Embed Size (px)
Citation preview

Copyright 2014 Milone & MacBroom, Inc.
EMERGENCY TRANSPORTATION INFRASTRUCTURE RECOVERY
WATER BASIN ASSESSMENT
AND FLOOD HAZARD MITIGATION ALTERNATIVES
BELLINGER BROOK AT THE VILLAGE OF HERKIMER
HERKIMER COUNTY, NEW YORK
April 2014
MMI #5231-01
Photo Source: Milone & MacBroom, Inc. (2013)
This document was prepared for the New York State Department of Transportation,
in cooperation with the New York State Department of Environmental Conservation.
Prepared by:
MILONE & MACBROOM, INC.
134 Main Street, Suite A1
New Paltz, NY 12561
(845) 633-8153
www.miloneandmacbroom.com

WATER BASIN ASSESSMENT AND FLOOD HAZARD MITIGATION ALTERNATIVES
BELLINGER BROOK, HERKIMER COUNTY, NEW YORK
APRIL 2014 TC - i
TABLE OF CONTENTS
Page
1.0 INTRODUCTION ................................................................................................................. 1
1.1 Project Background ...................................................................................................... 1
1.2 Nomenclature ............................................................................................................... 3
2.0 DATA COLLECTION .......................................................................................................... 3
2.1 Initial Data Collection .................................................................................................. 3
2.2 Public Outreach ............................................................................................................ 3
2.3 Field Assessment .......................................................................................................... 5
2.4 Watershed Land Use .................................................................................................... 5
2.5 Geomorphology ............................................................................................................ 7
2.6 Hydrology ..................................................................................................................... 8
2.7 Infrastructure .............................................................................................................. 11
3.0 FLOODING HAZARDS AND MITIGATION ALTERNATIVES ................................ 12
3.1 Flooding History Along Bellinger Brook ................................................................... 12
3.2 Post-Flood Community Response .............................................................................. 14
3.3 Flood Mitigation Analysis .......................................................................................... 15
3.4 High Risk Area #1 – Headcut in Brookwood Park Near STA 65+75 ........................ 16
3.5 High Risk Area #2 – Stone-Lined Channel and West German Street Vicinity ......... 20
3.6 High Risk Area #3 – School Levee ............................................................................ 27
4.0 RECOMMENDATIONS .................................................................................................... 30

WATER BASIN ASSESSMENT AND FLOOD HAZARD MITIGATION ALTERNATIVES
BELLINGER BROOK, HERKIMER COUNTY, NEW YORK
APRIL 2014 TC - ii
TABLE OF CONTENTS (continued)
Page
LIST OF TABLES
Table 1 Estimated Bankfull Discharge, Width and Depth ....................................................9
Table 2 Bellinger Brook Peak Discharges at FEMA Cross Section A ...............................10
Table 3 Bellinger Brook Peak Discharges at FEMA Cross Section B ...............................10
Table 4 Final Hydrology for Hydraulic Modeling of Bellinger Brook...............................11
Table 5 Summary of Stream Crossing Data ........................................................................11
Table 6 Summary of Pedestrian Bridge Data......................................................................30
Table 7 Cost Range of Recommended Actions ..................................................................33
LIST OF FIGURES
Figure 1 Bellinger Brook Drainage Basin Location Map ......................................................2
Figure 2 Bellinger Brook Watercourse Stationing .................................................................4
Figure 3 Bellinger Brook Drainage Basin Aerial ...................................................................6
Figure 4 Bellinger Brook Channel Profile .............................................................................8
Figure 5 FEMA Delineated Floodplain ................................................................................13
Figure 6 Bellinger Brook High Risk Area #1.......................................................................17
Figure 7 Bellinger Brook HEC-RAS Modeling Results ......................................................18
Figure 8 Example Rock Ramp .............................................................................................19
Figure 9 Bellinger Brook High Risk Area #2.......................................................................21
Figure 10 Typical Cross Section of a Compound Channel ....................................................23
Figure 11 Bellinger Brook HEC-RAS Modeling Results ......................................................24
Figure 12 Bellinger Brook High Risk Area #3.......................................................................28
LIST OF APPENDICES
Appendix A Summary of Data and Reports Collected
Appendix B Field Data Collection Forms
Appendix C Bellinger Brook Photo Log

WATER BASIN ASSESSMENT AND FLOOD HAZARD MITIGATION ALTERNATIVES
BELLINGER BROOK, HERKIMER COUNTY, NEW YORK
APRIL 2014 TC - iii
ABBREVIATIONS/ACRONYMS
CFS Cubic Feet per Second
CME Creighton Manning Engineering
DART Damage Assessment Response Team
FEMA Federal Emergency Management Agency
FIRM Flood Insurance Rate Map
FIS Flood Insurance Study
FTP File Transfer Protocol
GIS Geographic Information System
HEC-RAS Hydrologic Engineering Center – River Analysis System
LiDAR Light Detection and Ranging
MMI Milone & MacBroom, Inc.
NFIP National Flood Insurance Program
NOAA National Oceanic and Atmospheric Administration
NWS National Weather Service
NYSDEC New York State Department of Environmental Conservation
NYSDOT New York State Department of Transportation
STA River Station
USACE United States Army Corps of Engineers
USGS United States Geological Survey
WATER BASIN ASSESSMENT AND FLOOD HAZARD MITIGATION ALTERNATIVES
BELLINGER BROOK, HERKIMER COUNTY, NEW YORK
APRIL 2014 PAGE 1
1.0 INTRODUCTION
1.1 Project Background
A severe precipitation system in June 2013 caused excessive flow rates and flooding in a
number of communities in the greater Utica region. As a result, the New York State
Department of Transportation (NYSDOT) in consultation with the New York State
Department of Environmental Conservation (NYSDEC) retained Milone & MacBroom,
Inc. (MMI) through a subconsultant agreement with Creighton Manning Engineering
(CME) to undertake an emergency transportation infrastructure recovery water basin
assessment of 13 watersheds in Herkimer, Oneida, and Montgomery Counties, including
the Bellinger Brook watershed. Prudent Engineering was also contracted through CME
to provide support services, including field survey of stream cross sections.
Work conducted for this study included field assessment of the watersheds, streams, and
rivers; analysis of flood mitigation needs in the affected areas; hydrologic assessment;
hydraulic modeling; and identification of long-term recommendations for mitigation of
future flood hazards.
Bellinger Brook flows through the town and village of Herkimer in Herkimer County.
The brook is 4.4 miles long with a contributing drainage basin of 3.7 square miles.
Figure 1 depicts the contributing watershed. Bellinger Brook has an average slope of 2.3
percent over its entire length. The drainage basin is over 50 percent forested, with a mix
of residential and commercial land uses concentrated in the lower part of the basin.
Bellinger Brook is a relatively steep watercourse that generates a substantial amount of
stream power during high flows. The fundamental flood vulnerabilities associated with
the brook stem from systematic floodplain constrictions, including a significant amount
of vertical walled channelization that fully confines the watercourse. The channel is
undersized with three roadway crossings that serve as pinch points. Areas of bank and
bed instability contribute a substantial sediment load to the brook during high flow
events, thus further restricting the channel and bridge capacity in depositional areas.
Compounding the poor stream hydraulics, land development (largely residential) occurs
extensively in the floodplain, in many cases to within 20 feet of the edge of the stream.
When the stream exceeds its low channel hydraulic capacity or becomes clogged with
sediment and debris, it is prone to avulsion, finding new and destructive paths through the
community and leaving widespread damages in its wake.
The storm event that occurred in June 2013 tells a compelling narrative about the
flooding vulnerabilities of Bellinger Brook. The storm damaged homes, leaving property
uninhabitable; damaged and/or destroyed bridges; and left the streambed and banks in
unstable condition, at risk for further degradation and failure.

NYDOT: Emergency Transportation Infrastructure Recovery
Herkimer County, New YorkFigure 1: Bellinger Brook Drainage Basin Location Map
LOCATION:Copyright:© 2013 National Geographic Society, i-cubed
SOURCE(S):
³ 99 Realty Drive Cheshire, CT 06410(203) 271-1773 Fax: (203) 272-9733
www.miloneandmacbroom.com
5231-01
Scale:
Map By:MMI#:Original:
1 inch = 2,000 feetY:\5231-01\GIS\Maps\Figure 1 Maps\Bellinger Brook.mxdMXD:1/2/2014
CMP
1/2/2014Revision:

WATER BASIN ASSESSMENT AND FLOOD HAZARD MITIGATION ALTERNATIVES
BELLINGER BROOK, HERKIMER COUNTY, NEW YORK
APRIL 2014 PAGE 3
The goals of the subject water basin assessment were to:
1. Collect and analyze information relative to the June 2013 flood and other historic
flooding events
2. Identify critical areas subject to flood risk
3. Develop and evaluate flood hazard mitigation alternatives for each high risk area
within the stream corridor
1.2 Nomenclature
In this report and associated mapping, stream stationing is used as an address to identify
specific points along the watercourse. Stationing is measured in feet, beginning at the
mouth of Bellinger Brook at STA 0+00 and continuing upstream to STA 120+00. As an
example, STA 73+00 indicates a point in the channel located 7,300 linear feet upstream
of the mouth. Figure 2 depicts the stream stationing along Bellinger Brook.
All references to right bank and left bank in this report refer to "river right" and "river
left," meaning the orientation assumes that the reader is standing in the river looking
downstream.
2.0 DATA COLLECTION
2.1 Initial Data Collection
Public information pertaining to Bellinger Brook was collected from previously
published documents as well as through meetings with municipal, county, and state
officials. Data collected includes reports, photographs, newspaper articles, Federal
Emergency Management Agency (FEMA) Flood Insurance Studies (FIS), aerial
photographs, and geographic information system (GIS) mapping. Appendix A is a
summary listing of data and reports collected.
2.2 Public Outreach
An initial project kickoff meeting was held in early October 2013 with representatives
from NYSDOT and NYSDEC, followed by public outreach meetings held in the affected
communities, including in the town of Herkimer. These meetings provided more
detailed, firsthand accounts of past flooding events; identified specific areas that flooded
in each community and the extent and severity of flood damage; and provided
information on post-flood efforts such as bridge reconstruction, road repair, channel
modification, and dredging. This outreach effort assisted in the identification of target
areas for field investigations and future analysis.

NYDOT: Emergency Transportation Insfrastructure Recovery
Herkimer County, New YorkFigure 2: Bellinger Brook Watercourse StationingLocation:SOURCE(S):
³ 99 Realty Drive Cheshire, CT 06410(203) 271-1773 Fax: (203) 272-9733
www.miloneandmacbroom.com
5231-01
01/02/2014
Scale:
Map By:MMI#:MXD:1st Version:
1 in = 1,000 ft
CMPY:\5231-01\GIS\Maps\Figure 2 Maps\Figure 2 Bellinger Brook.mxd
Revision: 4/10/2014
WATER BASIN ASSESSMENT AND FLOOD HAZARD MITIGATION ALTERNATIVES
BELLINGER BROOK, HERKIMER COUNTY, NEW YORK
APRIL 2014 PAGE 5
2.3 Field Assessment
Following initial data gathering and outreach meetings, field staff from Prudent
Engineering and MMI undertook field data collection efforts, with special attention given
to areas identified in the outreach meetings. Initial field assessment of all 13 watersheds
was conducted in October and November 2013. Selected locations identified in the initial
phase were assessed more closely by multiple field teams in late November 2013.
Information collected during field investigations included the following:
Rapid "windshield" river corridor inspection
Photo documentation of inspected areas
Measurement and rapid hydraulic assessment of bridges, culverts, and dams
Geomorphic classification and assessment, including measurement of bankfull
channel widths and depths at key cross sections
Field identification of potential flood storage areas
Wolman pebble counts
Cohesive soil shear strength measurements
Characterization of key bank failures, headcuts, bed erosion, aggradation areas, and
other unstable channel features
Preliminary identification of potential flood hazard mitigation alternatives, including
those requiring further analysis
Included in Appendix B is a copy of the River Assessment Reach Data Form, River
Condition Assessment Form, Bridge Waterway Inspection Form, and Wolman Pebble
Count Form. Appendix C is a photo log of select locations within the river corridor. Field
Data Collection Index Summary mapping has been developed to graphically depict the
type and location of field data collected. Completed data sheets, field notes, photo
documentation, and mapping developed for this project have been uploaded onto the
NYSDOT ProjectWise system and the project-specific file transfer protocol (FTP) site at
MMI. The data and mapping were also provided electronically to NYSDEC.
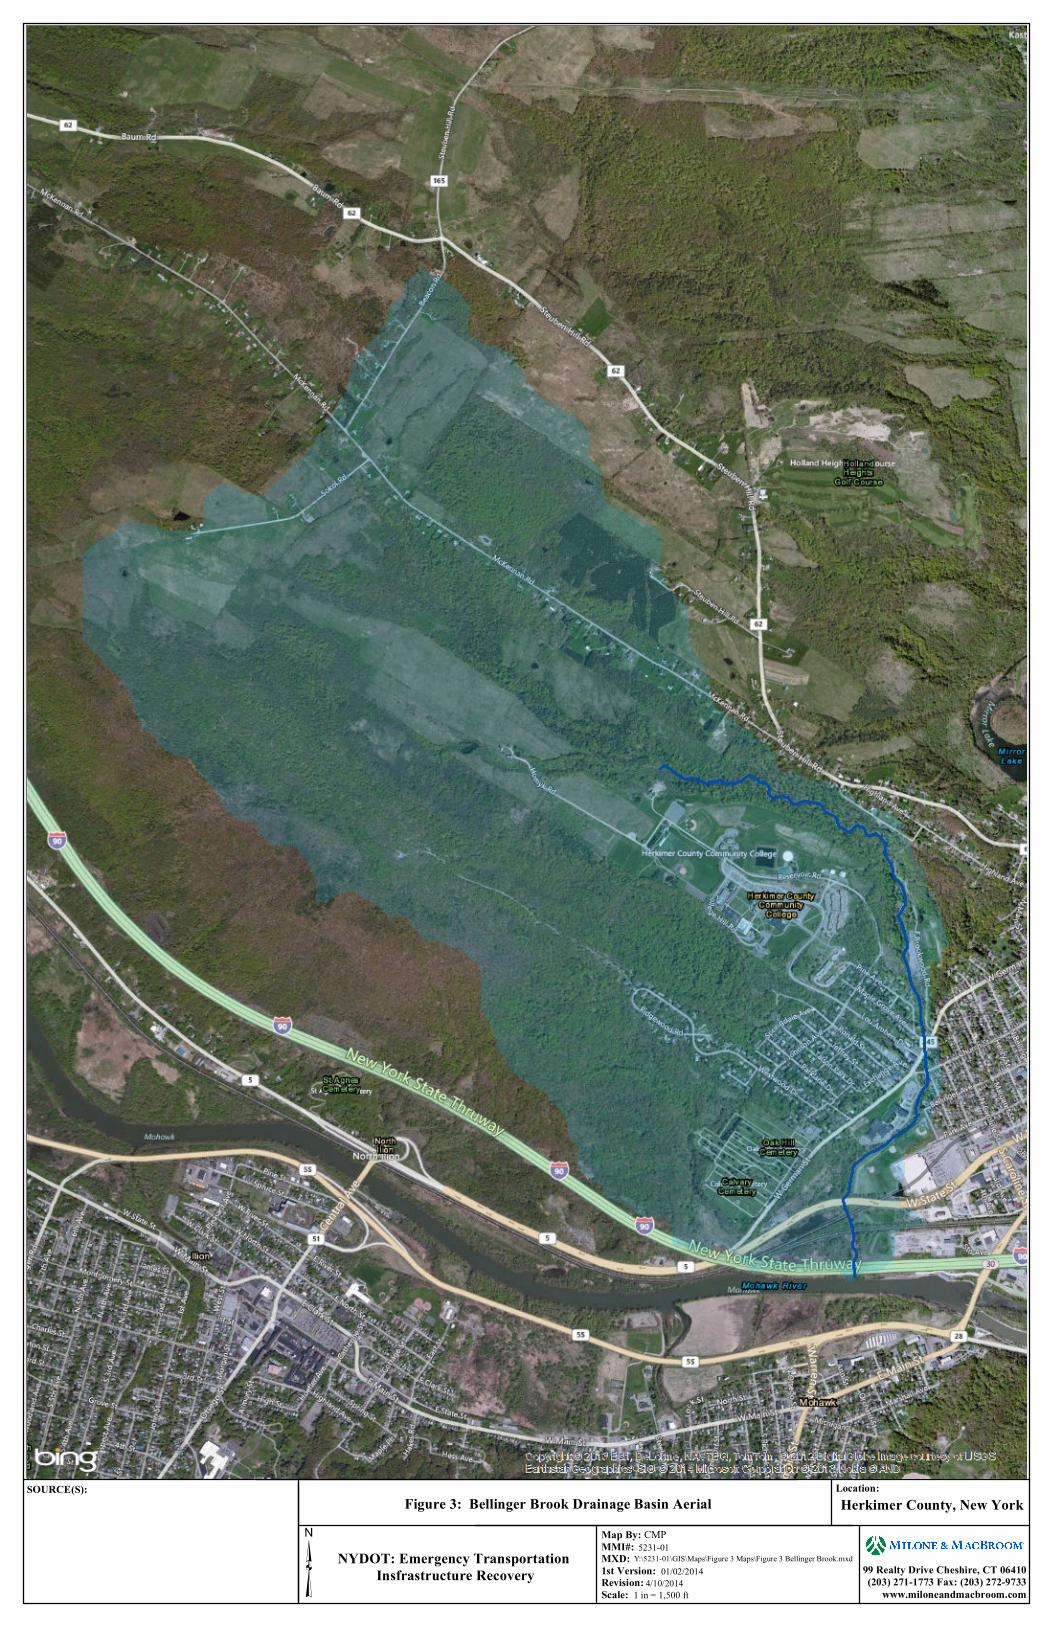
2.4 Watershed Land Use
Figure 3 is a watershed map of Bellinger Brook. The brook flows through the town and
village of Herkimer in Herkimer County. It drains an area of 3.7 square miles. The
drainage basin is approximately 56 percent forested, with a mix of residential and
commercial land uses concentrated in the lower part of the basin. The Herkimer County
Community College campus is a significant facility within the basin and includes
buildings, athletic fields, and paved parking lots. A second educational facility within the
stream corridor is the Herkimer Junior/Senior High School, located in the lower part of
the watershed.
The upper reaches of Bellinger Brook (upstream of STA 53+00) flow through forested
land and sparse residential development, past the Herkimer County Community College
campus, through Brookwood Park, and past a former landfill. A number of areas of bank
NYDOT: Emergency Transportation Insfrastructure Recovery
Herkimer County, New YorkFigure 3: Bellinger Brook Drainage Basin Aerial Location:SOURCE(S):
³ 99 Realty Drive Cheshire, CT 06410(203) 271-1773 Fax: (203) 272-9733
www.miloneandmacbroom.com
5231-01
01/02/2014
Scale:
Map By:MMI#:MXD:1st Version:
1 in = 1,500 ft
CMPY:\5231-01\GIS\Maps\Figure 3 Maps\Figure 3 Bellinger Brook.mxd
Revision: 4/10/2014
WATER BASIN ASSESSMENT AND FLOOD HAZARD MITIGATION ALTERNATIVES
BELLINGER BROOK, HERKIMER COUNTY, NEW YORK
APRIL 2014 PAGE 7
erosion and minor bank failures were observed along Bellinger Brook (between STA
97+00 and STA 78+00), all of which are contributing to sediment load in the brook.
There is evidence of high sediment load within these upper reaches, and it is evident that
portions of the stream channel have been recently dredged in response to the 2013 storm.
2.5 Geomorphology
The total length of Bellinger Brook is 4.4 miles. It has an average slope of 2.6 percent
from its headwaters to where it flows past Herkimer Junior/Senior High School (STA
31+00), a distance of 3.8 miles. The slope of the channel is relatively consistent over this
length. From the school downstream to the mouth of Bellinger Brook (STA 0+00), the
channel slope is much flatter at 0.4 percent. Steams with steep slopes generate more
energy than low gradient streams and as a result have higher velocities and can carry more
sediment.
For nearly 4,500 linear feet, from STA 73+00 upstream of Brookwood Park downstream
to STA 31+00 near the high school, Bellinger Brook flows through a concrete-bottomed,
stone-lined channel. Sections of the lined channel are deteriorating and are in poor
condition. Between STA 65+75 and STA 53+50, the concrete and stone lining is absent
although remnants of concrete observed in the channel indicate that this portion of
Bellinger Brook may have been lined at one time.
A large erosional headcut has formed in Bellinger Brook and has been arrested in place
by a concrete "jack" grade control structure near STA 65+75, just downstream of the
Brookwood Park pavilion. The headcut is a point of severe instability, a progressive
major source of sediment, and at high risk of becoming more severe if not repaired.
Downstream of the headcut, between STA 65+75 and STA 53+50, it appears that the
stone and concrete that once lined this section of channel has been destroyed by the
erosive action of the headcut, which has moved gradually upstream.
Downstream of Brookwood Park, the brook enters a mixed residential/commercial area
and flows within its lined channel beneath three bridges, at Maple Grove Avenue (STA
43+50), West German Street (STA 42+00), and Church Street (STA 38+50). It is along
this reach of Bellinger Brook where the most severe flooding and flood-related damage to
homes, bridges, and property have occurred. It is reported that a high volume of coarse-
grained sediment is transported through this reach during high flow events, which
subsequently deposits under the downstream bridges.
Between Church Street (STA 38+50) and the Route 5 bridge (STA 12+50), Bellinger
Brook flows between Herkimer Junior/Senior High School on the right bank and a
residential area and athletic fields on the left. The gradient of the brook becomes much
flatter at this point. A flood control levee is located along the left bank, between the
athletic fields and the brook (from STA 32+00 to STA 16+00). The levee is showing

WATER BASIN ASSESSMENT AND FLOOD HAZARD MITIGATION ALTERNATIVES
BELLINGER BROOK, HERKIMER COUNTY, NEW YORK
APRIL 2014 PAGE 8
signs of erosion at a number of locations. Two pedestrian footbridges cross the brook in
this area, at STA 31+50 and STA 25+75.
Downstream of the Route 5 bridge, from STA 12+50 to STA 0+00, Bellinger Brook
flows into a flood damage reduction project area, which consists of earth levees, control
gates, ponding areas, and pump stations. According to municipal officials, the flood
control system is operating as designed. No independent analysis has been conducted as
part of the subject study to confirm the appropriateness of the design or its function.
Figure 4 presents a profile of Bellinger Brook, showing its elevation versus linear
distance from the mouth of the watercourse, as well as the locations of the headcut, the
Church Street bridge, and the stone-lined channel. The brook drops a total of 530 vertical
feet over its 4.4-mile length, from an elevation of 916 feet above sea level at its
headwaters to 386 feet at its outlet to the Mohawk River.
FIGURE 4
Bellinger Brook Channel Profile
2.6 Hydrology
Alluvial river channels adjust their width and depth around a long-term dynamic
equilibrium condition that corresponds to "bankfull" conditions. Extensive data sets
indicate that the channel-forming or bankfull discharge in specific regions is primarily a
Church St.
Head Cut
350
400
450
500
550
600
650
700
750
800
850
900
950
0+0050+00100+00150+00200+00250+00
Ele
vati
on
(fe
et)
Watercourse Stationing (linear distance from mouth, in feet)
Stone-Lined Channel

WATER BASIN ASSESSMENT AND FLOOD HAZARD MITIGATION ALTERNATIVES
BELLINGER BROOK, HERKIMER COUNTY, NEW YORK
APRIL 2014 PAGE 9
function of watershed area and soil conditions. The bankfull width and depth of alluvial
channels represent long-term equilibrium conditions and are important geophysical
criteria that are used for design. Table 1 below lists estimated bankfull discharge, width,
and depth at several points along Bellinger Brook, as derived from the United States
Geological Survey (USGS) StreamStats program.
TABLE 1
Estimated Bankfull Discharge, Width and Depth
(Source: USGS StreamStats)
Location Along Bellinger Brook Station
(ft)
Watershed Area,
(sq. mi.)
Discharge
(cfs)
Bankfull
Width (ft)
Bankfull
Depth (ft)
Upstream of Headcut in Park 66+00 2.23 98.0 28.7 1.38
Maple Grove Avenue Bridge 43+50 2.28 99.9 29.0 1.39
Church Street Bridge 38+75 3.08 129 32.3 1.53
FEMA Cross Section B 22+50 3.11 130 32.4 1.54
Railroad Bridge 7+50 3.22 134 32.8 1.56
In contrast to the average regional bankfull channel dimensions reported above, the actual
measured width of the Bellinger Brook channel through the channelized reach ranges
from 23 to 25 feet, with no floodplain, suggesting that it is narrower than an equivalent
natural channel.
There are no USGS stream gauging stations on Bellinger Brook. Hydrologic data on
peak flood flow rates are available from the FEMA FIS and from StreamStats regional
statistical data.
The most current FEMA FIS for the village of Herkimer has an effective date of
December 1977, and a revision date of June 17, 2002. A preliminary draft FIS is
available for all of Herkimer County, which was issued September 30, 2011 but had not
been formally approved as of the publication of the subject report. According to this
more recent draft FIS, the hydraulic modeling for Bellinger Brook dates to December
1976, and it has been periodically republished for almost 40 years without updates.
The hydrologic analysis methods employed in the FEMA study used watershed
characteristics such as drainage area, channel slope, channel length, available storage,
rainfall intensity, vegetative cover, soil characteristics, and impervious area and were
developed by the Soil Conservation Service (U.S. Department of Agriculture, 1973;
Anderson, D. G., 1974; U.S. Department of Commerce, 1961). FEMA applied these
predicted peak discharges in a hydraulic analysis on Bellinger Brook and compared the
resulting water surface elevations with historical elevations and checked for
reasonableness. The results were published in the FIS, and the resulting mapping was
published as the effective Flood Insurance Rate Map (FIRM) for Bellinger Brook.

WATER BASIN ASSESSMENT AND FLOOD HAZARD MITIGATION ALTERNATIVES
BELLINGER BROOK, HERKIMER COUNTY, NEW YORK
APRIL 2014 PAGE 10
Estimated peak discharges for various frequency events were calculated by MMI using
StreamStats and were then compared to peak discharges reported in the FEMA FIS.
Table 2 lists estimated peak flows at FEMA cross section A, which is located at STA
21+50, just downstream of the high school. The drainage area at this location is reported
in the FEMA FIS to be 3.2 square miles and by StreamStats to be 3.14 square miles.
TABLE 2
Bellinger Brook Peak Discharges at FEMA Cross Section A
(Station 21+50, Downstream of High School)
Frequency FEMA
Discharge (cfs)
StreamStats
Discharge (cfs)
10-Yr 685 291
50-Yr 1,200 428
100-Yr 1,465 495
500-Yr 2,265 654
Table 3 lists estimated peak flows at FEMA cross section B, which is located at STA
28+75, just upstream of the high school. The drainage area at this location is reported in
the FEMA FIS to be 2.55 square miles and by StreamStats to be 3.11 square miles. This
is a substantial discrepancy. The basin area used by StreamStats appears more accurate
based upon the USGS topography.
TABLE 3
Bellinger Brook Peak Discharges at FEMA Cross Section B
(MMI Station 28+75, Just Upstream of High School)
Frequency FEMA
Discharge (cfs)
StreamStats
Discharge (cfs)
10-Yr 595 286
50-Yr 1,040 421
100-Yr 1,260 487
500-Yr 1,945 643
FEMA flood projections are more than twice (in some cases three times) those estimated
by StreamStats. These large peak flow discrepancies exist between FEMA and
StreamStats at both cross section locations. As further described in Section 3.3, both sets
of flow data were modeled for existing conditions and compared to field observations
during the June 2013 storm event. The analysis suggests that the FEMA flows more
accurately represent the field conditions experienced in the June flood event. For this
reason and in recognition that the FEMA flows are (a) more conservative; and (b) the
jurisdictional standard, the FEMA flows were used in the subsequent analysis.

WATER BASIN ASSESSMENT AND FLOOD HAZARD MITIGATION ALTERNATIVES
BELLINGER BROOK, HERKIMER COUNTY, NEW YORK
APRIL 2014 PAGE 11
Because FEMA cross section A is located significantly downstream of some of the
primary flooding areas, the ratios between the basin sizes at selected upstream locations
were used to scale the FEMA flows at the corresponding areas. Table 4 presents the final
data used in the hydraulic modeling of Bellinger Brook.
TABLE 4
Final Hydrology for Hydraulic Modeling of Bellinger Brook
River Station Bankfull
(cfs)
100-Year
USGS (cfs)
Watershed
Area
(sq. mi.)
Watershed
Area Ratio
100-Year FEMA
(cfs)
21+50 FEMA "A" 131 495 3.15 - 1,465
40+50 129 477 3.07 0.97 1,421*
68+35 97 333 2.21 0.72 1,023*
108+90 88 290 1.97 0.89 9,11*
* Note: Ratios developed based upon scaling of flows from FEMA "A" based upon ratio of watershed area at each location.
2.7 Infrastructure
Bridge spans and heights were measured as part of the 2013 field investigations. Table 5
summarizes the bridge measurements collected. For purposes of comparison, estimated
bankfull widths at each structure are also included in the table. All of these bridges, with
the exception of the pedestrian bridge at STA 25+75, were found to be insufficiently
sized even to span bankfull flows.
TABLE 5
Summary of Stream Crossing Data
Roadway Crossing Station
BIN Measured
Width (ft)*
Measured
Height (ft)
Bankfull
Width (ft)
Maple Grove Ave. 43+50 000000002266830 16.5 4.3 29.0
West German St. 42+00 000000002266820 28.0 (19.0) 6.0 29.0
Church Street 38+50 --- 16.0 4.0 - 5.5 32.3
Pedestrian Bridge 31+50 --- 26.0 (21.0) 6.5 32.4
Pedestrian Bridge 25+75 --- 55.0 12.2 32.5
* Note: Figures in parentheses represent the functional hydraulic width of the bridge.
Bridges at Maple Grove Avenue and West German Street were inspected in 2012 by the
NYSDOT and found to be in poor structural condition (a rating of 3 to 4 out of 9), and
both were recommended for replacement. The Maple Grove Avenue bridge was
destroyed during the June 2013 flood. During field inspections conducted by MMI in
November 2013, work was being undertaken to replace the bridge using the same span
width but with a higher deck.

WATER BASIN ASSESSMENT AND FLOOD HAZARD MITIGATION ALTERNATIVES
BELLINGER BROOK, HERKIMER COUNTY, NEW YORK
APRIL 2014 PAGE 12
Flood profiles published in the FEMA FIS indicate that the three vehicle bridges that
span Bellinger Brook at Church Street, West German Street, and Maple Grove Avenue
all act to restrict flows during the 10-year frequency storm event (the smallest event
modeled by FEMA), as well as during the 50-, 100-, and 500-year frequency events. The
profiles also indicate that flood flows overtop the Church Street bridge during the 100-
year storm event. Only the more upstream of the two pedestrian bridges is shown on the
FEMA FIS flood profiles. The downstream pedestrian ridge appears to have been
constructed after December 1976, the date that the FEMA hydraulic model was
completed. The FEMA flood profile indicates that the upper bridge acts to restrict flows
during the 10-year frequency and larger storm events.
3.0 FLOODING HAZARDS AND MITIGATION ALTERNATIVES
3.1 Flooding History Along Bellinger Brook
According to NYSDEC, in October 1945 a severe flood caused damage throughout the
Mohawk Valley. Subsequently in the late 1950s, Congressional authorization was given
for corrective measures. Plans and specifications for a flood control project along
Bellinger Brook were issued in 1962, and the project was constructed in 1964. It
included levees, control gates, pump stations, and manipulation of the historic hydraulic
canal near the center of the village of Herkimer. At the time of implementation, the flood
control project was designed to provide protection for up to 515 cubic feet per second
(cfs) of flow in Bellinger Brook.
The most severe flooding on Bellinger Brook has historically occurred in the area of the
Church Street, West German Street, and Maple Grove Avenue bridges and in the
neighborhood in the vicinity of these three bridges. Large volumes of sediment and large
woody debris are conveyed down the brook from higher in the watershed during high
flow events. This material is deposited in the channel at the bridges, which reduces the
channel capacity and exacerbates flooding. Floodwaters overtop the channel during flood
events and flow overland through the neighborhood, causing extensive damage to nearby
homes and properties. According to FEMA, ice jams have also contributed to flooding
on Bellinger Brook in the vicinity of Church and West German Streets. The FEMA FIS
reports that serious flooding has occurred in this area in 1948, 1949, and 1971 as a result
of ice jams at the Church Street bridge.
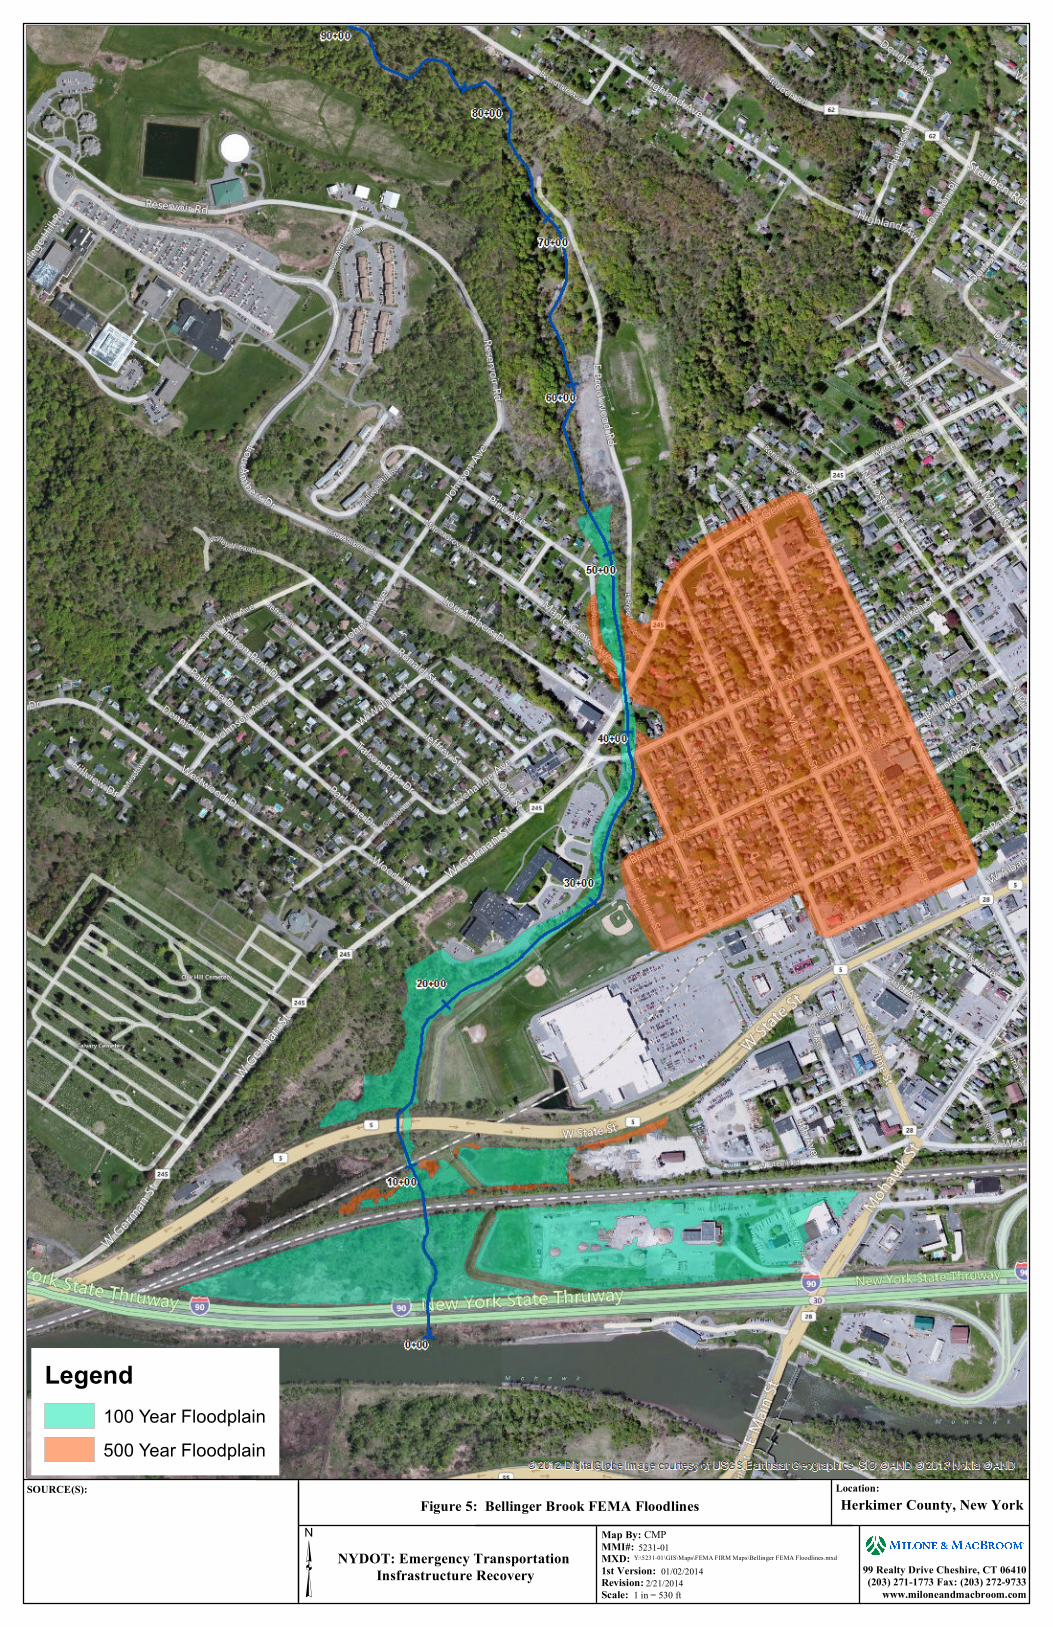
FEMA FIRMs are available for the village of Herkimer but do not include areas outside of
the village in the town of Herkimer. FEMA mapping (Figure 5) indicates that during a
500-year frequency event, waters from Bellinger Brook overtop the channel in the vicinity
of Maple Grove Avenue and West German Street and flood an extensive area of houses to
the east. However, when these bridges become clogged and overtop, this area is at risk of
flooding in much lower intensity storm events, as evidenced in the June 2013 event.
NYDOT: Emergency Transportation Insfrastructure Recovery
Herkimer County, New YorkFigure 5: Bellinger Brook FEMA FloodlinesLocation:SOURCE(S):
³ 99 Realty Drive Cheshire, CT 06410(203) 271-1773 Fax: (203) 272-9733
www.miloneandmacbroom.com
5231-01
01/02/2014
Scale:
Map By:MMI#:MXD:1st Version:
1 in = 530 ft
CMPY:\5231-01\GIS\Maps\FEMA FIRM Maps\Bellinger FEMA Floodlines.mxd
Revision: 2/21/2014
Legend100 Year Floodplain500 Year Floodplain

WATER BASIN ASSESSMENT AND FLOOD HAZARD MITIGATION ALTERNATIVES
BELLINGER BROOK, HERKIMER COUNTY, NEW YORK
APRIL 2014 PAGE 14
In mid to late June and early July of 2013, a severe precipitation system caused excessive
flow rates and flooding in a number of communities in the greater Utica region, including
in the Bellinger Brook basin. Because rainfall across the region was highly varied and
rainfall information is limited, it is not possible to determine exact rainfall amounts
within the Bellinger Brook basin.
Historic records on the National Oceanic and Atmospheric Administration's (NOAA)
National Weather Service (NWS) Advanced Hydrologic Prediction Service website
indicate that the village of Herkimer area received between 10 and 15 inches of rainfall in
the month of June and an additional 5 to 8 inches in July 2013. Much of this rainfall
occurred over several storm events that dropped between 3.5 and 4.5 inches of rain
between June 11 and June 14; 5.5 to 8.5 inches between June 24 and June 28; and 1.5 to
2.0 inches on July 2. In between these more severe rain events were a number of smaller
rain showers that dropped trace amounts of precipitation, preventing soils from drying
out between the larger rain events.
Damage Assessment Response Team (DART) reports and mapping compiled after the
June 2013 flood indicate that the actual area of flooding associated with this storm event
was more widespread than the 100-year floodplain delineated on the FIRMs. Flooded
areas extended east beyond North Main Street and south across Route 5 to the railroad
tracks.
According to news accounts during and after the June 2013 flood, the flood control levee
along the left bank of Bellinger Brook, between Herkimer Junior/Senior High School and
the athletic fields, was compromised and in danger of failure when flows crested.
However, the levee did not overtop during this flood event.
On January 14, 2014, news reports indicated that an ice jam at the Church Street bridge
resulted in flooding and the closure of Church Street. Crews set up concrete blocks and
sandbags to prevent water from flooding the neighborhood and used heavy equipment to
break up the ice jam.
3.2 Post-Flood Community Response
Following the heavy flooding in June 2013 along Bellinger Brook, the Village of
Herkimer implemented a number of temporary repairs. The Maple Grove Avenue bridge
over Bellinger Brook was completely destroyed during the flood. At the time of field
investigations in October and November 2013, the bridge was being replaced with a
structure of similar size, with a one-foot increase in height.
Homes adjacent to the Maple Grove Avenue bridge that were heavily damaged have been
repaired, but no attempts to correct flooding in the area have been made. Upstream of
Maple Grove Avenue and its concrete-lined channel (beginning at STA 50+00), Bellinger
Brook was dredged after the flood. The sediment that was removed was placed on the

WATER BASIN ASSESSMENT AND FLOOD HAZARD MITIGATION ALTERNATIVES
BELLINGER BROOK, HERKIMER COUNTY, NEW YORK
APRIL 2014 PAGE 15
adjacent banks and remains at risk for remobilization during a high flow event. This
post-flood repair appears to extend at least a mile upstream.
3.3 Flood Mitigation Analysis
Hydraulic analysis of Bellinger Brook was conducted using the HEC-RAS program. The
HEC-RAS computer program (River Analysis System) was written by the United States
Army Corps of Engineers (USACE) Hydrologic Engineering Center (HEC) and is
considered to be the industry standard for riverine flood analysis. The model is used to
compute water surface profiles for one-dimensional, steady-state, or time-varied flow.
The system can accommodate a full network of channels, a dendritic system, or a single
river reach. HEC-RAS is capable of modeling water surface profiles under subcritical,
supercritical, and mixed-flow conditions.
Water surface profiles are computed from one cross section to the next by solving the
one-dimensional energy equation with an iterative procedure called the standard step
method. Energy losses are evaluated by friction (Manning's Equation) and the
contraction/expansion of flow through the channel. The momentum equation is used in
situations where the water surface profile is rapidly varied, such as hydraulic jumps,
mixed-flow regime calculations, hydraulics of dams and bridges, and evaluating profiles
at a river confluence.
Hydraulic modeling that was originally generated by FEMA as part of its 1976 study of
Bellinger Brook was obtained and used as a starting point for the current analysis. It can
be assumed that conditions have significantly changed since the FEMA study and, for
that reason, updated cross sections were surveyed as part of the subject analysis. The
updated survey information was incorporated into the hydraulic model in order to better
characterize and understand modern flooding risks and causes.
The survey effort included the wetted area (within bankfull elevation) of 25 stream cross
sections, plus the survey of six bridges/culverts and one grade control structure. These
data were combined with countywide light detection and ranging (LiDAR) data provided
by the NYSDEC to develop sufficient model geometry such that existing conditions
flooding up to and including the 100-year recurrence interval could be modeled.
As described in Section 2.6, hydrology data reported by FEMA is significantly higher
than data that was derived by the USGS StreamStats program. Both flows were modeled
in the existing conditions HEC-RAS model and compared to field observations reported
during the June 2013 storm. Anecdotal reports indicate that the levee protecting the
Herkimer High School athletic fields near STA 30+00 was close to overtopping at the
peak of the storm. Based upon other anecdotal reports in the region, the June flooding
event is believed to represent the 100-year or greater event. Flows in the HEC-RAS
model were iterated until the levee near STA 30+00 almost overtopped, yielding a flow
of 1,600 cfs. This is reasonably similar to the FEMA flow of 1,412 cfs. For this reason,
FEMA flows were used as the basis for the hydraulic modeling.
WATER BASIN ASSESSMENT AND FLOOD HAZARD MITIGATION ALTERNATIVES
BELLINGER BROOK, HERKIMER COUNTY, NEW YORK
APRIL 2014 PAGE 16
The model of existing conditions was used to analyze certain alternatives, described in
more detail in the report sections that follow. Model input and output files have been
uploaded onto the NYSDOT ProjectWise site and delivered electronically to NYSDEC.
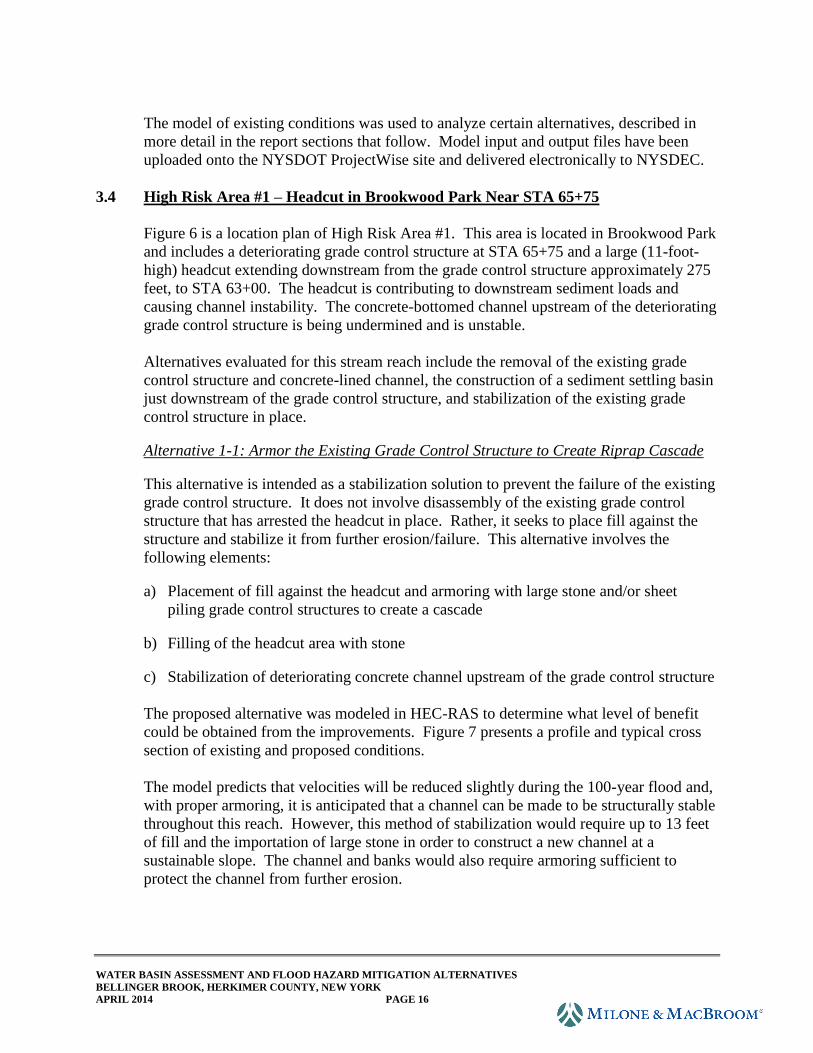
3.4 High Risk Area #1 – Headcut in Brookwood Park Near STA 65+75
Figure 6 is a location plan of High Risk Area #1. This area is located in Brookwood Park
and includes a deteriorating grade control structure at STA 65+75 and a large (11-foot-
high) headcut extending downstream from the grade control structure approximately 275
feet, to STA 63+00. The headcut is contributing to downstream sediment loads and
causing channel instability. The concrete-bottomed channel upstream of the deteriorating
grade control structure is being undermined and is unstable.
Alternatives evaluated for this stream reach include the removal of the existing grade
control structure and concrete-lined channel, the construction of a sediment settling basin
just downstream of the grade control structure, and stabilization of the existing grade
control structure in place.
Alternative 1-1: Armor the Existing Grade Control Structure to Create Riprap Cascade
This alternative is intended as a stabilization solution to prevent the failure of the existing
grade control structure. It does not involve disassembly of the existing grade control
structure that has arrested the headcut in place. Rather, it seeks to place fill against the
structure and stabilize it from further erosion/failure. This alternative involves the
following elements:
a) Placement of fill against the headcut and armoring with large stone and/or sheet
piling grade control structures to create a cascade
b) Filling of the headcut area with stone
c) Stabilization of deteriorating concrete channel upstream of the grade control structure
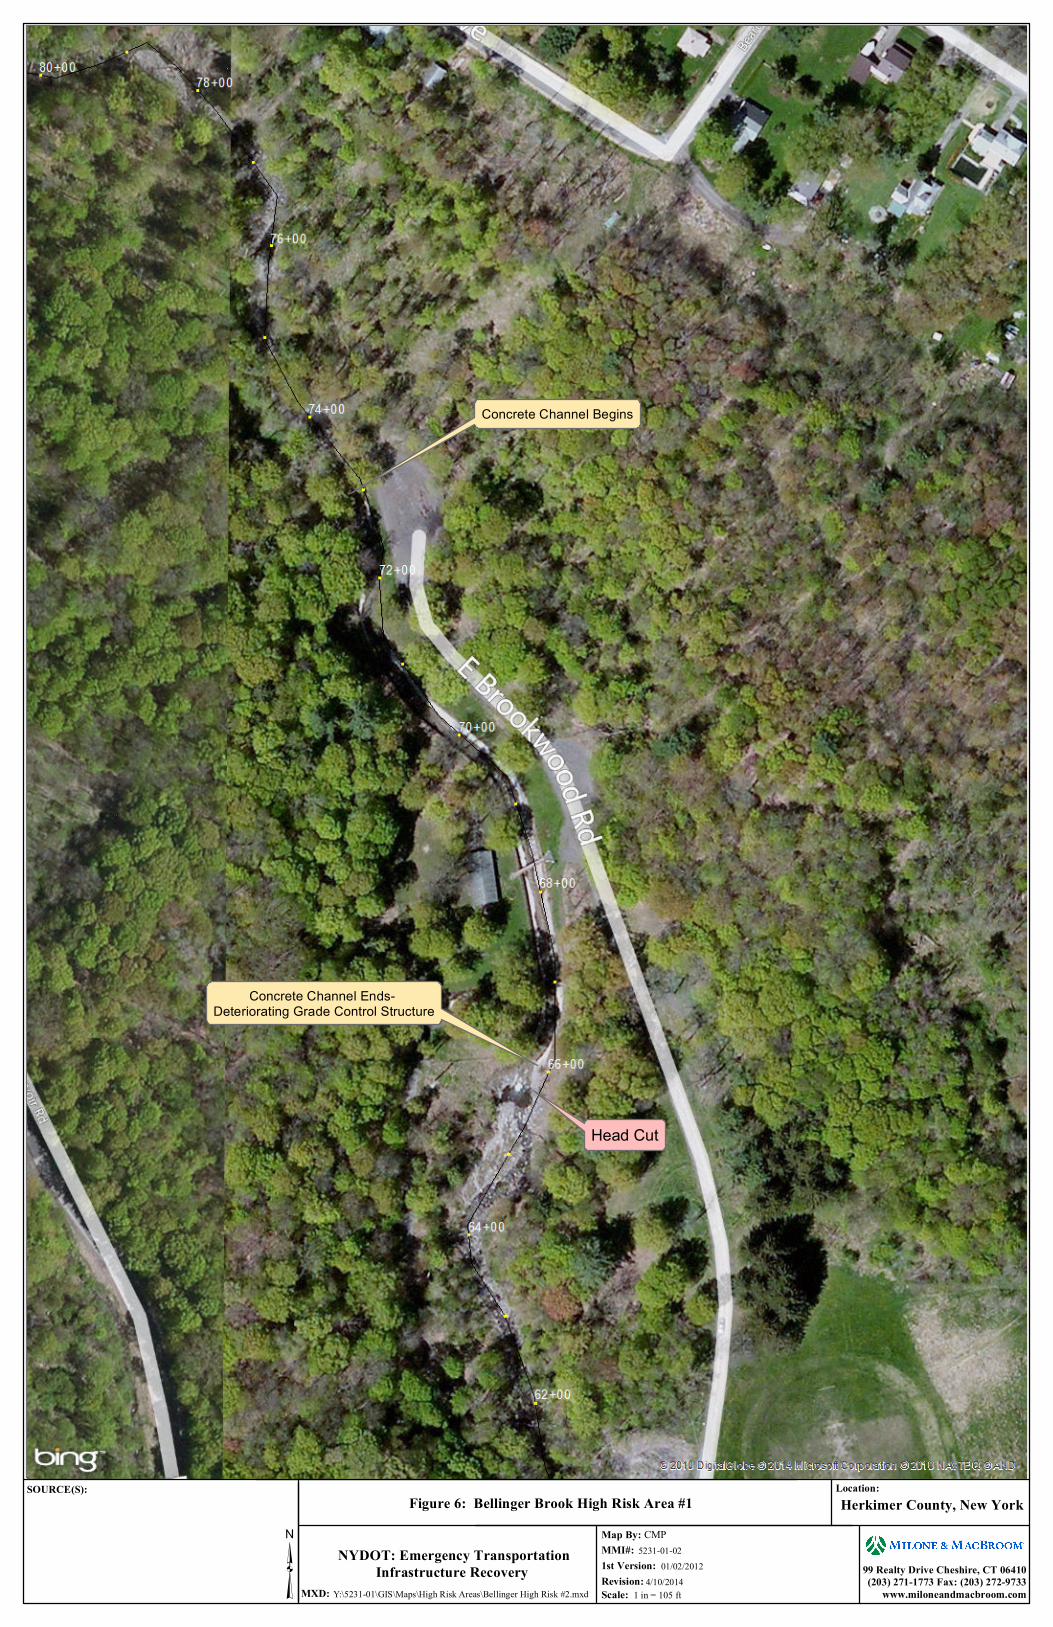
The proposed alternative was modeled in HEC-RAS to determine what level of benefit
could be obtained from the improvements. Figure 7 presents a profile and typical cross
section of existing and proposed conditions.
The model predicts that velocities will be reduced slightly during the 100-year flood and,
with proper armoring, it is anticipated that a channel can be made to be structurally stable
throughout this reach. However, this method of stabilization would require up to 13 feet
of fill and the importation of large stone in order to construct a new channel at a
sustainable slope. The channel and banks would also require armoring sufficient to
protect the channel from further erosion.
NYDOT: Emergency TransportationInfrastructure Recovery
Herkimer County, New YorkFigure 6: Bellinger Brook High Risk Area #1Location:SOURCE(S):
³ 99 Realty Drive Cheshire, CT 06410(203) 271-1773 Fax: (203) 272-9733
www.miloneandmacbroom.com
5231-01-0201/02/2012
Scale:
Map By:MMI#:
MXD:
1st Version:
1 in = 105 ft
CMP
Y:\5231-01\GIS\Maps\High Risk Areas\Bellinger High Risk #2.mxdRevision: 4/10/2014
Concrete Channel Begins
Concrete Channel Ends- Deteriorating Grade Control Structure
Head Cut
WATER BASIN ASSESSMENT AND FLOOD HAZARD MITIGATION ALTERNATIVES
BELLINGER BROOK, HERKIMER COUNTY, NEW YORK
APRIL 2014 PAGE 18
FIGURE 7
Bellinger Brook HEC-RAS Modeling Results
WATER BASIN ASSESSMENT AND FLOOD HAZARD MITIGATION ALTERNATIVES
BELLINGER BROOK, HERKIMER COUNTY, NEW YORK
APRIL 2014 PAGE 19
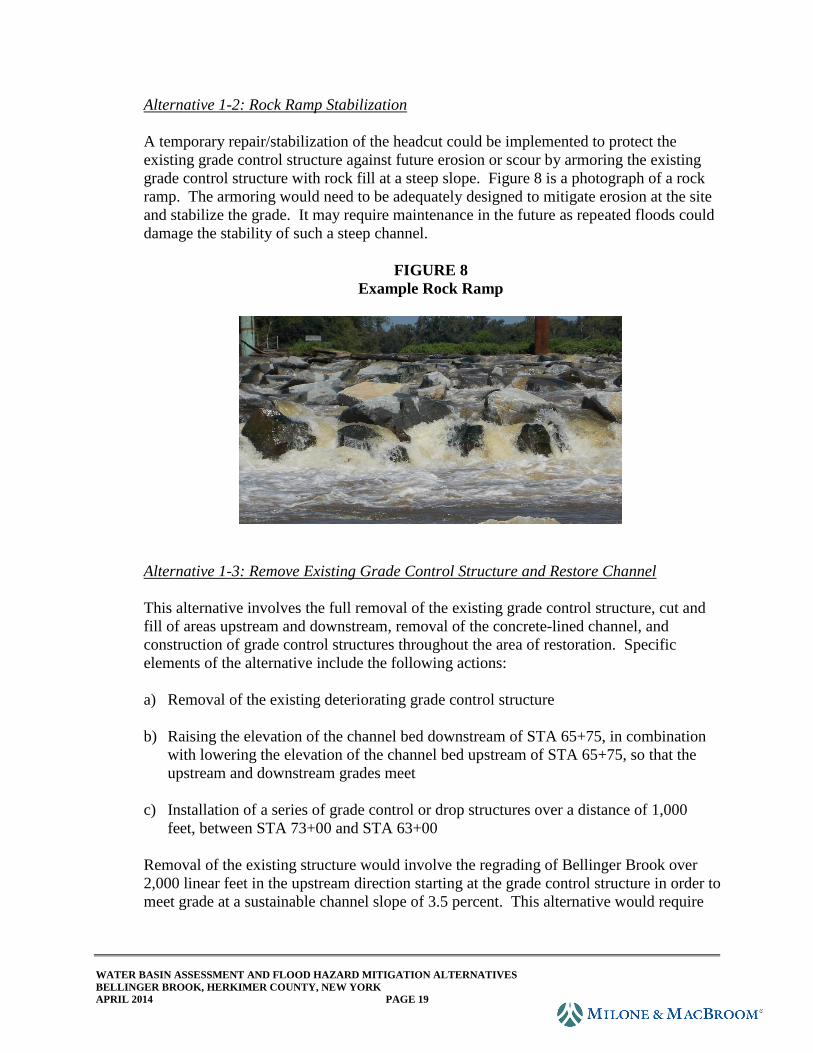
Alternative 1-2: Rock Ramp Stabilization
A temporary repair/stabilization of the headcut could be implemented to protect the
existing grade control structure against future erosion or scour by armoring the existing
grade control structure with rock fill at a steep slope. Figure 8 is a photograph of a rock
ramp. The armoring would need to be adequately designed to mitigate erosion at the site
and stabilize the grade. It may require maintenance in the future as repeated floods could
damage the stability of such a steep channel.
FIGURE 8
Example Rock Ramp
Alternative 1-3: Remove Existing Grade Control Structure and Restore Channel
This alternative involves the full removal of the existing grade control structure, cut and
fill of areas upstream and downstream, removal of the concrete-lined channel, and
construction of grade control structures throughout the area of restoration. Specific
elements of the alternative include the following actions:
a) Removal of the existing deteriorating grade control structure
b) Raising the elevation of the channel bed downstream of STA 65+75, in combination
with lowering the elevation of the channel bed upstream of STA 65+75, so that the
upstream and downstream grades meet
c) Installation of a series of grade control or drop structures over a distance of 1,000
feet, between STA 73+00 and STA 63+00
Removal of the existing structure would involve the regrading of Bellinger Brook over
2,000 linear feet in the upstream direction starting at the grade control structure in order to
meet grade at a sustainable channel slope of 3.5 percent. This alternative would require
WATER BASIN ASSESSMENT AND FLOOD HAZARD MITIGATION ALTERNATIVES
BELLINGER BROOK, HERKIMER COUNTY, NEW YORK
APRIL 2014 PAGE 20
the removal of a large amount of fill in order to lower the channel and construct a
floodplain of adequate capacity to prevent further erosion and degradation. The pavilion
and the pedestrian bridge in Brookwood Park would likely need to be removed or
relocated and the concrete-lined channel removed in its entirety in order to meet the
grading requirements of such an alternative.
Alternative 1-4: Construct a Sediment Trapping Basin
Bellinger Brook is a steep watercourse that conveys a large, coarse-grained sediment
load. These sediments originate in the upper and mid basin and are deposited in the
lower reaches, reducing channel capacity and contributing to flooding in the village. A
sediment trapping alternative was assessed to evaluate the option of collecting and
managing sediment upstream of the floodprone areas. It involves using the scoured area
downstream of the headcut as a sediment settling area by constructing a flow control
structure at the downstream end.
Incorporating a sediment trapping basin in the design of the headcut repair would trap
sediments and prevent them from moving downstream. The site could be accessed and
maintained by public works vehicles from within the park to perform regularly scheduled
sediment removal. Such a structure could provide benefit by encouraging bed load
sediments to settle out of transport before being brought into more densely developed
areas. However, its construction would require a large flow control structure such as a
dam and would require a maintenance agreement to be developed and followed for as
long as the structure is in operation. The costs associated with the construction and
continued operation and maintenance could be significant and may not provide enough
benefit to warrant the high costs.
Recommendation
Alternative 1-1 is recommended as the preferred alternative due to the effectiveness of
arresting the headcut and the ability to prevent future erosion. If a limited amount of time
and funding exist, Alternative 1-2 may be considered.
3.5 High Risk Area #2 – Stone-Lined Channel and West German Street Vicinity (STA
31+00 to STA 73+00)
Figure 9 is a location plan of High Risk Area #2. This area extends 4,200 linear feet, from
STA 73+00 downstream to STA 31+00. Between these stations, Bellinger Brook flows
through a channel with a concrete-lined bottom and mortared stone walls along its banks.
The channel passes through a residential area where it flows beneath three roadway
crossings, all of which have been identified as undersized and act as restrictions to flow
during severe flood events.

NYDOT: Emergency TransportationInfrastructure Recovery
Herkimer County, New YorkFigure 9: Bellinger Brook High Risk Area #2Location:SOURCE(S):
³ 99 Realty Drive Cheshire, CT 06410(203) 271-1773 Fax: (203) 272-9733
www.miloneandmacbroom.com
5231-01-0201/02/2012
Scale:
Map By:MMI#:
MXD:
1st Version:
1 in = 300 ft
CMP
Y:\5231-01\GIS\Maps\High Risk Areas\Bellinger High Risk #1.mxdRevision: 4/10/2014
Church Street Culvert Crossing
West German Street- Rt 245- Bridge Crossing
Maple Grove Avenue Bridge Crossing
Concrete Channel Begins
Concrete Channel Ends
Concrete Channel Ends
Concrete Channel Begins
WATER BASIN ASSESSMENT AND FLOOD HAZARD MITIGATION ALTERNATIVES
BELLINGER BROOK, HERKIMER COUNTY, NEW YORK
APRIL 2014 PAGE 22
From upstream to downstream, the three bridges that cross Bellinger Brook are Maple
Grove Avenue, West German Street, and Church Street. The FEMA FIRM and FIS
indicate that the 500-year flows from Bellinger Brook overtop the channel in the vicinity
of Maple Grove Avenue and West German Street and flood an extensive residential area
to the east. However, when the bridges become clogged and overtop, this area is at risk
of flooding in much lower intensity storm events, as evidenced in the June 2013 event.
At the time of field inspections in October and November 2013, the Maple Grove Avenue
bridge was in the process of being replaced due to damage sustained during the June 2013
flood event. DART reports and mapping indicate that the actual area of flooding
associated with the June 2013 storm event was more widespread than the 100-year
floodplain delineated on the FIRMs, suggesting that the flooding experienced may have
been more severe than a 100-year recurrence interval.
Alternatives evaluated for this stream reach include channel modifications as well as
bridge modification and/or removal.
Alternative 2-1: Channel Widening and Bridge Replacement STA 50+50 to STA 36+50
This alternative involves the permanent removal of one roadway crossing and the
replacement of two more, as well as the modification of 865 linear feet of channel to
accommodate flood flows through the area. This alternative would also require the
acquisition of three properties due to their encroachment into the floodplain of Bellinger
Brook. The following is a summary of design elements associated with this alternative:
a) Removal of 865 linear feet of concrete-bottomed, stone-lined channel and
replacement with more natural sand/gravel/cobble substrate
b) Channel modification from the existing dimensions of approximately 20 feet wide by
five feet deep to a multistage compound channel, including an inner 25-foot-wide by
two-foot-deep bankfull channel and a minimum of 10 feet of floodplain on both sides,
to be created through excavation and regrading. Figure 10 is a cross section of a
typical compound channel.
c) Permanent removal of the Maple Grove Avenue bridge
d) Replacement and widening of both the West German Street bridge and the Church
Street bridge with new 45-foot minimum span bridges
e) Acquisition and removal of at least three floodprone structures: (1) single-family
house at the northwest corner of Maple Grove Avenue and West German Street; (2)
single-family house at the southwest corner of Maple Grove Avenue and West
German Street; and (3) single-family house on the south side of Church Street,
between Bellinger Brook and the entrance to the high school parking lot.

WATER BASIN ASSESSMENT AND FLOOD HAZARD MITIGATION ALTERNATIVES
BELLINGER BROOK, HERKIMER COUNTY, NEW YORK
APRIL 2014 PAGE 23
FIGURE 10
Typical Cross Section of a Compound Channel
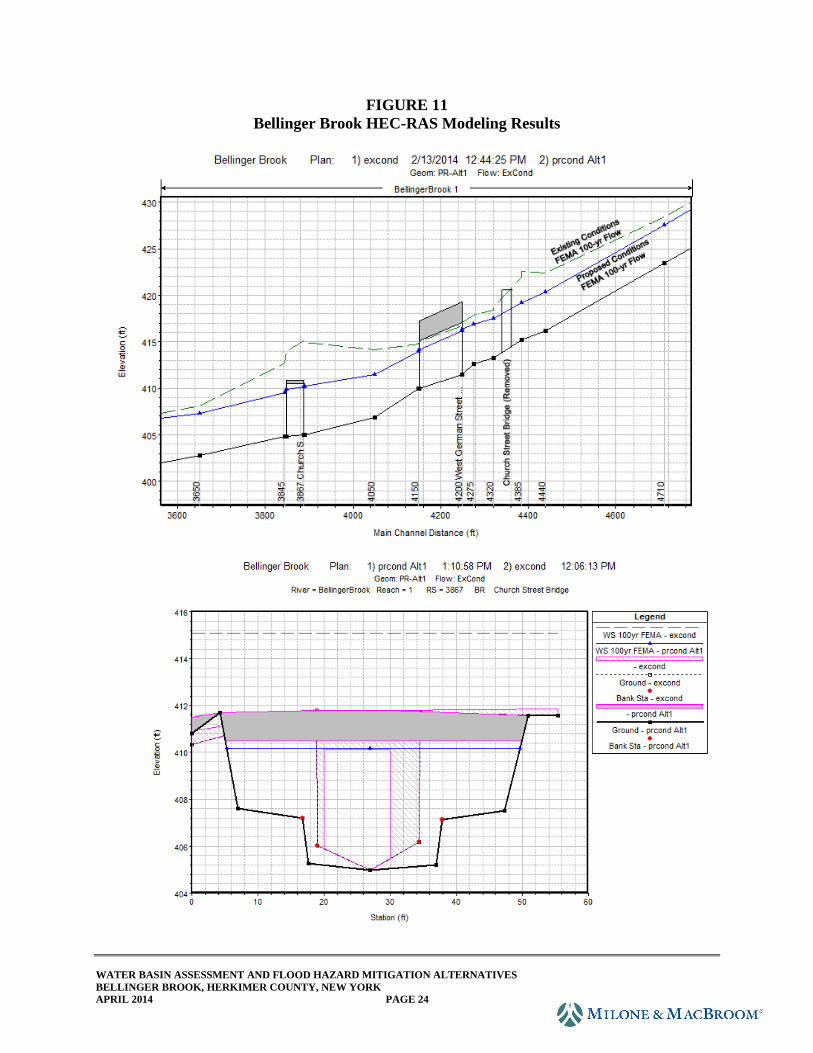
The proposed alternative was modeled in HEC-RAS to determine what level of benefit
could be offered from the improvements. Figure 11 presents a profile of existing and
proposed conditions.
The model predicts that water surface elevations during the 100-year FEMA flow can be
completely contained within the compound channel, with a maximum decrease in water
surface elevation of 5.2 feet upstream of the Church Street bridge crossing. This will
significantly decrease the frequency and severity of flooding where water overtops the
channel and bridges and floods the adjoining residential areas.
Recognizing that the existing bridges act as hydraulic constrictions and contribute heavily
to flooding of the area, removal of all roadway crossings is not viable. Although a formal
traffic study was not conducted, the average daily traffic on West German Street and
Church Street appeared too high on these roadways to consider rerouting traffic patterns.
Maple Grove Avenue, however, provides access to a residential area that has multiple
other access points less than a quarter mile away.
Alternative 2-2: Channel Dredging
Dredging (specifically lowering) Bellinger Brook through this reach was assessed but led
to an over-steepening of the upstream channel, with an overly flat downstream channel, a
condition that would disrupt sediment transport through the reach, cause upstream
bank/channel scour conditions, and encourage additional downstream sediment
deposition. Such a condition is likely to exacerbate flooding on a long-term basis.
WATER BASIN ASSESSMENT AND FLOOD HAZARD MITIGATION ALTERNATIVES
BELLINGER BROOK, HERKIMER COUNTY, NEW YORK
APRIL 2014 PAGE 24
FIGURE 11
Bellinger Brook HEC-RAS Modeling Results

WATER BASIN ASSESSMENT AND FLOOD HAZARD MITIGATION ALTERNATIVES
BELLINGER BROOK, HERKIMER COUNTY, NEW YORK
APRIL 2014 PAGE 25
The need for sediment excavation within Bellinger Brook can be reduced by reducing the
sediment load at its source (i.e., by repairing bank failures and headcuts and reducing
erosion) and by improving sediment transport. Bellinger Brook is a steep, high-energy
watercourse, and sediments will continue to be transported downstream regardless of
what actions are taken to control sediments in the upper reaches. These sediments are
prone to depositing in the lower reaches, thus reducing channel capacity and contributing
to flooding in the village of Herkimer.
Dredging is often the first response to sediment deposition and clogging of the stream
channel or bridge openings; however, over-widening or over-deepening through dredging
can initiate headcutting, foster poor sediment transport, result in low habitat quality, and
not necessarily provide significant flood mitigation. Dredging can further isolate a
stream from its natural floodplain, disrupt sediment transport, expose erodible sediments,
cause upstream bank/channel scour, and encourage additional downstream sediment
deposition. Improperly dredged stream channels often show signs of severe instability,
which can cause larger problems after the work is complete. Such a condition is likely to
exacerbate flooding on a long-term basis.
A sediment management program should involve the development of standards to
delineate how, when, and to what dimensions sediment excavation should be performed.
It will also require the proper regulatory approval, as well as budgetary considerations to
allow the work to be funded on an ongoing or as-needed basis as prescribed by the
standards to be developed.
Conditions in which active sediment management should be considered include:
Situations where the channel is confined, without space in which to laterally migrate
For the purpose of infrastructure protection
At bridge openings where hydraulic capacity has been compromised
In reaches with low habitat value
In cases where sediment management of the stream channel is necessary, a methodology
should be developed that would allow for proper channel sizing and slope. The following
guidelines are provided:
1. Maintain the original channel slope and do not overly deepen or widen the channel.
Excavation should not extend beyond the channel's estimated bankfull width unless it
is to match an even wider natural channel. Estimated bankfull widths on Bellinger
Brook are provided in Table 1 of this report and range from 28.7 feet in Brookwood
Park to 32.8 feet at the railroad bridge.
2. Sediment management should be limited in volume to either a single flood's
deposition or to the watershed's annual sediment yield in order to preclude
downstream bed degradation from lack of sediment. Annual sediment yields vary,
but one approach is to use a regional average of 50 cubic yards per square mile per

WATER BASIN ASSESSMENT AND FLOOD HAZARD MITIGATION ALTERNATIVES
BELLINGER BROOK, HERKIMER COUNTY, NEW YORK
APRIL 2014 PAGE 26
year unless a detailed study is made. The estimated annual sediment yield of
Bellinger Brook is 185 cubic yards.
3. Excavation of fine-grain sediment releases turbidity. Best available practices should
be followed to control sedimentation and erosion.
4. Sediment excavation requires regulatory permits. Prior to initiation of any in-stream
activities, NYSDEC should be contacted, and appropriate local, state, and federal
permitting should be obtained.
5. Disposal of excavated sediments should always occur outside of the floodplain. If
such materials are placed on the adjacent bank, they will be vulnerable to
remobilization and redeposition during the next large storm event.
6. No sediment excavation should be undertaken in areas where rare or endangered
species are located.
Alternative 2-3: Floodproofing and Flood Protection of Individual Properties
In areas where properties are vulnerable to flooding and repeatedly flood, improvements
to individual properties and structures may be appropriate. Potential measures for
property protection include the following:
Elevation of the structure. Home elevation involves the removal of the building structure
from the basement and elevating it on piers to a height such that the first floor is located
above the 1 percent annual chance flood level. The basement area is abandoned and
filled to be no higher than the existing grade. All utilities and appliances located within
the basement must be relocated to the first-floor level.
Construction of property improvements such as barriers, floodwalls, and earthen
berms. Such structural projects can be used to prevent shallow flooding. There may be
properties within the town where implementation of such measures will serve to protect
structures.
Dry floodproofing of the structure to keep floodwaters from entering. Dry floodproofing
refers to the act of making areas below the flood level watertight. Walls may be coated
with compound or plastic sheathing. Openings such as windows and vents would be
either permanently closed or covered with removable shields. Flood protection should
extend only 2 to 3 feet above the top of the concrete foundation because building walls
and floors cannot withstand the pressure of deeper water.
Wet floodproofing of the structure to allow floodwaters to pass through the lower area of
the structure unimpeded. Wet floodproofing refers to intentionally letting floodwater into
a building to equalize interior and exterior water pressures. Wet floodproofing should

WATER BASIN ASSESSMENT AND FLOOD HAZARD MITIGATION ALTERNATIVES
BELLINGER BROOK, HERKIMER COUNTY, NEW YORK
APRIL 2014 PAGE 27
only be used as a last resort. If considered, furniture and electrical appliances should be
moved away or elevated above the 1 percent annual chance flood elevation.
Performing other potential home improvements to mitigate damage from flooding. The
following measures can be undertaken to protect home utilities and belongings:
Relocate valuable belongings above the 1 percent annual chance flood elevation to
reduce the amount of damage caused during a flood event.
Relocate or elevate water heaters, heating systems, washers, and dryers to a higher
floor or to at least 12 inches above the high water mark (if the ceiling permits). A
wooden platform of pressure-treated wood can serve as the base.
Anchor the fuel tank to the wall or floor with noncorrosive metal strapping and lag
bolts.
Install a backflow valve to prevent sewer backup into the home.
Install a floating floor drain plug at the lowest point of the lowest finished floor.
Elevate the electrical box or relocate it to a higher floor and elevate electric outlets to
at least 12 inches above the high water mark.
Encouraging property owners to purchase flood insurance under the National Flood
Insurance Program (NFIP) and to make claims when damage occurs. While having
flood insurance will not prevent flood damage, it will help a family or business put things
back in order following a flood event. Property owners should be encouraged to submit
claims under the NFIP whenever flooding damage occurs in order to increase the
eligibility of the property for projects under the various mitigation grant programs.
Recommendation
Alternative 2-1 is recommended as the preferred alternative due to its effectiveness at
mitigating flooding while minimizing the impact on adjoining infrastructure and
development. Until such time as long-term flood improvements can be made, individual
property protection measures, as described in Alternative 2-3, may be appropriate.
3.6 High Risk Area #3 – School Levee (STA 16+00 to STA 36+50)
Figure 12 is a location plan of High Risk Area #3. Due to the floodplain encroachment
associated with the Herkimer Junior/Senior High School and athletic field complex,
Bellinger Brook is excessively incised and channelized from STA 36+50 to STA 16+00.
It does not have a floodplain. This 1,650-linear-foot reach of channel experiences deep
waters flowing at high velocities during flood events, which cause very high shear forces
along the channel and bank.
Bellinger Brook is lined on its left bank through this reach by a flood control levee. The
levee shows signs of erosion at various points along its length. The brook is spanned by
two pedestrian bridges that cross between the high school and the athletic fields, one at
STA 31+50 (referred to as Bridge 1) and one at STA 25+75 (referred to as Bridge 2).

NYDOT: Emergency TransportationInfrastructure Recovery
Herkimer County, New YorkFigure 12: Bellinger Brook High Risk Area #3Location:SOURCE(S):
³ 99 Realty Drive Cheshire, CT 06410(203) 271-1773 Fax: (203) 272-9733
www.miloneandmacbroom.com
5231-01-0201/02/2012
Scale:
Map By:MMI#:
MXD:
1st Version:
1 in = 125 ft
CMP
Y:\5231-01\GIS\Maps\High Risk Areas\Bellinger High Risk #3.mxdRevision: 2/20/2014
Begin Levee- Along Right Bank
Pedestrian Bridge
Pedestrian Bridge
End Levee

WATER BASIN ASSESSMENT AND FLOOD HAZARD MITIGATION ALTERNATIVES
BELLINGER BROOK, HERKIMER COUNTY, NEW YORK
APRIL 2014 PAGE 29
The FEMA flood profile shows a hydraulic constriction at Bridge 1. The downstream
bridge is not included in the FEMA profile. According to FEMA mapping, the 100-year
flood event does not overtop the levee. Anecdotal accounts indicate that the levee was
compromised and in danger of failure during the June 2013 floods; however, it did not
actually overtop.
Two alternatives were evaluated to alleviate the scour and erosion potential associated
with high velocities in confined channels within Hazard Area #3. The first involves
floodplain restoration and reconnectivity; the second involves bank armoring.
Alternative 3-1: Channel Widening and Floodplain Restoration
This alternative involves the following elements:
a) Creation of a larger channel and floodplain for the 1,650-foot confined reach of
Bellinger Brook
b) Removal and/or replacement of both pedestrian bridges
c) Replacement of the levee
Under this two-part alternative, a modified channel would be sized to convey the brook's
bankfull discharge, which has been estimated to be 130 cfs. This would require a channel
with a width of approximately 33 feet and a depth of approximately 1.5 feet. Larger,
peak flood flows would be conveyed on a created floodplain, approximately 145 feet in
width, which would be dry under normal conditions. One or both of the pedestrian
bridges would need to be replaced with a larger bridge long enough to span the channel
and floodplain.
This alternative would encroach into a portion of the athletic fields, likely making the
athletic fields unusable in their current configuration and requiring reconstruction.
Alternative 3-2: Repair Levee and Replace Pedestrian Bridges.
This alternative involves the following elements:
a) Repair and armoring of the levee that was damaged during the June 2013 floods
b) Replacement or removal of the pedestrian bridge at STA 31+50
Hydraulic modeling indicates that the downstream-most pedestrian bridge at STA 25+80
(Bridge 2) is adequately sized for the 100-year flow event. This alternative includes
replacement of the pedestrian bridge at STA 31+50 (Bridge 1) with a structure that is of
similar size to Bridge 2. Table 6 summarizes existing conditions of the two bridges.

WATER BASIN ASSESSMENT AND FLOOD HAZARD MITIGATION ALTERNATIVES
BELLINGER BROOK, HERKIMER COUNTY, NEW YORK
APRIL 2014 PAGE 30
TABLE 6
Summary of Pedestrian Bridge Data
Waterway Crossing Station Width (ft) Height (ft)
Pedestrian Bridge (Bridge 1) 31+50 24 7
Pedestrian Bridge (Bridge 2) 25+80 60 12
The existing conditions model predicts velocities ranging between 12 and 14 feet per
second in the area of erosion along the levee banks and channel bottom. Riprap over 2
feet in diameter may be necessary to stabilize the area from such highly erosive forces.
Recommendation
Alternative 3-1 is the most naturalistic solution but has a significant impact on the school
athletic fields. As such, Alternative 3-2 is recommended due to its effectiveness at
mitigating flooding while minimizing the impact on adjoining infrastructure and
development. Repair of the existing levee in its current location will minimize impacts
on the surrounding school and athletic fields, and the replacement of the pedestrian
bridge at STA 31+50 will lower velocities and help control erosion in the area.
4.0 RECOMMENDATIONS
The following recommendations are offered:
1. Stabilize Headcut and Restore Channel at Brookwood Park – Stabilize the headcut
in Brookwood Park near STA 65+75 to eliminate a major source of sediment and
prevent further degradation of the streambed and banks. Stabilization can be
achieved by placing fill against the headcut and armoring the downstream channel
with large stone and/or sheet piling grade control structures.
2. Increase Channel Capacity and Connectivity to Floodplain – The Bellinger Brook
channel is significantly undersized through its middle section where it is concrete
lined and bound by stone walls on both banks without a floodplain. Modifying the
channel from the existing dimensions of approximately 20 feet wide by five feet
deep to a multistage compound channel, including an inner 25-foot-wide by two-
foot-deep bankfull channel and a minimum of 10 feet of floodplain on both sides
would provide the needed capacity and reconnect the stream to its floodplain. This
approach is recommended from STA 50+50 to STA 36+50.
3. Acquire and Remove Residential Properties – Expansion of the channel as
described above will impact numerous properties along the brook, portions of
which will need to be acquired. Acquisition and removal of at least three
floodprone structures will be required as follows: (1) single-family house at the
northwest corner of Maple Grove Avenue and West German Street; (2) single-

WATER BASIN ASSESSMENT AND FLOOD HAZARD MITIGATION ALTERNATIVES
BELLINGER BROOK, HERKIMER COUNTY, NEW YORK
APRIL 2014 PAGE 31
family house at the southwest corner of Maple Grove Avenue and West German
Street; and (3) single-family house on the south side of Church Street, between
Bellinger Brook and the entrance to the high school parking lot.
4. Remove the Bridge at Maple Grove Avenue – Maple Grove Avenue creates a
significant hydraulic pinch point in Bellinger Brook, as evidenced by the severe
damage during the June 2013 flood event. Unlike the bridges at West German
Street and Church Street, which carry higher volumes of traffic, the Maple Grove
Avenue bridge provides access to a residential area that has multiple other access
points less than a quarter mile away. Its removal and conversion of Maple Grove
Avenue to a cul-de-sac would provide substantial flood benefit for a relatively small
cost of demolition and is recommended.
5. Replace the Bridges at West German Street and Church Street – The West German
and Church Street bridges hydraulically constrict the flow in Bellinger Brook.
Replacement and widening are recommended with new 45-foot minimum span
bridges. Adequately sized stream crossings not only have the potential to reduce
flooding, but they also provide a range of environmental benefits by allowing
aquatic organisms, sediment, and debris to be conveyed through the stream
corridor.
6. Replace the Pedestrian Bridge Near the Herkimer Junior/Senior High School –
Two pedestrian bridges are located adjacent to the Herkimer Junior/Senior High
School. Replacement of the upstream bridge at STA 31+50 (Bridge 1) is
recommended with a structure that is of similar size to Bridge 2, which has a span
of 60 feet and a height of 12 feet.
7. Armor the Levee Adjacent to the Herkimer Junior/Senior High School – Repair and
armoring are recommended along the levee adjacent to the Herkimer Junior/Senior
High School to stabilize erosion that has occurred and protect it from future erosion.
8. Adopt Sediment Management Standards – When excavation of depositional areas is
necessary, it should be undertaken in a manner that maintains channel stability,
avoiding over-widening and/or over-deepening the channel. Development of
sediment management standards is recommended to provide guidance to contractors
and local municipal and county public works departments on how to maintain
proper channel sizing and slope as well as the application of best practices.
9. Monitor Minor Bank Failures – Several areas of eroding banks, minor bank
failures, and slumping hill slopes were observed along Bellinger Brook in the upper
reaches (STA 78+00 and upstream). These are of low to moderate severity, appear
to be relatively stable, and at the time of the field visits were not contributing a
large amount of sediment to the channel. It is recommended that these sites be
monitored periodically and stabilized as necessary.

WATER BASIN ASSESSMENT AND FLOOD HAZARD MITIGATION ALTERNATIVES
BELLINGER BROOK, HERKIMER COUNTY, NEW YORK
APRIL 2014 PAGE 32
10. Develop a Watershed Management Plan – Existing and future land uses and
activities within the Bellinger Brook watershed can impact water quantity as well as
water quality. To address issues relating to land use practices and stormwater
management, development of a watershed management plan is recommended.
11. Evaluate Floodplain Regulations – A critical evaluation of existing floodplain law
and policies should be undertaken to evaluate the effectiveness of current practices
and requirements. Identification of a floodplain coordinator and development of a
detailed site plan review process for all proposed development within the floodplain
would provide a mechanism to quantify floodplain impacts and ascertain
appropriate mitigation measures.
12. Install and Monitor a Stream Gauge – There is currently no stream gauge on
Bellinger Brook, making statistical analysis difficult. Installation of a permanent
stream gauge is recommended.
13. Develop Design Standards – There is currently no requirement to design stream
crossings to certain capacity standards. For critical crossings such as major
roadways or crossings that provide sole ingress/egress, design to the 50- or 100-year
storm event may be appropriate whereas less critical crossings in flat areas where
flood velocities are low may be sufficient to pass only the 10-year event. Crossings
should always be designed in a manner that does not cause flooding. When a
structure that is damaged or destroyed is replaced with a structure of the same size,
type, and design, it is reasonable to expect that the new structure will be at risk for
future damage as well. Development of design standards is recommended for all
new and replacement structures.
14. Protect Individual Properties – A variety of measures are available to protect
existing public and private properties from flood damage, including elevation of
structures, construction of barriers, floodwalls and earthen berms, dry or wet
floodproofing, and utility modifications within the structure. While broader
mitigation efforts are most desirable, they often take time and money to implement.
On a case-by-case basis, where structures are at risk, individual floodproofing
should be explored. Property owners within FEMA delineated floodplains should
also be encouraged to purchase flood insurance under the NFIP and to make claims
when damage occurs.
Table 7 presents anticipated cost ranges for key recommendations. These are graphically
depicted on the following pages.

WATER BASIN ASSESSMENT AND FLOOD HAZARD MITIGATION ALTERNATIVES
BELLINGER BROOK, HERKIMER COUNTY, NEW YORK
APRIL 2014 PAGE 33
TABLE 7
Cost Range of Recommended Actions
Approximate Cost Range
Bellinger Brook Recommendations < $100k $100k-$500k $500k-$1M $1M-$5M >$5M
Stabilize Headcut and Restore Channel at Brookwood Park
X
Increase Channel Capacity and Connectivity to Floodplain X
Acquire and Remove Residential Properties
X
Remove the Bridge at Maple Grove Avenue X
Replace the Bridges at West German Street and Church Street
X
Replace the Pedestrian Bridge Near the Herkimer Junior/Senior High School X
Armor the Levee Adjacent to the Herkimer Junior/Senior High School
X
Undertake Study of Hydrology and Land Use X
Install and Monitor a Stream Gauge X
WATER BASIN ASSESSMENT AND FLOOD HAZARD MITIGATION ALTERNATIVESBELLINGER BROOK, HERKIMER COUNTY, NEW YORK
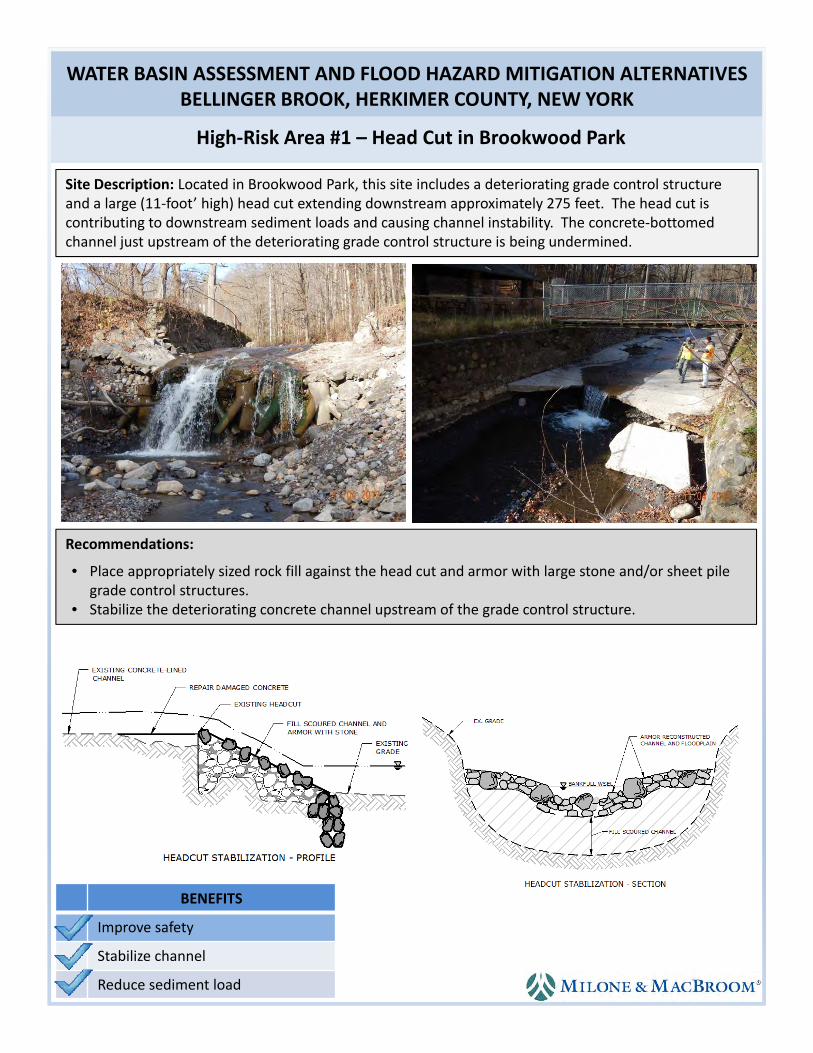
High‐Risk Area #1 – Head Cut in Brookwood Park
BENEFITS
Improve safety
Stabilize channel
Reduce sediment load
Site Description: Located in Brookwood Park, this site includes a deteriorating grade control structure and a large (11‐foot’ high) head cut extending downstream approximately 275 feet. The head cut is contributing to downstream sediment loads and causing channel instability. The concrete‐bottomed channel just upstream of the deteriorating grade control structure is being undermined.
Recommendations:
• Place appropriately sized rock fill against the head cut and armor with large stone and/or sheet pilegrade control structures.
• Stabilize the deteriorating concrete channel upstream of the grade control structure.

WATER BASIN ASSESSMENT AND FLOOD HAZARD MITIGATION ALTERNATIVESBELLINGER BROOK, HERKIMER COUNTY, NEW YORK
High‐Risk Area #2 – Concrete Lined Channel
BENEFITS
Mitigate flooding
Reconnect floodplain
Improve sediment transport
Site Description: Beginning at station 46+00 downstream to station 31+00, is a concrete lined channel that routes Bellinger Brook through the developed town of Herkimer. The channel is deteriorated at many points and highly constricts floodwaters, with no floodplain to accommodate flood flows.
Recommendations:
• Modify the channel to a multi‐stage compound channel, including an inner 25‐foot wide by two‐foot deep bankfull channel with a minimum of 10 feet of floodplain bench on both sides.
• Acquire easements and several high risk residential properties near Maple Grove Avenue, West German Street, and Church Street to accommodate the larger stream corridor.
WATER BASIN ASSESSMENT AND FLOOD HAZARD MITIGATION ALTERNATIVESBELLINGER BROOK, HERKIMER COUNTY, NEW YORK
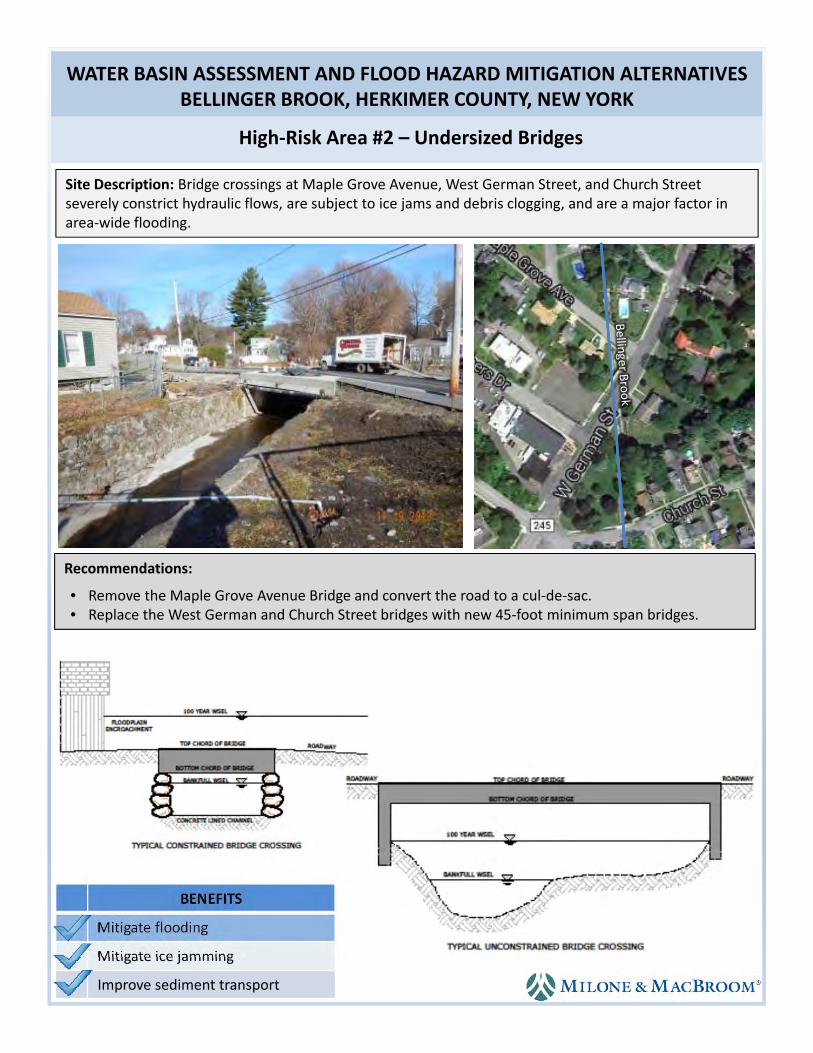
High‐Risk Area #2 – Undersized Bridges
BENEFITS
Mitigate flooding
Mitigate ice jamming
Improve sediment transport
Site Description: Bridge crossings at Maple Grove Avenue, West German Street, and Church Street severely constrict hydraulic flows, are subject to ice jams and debris clogging, and are a major factor in area‐wide flooding.
Recommendations:
• Remove the Maple Grove Avenue Bridge and convert the road to a cul‐de‐sac.• Replace the West German and Church Street bridges with new 45‐foot minimum span bridges.

WATER BASIN ASSESSMENT AND FLOOD HAZARD MITIGATION ALTERNATIVESBELLINGER BROOK, HERKIMER COUNTY, NEW YORK
High‐Risk Area #3 – Leveed Channel at High School
BENEFITS
Improve hydraulic conveyance
Stabilize levee
Maintain athletic fields
Site Description: Located just south of Herkimer High School along the athletic fields is a man made levee designed to contain flows of Bellinger Brook. The levee runs from station 32+00 downstream to station 16+00 and shows signs of linear erosion at some sections along the channel. Two pedestrian bridges span the river just upstream of the levee and midway, creating a hydraulic constriction at the upstream point.
Recommendations:
• Replace the pedestrian bridge near the Herkimer Junior/Senior High School with a larger structurewith one of approximate 60‐foot span.
• Repair and armor the levee to stabilize erosion and protect against future erosion.

APPENDIX A
Summary of Data and Reports Collected

Emergency Transportation Infrastructure Recovery, Waterbasin Assessment NYSDOT PIN # 2FOI.02.301
Herkimer, Oneida, and Montgomery Counties, New York MMI Proj. #5231‐01
December 10, 2013
ATTACHMENT A: DATA INVENTORY
Year Data Type Document Title Author
2013 Presentation Flood Control Study for Fulmer Creek Schnabel Engineering
2012 Map Sauquoit Creek Watershed/Floodplain Map Herkimer‐Oneida Counties Comprehensive Planning Program
2011 Report Oriskany Creek Conceptual Plan and Feasibility Study for Watershed Project Oneida County SWCD
2009 Presentation Ice Jam History and Mitigation Efforts National Weather Service, Albay NY
2007 Report Cultural Resources Investigations of Fulmer, Moyer, and Steele Flood Control Projects United States Army Corps of Engineers (USACE)
2006 Report Riverine High Water Mark Collection, Unnamed Storm Federal Emergency Management Agency (FEMA)
2005 Report Fulmer Creek Flood Damage Control Feasibility Study United States Army Corps of Engineers (USACE)
2005 Report Steele Creek Flood Damage Control Feasibility Study United States Army Corps of Engineers (USACE)
2004 Report Fulmer Creek Basin Flood Hazard Mitigation Plan Herkimer‐Oneida Counties Comprehensive Planning Program
2004 Report Moyer Creek Basin Flood Hazard Mitigation Plan Herkimer‐Oneida Counties Comprehensive Planning Program
2004 Report Steele Creek Basin Flood Hazard Mitigation Plan Herkimer‐Oneida Counties Comprehensive Planning Program
2003 Report Fulmer, Moyer, Steele Creek ‐ Stream Bank Erosion Inventory Herkimer‐Oneida Counties Comprehensive Planning Program
1997 Report Sauquoit Creek Watershed Management Strategy Herkimer‐Oneida Counties Comprehensive Planning Program
2011 Report Flood Insurance Study (FIS), Herkimer County Federal Emergency Management Agency (FEMA)
2011 Report Flood Insurance Study (FIS), Montgomery County Federal Emergency Management Agency (FEMA)
2013 Report Flood Insurance Study (FIS), Oneida County Federal Emergency Management Agency (FEMA)
2010 Report Bridge Inspection Summaries, Multiple Bridges National Bridge Inventory (NBI)
2002 Hydraulic Models Flood Study Data Description and Assembly ‐ Rain CDROM New York Department of Enviromental Conservation (NYDEC)
2013 Data June/July 2013 ‐ Post‐Flood Stream Assessment New York State Department of Transportation (NYSDOT)
2013 GIS Data LiDAR Topography, Street Mapping, Parcel Data, Utility Info, Watersheds Herkimer‐Oneida Counties Comprehensive Planning Program
2013 GIS Data Aerial Orthographic Imagery, Basemaps Microsoft Bing, Google Maps, ESRI
2011 GIS Data FEMA DFIRM Layers Federal Emergency Management Agency (FEMA)
2013 Data Watershed Delineation and Regression Calculation US Geological Survey (USGS) ‐ Streamstats Program

APPENDIX B
Field Data Collection Forms

NYDOT: Emergency TransportationInfrastructure Recovery
Herkimer County, New YorkFigure 1-1: Bellinger Brook Data Collection Points Location:
Sources: Esri, DeLorme, NAVTEQ, TomTom, Intermap, increment P Corp., GEBCO, USGS, FAO, NPS,NRCAN, GeoBase, IGN, Kadaster NL, Ordnance Survey, Esri Japan, METI, Esri China (Hong Kong),swisstopo, and the GIS User Community
SOURCE(S):
³ 99 Realty Drive Cheshire, CT 06410(203) 271-1773 Fax: (203) 272-9733
www.miloneandmacbroom.com
5231-01-0212/4/2013
Scale:
Map By:MMI#:
MXD:
1st Version:
1 in = 667 ft
CMP
Y:\5231-01\GIS\Maps\Phase II Icon Maps\Bellinger 1-1.mxdRevision: 12/12/2013
!\
!\
!\!<
!\!<
!\
!\!<
!\
!\
!\
!\
!\!< !f
IL !\!<
!U
!fIL
!\
SymbologyPhoto Documentation
Phase I Assessment
Phase II Assessment
Wolman Pebble Count
Bridge/ Culvert Measurement
Bank Failure Assessment
!<
!<
!\ !f!\
!\
!<!f !\
IL!< !\
IL!< !\

MMI Project #5231-01 Phase I River Assessment Reach Data
River _______________ Reach ____________ U/S Station ______________ D/S Station __________
Inspectors _________________ Date _____________ Weather _________________________________
Photo Log _________________________________________________________________________________
A) Channel Dimensions: Bankfull Width (ft) __________ Depth (ft) __________
Watershed area at D/S end of reach (mi2) ___________
B) Bed Material: Bedrock Boulders Cobble Gravel Sand Clay Concrete Debris Riprap
Notes: ____________________________________________________________________
C) Bed Stability: Aggradation Degradation Stable Note: ___________________
D) Gradient: Flat Medium Steep Note: ___________________
E) Banks: Natural Channelized Note: _________________
F) Channel Type: Incised Colluvial Alluvial Bedrock Note: __________
G) Structures: Dam Levee Retaining Wall Note: ________________
H) Sediment Sources: ________________________________________________________________________________
I) Storm Damage Observations: ________________________________________________________________________
________________________________________________________________________
J) Vulnerabilities: Riverbank Development Floodplain Development Road Trail Railroad
Utility Bridge Culvert Retaining Wall Ball field Notes: _________________
K) Bridges: Structure # _____________ Inspection Report? Y N Date _________________
Notes: ___________________________________________________________________________________________
Record span measurements if not in inspection report: _____________________________________________________
Damage, scour, debris: ______________________________________________________________________________
L) Culverts: complete culvert inspection where necessary. Size: ____________________________________________
Type: _________________ Notes: _________________________________________________________________
__________________________________________________________________________________________________

Phase II River Assessment Reach Data
River ____________________ Reach ____________ Road _____________ Station ______________
Inspector _________________ Date _____________ Town ____________ County _____________
Identification Number _____________________ GPS # ________________ Photo # ________________
A) River Reach ID _____________________________ Drainage Area, sm ____________________________ D/S Boundary _______________________________, U/S Boundary ________________________________ D/S STA ___________________________________, U/S STA ____________________________________ D/S Coordinates _____________________________, U/S Coordinates ______________________________
B) Valley Bottom Data:Valley Type Confined Semiconfined Unconfined (Circle one) >80% L 20-80% <20%
Valley Relief <20' 20-100' >100
Floodplain Width <2 Wb 2-10 Wb >10 Wb __________________________________________________________________________
Left Side Right Side Natural floodplain _______% _______% Developed floodplain _______% _______% Terrace _______% _______%
Floodplain Land Use ____________ ____________
C) Pattern: Straight Sinuous Meanders Highly Meandering Braided Wandering Irregular S=1-1.05 S=1.05 – 1.25 S=1.25 – 2.0 S>2.0
D) Channel Profile Form: (Percent by Class in Reach)Cascades __________ Alluvial __________ Channel Transport Steep Step/Pool __________ Semi Alluvial __________ Sed. Source Area Fast Rapids __________ Non Alluvial __________ Eroding Tranquil Run __________ Channelized __________ Neutral Pool & Riffle __________ Incised __________ Depositional Slow Run __________ Headcuts __________
E) Channel Dimensions (FT): Bankfull Actual Top of Bank Regional HGR Width __________ __________ __________ Depth __________ __________ __________ Inner Channel Base Width __________ W/D Ratio __________
F) Hydraulic Regime:Mean Bed Profile Slope ________________ Ft/Ft Observed Mean Velocity ______________________ FPS
G) Bed Controls: Bedrock Weathered Bedrock Dam Static Armor Cohesive Substrate Bridge Boulders Dynamic Armor Culvert Debris Riprap Utility Pipe/Casing
Overall Stability _______________________
H) Bed Material: Bedrock __________ Sand __________ Riprap __________ Boulders __________ Silt and Clay __________ Concrete __________
D50 __________ Cobble and Boulder __________ Glacial Till __________ Gravel and Cobble __________ Organic __________ Sand and Gravel __________
I) Flood Hazards: Developed Floodplains Bank Erosion Buildings Aggradation Utilities Sediment Sources Hyd. Structures Widening
phase i river assessment - reach data form.docx

Bridge Waterway Inspection Summary River ____________________ Reach ____________ Road _____________ Station ______________ Inspector _________________ Date _____________ NBIS Bridge Number ____________________ NBIS Structure Rating _____________________ Year Built __________________________________ Bridge Size & Type _______________________ Skew Angle ________________________________ Waterway Width (ft) ______________________ Waterway Height (ft) _________________________ Abutment Type (circle) Vertical Spill through Wingwalls Abutment Location (circle) In channel At bank Set back Bridge Piers _____________________________ Pier Shape __________________________________ Abutment Material ________________________ Pier Material _________________________________ Spans % Bankfull Width ____________________ Allowance Head (ft) __________________________ Approach Floodplain Width _________________ Approach Channel Bankfull Width _______________ Tailwater Flood Depth or Elevation ___________ Flood Headloss, ft ____________________________ Left Abutment Piers Right Abutment Bed Materials, D50 Footing Exposure Pile Exposure Local Scour Depth Skew Angle Bank Erosion Countermeasures Condition High Water Marks Debris Bed Slope Low Medium Steep Vertical Channel Stability Stable Aggrading Degrading Observed Flow Condition Ponded Flow Rapid Turbulent Lateral Channel Stability _________________________________________________________ Fish Passage _________________________________________________________ Upstream Headwater Control _________________________________________________________
Project InformationProject Name silt/clayProject Number sandStream / Station gravelTown, State cobbleSample Date boulderSampled By bedrockSample Method
Sample Site Descriptions by ObservationsChannel type D16Misc. Notes D35
D50D84D95
(Bunte and Abt, 2001)Percent Cumulative
Particle Name lower upper Tally Count Passing % Finersilt/clay 0 0.063 0.0 0.0 F-T n-value 0.5very fine sand 0.063 0.125 0.0 0.0 D16fine sand 0.125 0.250 0.0 0.0 D5medium sand 0.250 0.500 0.0 0.0 (Fuller and Thompson, 1907)coarse sand 0.500 1 0.0 0.0very coarse sand 1 2 0.0 0.0very fine gravel 2 4 0.0 0.0fine gravel 4 5.7 0.0 0.0fine gravel 5.7 8 0.0 0.0medium gravel 8 11.3 0.0 0.0medium gravel 11.3 16 0.0 0.0coarse gravel 16 22.6 0.0 0.0coarse gravel 22.6 32 0.0 0.0 Meanvery coarse gravel 32 45 0.0 0.0very coarse gravel 45 60 0.0 0.0small cobble 60 90 0.0 0.0medium cobble 90 128 0.0 0.0large cobble 128 180 0.0 0.0 (Kappesser, 2002)very large cobble 180 256 0.0 0.0small boulder 256 362 0.0 0.0 Notessmall boulder 362 512 0.0 0.0medium boulder 512 1024 0.0 0.0large boulder 1024 2048 0.0 0.0very large boulder 2048 4096 0.0 0.0bedrock 4096 - 0.0 0.0(Wenthworth, 1922) Total 0 0.0 -
Particle Distribution (%)
Wolman Pebble Count
Particle Sizes (mm)
Riffle Stability Index (%)
Size Limits (mm)F-T Particle Sizes (mm)
D (mm) of the largestmobile particles on bar
00.10.20.30.40.50.60.70.80.9
1
0.125
0.250
0.500 1 2 4 5.7 8
11.3 16 22.6 32 45 60 90 128
180
256
362
512
1024
2048
4096
Per
cen
t b
y S
ize
(%)
Particle size (mm)
Particle Size Histogram
0102030405060708090
100
0 1 10 100 1000 10000
Per
cen
t F
iner
Particle size (mm)
Gradation Curve
sand gravel cobble boulder

APPENDIX C
Bellinger Brook Photo Log
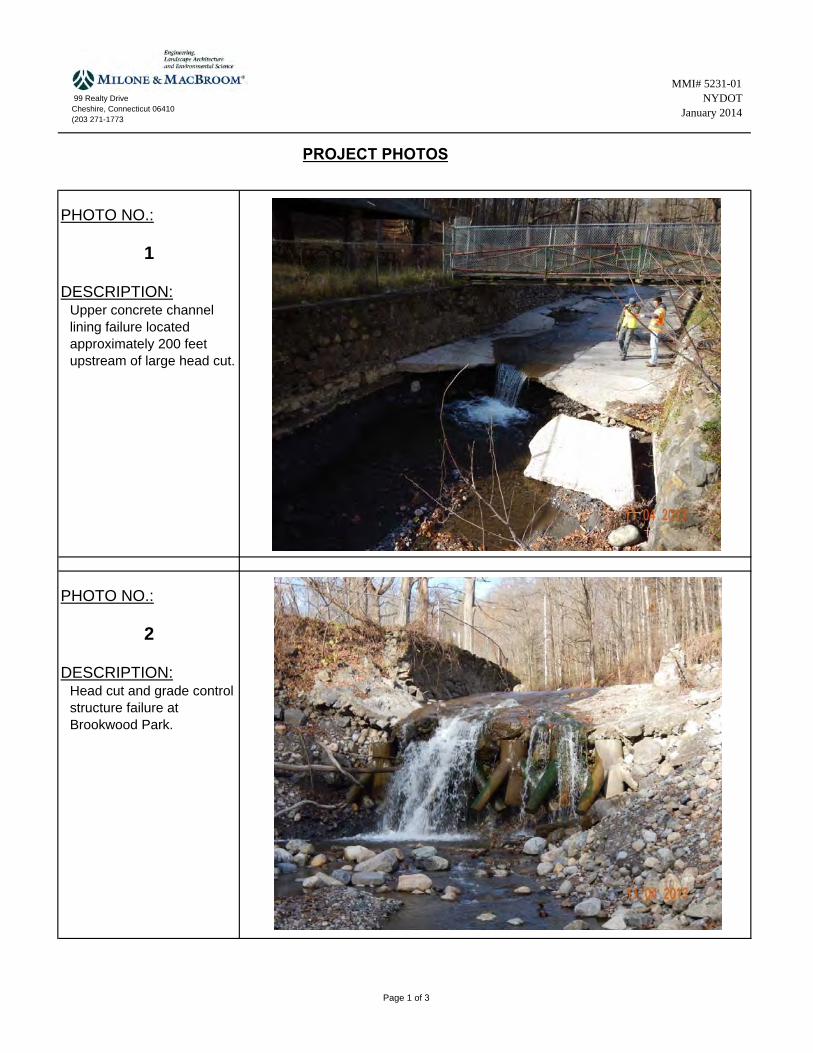
99 Realty DriveCheshire, Connecticut 06410(203 271-1773
MMI# 5231-01NYDOT
January 2014
PROJECT PHOTOS
PHOTO NO.:
DESCRIPTION:
PHOTO NO.:
DESCRIPTION:
1
Upper concrete channel lining failure located approximately 200 feet upstream of large head cut.
2
Head cut and grade control structure failure at Brookwood Park.
Page 1 of 3

99 Realty DriveCheshire, Connecticut 06410(203 271-1773
MMI# 5231-01NYDOT
January 2014
PHOTO NO.:
DESCRIPTION:
PHOTO NO.:
DESCRIPTION:
3
Concrete lined channel between Church Street and W German Street crossings
4
Reconstructed section of concrete lined channel where Maple Grove Ave had been washed out in the summer of 2013 flooding events.
Page 2 of 3
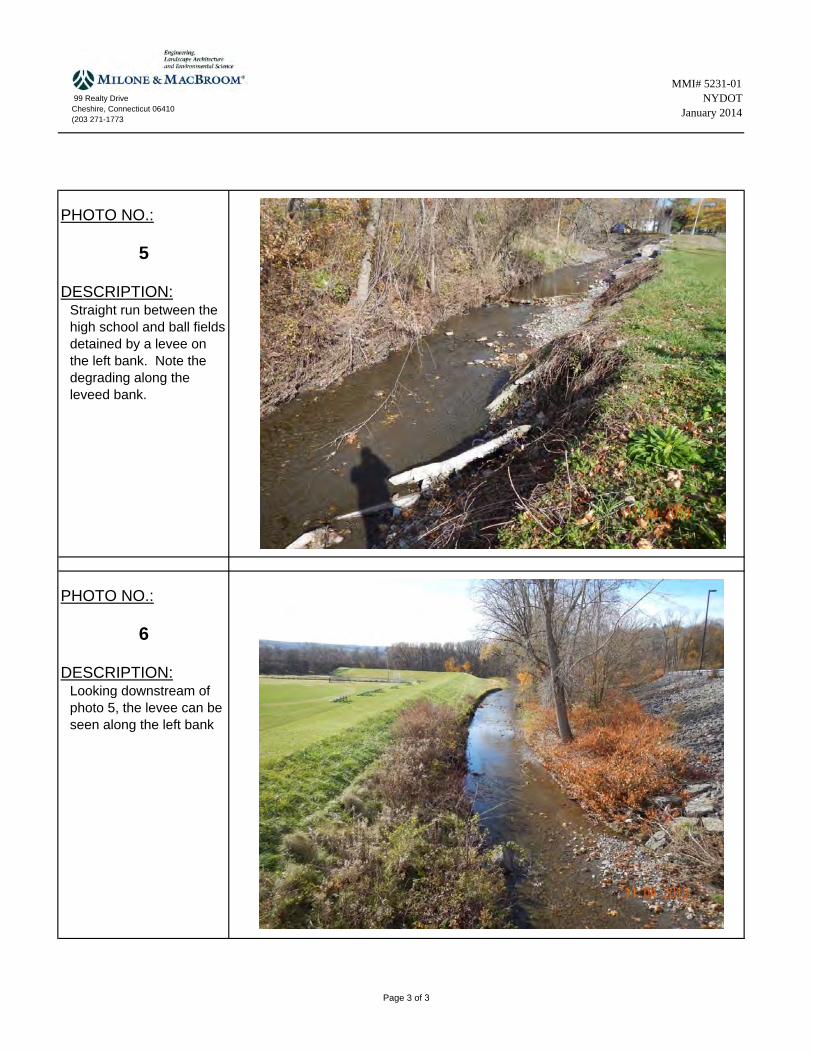
99 Realty DriveCheshire, Connecticut 06410(203 271-1773
MMI# 5231-01NYDOT
January 2014
PHOTO NO.:
DESCRIPTION:
PHOTO NO.:
DESCRIPTION:
5
Straight run between the high school and ball fields detained by a levee on the left bank. Note the degrading along the leveed bank.
6
Looking downstream of photo 5, the levee can be seen along the left bank
Page 3 of 3


![ROAD DATA - [ ], [ ], [ ], [ ] & VICINITY](https://img.pdfslide.net/doc/110x75/61a4edb5a83d6b4d7a703c9f/road-data-amp-vicinity.jpg)