Embed Size (px)
Citation preview
Emerging Issues and Trends Affecting
Commercial P/C Insurance Seminar for State Committee Chairs & Legislators
Griffith FoundationColumbus, OH
August 21, 2011Steven N. Weisbart, Ph.D., CLU, Senior Vice President & Chief EconomistInsurance Information Institute 110 William Street New York, NY 10038
Tel: 212.346.5540 Cell: 917.494.5945 [email protected] www.iii.org
2
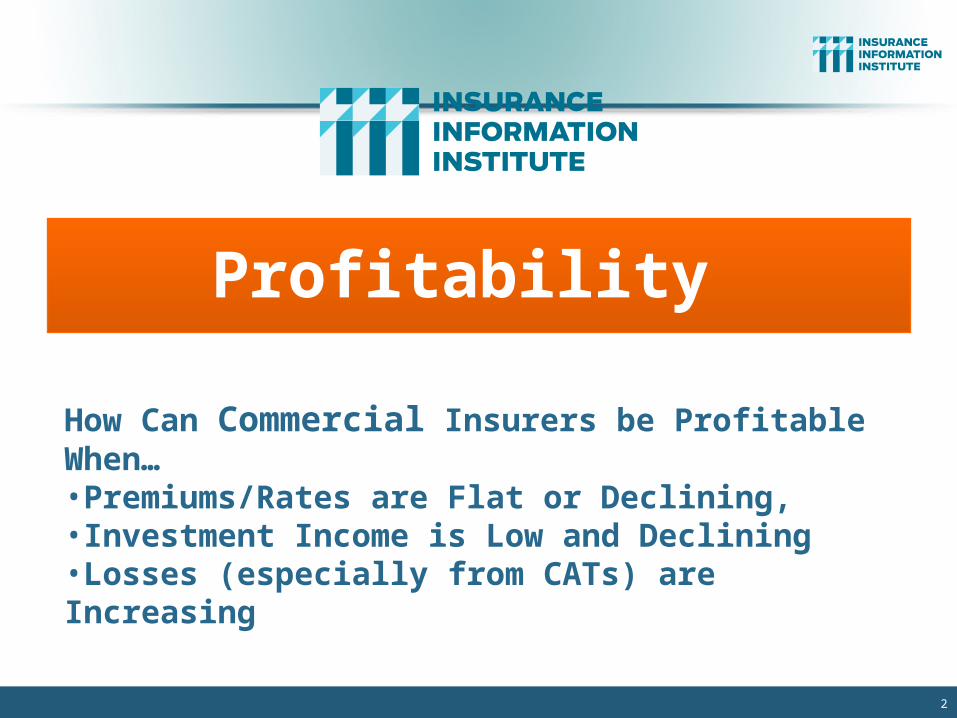
Profitability
How Can Commercial Insurers be Profitable When…•Premiums/Rates are Flat or Declining,•Investment Income is Low and Declining•Losses (especially from CATs) are Increasing

-5%
0%
5%
10%
15%
20%
25%
75
76
77
78
79
80
81
82
83
84
85
86
87
88
89
90
91
92
93
94
95
96
97
98
99
00
01
02
03
04
05
06
07
08
09
10
11
*
Profitability Peaks & Troughs in the P/C Insurance Industry, 1975 – 2011*
*Profitability = P/C insurer ROEs are I.I.I. estimates. 2011 figure is an estimate based on annualized ROAS for Q1 data. Note: Data for 2008-2011 exclude mortgage and financial guaranty insurers.Source: Insurance Information Institute; NAIC, ISO, A.M. Best.
1977:19.0% 1987:17.3%
1997:11.6%2007:12.3%
1984: 1.8% 1992: 4.5% 2001: -1.2%
10 Years
10 Years10 Years
2011:6.1%*
History suggests next ROE peak will be in 2016-2017
ROE
1975: 2.4%

P/C Commercial Insurance Direct Premiums Written by Line, 2009
$44.71
$39.89
$33.33
$24.19$22.81
$12.99$10.69
$8.47$5.41
$31.02
$0
$10
$20
$30
$40
$50
Other Liability*
WorkersComp
Comm'lMultiple
Peril
Comm'lAuto
Fire & AlliedLines
InlandMarine
MedicalMalpractice
MultiplePeril Crop
MortgageGuaranty
All Other
*Includes General Liability, Products Liability, D&O, Professional Malpractice (except Medical) etc.Sources: SNL Financial, Insurance Information Institute
$ Billions
2009 Total: $467.8 billion
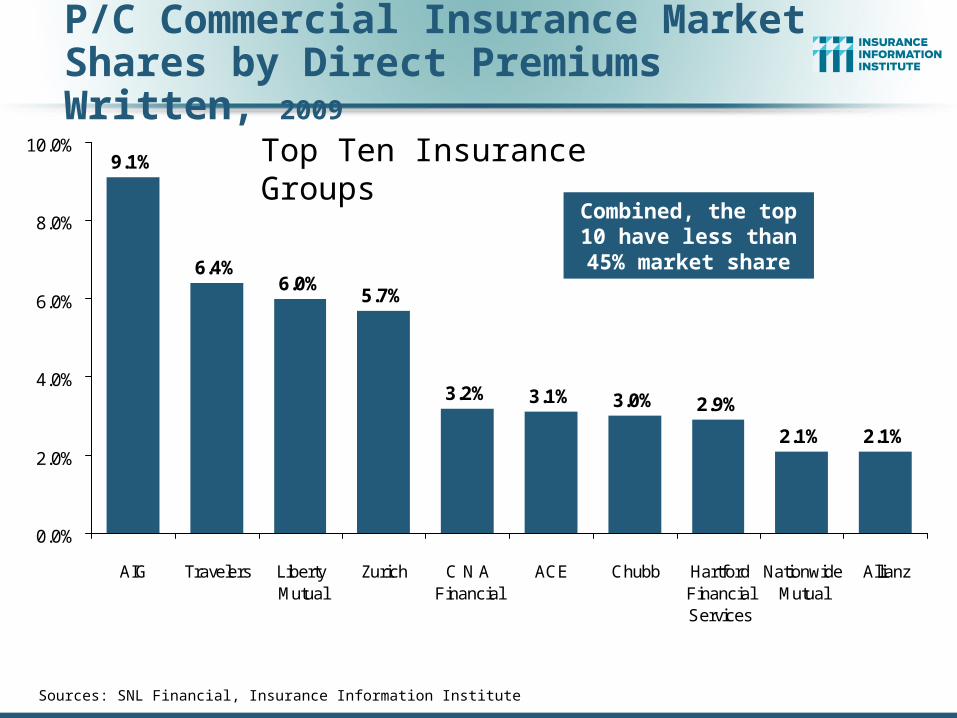
P/C Commercial Insurance Market Shares by Direct Premiums Written, 2009
9.1%
6.4%6.0%
5.7%
3.2% 3.1% 3.0% 2.9%
2.1% 2.1%
0.0%
2.0%
4.0%
6.0%
8.0%
10.0%
AIG Travelers LibertyMutual
Zurich C N AFinancial
ACE Chubb HartfordFinancialServices
NationwideMutual
Allianz
Sources: SNL Financial, Insurance Information Institute
Top Ten Insurance Groups
Combined, the top 10 have less than 45%
market share
6
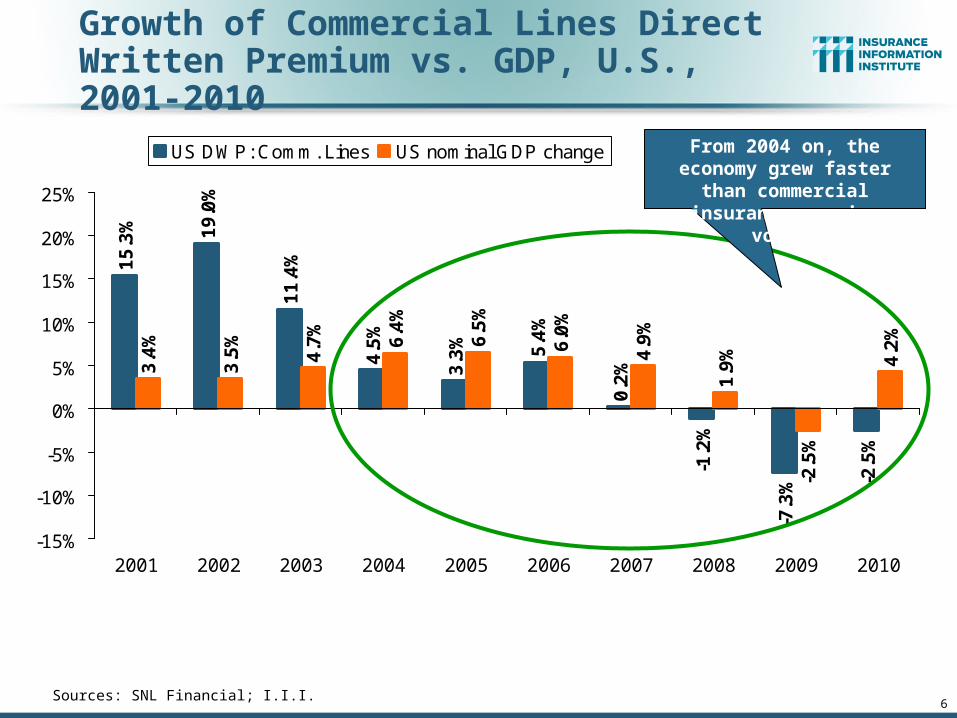
Growth of Commercial Lines Direct Written Premium vs. GDP, U.S., 2001-2010
Sources: SNL Financial; I.I.I.
15
.3% 19
.0%
11
.4%
4.5
%
3.3
% 5.4
%
0.2
%
-1.2
%
-7.3
% -2.5
%
3.4
%
3.5
%
4.7
%
6.4
%
6.5
%
6.0
%
4.9
%
1.9
%
-2.5
%
4.2
%
-15%
-10%
-5%
0%
5%
10%
15%
20%
25%
2001 2002 2003 2004 2005 2006 2007 2008 2009 2010
US DWP: Comm. Lines US nominal GDP change From 2004 on, the economy grew faster than commercial insurance premium volume
7
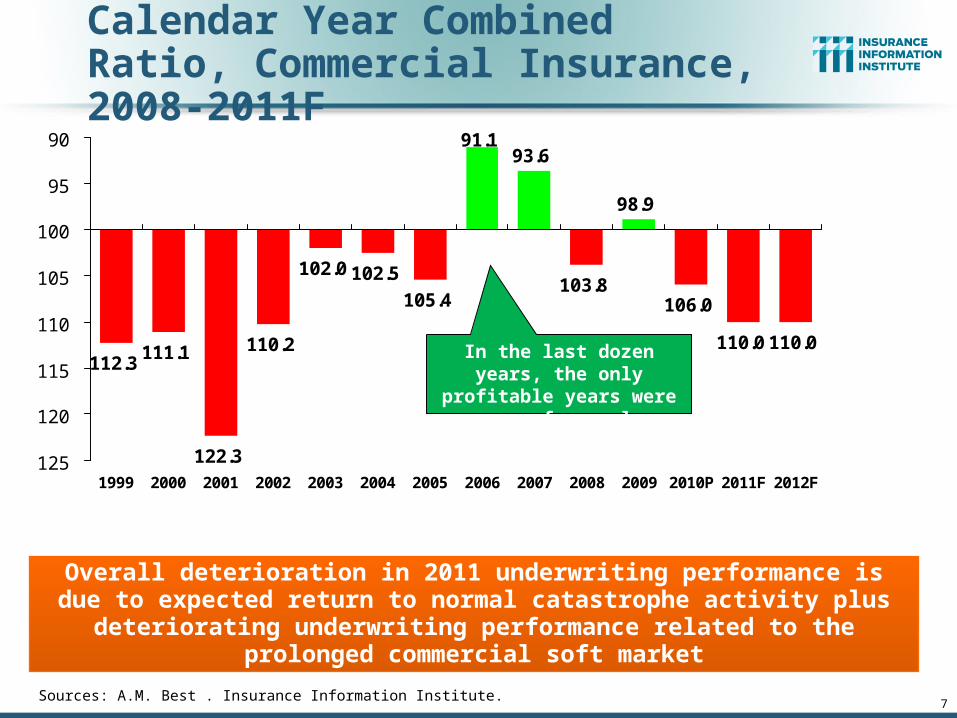
Calendar Year Combined Ratio, Commercial Insurance, 2008-2011F
Sources: A.M. Best . Insurance Information Institute.
105.4
91.193.6
103.8
98.9
106.0
110.0 110.0
102.5102.0
110.2
122.3
111.1112.3
90
95
100
105
110
115
120
1251999 2000 2001 2002 2003 2004 2005 2006 2007 2008 2009 2010P 2011F 2012F
Overall deterioration in 2011 underwriting performance is due to expected return to normal catastrophe activity plus deteriorating underwriting
performance related to the prolonged commercial soft market
In the last dozen years, the only profitable years were
years of very low CATs

P/C Combined Ratios, SelectedCommercial Lines, 2008-2010P
Line of Business 2008 2009 2010P
Other Liability (incl. Prod Liab) 95 105 110
Workers Compensation 101 110.5 115
Commercial Multi Peril 104 97 101
Commercial Auto 96.8 99.5 98
Fire & Allied Lines (incl. EQ) 99 80 83
All Other Lines 113 96 101
Sources: All lines except WC for 2008-09, A.M. Best; Worker Comp., NCCI; 2010P data, ISO. Private carriers only.
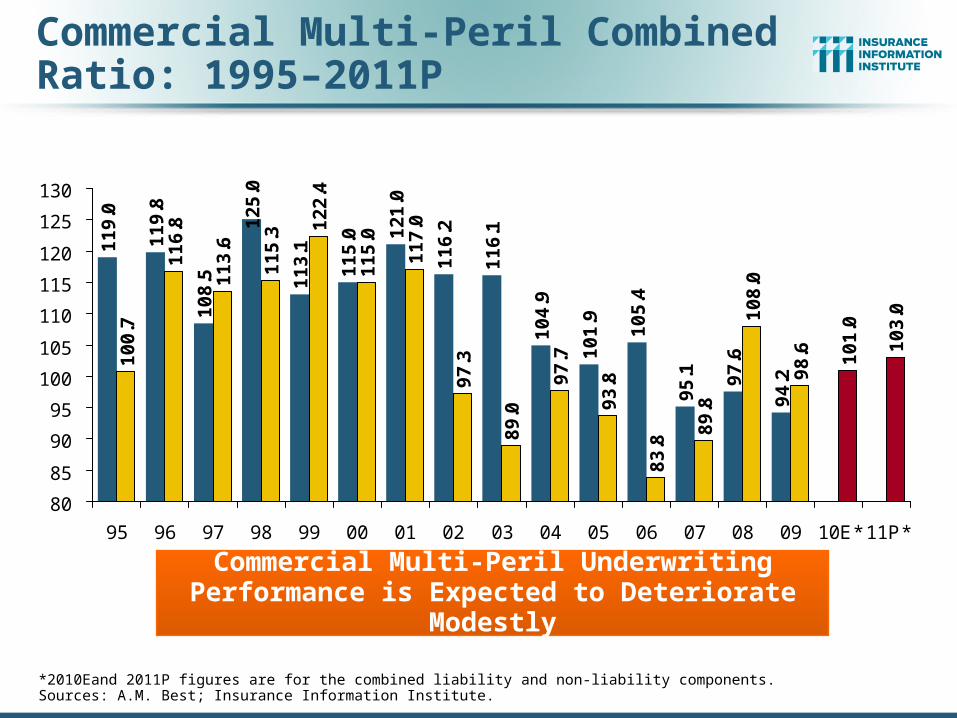
Commercial Multi-Peril Combined Ratio: 1995–2011P
11
9.0
11
9.8
10
8.5
12
5.0
11
6.2
11
6.1
10
4.9
10
1.9
10
5.4
95
.1 97
.6
94
.2
10
0.7
11
6.8
11
3.6
11
5.3
12
2.4
11
5.0
11
7.0
97
.3
89
.0
97
.7
93
.8
83
.8
89
.8
10
8.0
98
.6 10
1.0
10
3.0
11
3.1
11
5.0 1
21
.0
80
85
90
95
100
105
110
115
120
125
130
95 96 97 98 99 00 01 02 03 04 05 06 07 08 09 10E* 11P*
Commercial Multi-Peril Underwriting Performance is Expected to Deteriorate Modestly
*2010Eand 2011P figures are for the combined liability and non-liability components.Sources: A.M. Best; Insurance Information Institute.

Commercial Auto Combined Ratio: 1993–2011P
11
2.1
11
2.0
11
3.0
11
5.9
10
2.7
95
.2
92
.9
92
.1
92
.4 94
.2 96
.8 99
.5
98
.0 10
0.0
11
8.1
11
5.7
11
6.2
80
85
90
95
100
105
110
115
120
125
95 96 97 98 99 00 01 02 03 04 05 06 07 08 09 10E 11P
Sources: A.M. Best; Insurance Information Institute.
Commercial Auto Underwriting Performance is Expected to Deteriorate Modestly
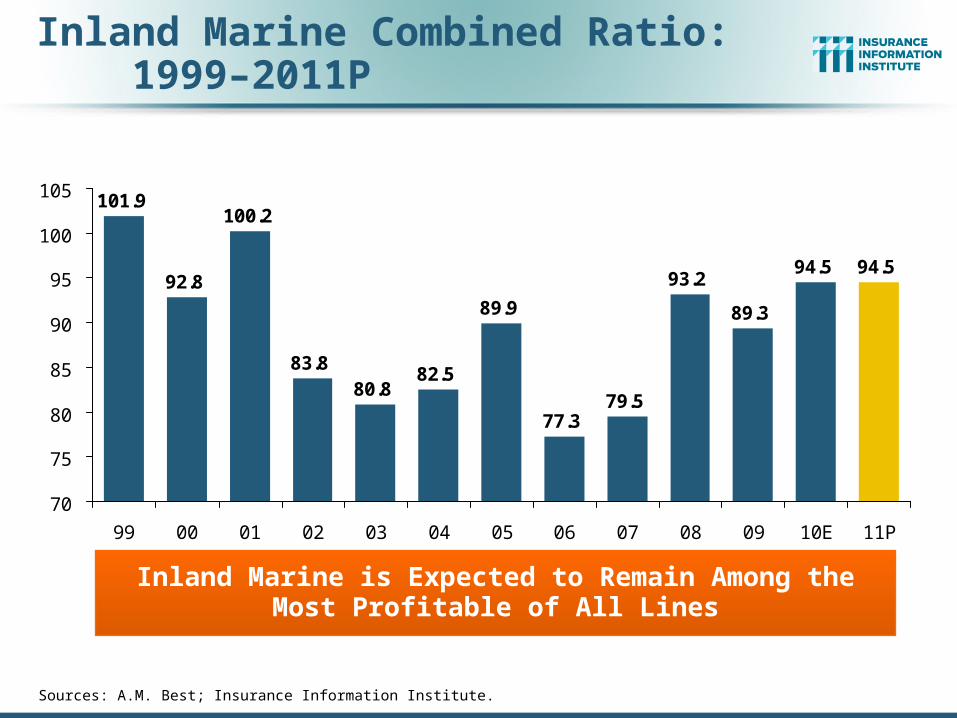
Inland Marine Combined Ratio: 1999–2011P
101.9
92.8
100.2
83.8
77.379.5
93.2
89.3
94.5 94.5
80.882.5
89.9
70
75
80
85
90
95
100
105
99 00 01 02 03 04 05 06 07 08 09 10E 11P
Inland Marine is Expected to Remain Among the Most Profitable of All Lines
Sources: A.M. Best; Insurance Information Institute.

Workers CompensationCombined Ratio: 1994–2011P
102.
0
97.0 10
0.0
101.
0
110.
9
110.
0
107.
0
102.
7
98.4
103.
5
101.
0
110.
5 115.
0
117.
5121.
7
107.
0
115.
3
118.
2
80
85
90
95
100
105
110
115
120
125
130
94 95 96 97 98 99 00 01 02 03 04 05 06 07 08 09 10E 11P
Workers Comp underwriting results are deteriorating markedly and are the worst they have been in a decade
Sources: A.M. Best (1994-2009); NCCI (2010E); Insurance Information Institute (2011P).
13
2.3
-2.1
-8.3
-2.6-6.6
-9.9 -9.8
-4.1
1
11.7
23.2
13.79.9
7.3
-6.7-9.5
-14.6-16 -15
-5
-$20
-$15
-$10
-$5
$0
$5
$10
$15
$20
$25
$309
2
93
94
95
96
97
98
99
00
01
02
03
04
05
06
07
08
09
10
E
11
E
Pri
or
Yr.
Re
se
rve
Re
lea
se
($
B)
-6
-4
-2
0
2
4
6
8 Imp
ac
t on
Co
mb
ine
d R
atio
(Po
ints
)
Prior Yr. ReserveDevelopment ($B)
Impact onCombined Ratio(Points)
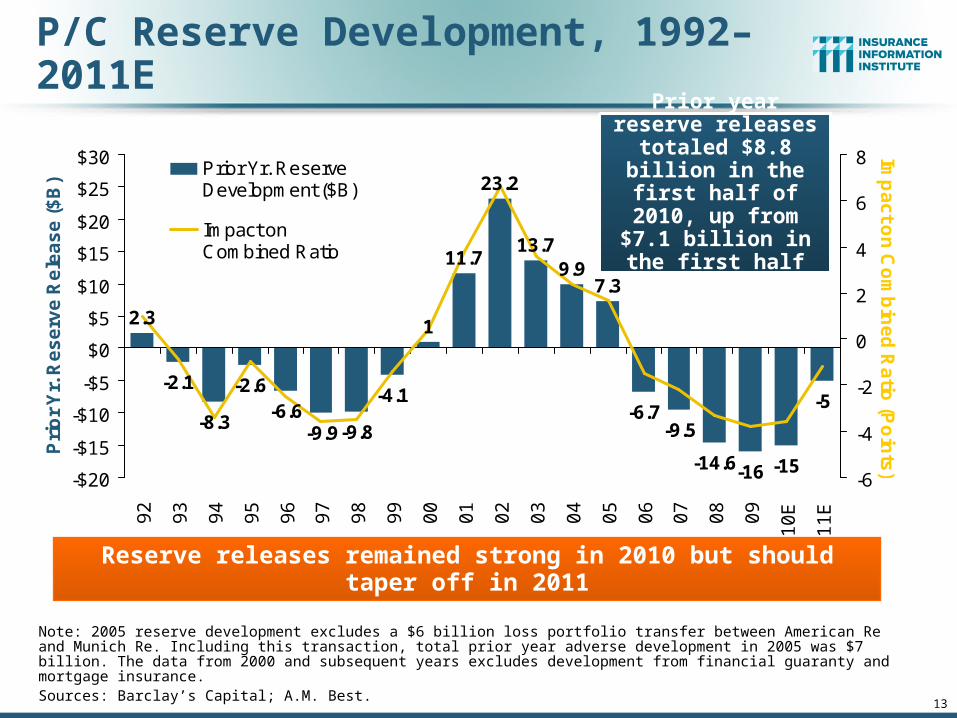
P/C Reserve Development, 1992–2011E
Reserve releases remained strong in 2010 but should taper off in 2011
Note: 2005 reserve development excludes a $6 billion loss portfolio transfer between American Re and Munich Re. Including this transaction, total prior year adverse development in 2005 was $7 billion. The data from 2000 and subsequent years excludes development from financial guaranty and mortgage insurance. Sources: Barclay’s Capital; A.M. Best.
Prior year reserve releases totaled $8.8
billion in the first half of 2010, up from
$7.1 billion in the first half of 2009
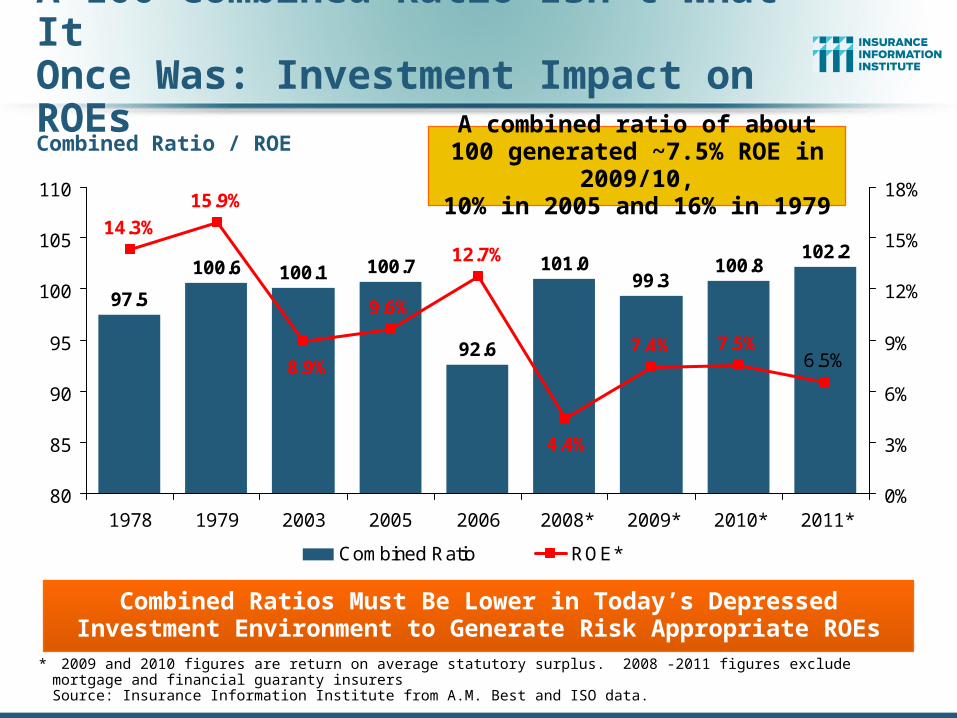
A 100 Combined Ratio Isn’t What ItOnce Was: Investment Impact on ROEs
Combined Ratio / ROE
* 2009 and 2010 figures are return on average statutory surplus. 2008 -2011 figures exclude mortgage and financial guaranty insurersSource: Insurance Information Institute from A.M. Best and ISO data.
97.5
100.6 100.1 100.7
92.6
99.3100.8
102.2101.0
6.5%7.5%7.4%
9.6%
15.9%
14.3%
12.7%
4.4%
8.9%
80
85
90
95
100
105
110
1978 1979 2003 2005 2006 2008* 2009* 2010* 2011*0%
3%
6%
9%
12%
15%
18%
Combined Ratio ROE*
Combined Ratios Must Be Lower in Today’s DepressedInvestment Environment to Generate Risk Appropriate ROEs
A combined ratio of about 100 generated ~7.5% ROE in 2009/10,
10% in 2005 and 16% in 1979

Catastrophe Loss Developments and Trends
15
2011 and 2010 Are Rewriting Catastrophe Loss and
Insurance History
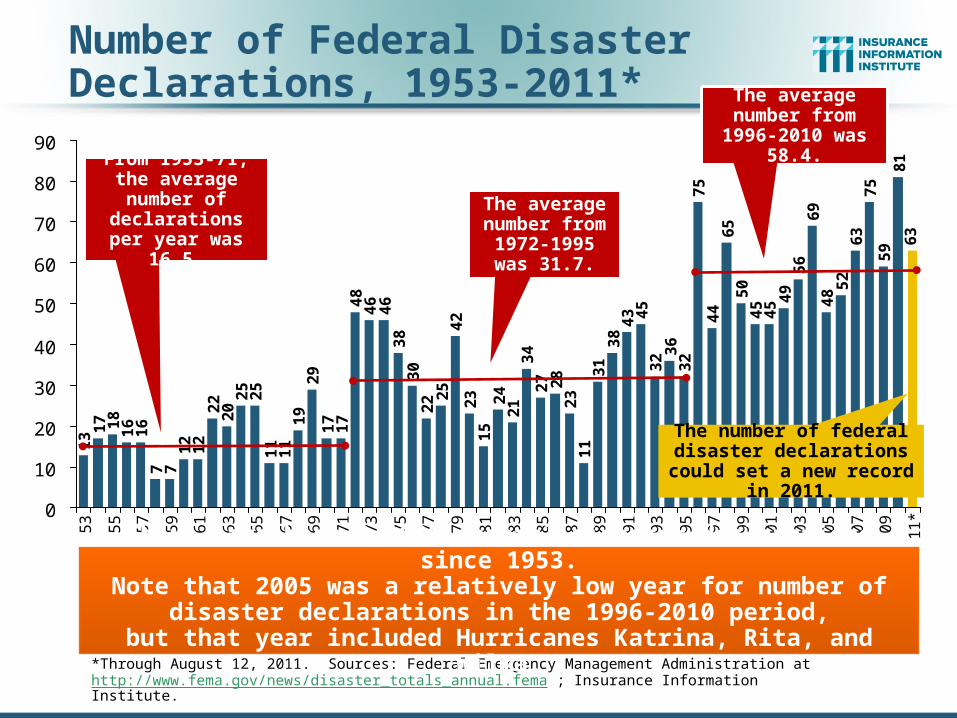
Number of Federal Disaster Declarations, 1953-2011*
13 1
7 18
16
16
7 71
21
22
22
02
52
51
11
11
92
91
71
74
84
64
63
83
02
2 25
42
23
15
24
21
34
27 28
23
11
31
38
45
32 3
63
27
54
46
55
04
54
5 49
56
69
48 5
26
37
55
98
16
3
43
0
10
20
30
40
50
60
70
80
90
53
55
57
59
61
63
65
67
69
71
73
75
77
79
81
83
85
87
89
91
93
95
97
99
01
03
05
07
09
11
*
*Through August 12, 2011. Sources: Federal Emergency Management Administration at http://www.fema.gov/news/disaster_totals_annual.fema ; Insurance Information Institute.
There have been 2,013* federal disaster declarations since 1953.Note that 2005 was a relatively low year for number of disaster
declarations in the 1996-2010 period,but that year included Hurricanes Katrina, Rita, and Wilma.
The number of federal disaster declarations could set a new record in 2011.
From 1953-71, the average number of declarations
per year was 16.5.
The average number from
1996-2010 was 58.4.
The average number from
1972-1995 was 31.7.
100
200
300
400
500
600
1980 1982 1984 1986 1988 1990 1992 1994 1996 1998 2000 2002 2004 2006 2008 2010
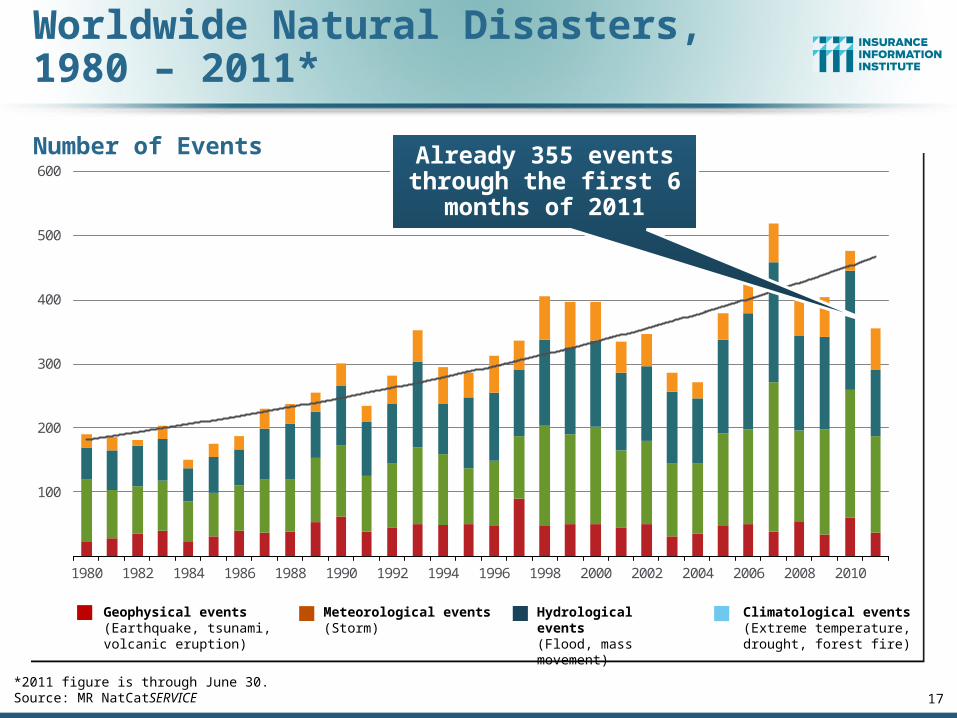
Worldwide Natural Disasters,1980 – 2011*
Number of Events
*2011 figure is through June 30.Source: MR NatCatSERVICE 17
Meteorological events(Storm)
Hydrological events(Flood, mass movement)
Climatological events(Extreme temperature, drought, forest fire)
Geophysical events(Earthquake, tsunami, volcanic eruption)
Already 355 events through the first 6
months of 2011

US
$bn
Worldwide Natural Disasters 1980–2011,Overall and Insured Losses*
18
Overall losses (in 2011 values) Insured losses (in 2011 values)
*2011 figure is through June 30.Source: MR NatCatSERVICE © 2011 Munich Re
50
100
150
200
250
300
1980 1982 1984 1986 1988 1990 1992 1994 1996 1998 2000 2002 2004 2006 2008 2010
First Half 2011
Overall Losses: $265 Bill
Insured Losses: $60 Bill

19
Residual Markets
20
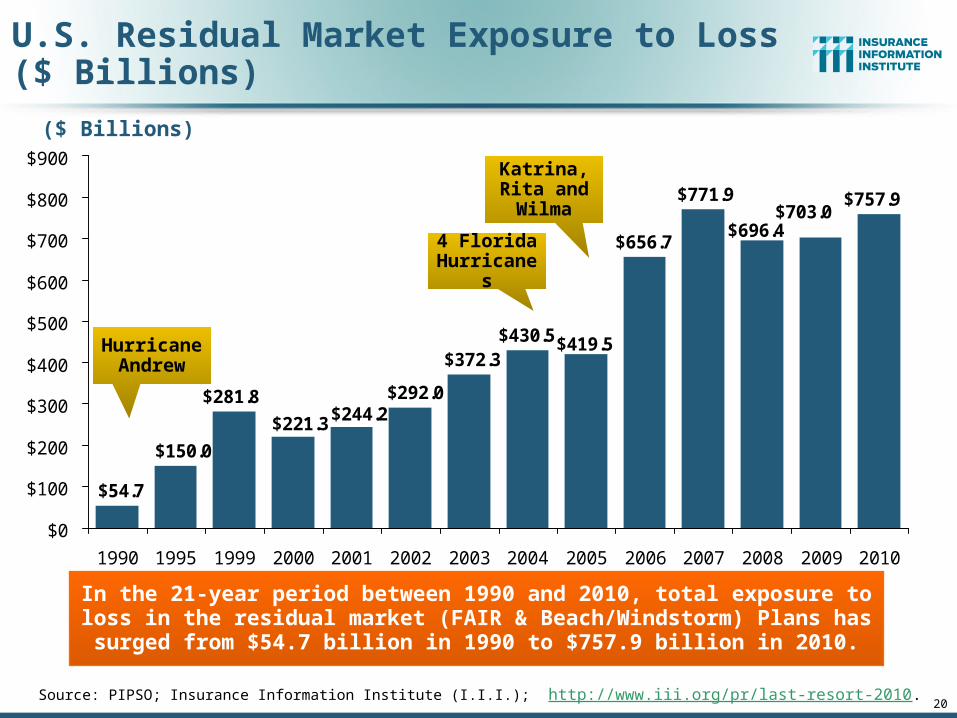
U.S. Residual Market Exposure to Loss($ Billions)
Source: PIPSO; Insurance Information Institute (I.I.I.); http://www.iii.org/pr/last-resort-2010.
$281.8
$757.9
$430.5$372.3
$54.7
$150.0
$292.0$244.2$221.3
$419.5
$656.7$696.4
$771.9$703.0
$0
$100
$200
$300
$400
$500
$600
$700
$800
$900
1990 1995 1999 2000 2001 2002 2003 2004 2005 2006 2007 2008 2009 2010
($ Billions)
In the 21-year period between 1990 and 2010, total exposure to loss in the residual market (FAIR & Beach/Windstorm) Plans has surged from $54.7
billion in 1990 to $757.9 billion in 2010.
Hurricane Andrew
4 Florida Hurricanes
Katrina, Rita and Wilma
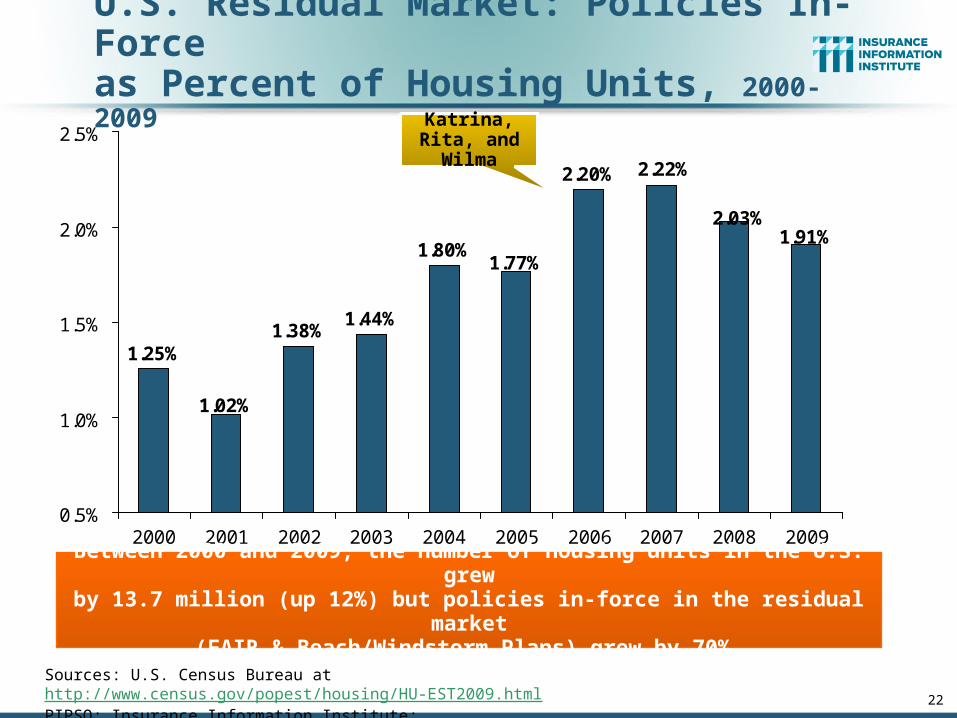
U.S. Residual Market: Policies In-Forceas Percent of Housing Units, 2000-2009
Sources: U.S. Census Bureau at http://www.census.gov/popest/housing/HU-EST2009.html PIPSO; Insurance Information Institute; http://www.iii.org/pr/last-resort-2010.
1.25%1.38%
1.44%
1.80%
2.20%
1.02%
1.91%1.77%
2.22%
2.03%
0.5%
1.0%
1.5%
2.0%
2.5%
2000 2001 2002 2003 2004 2005 2006 2007 2008 2009
Katrina, Rita, and Wilma
Between 2000 and 2009, the number of housing units in the U.S. grewby 13.7 million (up 12%) but policies in-force in the residual market
(FAIR & Beach/Windstorm Plans) grew by 70%.
22

Pricing
23
Is There Evidence of a Broad and Sustained Shift in Pricing?
24
-5%
0%
5%
10%
15%
20%
25%
71 72 73 74 75 76 77 78 79 80 81 82 83 84 85 86 87 88 89 90 91 92 93 94 95 96 97 98 99 00 01 02 03 04 05 06 07 08 09 10 11*
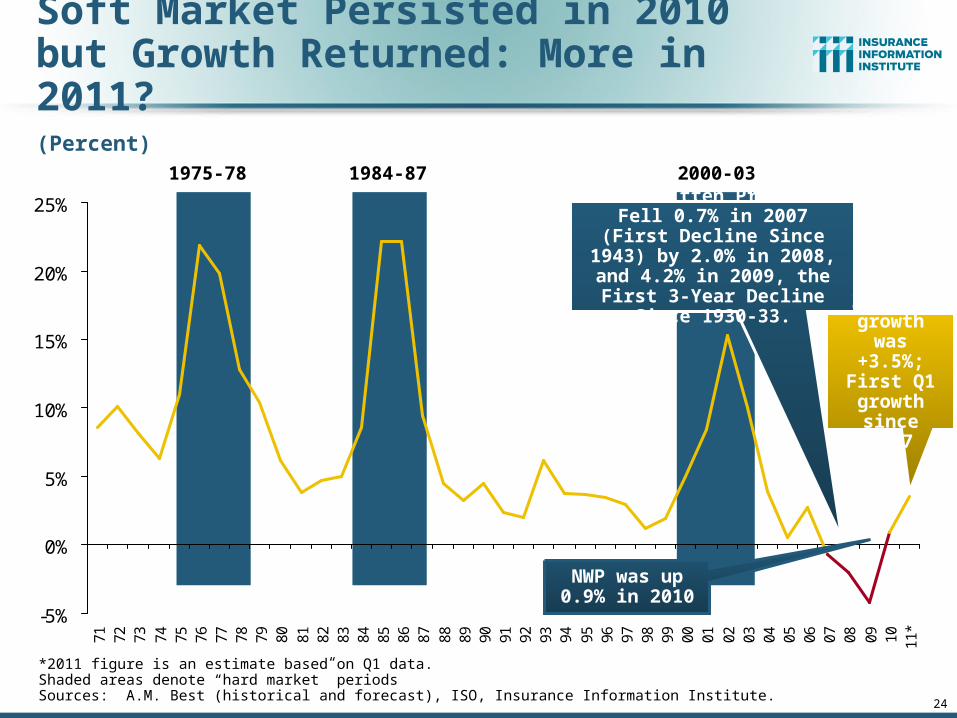
Soft Market Persisted in 2010 but Growth Returned: More in 2011?
(Percent)1975-78 1984-87 2000-03
*2011 figure is an estimate based on Q1 data. Shaded areas denote “hard market” periodsSources: A.M. Best (historical and forecast), ISO, Insurance Information Institute.
Net Written Premiums Fell 0.7% in 2007 (First Decline
Since 1943) by 2.0% in 2008, and 4.2% in 2009, the First 3-Year Decline Since 1930-33.
NWP was up 0.9% in 2010
2011:Q1 growth was +3.5%; First Q1 growth since 2007
25
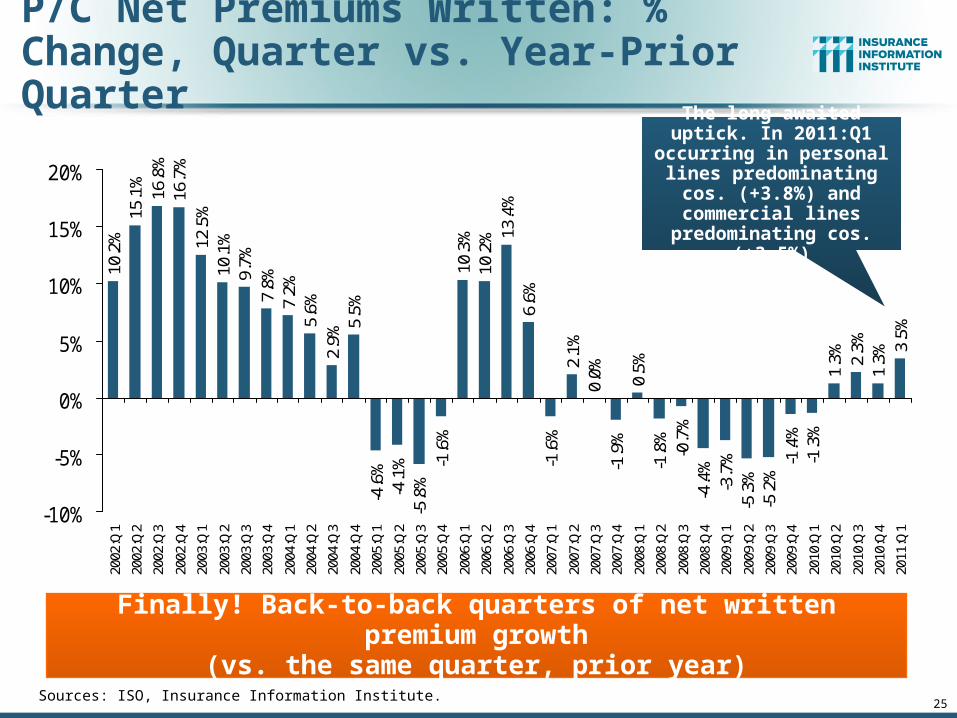
P/C Net Premiums Written: % Change, Quarter vs. Year-Prior Quarter
Sources: ISO, Insurance Information Institute.
Finally! Back-to-back quarters of net written premium growth(vs. the same quarter, prior year)
10.2
%15
.1%
16.8
%16
.7%
12.5
%10
.1%
9.7%
7.8%
7.2%
5.6%
2.9%
5.5%
-4.6
%-4
.1%
-5.8
%-1
.6%
10.3
%10
.2% 13
.4%
6.6%
-1.6
%2.
1%0.
0%-1
.9%
0.5%
-1.8
%-0
.7%
-4.4
%-3
.7%
-5.3
%-5
.2%
-1.4
%-1
.3%
1.3% 2.
3%1.
3%3.
5%
-10%
-5%
0%
5%
10%
15%
20%
2002
:Q1
2002
:Q2
2002
:Q3
2002
:Q4
2003
:Q1
2003
:Q2
2003
:Q3
2003
:Q4
2004
:Q1
2004
:Q2
2004
:Q3
2004
:Q4
2005
:Q1
2005
:Q2
2005
:Q3
2005
:Q4
2006
:Q1
2006
:Q2
2006
:Q3
2006
:Q4
2007
:Q1
2007
:Q2
2007
:Q3
2007
:Q4
2008
:Q1
2008
:Q2
2008
:Q3
2008
:Q4
2009
:Q1
2009
:Q2
2009
:Q3
2009
:Q4
2010
:Q1
2010
:Q2
2010
:Q3
2010
:Q4
2011
:Q1
The long-awaited uptick. In 2011:Q1 occurring in
personal lines predominating cos.
(+3.8%) and commercial lines predominating cos.
(+3.5%)
26
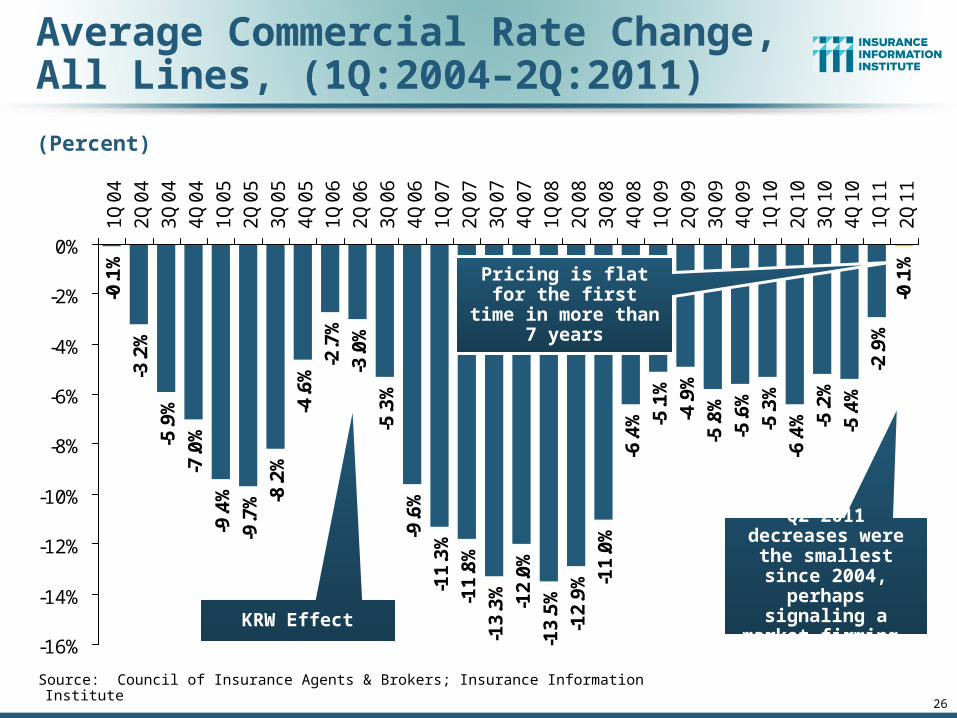
Average Commercial Rate Change,All Lines, (1Q:2004–2Q:2011)
-3.2
%
-5.9
%
-7.0
%
-9.4
%
-9.7
% -8.2
%
-4.6
%
-2.7
%
-3.0
%
-5.3
%
-9.6
%
-11
.3%
-11
.8%
-13
.3%
-12
.0%
-13
.5%
-12
.9% -1
1.0
%
-6.4
% -5.1
%
-4.9
%
-5.8
%
-5.6
%
-5.3
%
-6.4
% -5.2
%
-5.4
%
-2.9
%-0
.1%
-0.1
%
-16%
-14%
-12%
-10%
-8%
-6%
-4%
-2%
0%
1Q
04
2Q
04
3Q
04
4Q
04
1Q
05
2Q
05
3Q
05
4Q
05
1Q
06
2Q
06
3Q
06
4Q
06
1Q
07
2Q
07
3Q
07
4Q
07
1Q
08
2Q
08
3Q
08
4Q
08
1Q
09
2Q
09
3Q
09
4Q
09
1Q
10
2Q
10
3Q
10
4Q
10
1Q
11
2Q
11
Source: Council of Insurance Agents & Brokers; Insurance Information Institute
KRW Effect
Pricing is flat for the first time in more than
7 years
(Percent)
Q2 2011 decreases were the smallest
since 2004, perhaps signaling a market
firming
27
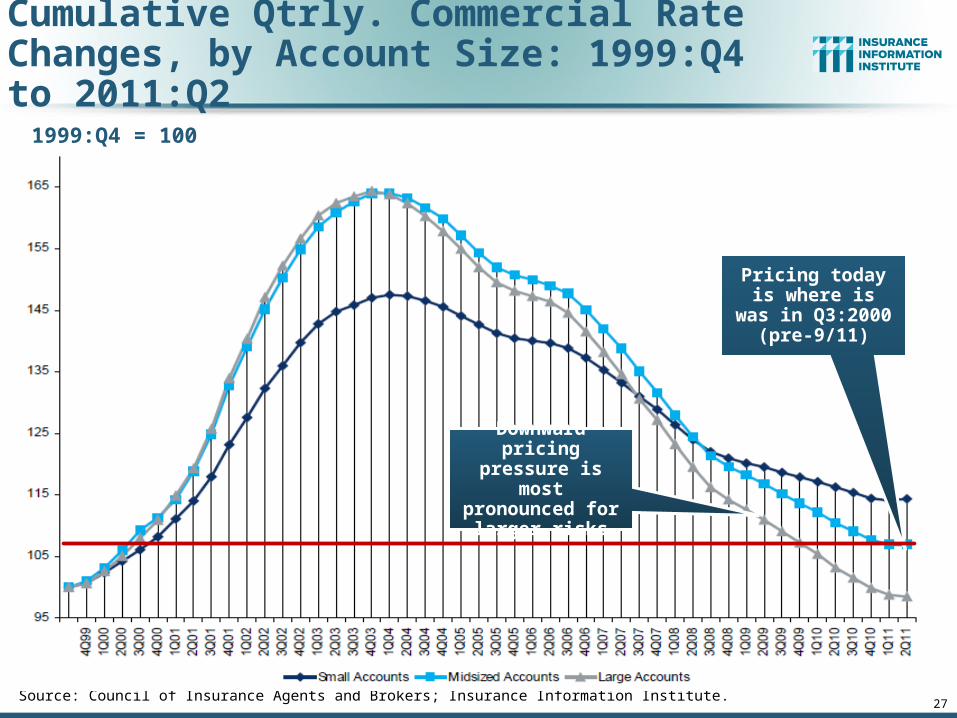
Cumulative Qtrly. Commercial Rate Changes, by Account Size: 1999:Q4 to 2011:Q2
Source: Council of Insurance Agents and Brokers; Insurance Information Institute.
1999:Q4 = 100
Pricing today is where is was in
Q3:2000 (pre-9/11)
Downward pricing pressure is most pronounced for
larger risks

28
Price Index for Premiums for Commercial Multiple Peril Insurance, 1998–2011*
IndexJune 1998 = 100
98
101
104
107
110
113
116
Jun
-98
De
c-9
8
Jun
-99
De
c-9
9
Jun
-00
De
c-0
0
Jun
-01
De
c-0
1
Jun
-02
De
c-0
2
Jun
-03
De
c-0
3
Jun
-04
De
c-0
4
Jun
-05
De
c-0
5
Jun
-06
De
c-0
6
Jun
-07
De
c-0
7
Jun
-08
De
c-0
8
Jun
-09
De
c-0
9
Jun
-10
De
c-1
0
Jun
-11
*As of July 2011; Not seasonally adjusted.Note: Recessions indicated by gray shaded columns.Sources: U.S. Bureau of Labor Statistics, Producer Price Index database; National Bureau of Economic Research (recession dates); Insurance Information Institute.

29
Price Index for Premiums forNon-auto Liability Insurance, 1998–2011*
IndexJune 1998 = 100
98
101
104
107
110
113
116
Jun
-98
De
c-9
8
Jun
-99
De
c-9
9
Jun
-00
De
c-0
0
Jun
-01
De
c-0
1
Jun
-02
De
c-0
2
Jun
-03
De
c-0
3
Jun
-04
De
c-0
4
Jun
-05
De
c-0
5
Jun
-06
De
c-0
6
Jun
-07
De
c-0
7
Jun
-08
De
c-0
8
Jun
-09
De
c-0
9
Jun
-10
De
c-1
0
Jun
-11
*As of July 2011; Not seasonally adjusted.Note: Recessions indicated by gray shaded columns.Sources: U.S. Bureau of Labor Statistics, Producer Price Index database; National Bureau of Economic Research (recession dates); Insurance Information Institute.
30
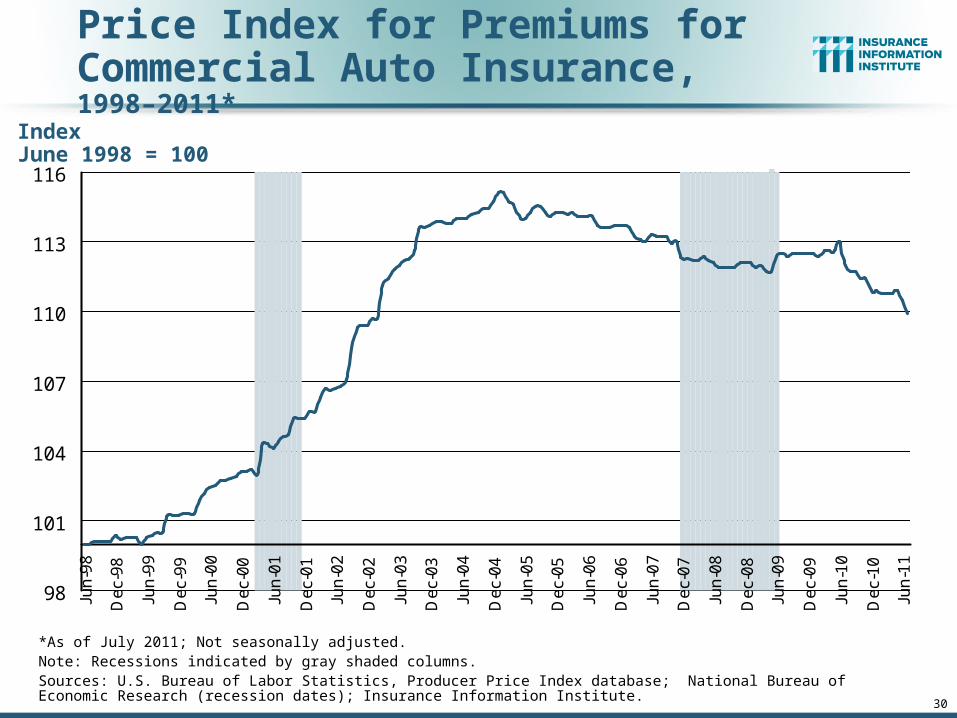
Price Index for Premiums forCommercial Auto Insurance, 1998–2011*
IndexJune 1998 = 100
98
101
104
107
110
113
116
Jun
-98
De
c-9
8
Jun
-99
De
c-9
9
Jun
-00
De
c-0
0
Jun
-01
De
c-0
1
Jun
-02
De
c-0
2
Jun
-03
De
c-0
3
Jun
-04
De
c-0
4
Jun
-05
De
c-0
5
Jun
-06
De
c-0
6
Jun
-07
De
c-0
7
Jun
-08
De
c-0
8
Jun
-09
De
c-0
9
Jun
-10
De
c-1
0
Jun
-11
*As of July 2011; Not seasonally adjusted.Note: Recessions indicated by gray shaded columns.Sources: U.S. Bureau of Labor Statistics, Producer Price Index database; National Bureau of Economic Research (recession dates); Insurance Information Institute.

INVESTMENTS: THE NEW REALITY
31
Investment Performance is a Key Driver of Profitability
Does It Influence Underwriting or Cyclicality?
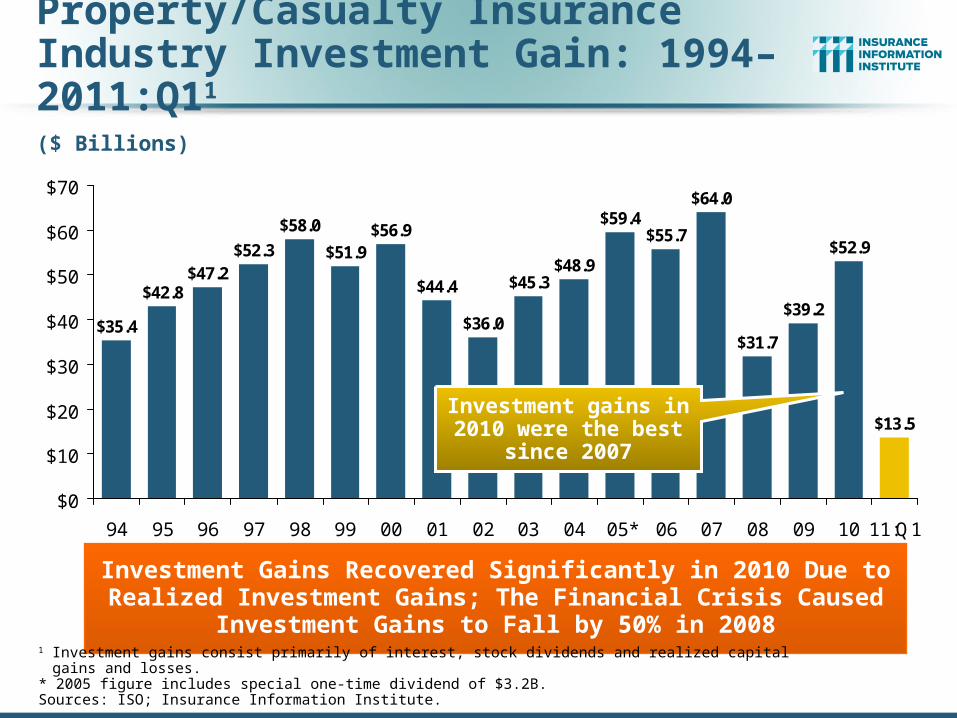
Property/Casualty Insurance Industry Investment Gain: 1994–2011:Q11
$35.4
$42.8$47.2
$52.3
$44.4
$36.0
$45.3$48.9
$59.4$55.7
$64.0
$31.7
$39.2
$52.9
$13.5
$58.0
$51.9$56.9
$0
$10
$20
$30
$40
$50
$60
$70
94 95 96 97 98 99 00 01 02 03 04 05* 06 07 08 09 10 11:Q1
Investment Gains Recovered Significantly in 2010 Due to Realized Investment Gains; The Financial Crisis Caused Investment Gains to
Fall by 50% in 2008
1 Investment gains consist primarily of interest, stock dividends and realized capital gains and losses.* 2005 figure includes special one-time dividend of $3.2B.Sources: ISO; Insurance Information Institute.
($ Billions)
Investment gains in 2010 were the best
since 2007

33
Treasury Yield Curves Before and After S&P Downgrade
0.04% 0.04% 0.08% 0.19%0.41%
2.28%
3.00%
0.27%0.45%
1.11%
1.75%
2.40%
3.31%
3.68%
1.54%
0.68%
4.27%
3.95%
0.12%0.07%0.05%0.02%0%
1%
1%
2%
2%
3%
3%
4%
4%
5%
1M 3M 6M 1Y 2Y 3Y 5Y 7Y 10Y 20Y 30Y
July 2011 Yield Curve*Post-Downgrade (July 2007)
Treasury actually fell in the wake of the S&P downgrade, despite
(theoretically) higher risk
The End of the Fed’s Quantitative Easing Is Unlikely to Push Interest Rates Up Substantially Given Ongoing Economic Weakness
*Average of daily rates.Sources: Board of Governors of the United States Federal Reserve Bank; Insurance Information Institute.

Inflation
34
Is it a Threat to Claim Cost Severities?

35
Annual Inflation Rates, (CPI-U, %),1990–2014F
2.8 2.6
1.51.9
3.3 3.4
1.3
2.5 2.3
3.0
3.8
2.8
3.8
-0.4
1.6
3.0
2.2 2.1 2.2
2.92.4
3.23.0
5.14.9
-1.0
0.0
1.0
2.0
3.0
4.0
5.0
6.0
90 91 92 93 94 95 96 97 98 99 00 01 02 03 04 05 06 07 08 09 10 11F 12F 13F 14F
Sources: US Bureau of Labor Statistics; Blue Chip Economic Indicators, 3/11 and 8/11 (forecasts).
The slack in the U.S. economy suggests that inflation should not heat upbefore 2012, but other forces (commodity prices, inflation in countries from which we import, etc.), plus U.S. debt burden, remain longer-run concerns
Annual Inflation Rates (%)
The recession and the collapse of the commodity bubble reduced inflationary
pressures in 2009/10
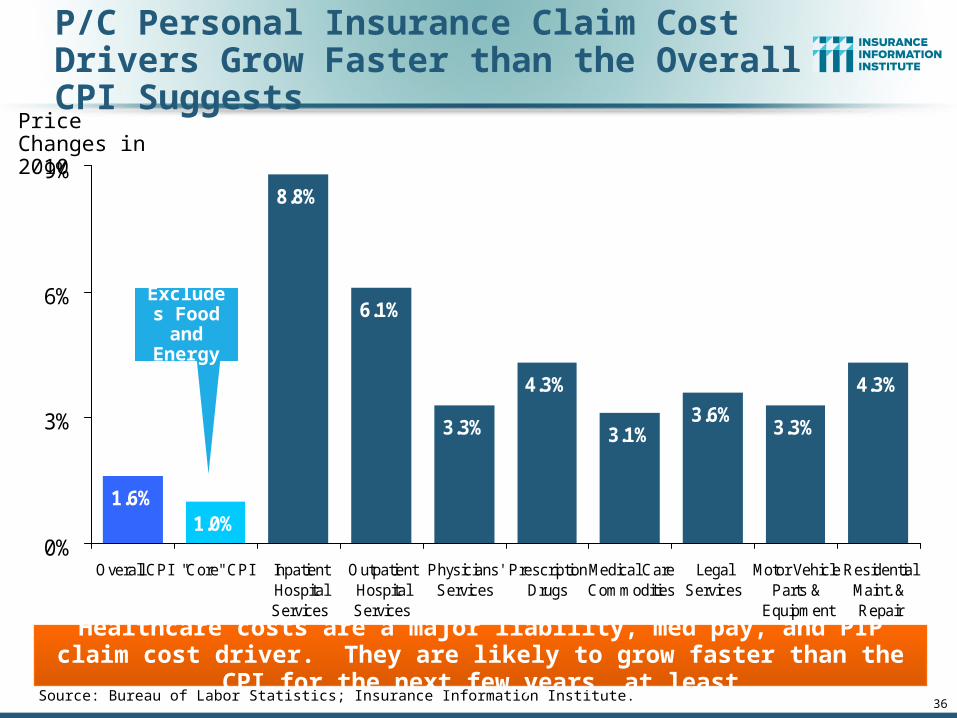
P/C Personal Insurance Claim Cost Drivers Grow Faster than the Overall CPI Suggests
Source: Bureau of Labor Statistics; Insurance Information Institute.
1.6%1.0%
8.8%
6.1%
3.3%
4.3%
3.1%3.6%
3.3%
4.3%
0%
3%
6%
9%
Overall CPI "Core" CPI InpatientHospitalServices
OutpatientHospitalServices
Physicians'Services
PrescriptionDrugs
Medical CareCommodities
LegalServices
Motor VehicleParts &
Equipment
ResidentialMaint. &Repair
Price Changes in 2010
Healthcare costs are a major liability, med pay, and PIP claim cost driver. They are likely to grow faster than the CPI for the next few years, at least
36
Excludes Food and Energy
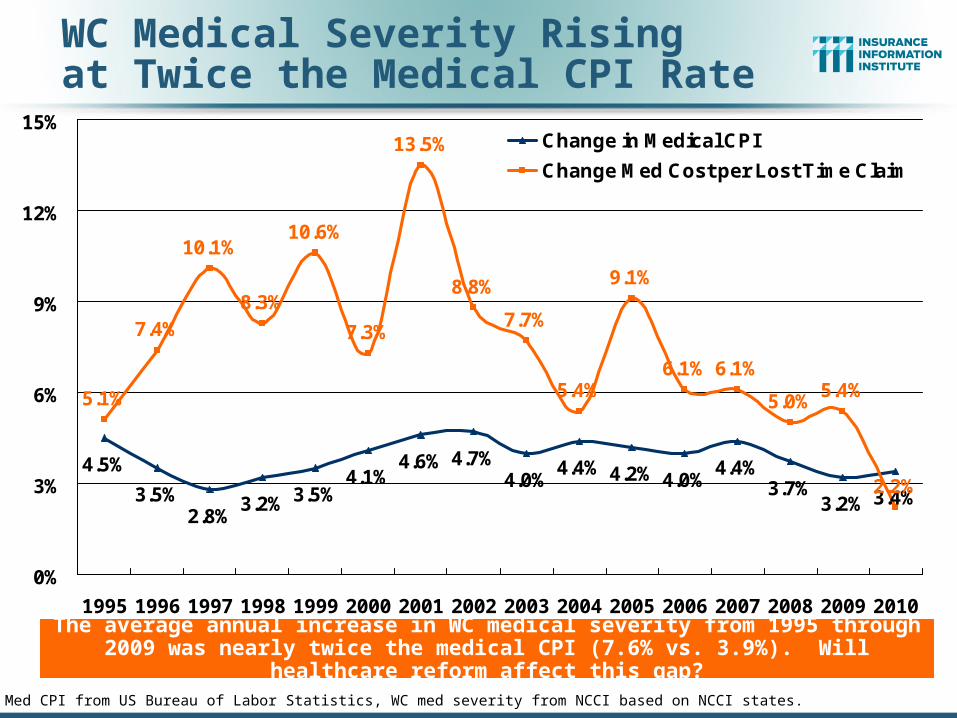
4.5%
3.5%2.8%
3.2% 3.5%4.1%
4.6% 4.7%4.0%
4.4% 4.2% 4.0%4.4%
3.7%3.2% 3.4%
5.1%
7.4%
10.1%
8.3%
10.6%
7.3%
13.5%
8.8%
7.7%
5.4%
9.1%
6.1% 6.1%
5.0%5.4%
2.2%
0%
3%
6%
9%
12%
15%
1995 1996 1997 1998 1999 2000 2001 2002 2003 2004 2005 2006 2007 2008 2009 2010
Change in Medical CPI
Change Med Cost per Lost Time Claim
WC Medical Severity Risingat Twice the Medical CPI Rate
Sources: Med CPI from US Bureau of Labor Statistics, WC med severity from NCCI based on NCCI states.
The average annual increase in WC medical severity from 1995 through 2009 was nearly twice the medical CPI (7.6% vs. 3.9%). Will healthcare reform affect this gap?
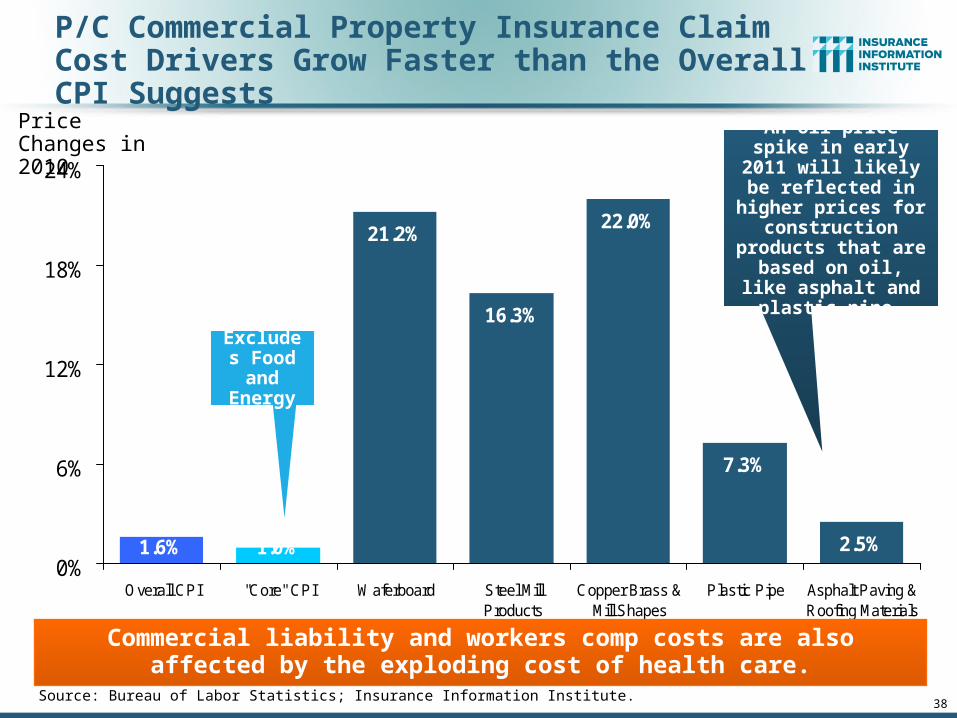
P/C Commercial Property Insurance Claim Cost Drivers Grow Faster than the Overall CPI Suggests
Source: Bureau of Labor Statistics; Insurance Information Institute.
1.6%
21.2%
16.3%
22.0%
7.3%
2.5%1.0%0%
6%
12%
18%
24%
Overall CPI "Core" CPI Waferboard Steel MillProducts
Copper Brass &Mill Shapes
Plastic Pipe Asphalt Paving &Roofing Materials
Price Changes in 2010
Commercial liability and workers comp costs are also affected by the exploding cost of health care.
38
Excludes Food and Energy
An oil price spike in early 2011 will likely
be reflected in higher prices for
construction products that are based on oil,
like asphalt and plastic pipe.

www.iii.org
Thank you for your timeand your attention!
Insurance Information Institute Online: