Embed Size (px)
Citation preview

Emerging Market Debt Environment
October 2014

2
EM Dollar Debt Posts Gains after Difficult 2013

3
EM vs. DM Growth Stabilizing at Lower Spread
Source: IMF, World Economic Outlook Update, April 2014
Real GDP Growth Rate Differential: Emerging Market Premium over Developed Markets
(2014 –2018 IMF Estimates)
‐1
0
1
2
3
4
5
6
7
1985
1986
1987
1988
1989
1990
1991
1992
1993
1994
1995
1996
1997
1998
1999
2000
2001
2002
2003
2004
2005
2006
2007
2008
2009
2010
2011
2012
2013
2014
2015
2016
2017
2018
2019
Realized Average: 2.36%

4
‐4
‐3.5
‐3
‐2.5
‐2
‐1.5
‐1
‐0.5
0
0.5
1Brazil India Indonesia South Africa Turkey
Current Account Deficits have Stabilized
Source: FactSet, IMF
Average Current Account BalanceAs of July 31, 2014
Chan
ge in
Cur
rent
Acco
unt Y
oY(%
)
Fragile Five – YoY Change in Current AccountAs of June 30, 2014
Current account deficits from the Fragile Five have begun to improve, while balances in EM remain in surplus on aggregate.
Improving Current Account
Worsening Current Account

5
EM Currencies have Re‐Priced to Competitive Levels
Source: FactSet, IMF, JP Morgan
JP Morgan Emerging Market Currency IndexDecember 2012 – September 2014
Inde
x Level
Fragile Five – Currency Panic Subsiding December 2012 – September 2014
Pullback in U.S. interest rates and defensive central bank policies shore up Fragile Five currencies
70
75
80
85
90
95
100
105
110
Dec‐12 Jun‐13 Dec‐13 Jun‐14Local Currency vs. U
SD
Brazil
India
Indonesia
South Africa
Turkey
6
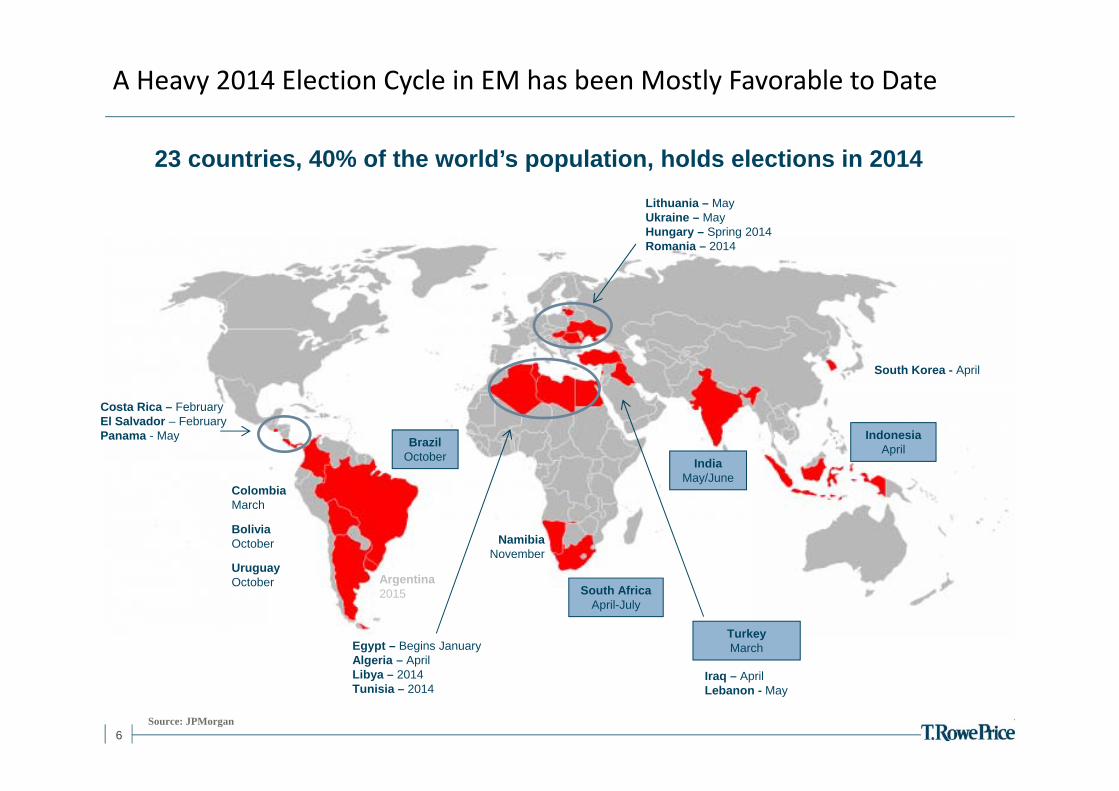
23 countries, 40% of the world’s population, holds elections in 2014
BrazilOctober India
May/June
Egypt – Begins JanuaryAlgeria – AprilLibya – 2014Tunisia – 2014
South AfricaApril-July
NamibiaNovember
South Korea - April
Iraq – AprilLebanon - May
IndonesiaApril
Lithuania – MayUkraine – MayHungary – Spring 2014Romania – 2014
Argentina2015
ColombiaMarch
BoliviaOctober
UruguayOctober
Turkey March
Costa Rica – FebruaryEl Salvador – FebruaryPanama - May
Source: JPMorgan
A Heavy 2014 Election Cycle in EM has been Mostly Favorable to Date

7Source: EPFR
Investors have Returned to EM Debt
(6)
(5)
(4)
(3)
(2)
(1)
0
1
2
3
Dec-12 Mar-13 May-13 Aug-13 Oct-13 Jan-14 Apr-14 Jun-14 Sep-14
U.S
. $, b
illio
ns
Weekly EM Fund and ETF Flows
EM Hard CurrencyEM LocalEM Blended Currency
Fed announces Tapering plans;‘Tourists’ leave the asset class

8
Reserve Accumulation of EM Countries*As of September 30, 2014
Many EM countries today have strong liquidity buffers, free-floating currency regimes, and relatively low debt burdens.
Emerging Markets vs. G7 Public Debt (% of GDP)IMF forecasts as of Apr 2014
EM’s Have Maintained Healthy Buffers to External Shocks
Source: Haver Analytics. *EM Countries include all constituents based on the JP Morgan GBI-EM Global Diversified Index
$mn

9Source: International Monetary Fund, World Economic Outlook Update, April 2014.
DM and EM Share of Global GDP (%)1982 – 2019 (Estimated)
EM Should not be Ignored Given its Rising Global Importance
10%
20%
30%
40%
50%
60%
70%
80%
90%
1982 1986 1990 1994 1998 2002 2006 2010 2014 2018
DM EM
(E) (E)

10
Although Idiosyncratic Events have Driven Disparate Returns

11
Source: JP MorganIndices: EMBI Global Diversified, CEMBI Broad Diversified, GBI-EM Global Diversified
Emerging Markets Hard Currency30 September 2011 – 30 September 2014
Today’s Absolute Valuations Are Fair…
5.31%
5.40%
Emerging Markets Corporate30 September 2011 – 30 September 2014
Emerging Markets Local Currency30 September 2011 – 30 September 2014
4
4.5
5
5.5
6
6.5
Sep‐11 Mar‐12 Sep‐12 Mar‐13 Sep‐13 Mar‐14 Sep‐14
Yield (%
)
JPM EMBI Glbl Div Average for period
4
4.5
5
5.5
6
6.5
7
7.5
Sep‐11 Mar‐12 Sep‐12 Mar‐13 Sep‐13 Mar‐14 Sep‐14
Yield (%
)
JPM CEMBI Broad Div Average for period
5.35%5.27%
5
5.5
6
6.5
7
7.5
Sep‐11 Mar‐12 Sep‐12 Mar‐13 Sep‐13 Mar‐14 Sep‐14
Yield (%
)
Average for period JPM EM‐GBI Glbl Div
6.74%
6.27%
12 12
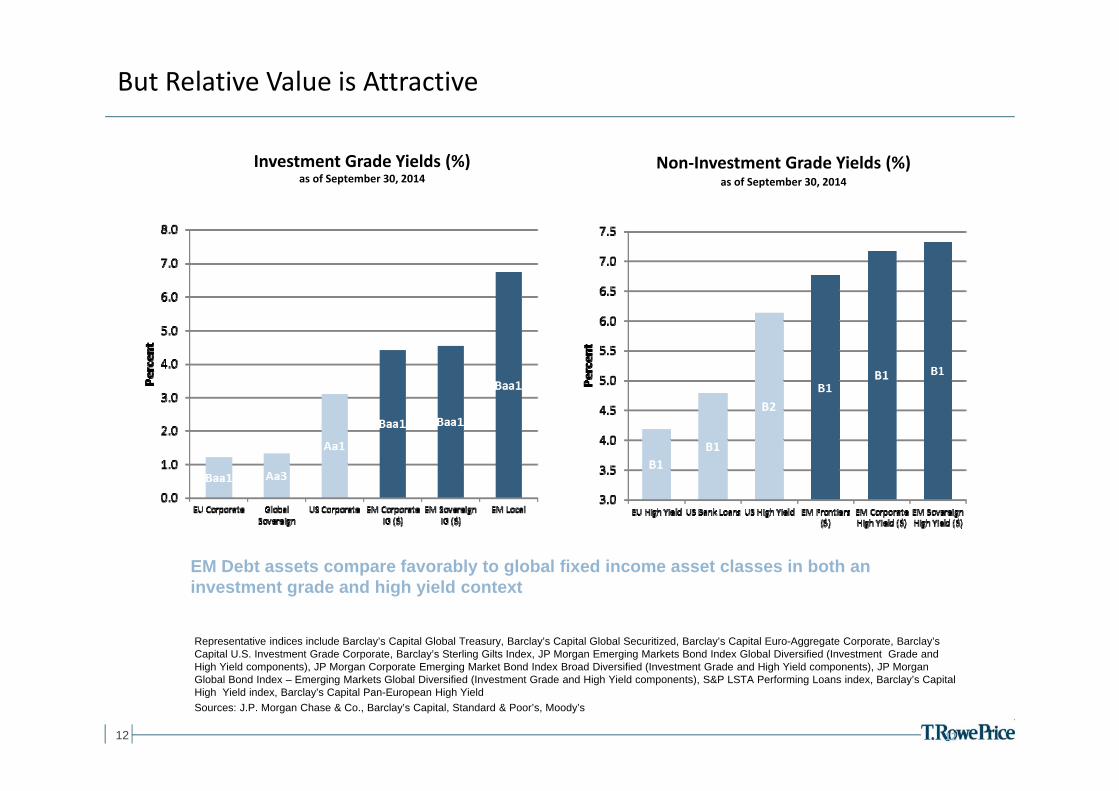
But Relative Value is Attractive
Representative indices include Barclay’s Capital Global Treasury, Barclay’s Capital Global Securitized, Barclay’s Capital Euro-Aggregate Corporate, Barclay’s Capital U.S. Investment Grade Corporate, Barclay’s Sterling Gilts Index, JP Morgan Emerging Markets Bond Index Global Diversified (Investment Grade and High Yield components), JP Morgan Corporate Emerging Market Bond Index Broad Diversified (Investment Grade and High Yield components), JP Morgan Global Bond Index – Emerging Markets Global Diversified (Investment Grade and High Yield components), S&P LSTA Performing Loans index, Barclay’s Capital High Yield index, Barclay’s Capital Pan-European High YieldSources: J.P. Morgan Chase & Co., Barclay’s Capital, Standard & Poor’s, Moody’s
EM Debt assets compare favorably to global fixed income asset classes in both an investment grade and high yield context
Investment Grade Yields (%) as of September 30, 2014
Non‐Investment Grade Yields (%) as of September 30, 2014

13
Sources: Barclays, JP Morgan, S&P/LSTA
J.P. Morgan indices: Emerging Markets Bond Index Global, Global High Yield, GBI-EM Global Diversified, CEMBI Broad Diversified; Barclays indices: U.S. Corporate Investment Grade, U.S. Aggregate Bond Index, Global Aggregate Bond Index, U.S. Treasury component of Barclays U.S. Agg; UK Sterling Aggregate, Swedish Krona Aggregate, Euro Corporate Investment Grade, Euro Aggregate
2H14 Returns Likely to be Driven by Carry versus Yield Compression
0
1
2
3
4
5
6
7
8
Global HY EM Local EM DollarSovereign
EM Corp U.S. IGCorp
UKSterling
Aggregate
SwedishKrona
Aggregate
Euro IGCorp
EuroAggregate
U.S.Aggregate
GlobalAggregate
U.S.Treasury
Average Coupon by Asset Class (%)as of September 30, 2014

14
Investor Allocations Continue to Rise from a Low Base
Sources: JP Morgan, Morningstar, Morgan Stanley
27%36%
36% 38% 37%
67%
57%
55%51% 52%
0
100
200
300
400
500
600
700
2010 2011 2012 2013 Sep‐2014
Corporate External Debt
External Debt
Local Debt
6%
7%
9%
12%11%
U.S
. $, b
illion
s
Dedicated EM Debt Investor Base**As of September 2014
As at 31 Dec 2012

15
Important Information
This document, including any statements, information, data and content contained therein and any materials, information, images, links, sounds, graphics or video provided in conjunction with this document (collectively “Materials”) are being furnished by T. Rowe Price for your general informational purposes only. The Materials are not intended for use by persons injurisdictions which prohibit or restrict the distribution of the Materials and in certain countries these Materials are only provided upon specific request. It is not intended for distribution to retail investors in any jurisdiction. Under no circumstances should the Materials, in whole or in part, be copied, redistributed or shown to any person without consent from T. Rowe Price. The Materials do not constitute a distribution, an offer, an invitation, recommendation or solicitation to sell or buy any securities in any jurisdiction. The Materials have not been reviewed by any regulatory authority in any jurisdiction. The Materials do not constitute investment advice and should not be relied upon. Investors should seek independent legal and financial advice, including advice as to tax consequences, before making any investment decision.
Issued in the EEA by T. Rowe Price International Limited (“TRPIL”), 60 Queen Victoria Street, London EC4N 4TZ which is authorised and regulated by the Financial Conduct Authority. For Qualified Investors only.
T. ROWE PRICE, INVEST WITH CONFIDENCE and the Bighorn Sheep design are, collectively and/or apart, trademarks or registered trademarks of T. Rowe Price Group, Inc. in the United States, European Union, and other countries. This material is intended for use only in select countries.
This material is provided for informational purposes only and is not intended to be investment advice or a recommendation to take any particular investment action. The views contained herein are as of September 2014, and may have changed since that time.
GL‐2014‐909