Embed Size (px)
Citation preview
September 2014
SDN
/14/09
I M F S T A F F D I S C U S S I O N N O T E
EMERGING MARKET VOLATILITY: LESSONS FROM
THE TAPER TANTRUM
Ratna Sahay, Vivek Arora, Thanos Arvanitis,
Hamid Faruqee, Papa N'Diaye,
Tommaso Mancini-Griffoli, and an IMF Team

IMF STAFF DISCUSSION NOTE
2 INTERNATIONAL MONETARY FUND
INTERNATIONAL MONETARY FUND
Monetary and Capital Markets Department, Research Department, Strategy and Policy Review Department
Prepared by Ratna Sahay, Vivek Arora, Thanos Arvanitis, Hamid Faruqee, Papa N'Diaye,
Tommaso Mancini-Griffoli, and an IMF Team1
Authorized for distribution by Ratna Sahay and Vivek Arora
DISCLAIMER: This Staff Discussion Note represents the views of the authors and does not necessarily represent IMF views or IMF policy. The views expressed herein should be attributed to the authors and not to the IMF, its Executive Board, or its management. Staff Discussion Notes are published to elicit comments and to further debate.
JEL Classification Numbers: E40, E44, E61, E62, G12
Keywords:
Tapering, unconventional monetary policy, volatility, macroprudential, capital flow measures, foreign exchange intervention
Authors’ E-mail Addresses: [email protected]; [email protected]; [email protected]; [email protected]; [email protected]; [email protected]
1 The IMF team includes Ran Bi, Jiaqian Chen, Prachi Mishra, Kenji Moriyama, Lam Nguyen, Silvia Sgherri, Preya Sharma, Esteban Vesperoni, Sebatian Weber, and Gao Yuan. The authors thank the members of the IMF Executive Board for their invaluable input at an informal Board briefing, as well as participants at various IMF seminars for useful comments. The authors also thank Grace Angeles and Gillian Adu for their excellent assistance.
IMF STAFF DISCUSSION NOTE
INTERNATIONAL MONETARY FUND 3
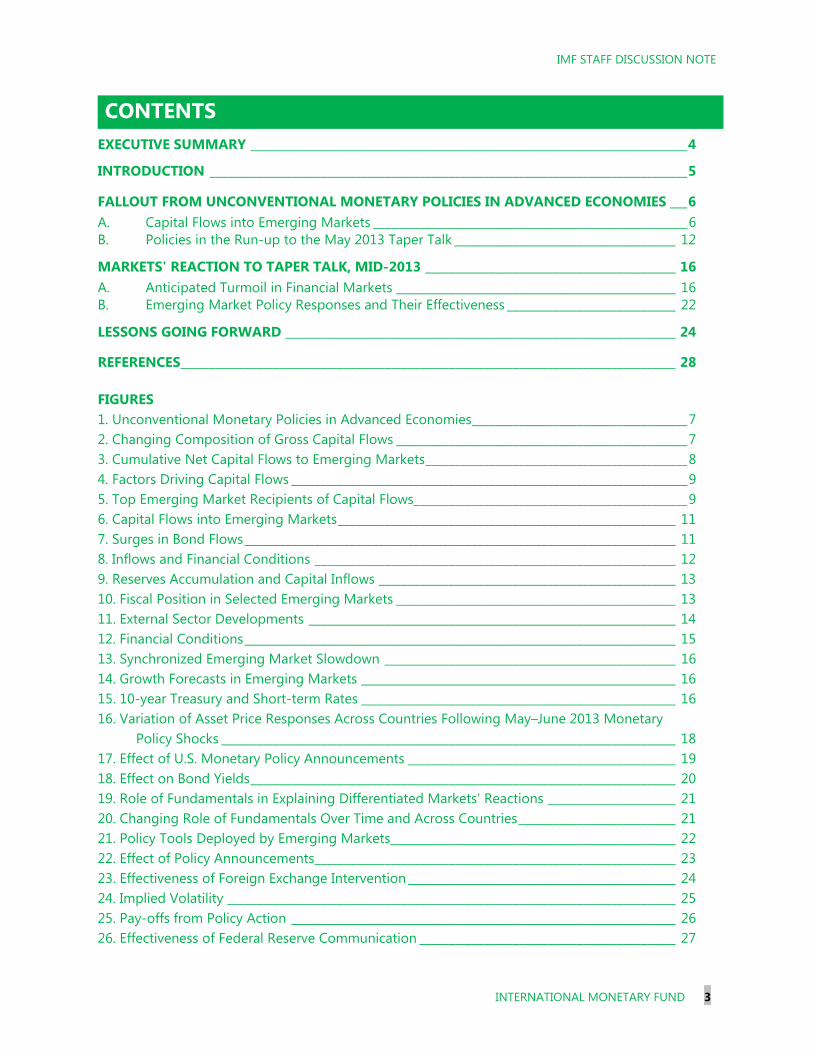
CONTENTS EXECUTIVE SUMMARY ___________________________________________________________________________ 4
INTRODUCTION __________________________________________________________________________________ 5
FALLOUT FROM UNCONVENTIONAL MONETARY POLICIES IN ADVANCED ECONOMIES ___ 6 A. Capital Flows into Emerging Markets ______________________________________________________ 6 B. Policies in the Run-up to the May 2013 Taper Talk ______________________________________ 12
MARKETS' REACTION TO TAPER TALK, MID-2013 ___________________________________________ 16 A. Anticipated Turmoil in Financial Markets ________________________________________________ 16 B. Emerging Market Policy Responses and Their Effectiveness _____________________________ 22
LESSONS GOING FORWARD ___________________________________________________________________ 24
REFERENCES _____________________________________________________________________________________ 28 FIGURES 1. Unconventional Monetary Policies in Advanced Economies _____________________________________ 7 2. Changing Composition of Gross Capital Flows __________________________________________________ 7 3. Cumulative Net Capital Flows to Emerging Markets _____________________________________________ 8 4. Factors Driving Capital Flows ____________________________________________________________________ 9 5. Top Emerging Market Recipients of Capital Flows_______________________________________________ 9 6. Capital Flows into Emerging Markets __________________________________________________________ 11 7. Surges in Bond Flows __________________________________________________________________________ 11 8. Inflows and Financial Conditions ______________________________________________________________ 12 9. Reserves Accumulation and Capital Inflows ___________________________________________________ 13 10. Fiscal Position in Selected Emerging Markets ________________________________________________ 13 11. External Sector Developments _______________________________________________________________ 14 12. Financial Conditions __________________________________________________________________________ 15 13. Synchronized Emerging Market Slowdown __________________________________________________ 16 14. Growth Forecasts in Emerging Markets ______________________________________________________ 16 15. 10-year Treasury and Short-term Rates ______________________________________________________ 16 16. Variation of Asset Price Responses Across Countries Following May–June 2013 Monetary Policy Shocks ______________________________________________________________________________ 18 17. Effect of U.S. Monetary Policy Announcements ______________________________________________ 19 18. Effect on Bond Yields _________________________________________________________________________ 20 19. Role of Fundamentals in Explaining Differentiated Markets’ Reactions ______________________ 21 20. Changing Role of Fundamentals Over Time and Across Countries ___________________________ 21 21. Policy Tools Deployed by Emerging Markets _________________________________________________ 22 22. Effect of Policy Announcements ______________________________________________________________ 23 23. Effectiveness of Foreign Exchange Intervention ______________________________________________ 24 24. Implied Volatility _____________________________________________________________________________ 25 25. Pay-offs from Policy Action __________________________________________________________________ 26 26. Effectiveness of Federal Reserve Communication ____________________________________________ 27
IMF STAFF DISCUSSION NOTE
4 INTERNATIONAL MONETARY FUND
EXECUTIVE SUMMARY A surge in volatility overtook global financial markets in the summer of 2013 following the markets’ reassessment of the prospects that the U.S. Federal Reserve would wind down its bond-buying program and tighten monetary policy. The brunt was felt acutely by emerging markets (EMs). While changes in advanced-country monetary policy, or even signals of such changes, can reverberate in the rest of the world, the strength of the markets’ reaction took most by surprise. Asset prices and currencies tumbled, and questions about the growth prospects of EMs continued to intensify amidst heightened uncertainty.
The shift in market sentiment vis-à-vis EMs came on the heels of a prolonged period of monetary easing in advanced economies, which was essential for preventing an even worse outcome at the start of the global financial crisis (IMF 2013a), and during which emerging economies experienced large inflows of foreign capital. During 2009–12, EMs received close to half of global flows, and while inflows were concentrated in eight to 10 large EMs, several small EMs also attracted large volumes relative to their size. In several cases, the inflows were accompanied by a rapid expansion of credit, fueling an overheating of domestic economies and setting the conditions for a buildup of vulnerabilities. This challenged policymaking, with some EMs raising concerns about the unwelcome side effects of monetary policy in advanced countries. Indeed, a substantial part of the flows could not be explained by EMs’ economic fundamentals.
The reactions of markets during the summer of 2013 following talks by the Fed about prospects for gradually unwinding its unconventional monetary policy were unusual both in terms of the size and breadth of the outflows, although the magnitude of adjustment varied significantly across countries. Why did markets react the way they did and what are the policy lessons from this episode? This paper tries to synthesize recent research on this issue.
The key findings of this Staff Discussion Note are as follows: (i) The Fed’s monetary policy announcements were strongly correlated with movements in asset
prices and capital inflows in EMs, with the effects being largest during the phase of unconventional monetary policy (post-2008) and when tapering was first discussed (summer of 2013);
(ii) During initial periods of acute and systemic market volatility, asset prices and capital flows were hit indiscriminately across countries, but over time there was greater differentiation among EMs;
(iii) Good macroeconomic fundamentals helped dampen market reactions to U.S. monetary policy shocks. In particular, elevated current account deficits, high inflation, weak growth prospects, and relatively low reserves were important factors affecting market reaction.
(iv) Where vulnerabilities existed, emerging markets that acted early and decisively generally fared better;
(v) Clear and effective communication by advanced-economy central banks concerning exit from unconventional monetary support is important to reduce the risk of excessive market volatility; and
(vi) The international community has an important role to play to safeguard global financial stability. This includes determined efforts by all countries to cooperate with regional financial arrangements, enhance cross-border cooperation between central banks and regulators, and establish stronger global financial safety net, including through adequate Fund resources.

IMF STAFF DISCUSSION NOTE
INTERNATIONAL MONETARY FUND 5
INTRODUCTION In May 2013, financial shock waves hit many emerging markets (EMs). The shock waves came on the heels of testimony to Congress by the chairman of the U.S. Federal Reserve (henceforth “the Fed”) that raised the possibility of the Fed tapering its purchase of treasury and agency bonds. This signal followed several years of U.S. monetary easing prior to the global financial crisis, and unconventional monetary policies (UMP) in the United States and other advanced economies (AEs) after the crisis. During this period, EMs generally experienced capital inflows.
However, starting in May 2013 and through early 2014 there was a marked rise in financial market volatility, with sharp corrections in EM asset prices and exchange rates, and a reversal in capital flows. Amid significant concerns about a shifting external environment and slowing domestic economic activity in EMs, experiences and policy responses in EM countries varied.
This paper examines the impact of the Fed’s policy announcements on asset prices and capital flows into and out of EMs, with a view to explaining the different reactions across countries by looking at domestic and external factors, and to drawing broad policy lessons. Key findings of this study are that (i) the Fed’s monetary policy announcements were correlated with movements in asset prices and capital inflows in EMs; (ii) the effects were greatest during the UMP phase (post-2008) and especially during the period when tapering was first discussed (summer of 2013); (iii) during initial periods of acute and systemic market volatility, asset prices and capital flows were hit more indiscriminately across countries, but over time there was greater differentiation among EMs; (iv) good macroeconomic fundamentals in EMs matter and helped dampen market reactions to U.S. monetary policy shocks; (v) where vulnerabilities existed, emerging markets that acted early and decisively generally fared better; (vi) clear and effective communication by AE central banks concerning exit from unconventional monetary support is important to reduce the risk of excessive market volatility; and (vii) enhanced global cooperation, including a strong global financial safety net, may offer EMs effective protection against market volatility as the global economy transitions away from large-scale liquidity support.
This Staff Discussion Note is structured as follows: Section II recounts the developments in EMs prior to the taper talk in May 2013; Section III discusses markets’ reaction during the taper talk and EMs’ policy responses; and Section IV concludes with key lessons going forward.
IMF STAFF DISCUSSION NOTE
6 INTERNATIONAL MONETARY FUND
FALLOUT FROM UNCONVENTIONAL MONETARY POLICIES IN ADVANCED ECONOMIES
A. Capital Flows into Emerging Markets
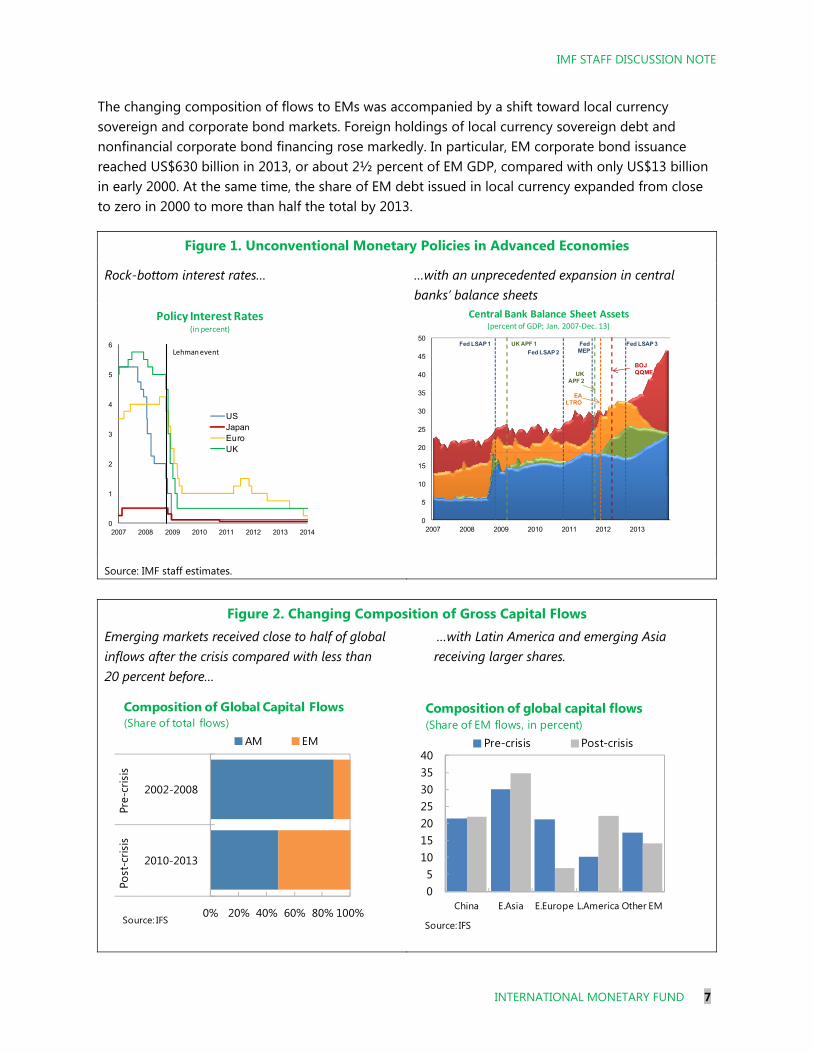
In the aftermath of the 2008 global financial crisis, unprecedented actions were taken by central banks and governments to support financial and economic activity. Against the risk of severe recession and disruption in financial systems, AE central banks sharply cut policy interest rates down to or near zero. In addition, several central banks, particularly in the United States, United Kingdom, Japan, and the euro area, implemented unconventional monetary policy measures to restore the functioning of financial markets and provide further stimulus at the zero lower bound (Figure 1). This intervention first focused on restoring intermediation and the normal functioning of markets through various liquidity provision measures, and then on asset purchases to reduce long-term yields and rekindle aggregate demand. Quantitative easing (QE) by the United States was one of the largest such programs, resulting in an approximate 750 percent increase in the size of the Fed balance sheet.2
While the impact of QE on stabilizing global economic and financial conditions is beyond the scope of this paper and has been examined elsewhere, recent analysis suggests that it contributed to significant capital flows to EMs, especially to Latin America and Asia (IMF, 2013a). In fact, starting in 2010, there was a marked shift in the flow of capital to EMs, driven by accommodative monetary policy in AEs, a global search for yield, and stronger growth prospects in EMs. During 2010–13, EMs received close to half of all global flows, while capital flows to AEs, particularly to the euro area, declined substantially (Figure 2). This reorientation of flows was most pronounced in Latin America and emerging Asia. In contrast, emerging Europe received substantially fewer flows, as most countries went through a period of deleveraging to reduce high debt built up in the precrisis years.
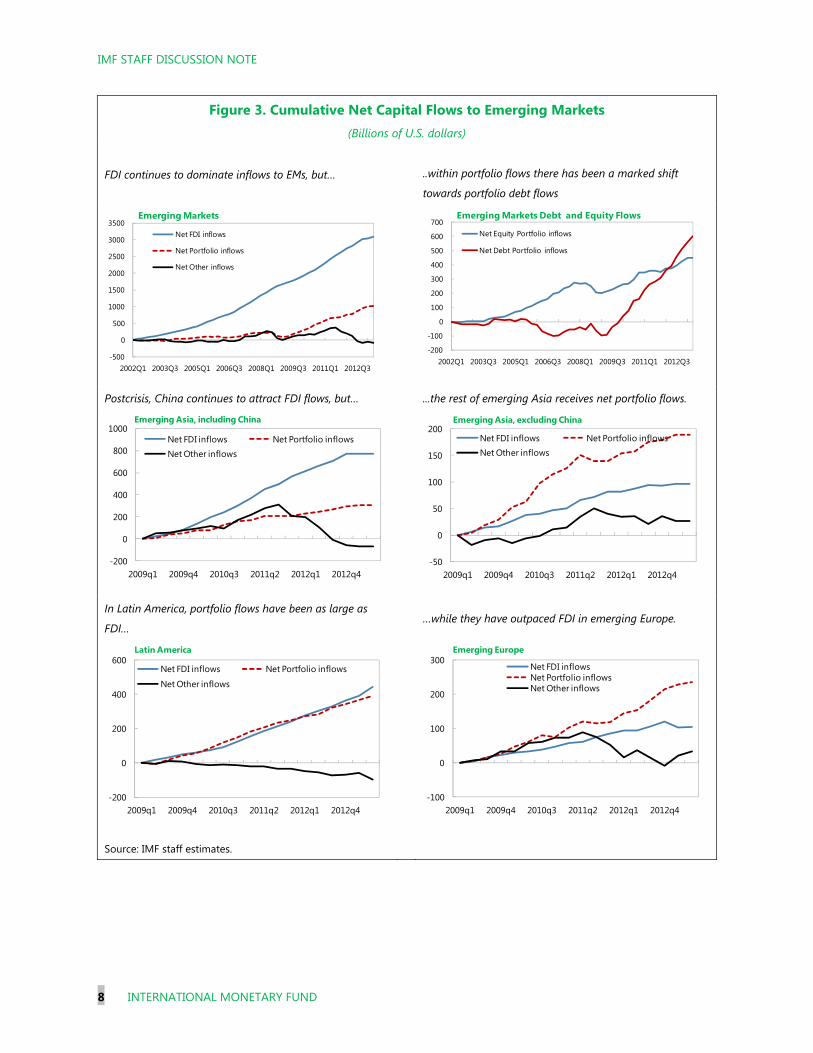
Portfolio flows, particularly debt, played an increasingly important role in capital flows to EMs (Figure 3). In the precrisis period, foreign direct investment (FDI) was the predominant type of inflow into EMs, with portfolio and other flows being relatively modest. Following the global financial crisis, portfolio flows grew to one in every four dollars entering EMs. Excluding China, which is open mainly to FDI flows, the trend is even more pronounced. In contrast, “other flows” (notably trade credits and bank loans) declined in most regions, reflecting cross-border bank deleveraging. This evidence is consistent with recent literature on the role of UMP in changes in the composition of flows towards portfolio flows (Ahmed and Zlate, 2013).
2 This expansion in the Fed balance sheet occurred in three successive stages: QE1 started in late November 2008 when the Fed decided to buy $600 billion in mortgage-backed securities (MBS); QE2 began in November 2010 with the Fed buying $600 billion of treasury securities; and QE3 began in mid-September 2012 with the Fed buying on a monthly basis $40 billion worth of MBS and $85 billion of treasury and agency bonds starting in December 2012.
IMF STAFF DISCUSSION NOTE
INTERNATIONAL MONETARY FUND 7
The changing composition of flows to EMs was accompanied by a shift toward local currency sovereign and corporate bond markets. Foreign holdings of local currency sovereign debt and nonfinancial corporate bond financing rose markedly. In particular, EM corporate bond issuance reached US$630 billion in 2013, or about 2½ percent of EM GDP, compared with only US$13 billion in early 2000. At the same time, the share of EM debt issued in local currency expanded from close to zero in 2000 to more than half the total by 2013.
Figure 1. Unconventional Monetary Policies in Advanced Economies
Rock-bottom interest rates…
…with an unprecedented expansion in central banks’ balance sheets
Source: IMF staff estimates.
Figure 2. Changing Composition of Gross Capital Flows Emerging markets received close to half of global …with Latin America and emerging Asia inflows after the crisis compared with less than receiving larger shares. 20 percent before…
Central Bank Balance Sheet Assets(percent of GDP; Jan. 2007-Dec. 13)
0
5
10
15
20
25
30
35
40
45
50
2007 2008 2009 2010 2011 2012 2013
BOJQQME
Fed LSAP 2
Fed LSAP 1 FedMEP
Fed LSAP 3
EALTRO
UK APF 1
UK APF 2
Policy Interest Rates(in percent)
0
1
2
3
4
5
6
2007 2008 2009 2010 2011 2012 2013 2014
USJapanEuroUK
Lehman event
0% 20% 40% 60% 80% 100%
2010-2013
2002-2008
Post
-cris
is
Pre-
cris
is
AM EM
Composition of Global Capital Flows(Share of total flows)
Source: IFS
05
10152025303540
China E.Asia E.Europe L.America Other EM
Pre-crisis Post-crisis
Composition of global capital flows(Share of EM flows, in percent)
Source: IFS
IMF STAFF DISCUSSION NOTE
8 INTERNATIONAL MONETARY FUND
Figure 3. Cumulative Net Capital Flows to Emerging Markets (Billions of U.S. dollars)
FDI continues to dominate inflows to EMs, but…
..within portfolio flows there has been a marked shift
towards portfolio debt flows
Postcrisis, China continues to attract FDI flows, but… ...the rest of emerging Asia receives net portfolio flows.
In Latin America, portfolio flows have been as large as
FDI… …while they have outpaced FDI in emerging Europe.
Source: IMF staff estimates.
-500
0
500
1000
1500
2000
2500
3000
3500
2002Q1 2003Q3 2005Q1 2006Q3 2008Q1 2009Q3 2011Q1 2012Q3
Emerging Markets
Net FDI inflows
Net Portfolio inflows
Net Other inflows
-200
-100
0
100
200
300
400
500
600
700
2002Q1 2003Q3 2005Q1 2006Q3 2008Q1 2009Q3 2011Q1 2012Q3
Emerging Markets Debt and Equity Flows
Net Equity Portfolio inflows
Net Debt Portfolio inflows
-200
0
200
400
600
800
1000
2009q1 2009q4 2010q3 2011q2 2012q1 2012q4
Emerging Asia, including China
Net FDI inflows Net Portfolio inflows
Net Other inflows
-50
0
50
100
150
200
2009q1 2009q4 2010q3 2011q2 2012q1 2012q4
Emerging Asia, excluding China
Net FDI inflows Net Portfolio inflowsNet Other inflows
-200
0
200
400
600
2009q1 2009q4 2010q3 2011q2 2012q1 2012q4
Latin America
Net FDI inflows Net Portfolio inflows
Net Other inflows
-100
0
100
200
300
2009q1 2009q4 2010q3 2011q2 2012q1 2012q4
Emerging Europe
Net FDI inflowsNet Portfolio inflowsNet Other inflows
IMF STAFF DISCUSSION NOTE
INTERNATIONAL MONETARY FUND 9
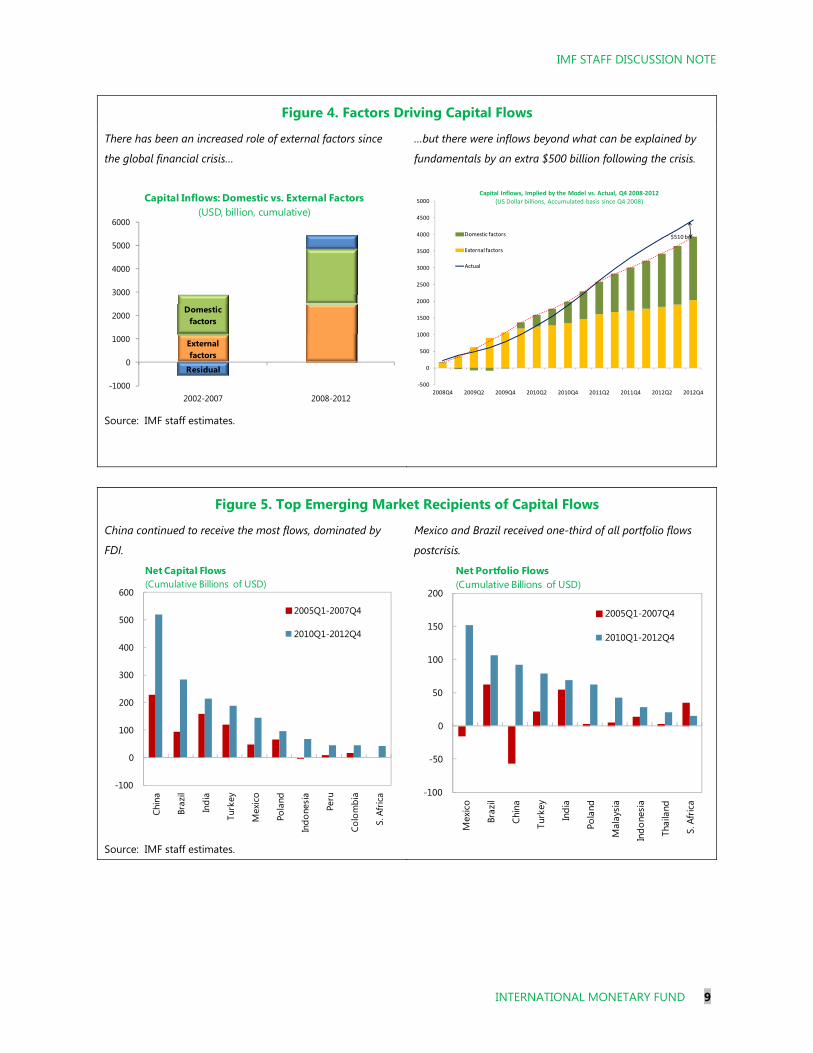
Figure 4. Factors Driving Capital Flows
There has been an increased role of external factors since
the global financial crisis…
Source: IMF staff estimates.
…but there were inflows beyond what can be explained by
fundamentals by an extra $500 billion following the crisis.
Figure 5. Top Emerging Market Recipients of Capital Flows
China continued to receive the most flows, dominated by
FDI.
Source: IMF staff estimates.
Mexico and Brazil received one-third of all portfolio flows
postcrisis.
External factors
Domestic factors
Residual
-1000
0
1000
2000
3000
4000
5000
6000
2002-2007 2008-2012
Capital Inflows: Domestic vs. External Factors(USD, billion, cumulative)
-500
0
500
1000
1500
2000
2500
3000
3500
4000
4500
5000
2008Q4 2009Q2 2009Q4 2010Q2 2010Q4 2011Q2 2011Q4 2012Q2 2012Q4
Domestic factors
External factors
Actual
Capital Inflows, Implied by the Model vs. Actual, Q4 2008-2012(US Dollar billions, Accumulated basis since Q4 2008)
$510 bn
-100
0
100
200
300
400
500
600
Chin
a
Braz
il
Indi
a
Turk
ey
Mex
ico
Pola
nd
Indo
nesi
a
Peru
Colo
mbi
a
S. A
fric
a
Net Capital Flows (Cumulative Billions of USD)
2005Q1-2007Q4
2010Q1-2012Q4
-100
-50
0
50
100
150
200
Mex
ico
Braz
il
Chin
a
Turk
ey
Indi
a
Pola
nd
Mal
aysi
a
Indo
nesi
a
Thai
land
S. A
fric
a
2005Q1-2007Q4
2010Q1-2012Q4
Net Portfolio Flows (Cumulative Billions of USD)
IMF STAFF DISCUSSION NOTE
10 INTERNATIONAL MONETARY FUND
The relative importance of external factors relative to domestic factors increase somewhat in 2008–12 compared with 2002–07. Based on model estimates of the drivers of capital flows, over half of cumulative flows to EMs during 2008–12 were related to external factors (Figure 4), including AEs’ weak growth and expansionary monetary policy, and a global search for yield. But the relative importance of external and domestic factors in explaining capital inflows changed, with external factors driving capital inflows during 2008–11 and domestic factors becoming increasingly more important in driving capital inflows during 2011–12.
As global capital flows were redirected toward EMs, they became increasingly concentrated. Postcrisis, 90 percent of net capital flows to EMs (75 percent of gross capital flows) were received by just eight countries (Brazil, China, India, Indonesia, Mexico, Peru, Poland, and Turkey) (Figure 5). This higher concentration reflects the large size of these countries, their higher growth rates vis-à-vis advanced economies, financial sector reforms leading to growing financial depth, and increasing accessibility to international institutional investors. The eight countries account for around 40 percent of the combined weights of all countries in the Emerging Markets Bond Index (EMBI).3
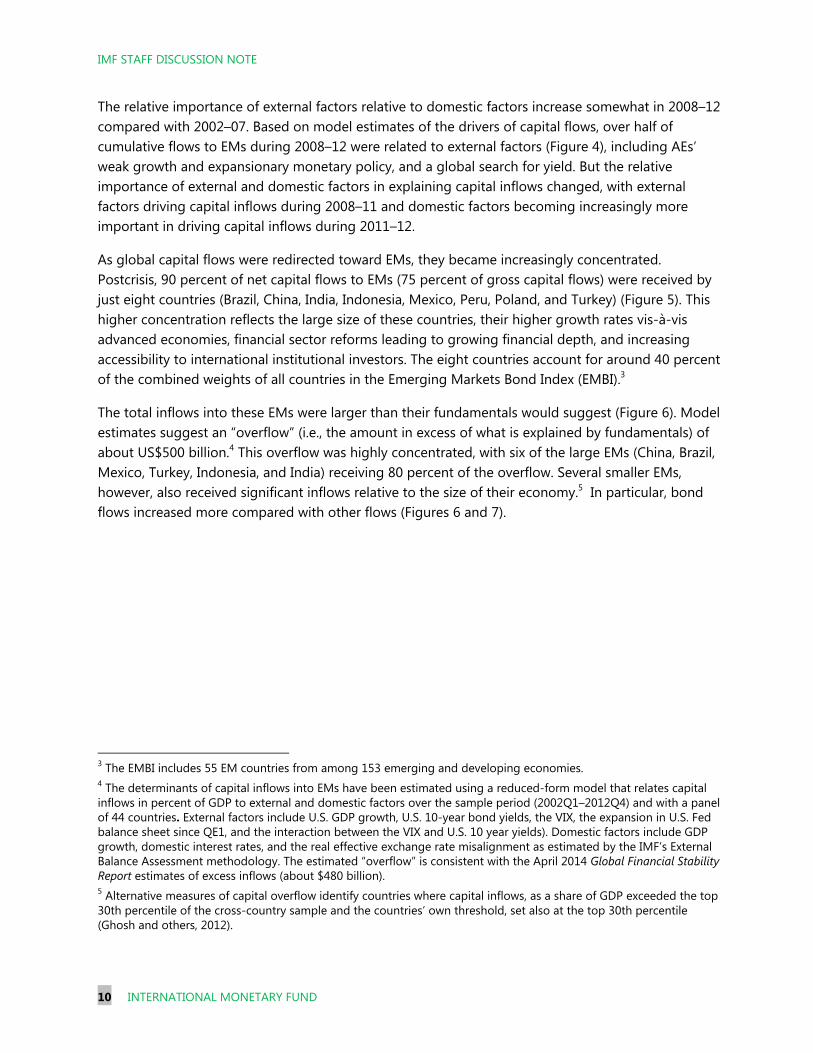
The total inflows into these EMs were larger than their fundamentals would suggest (Figure 6). Model estimates suggest an “overflow” (i.e., the amount in excess of what is explained by fundamentals) of about US$500 billion.4 This overflow was highly concentrated, with six of the large EMs (China, Brazil, Mexico, Turkey, Indonesia, and India) receiving 80 percent of the overflow. Several smaller EMs, however, also received significant inflows relative to the size of their economy.5 In particular, bond flows increased more compared with other flows (Figures 6 and 7).
3 The EMBI includes 55 EM countries from among 153 emerging and developing economies. 4 The determinants of capital inflows into EMs have been estimated using a reduced-form model that relates capital inflows in percent of GDP to external and domestic factors over the sample period (2002Q1–2012Q4) and with a panel of 44 countries. External factors include U.S. GDP growth, U.S. 10-year bond yields, the VIX, the expansion in U.S. Fed balance sheet since QE1, and the interaction between the VIX and U.S. 10 year yields). Domestic factors include GDP growth, domestic interest rates, and the real effective exchange rate misalignment as estimated by the IMF’s External Balance Assessment methodology. The estimated “overflow” is consistent with the April 2014 Global Financial Stability Report estimates of excess inflows (about $480 billion). 5 Alternative measures of capital overflow identify countries where capital inflows, as a share of GDP exceeded the top 30th percentile of the cross-country sample and the countries’ own threshold, set also at the top 30th percentile (Ghosh and others, 2012).
IMF STAFF DISCUSSION NOTE
INTERNATIONAL MONETARY FUND 11
Figure 6. Capital Flows into Emerging Markets
The overflow into EMs concentrated into a few EMs.
Source: IMF staff estimates.
A larger share of EMs experienced a surge in bond flows
postcrisis.
Figure 7. Surges in Bond Flows Emerging markets experienced a surge in bond flows in the postcrisis period.
Source: IMF staff estimates. Note: Blue shaded areas represent episodes of surges in bond flows.
0
5
10
15
20
25
30
35
40
45
50
2005Q4 2006Q4 2007Q4 2008Q4 2009Q4 2010Q4 2011Q4 2012Q4
Net surges Bond surges
(In percent)
2010Q1 2010Q2 2010Q3 2010Q4 2011Q1 2011Q2 2011Q3 2011Q4 2012Q1 2012Q2 2012Q3 2012Q4 2013Q1 2013Q2 2013Q3Argentina 0 1 0 0 0 0 0 0 0 0 0 0 0 0 0Brazil 0 1 1 0 0 0 0 0 0 0 0 0 0 0 1Bulgaria 0 0 0 0 0 0 0 1 0 0 1 0 0 0 0Chile 1 1 1 0 1 0 0 1 0 0 1 0 1 1 0China,P.R.: Mainland 0 0 0 0 0 0 0 0 0 0 0 0 0 0 0Colombia 0 0 0 0 0 0 0 1 0 1 1 0 1 1 0Croatia 0 1 1 0 1 0 1 0 1 1 0 1 0 1 0Czech Republic 0 1 1 0 0 1 0 0 1 1 1 0 1 1 0Estonia 1 0 0 0 1 0 1 1 0 1 0 1 0 1 0Hungary 1 0 0 0 1 1 0 0 0 0 1 0 0 0 0India 0 0 0 0 0 0 0 0 0 0 0 0 0 0 0Indonesia 1 0 1 0 1 1 0 0 0 1 0 0 0 0 0Korea, Republic of 1 1 1 0 1 0 1 0 1 0 0 0 0 0 0Latvia 1 1 0 0 0 1 0 1 1 0 1 1 0 1 0Lithuania 1 0 1 0 0 0 0 1 1 0 0 0 0 0 0Malaysia 0 0 0 0 0 0 0 0 0 0 0 0 0 0 0Mexico 1 0 1 0 1 1 1 1 1 0 1 1 1 1 1Pakistan 0 0 0 0 0 0 0 0 0 0 0 0 0 0 0Peru 0 1 1 1 0 0 1 0 1 1 1 0 1 1 0Philippines 0 0 1 1 1 1 0 0 0 0 0 1 1 0 0Poland 1 0 1 0 1 1 1 0 1 1 1 1 0 0 0Romania 1 0 0 1 1 1 0 0 1 0 0 1 1 1 1Russian Federation 0 1 0 0 0 0 0 0 1 1 0 1 0 0 0South Africa 1 1 1 0 0 1 0 0 1 0 1 0 0 0 1Sri Lanka 0 0 0 0 0 0 1 0 0 0 1 0 0 0 0Thailand 1 1 1 1 1 0 1 0 0 0 1 0 1 0 0Turkey 0 1 1 0 1 1 0 1 1 1 1 1 1 1 0Vietnam 0 0 0 0 0 0 0 0 0 0 0 0 0 0 0Egypt 0 0 0 0 0 0 0 0 0 0 0 0 0 0 0Israel 1 1 0 1 1 0 1 0 0 0 0 0 1 0 0Kazakhstan 1 0 1 1 1 0 0 0 0 0 0 0 0 1 0Serbia 0 0 0 0 1 1 1 0 1 0 0 1 1 0 0Ukraine 0 0 1 1 1 1 0 0 0 0 1 1 1 0 0Uruguay 0 0 0 0 0 1 1 1 0 0 0 1 0 0 0Armenia 0 0 0 0 0 0 0 0 0 0 0 0 0 0 0Bosnia & Herzegovina 0 0 0 0 0 0 0 0 0 0 0 0 0 0 0Dominican Republic 0 0 0 0 0 0 1 1 0 0 0 0 0 0 0Ecuador 0 0 0 0 0 0 0 0 0 0 1 0 0 0 0El Salvador 0 0 0 0 1 0 0 0 0 0 0 1 0 0 0Guatemala 0 0 0 0 0 0 0 0 0 0 0 0 0 0 0Jamaica 0 0 0 0 0 0 0 0 1 0 0 0 0 0 0Jordan 0 0 0 1 0 0 0 1 1 0 0 0 1 0 0Lebanon 0 0 0 0 1 0 0 0 0 0 0 1 0 0 0Tunisia 0 0 0 0 0 0 0 0 0 0 0 0 0 0 0Venezuela 0 0 1 1 1 0 0 1 1 0 1 0 0 1 0Morocco 0 0 0 0 0 0 0 0 0 0 0 0 0 0 0Costa Rica 0 0 1 1 0 0 1 1 0 0 1 1 0 0 0Paraguay 0 0 0 0 0 0 0 0 0 0 0 1 1 0 0
-600
-400
-200
0
200
400
600
800
2008Q4 2009Q2 2009Q4 2010Q2 2010Q4 2011Q2 2011Q4 2012Q2 2012Q4
Mex Others
ZAF TUR
IDN IND
CHN BRA
Cumulative Excess Capital Inflows to EMs Since 2008Q4: Contribution of Large EMs (in Billions of US Dollars)
IMF STAFF DISCUSSION NOTE
12 INTERNATIONAL MONETARY FUND
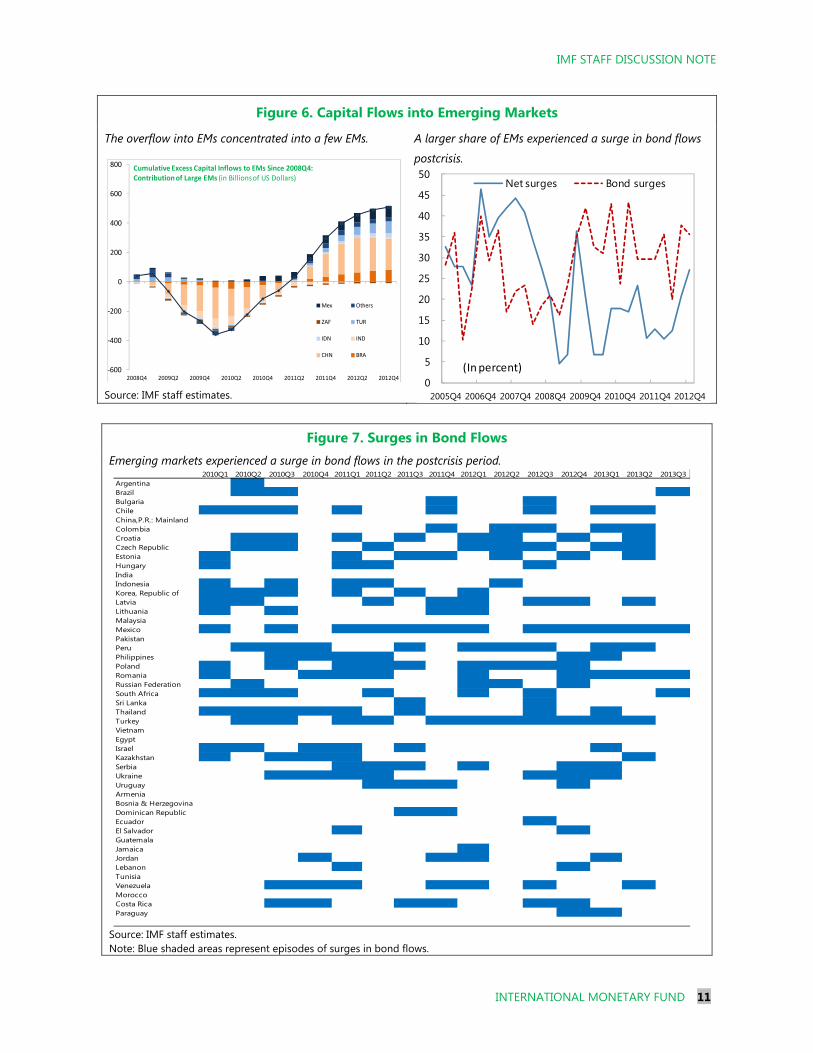
Strong credit growth accompanied the surge in capital flows in many countries. While banks continued to channel the bulk of the inflows, the shadow banking sector also grew rapidly in some EMs. At the same time, EM corporates took advantage of the strong appetite for EM debt and favorable financing conditions, including for first-time issuers and lower-rated borrowers (Figure 8). Between 2010 and 2013, EM issuance of below-investment-grade debt jumped from 15 to 35 percent of total debt issuance. India and Turkey experienced particularly large increases. However, elevated corporate leverage increased these countries’ sensitivity to slowing economic growth and earnings, tighter financial conditions and higher interest rates, and more depreciated exchange rates.
B. Policies in the Run-up to the May 2013 Taper Talk
While private inflows and debt increased in many EMs, policy buffers initially increased as well. Having experienced or observed several EM crises during 1980–2000, EMs in Asia and Latin America had learned some important lessons—namely, the value of strong public finances, low inflation, sustainable current account deficits, and building buffers to cushion against negative shocks. The advent of the early 2000s witnessed, by and large, a period of continued fiscal consolidation and relative tranquility. In general, foreign exchange reserves remained comfortable in most EMs, and some countries built reserve positions beyond what could be necessary for precautionary purposes.6 The Eastern European countries were an exception, accumulating significant imbalances prior to 2008, and going through a painful boom and bust.
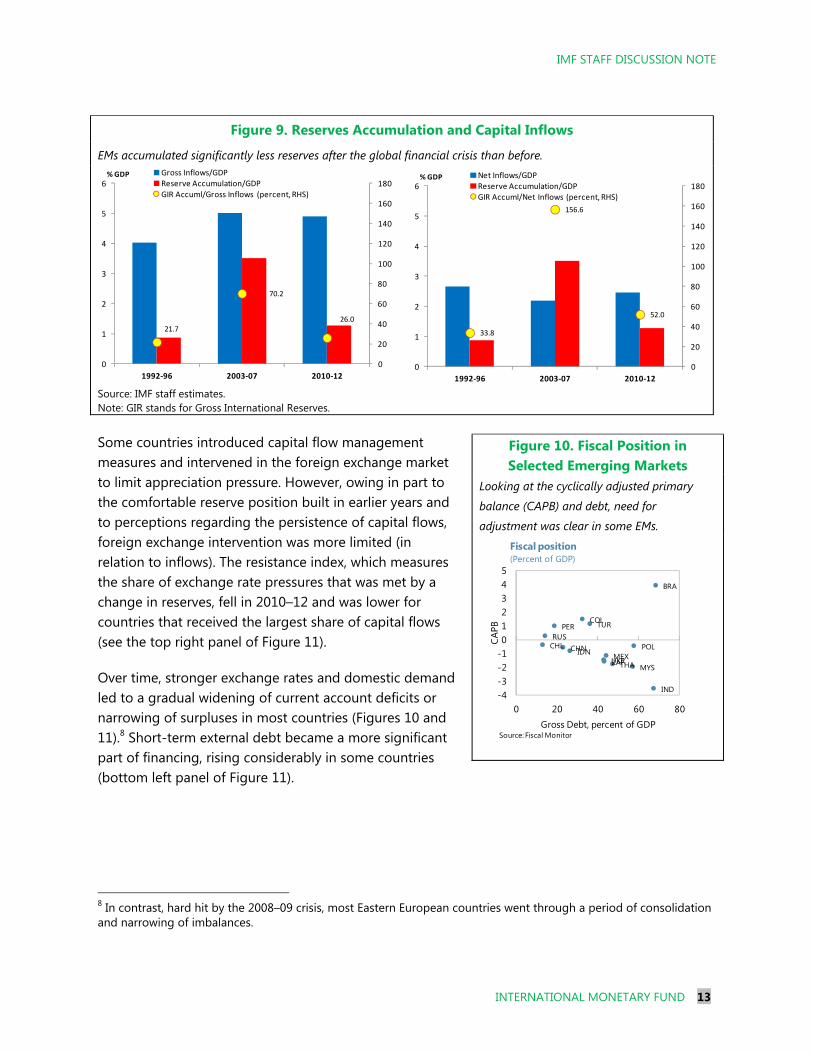
As noted in the previous section, following the global financial crisis, many EMs faced the challenge of absorbing large capital inflows, particularly during 2010–12. While there were significant differences in individual country responses, most met this challenge by allowing their nominal exchange rates to appreciate and by accumulating reserves (Figure 9).7
6 Some exceptions were Turkey, Indonesia, and Ukraine, where external reserves were relatively low, 7 Mexico saw a significant accumulation of foreign assets in the form of reserves by the central bank but also the private sector through outward FDI, portfolio flows, and deposits abroad. In contrast, Turkey had limited foreign asset accumulation.
Figure 8. Inflows and Financial Conditions
Large inflows made it easier for companies to borrow.
Source: IMF staff estimates.
R² = 0.3165
-100
-50
0
50
100
150
200
250
0 20 40 60 80 100 120 140
Cu
mm
ula
tive
exc
ess
flo
ws
(12
Q4
, $b
n)
Non-investment outstanding stock 12Q4 (USDbn)
IMF STAFF DISCUSSION NOTE
INTERNATIONAL MONETARY FUND 13
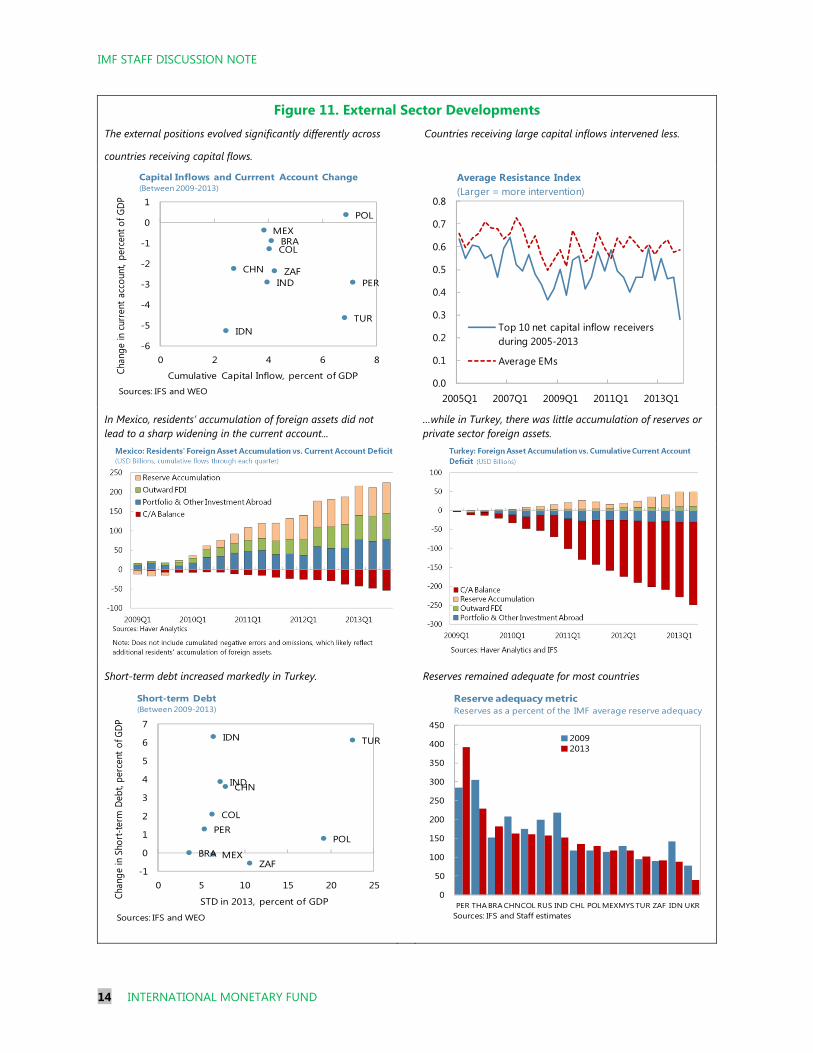
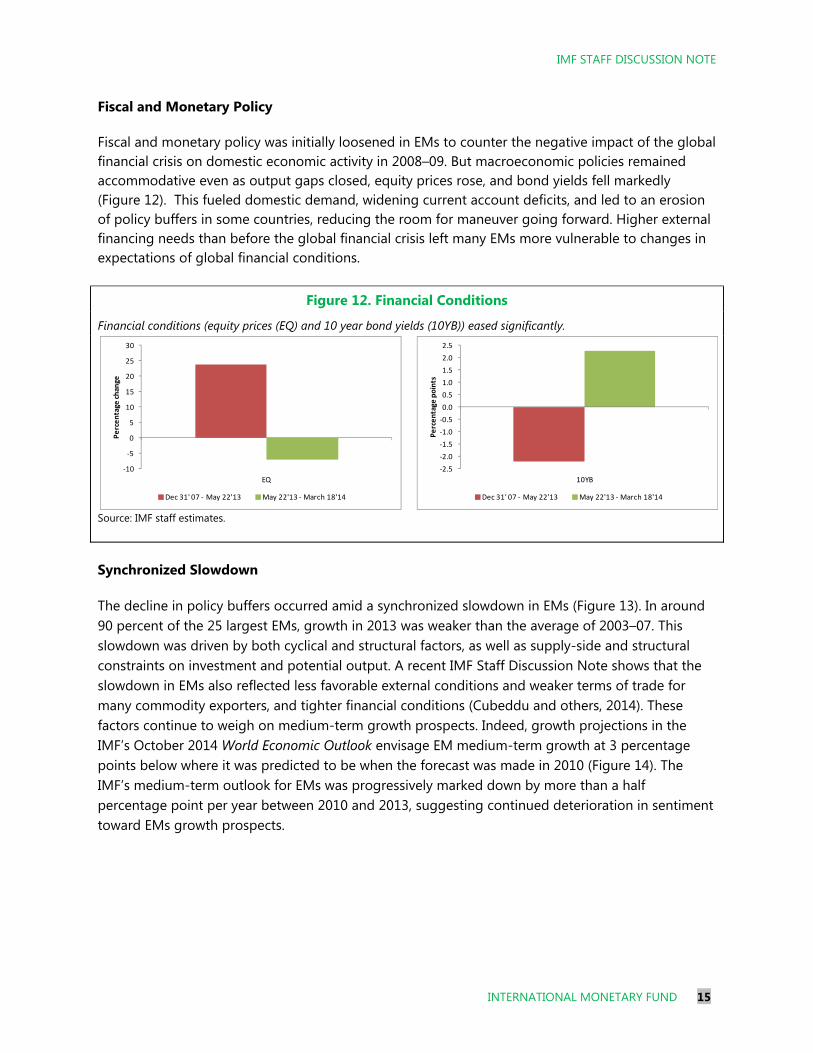
Some countries introduced capital flow management measures and intervened in the foreign exchange market to limit appreciation pressure. However, owing in part to the comfortable reserve position built in earlier years and to perceptions regarding the persistence of capital flows, foreign exchange intervention was more limited (in relation to inflows). The resistance index, which measures the share of exchange rate pressures that was met by a change in reserves, fell in 2010–12 and was lower for countries that received the largest share of capital flows (see the top right panel of Figure 11).
Over time, stronger exchange rates and domestic demand led to a gradual widening of current account deficits or narrowing of surpluses in most countries (Figures 10 and 11).8 Short-term external debt became a more significant part of financing, rising considerably in some countries (bottom left panel of Figure 11).
8 In contrast, hard hit by the 2008–09 crisis, most Eastern European countries went through a period of consolidation and narrowing of imbalances.
Figure 9. Reserves Accumulation and Capital Inflows
EMs accumulated significantly less reserves after the global financial crisis than before.
Source: IMF staff estimates. Note: GIR stands for Gross International Reserves.
Figure 10. Fiscal Position in Selected Emerging Markets
Looking at the cyclically adjusted primary
balance (CAPB) and debt, need for
adjustment was clear in some EMs.
21.7
70.2
26.0
0
20
40
60
80
100
120
140
160
180
0
1
2
3
4
5
6
1992-96 2003-07 2010-12
Gross Inflows/GDPReserve Accumulation/GDPGIR Accuml/Gross Inflows (percent, RHS)
% GDP
33.8
156.6
52.0
0
20
40
60
80
100
120
140
160
180
0
1
2
3
4
5
6
1992-96 2003-07 2010-12
Net Inflows/GDPReserve Accumulation/GDPGIR Accuml/Net Inflows (percent, RHS)
% GDP
BRA
CHL CHN
COL
IND
IDN
MYSMEX
PER
POLRUS
ZAFTHA
TUR
UKR
-4-3-2-1012345
0 20 40 60 80
CAPB
Gross Debt, percent of GDP
Fiscal position(Percent of GDP)
Source: Fiscal Monitor
IMF STAFF DISCUSSION NOTE
14 INTERNATIONAL MONETARY FUND
Figure 11. External Sector Developments The external positions evolved significantly differently across Countries receiving large capital inflows intervened less.
countries receiving capital flows.
In Mexico, residents’ accumulation of foreign assets did not lead to a sharp widening in the current account... …while in Turkey, there was little accumulation of reserves or
private sector foreign assets.
Short-term debt increased markedly in Turkey. Reserves remained adequate for most countries
CHN
BRA
TUR
MEX
IND
POL
IDN
ZAFPER
COL
-6
-5
-4
-3
-2
-1
0
1
0 2 4 6 8
Chan
ge in
cur
rent
acc
ount
, per
cent
of G
DP
Cumulative Capital Inflow, percent of GDP
Capital Inflows and Currrent Account Change (Between 2009-2013)
Sources: IFS and WEO0.0
0.1
0.2
0.3
0.4
0.5
0.6
0.7
0.8
2005Q1 2007Q1 2009Q1 2011Q1 2013Q1
Average Resistance Index (Larger = more intervention)
Top 10 net capital inflow receivers during 2005-2013
Average EMs
CHN
BRA
TUR
MEX
IND
POL
IDN
ZAF
PERCOL
-1
0
1
2
3
4
5
6
7
0 5 10 15 20 25
Chan
ge in
Sho
rt-te
rm D
ebt,
perc
ent o
f GDP
STD in 2013, percent of GDP
Short-term Debt(Between 2009-2013)
Sources: IFS and WEO
0
50
100
150
200
250
300
350
400
450
PER THA BRA CHNCOL RUS IND CHL POL MEXMYS TUR ZAF IDN UKR
20092013
Reserve adequacy metricReserves as a percent of the IMF average reserve adequacy
Sources: IFS and Staff estimates
IMF STAFF DISCUSSION NOTE
INTERNATIONAL MONETARY FUND 15
Fiscal and Monetary Policy
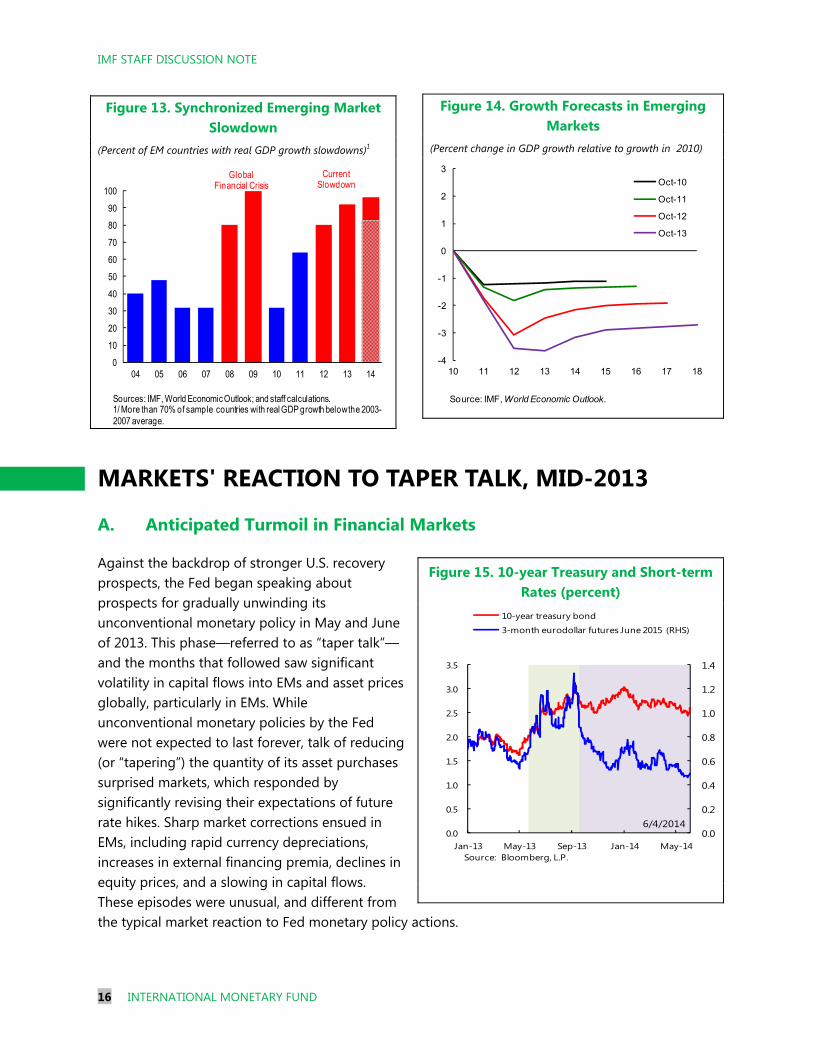
Fiscal and monetary policy was initially loosened in EMs to counter the negative impact of the global financial crisis on domestic economic activity in 2008–09. But macroeconomic policies remained accommodative even as output gaps closed, equity prices rose, and bond yields fell markedly (Figure 12). This fueled domestic demand, widening current account deficits, and led to an erosion of policy buffers in some countries, reducing the room for maneuver going forward. Higher external financing needs than before the global financial crisis left many EMs more vulnerable to changes in expectations of global financial conditions.
Figure 12. Financial Conditions
Financial conditions (equity prices (EQ) and 10 year bond yields (10YB)) eased significantly.
Source: IMF staff estimates.
Synchronized Slowdown
The decline in policy buffers occurred amid a synchronized slowdown in EMs (Figure 13). In around 90 percent of the 25 largest EMs, growth in 2013 was weaker than the average of 2003–07. This slowdown was driven by both cyclical and structural factors, as well as supply-side and structural constraints on investment and potential output. A recent IMF Staff Discussion Note shows that the slowdown in EMs also reflected less favorable external conditions and weaker terms of trade for many commodity exporters, and tighter financial conditions (Cubeddu and others, 2014). These factors continue to weigh on medium-term growth prospects. Indeed, growth projections in the IMF’s October 2014 World Economic Outlook envisage EM medium-term growth at 3 percentage points below where it was predicted to be when the forecast was made in 2010 (Figure 14). The IMF’s medium-term outlook for EMs was progressively marked down by more than a half percentage point per year between 2010 and 2013, suggesting continued deterioration in sentiment toward EMs growth prospects.
-10
-5
0
5
10
15
20
25
30
EQ
Pe
rce
nta
ge c
han
ge
Dec 31' 07 - May 22'13 May 22'13 - March 18'14
-2.5
-2.0
-1.5
-1.0
-0.5
0.0
0.5
1.0
1.5
2.0
2.5
10YB
Pe
rce
nta
ge p
oin
ts
Dec 31' 07 - May 22'13 May 22'13 - March 18'14
IMF STAFF DISCUSSION NOTE
16 INTERNATIONAL MONETARY FUND
MARKETS' REACTION TO TAPER TALK, MID-2013
A. Anticipated Turmoil in Financial Markets
Against the backdrop of stronger U.S. recovery prospects, the Fed began speaking about prospects for gradually unwinding its unconventional monetary policy in May and June of 2013. This phase—referred to as “taper talk”—and the months that followed saw significant volatility in capital flows into EMs and asset prices globally, particularly in EMs. While unconventional monetary policies by the Fed were not expected to last forever, talk of reducing (or “tapering”) the quantity of its asset purchases surprised markets, which responded by significantly revising their expectations of future rate hikes. Sharp market corrections ensued in EMs, including rapid currency depreciations, increases in external financing premia, declines in equity prices, and a slowing in capital flows. These episodes were unusual, and different from the typical market reaction to Fed monetary policy actions.
Figure 14. Growth Forecasts in Emerging Markets
(Percent change in GDP growth relative to growth in 2010)
Figure 13. Synchronized Emerging Market Slowdown
(Percent of EM countries with real GDP growth slowdowns)1
Figure 15. 10-year Treasury and Short-term Rates (percent)
-4
-3
-2
-1
0
1
2
3
10 11 12 13 14 15 16 17 18
Oct-10
Oct-11
Oct-12
Oct-13
Source: IMF, World Economic Outlook.
0
10
20
30
40
50
60
70
80
90
100
04 05 06 07 08 09 10 11 12 13 14
Global Financial Crisis
Current Slowdown
Sources: IMF, World Economic Outlook; and staff calculations.1/ More than 70% of sample countries with real GDP growth below the 2003-2007 average.
0.0
0.2
0.4
0.6
0.8
1.0
1.2
1.4
0.0
0.5
1.0
1.5
2.0
2.5
3.0
3.5
Jan-13 May-13 Sep-13 Jan-14 May-14
10-year treasury bond
3-month eurodollar futures June 2015 (RHS)
Source: Bloomberg, L.P.
6/4/2014
IMF STAFF DISCUSSION NOTE
INTERNATIONAL MONETARY FUND 17
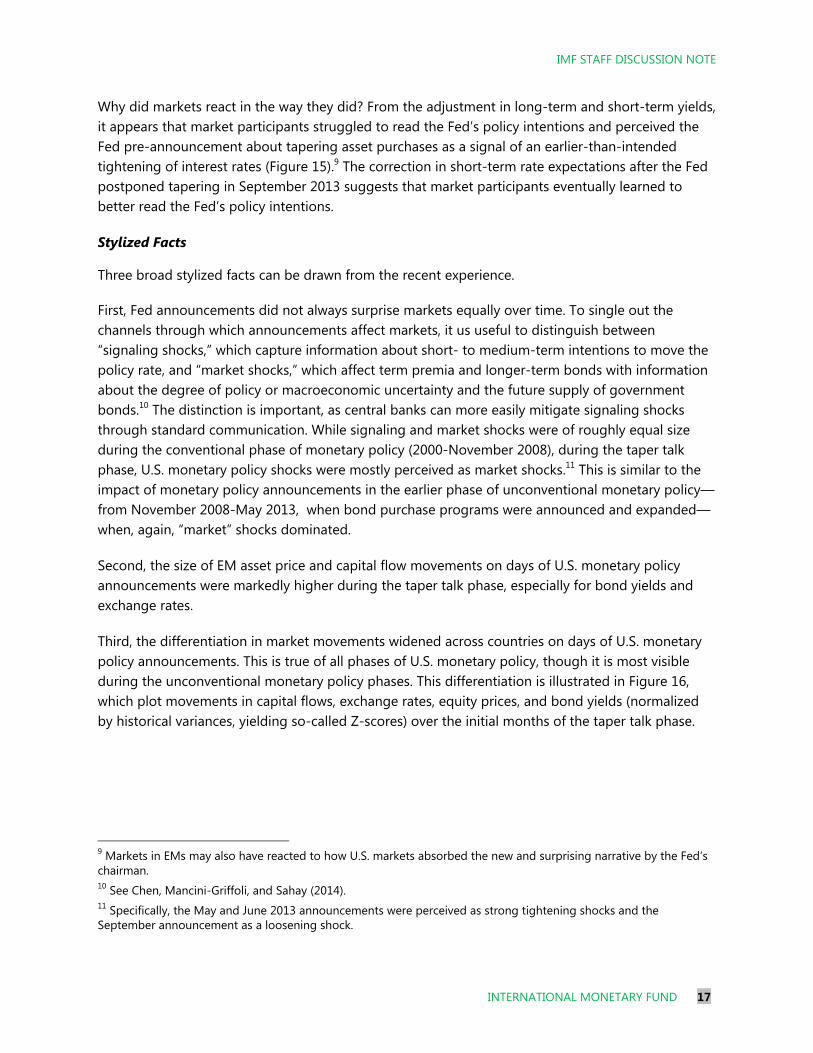
Why did markets react in the way they did? From the adjustment in long-term and short-term yields, it appears that market participants struggled to read the Fed’s policy intentions and perceived the Fed pre-announcement about tapering asset purchases as a signal of an earlier-than-intended tightening of interest rates (Figure 15).9 The correction in short-term rate expectations after the Fed postponed tapering in September 2013 suggests that market participants eventually learned to better read the Fed’s policy intentions.
Stylized Facts
Three broad stylized facts can be drawn from the recent experience.
First, Fed announcements did not always surprise markets equally over time. To single out the channels through which announcements affect markets, it us useful to distinguish between “signaling shocks,” which capture information about short- to medium-term intentions to move the policy rate, and “market shocks,” which affect term premia and longer-term bonds with information about the degree of policy or macroeconomic uncertainty and the future supply of government bonds.10 The distinction is important, as central banks can more easily mitigate signaling shocks through standard communication. While signaling and market shocks were of roughly equal size during the conventional phase of monetary policy (2000-November 2008), during the taper talk phase, U.S. monetary policy shocks were mostly perceived as market shocks.11 This is similar to the impact of monetary policy announcements in the earlier phase of unconventional monetary policy—from November 2008-May 2013, when bond purchase programs were announced and expanded—when, again, “market” shocks dominated.
Second, the size of EM asset price and capital flow movements on days of U.S. monetary policy announcements were markedly higher during the taper talk phase, especially for bond yields and exchange rates.
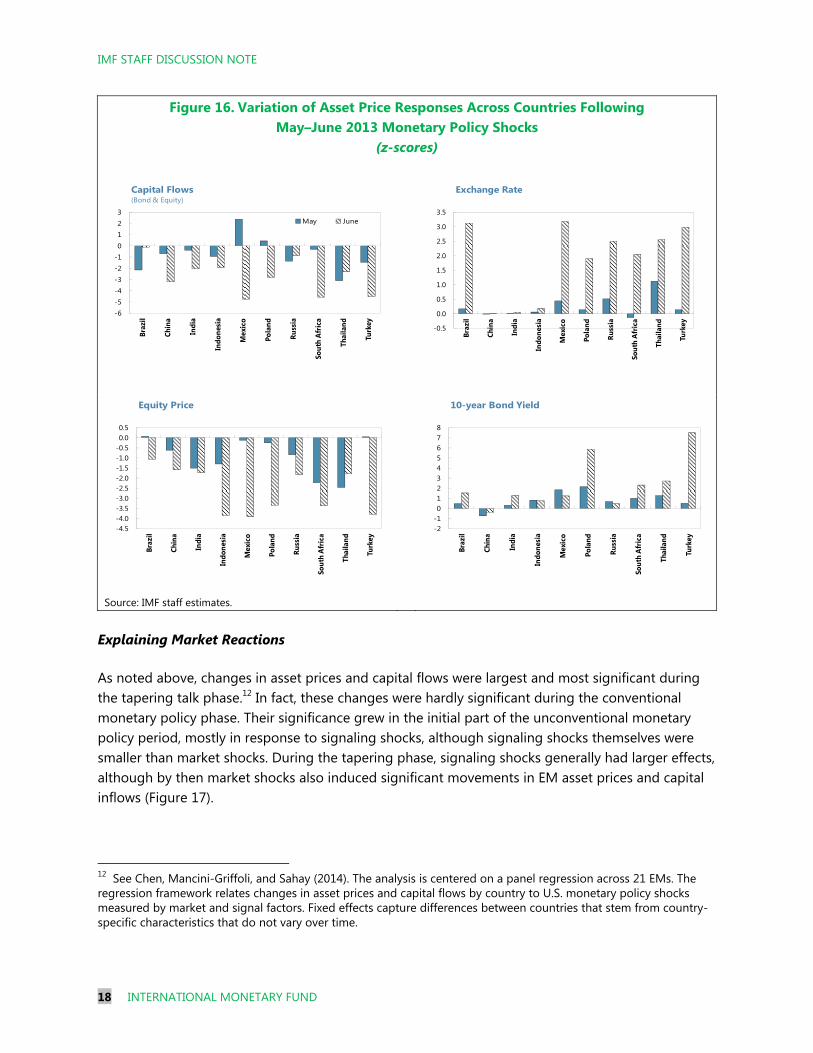
Third, the differentiation in market movements widened across countries on days of U.S. monetary policy announcements. This is true of all phases of U.S. monetary policy, though it is most visible during the unconventional monetary policy phases. This differentiation is illustrated in Figure 16, which plot movements in capital flows, exchange rates, equity prices, and bond yields (normalized by historical variances, yielding so-called Z-scores) over the initial months of the taper talk phase.
9 Markets in EMs may also have reacted to how U.S. markets absorbed the new and surprising narrative by the Fed’s chairman. 10 See Chen, Mancini-Griffoli, and Sahay (2014). 11 Specifically, the May and June 2013 announcements were perceived as strong tightening shocks and the September announcement as a loosening shock.
IMF STAFF DISCUSSION NOTE
18 INTERNATIONAL MONETARY FUND
Explaining Market Reactions
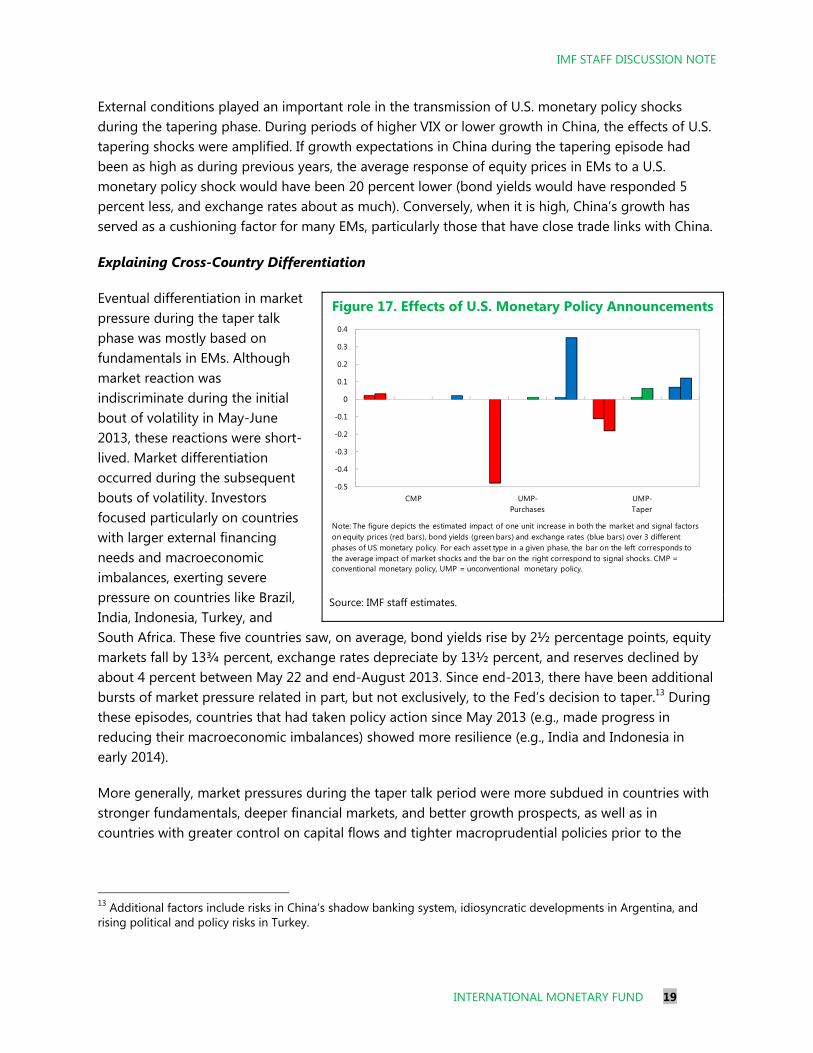
As noted above, changes in asset prices and capital flows were largest and most significant during the tapering talk phase.12 In fact, these changes were hardly significant during the conventional monetary policy phase. Their significance grew in the initial part of the unconventional monetary policy period, mostly in response to signaling shocks, although signaling shocks themselves were smaller than market shocks. During the tapering phase, signaling shocks generally had larger effects, although by then market shocks also induced significant movements in EM asset prices and capital inflows (Figure 17).
12 See Chen, Mancini-Griffoli, and Sahay (2014). The analysis is centered on a panel regression across 21 EMs. The regression framework relates changes in asset prices and capital flows by country to U.S. monetary policy shocks measured by market and signal factors. Fixed effects capture differences between countries that stem from country-specific characteristics that do not vary over time.
Figure 16.Variation of Asset Price Responses Across Countries Following May–June 2013 Monetary Policy Shocks
(z-scores)
Source: IMF staff estimates.
-6-5-4-3-2-10123
Braz
il
Chin
a
Indi
a
Indo
nesi
a
Mex
ico
Pola
nd
Russ
ia
Sout
h Af
rica
Thai
land
Turk
ey
May June
Capital Flows(Bond & Equity)
-0.5
0.0
0.5
1.0
1.5
2.0
2.5
3.0
3.5
Braz
il
Chin
a
Indi
a
Indo
nesi
a
Mex
ico
Pola
nd
Russ
ia
Sout
h A
fric
a
Thai
land
Turk
ey
Exchange Rate
-4.5-4.0-3.5-3.0-2.5-2.0-1.5-1.0-0.50.00.5
Braz
il
Chin
a
Indi
a
Indo
nesi
a
Mex
ico
Pola
nd
Russ
ia
Sout
h A
fric
a
Thai
land
Turk
ey
Equity Price
-2-1012345678
Braz
il
Chin
a
Indi
a
Indo
nesi
a
Mex
ico
Pola
nd
Russ
ia
Sout
h Af
rica
Thai
land
Turk
ey
10-year Bond Yield
IMF STAFF DISCUSSION NOTE
INTERNATIONAL MONETARY FUND 19
External conditions played an important role in the transmission of U.S. monetary policy shocks during the tapering phase. During periods of higher VIX or lower growth in China, the effects of U.S. tapering shocks were amplified. If growth expectations in China during the tapering episode had been as high as during previous years, the average response of equity prices in EMs to a U.S. monetary policy shock would have been 20 percent lower (bond yields would have responded 5 percent less, and exchange rates about as much). Conversely, when it is high, China’s growth has served as a cushioning factor for many EMs, particularly those that have close trade links with China.
Explaining Cross-Country Differentiation
Eventual differentiation in market pressure during the taper talk phase was mostly based on fundamentals in EMs. Although market reaction was indiscriminate during the initial bout of volatility in May-June 2013, these reactions were short-lived. Market differentiation occurred during the subsequent bouts of volatility. Investors focused particularly on countries with larger external financing needs and macroeconomic imbalances, exerting severe pressure on countries like Brazil, India, Indonesia, Turkey, and South Africa. These five countries saw, on average, bond yields rise by 2½ percentage points, equity markets fall by 13¾ percent, exchange rates depreciate by 13½ percent, and reserves declined by about 4 percent between May 22 and end-August 2013. Since end-2013, there have been additional bursts of market pressure related in part, but not exclusively, to the Fed’s decision to taper.13 During these episodes, countries that had taken policy action since May 2013 (e.g., made progress in reducing their macroeconomic imbalances) showed more resilience (e.g., India and Indonesia in early 2014).
More generally, market pressures during the taper talk period were more subdued in countries with stronger fundamentals, deeper financial markets, and better growth prospects, as well as in countries with greater control on capital flows and tighter macroprudential policies prior to the
13 Additional factors include risks in China’s shadow banking system, idiosyncratic developments in Argentina, and rising political and policy risks in Turkey.
Figure 17. Effects of U.S. Monetary Policy Announcements
Source: IMF staff estimates.
-0.5
-0.4
-0.3
-0.2
-0.1
0
0.1
0.2
0.3
0.4
CMP UMP-Purchases
UMP-Taper
Note: The figure depicts the estimated impact of one unit increase in both the market and signal factors on equity prices (red bars), bond yields (green bars) and exchange rates (blue bars) over 3 different phases of US monetary policy. For each asset type in a given phase, the bar on the left corresponds to the average impact of market shocks and the bar on the right correspond to signal shocks. CMP = conventional monetary policy, UMP = unconventional monetary policy.
IMF STAFF DISCUSSION NOTE
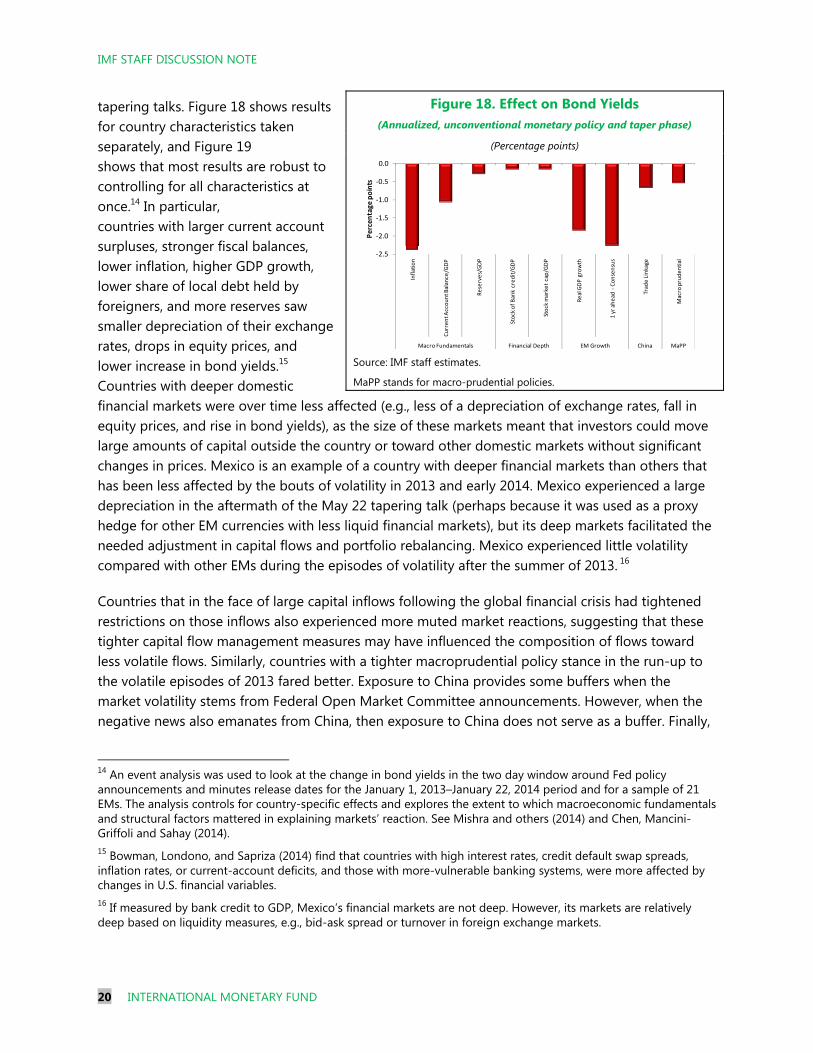
20 INTERNATIONAL MONETARY FUND
tapering talks. Figure 18 shows results for country characteristics taken separately, and Figure 19 shows that most results are robust to controlling for all characteristics at once.14 In particular, countries with larger current account surpluses, stronger fiscal balances, lower inflation, higher GDP growth, lower share of local debt held by foreigners, and more reserves saw smaller depreciation of their exchange rates, drops in equity prices, and lower increase in bond yields.15 Countries with deeper domestic financial markets were over time less affected (e.g., less of a depreciation of exchange rates, fall in equity prices, and rise in bond yields), as the size of these markets meant that investors could move large amounts of capital outside the country or toward other domestic markets without significant changes in prices. Mexico is an example of a country with deeper financial markets than others that has been less affected by the bouts of volatility in 2013 and early 2014. Mexico experienced a large depreciation in the aftermath of the May 22 tapering talk (perhaps because it was used as a proxy hedge for other EM currencies with less liquid financial markets), but its deep markets facilitated the needed adjustment in capital flows and portfolio rebalancing. Mexico experienced little volatility compared with other EMs during the episodes of volatility after the summer of 2013. 16
Countries that in the face of large capital inflows following the global financial crisis had tightened restrictions on those inflows also experienced more muted market reactions, suggesting that these tighter capital flow management measures may have influenced the composition of flows toward less volatile flows. Similarly, countries with a tighter macroprudential policy stance in the run-up to the volatile episodes of 2013 fared better. Exposure to China provides some buffers when the market volatility stems from Federal Open Market Committee announcements. However, when the negative news also emanates from China, then exposure to China does not serve as a buffer. Finally,
14 An event analysis was used to look at the change in bond yields in the two day window around Fed policy announcements and minutes release dates for the January 1, 2013–January 22, 2014 period and for a sample of 21 EMs. The analysis controls for country-specific effects and explores the extent to which macroeconomic fundamentals and structural factors mattered in explaining markets’ reaction. See Mishra and others (2014) and Chen, Mancini-Griffoli and Sahay (2014). 15 Bowman, Londono, and Sapriza (2014) find that countries with high interest rates, credit default swap spreads, inflation rates, or current-account deficits, and those with more-vulnerable banking systems, were more affected by changes in U.S. financial variables. 16 If measured by bank credit to GDP, Mexico’s financial markets are not deep. However, its markets are relatively deep based on liquidity measures, e.g., bid-ask spread or turnover in foreign exchange markets.
Figure 18. Effect on Bond Yields (Annualized, unconventional monetary policy and taper phase)
(Percentage points)
Source: IMF staff estimates.
MaPP stands for macro-prudential policies.
-2.5
-2.0
-1.5
-1.0
-0.5
0.0
Infl
atio
n
Cu
rre
nt A
cco
un
t Bal
ance
/GD
P
Re
serv
es/
GD
P
Sto
ck o
f B
ank
cre
dit
/GD
P
Sto
ck m
arke
t ca
p/G
DP
Re
al G
DP
gro
wth
1 y
r ah
ead
-C
on
sen
sus
Trad
e L
inka
ge
Mac
ro p
rud
en
tial
Macro Fundamentals Financial Depth EM Growth China MaPP
Per
cen
tage
po
ints
IMF STAFF DISCUSSION NOTE
INTERNATIONAL MONETARY FUND 21
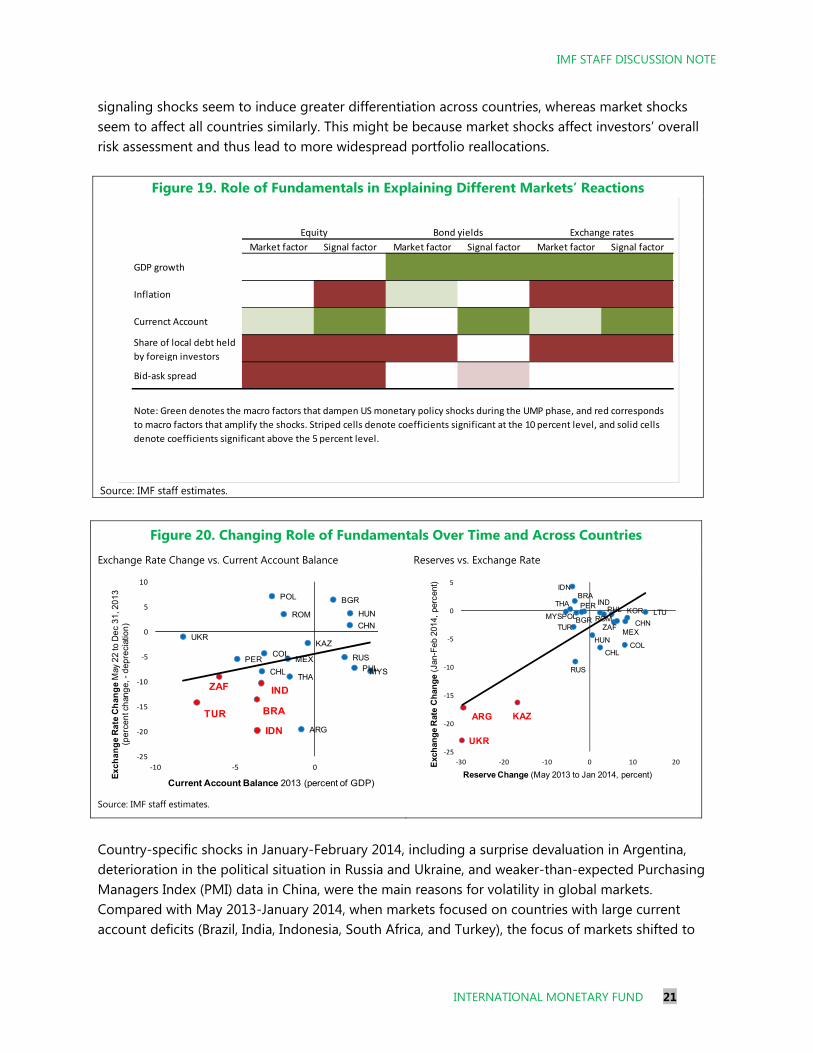
signaling shocks seem to induce greater differentiation across countries, whereas market shocks seem to affect all countries similarly. This might be because market shocks affect investors’ overall risk assessment and thus lead to more widespread portfolio reallocations.
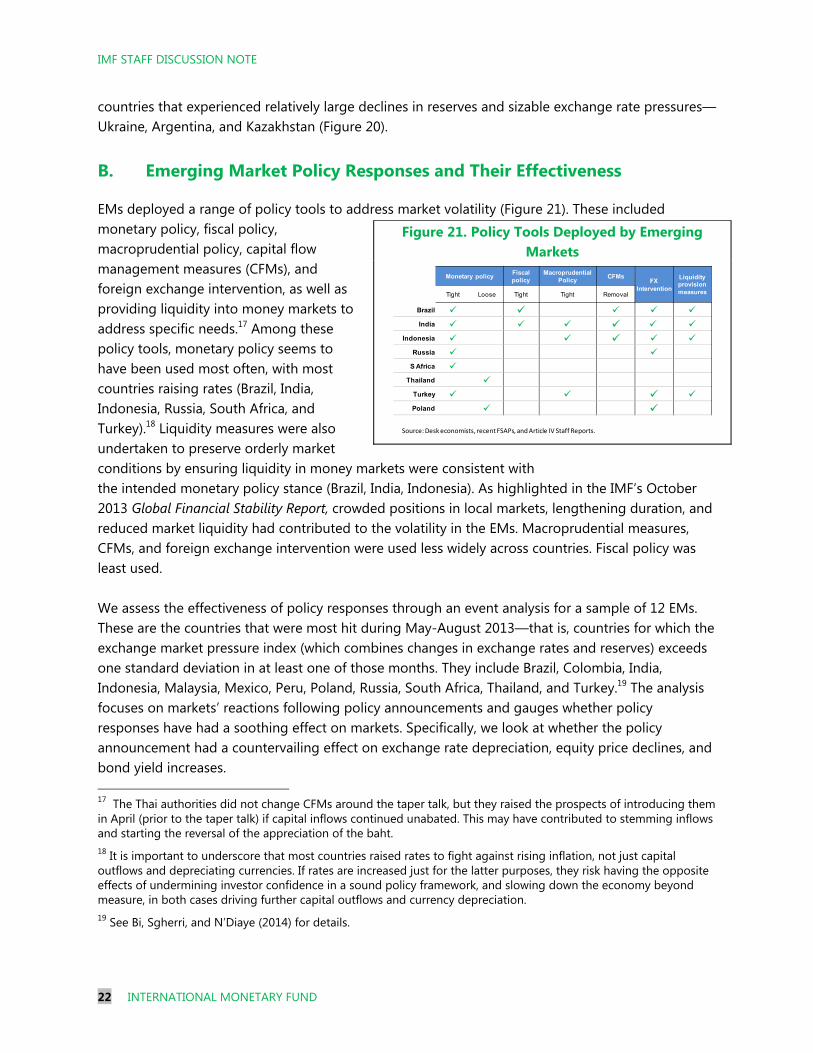
Country-specific shocks in January-February 2014, including a surprise devaluation in Argentina, deterioration in the political situation in Russia and Ukraine, and weaker-than-expected Purchasing Managers Index (PMI) data in China, were the main reasons for volatility in global markets. Compared with May 2013-January 2014, when markets focused on countries with large current account deficits (Brazil, India, Indonesia, South Africa, and Turkey), the focus of markets shifted to
Figure 19. Role of Fundamentals in Explaining Different Markets’ Reactions
Source: IMF staff estimates.
Figure 20. Changing Role of Fundamentals Over Time and Across Countries
Exchange Rate Change vs. Current Account Balance Reserves vs. Exchange Rate
Source: IMF staff estimates.
Market factor Signal factor Market factor Signal factor Market factor Signal factor
GDP growth
Inflation
Currenct Account
Share of local debt held
by foreign investors
Bid-ask spread
Equity Bond yields Exchange rates
Note: Green denotes the macro factors that dampen US monetary policy shocks during the UMP phase, and red corresponds
to macro factors that amplify the shocks. Striped cells denote coefficients significant at the 10 percent level, and solid cells
denote coefficients significant above the 5 percent level.
CHN
IND
IDN
BRA
MEX
HUN
POL
RUS
TUR
ZAF
MYSPHLTHA
CHL
COLPER
BGR
KAZ
ROM
UKR
ARG
-25
-20
-15
-10
-5
0
5
10
-10 -5 0
Current Account Balance 2013 (percent of GDP)
Exc
ha
ng
e R
ate
Ch
ang
e M
ay 2
2 to
De
c 3
1, 2
013
(per
cen
t ch
ang
e, -
dep
reci
atio
n) CHN
IND
IDNBRA
MEXHUN
POL
RUS
TUR ZAF
KORMYS
PHLTHA
CHLCOL
PER
BGR
KAZ
LTUROM
UKR
ARG
-25
-20
-15
-10
-5
0
5
-30 -20 -10 0 10 20
Reserve Change (May 2013 to Jan 2014, percent)
Exc
han
ge
Rat
e C
han
ge
(Jan
-Feb
201
4, p
erce
nt)
IMF STAFF DISCUSSION NOTE
22 INTERNATIONAL MONETARY FUND
countries that experienced relatively large declines in reserves and sizable exchange rate pressures—Ukraine, Argentina, and Kazakhstan (Figure 20).
B. Emerging Market Policy Responses and Their Effectiveness
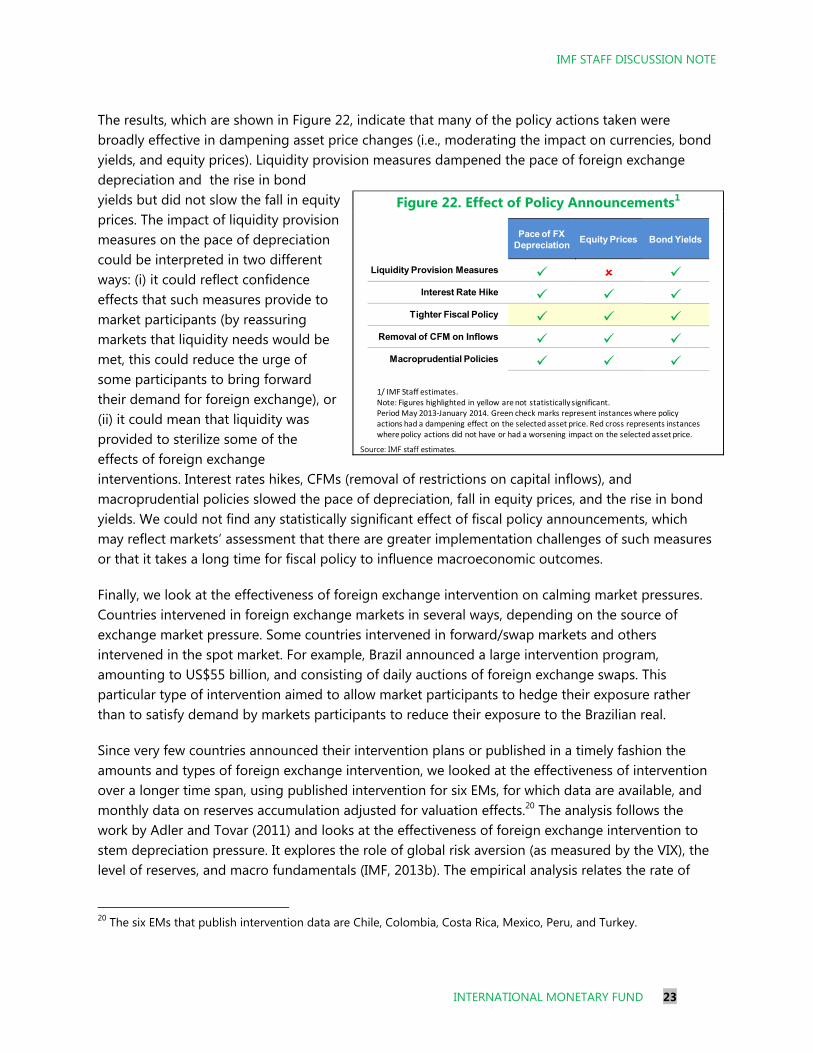
EMs deployed a range of policy tools to address market volatility (Figure 21). These included monetary policy, fiscal policy, macroprudential policy, capital flow management measures (CFMs), and foreign exchange intervention, as well as providing liquidity into money markets to address specific needs.17 Among these policy tools, monetary policy seems to have been used most often, with most countries raising rates (Brazil, India, Indonesia, Russia, South Africa, and Turkey).18 Liquidity measures were also undertaken to preserve orderly market conditions by ensuring liquidity in money markets were consistent with the intended monetary policy stance (Brazil, India, Indonesia). As highlighted in the IMF’s October 2013 Global Financial Stability Report, crowded positions in local markets, lengthening duration, and reduced market liquidity had contributed to the volatility in the EMs. Macroprudential measures, CFMs, and foreign exchange intervention were used less widely across countries. Fiscal policy was least used. We assess the effectiveness of policy responses through an event analysis for a sample of 12 EMs. These are the countries that were most hit during May-August 2013—that is, countries for which the exchange market pressure index (which combines changes in exchange rates and reserves) exceeds one standard deviation in at least one of those months. They include Brazil, Colombia, India, Indonesia, Malaysia, Mexico, Peru, Poland, Russia, South Africa, Thailand, and Turkey.19 The analysis focuses on markets’ reactions following policy announcements and gauges whether policy responses have had a soothing effect on markets. Specifically, we look at whether the policy announcement had a countervailing effect on exchange rate depreciation, equity price declines, and bond yield increases. 17 The Thai authorities did not change CFMs around the taper talk, but they raised the prospects of introducing them in April (prior to the taper talk) if capital inflows continued unabated. This may have contributed to stemming inflows and starting the reversal of the appreciation of the baht. 18 It is important to underscore that most countries raised rates to fight against rising inflation, not just capital outflows and depreciating currencies. If rates are increased just for the latter purposes, they risk having the opposite effects of undermining investor confidence in a sound policy framework, and slowing down the economy beyond measure, in both cases driving further capital outflows and currency depreciation. 19 See Bi, Sgherri, and N’Diaye (2014) for details.
Figure 21. Policy Tools Deployed by Emerging Markets
Monetary policyFiscalpolicy
MacroprudentialPolicy
CFMsFX
Intervention
Liquidity provision measuresTight Loose Tight Tight Removal
Brazil India
Indonesia Russia
S Africa Thailand
Turkey Poland
Source: Desk economists, recent FSAPs, and Article IV Staff Reports.
IMF STAFF DISCUSSION NOTE
INTERNATIONAL MONETARY FUND 23
The results, which are shown in Figure 22, indicate that many of the policy actions taken were broadly effective in dampening asset price changes (i.e., moderating the impact on currencies, bond yields, and equity prices). Liquidity provision measures dampened the pace of foreign exchange depreciation and the rise in bond yields but did not slow the fall in equity prices. The impact of liquidity provision measures on the pace of depreciation could be interpreted in two different ways: (i) it could reflect confidence effects that such measures provide to market participants (by reassuring markets that liquidity needs would be met, this could reduce the urge of some participants to bring forward their demand for foreign exchange), or (ii) it could mean that liquidity was provided to sterilize some of the effects of foreign exchange interventions. Interest rates hikes, CFMs (removal of restrictions on capital inflows), and macroprudential policies slowed the pace of depreciation, fall in equity prices, and the rise in bond yields. We could not find any statistically significant effect of fiscal policy announcements, which may reflect markets’ assessment that there are greater implementation challenges of such measures or that it takes a long time for fiscal policy to influence macroeconomic outcomes.
Finally, we look at the effectiveness of foreign exchange intervention on calming market pressures. Countries intervened in foreign exchange markets in several ways, depending on the source of exchange market pressure. Some countries intervened in forward/swap markets and others intervened in the spot market. For example, Brazil announced a large intervention program, amounting to US$55 billion, and consisting of daily auctions of foreign exchange swaps. This particular type of intervention aimed to allow market participants to hedge their exposure rather than to satisfy demand by markets participants to reduce their exposure to the Brazilian real.
Since very few countries announced their intervention plans or published in a timely fashion the amounts and types of foreign exchange intervention, we looked at the effectiveness of intervention over a longer time span, using published intervention for six EMs, for which data are available, and monthly data on reserves accumulation adjusted for valuation effects.20 The analysis follows the work by Adler and Tovar (2011) and looks at the effectiveness of foreign exchange intervention to stem depreciation pressure. It explores the role of global risk aversion (as measured by the VIX), the level of reserves, and macro fundamentals (IMF, 2013b). The empirical analysis relates the rate of
20 The six EMs that publish intervention data are Chile, Colombia, Costa Rica, Mexico, Peru, and Turkey.
Figure 22. Effect of Policy Announcements1
Source: IMF staff estimates.
Pace of FX Depreciation
Liquidity Provision Measures Interest Rate Hike
Tighter Fiscal Policy Removal of CFM on Inflows
Macroprudential Policies
1/ IMF Staff estimates. Note: Figures highlighted in yellow are not statistically significant.Period May 2013-January 2014. Green check marks represent instances where policy actions had a dampening effect on the selected asset price. Red cross represents instances where policy actions did not have or had a worsening impact on the selected asset price.
Equity Prices
Bond Yields
IMF STAFF DISCUSSION NOTE
24 INTERNATIONAL MONETARY FUND
change in bilateral exchange rates against the U.S. dollar to a set of fundamentals, including interest rate differentials, EMBI spreads, commodity prices, the VIX, countries’ experience with foreign exchange intervention (which in turn depends on past movements in exchanges rates), the extent of exchange rate misalignment, past volatility in exchange rate, foreign exchange reserves, and six- month-ahead rollover need.
The results suggest that foreign exchange interventions are effective in slowing the pace of depreciation when inflation is low, the currency is not overvalued, and reserves are adequate (Figure 23). In fact we find that if reserves are not adequate, selling foreign exchange can be destabilizing, and can lead to a faster pace of depreciation. This result is consistent with the empirical literature on foreign exchange intervention, which in general provides some support for intervention in helping slow the rate of change in the exchange rate.21 The analysis also indicates that the effectiveness of intervention in slowing the pace of depreciation depends on the level of uncertainty in global markets. In particular, the results indicate that when the VIX is above the 75th percentile, the smoothing effect of intervention on exchange rate depreciation pressure stops being statistically significant. In other words, when markets panic, intervention provides little or no help.
LESSONS GOING FORWARD Markets reassess emerging markets’ fundamentals as global conditions change. The global financial system remains far from normal, and the transition path to a sustainable system is not yet risk-free. Indeed, occasional spikes in market volatility since the taper talk in May of 2013 serve as an important reminder. Such bumps during the monetary normalization process can be costly both at 21 Intervention was found to be effective by Sarno and Taylor (2001) for AEs during “periods of high reputation and heavy sterilized intervention” (p. 854), and “if it is publicly announced and concerted” (p. 855), and by Dominguez (2003) for the United States, Japan, and Germany in influencing foreign exchange returns and volatility. Adler and Tovar (2011) find that, for EMs, intervention during episodes of appreciation pressure affects the pace of appreciation but not the level of the exchange rate. Kohlscheen and Andrade (2013) use high-frequency data of foreign exchange and official currency swap auctions in Brazil and demonstrate that public auctions have an economically and statistically significant effect on the foreign exchange rate. In a more general survey of the effectiveness of intervention in EMs, Ostry, Ghosh, and Chamon (2012, p. 12) find that the evidence on the effectiveness of sterilized intervention in EMs is mixed, but generally more favorable than in the advanced economy context.
Figure 23. Effectiveness of Foreign Exchange Intervention
Note: Green check marks represent instances where policy actions had a dampening effect on the selected asset price. Red cross represents instances where policy actions did not have or had a worsening impact on the selected asset price. Source: IMF staff estimates.
Depreciation Pace of
Depreciation
Low reserves
High reserves VIX
25th - 75th percentile Above 75th percentile
Tightening of MPPs
REER overvaluation
Higher inflation in previous year
Gross reserves/GDP
Episodes: FX Selling Interventions: All (2004-13)
Effect on FX Selling Intervention
(improving effectiveness: +)
More Open Capital Account
IMF STAFF DISCUSSION NOTE
INTERNATIONAL MONETARY FUND 25
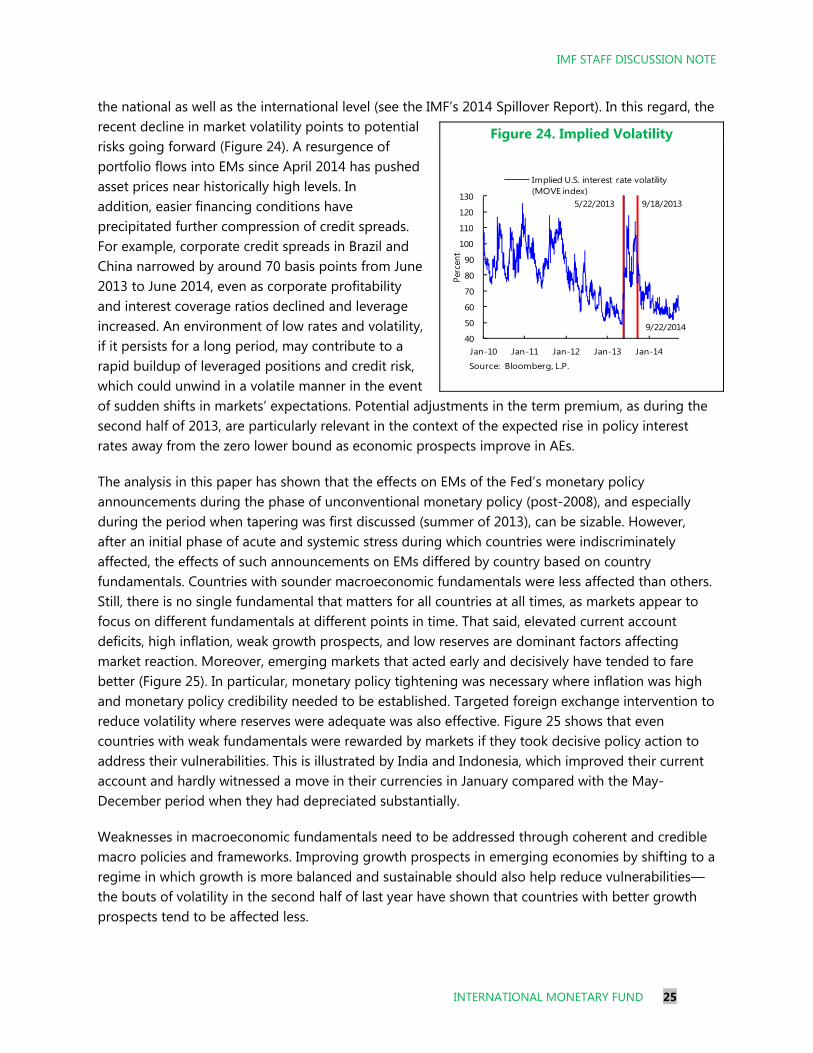
the national as well as the international level (see the IMF’s 2014 Spillover Report). In this regard, the recent decline in market volatility points to potential risks going forward (Figure 24). A resurgence of portfolio flows into EMs since April 2014 has pushed asset prices near historically high levels. In addition, easier financing conditions have precipitated further compression of credit spreads. For example, corporate credit spreads in Brazil and China narrowed by around 70 basis points from June 2013 to June 2014, even as corporate profitability and interest coverage ratios declined and leverage increased. An environment of low rates and volatility, if it persists for a long period, may contribute to a rapid buildup of leveraged positions and credit risk, which could unwind in a volatile manner in the event of sudden shifts in markets’ expectations. Potential adjustments in the term premium, as during the second half of 2013, are particularly relevant in the context of the expected rise in policy interest rates away from the zero lower bound as economic prospects improve in AEs.
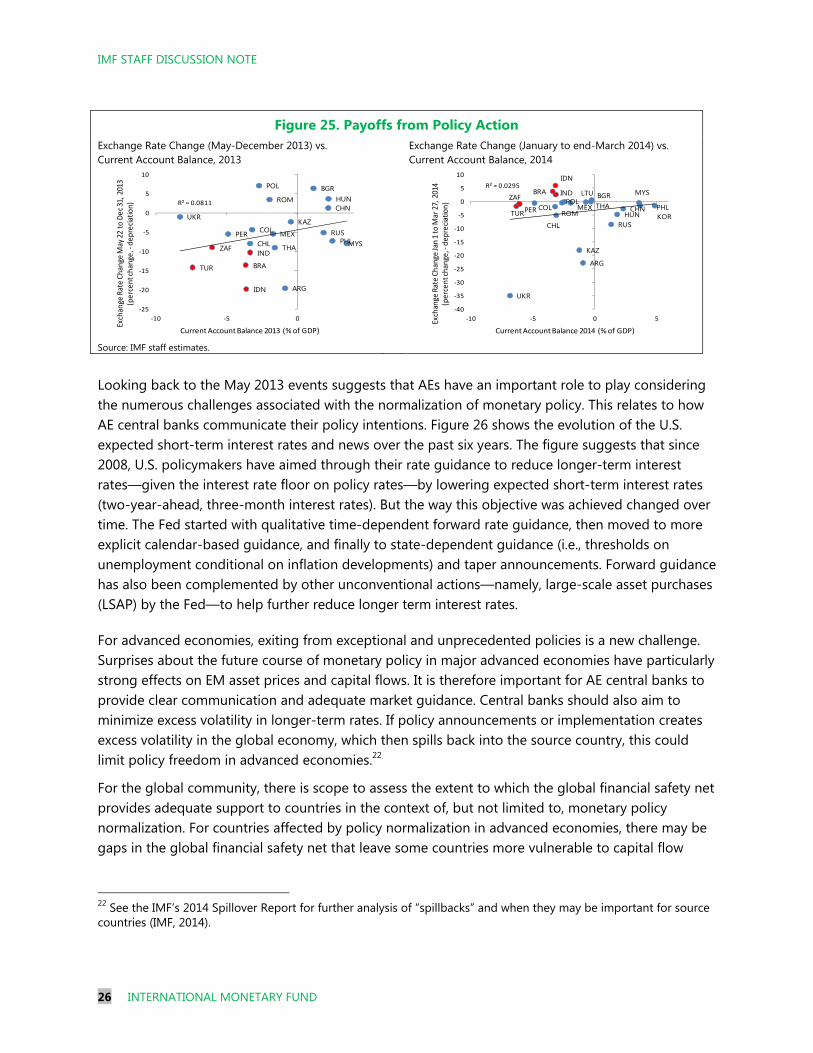
The analysis in this paper has shown that the effects on EMs of the Fed’s monetary policy announcements during the phase of unconventional monetary policy (post-2008), and especially during the period when tapering was first discussed (summer of 2013), can be sizable. However, after an initial phase of acute and systemic stress during which countries were indiscriminately affected, the effects of such announcements on EMs differed by country based on country fundamentals. Countries with sounder macroeconomic fundamentals were less affected than others. Still, there is no single fundamental that matters for all countries at all times, as markets appear to focus on different fundamentals at different points in time. That said, elevated current account deficits, high inflation, weak growth prospects, and low reserves are dominant factors affecting market reaction. Moreover, emerging markets that acted early and decisively have tended to fare better (Figure 25). In particular, monetary policy tightening was necessary where inflation was high and monetary policy credibility needed to be established. Targeted foreign exchange intervention to reduce volatility where reserves were adequate was also effective. Figure 25 shows that even countries with weak fundamentals were rewarded by markets if they took decisive policy action to address their vulnerabilities. This is illustrated by India and Indonesia, which improved their current account and hardly witnessed a move in their currencies in January compared with the May-December period when they had depreciated substantially.
Weaknesses in macroeconomic fundamentals need to be addressed through coherent and credible macro policies and frameworks. Improving growth prospects in emerging economies by shifting to a regime in which growth is more balanced and sustainable should also help reduce vulnerabilities—the bouts of volatility in the second half of last year have shown that countries with better growth prospects tend to be affected less.
Figure 24. Implied Volatility
40
50
60
70
80
90
100
110
120
130
Jan-10 Jan-11 Jan-12 Jan-13 Jan-14
Perc
ent
Implied U.S. interest rate volatility (MOVE index)
9/22/2014
9/18/20135/22/2013
Source: Bloomberg, L.P.
IMF STAFF DISCUSSION NOTE
26 INTERNATIONAL MONETARY FUND
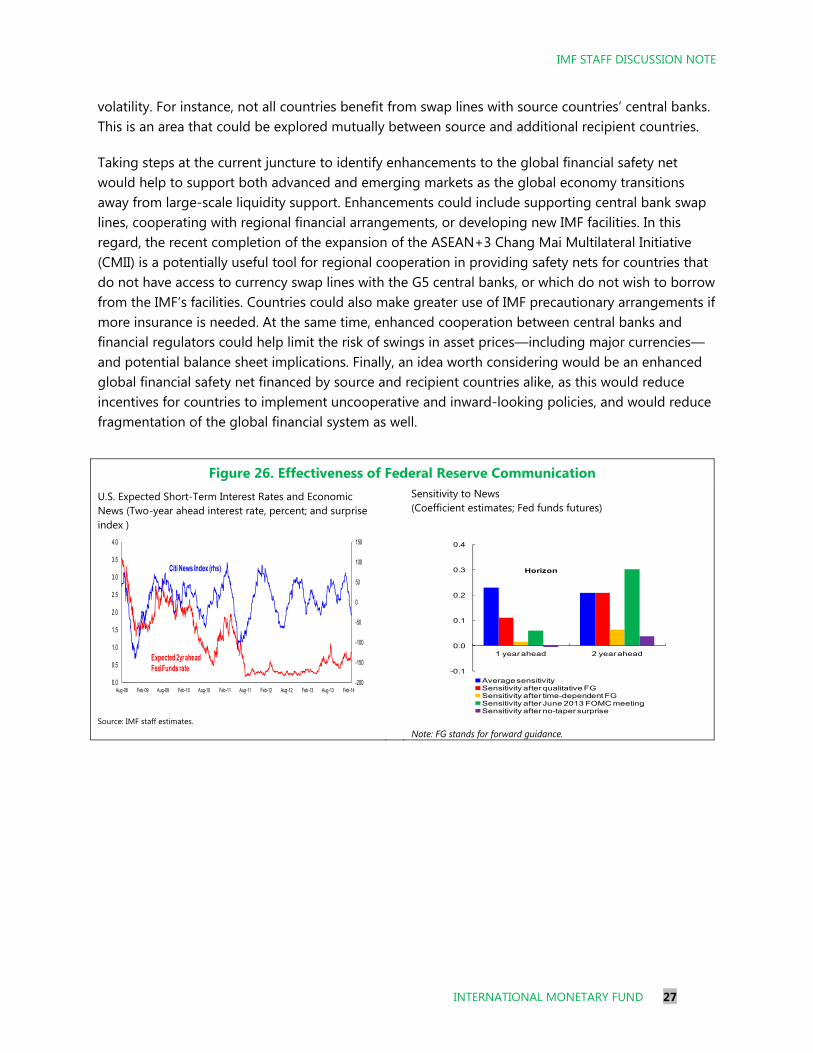
Looking back to the May 2013 events suggests that AEs have an important role to play considering the numerous challenges associated with the normalization of monetary policy. This relates to how AE central banks communicate their policy intentions. Figure 26 shows the evolution of the U.S. expected short-term interest rates and news over the past six years. The figure suggests that since 2008, U.S. policymakers have aimed through their rate guidance to reduce longer-term interest rates—given the interest rate floor on policy rates—by lowering expected short-term interest rates (two-year-ahead, three-month interest rates). But the way this objective was achieved changed over time. The Fed started with qualitative time-dependent forward rate guidance, then moved to more explicit calendar-based guidance, and finally to state-dependent guidance (i.e., thresholds on unemployment conditional on inflation developments) and taper announcements. Forward guidance has also been complemented by other unconventional actions—namely, large-scale asset purchases (LSAP) by the Fed—to help further reduce longer term interest rates.
For advanced economies, exiting from exceptional and unprecedented policies is a new challenge. Surprises about the future course of monetary policy in major advanced economies have particularly strong effects on EM asset prices and capital flows. It is therefore important for AE central banks to provide clear communication and adequate market guidance. Central banks should also aim to minimize excess volatility in longer-term rates. If policy announcements or implementation creates excess volatility in the global economy, which then spills back into the source country, this could limit policy freedom in advanced economies.22
For the global community, there is scope to assess the extent to which the global financial safety net provides adequate support to countries in the context of, but not limited to, monetary policy normalization. For countries affected by policy normalization in advanced economies, there may be gaps in the global financial safety net that leave some countries more vulnerable to capital flow
22 See the IMF’s 2014 Spillover Report for further analysis of “spillbacks” and when they may be important for source countries (IMF, 2014).
Figure 25. Payoffs from Policy Action Exchange Rate Change (May-December 2013) vs. Current Account Balance, 2013
Exchange Rate Change (January to end-March 2014) vs. Current Account Balance, 2014
Source: IMF staff estimates.
CHN
IND
IDN
BRA
MEX
HUN
POL
RUS
TUR
ZAFMYSPHL
THACHL
COLPER
BGR
KAZ
ROM
UKR
ARG
R² = 0.0811
-25
-20
-15
-10
-5
0
5
10
-10 -5 0
Current Account Balance 2013 (% of GDP)
Exch
ange
Rat
e C
han
ge M
ay 2
2 to
De
c 31
, 20
13(p
erc
en
t ch
ange
, -d
ep
reci
atio
n)
CHN
IND
IDN
BRA
MEXHUN
POL
RUSTUR
ZAF
KOR
MYS
PHLTHA
CHL
COLPER
BGR
KAZ
LTU
ROM
UKR
ARG
R² = 0.0295
-40
-35
-30
-25
-20
-15
-10
-5
0
5
10
-10 -5 0 5
Current Account Balance 2014 (% of GDP)
Exch
ange
Rat
e C
han
ge Ja
n 1
to
Mar
27,
201
4(p
erc
en
t ch
ange
, -d
ep
reci
atio
n)
IMF STAFF DISCUSSION NOTE
INTERNATIONAL MONETARY FUND 27
volatility. For instance, not all countries benefit from swap lines with source countries’ central banks. This is an area that could be explored mutually between source and additional recipient countries.
Taking steps at the current juncture to identify enhancements to the global financial safety net would help to support both advanced and emerging markets as the global economy transitions away from large-scale liquidity support. Enhancements could include supporting central bank swap lines, cooperating with regional financial arrangements, or developing new IMF facilities. In this regard, the recent completion of the expansion of the ASEAN+3 Chang Mai Multilateral Initiative (CMII) is a potentially useful tool for regional cooperation in providing safety nets for countries that do not have access to currency swap lines with the G5 central banks, or which do not wish to borrow from the IMF’s facilities. Countries could also make greater use of IMF precautionary arrangements if more insurance is needed. At the same time, enhanced cooperation between central banks and financial regulators could help limit the risk of swings in asset prices—including major currencies—and potential balance sheet implications. Finally, an idea worth considering would be an enhanced global financial safety net financed by source and recipient countries alike, as this would reduce incentives for countries to implement uncooperative and inward-looking policies, and would reduce fragmentation of the global financial system as well.
Figure 26. Effectiveness of Federal Reserve Communication U.S. Expected Short-Term Interest Rates and Economic News (Two-year ahead interest rate, percent; and surprise index )
Sensitivity to News (Coefficient estimates; Fed funds futures)
Source: IMF staff estimates.
Note: FG stands for forward guidance.
-200
-150
-100
-50
0
50
100
150
0.0
0.5
1.0
1.5
2.0
2.5
3.0
3.5
4.0
Aug-08 Feb-09 Aug-09 Feb-10 Aug-10 Feb-11 Aug-11 Feb-12 Aug-12 Feb-13 Aug-13 Feb-14
Expected 2yr ahead Fed Funds rate
Citi News Index (rhs)
-0.1
0.0
0.1
0.2
0.3
0.4
1 year ahead 2 year ahead
Horizon
Average sensitivitySensitivity after qualitative FGSensitivity after time-dependent FGSensitivity after June 2013 FOMC meetingSensitivity after no-taper surprise
IMF STAFF DISCUSSION NOTE
28 INTERNATIONAL MONETARY FUND
REFERENCES
Adler, Gustavo, and Camilo Tovar, “Foreign Exchange Intervention: A Shield Against Appreciation Winds?” IMF Working Paper 11/165 (Washington: International Monetary Fund).
Ahmed, Shaghil, and Andrei Zlate, 2013, “Capital Flows to Emerging Market Economies: A Brave New World?” International Finance Discussion Papers, Board of Governors of the Federal Reserve System, Number 1081. Bi, Ran, Silvia Sgherri, and Papa N’Diaye, 2014, “Policy Responses to the May 2013 Market Jitters:
What Worked and What Did Not Work?” IMF Working Paper, Forthcoming.
Bowman David, Juan M. Londono, and Horacio Sapriza, 2014, ”U.S. Unconventional Monetary Policy and Transmission to Emerging Market Economies,” International Finance Discussion Papers, No. 1109, Board of Governors of the Federal Reserve System.
Chen, Jiaqan, Tommaso Mancini-Griffoli, and Ratna Sahay, 2014, “Spillovers from U.S. Monetary
Policy on Emerging Markets: Different this Time?” IMF Working Paper, forthcoming. Cubeddu, L., A. Culiuc, Ghada Fayad, Yuan Gao, Kalpana Kochhar, Ayhan Kyobe, Ceyda Oner,
Roberto Perrelli, Sarah Sanya, Evridiki Tsounta, and Zhongxia Zhang, 2014, “Emerging Markets in Transition: Growth Prospects and Challenges,” Staff Discussion Note 14/6 (Washington: International Monetary Fund).
Dominguez, Kathryn, 2003, “The Market Microstructure of Central Bank Intervention,” Journal of International Economics, Vol. 59, 25-45.
Ghosh, Atish R., Jun Kim, Mahvash S. Qureshi, and Juan Zalduendo, 2012, “Surges,” IMF Working Paper12/22 (Washington: International Monetary Fund).
International Monetary, Fund (IMF), 2013a, “Unconventional Monetary Policies––Recent Experience and Prospects,” April 18. http://www.imf.org/external/np/pp/eng/2013/041813a.pdf.
International Monetary, Fund (IMF), 2013b, “Assessing Reserves Adequacy—Further Considerations,” IMF Policy Paper, 13 November. http://www.imf.org/external/np/pp/eng/2013/111313d.pdf.
International Monetary, Fund (IMF), 2014, “IMF 2014 Spillover Report,” July 29. http://www.imf.org/external/np/pp/eng/2014/062514.pdf.
Kohlscheen, Emanuel, and Sandro C. Andrade, 2013, “Official Interventions through Derivatives: Affecting the Demand for Foreign Exchange,” Banco Central do Brazil Working Paper 317. Mishra, Prachi, Kenji Moriyama, Papa N’Diaye, and Lam Nguyen, 2014, “Impact of Fed Tapering
IMF STAFF DISCUSSION NOTE
INTERNATIONAL MONETARY FUND 29
Announcements on Emerging Markets,” IMF Working Paper 14/109 (Washington: International Monetary Fund).
Ostry, Jonathan D., Atish R. Ghosh, and Marcos Chamon, 2012, “Two Targets, Two Instruments: Monetary and Exchange Rate Policies in Emerging Market Economies,” IMF Staff Discussion Note 12/01 (Washington: International Monetary Fund).
Sarno, Lucio, and Mark Taylor, 2001, “Official Intervention in the Foreign Exchange Market: Is it Effective and, If So, How Does It Work?” Journal of Economic Literature Vol. 39,
pp. 839-68.


![[Hujan019] {tantrum} - {tantrum} EP](https://img.pdfslide.net/doc/110x75/6183d39743640155611677c9/hujan019-tantrum-tantrum-ep.jpg)