Embed Size (px)
Citation preview

A
A 2001604315/505816_0/505816/399861
Cover-Full Image-InsideWMCNONO
Emerging Markets Systematic Equity
Wellington Management Company LLP
Water & Power Employees’ Retirement Plan
22 May 2019Michael P. McElroy, CFA Managing Director and Investment Director, Equity Product Management Charles C. Ruch, CFA Managing Director and Relationship Manager
Copyright © 2017 All Rights Reserved2001070596/451746_0/451746/451746A
A
Representing Wellington ManagementTitle Line 2
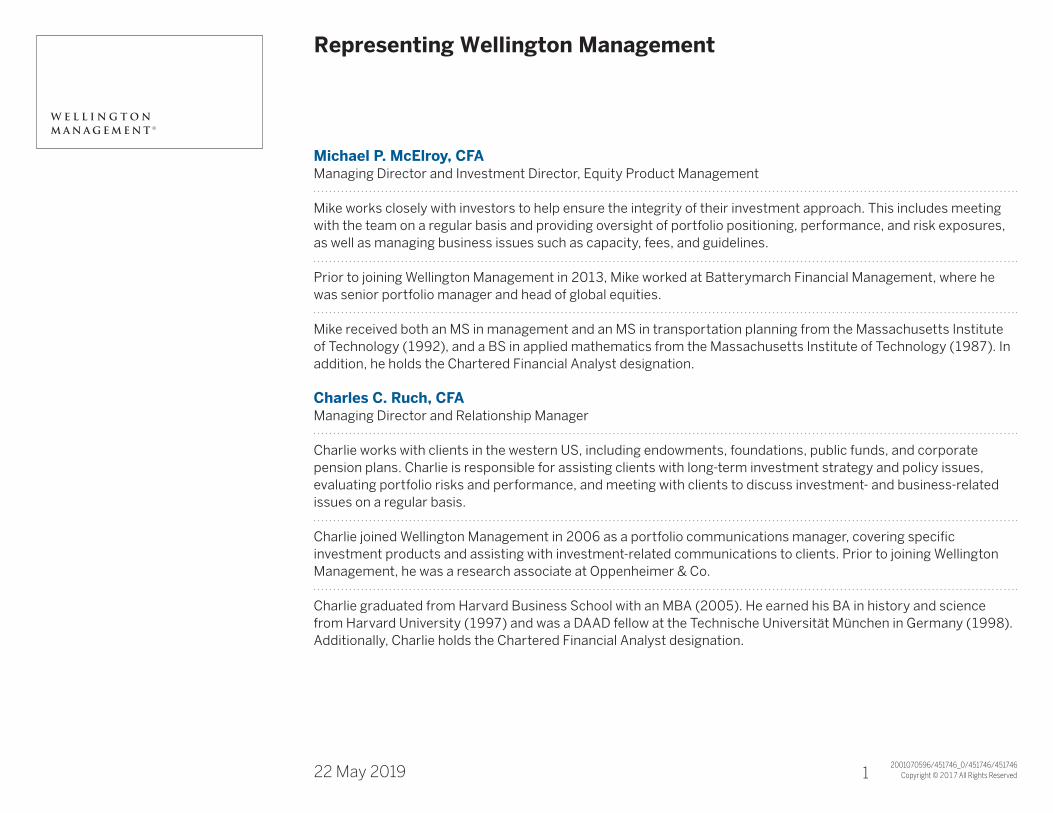
Michael P. McElroy, CFAManaging Director and Investment Director, Equity Product Management
Mike works closely with investors to help ensure the integrity of their investment approach. This includes meeting with the team on a regular basis and providing oversight of portfolio positioning, performance, and risk exposures, as well as managing business issues such as capacity, fees, and guidelines.
Prior to joining Wellington Management in 2013, Mike worked at Batterymarch Financial Management, where he was senior portfolio manager and head of global equities.
Mike received both an MS in management and an MS in transportation planning from the Massachusetts Institute of Technology (1992), and a BS in applied mathematics from the Massachusetts Institute of Technology (1987). In addition, he holds the Chartered Financial Analyst designation.
Charles C. Ruch, CFAManaging Director and Relationship Manager
Charlie works with clients in the western US, including endowments, foundations, public funds, and corporate pension plans. Charlie is responsible for assisting clients with long-term investment strategy and policy issues, evaluating portfolio risks and performance, and meeting with clients to discuss investment- and business-related issues on a regular basis.
Charlie joined Wellington Management in 2006 as a portfolio communications manager, covering specific investment products and assisting with investment-related communications to clients. Prior to joining Wellington Management, he was a research associate at Oppenheimer & Co.
Charlie graduated from Harvard Business School with an MBA (2005). He earned his BA in history and science from Harvard University (1997) and was a DAAD fellow at the Technische Universität München in Germany (1998). Additionally, Charlie holds the Chartered Financial Analyst designation.
A
A22 May 2019 A1 1

Copyright © 2019 All Rights Reserved2000635965/504341_0/G1039/G1039
A
A22 May 2019
A trusted advisor and strategic partner to clients worldwideTitle Line 2
As of 31 March 2019 | 1E�ective as of 1 January 2019
BY THE NUMBERS
Business
USD 1,072 billion of client assetsunder management
2,200+ clients
60+ countries in which clients are based
People and portfolios
806 investment professionals
17 years of experience, on average
168 partners all active at the firm1
Heritage: key dates
1928 Wellington Fund – the firstUS balanced fund
1979 Establishment of ourprivate partnership
1994 Our first long – shortstrategy
2014 Our first dedicated privateequity strategy
2015 Global Impact: Our first diversified impact investing strategy in public equities
OWNERSHIP MODEL
Long-term perspective of a private partnership structure
Attract and retaininvestment talent
Independent: No public shareholders, no outside capital
Interests aligned with clients
BUSINESS MODEL
Singular focus oninvestment management
Diversi�cation by asset class, geography, and client type
Research for clientbene�t only
Commitment to bringing the right resources to each client
INVESTMENT MODEL
Comprehensive capabilities
Rigorous proprietary research
Career analysts
Global resources
Empowered portfolio teams
CULTURE
Open, collaborative
Performance driven
Professional/collegial
High standards, ethics,and integrity
Global diversity and inclusion
Contributors to �rm
sustainability
A1 2
Copyright © 2019 All Rights Reserved
A
A22 May 2019
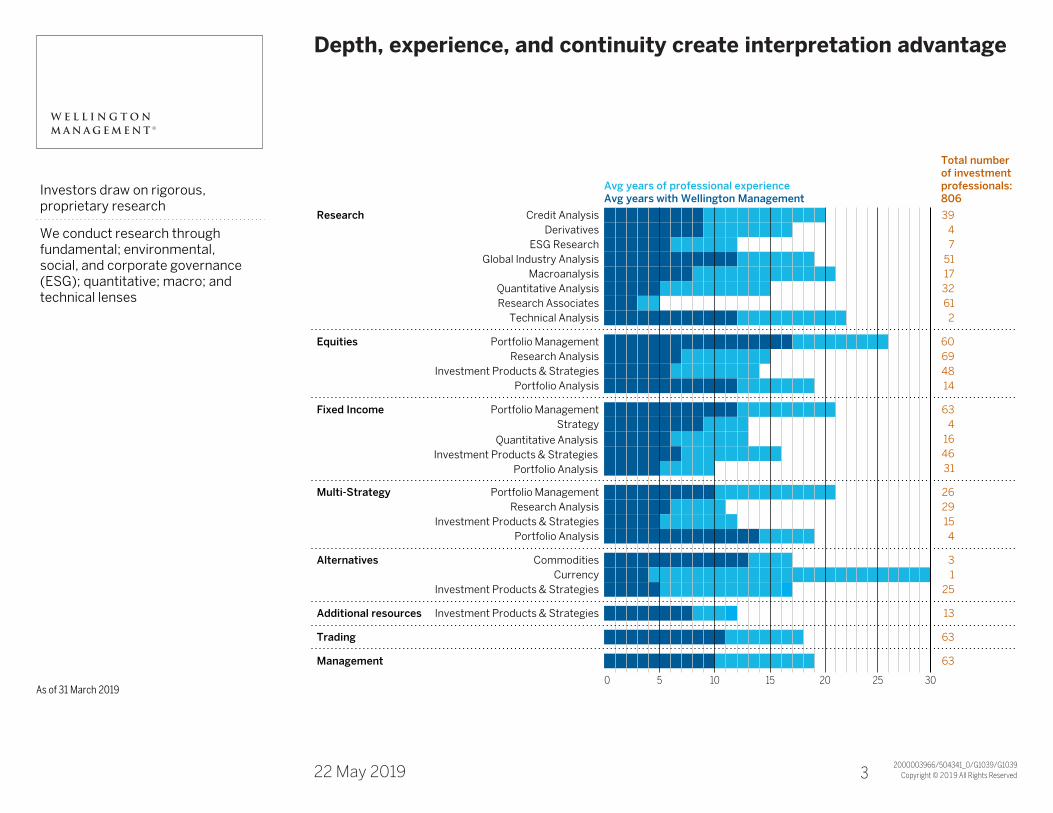
Depth, experience, and continuity create interpretation advantageTitle Line 2
2000003966/504341_0/G1039/G1039
As of 31 March 2019
Investors draw on rigorous, proprietary research
We conduct research through fundamental; environmental,social, and corporate governance (ESG); quantitative; macro; and technical lenses
Avg years of professional experienceAvg years with Wellington Management
Total numberof investmentprofessionals: 806
Research Credit Analysis 39Derivatives 4
ESG Research 7Global Industry Analysis 51
Macroanalysis 17Quantitative Analysis 32Research Associates 61
Technical Analysis 2
Equities Portfolio Management 60Research Analysis 69
Investment Products & Strategies 48Portfolio Analysis 14
Fixed Income Portfolio Management 63Strategy 4
Quantitative Analysis 16Investment Products & Strategies 46
Portfolio Analysis 31
Multi-Strategy Portfolio Management 26Research Analysis 29
Investment Products & Strategies 15Portfolio Analysis 4
Alternatives Commodities 3Currency 1
Investment Products & Strategies 25
Additional resources Investment Products & Strategies 13
Trading 63
Management 63
0 5 10 15 20 25 30
A1 3
Copyright © 2019 All Rights Reserved2000635968/505816_0/G2911/G2911
A
A22 May 2019
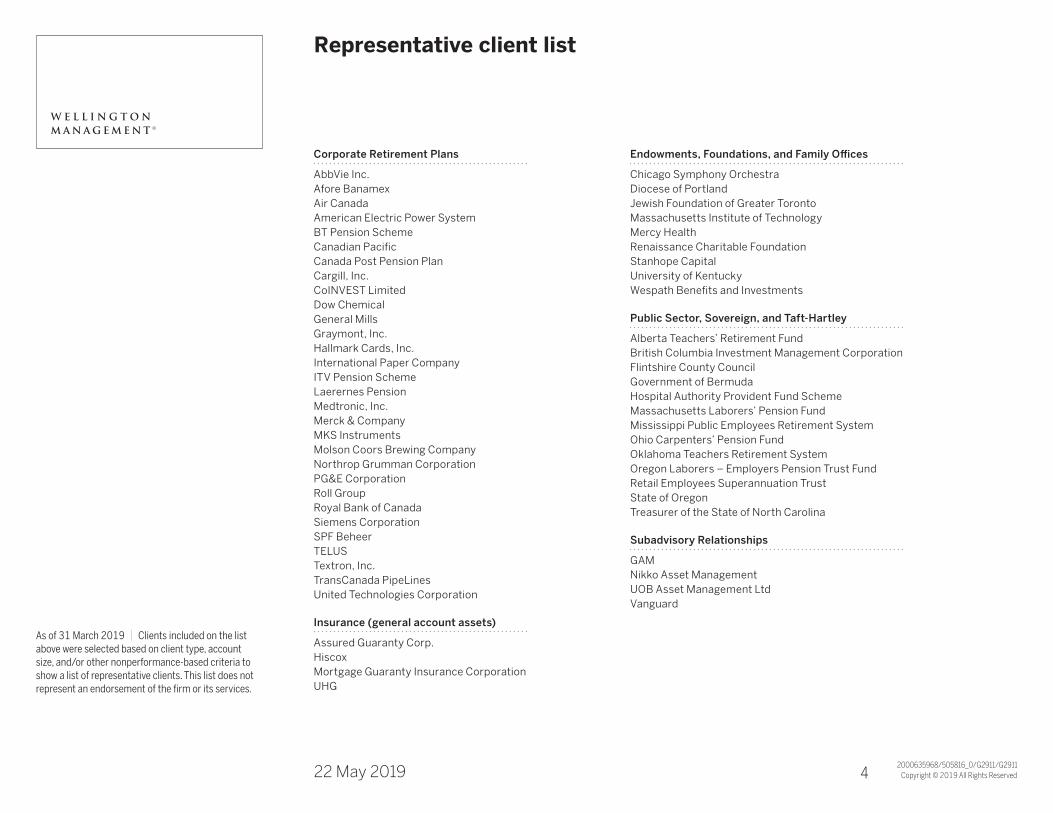
Representative client listTitle Line 2
As of 31 March 2019 | Clients included on the list above were selected based on client type, account size, and/or other nonperformance-based criteria to show a list of representative clients. This list does not represent an endorsement of the firm or its services.
Corporate Retirement Plans
AbbVie Inc.Afore BanamexAir CanadaAmerican Electric Power SystemBT Pension SchemeCanadian PacificCanada Post Pension PlanCargill, Inc.CoINVEST LimitedDow ChemicalGeneral MillsGraymont, Inc.Hallmark Cards, Inc.International Paper CompanyITV Pension SchemeLaerernes PensionMedtronic, Inc.Merck & CompanyMKS InstrumentsMolson Coors Brewing CompanyNorthrop Grumman CorporationPG&E CorporationRoll GroupRoyal Bank of CanadaSiemens CorporationSPF BeheerTELUSTextron, Inc.TransCanada PipeLinesUnited Technologies Corporation
Insurance (general account assets)
Assured Guaranty Corp.HiscoxMortgage Guaranty Insurance CorporationUHG
Endowments, Foundations, and Family Offices
Chicago Symphony OrchestraDiocese of PortlandJewish Foundation of Greater TorontoMassachusetts Institute of TechnologyMercy HealthRenaissance Charitable FoundationStanhope CapitalUniversity of KentuckyWespath Benefits and Investments
Public Sector, Sovereign, and Taft-Hartley
Alberta Teachers’ Retirement FundBritish Columbia Investment Management CorporationFlintshire County CouncilGovernment of BermudaHospital Authority Provident Fund SchemeMassachusetts Laborers’ Pension FundMississippi Public Employees Retirement SystemOhio Carpenters’ Pension FundOklahoma Teachers Retirement SystemOregon Laborers – Employers Pension Trust FundRetail Employees Superannuation TrustState of OregonTreasurer of the State of North Carolina
Subadvisory Relationships
GAMNikko Asset ManagementUOB Asset Management LtdVanguard
A1 4

Copyright © 2019 All Rights Reserved2001607313/505816_0/505816/451746A
A
Los Angeles Department of Water and PowerTitle Line 2Relationship review
Investment assignment Emerging Markets Systematic Equity
Portfolio inception 30 September 2016
Relationship team Charles Ruch, CFA; Stephen Crisan, CFA
31 March 2019 Market values
Employees’ Retirement Plan portfolio $327.7 million
Retiree Health Benefits Fund portfolio 54.5 million
EMSE – total strategy AUM 3.3 billion
Wellington – total firm AUM 1,072 billion
A
A22 May 2019 A1 5
Copyright © 2019 All Rights Reserved2001583675/497514_0/411669/411669A
-
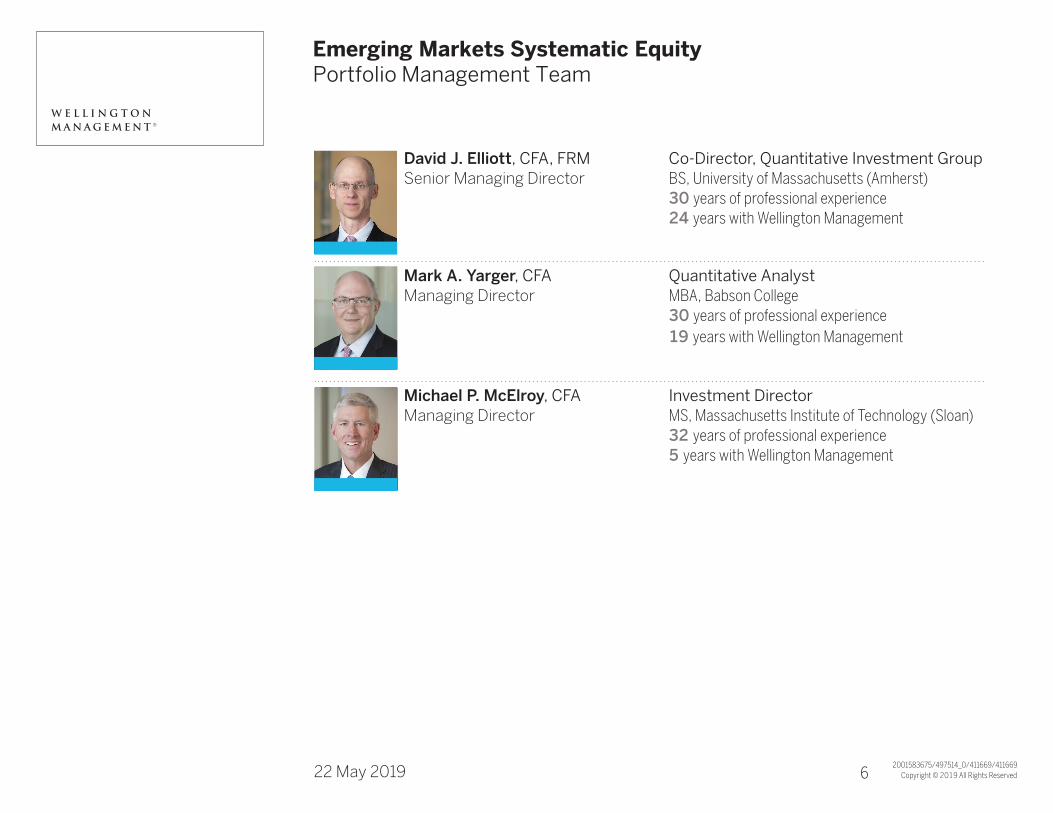
Title Line 1Title Line 2Portfolio Management TeamEmerging Markets Systematic Equity
David J. Elliott, CFA, FRM Co-Director, Quantitative Investment Group Senior Managing Director BS, University of Massachusetts (Amherst) 30 years of professional experience 24 years with Wellington Management
Mark A. Yarger, CFA Quantitative AnalystManaging Director MBA, Babson College 30 years of professional experience 19 years with Wellington Management
Michael P. McElroy, CFA Investment DirectorManaging Director MS, Massachusetts Institute of Technology (Sloan) 32 years of professional experience 5 years with Wellington Management
-
_22 May 2019 A1 6
Copyright © 2019 All Rights Reserved2001583676/497514_0/411669/411669A
-
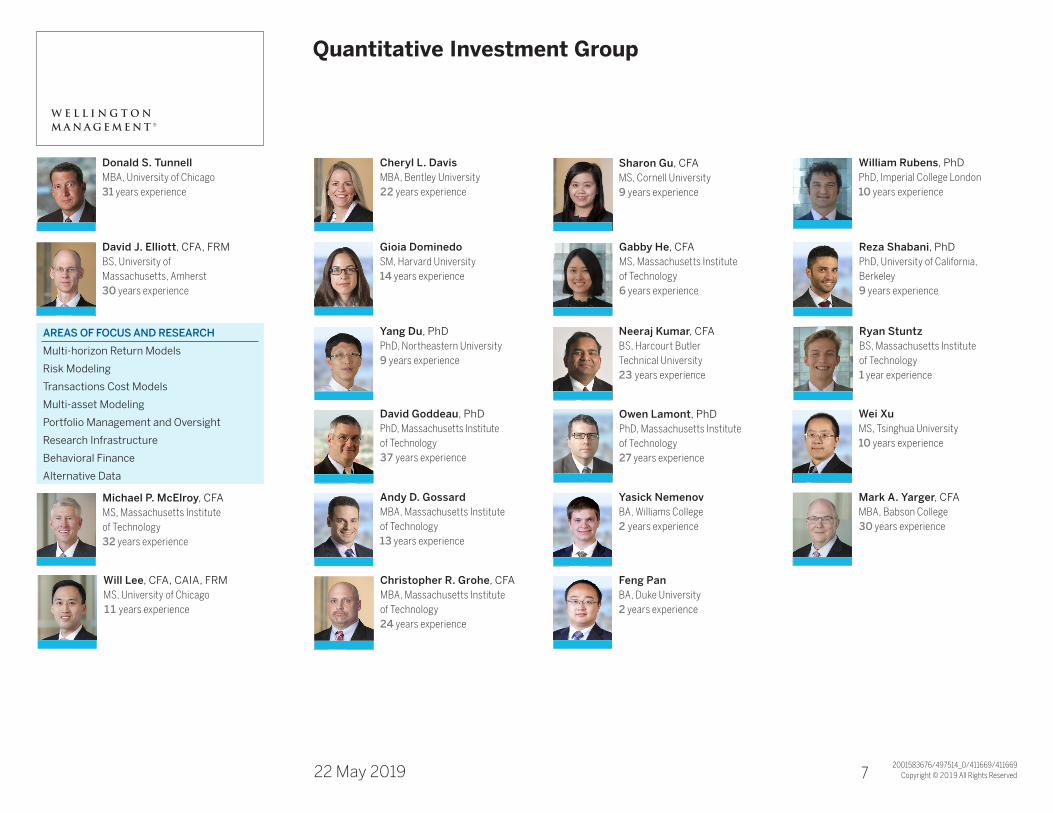
Title Line 1Title Line 2Quantitative Investment Group
Christopher R. Grohe, CFAMBA, Massachusetts Institute of Technology24 years experience
Feng PanBA, Duke University 2 years experience
Will Lee, CFA, CAIA, FRMMS, University of Chicago11 years experience
Michael P. McElroy, CFAMS, Massachusetts Institute of Technology32 years experience
Yasick Nemenov BA, Williams College 2 years experience
Mark A. Yarger, CFAMBA, Babson College30 years experience
Andy D. GossardMBA, Massachusetts Institute of Technology13 years experience
Neeraj Kumar, CFA BS, Harcourt Butler Technical University 23 years experience
Ryan StuntzBS, Massachusetts Institute of Technology 1 year experience
Yang Du, PhDPhD, Northeastern University9 years experience
Donald S. TunnellMBA, University of Chicago31 years experience
William Rubens, PhDPhD, Imperial College London 10 years experience
Sharon Gu, CFAMS, Cornell University9 years experience
Cheryl L. DavisMBA, Bentley University22 years experience
Owen Lamont, PhDPhD, Massachusetts Institute of Technology27 years experience
David Goddeau, PhDPhD, Massachusetts Institute of Technology37 years experience
Wei XuMS, Tsinghua University10 years experience
Gabby He, CFAMS, Massachusetts Institute of Technology6 years experience
Reza Shabani, PhDPhD, University of California, Berkeley 9 years experience
David J. Elliott, CFA, FRMBS, University of Massachusetts, Amherst 30 years experience
Gioia DominedoSM, Harvard University 14 years experience
AREAS OF FOCUS AND RESEARCHMulti-horizon Return Models
Risk Modeling
Transactions Cost Models
Multi-asset Modeling
Portfolio Management and Oversight
Research Infrastructure
Behavioral Finance
Alternative Data
-
_22 May 2019 A1 7

Copyright © 2019 All Rights Reserved2001578486/497514_0/411669/411669A
-
Title Line 1Title Line 2
Tmpl 1.6
1 April 2019 page 2 Copyright © 2019 All Rights Reserved
P0000014935
S0000003631/S0000003689
PPT/
Emerging Markets Systematic Equity (EMSE)What role can EMSE play and what is our competitive advantage?
PAST RESULTS ARE NOT NECESSARILY INDICATIVE OF FUTURE RESULTS AND AN INVESTMENT CAN LOSE VALUE. Based on the net performance of the Emerging Markets Systematic Equity Composite since inception
on 30 September 2009. The inception date of the Wellington Emerging Markets Systematic Equity Fund is 23 November 2015. See performance pages
enclosed for full details
Why should clients consider EMSE? Employs a systematic approach to investing in emerging markets equities
Systematic approaches have historically been effective in emerging markets
Low alpha correlation with other emerging markets approaches
Consistent historical performance across a range of market environments
What is our competitive advantage? Contextual alpha model
Uses a proprietary framework to weight factors at the stock level based on company-specific indicators
Risk management
A holistic approach based on EM-specific risk drivers, which considers both historical and forward-looking indicators; enables portfolio risk to be focused on stock-specific drivers and allows for more responsive risk adjustments
Transaction cost management
EM costs average about twice those of developed markets; model integrates cost considerations into every trading decision
-
_22 May 2019 A1 8
Copyright © 2019 All Rights Reserved2001583674/497514_0/411669/411669A
-
Title Line 1Title Line 2Emerging Markets Systematic EquityInvestment philosophy, approach, and objective
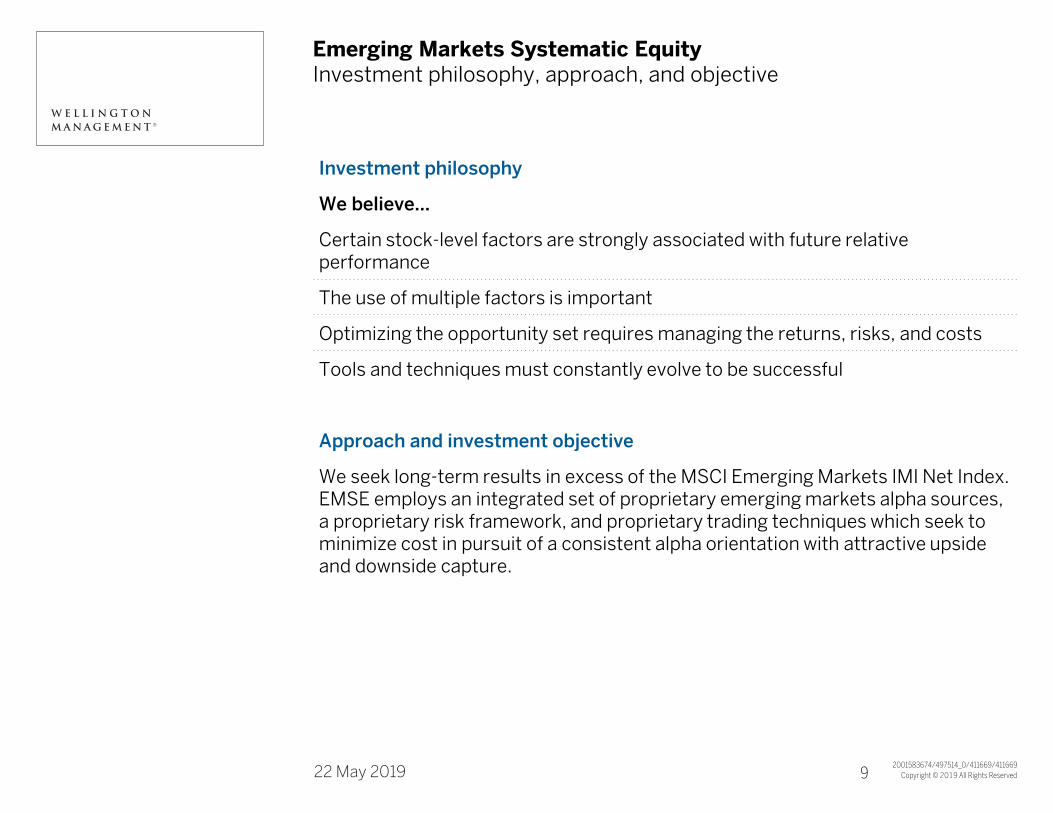
Investment philosophy
We believe…
Certain stock-level factors are strongly associated with future relative performance
The use of multiple factors is important
Optimizing the opportunity set requires managing the returns, risks, and costs
Tools and techniques must constantly evolve to be successful
Approach and investment objective
We seek long-term results in excess of the MSCI Emerging Markets IMI Net Index. EMSE employs an integrated set of proprietary emerging markets alpha sources, a proprietary risk framework, and proprietary trading techniques which seek to minimize cost in pursuit of a consistent alpha orientation with attractive upside and downside capture.
-
_22 May 2019 A1 9
Copyright © 2019 All Rights Reserved2001583677/497514_0/411669/411669A
-
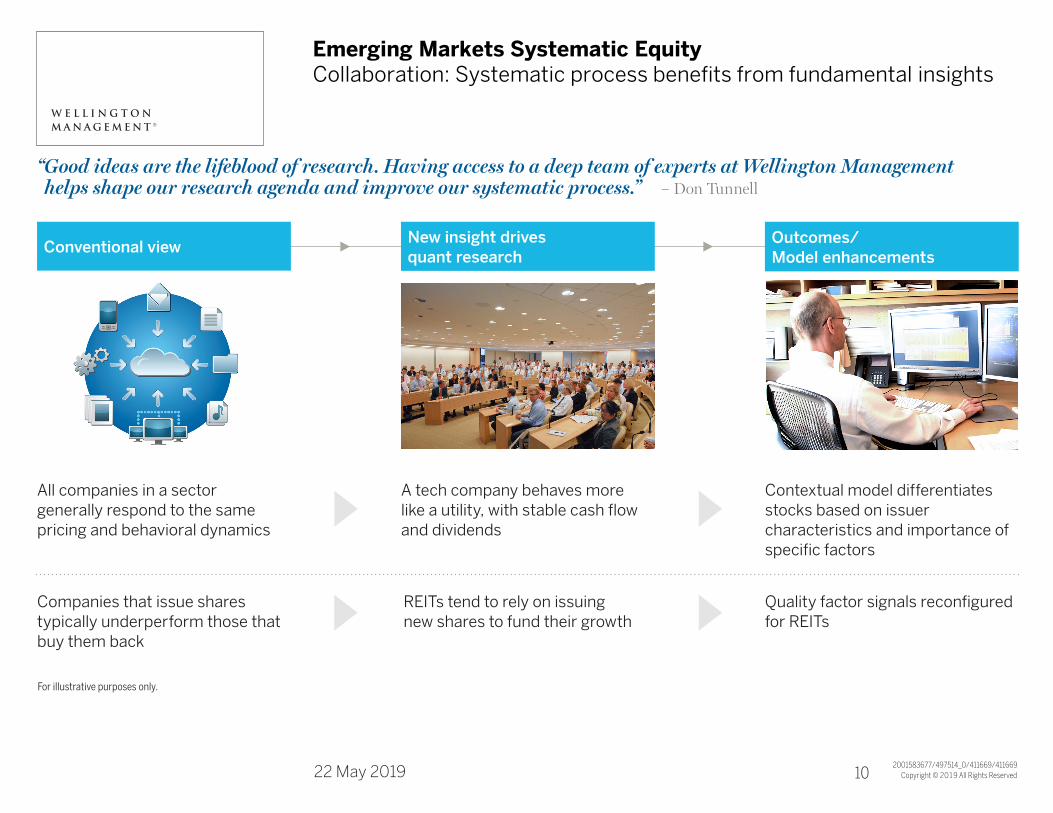
Title Line 1Title Line 2Collaboration: Systematic process benefits from fundamental insightsEmerging Markets Systematic Equity
Outcomes/ Model enhancements
Quality factor signals reconfigured for REITs
Contextual model differentiates stocks based on issuer characteristics and importance of specific factors
New insight drives quant research
REITs tend to rely on issuing new shares to fund their growth
A tech company behaves more like a utility, with stable cash flow and dividends
“ Good ideas are the lifeblood of research. Having access to a deep team of experts at Wellington Management helps shape our research agenda and improve our systematic process.” – Don Tunnell
Conventional view
Companies that issue shares typically underperform those that buy them back
All companies in a sector generally respond to the same pricing and behavioral dynamics
For illustrative purposes only.
-
_22 May 2019 A1 10
Copyright © 2019 All Rights Reserved2001583679/497514_0/411669/411669A
-
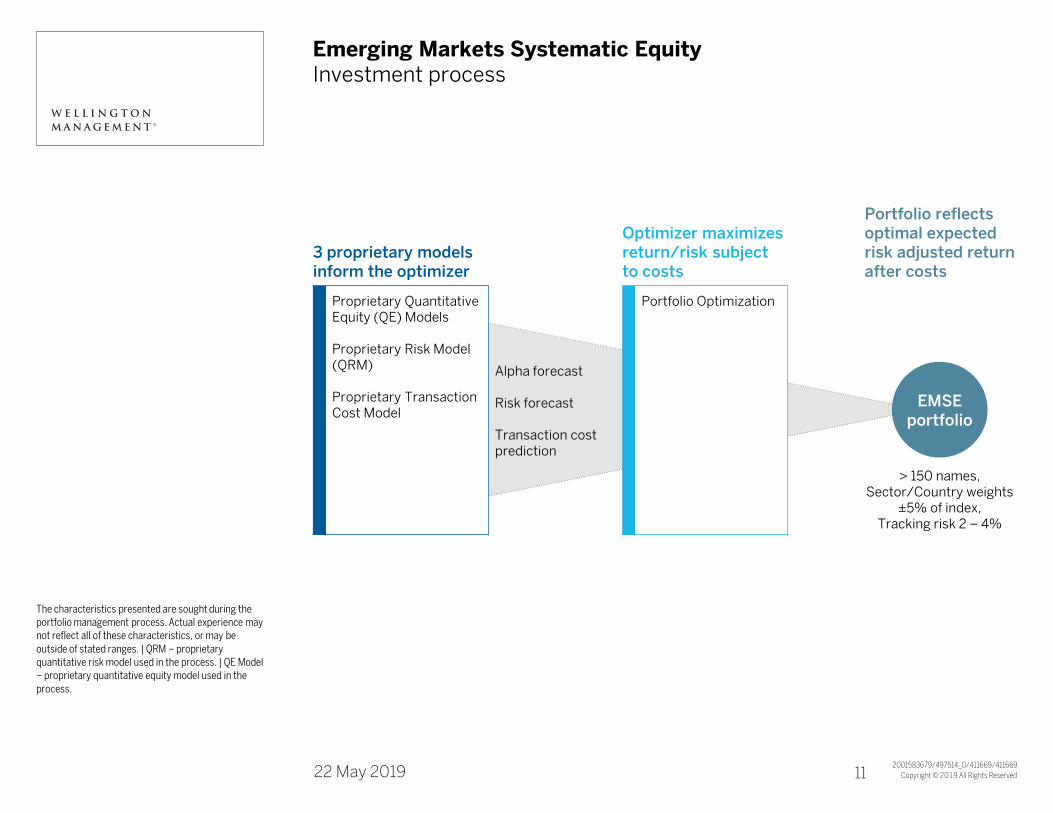
Title Line 1Title Line 2Emerging Markets Systematic EquityInvestment process
The characteristics presented are sought during the portfolio management process. Actual experience may not reflect all of these characteristics, or may be
outside of stated ranges. | QRM – proprietary quantitative risk model used in the process. | QE Model – proprietary quantitative equity model used in the
process.
3 proprietary models inform the optimizer
Optimizer maximizes return/risk subject to costs
Portfolio reflects optimal expected risk adjusted return after costs
Proprietary Quantitative Equity (QE) Models
Proprietary Risk Model (QRM)
Proprietary Transaction Cost Model
Alpha forecast
Risk forecast
Transaction cost prediction
Portfolio Optimization
EMSEportfolio
> 150 names, Sector/Country weights
±5% of index,Tracking risk 2 – 4%
-
_22 May 2019 A1 11
Copyright © 2019 All Rights Reserved2001583680/497514_0/411669/411669A
-
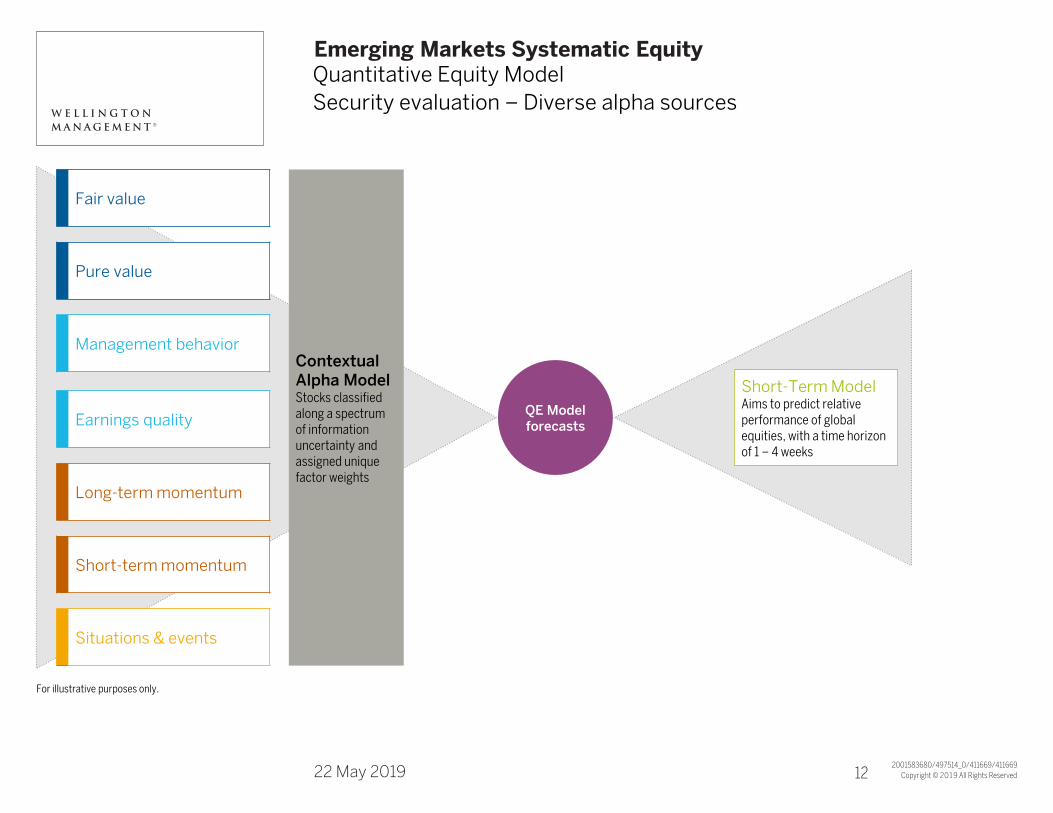
Title Line 1Title Line 2Emerging Markets Systematic EquityQuantitative Equity Model
Security evaluation – Diverse alpha sources
For illustrative purposes only.
Fair value
Contextual Alpha ModelStocks classified along a spectrum of information uncertainty and assigned unique factor weights
Pure value
Management behavior
Earnings quality
Long-term momentum
Short-term momentum
Situations & events
QE Model forecasts
Short-Term ModelAims to predict relative performance of global equities, with a time horizon of 1 – 4 weeks
-
_22 May 2019 A1 12
Copyright © 2019 All Rights Reserved2001583682/497514_0/411669/411669A
-
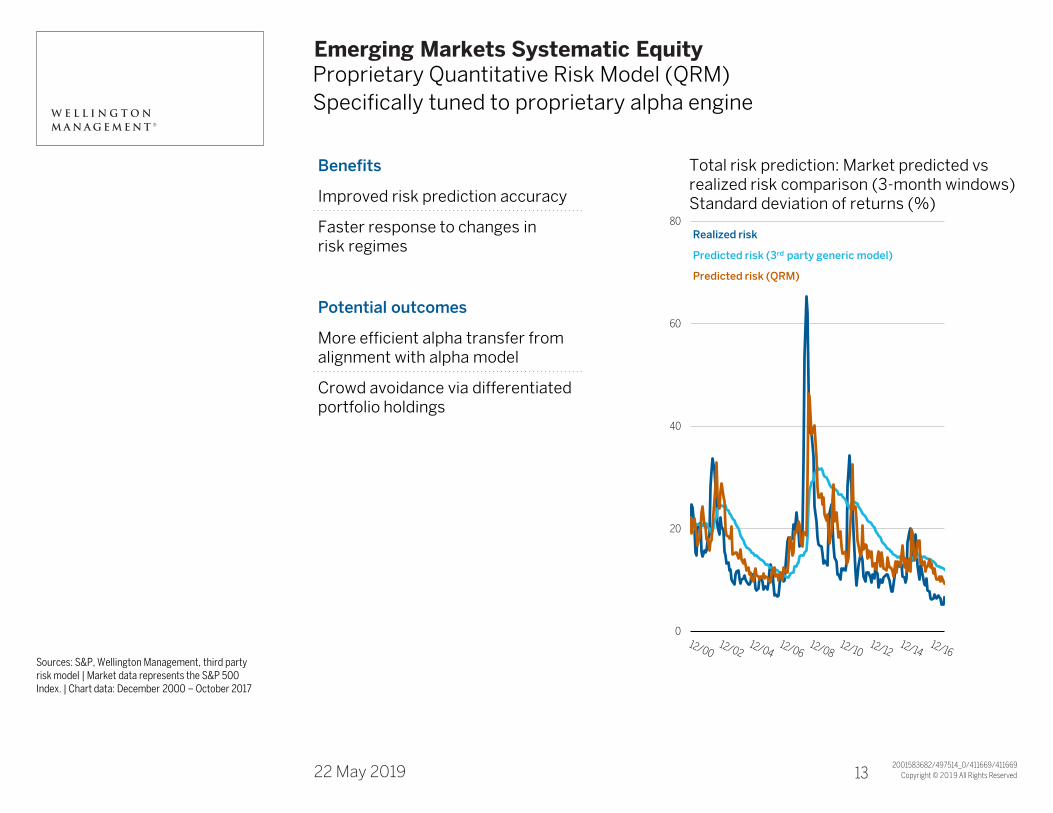
Title Line 1Title Line 2Emerging Markets Systematic Equity Proprietary Quantitative Risk Model (QRM)
Specifically tuned to proprietary alpha engine
Sources: S&P, Wellington Management, third party risk model | Market data represents the S&P 500 Index. | Chart data: December 2000 – October 2017
Benefits
Improved risk prediction accuracy
Faster response to changes in risk regimes
Potential outcomes
More efficient alpha transfer from alignment with alpha model
Crowd avoidance via differentiated portfolio holdings
0
20
40
60
80
Total risk prediction: Market predicted vs realized risk comparison (3-month windows) Standard deviation of returns (%)
Realized risk
Predicted risk (3rd party generic model)
Predicted risk (QRM)
-
_22 May 2019 A1 13

Copyright © 2019 All Rights Reserved2001583683/497514_0/411669/411669A
-
Title Line 1Title Line 2How we control transaction costsEmerging Markets Systematic Equity
For illustrative purposes only.
Proprietary transaction cost modelIntegrates cost considerations into every trading decision
Tuned to our trading style
Incorporates country-specific fees, taxes, commissions, and stamp duties
Minimal-impact execution processPatient trade horizon/low liquidity consumption
Efficient execution by our Global Program trading desk
Transaction cost monitoringProprietary cost reporting tool delivers comprehensive cost analytics T+1
Visualization tools summarize execution patterns and allow drill-down into individual orders
Sample report
-
_22 May 2019 A1 14

Copyright © 2019 All Rights Reserved2001583684/497514_0/411669/411669A
-
Title Line 1Title Line 2Emerging Markets Systematic EquityPortfolio construction and risk controls
The characteristics presented are sought during the portfolio management process. Actual experience may not reflect all of these characteristics, or may be
outside of stated ranges.
Benchmark: MSCI Emerging Markets Index
Position size Number of holdings
Relative weight ±3% Number of holdings Typically > 150
Sector weights Other
Typically within ±5% of the MSCI Emerging Markets Index sector weight
Cash Typically < 5%
Derivatives To equitize cash
Country weights
Typically within ±5% of the MSCI Emerging Markets Index country weight
Regular portfolio and risk reviews by Product Management and Investment Review Group
Market cap size limitations
Within the range of the benchmark
-
_22 May 2019 A1 15

Copyright © 2017 All Rights Reserved2001070595/451989_1/451746/451746A
A
Los Angeles Dept of Water and PowerTitle Line 2Summary of guidelines
The portfolios have been in compliance with investment guidelines since the inception of the accounts (September 2016)• Benchmark:MSCIEmergingMarketsIMIND• Permittedinvestments:securitiesofnon-UScompaniesdoingbusinessinemergingmarkets,includingREITsanddepositaryreceipts;ETF’salsopermitted.
• Minimummarketcapitalizationforeligibleinvestments:$100million• 144Asecuritieswithoutregistrationrightslimitedto10%ofportfolio• Non-currencyderivativesarenotpermittedwithouttheconsentofthePlan• Currencyhedgingpermitted,upto25%ofportfoliovalue• Nogreaterthan7%investedinasingleissuer• Securitieswithgreaterthan10%ofoutstandingsharesheldbyWellingtonare
not permitted• Turnovernormallylessthan200%fortwelvemonthperiods• Trailingtwelvemonthprice-to-earningsnormallywithin±.5xrangeofbenchmark• Averagedividendyieldnormallywithin±.5xofbenchmark• Betanormallysimilartobenchmarkonarolling24-monthbasis
A
A22 May 2019 A1 16
Copyright © 2019 All Rights Reserved2001601318/505816_0/504341/451989A
A
Market OverviewTitle Line 2Update and Outlook
We believe the environment well-suited for systematic techniques
Quality theme was the strongest contributor
Value theme was flat for the quarter
Momentum theme detracted from performance
A
A22 May 2019 A1 17
Copyright © 2019 All Rights Reserved2001583692/497514_0/411669/411669A
-
Title Line 1Title Line 2
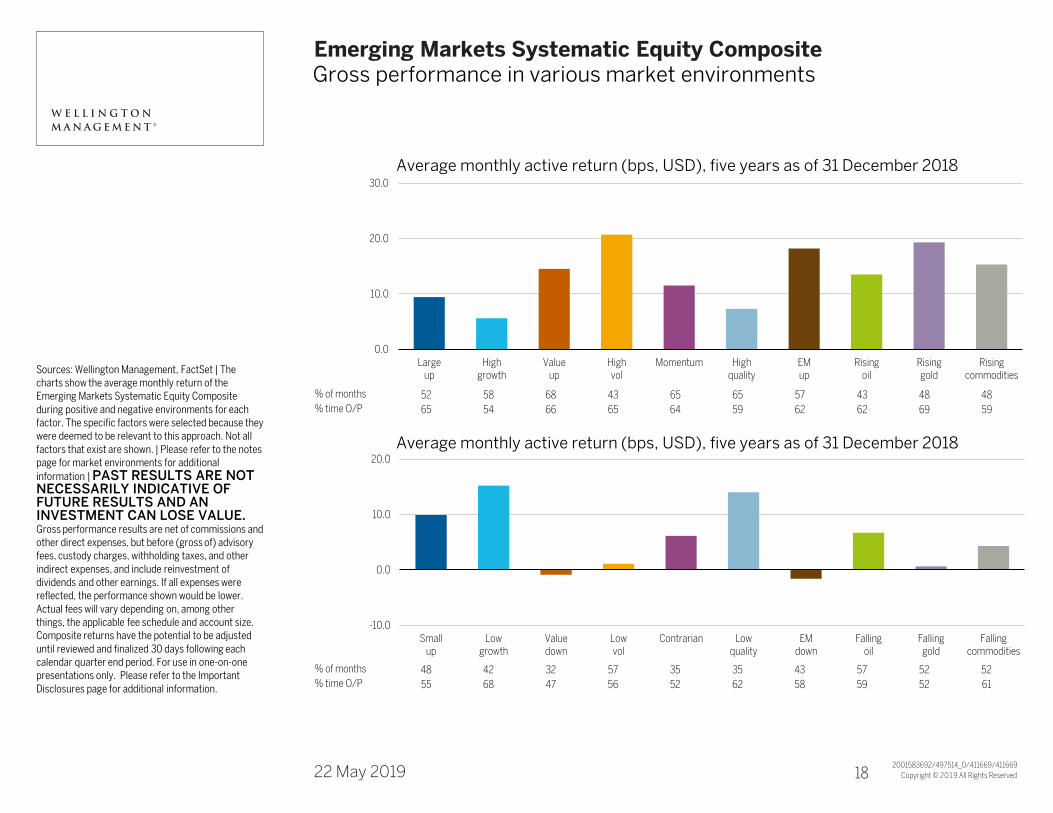
% of months 48 42 32 57 35 35 43 57 52 52
% time O/P 55 68 47 56 52 62 58 59 52 61
% of months 52 58 68 43 65 65 57 43 48 48
% time O/P 65 54 66 65 64 59 62 62 69 59
Emerging Markets Systematic Equity CompositeGross performance in various market environments
Sources: Wellington Management, FactSet | The charts show the average monthly return of the Emerging Markets Systematic Equity Composite
during positive and negative environments for each factor. The specific factors were selected because they were deemed to be relevant to this approach. Not all
factors that exist are shown. | Please refer to the notes page for market environments for additional
information | PAST RESULTS ARE NOT NECESSARILY INDICATIVE OF FUTURE RESULTS AND AN INVESTMENT CAN LOSE VALUE.Gross performance results are net of commissions and other direct expenses, but before (gross of) advisory fees, custody charges, withholding taxes, and other
indirect expenses, and include reinvestment of dividends and other earnings. If all expenses were reflected, the performance shown would be lower.
Actual fees will vary depending on, among other things, the applicable fee schedule and account size. Composite returns have the potential to be adjusted
until reviewed and finalized 30 days following each calendar quarter end period. For use in one-on-one presentations only. Please refer to the Important
Disclosures page for additional information.
-10.0
0.0
10.0
20.0
Smallup
Lowgrowth
Valuedown
Lowvol
Contrarian Lowquality
EMdown
Fallingoil
Fallinggold
Fallingcommodities
0.0
10.0
20.0
30.0
Largeup
Highgrowth
Valueup
Highvol
Momentum Highquality
EMup
Risingoil
Risinggold
Risingcommodities
Average monthly active return (bps, USD), five years as of 31 December 2018
Average monthly active return (bps, USD), five years as of 31 December 2018
-
_22 May 2019 A1 18
Copyright © 2019 All Rights Reserved2001583693/497514_0/411669/411669A
-
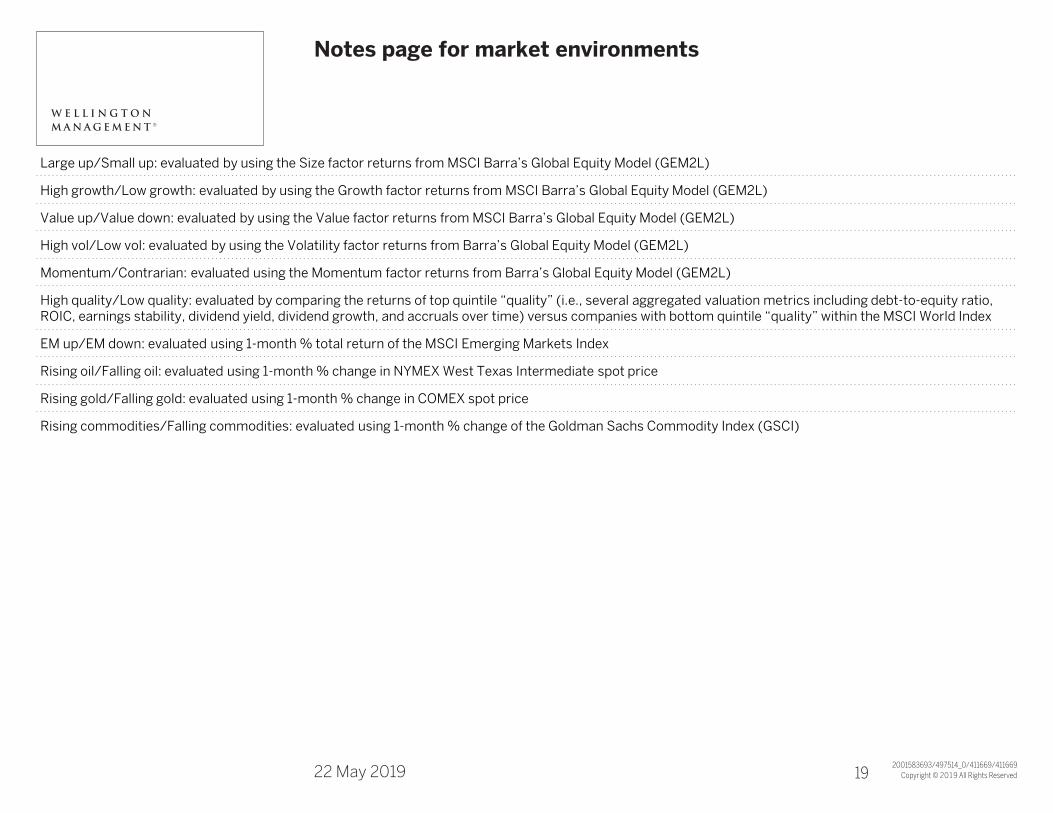
Title Line 1Title Line 2Notes page for market environments
Large up/Small up: evaluated by using the Size factor returns from MSCI Barra’s Global Equity Model (GEM2L)
High growth/Low growth: evaluated by using the Growth factor returns from MSCI Barra’s Global Equity Model (GEM2L)
Value up/Value down: evaluated by using the Value factor returns from MSCI Barra’s Global Equity Model (GEM2L)
High vol/Low vol: evaluated by using the Volatility factor returns from Barra’s Global Equity Model (GEM2L)
Momentum/Contrarian: evaluated using the Momentum factor returns from Barra’s Global Equity Model (GEM2L)
High quality/Low quality: evaluated by comparing the returns of top quintile “quality” (i.e., several aggregated valuation metrics including debt-to-equity ratio, ROIC, earnings stability, dividend yield, dividend growth, and accruals over time) versus companies with bottom quintile “quality” within the MSCI World Index
EM up/EM down: evaluated using 1-month % total return of the MSCI Emerging Markets Index
Rising oil/Falling oil: evaluated using 1-month % change in NYMEX West Texas Intermediate spot price
Rising gold/Falling gold: evaluated using 1-month % change in COMEX spot price
Rising commodities/Falling commodities: evaluated using 1-month % change of the Goldman Sachs Commodity Index (GSCI)
-
_22 May 2019 A1 19
Copyright © 2019 All Rights Reserved2001583694/497514_0/411669/411669A
-
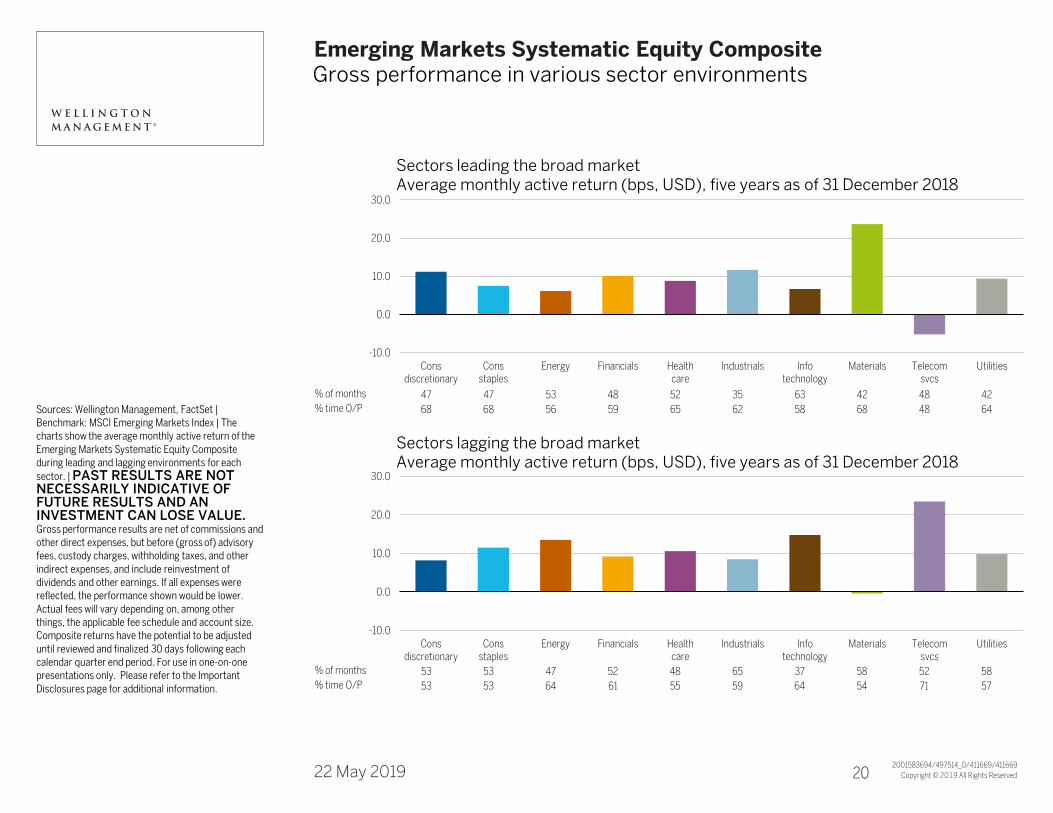
Title Line 1Title Line 2Emerging Markets Systematic Equity CompositeGross performance in various sector environments
Sources: Wellington Management, FactSet | Benchmark: MSCI Emerging Markets Index | The charts show the average monthly active return of the
Emerging Markets Systematic Equity Composite during leading and lagging environments for each
sector. | PAST RESULTS ARE NOT NECESSARILY INDICATIVE OF FUTURE RESULTS AND AN INVESTMENT CAN LOSE VALUE.Gross performance results are net of commissions and other direct expenses, but before (gross of) advisory fees, custody charges, withholding taxes, and other
indirect expenses, and include reinvestment of dividends and other earnings. If all expenses were reflected, the performance shown would be lower.
Actual fees will vary depending on, among other things, the applicable fee schedule and account size. Composite returns have the potential to be adjusted
until reviewed and finalized 30 days following each calendar quarter end period. For use in one-on-one presentations only. Please refer to the Important
Disclosures page for additional information.
% of months 53 53 47 52 48 65 37 58 52 58
% time O/P 53 53 64 61 55 59 64 54 71 57
% of months 47 47 53 48 52 35 63 42 48 42
% time O/P 68 68 56 59 65 62 58 68 48 64
-10.0
0.0
10.0
20.0
30.0
Consdiscretionary
Consstaples
Energy Financials Healthcare
Industrials Infotechnology
Materials Telecomsvcs
Utilities
-10.0
0.0
10.0
20.0
30.0
Consdiscretionary
Consstaples
Energy Financials Healthcare
Industrials Infotechnology
Materials Telecomsvcs
Utilities
Sectors leading the broad marketAverage monthly active return (bps, USD), five years as of 31 December 2018
Sectors lagging the broad marketAverage monthly active return (bps, USD), five years as of 31 December 2018
-
_22 May 2019 A1 20
Copyright © 2019 All Rights Reserved2001583700/497514_0/411669/411669A
-
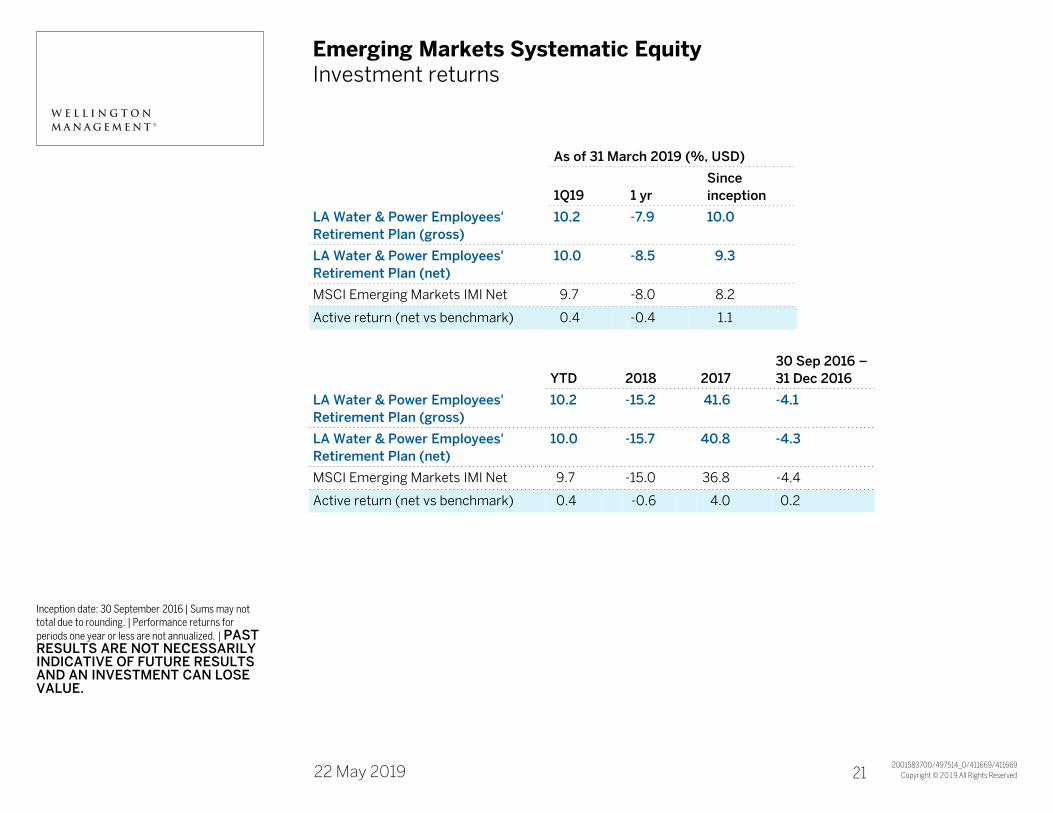
Title Line 1Title Line 2Emerging Markets Systematic EquityInvestment returns
Inception date: 30 September 2016 | Sums may not total due to rounding. | Performance returns for
periods one year or less are not annualized. | PAST RESULTS ARE NOT NECESSARILY INDICATIVE OF FUTURE RESULTS AND AN INVESTMENT CAN LOSE VALUE.
As of 31 March 2019 (%, USD)
1Q19 1 yr
Since
inception
LA Water & Power Employees'
Retirement Plan (gross)
10.2 -7.9 10.0
LA Water & Power Employees'
Retirement Plan (net)
10.0 -8.5 9.3
MSCI Emerging Markets IMI Net 9.7 -8.0 8.2
Active return (net vs benchmark) 0.4 -0.4 1.1
YTD 2018 2017
30 Sep 2016 –
31 Dec 2016
LA Water & Power Employees'
Retirement Plan (gross)
10.2 -15.2 41.6 -4.1
LA Water & Power Employees'
Retirement Plan (net)
10.0 -15.7 40.8 -4.3
MSCI Emerging Markets IMI Net 9.7 -15.0 36.8 -4.4
Active return (net vs benchmark) 0.4 -0.6 4.0 0.2
_22 May 2019 A1 21

Copyright © 2019 All Rights Reserved2001583701/497514_0/411669/411669A
-
Title Line 1Title Line 2Emerging Markets Systematic EquityInvestment returns
Inception date: 30 September 2016 | Sums may not total due to rounding. | Performance returns for
periods one year or less are not annualized. | PAST RESULTS ARE NOT NECESSARILY INDICATIVE OF FUTURE RESULTS AND AN INVESTMENT CAN LOSE VALUE.
As of 31 March 2019 (%, USD)
1Q19 1 yr
Since
inception
Retiree Health Benefits Fund (gross)
10.2 -8.1 9.9
Retiree Health Benefits Fund
(net)
10.0 -8.6 9.3
MSCI Emerging Markets IMI Net 9.7 -8.0 8.2
Active return (net vs benchmark) 0.3 -0.6 1.1
YTD 2018 2017
30 Sep 2016 –
31 Dec 2016
Retiree Health Benefits Fund (gross) 10.2 -15.2 41.4 -4.2
Retiree Health Benefits Fund (net) 10.0 -15.6 40.7 -4.3
MSCI Emerging Markets IMI Net 9.7 -15.0 36.8 -4.4
Active return (net vs benchmark) 0.3 -0.6 3.8 0.2
_22 May 2019 A1 22
Copyright © 2019 All Rights Reserved2001583686/497514_0/411669/411669A
-
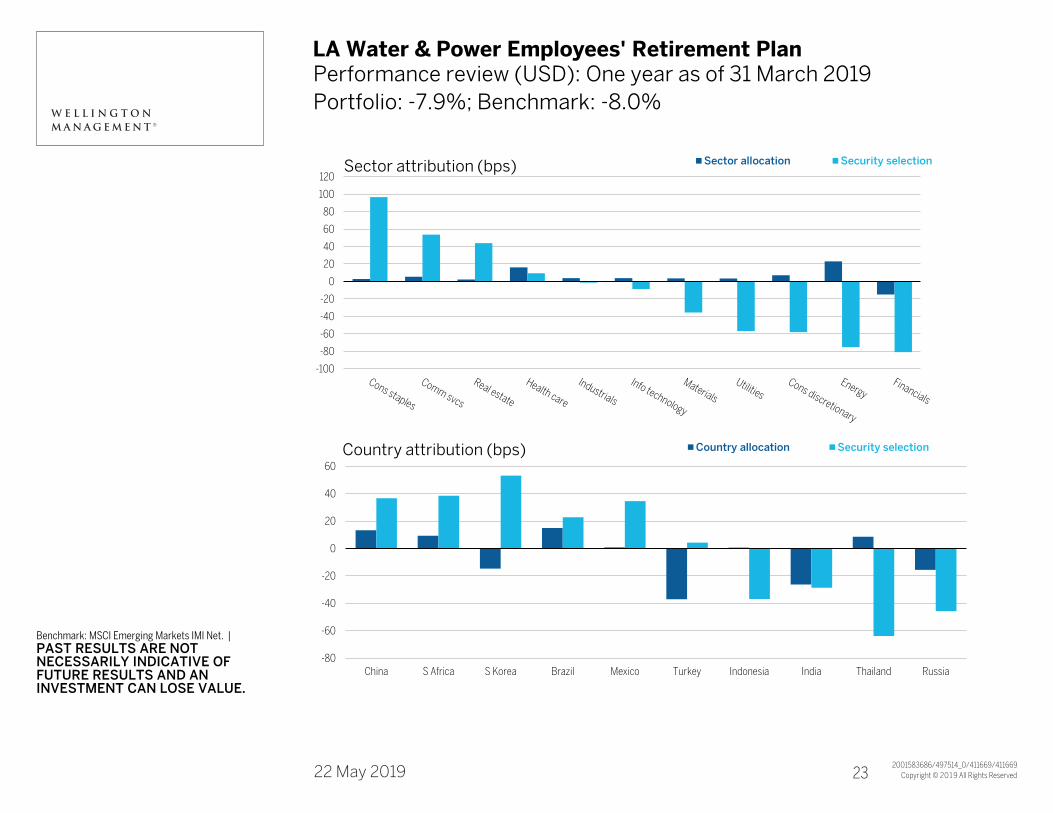
Title Line 1Title Line 2LA Water & Power Employees' Retirement Plan
Benchmark: MSCI Emerging Markets IMI Net. |
PAST RESULTS ARE NOT NECESSARILY INDICATIVE OF FUTURE RESULTS AND AN INVESTMENT CAN LOSE VALUE.
Performance review (USD): One year as of 31 March 2019
Portfolio: -7.9%; Benchmark: -8.0%
-100
-80
-60
-40
-20
0
20
40
60
80
100
120Sector attribution (bps) Sector allocation Security selection
-80
-60
-40
-20
0
20
40
60
China S Africa S Korea Brazil Mexico Turkey Indonesia India Thailand Russia
Country attribution (bps) Country allocation Security selection
-
_22 May 2019 A1 23
Copyright © 2019 All Rights Reserved2001583768/497514_0/411669/411669A
-
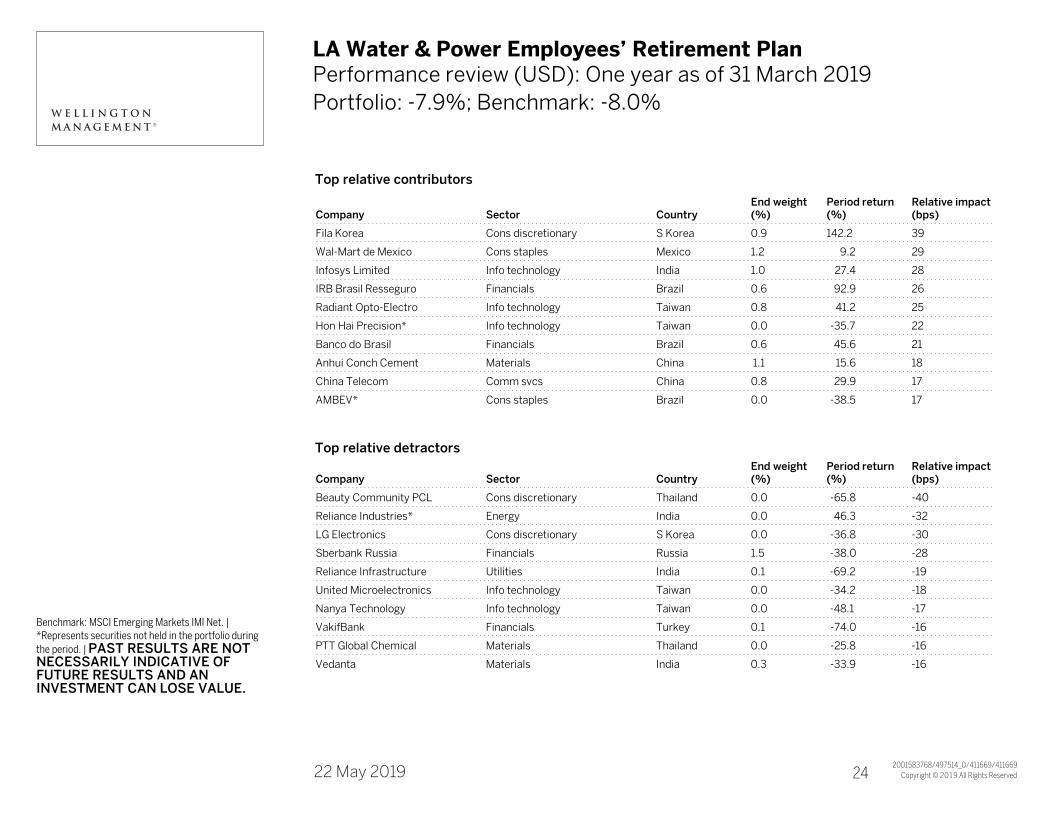
Title Line 1Title Line 2LA Water & Power Employees’ Retirement PlanPerformance review (USD): One year as of 31 March 2019
Portfolio: -7.9%; Benchmark: -8.0%
Benchmark: MSCI Emerging Markets IMI Net. | *Represents securities not held in the portfolio during
the period. | PAST RESULTS ARE NOT NECESSARILY INDICATIVE OF FUTURE RESULTS AND AN INVESTMENT CAN LOSE VALUE.
Company Sector Country End weight (%)
Period return (%)
Relative impact (bps)
Fila Korea Cons discretionary S Korea 0.9 142.2 39
Wal-Mart de Mexico Cons staples Mexico 1.2 9.2 29
Infosys Limited Info technology India 1.0 27.4 28
IRB Brasil Resseguro Financials Brazil 0.6 92.9 26
Radiant Opto-Electro Info technology Taiwan 0.8 41.2 25
Hon Hai Precision* Info technology Taiwan 0.0 -35.7 22
Banco do Brasil Financials Brazil 0.6 45.6 21
Anhui Conch Cement Materials China 1.1 15.6 18
China Telecom Comm svcs China 0.8 29.9 17
AMBEV* Cons staples Brazil 0.0 -38.5 17
Company Sector Country End weight (%)
Period return (%)
Relative impact (bps)
Beauty Community PCL Cons discretionary Thailand 0.0 -65.8 -40
Reliance Industries* Energy India 0.0 46.3 -32
LG Electronics Cons discretionary S Korea 0.0 -36.8 -30
Sberbank Russia Financials Russia 1.5 -38.0 -28
Reliance Infrastructure Utilities India 0.1 -69.2 -19
United Microelectronics Info technology Taiwan 0.0 -34.2 -18
Nanya Technology Info technology Taiwan 0.0 -48.1 -17
VakifBank Financials Turkey 0.1 -74.0 -16
PTT Global Chemical Materials Thailand 0.0 -25.8 -16
Vedanta Materials India 0.3 -33.9 -16
Top relative contributors
Top relative detractors
-
_22 May 2019 A1 24
Copyright © 2019 All Rights Reserved2001583767/497514_0/411669/411669A
-
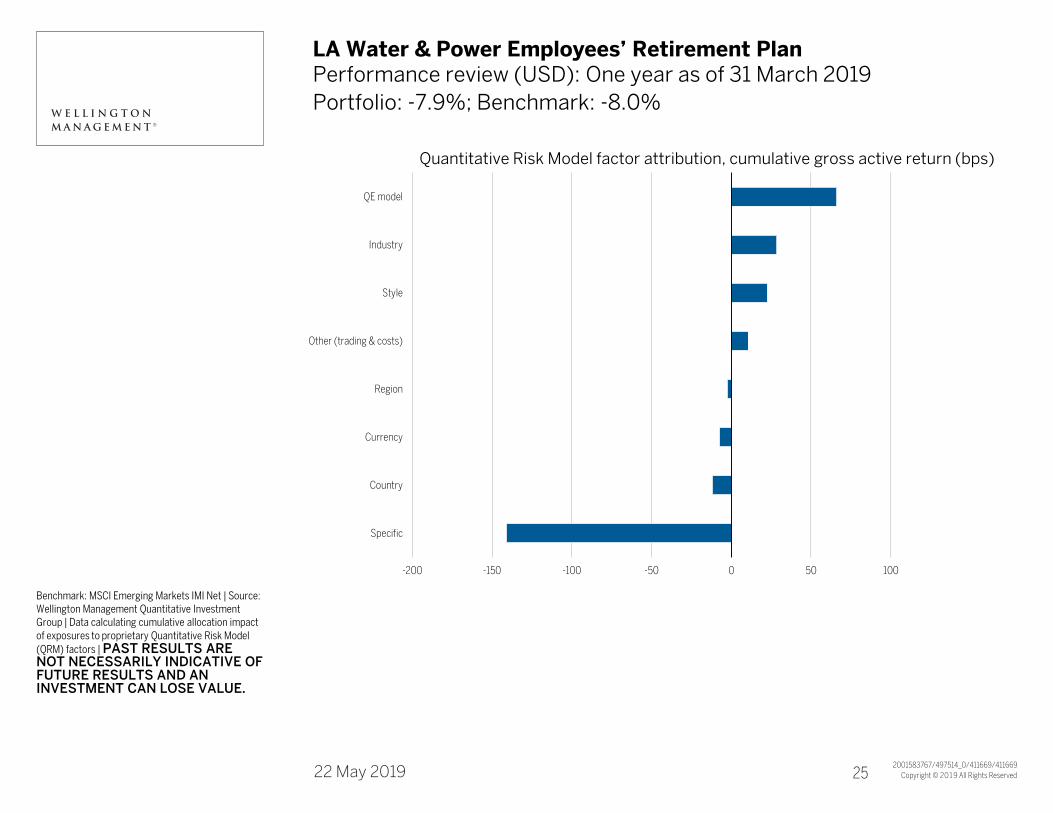
Title Line 1Title Line 2LA Water & Power Employees’ Retirement PlanPerformance review (USD): One year as of 31 March 2019
Portfolio: -7.9%; Benchmark: -8.0%
Benchmark: MSCI Emerging Markets IMI Net | Source: Wellington Management Quantitative Investment Group | Data calculating cumulative allocation impact
of exposures to proprietary Quantitative Risk Model
(QRM) factors | PAST RESULTS ARE NOT NECESSARILY INDICATIVE OF FUTURE RESULTS AND AN INVESTMENT CAN LOSE VALUE.
-200 -150 -100 -50 0 50 100
Specific
Country
Currency
Region
Other (trading & costs)
Style
Industry
QE model
Quantitative Risk Model factor attribution, cumulative gross active return (bps)
-
_22 May 2019 A1 25
Copyright © 2019 All Rights Reserved2001583688/497514_0/411669/411669A
-
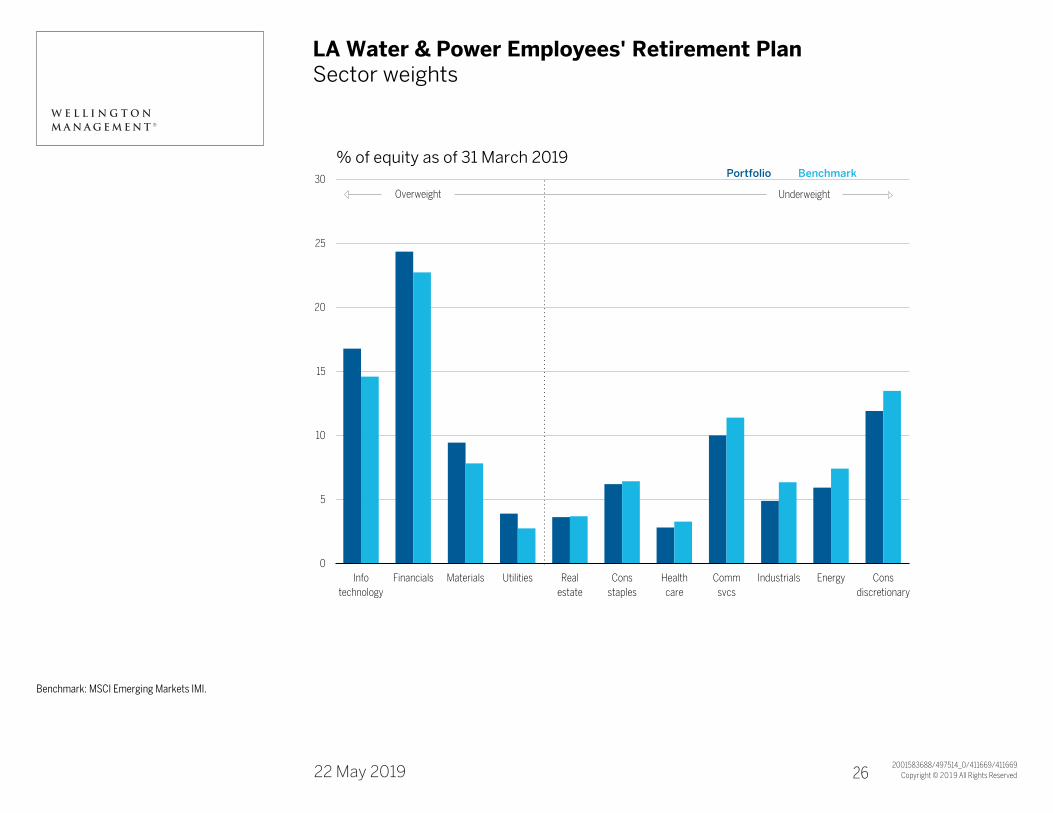
Title Line 1Title Line 2LA Water & Power Employees' Retirement PlanSector weights
Benchmark: MSCI Emerging Markets IMI.
0
5
10
15
20
25
30
Info
technology
Financials Materials Utilities Real
estate
Cons
staples
Health
care
Comm
svcs
Industrials Energy Cons
discretionary
% of equity as of 31 March 2019
Overweight Underweight
Portfolio Benchmark
-
_22 May 2019 A1 26
Copyright © 2019 All Rights Reserved2001583689/497514_0/411669/411669A
-
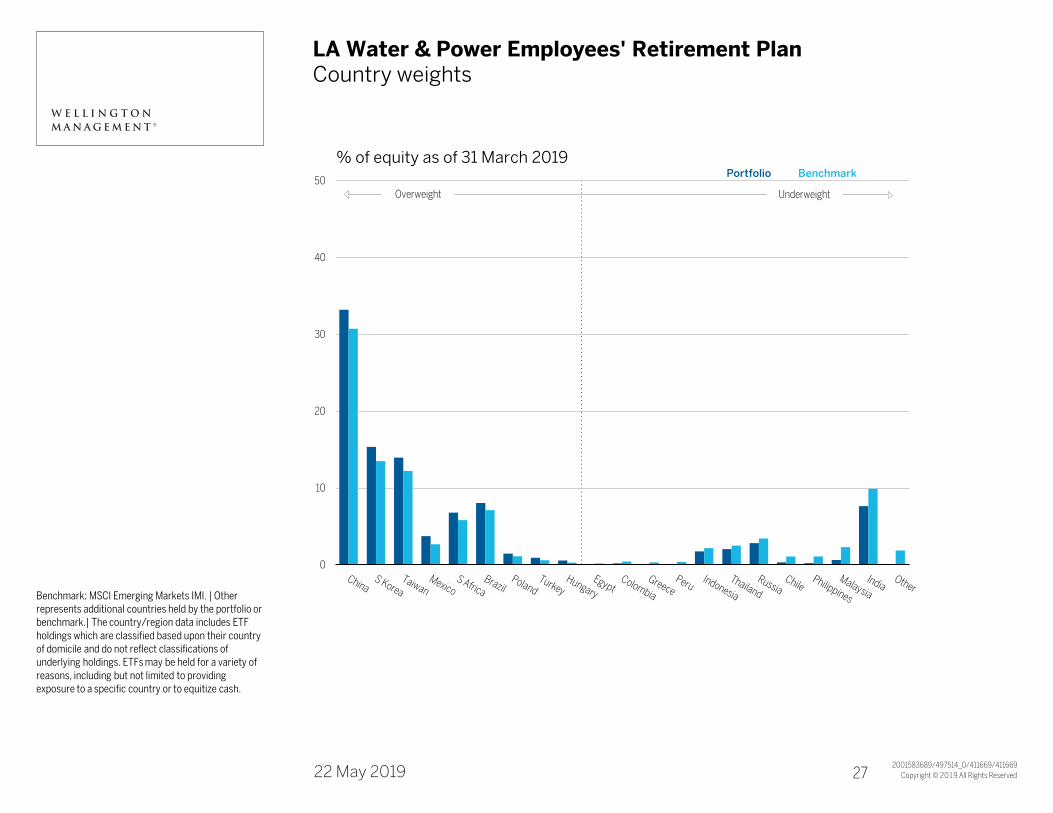
Title Line 1Title Line 2LA Water & Power Employees' Retirement PlanCountry weights
Benchmark: MSCI Emerging Markets IMI. | Other represents additional countries held by the portfolio or benchmark.| The country/region data includes ETF
holdings which are classified based upon their country of domicile and do not reflect classifications of underlying holdings. ETFs may be held for a variety of
reasons, including but not limited to providing exposure to a specific country or to equitize cash.
0
10
20
30
40
50
% of equity as of 31 March 2019
Overweight Underweight
Portfolio Benchmark
-
_22 May 2019 A1 27
Copyright © 2019 All Rights Reserved2001586159/504341_0/504441/452344
A
A22 May 2019
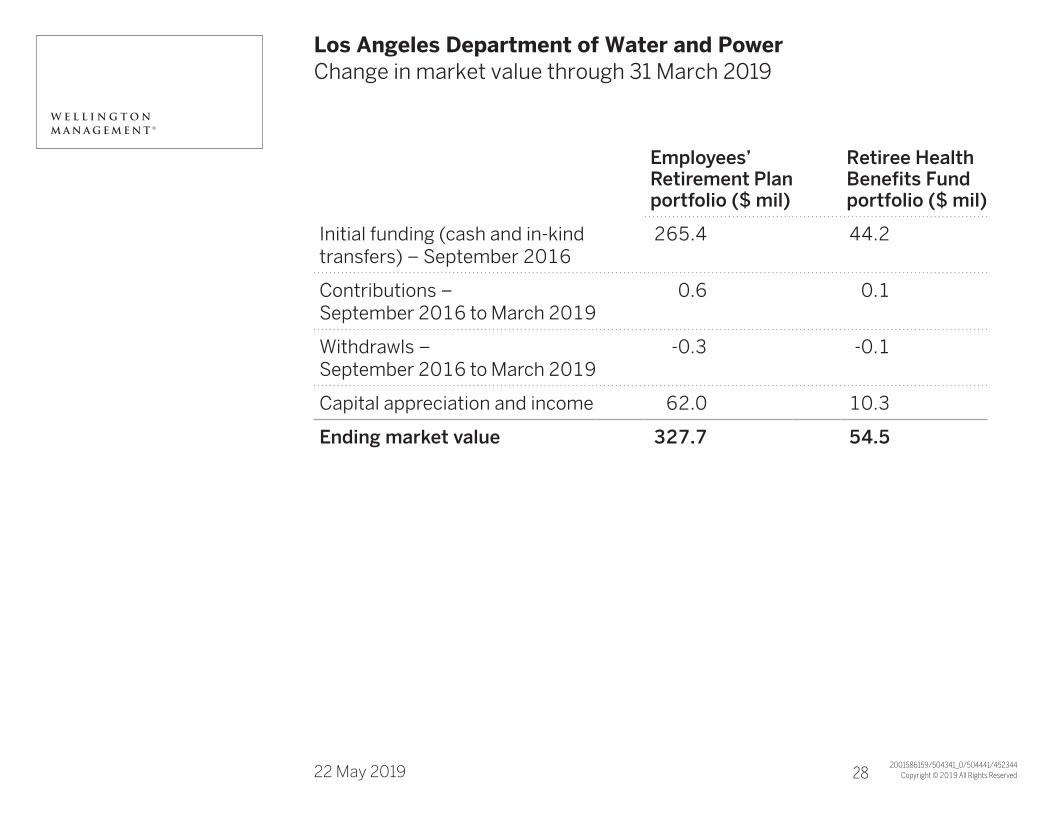
Los Angeles Department of Water and PowerTitle Line 2Change in market value through 31 March 2019
Employees’ Retirement Plan portfolio ($ mil)
Retiree Health Benefits Fund portfolio ($ mil)
Initial funding (cash and in-kind transfers) – September 2016
265.4 44.2
Contributions – September 2016 to March 2019
0.6 0.1
Withdrawls – September 2016 to March 2019
-0.3 -0.1
Capital appreciation and income 62.0 10.3
Ending market value 327.7 54.5
A1 28

Copyright © 2019 All Rights Reserved2001583690/497514_0/411669/411669A
-
Title Line 1Title Line 2LA Water & Power Employees' Retirement PlanTop ten active positions
Benchmark: MSCI Emerging Markets IMI | Sums may not total due to rounding.
As of 31 March 2019
Company Industry Country % of equities
% of benchmark
Active position (%)
Alibaba Internet & direct mktg retail China 2.4 4.0 -1.5
Taiwan Semiconductor Semiconductors & semi equip Taiwan 1.9 3.3 -1.4
Tencent Interactive media & svcs China 3.1 4.4 -1.4
Agricultural Bank of China Banks China 1.5 0.2 1.3
China Construction Bank Banks China 0.1 1.4 -1.3
Grupo Financiero Banorte Banks Mexico 1.4 0.2 1.2
Wipro Limited IT svcs India 1.2 0.1 1.1
GAIL India Gas utilities India 1.1 0.1 1.1
Wal-Mart de Mexico Food & stpls retailing Mexico 1.3 0.2 1.0
Ping An Insurance Insurance China 0.0 1.0 -1.0
Total 14.0 14.9
Number of equity names: 238
-
_22 May 2019 A1 29

Copyright © 2019 All Rights Reserved2001583691/497514_0/411669/411669A
-
Title Line 1Title Line 2LA Water & Power Employees' Retirement PlanPortfolio characteristics
Benchmark: MSCI Emerging Markets IMI | Sums may not total due to rounding. | If access products are held by the portfolio they may not be included in the
calculation of characteristic data. Access products are instruments used to gain access to equity markets not otherwise available and may include (but are not
limited to) instruments such as warrants, total return swaps, p-notes, or zero strike options. Please refer to the Important Disclosures page for additional
information.
As of 31 March 2019
Portfolio Benchmark
Size
Asset-weighted market cap (USD, bil) 63.7 84.5
Over USD 50 bil (%) 24 32
USD 20 – 50 bil (%) 15 17
USD 10 – 20 bil (%) 19 16
USD 2 – 10 bil (%) 30 24
Under USD 2 bil (%) 12 10
Valuation
Projected EPS growth – median (5-yr, %) 8.0 11.9
Projected P/E – median (x) 9.2 11.3
P/E trailing ex negatives – median (x) 9.1 11.6
Price/book (x) 1.3 1.6
Yield (%) 3.0 2.4
ROE (1-yr, %) 17.4 17.1
Debt % of equity (%) 112.0 94.6
Risk
Projected beta – equity 0.99
Projected tracking risk (%) 2.24
Projected R² 0.98
-
_22 May 2019 A1 30

Copyright © 2017 All Rights Reserved2001070594/451989_1/451746/451746A
A
Los Angeles Dept of Water and PowerTitle Line 2Investment management fee schedule
On all assets• 57basispointsperannum
A
A22 May 2019 A1 31

Copyright © 2018 All Rights Reserved2001303931/480059_0/411669/411669A
-
Title Line 1Title Line 2Emerging Markets Systematic EquityKey considerations
Wellington Management uses quantitative investment models in the management of this investment strategy. All quantitative investment models have risks related to mistakes in coding software (e.g., software bugs) and inaccurate or stale data inputs. Because our quantitative investment models are complex, some of these issues may not be detected for a prolonged period before being corrected. In addition, quantitative investment models are susceptible to temporary disruptions due to technological failures (e.g., systems, communications or power outages). These risks may have a negative impact on the investment performance of this investment approach.
Wellington Management has adopted controls that we believe are reasonably designed to mitigate (but not eliminate) these risks. These controls include monitoring the quantitative investment model’s data inputs and results, the review and testing of systems changes made to the model, and the implementation of business continuity procedures.
-
_22 May 2019 A1 32

Copyright © 2019 All Rights Reserved2001583712/497514_0/411669/411669A
-
Title Line 1Title Line 2Important disclosures
Additional performance informationPast results are not necessarily indicative of future results. There can be no assurance nor should it be assumed that future investment performance of any strategy will conform to any performance
examples set forth in this material or that the portfolio’s underlying investments will be able to avoid losses. The investment results and any portfolio compositions set forth in this material are provided for
illustrative purposes only and may not be indicative of the future investment results or future portfolio composition. The composition, size of, and risks associated with an investment in the strategy may
differ substantially from the examples set forth in this material. An investment can lose value.
Impact of feesIllustration of impact of fees: If USD100,000 was invested and experienced a 10% annual return compounded monthly for ten years, its ending value, without giving effect to the deduction of advisory
fees, would be USD270,704 with an annualized compounded return of 10.47%. If an advisory fee of 0.95% of average net assets per year were deducted monthly for the ten-year period, the annualized
compounded return would be 9.43% and the ending USD value would be USD246,355. Information regarding the firm's advisory fees is available upon request.
Selection of representative accountThe current representative account became effective on 1 October 2009 because it was the only account at the time of selection. For data shown prior to the current representative account effective
date, data of the representative account(s) deemed appropriate for the time period was used. Further information regarding former representative accounts can be provided upon request. Each client
account is individually managed; individual holdings will vary for each account and there is no guarantee that a particular account will have the same characteristics as described. Actual results may vary
for each client due to specific client guidelines, holdings, and other factors. In limited circumstances, the designated representative account may have changed over time, for reasons including, but not
limited to, account termination, imposition of significant investment restrictions, or material asset size fluctuations.
Access productsIf access products are held by the portfolio they may not be included in the calculation of characteristic data. Access products are instruments used to gain access to equity markets not otherwise
available and may include (but are not limited to) instruments such as warrants, total return swaps, p-notes, or zero strike options.
Global Industry Classification Standard (GICS) changes S&P Dow Jones Indices and MSCI have broadened and renamed the Telecommunication Services Sector as Communication Services to include companies that facilitate communication and offer related
content and information through various media. These changes to Global Industry Classification Standard (GICS) are effective as of 1 October 2018 in the data shown. The new sector name applies
retroactively and therefore Communication Services will replace Telecommunications Services for all periods. Wellington Management data reflects changes in line with the official GICS update; however,
MSCI and S&P have elected to update their official index structures with different timing. Therefore, index data shown may differ from data obtained directly from the index vendors.
-
_22 May 2019 A1 33
Copyright © 2019 All Rights Reserved2001578577/497514_0/411669/411669A
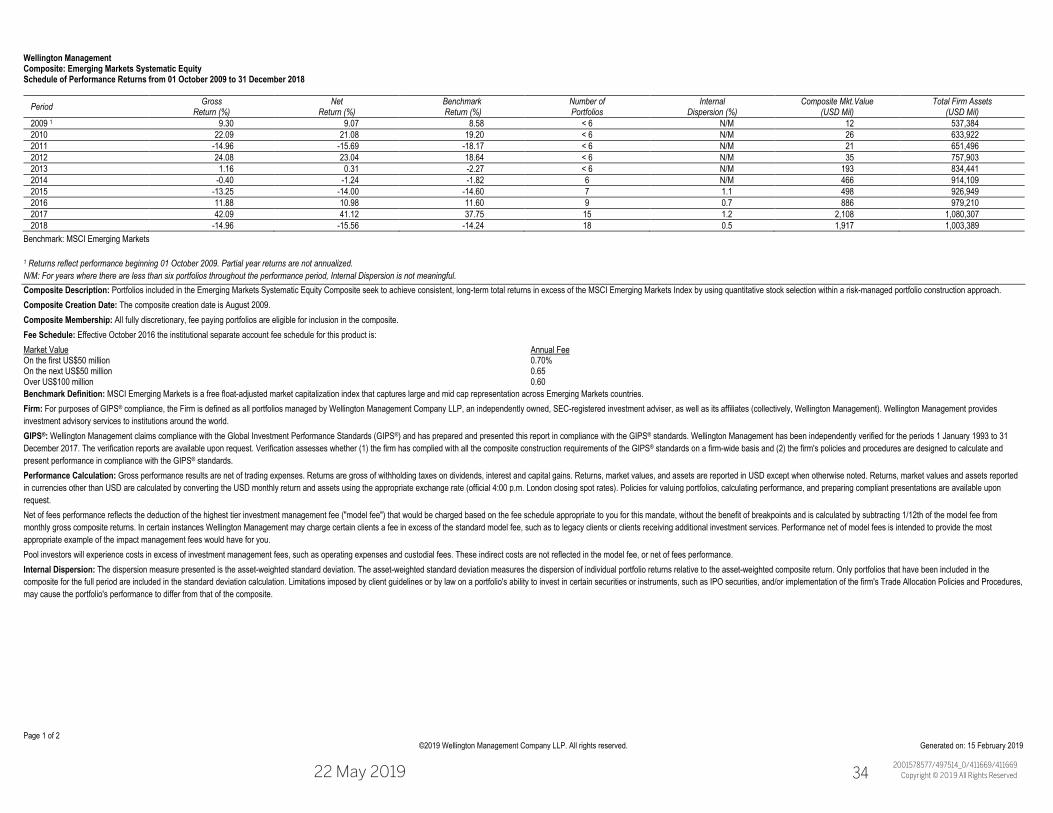
Wellington Management Composite: Emerging Markets Systematic Equity Schedule of Performance Returns from 01 October 2009 to 31 December 2018
Page 1 of 2 EMEQUANTTOT ©2019 Wellington Management Company LLP. All rights reserved. Generated on: 15 February 2019
Period Gross Return (%)
Net Return (%)
Benchmark Return (%)
Number of Portfolios
Internal Dispersion (%)
Composite Mkt.Value (USD Mil)
Total Firm Assets (USD Mil)
2009 1 9.30 9.07 8.58 < 6 N/M 12 537,384 2010 22.09 21.08 19.20 < 6 N/M 26 633,922 2011 -14.96 -15.69 -18.17 < 6 N/M 21 651,496 2012 24.08 23.04 18.64 < 6 N/M 35 757,903 2013 1.16 0.31 -2.27 < 6 N/M 193 834,441 2014 -0.40 -1.24 -1.82 6 N/M 466 914,109 2015 -13.25 -14.00 -14.60 7 1.1 498 926,949 2016 11.88 10.98 11.60 9 0.7 886 979,210 2017 42.09 41.12 37.75 15 1.2 2,108 1,080,307 2018 -14.96 -15.56 -14.24 18 0.5 1,917 1,003,389
Benchmark: MSCI Emerging Markets 1 Returns reflect performance beginning 01 October 2009. Partial year returns are not annualized. N/M: For years where there are less than six portfolios throughout the performance period, Internal Dispersion is not meaningful. Composite Description: Portfolios included in the Emerging Markets Systematic Equity Composite seek to achieve consistent, long-term total returns in excess of the MSCI Emerging Markets Index by using quantitative stock selection within a risk-managed portfolio construction approach. Composite Creation Date: The composite creation date is August 2009. Composite Membership: All fully discretionary, fee paying portfolios are eligible for inclusion in the composite. Fee Schedule: Effective October 2016 the institutional separate account fee schedule for this product is: Market Value Annual Fee On the first US$50 million 0.70% On the next US$50 million 0.65 Over US$100 million 0.60 Benchmark Definition: MSCI Emerging Markets is a free float-adjusted market capitalization index that captures large and mid cap representation across Emerging Markets countries. Firm: For purposes of GIPS® compliance, the Firm is defined as all portfolios managed by Wellington Management Company LLP, an independently owned, SEC-registered investment adviser, as well as its affiliates (collectively, Wellington Management). Wellington Management provides investment advisory services to institutions around the world. GIPS®: Wellington Management claims compliance with the Global Investment Performance Standards (GIPS®) and has prepared and presented this report in compliance with the GIPS® standards. Wellington Management has been independently verified for the periods 1 January 1993 to 31 December 2017. The verification reports are available upon request. Verification assesses whether (1) the firm has complied with all the composite construction requirements of the GIPS® standards on a firm-wide basis and (2) the firm's policies and procedures are designed to calculate and present performance in compliance with the GIPS® standards. Performance Calculation: Gross performance results are net of trading expenses. Returns are gross of withholding taxes on dividends, interest and capital gains. Returns, market values, and assets are reported in USD except when otherwise noted. Returns, market values and assets reported in currencies other than USD are calculated by converting the USD monthly return and assets using the appropriate exchange rate (official 4:00 p.m. London closing spot rates). Policies for valuing portfolios, calculating performance, and preparing compliant presentations are available upon request. Net of fees performance reflects the deduction of the highest tier investment management fee ("model fee") that would be charged based on the fee schedule appropriate to you for this mandate, without the benefit of breakpoints and is calculated by subtracting 1/12th of the model fee from monthly gross composite returns. In certain instances Wellington Management may charge certain clients a fee in excess of the standard model fee, such as to legacy clients or clients receiving additional investment services. Performance net of model fees is intended to provide the most appropriate example of the impact management fees would have for you. Pool investors will experience costs in excess of investment management fees, such as operating expenses and custodial fees. These indirect costs are not reflected in the model fee, or net of fees performance. Internal Dispersion: The dispersion measure presented is the asset-weighted standard deviation. The asset-weighted standard deviation measures the dispersion of individual portfolio returns relative to the asset-weighted composite return. Only portfolios that have been included in the composite for the full period are included in the standard deviation calculation. Limitations imposed by client guidelines or by law on a portfolio's ability to invest in certain securities or instruments, such as IPO securities, and/or implementation of the firm's Trade Allocation Policies and Procedures, may cause the portfolio's performance to differ from that of the composite.
-
_22 May 2019 A1 34
Copyright © 2019 All Rights Reserved2001578579/497514_0/411669/411669A
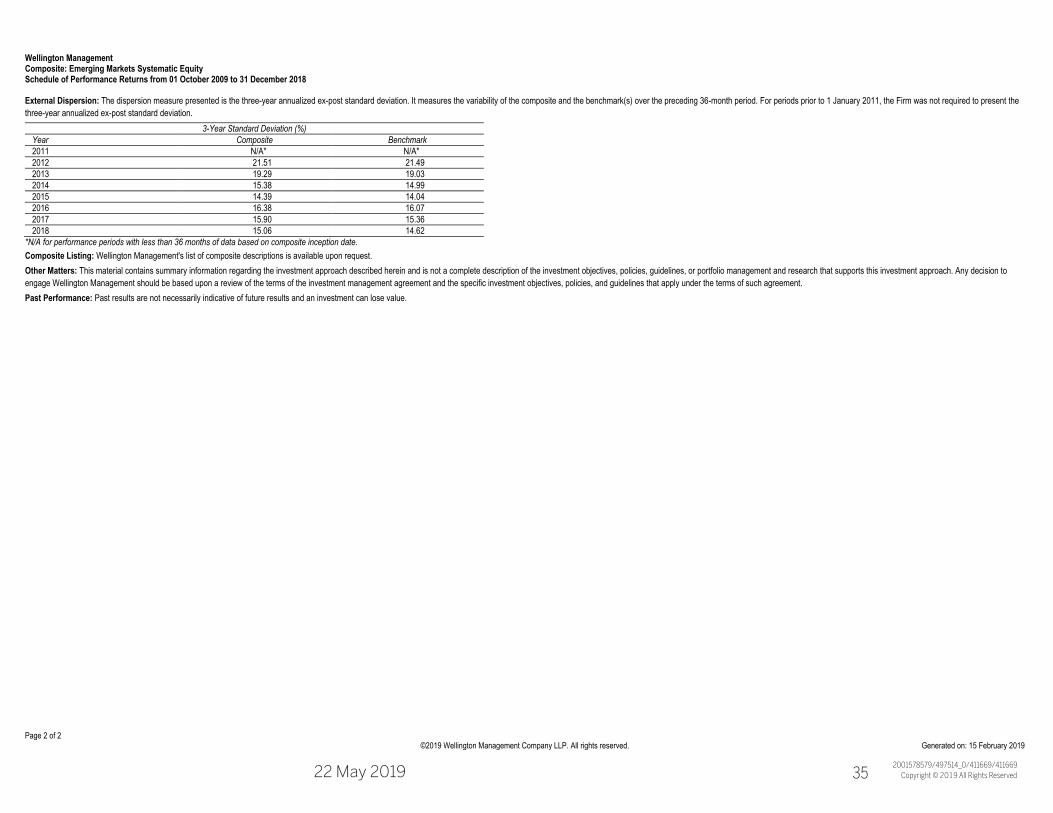
Wellington Management Composite: Emerging Markets Systematic Equity Schedule of Performance Returns from 01 October 2009 to 31 December 2018
Page 2 of 2 EMEQUANTTOT ©2019 Wellington Management Company LLP. All rights reserved. Generated on: 15 February 2019
External Dispersion: The dispersion measure presented is the three-year annualized ex-post standard deviation. It measures the variability of the composite and the benchmark(s) over the preceding 36-month period. For periods prior to 1 January 2011, the Firm was not required to present the three-year annualized ex-post standard deviation.
3-Year Standard Deviation (%) Year Composite Benchmark 2011 N/A* N/A* 2012 21.51 21.49 2013 19.29 19.03 2014 15.38 14.99 2015 14.39 14.04 2016 16.38 16.07 2017 15.90 15.36 2018 15.06 14.62
*N/A for performance periods with less than 36 months of data based on composite inception date. Composite Listing: Wellington Management's list of composite descriptions is available upon request. Other Matters: This material contains summary information regarding the investment approach described herein and is not a complete description of the investment objectives, policies, guidelines, or portfolio management and research that supports this investment approach. Any decision to engage Wellington Management should be based upon a review of the terms of the investment management agreement and the specific investment objectives, policies, and guidelines that apply under the terms of such agreement. Past Performance: Past results are not necessarily indicative of future results and an investment can lose value.
-
_22 May 2019 A1 35

Copyright © 2017 All Rights Reserved2001076672/504341_0/451989/451989A
A
GlossaryTitle Line 2Investment Terms
Contextual alpha model – The model incorporates risk information, sentiment information and trading information to rank stocks on a “difficult-to-value” (DTV) spectrum, which then translates into the recipe that we use to form the alpha forecast at the stock level
Pure value – cyclical value factors such as P/E, P/B, etc.
Fair value – absolute value factors such as dividend discount models
Earnings quality – accrual growth compared to cashflows, operating cashflows compared to assets, etc
Management behavior – capital stewardship factors – changes in external financing, share issuance/repurchase, etc.
Short-term momentum – price momentum, sentiment, and momentum of other financial statement items (sales, earnings, dividends) – typically over 1-3 month period
Long-term momentum – price momentum – typically over 3-12 month period
A
A22 May 2019 A1 36

Wellington Management Company LLP Page 1 of
Data last updated on: APR-04-2019
RMHLDETSCEQ 14
Cash and Cash Equivalents
Equities
Cash
Short-Term Cash Equivalents
Energy
Energy
-7,006
1
5,511
106,144
119
85,150
36
6,011,039
2,306,545
777,859
30,792
178,049
42,554
20,762
Security Shares orPar Value Unit Cost Unit Price Cost
Pct Asset Class YieldMarket Value
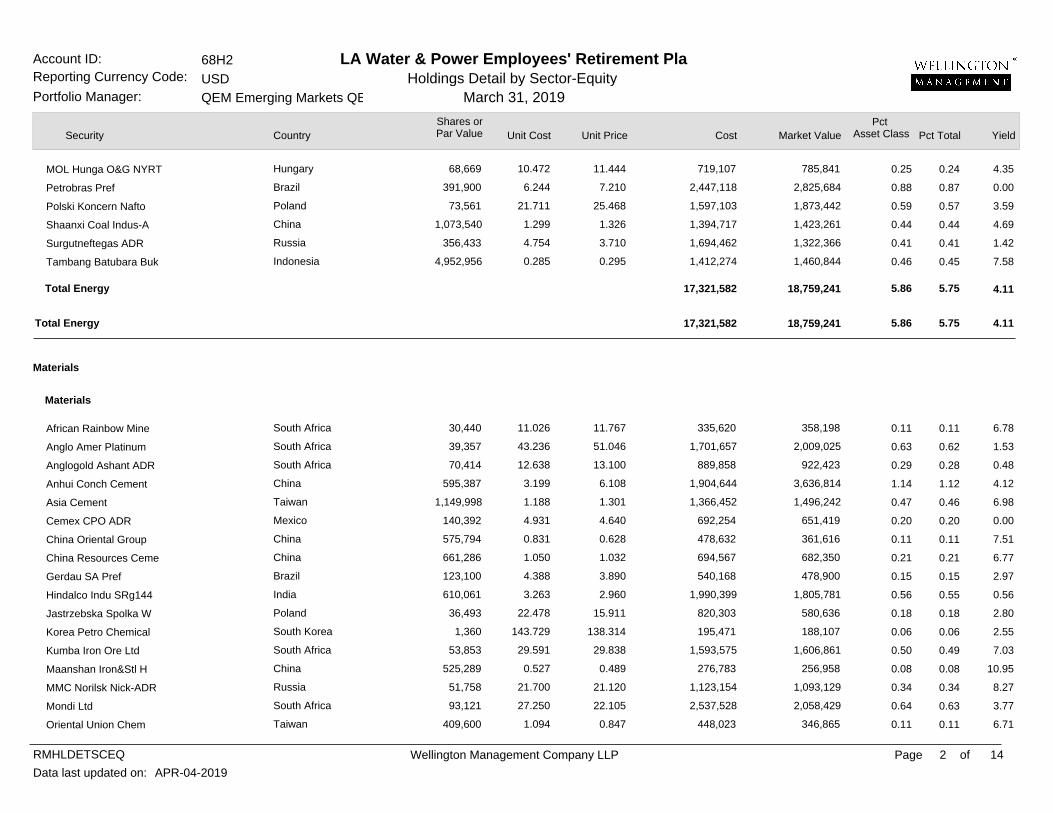
LA Water & Power Employees' Retirement Pla68H2USDQEM Emerging Markets QE
Holdings Detail by Sector-EquityMarch 31, 2019
0.252
0.127
0.051
0.069
0.001
0.183
100.000
0.904
2.343
9.097
8.434
21.871
69.199
100.000
0.789
2.280
21.440
11.396
21.754
89.600
-1,767
702
5,464
8
75
7
6,011,039
2,084,905
1,822,622
280,105
1,501,746
930,705
1,436,719
-1,800
702
5,472
8
75
6
6,020,780
1,818,803
1,773,728
660,180
2,029,113
925,702
1,860,275
-0.03
0.01
0.09
*
*
*
99.93
0.57
0.55
0.21
0.63
0.29
0.58
6.43
0.03
2.67
8.52
6.98
1.75
25.00
2.53
7.93
5.74
2.85
6.60
1.20
3.37
Total Cash and Cash Equivalents 6,015,528
Total Cash
Total Short-Term Cash Equivalents
4,489
6,011,039
6,025,243
4,464
6,020,780
0.07
99.93
2.54
8.35
2.53
Pct Total
*
*
*
*
*
*
1.85
0.56
0.54
0.20
0.62
0.28
0.57
1.85
0.00
1.85
Account ID: Reporting Currency Code:
Portfolio Manager:
********
********
********
********
********
********
********
Brazilian Real
Forint
Hong Kong Dollar
Mexican Peso
South African Rand
South Korean Won
Turkish Lira (New)
COLTV STIF 2.5340%
China Petro&Chem-H
China Shenhua Energy
Ecopetrol SA ADR
Exxaro Resources Ltd
Grupa Lotos SA
Lukoil PJSC Spon ADR
********
*************
*************
*************
*************
*************
100.00
Brazil
Hungary
Hong Kong
Mexico
South Africa
South Korea
Turkey
United States
China
China
Colombia
South Africa
Poland
Russia
Country
Wellington Management Company LLP Page 2 of
Data last updated on: APR-04-2019
RMHLDETSCEQ 14
Materials
Materials
68,669
391,900
73,561
1,073,540
356,433
4,952,956
30,440
39,357
70,414
595,387
1,149,998
140,392
575,794
661,286
123,100
610,061
36,493
1,360
53,853
525,289
51,758
93,121
409,600
Security Shares orPar Value Unit Cost Unit Price Cost
Pct Asset Class YieldMarket Value
LA Water & Power Employees' Retirement Pla68H2USDQEM Emerging Markets QE
Holdings Detail by Sector-EquityMarch 31, 2019
10.472
6.244
21.711
1.299
4.754
0.285
11.026
43.236
12.638
3.199
1.188
4.931
0.831
1.050
4.388
3.263
22.478
143.729
29.591
0.527
21.700
27.250
1.094
11.444
7.210
25.468
1.326
3.710
0.295
11.767
51.046
13.100
6.108
1.301
4.640
0.628
1.032
3.890
2.960
15.911
138.314
29.838
0.489
21.120
22.105
0.847
719,107
2,447,118
1,597,103
1,394,717
1,694,462
1,412,274
335,620
1,701,657
889,858
1,904,644
1,366,452
692,254
478,632
694,567
540,168
1,990,399
820,303
195,471
1,593,575
276,783
1,123,154
2,537,528
448,023
785,841
2,825,684
1,873,442
1,423,261
1,322,366
1,460,844
358,198
2,009,025
922,423
3,636,814
1,496,242
651,419
361,616
682,350
478,900
1,805,781
580,636
188,107
1,606,861
256,958
1,093,129
2,058,429
346,865
0.25
0.88
0.59
0.44
0.41
0.46
0.11
0.63
0.29
1.14
0.47
0.20
0.11
0.21
0.15
0.56
0.18
0.06
0.50
0.08
0.34
0.64
0.11
4.35
0.00
3.59
4.69
1.42
7.58
6.78
1.53
0.48
4.12
6.98
0.00
7.51
6.77
2.97
0.56
2.80
2.55
7.03
10.95
8.27
3.77
6.71
Total Energy 17,321,582
Total Energy 17,321,582
18,759,241
18,759,241
5.86
5.86
4.11
4.11
Pct Total
0.24
0.87
0.57
0.44
0.41
0.45
0.11
0.62
0.28
1.12
0.46
0.20
0.11
0.21
0.15
0.55
0.18
0.06
0.49
0.08
0.34
0.63
0.11
5.75
5.75
Account ID: Reporting Currency Code:
Portfolio Manager:
********
********
********
********
********
MOL Hunga O&G NYRT
Petrobras Pref
Polski Koncern Nafto
Shaanxi Coal Indus-A
Surgutneftegas ADR
Tambang Batubara Buk
African Rainbow Mine
Anglo Amer Platinum
Anglogold Ashant ADR
Anhui Conch Cement
Asia Cement
Cemex CPO ADR
China Oriental Group
China Resources Ceme
Gerdau SA Pref
Hindalco Indu SRg144
Jastrzebska Spolka W
Korea Petro Chemical
Kumba Iron Ore Ltd
Maanshan Iron&Stl H
MMC Norilsk Nick-ADR
Mondi Ltd
Oriental Union Chem
*************
*************
Hungary
Brazil
Poland
China
Russia
Indonesia
South Africa
South Africa
South Africa
China
Taiwan
Mexico
China
China
Brazil
India
Poland
South Korea
South Africa
China
Russia
South Africa
Taiwan
Country

Wellington Management Company LLP Page 3 of
Data last updated on: APR-04-2019
RMHLDETSCEQ 14
Industrials
Capital Goods
11,872
538,828
277,316
1,455,255
158,880
873,803
180,170
189,991
94,597
227,737
159,693
2,007,156
7,162
318,119
287,422
34,105
36,728
11,376
1,151,399
228,121
522,264
1,374,235
196,234
Security Shares orPar Value Unit Cost Unit Price Cost
Pct Asset Class YieldMarket Value
LA Water & Power Employees' Retirement Pla68H2USDQEM Emerging Markets QE
Holdings Detail by Sector-EquityMarch 31, 2019
218.125
1.030
4.019
0.548
1.317
1.318
7.573
12.249
11.383
1.267
10.953
1.490
70.776
1.240
1.371
32.217
17.503
55.552
0.330
1.282
1.192
0.678
0.664
222.888
1.091
4.176
0.476
1.328
1.338
7.400
13.087
10.560
1.064
8.806
1.493
84.926
1.579
1.694
26.782
16.695
68.276
0.324
1.630
1.902
0.546
0.759
2,589,582
555,035
1,114,414
797,768
209,200
1,151,814
1,364,446
2,327,270
1,076,782
288,550
1,749,081
2,989,895
506,895
394,548
394,082
1,098,774
642,855
631,955
380,384
292,428
622,351
931,607
130,224
2,646,125
587,727
1,157,948
693,336
210,918
1,169,493
1,333,258
2,486,379
998,944
242,207
1,406,328
2,996,690
608,243
502,220
486,973
913,393
613,158
776,707
372,557
371,837
993,138
750,654
149,023
0.83
0.18
0.36
0.22
0.07
0.37
0.42
0.78
0.31
0.08
0.44
0.94
0.19
0.16
0.15
0.29
0.19
0.24
0.12
0.12
0.31
0.23
0.05
3.95
0.00
0.00
7.81
4.60
8.00
1.69
0.00
9.75
3.78
3.64
3.50
1.76
0.00
2.78
2.30
0.79
2.58
7.87
0.72
1.41
2.69
2.08
Total Materials 28,775,400
Total Materials 28,775,400
29,817,881
29,817,881
9.31
9.31
3.85
3.85
Pct Total
0.81
0.18
0.36
0.21
0.06
0.36
0.41
0.76
0.31
0.07
0.43
0.92
0.19
0.15
0.15
0.28
0.19
0.24
0.11
0.11
0.30
0.23
0.05
9.14
9.14
Account ID: Reporting Currency Code:
Portfolio Manager:
********
********
********
********
********
POSCO
Sibanye Gold Ltd
Siderurgica Nacional
Sinopec Shanghai Pet
Soda Sanayii AS
Taiwan Cement
Tata Steel GDR RgSS
Vale
Vedanta Ltd -ADR
Alfa SAB -A
Barloworld Ltd
Citic Ltd
Daelim Industrial Co
Dongfang Elec Corp A
Fosun Intl Ltd
Han Wha Corporation
HDC Holdings Co Ltd
LG Corp
Lonking Holdings Ltd
NCC LTD RgSS
Sany Heavy Industry
Sime Darby Bhd
Sino Thai Engineerin
*************
*************
South Korea
South Africa
Brazil
China
Turkey
Taiwan
India
Brazil
India
Mexico
South Africa
China
South Korea
China
China
South Korea
South Korea
South Korea
China
India
China
Malaysia
Thailand
Country
Wellington Management Company LLP Page 4 of
Data last updated on: APR-04-2019
RMHLDETSCEQ 14
Consumer Discretionary
Commercial & Professional Services
Transportation
Automobiles & Components
197,858
414,495
797,687
338,568
11,282
153,498
1,581,112
407,509
2,794,690
4,969
95,550
1,118,475
149,128
Security Shares orPar Value Unit Cost Unit Price Cost
Pct Asset Class YieldMarket Value
LA Water & Power Employees' Retirement Pla68H2USDQEM Emerging Markets QE
Holdings Detail by Sector-EquityMarch 31, 2019
1.345
2.512
0.620
1.140
31.370
5.725
0.548
0.567
1.104
107.574
30.944
1.081
2.709
2.127
3.990
0.588
1.597
30.658
5.654
0.514
0.654
1.001
105.277
31.143
0.899
3.436
266,142
1,041,329
494,204
385,904
353,916
878,755
866,287
231,230
3,086,092
534,538
2,956,696
1,208,674
403,973
420,924
1,653,695
468,763
540,850
345,885
867,929
813,318
266,310
2,798,268
523,122
2,975,678
1,005,922
512,356
0.13
0.52
0.15
0.17
0.11
0.27
0.25
0.08
0.87
0.16
0.93
0.31
0.16
3.83
5.05
4.10
4.29
5.14
3.71
2.59
4.33
5.20
3.35
2.55
5.38
5.20
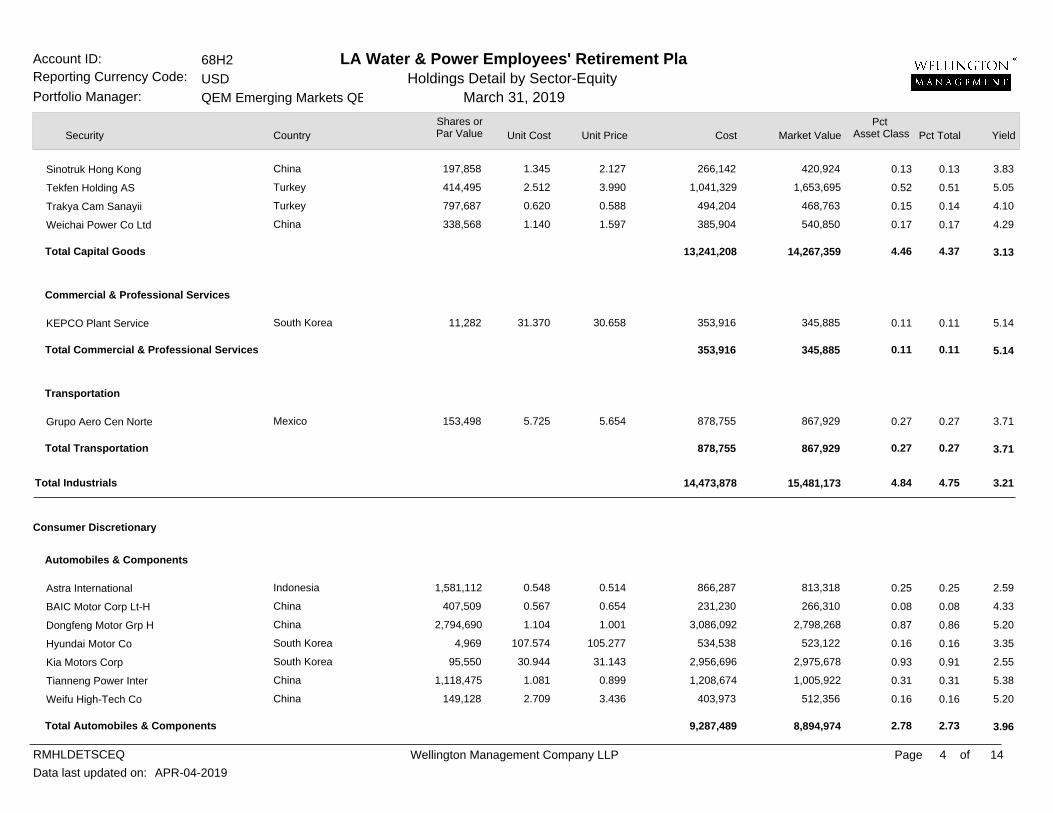
Total Industrials 14,473,878
Total Capital Goods
Total Commercial & Professional Services
Total Transportation
Total Automobiles & Components
13,241,208
353,916
878,755
9,287,489
15,481,173
14,267,359
345,885
867,929
8,894,974
4.84
4.46
0.11
0.27
2.78
3.21
3.13
5.14
3.71
3.96
Pct Total
0.13
0.51
0.14
0.17
0.11
0.27
0.25
0.08
0.86
0.16
0.91
0.31
0.16
4.75
4.37
0.11
0.27
2.73
Account ID: Reporting Currency Code:
Portfolio Manager:
********
********
********
********
********
********
********
********
********
Sinotruk Hong Kong
Tekfen Holding AS
Trakya Cam Sanayii
Weichai Power Co Ltd
KEPCO Plant Service
Grupo Aero Cen Norte
Astra International
BAIC Motor Corp Lt-H
Dongfeng Motor Grp H
Hyundai Motor Co
Kia Motors Corp
Tianneng Power Inter
Weifu High-Tech Co
*************
*************
*************
*************
*************
*************
*************
China
Turkey
Turkey
China
South Korea
Mexico
Indonesia
China
China
South Korea
South Korea
China
China
Country
Wellington Management Company LLP Page 5 of
Data last updated on: APR-04-2019
RMHLDETSCEQ 14
Consumer Durables & Apparel
Consumer Services
Retailing
193,266
24,999
182,049
43,230
43,921
7,890
310,851
32,400
443,196
214,531
600,269
17,810
42,699
34,363
9,763
8,181
15,238
272,528
1,961
Security Shares orPar Value Unit Cost Unit Price Cost
Pct Asset Class YieldMarket Value
LA Water & Power Employees' Retirement Pla68H2USDQEM Emerging Markets QE
Holdings Detail by Sector-EquityMarch 31, 2019
4.946
7.135
6.025
32.925
4.964
22.789
5.586
8.405
0.732
8.519
2.071
41.083
121.562
41.651
88.895
113.948
185.769
6.061
163.704
6.803
6.886
7.073
68.716
7.138
25.108
7.008
8.809
0.410
6.835
1.626
44.910
182.450
43.690
88.979
96.027
231.058
5.949
263.853
955,971
178,363
1,096,838
1,423,339
218,035
179,807
1,736,303
272,328
324,221
1,827,683
1,243,039
731,695
5,190,589
1,431,268
867,883
932,212
2,830,741
1,651,685
321,023
1,314,710
172,154
1,287,672
2,970,611
313,513
198,101
2,178,544
285,414
181,796
1,466,332
976,310
799,847
7,790,433
1,501,319
868,701
785,595
3,520,856
1,621,148
517,417
0.41
0.05
0.40
0.93
0.10
0.06
0.68
0.09
0.06
0.46
0.30
0.25
2.43
0.47
0.27
0.25
1.10
0.51
0.16
1.46
0.52
3.07
0.06
2.09
1.58
3.29
3.68
3.45
1.92
3.24
1.07
0.00
0.00
0.89
1.74
0.20
11.23
0.28
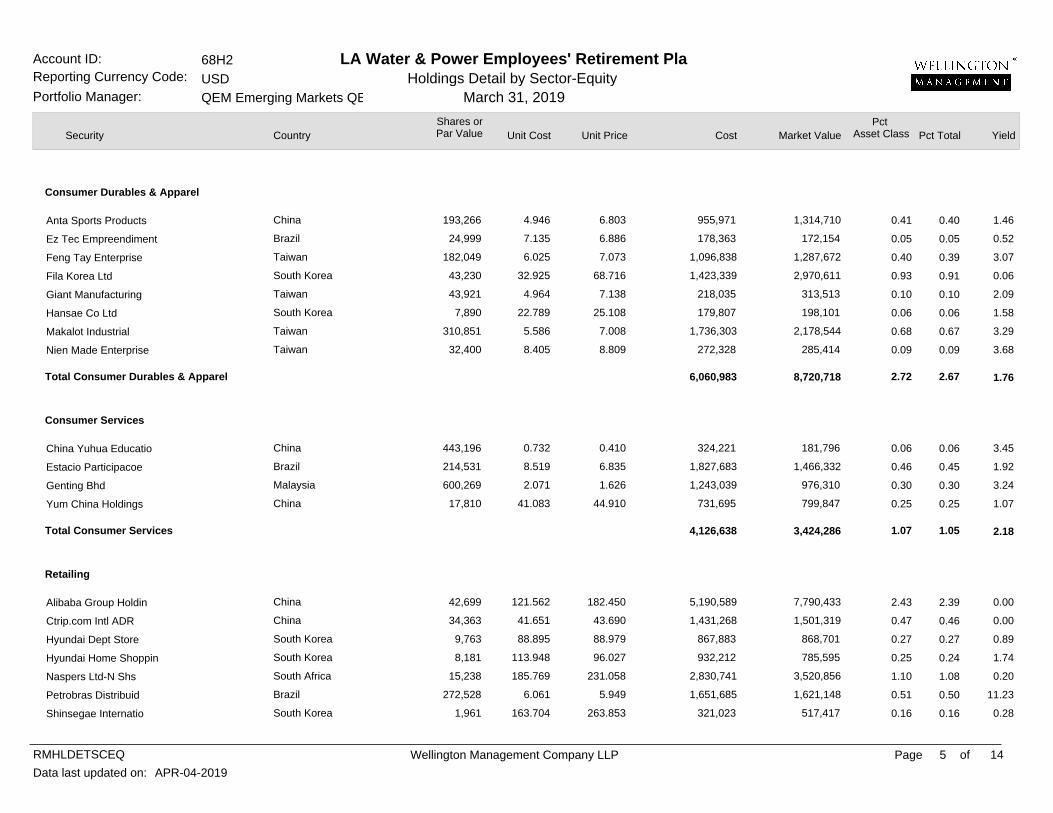
Total Consumer Durables & Apparel
Total Consumer Services
6,060,983
4,126,638
8,720,718
3,424,286
2.72
1.07
1.76
2.18
Pct Total
0.40
0.05
0.39
0.91
0.10
0.06
0.67
0.09
0.06
0.45
0.30
0.25
2.39
0.46
0.27
0.24
1.08
0.50
0.16
2.67
1.05
Account ID: Reporting Currency Code:
Portfolio Manager:
********
********
********
********
********
********
********
Anta Sports Products
Ez Tec Empreendiment
Feng Tay Enterprise
Fila Korea Ltd
Giant Manufacturing
Hansae Co Ltd
Makalot Industrial
Nien Made Enterprise
China Yuhua Educatio
Estacio Participacoe
Genting Bhd
Yum China Holdings
Alibaba Group Holdin
Ctrip.com Intl ADR
Hyundai Dept Store
Hyundai Home Shoppin
Naspers Ltd-N Shs
Petrobras Distribuid
Shinsegae Internatio
*************
*************
*************
*************
*************
*************
China
Brazil
Taiwan
South Korea
Taiwan
South Korea
Taiwan
Taiwan
China
Brazil
Malaysia
China
China
China
South Korea
South Korea
South Africa
Brazil
South Korea
Country

Wellington Management Company LLP Page 6 of
Data last updated on: APR-04-2019
RMHLDETSCEQ 14
Consumer Staples
Food & Staples Retailing
Food Beverage & Tobacco
Household & Personal Products
20,169
64,020
45,198
1,508,230
211,908
377,571
12,170
88,984
827,475
28,964
1,370,504
305,178
146,451
174,885
Security Shares orPar Value Unit Cost Unit Price Cost
Pct Asset Class YieldMarket Value
LA Water & Power Employees' Retirement Pla68H2USDQEM Emerging Markets QE
Holdings Detail by Sector-EquityMarch 31, 2019
15.872
12.916
13.764
2.289
5.455
3.165
99.869
6.648
0.535
13.889
2.210
2.316
7.411
9.216
13.488
12.774
13.305
2.677
5.843
4.091
91.181
9.420
0.449
10.551
2.427
4.452
9.555
13.692
320,128
826,875
622,117
3,452,795
1,155,924
1,195,102
1,215,410
591,603
442,964
402,283
3,028,487
706,809
1,085,277
1,611,780
272,033
817,760
601,376
4,036,979
1,238,114
1,544,551
1,109,678
838,249
371,899
305,589
3,326,153
1,358,731
1,399,387
2,394,558
0.08
0.26
0.19
1.26
0.39
0.48
0.35
0.26
0.12
0.10
1.04
0.42
0.44
0.75
4.20
2.06
3.80
3.37
3.13
0.29
3.87
0.08
0.88
10.24
3.34
0.50
4.08
1.66
Total Consumer Discretionary 32,700,510
Total Retailing
Total Food & Staples Retailing
Total Food Beverage & Tobacco
13,225,400
5,221,915
8,738,580
37,645,447
16,605,470
5,728,148
10,092,964
11.76
5.19
1.79
3.15
2.10
1.28
3.27
2.37
Pct Total
0.08
0.25
0.18
1.24
0.38
0.47
0.34
0.26
0.11
0.09
1.02
0.42
0.43
0.73
11.54
5.09
1.76
3.09
Account ID: Reporting Currency Code:
Portfolio Manager:
********
********
********
********
********
********
********
********
********
BIM Birlesik Magazal
Clicks Group Ltd
Spar Group Ltd/The
Wal-Mart de Mexico
Gudang Garam Tbk Pt
JBS SA
KT&G Corp
Muyuan Foodstuff Co
PT Charoen Pokphand
SLC Agricola SA
Uni-President Enterp
Yihai Intl Hldg Ltd
Chlitina Holding Ltd
TCI Co Ltd
*************
*************
*************
*************
*************
*************
Turkey
South Africa
South Africa
Mexico
Indonesia
Brazil
South Korea
China
Indonesia
Brazil
Taiwan
China
Taiwan
Taiwan
Country
Wellington Management Company LLP Page 7 of
Data last updated on: APR-04-2019
RMHLDETSCEQ 14
Health Care
Financials
Health Care Equipment & Services
Pharma, Biotech & Life Sciences
Banks
629,139
564,396
335,103
77,861
130,950
118,675
1,551,892
2,280,467
906,060
175,690
125,510
Security Shares orPar Value Unit Cost Unit Price Cost
Pct Asset Class YieldMarket Value
LA Water & Power Employees' Retirement Pla68H2USDQEM Emerging Markets QE
Holdings Detail by Sector-EquityMarch 31, 2019
0.517
0.977
2.178
34.700
3.766
3.202
0.830
0.381
1.467
4.836
11.137
0.536
0.969
1.001
40.500
4.408
3.942
0.874
0.242
0.912
4.331
10.547
325,064
551,513
729,720
2,701,762
493,158
380,033
1,287,406
869,525
1,329,223
849,673
1,397,756
337,021
547,144
335,532
3,153,371
577,185
467,838
1,356,184
551,964
826,424
760,955
1,323,746
0.11
0.17
0.10
0.99
0.18
0.15
0.42
0.17
0.26
0.24
0.41
1.35
4.52
4.72
0.67
1.43
0.00
1.69
1.05
0.93
3.44
7.30
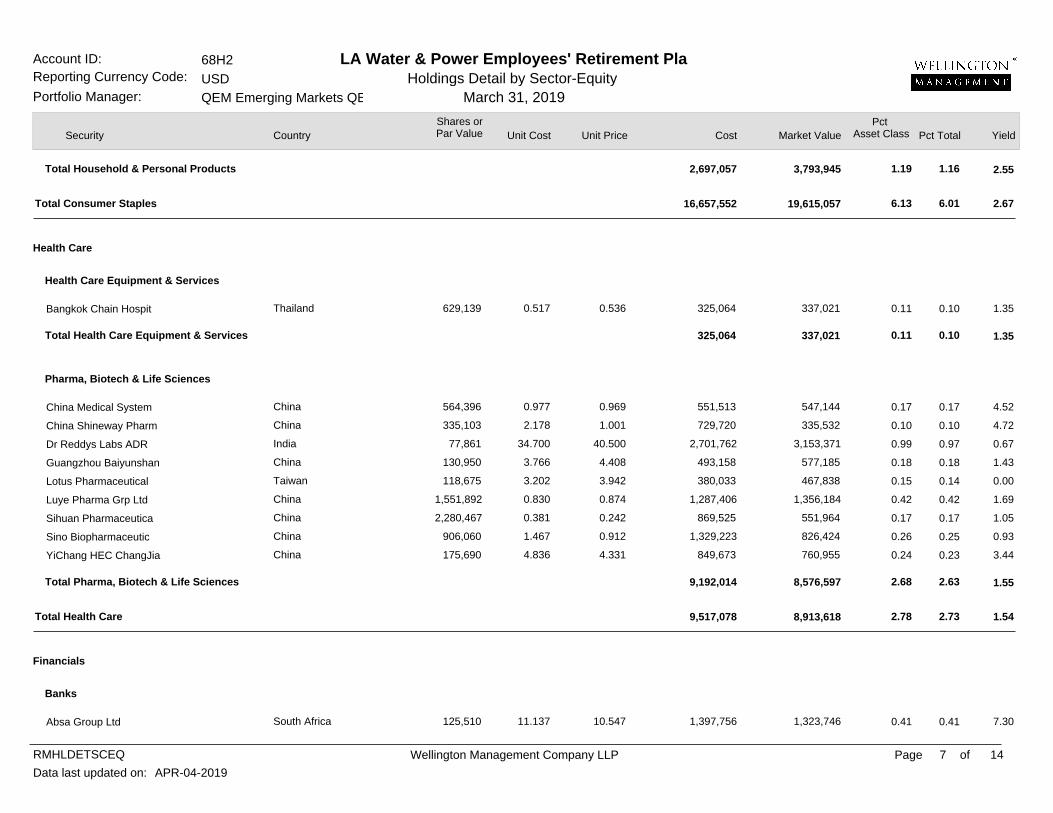
Total Consumer Staples
Total Health Care
16,657,552
9,517,078
Total Household & Personal Products
Total Health Care Equipment & Services
Total Pharma, Biotech & Life Sciences
2,697,057
325,064
9,192,014
19,615,057
8,913,618
3,793,945
337,021
8,576,597
6.13
2.78
1.19
0.11
2.68
2.67
1.54
2.55
1.35
1.55
Pct Total
0.10
0.17
0.10
0.97
0.18
0.14
0.42
0.17
0.25
0.23
0.41
6.01
2.73
1.16
0.10
2.63
Account ID: Reporting Currency Code:
Portfolio Manager:
********
********
********
********
********
********
********
********
********
********
********
Bangkok Chain Hospit
China Medical System
China Shineway Pharm
Dr Reddys Labs ADR
Guangzhou Baiyunshan
Lotus Pharmaceutical
Luye Pharma Grp Ltd
Sihuan Pharmaceutica
Sino Biopharmaceutic
YiChang HEC ChangJia
Absa Group Ltd
*************
*************
*************
*************
*************
Thailand
China
China
India
China
Taiwan
China
China
China
China
South Africa
Country
Wellington Management Company LLP Page 8 of
Data last updated on: APR-04-2019
RMHLDETSCEQ 14
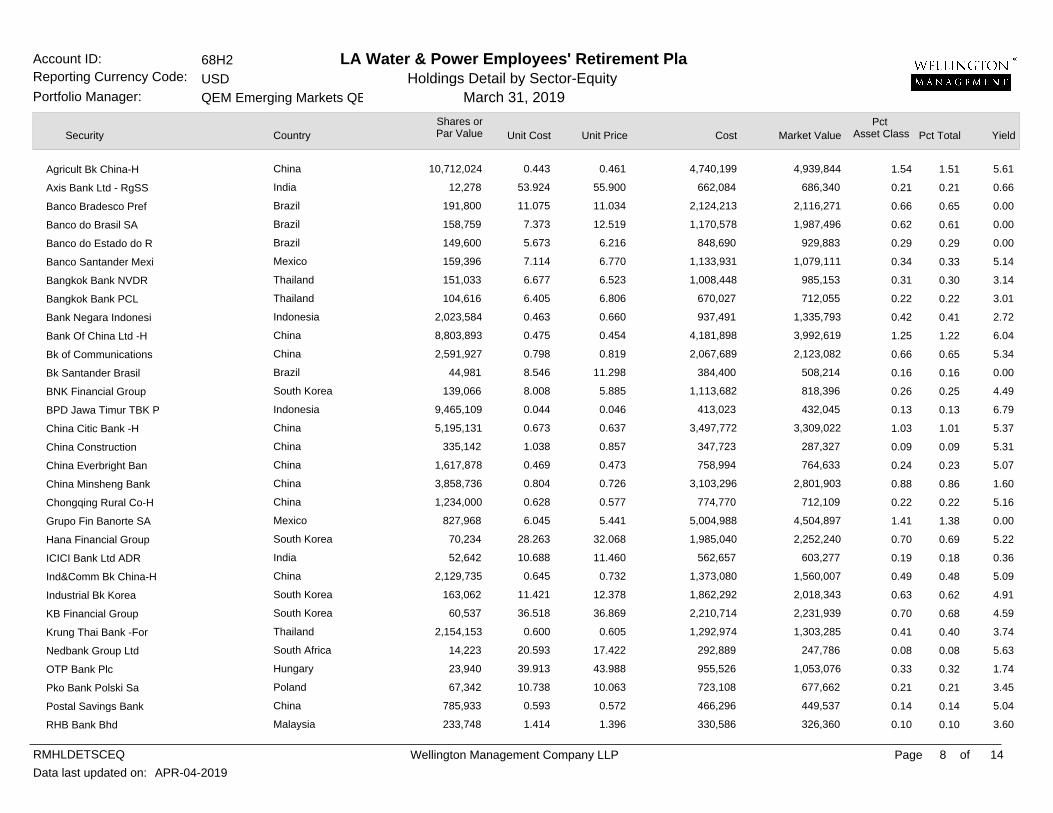
10,712,024
12,278
191,800
158,759
149,600
159,396
151,033
104,616
2,023,584
8,803,893
2,591,927
44,981
139,066
9,465,109
5,195,131
335,142
1,617,878
3,858,736
1,234,000
827,968
70,234
52,642
2,129,735
163,062
60,537
2,154,153
14,223
23,940
67,342
785,933
233,748
Security Shares orPar Value Unit Cost Unit Price Cost
Pct Asset Class YieldMarket Value
LA Water & Power Employees' Retirement Pla68H2USDQEM Emerging Markets QE
Holdings Detail by Sector-EquityMarch 31, 2019
0.443
53.924
11.075
7.373
5.673
7.114
6.677
6.405
0.463
0.475
0.798
8.546
8.008
0.044
0.673
1.038
0.469
0.804
0.628
6.045
28.263
10.688
0.645
11.421
36.518
0.600
20.593
39.913
10.738
0.593
1.414
0.461
55.900
11.034
12.519
6.216
6.770
6.523
6.806
0.660
0.454
0.819
11.298
5.885
0.046
0.637
0.857
0.473
0.726
0.577
5.441
32.068
11.460
0.732
12.378
36.869
0.605
17.422
43.988
10.063
0.572
1.396
4,740,199
662,084
2,124,213
1,170,578
848,690
1,133,931
1,008,448
670,027
937,491
4,181,898
2,067,689
384,400
1,113,682
413,023
3,497,772
347,723
758,994
3,103,296
774,770
5,004,988
1,985,040
562,657
1,373,080
1,862,292
2,210,714
1,292,974
292,889
955,526
723,108
466,296
330,586
4,939,844
686,340
2,116,271
1,987,496
929,883
1,079,111
985,153
712,055
1,335,793
3,992,619
2,123,082
508,214
818,396
432,045
3,309,022
287,327
764,633
2,801,903
712,109
4,504,897
2,252,240
603,277
1,560,007
2,018,343
2,231,939
1,303,285
247,786
1,053,076
677,662
449,537
326,360
1.54
0.21
0.66
0.62
0.29
0.34
0.31
0.22
0.42
1.25
0.66
0.16
0.26
0.13
1.03
0.09
0.24
0.88
0.22
1.41
0.70
0.19
0.49
0.63
0.70
0.41
0.08
0.33
0.21
0.14
0.10
5.61
0.66
0.00
0.00
0.00
5.14
3.14
3.01
2.72
6.04
5.34
0.00
4.49
6.79
5.37
5.31
5.07
1.60
5.16
0.00
5.22
0.36
5.09
4.91
4.59
3.74
5.63
1.74
3.45
5.04
3.60
Pct Total
1.51
0.21
0.65
0.61
0.29
0.33
0.30
0.22
0.41
1.22
0.65
0.16
0.25
0.13
1.01
0.09
0.23
0.86
0.22
1.38
0.69
0.18
0.48
0.62
0.68
0.40
0.08
0.32
0.21
0.14
0.10
Account ID: Reporting Currency Code:
Portfolio Manager:
********
Agricult Bk China-H
Axis Bank Ltd - RgSS
Banco Bradesco Pref
Banco do Brasil SA
Banco do Estado do R
Banco Santander Mexi
Bangkok Bank NVDR
Bangkok Bank PCL
Bank Negara Indonesi
Bank Of China Ltd -H
Bk of Communications
Bk Santander Brasil
BNK Financial Group
BPD Jawa Timur TBK P
China Citic Bank -H
China Construction
China Everbright Ban
China Minsheng Bank
Chongqing Rural Co-H
Grupo Fin Banorte SA
Hana Financial Group
ICICI Bank Ltd ADR
Ind&Comm Bk China-H
Industrial Bk Korea
KB Financial Group
Krung Thai Bank -For
Nedbank Group Ltd
OTP Bank Plc
Pko Bank Polski Sa
Postal Savings Bank
RHB Bank Bhd
China
India
Brazil
Brazil
Brazil
Mexico
Thailand
Thailand
Indonesia
China
China
Brazil
South Korea
Indonesia
China
China
China
China
China
Mexico
South Korea
India
China
South Korea
South Korea
Thailand
South Africa
Hungary
Poland
China
Malaysia
Country
Wellington Management Company LLP Page 9 of
Data last updated on: APR-04-2019
RMHLDETSCEQ 14
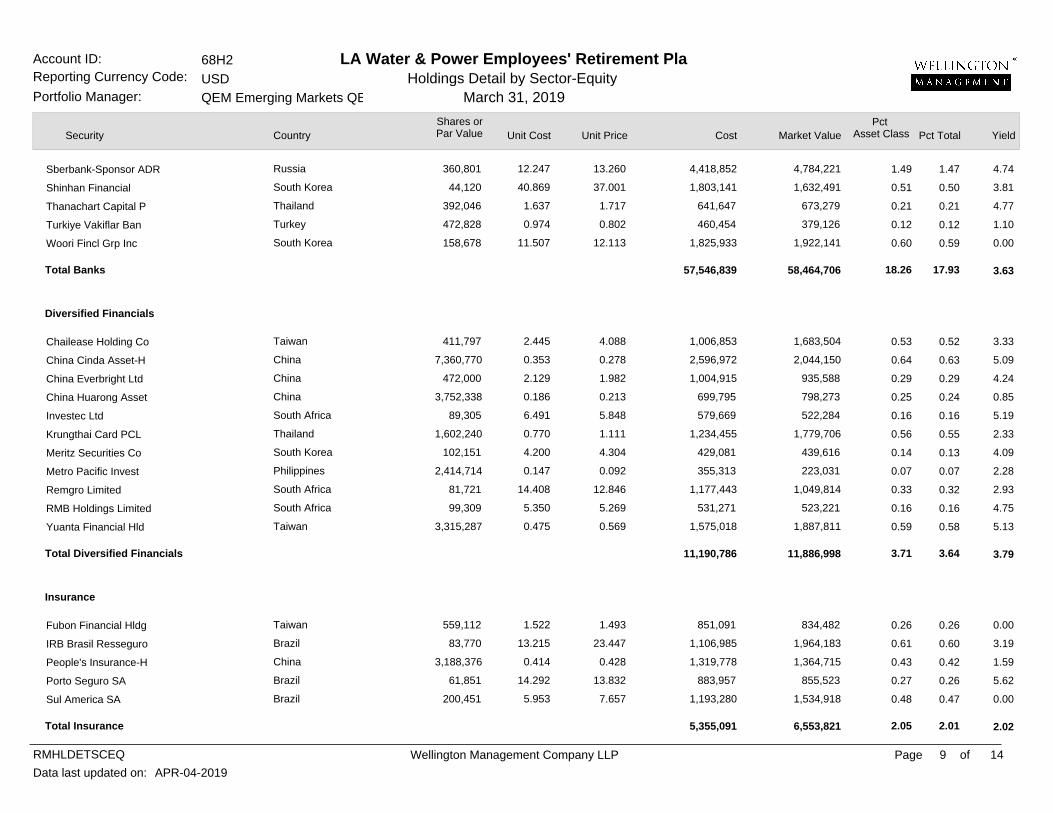
Diversified Financials
Insurance
360,801
44,120
392,046
472,828
158,678
411,797
7,360,770
472,000
3,752,338
89,305
1,602,240
102,151
2,414,714
81,721
99,309
3,315,287
559,112
83,770
3,188,376
61,851
200,451
Security Shares orPar Value Unit Cost Unit Price Cost
Pct Asset Class YieldMarket Value
LA Water & Power Employees' Retirement Pla68H2USDQEM Emerging Markets QE
Holdings Detail by Sector-EquityMarch 31, 2019
12.247
40.869
1.637
0.974
11.507
2.445
0.353
2.129
0.186
6.491
0.770
4.200
0.147
14.408
5.350
0.475
1.522
13.215
0.414
14.292
5.953
13.260
37.001
1.717
0.802
12.113
4.088
0.278
1.982
0.213
5.848
1.111
4.304
0.092
12.846
5.269
0.569
1.493
23.447
0.428
13.832
7.657
4,418,852
1,803,141
641,647
460,454
1,825,933
1,006,853
2,596,972
1,004,915
699,795
579,669
1,234,455
429,081
355,313
1,177,443
531,271
1,575,018
851,091
1,106,985
1,319,778
883,957
1,193,280
4,784,221
1,632,491
673,279
379,126
1,922,141
1,683,504
2,044,150
935,588
798,273
522,284
1,779,706
439,616
223,031
1,049,814
523,221
1,887,811
834,482
1,964,183
1,364,715
855,523
1,534,918
1.49
0.51
0.21
0.12
0.60
0.53
0.64
0.29
0.25
0.16
0.56
0.14
0.07
0.33
0.16
0.59
0.26
0.61
0.43
0.27
0.48
4.74
3.81
4.77
1.10
0.00
3.33
5.09
4.24
0.85
5.19
2.33
4.09
2.28
2.93
4.75
5.13
0.00
3.19
1.59
5.62
0.00
Total Banks
Total Diversified Financials
Total Insurance
57,546,839
11,190,786
5,355,091
58,464,706
11,886,998
6,553,821
18.26
3.71
2.05
3.63
3.79
2.02
Pct Total
1.47
0.50
0.21
0.12
0.59
0.52
0.63
0.29
0.24
0.16
0.55
0.13
0.07
0.32
0.16
0.58
0.26
0.60
0.42
0.26
0.47
17.93
3.64
2.01
Account ID: Reporting Currency Code:
Portfolio Manager:
********
********
********
********
********
Sberbank-Sponsor ADR
Shinhan Financial
Thanachart Capital P
Turkiye Vakiflar Ban
Woori Fincl Grp Inc
Chailease Holding Co
China Cinda Asset-H
China Everbright Ltd
China Huarong Asset
Investec Ltd
Krungthai Card PCL
Meritz Securities Co
Metro Pacific Invest
Remgro Limited
RMB Holdings Limited
Yuanta Financial Hld
Fubon Financial Hldg
IRB Brasil Resseguro
People's Insurance-H
Porto Seguro SA
Sul America SA
*************
*************
*************
*************
*************
Russia
South Korea
Thailand
Turkey
South Korea
Taiwan
China
China
China
South Africa
Thailand
South Korea
Philippines
South Africa
South Africa
Taiwan
Taiwan
Brazil
China
Brazil
Brazil
Country
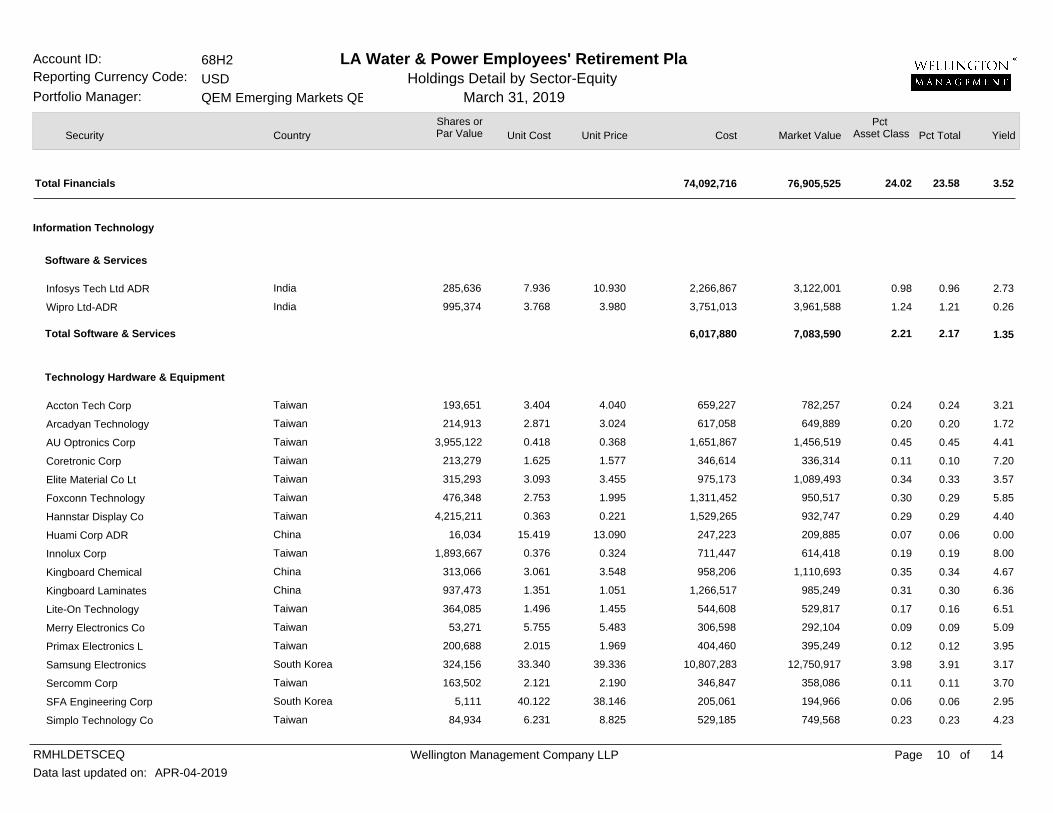
Wellington Management Company LLP Page 10 of
Data last updated on: APR-04-2019
RMHLDETSCEQ 14
Information Technology
Software & Services
Technology Hardware & Equipment
285,636
995,374
193,651
214,913
3,955,122
213,279
315,293
476,348
4,215,211
16,034
1,893,667
313,066
937,473
364,085
53,271
200,688
324,156
163,502
5,111
84,934
Security Shares orPar Value Unit Cost Unit Price Cost
Pct Asset Class YieldMarket Value
LA Water & Power Employees' Retirement Pla68H2USDQEM Emerging Markets QE
Holdings Detail by Sector-EquityMarch 31, 2019
7.936
3.768
3.404
2.871
0.418
1.625
3.093
2.753
0.363
15.419
0.376
3.061
1.351
1.496
5.755
2.015
33.340
2.121
40.122
6.231
10.930
3.980
4.040
3.024
0.368
1.577
3.455
1.995
0.221
13.090
0.324
3.548
1.051
1.455
5.483
1.969
39.336
2.190
38.146
8.825
2,266,867
3,751,013
659,227
617,058
1,651,867
346,614
975,173
1,311,452
1,529,265
247,223
711,447
958,206
1,266,517
544,608
306,598
404,460
10,807,283
346,847
205,061
529,185
3,122,001
3,961,588
782,257
649,889
1,456,519
336,314
1,089,493
950,517
932,747
209,885
614,418
1,110,693
985,249
529,817
292,104
395,249
12,750,917
358,086
194,966
749,568
0.98
1.24
0.24
0.20
0.45
0.11
0.34
0.30
0.29
0.07
0.19
0.35
0.31
0.17
0.09
0.12
3.98
0.11
0.06
0.23
2.73
0.26
3.21
1.72
4.41
7.20
3.57
5.85
4.40
0.00
8.00
4.67
6.36
6.51
5.09
3.95
3.17
3.70
2.95
4.23
Total Financials 74,092,716
Total Software & Services 6,017,880
76,905,525
7,083,590
24.02
2.21
3.52
1.35
Pct Total
0.96
1.21
0.24
0.20
0.45
0.10
0.33
0.29
0.29
0.06
0.19
0.34
0.30
0.16
0.09
0.12
3.91
0.11
0.06
0.23
23.58
2.17
Account ID: Reporting Currency Code:
Portfolio Manager:
********
********
********
********
********
********
********
Infosys Tech Ltd ADR
Wipro Ltd-ADR
Accton Tech Corp
Arcadyan Technology
AU Optronics Corp
Coretronic Corp
Elite Material Co Lt
Foxconn Technology
Hannstar Display Co
Huami Corp ADR
Innolux Corp
Kingboard Chemical
Kingboard Laminates
Lite-On Technology
Merry Electronics Co
Primax Electronics L
Samsung Electronics
Sercomm Corp
SFA Engineering Corp
Simplo Technology Co
*************
*************
*************
India
India
Taiwan
Taiwan
Taiwan
Taiwan
Taiwan
Taiwan
Taiwan
China
Taiwan
China
China
Taiwan
Taiwan
Taiwan
South Korea
Taiwan
South Korea
Taiwan
Country
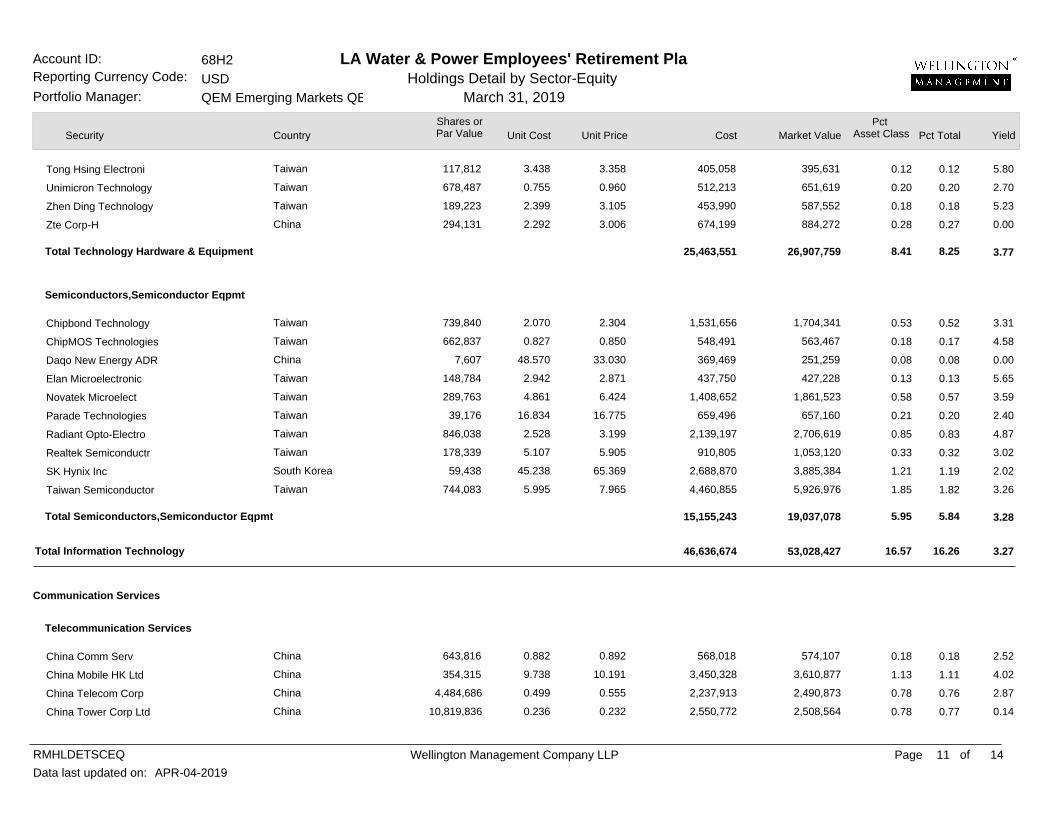
Wellington Management Company LLP Page 11 of
Data last updated on: APR-04-2019
RMHLDETSCEQ 14
Communication Services
Semiconductors,Semiconductor Eqpmt
Telecommunication Services
117,812
678,487
189,223
294,131
739,840
662,837
7,607
148,784
289,763
39,176
846,038
178,339
59,438
744,083
643,816
354,315
4,484,686
10,819,836
Security Shares orPar Value Unit Cost Unit Price Cost
Pct Asset Class YieldMarket Value
LA Water & Power Employees' Retirement Pla68H2USDQEM Emerging Markets QE
Holdings Detail by Sector-EquityMarch 31, 2019
3.438
0.755
2.399
2.292
2.070
0.827
48.570
2.942
4.861
16.834
2.528
5.107
45.238
5.995
0.882
9.738
0.499
0.236
3.358
0.960
3.105
3.006
2.304
0.850
33.030
2.871
6.424
16.775
3.199
5.905
65.369
7.965
0.892
10.191
0.555
0.232
405,058
512,213
453,990
674,199
1,531,656
548,491
369,469
437,750
1,408,652
659,496
2,139,197
910,805
2,688,870
4,460,855
568,018
3,450,328
2,237,913
2,550,772
395,631
651,619
587,552
884,272
1,704,341
563,467
251,259
427,228
1,861,523
657,160
2,706,619
1,053,120
3,885,384
5,926,976
574,107
3,610,877
2,490,873
2,508,564
0.12
0.20
0.18
0.28
0.53
0.18
0.08
0.13
0.58
0.21
0.85
0.33
1.21
1.85
0.18
1.13
0.78
0.78
5.80
2.70
5.23
0.00
3.31
4.58
0.00
5.65
3.59
2.40
4.87
3.02
2.02
3.26
2.52
4.02
2.87
0.14
Total Information Technology 46,636,674
Total Technology Hardware & Equipment
Total Semiconductors,Semiconductor Eqpmt
25,463,551
15,155,243
53,028,427
26,907,759
19,037,078
16.57
8.41
5.95
3.27
3.77
3.28
Pct Total
0.12
0.20
0.18
0.27
0.52
0.17
0.08
0.13
0.57
0.20
0.83
0.32
1.19
1.82
0.18
1.11
0.76
0.77
16.26
8.25
5.84
Account ID: Reporting Currency Code:
Portfolio Manager:
********
********
********
********
********
********
********
Tong Hsing Electroni
Unimicron Technology
Zhen Ding Technology
Zte Corp-H
Chipbond Technology
ChipMOS Technologies
Daqo New Energy ADR
Elan Microelectronic
Novatek Microelect
Parade Technologies
Radiant Opto-Electro
Realtek Semiconductr
SK Hynix Inc
Taiwan Semiconductor
China Comm Serv
China Mobile HK Ltd
China Telecom Corp
China Tower Corp Ltd
*************
*************
*************
*************
Taiwan
Taiwan
Taiwan
China
Taiwan
Taiwan
China
Taiwan
Taiwan
Taiwan
Taiwan
Taiwan
South Korea
Taiwan
China
China
China
China
Country

Wellington Management Company LLP Page 12 of
Data last updated on: APR-04-2019
RMHLDETSCEQ 14
Utilities
Media & Entertainment
Utilities
1,001,669
11,600
42,609
191,105
8,567
46,300
209,728
28,775
7,286
24,173
1,013,809
10,742
19,130
212,812
36,740
537,171
37,523
38,700
Security Shares orPar Value Unit Cost Unit Price Cost
Pct Asset Class YieldMarket Value
LA Water & Power Employees' Retirement Pla68H2USDQEM Emerging Markets QE
Holdings Detail by Sector-EquityMarch 31, 2019
1.089
13.499
15.115
7.352
222.396
13.026
3.705
86.811
42.042
8.389
1.431
23.680
45.832
29.389
9.680
4.256
10.369
18.089
1.268
12.440
13.611
6.145
221.566
12.205
5.056
105.120
52.167
8.158
1.386
27.134
34.711
45.988
9.428
4.713
10.792
19.822
1,090,552
156,593
644,024
1,404,960
1,905,268
603,091
776,999
2,497,979
306,317
202,776
1,450,868
254,375
876,769
6,254,419
355,660
2,285,948
389,074
700,064
1,269,640
144,304
579,957
1,174,359
1,898,159
565,113
1,060,474
3,024,828
380,088
197,200
1,405,135
291,475
664,014
9,786,703
346,376
2,531,905
404,956
767,099
0.40
0.05
0.18
0.37
0.59
0.18
0.33
0.94
0.12
0.06
0.44
0.09
0.21
3.06
0.11
0.79
0.13
0.24
1.57
2.93
2.59
5.64
3.98
0.00
4.79
0.00
0.00
0.81
3.16
0.40
0.00
0.28
0.00
2.08
0.00
0.00
Total Communication Services 27,232,019
Total Telecommunication Services
Total Media & Entertainment
15,388,517
11,843,502
31,625,871
15,876,427
15,749,444
9.88
4.96
4.92
1.71
2.94
0.47
Pct Total
0.39
0.04
0.18
0.36
0.58
0.17
0.33
0.93
0.12
0.06
0.43
0.09
0.20
3.00
0.11
0.78
0.12
0.24
9.70
4.87
4.83
Account ID: Reporting Currency Code:
Portfolio Manager:
********
********
********
********
********
********
********
China Unicom HK Ltd
Kt Corp-Sp ADR
LG Uplus Corp
MTN Group Ltd
SK Telecom Co Ltd
Telefonica Brasil SA
Telkom Sa Soc Ltd
Autohome Inc-Adr
CD Projekt SA
CJ Hellovision Co Lt
IGG Inc
JYP Entertainment Co
SM Entertainment Co
Tencent Holdings Ltd
Centrais Eletr Brasi
China Res Gas Group
Cia de Saneamento Ba
Cia Transmiss En-Pfd
*************
*************
*************
*************
China
South Korea
South Korea
South Africa
South Korea
Brazil
South Africa
China
Poland
South Korea
China
South Korea
South Korea
China
Brazil
China
Brazil
Brazil
Country

Wellington Management Company LLP Page 13 of
Data last updated on: APR-04-2019
RMHLDETSCEQ 14
Pooled Vehicle
Real Estate
Real Estate
158,407
117,457
117,640
30,822
110,581
58,034
169,755
128,473
29,690
216,222
431,200
418,437
473,698
432,996
453,095
5,130,000
6,612,928
187,070
Security Shares orPar Value Unit Cost Unit Price Cost
Pct Asset Class YieldMarket Value
LA Water & Power Employees' Retirement Pla68H2USDQEM Emerging Markets QE
Holdings Detail by Sector-EquityMarch 31, 2019
3.741
9.784
20.194
55.534
2.706
21.943
7.219
31.038
11.053
0.668
2.770
0.405
1.056
1.396
1.756
0.097
0.099
4.463
4.363
8.930
30.600
39.732
2.593
5.933
6.373
35.250
10.067
1.206
3.325
0.544
1.383
2.046
2.163
0.110
0.093
6.718
592,528
1,149,172
2,375,611
1,711,675
299,240
1,273,430
1,225,458
3,987,499
328,165
144,528
1,194,518
169,474
500,360
604,452
795,511
499,954
654,350
834,815
691,151
1,048,891
3,599,784
1,224,625
286,703
344,316
1,081,770
4,528,673
298,878
260,845
1,433,680
227,610
654,960
885,881
980,077
566,635
616,804
1,256,755
0.22
0.33
1.12
0.38
0.09
0.11
0.34
1.41
0.09
0.08
0.45
0.07
0.20
0.28
0.31
0.18
0.19
0.39
4.63
3.44
2.00
3.02
0.00
6.44
0.00
0.89
6.82
4.44
0.00
3.33
0.00
3.86
8.46
1.07
7.43
3.32
Total Utilities
Total Pooled Vehicle
12,357,859
3,987,499
Total Utilities 12,357,859
12,327,574
4,528,673
12,327,574
3.85
1.41
3.85
2.04
0.89
2.04
Pct Total
0.21
0.32
1.10
0.38
0.09
0.11
0.33
1.39
0.09
0.08
0.44
0.07
0.20
0.27
0.30
0.17
0.19
0.39
3.78
1.39
3.78
Account ID: Reporting Currency Code:
Portfolio Manager:
********
********
********
********
********
********
********
EDP - Energias do Br
Enersis Americas ADR
Gail India Limi RgSS
Korea Gas Corp
PGE SA
Reliance Infras RgSS
Transmissora Alianca
iShares MSCI India I
Barwa Real Estate Co
China Aoyuan Grp Ltd
China Evergrande Grp
China Overseas Grand
Fibra Uno Administra
Gemdale Corp-A
Guangzhou R&F Proper
Megaworld Corp
Quality Houses Pub
Seazen Holdings Co-A
*************
*************
*************
*************
Brazil
Chile
India
South Korea
Poland
India
Brazil
India
Qatar
China
China
China
Mexico
China
China
Philippines
Thailand
China
Country
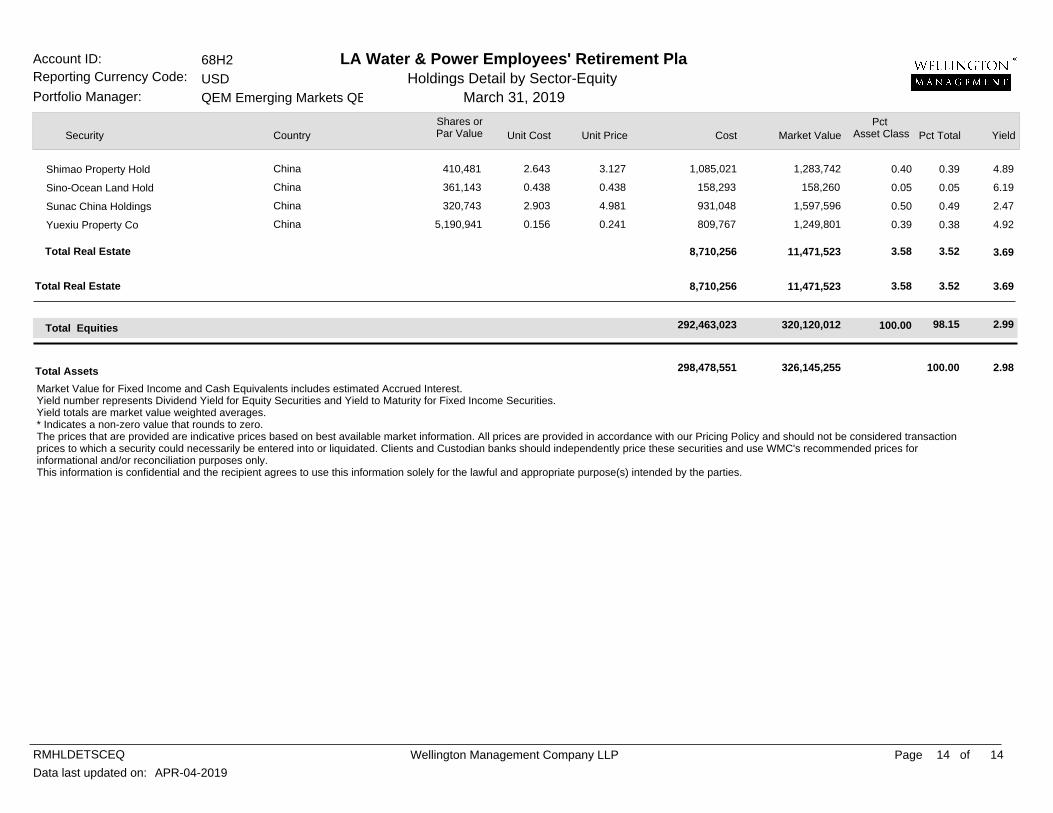
Wellington Management Company LLP Page 14 14of
Data last updated on: APR-04-2019
RMHLDETSCEQ
410,481
361,143
320,743
5,190,941
Security Shares orPar Value Unit Cost Unit Price Cost
Pct Asset Class YieldMarket Value
LA Water & Power Employees' Retirement Pla68H2USDQEM Emerging Markets QE
Holdings Detail by Sector-EquityMarch 31, 2019
2.643
0.438
2.903
0.156
3.127
0.438
4.981
0.241
1,085,021
158,293
931,048
809,767
1,283,742
158,260
1,597,596
1,249,801
0.40
0.05
0.50
0.39
4.89
6.19
2.47
4.92
Total Equities 292,463,023
Total Real Estate 8,710,256
Total Real Estate 8,710,256
320,120,012
11,471,523
11,471,523
3.58
3.58
2.99
3.69
3.69
Total Assets 298,478,551 326,145,255
Pct Total
0.39
0.05
0.49
0.38
98.15
3.52
3.52
100.00 2.98
Account ID: Reporting Currency Code:
Portfolio Manager:
********
********
********
Shimao Property Hold
Sino-Ocean Land Hold
Sunac China Holdings
Yuexiu Property Co
********
*************
Market Value for Fixed Income and Cash Equivalents includes estimated Accrued Interest.Yield number represents Dividend Yield for Equity Securities and Yield to Maturity for Fixed Income Securities.Yield totals are market value weighted averages.* Indicates a non-zero value that rounds to zero.The prices that are provided are indicative prices based on best available market information. All prices are provided in accordance with our Pricing Policy and should not be considered transaction prices to which a security could necessarily be entered into or liquidated. Clients and Custodian banks should independently price these securities and use WMC's recommended prices for informational and/or reconciliation purposes only.This information is confidential and the recipient agrees to use this information solely for the lawful and appropriate purpose(s) intended by the parties.
100.00
China
China
China
China
Country
Copyright © 2019 All Rights Reserved2001578581/497514_0/411669/411669A
-
Title Line 1Title Line 2
1 April 2019 page 36 Copyright © 2019 All Rights Reserved
Tmpl 1.6P0000001665
S0000006515
Important Notice
Wellington Management Company LLP (WMC) is an independently owned investment adviser registered with the US Securities and Exchange Commission (SEC). WMC is also a commodity trading advisor (CTA) registered with the US Commodity Futures Trading Commission. In certain circumstances, WMC provides commodity trading advice to clients in reliance on exemptions from CTA registration. WMC, along with its affiliates (collectively, Wellington Management), provides investment management and investment advisory services to institutions around the world. Located in
Boston, Massachusetts, Wellington Management also has offices in Chicago, Illinois; Radnor, Pennsylvania; San Francisco, California; Beijing; Frankfurt; Hong Kong; London; Luxembourg; Singapore; Sydney; Tokyo; Toronto; and Zurich. This material is prepared for, and authorized for internal use by, designated institutional and professional investors and their consultants or for such other use as may be authorized by Wellington Management. This material and/or its contents are current at the time of writing and may not be reproduced or distributed in whole or in part, for any purpose, without
the express written consent of Wellington Management. This material is not intended to constitute investment advice or an offer to sell, or the solicitation of an offer to purchase shares or other securities. Investors should always obtain and read an up-to-date investment services description or prospectus before deciding whether to appoint an investment manager or to invest in a fund. Any views expressed herein are those of the author(s), are based on available information, and are subject to change without notice. Individual portfolio management teams may hold different views and
may make different investment decisions for different clients.
In Canada, this material is provided by Wellington Management Canada ULC, British Columbia unlimited liability company registered in the provinces of Alberta, British Columbia, Manitoba, New
Brunswick, Newfoundland and Labrador, Nova Scotia, Ontario, Prince Edward Island, Quebec, and Saskatchewan in the categories of Portfolio Manager and Exempt Market Dealer. In the UK, this material is provided by Wellington Management International Limited (WMIL), a firm authorized and regulated by the Financial Conduct Authority (FCA). This material is directed only at persons (Relevant Persons) who are classified as eligible counterparties or professional clients under the rules of the FCA. This material must not be acted on or relied on by persons who are not Relevant
Persons. Any investment or investment service to which this material relates is available only to Relevant Persons and will be engaged in only with Relevant Persons. In Germany, this material is provided by Wellington Management International Limited, Niederlassung Deutschland, the German branch of WMIL, which is authorized and regulated by the FCA and in respect of certain aspects of its activities by the Bundesanstalt für Finanzdienstleistungsaufsicht (BaFin). This material is directed only at persons (Relevant Persons) who are classified as eligible counterparties or professional clients
under the German Securities Trading Act. This material does not constitute investment advice, a solicitation to invest in financial instruments or financial analysis within the meaning of Section 34b of the German Securities Trading Act. It does not meet all legal requirements designed to guarantee the independence of financial analyses and is not subject to any prohibition on dealing ahead of the publication of financial analyses. This material does not constitute a prospectus for the purposes of the German Capital Investment Code, the German Securities Sales Prospectus Act or the German
Securities Prospectus Act. In Hong Kong, this material is provided to you by Wellington Management Hong Kong Limited (WM Hong Kong), a corporation licensed by the Securities and Futures Commission to conduct Type 1 (dealing in securities), Type 2 (dealing in futures contracts), Type 4 (advising on securities), and Type 9 (asset management) regulated activities, on the basis that you are a Professional Investor as defined in the Securities and Futures Ordinance. By accepting this material you acknowledge and agree that this material is provided for your use only and that you will not
distribute or otherwise make this material available to any person. In Singapore, this material is provided for your use only by Wellington Management Singapore Pte Ltd (WM Singapore) (Registration Number 201415544E). WM Singapore is regulated by the Monetary Authority of Singapore under a Capital Markets Services Licence to conduct fund management activities and is an exempt financial adviser. By accepting this material you represent that you are a non-retail investor and that you will not copy, distribute or otherwise make this material available to any person. In
Australia, Wellington Management Australia Pty Ltd (WM Australia) (ABN19 167 091 090) has authorized the issue of this material for use solely by wholesale clients (as defined in the Corporations Act 2001). By accepting this material, you acknowledge and agree that this material is provided for your use only and that you will not distribute or otherwise make this material available to any person. Wellington Management Company LLP is exempt from the requirement to hold an Australian financial services licence (AFSL) under the Corporations Act 2001 in respect of financial services provided to
wholesale clients in Australia, subject to certain conditions. Financial services provided by Wellington Management Company LLP are regulated by the SEC under the laws and regulatory requirements of the United States, which are different from the laws applying in Australia. In Japan, Wellington Management Japan Pte Ltd (WM Japan) (Registration Number 199504987R) has been registered as a Financial Instruments Firm with registered number: Director General of Kanto Local Finance Bureau (Kin-Sho) Number 428. WM Japan is a member of the Japan Investment Advisers Association (JIAA)
and the Investment Trusts Association, Japan (ITA). WMIL, WM Hong Kong, WM Japan, and WM Singapore are also registered as investment advisers with the SEC; however, they will comply with the substantive provisions of the US Investment Advisers Act only with respect to their US clients.
©2018 Wellington Management. All rights reserved. | As of December 2018
PPT/
-
_22 May 2019 A1