Embed Size (px)
Citation preview

Emerging Opportunities for ATSSA Members in
Bicyclist SafetyDecember 2010

ACKNOWLEDGMENTS
The American Traffic Safety Services Association is grateful to the following members who provided invaluable input to the organization and presentation of this report:
Jeff JohnsonTrafficade Service, Inc.
Scott KlineA.C. Pavement Striping Co., Inc.
Jeff KoudelkaIowa Plains Signing, Inc.
Jeff RoehmEnterprise Flasher Co.
Funding for this report was provided by the American Traffic Safety Services Association (ATSSA). The report was developed and written by the Texas Transportation Institute, The Texas A&M University System, College Station, Texas 77843. Principle authors
were: Jun (Jade) Huang, Nathanael Proctor, Joan Hudson, PE, and Shawn Turner, PE.
Copyright December 2010

TableofContentsIntroduction ................................................................................................................ 1
MarketAssessment ..................................................................................................... 2
BicyclingLevelsandUsage....................................................................................... 2
BicyclistFatalitiesandInjuries ................................................................................. 2
MembershipinBicycleProfessionalandAdvocacyGroups ...................................... 3
BicycleSales ............................................................................................................ 3
ForecastforFutureBicyclingConditions .................................................................. 5
Conclusions ............................................................................................................. 8
BicyclistSafetyProductsandPractices ........................................................................ 9
BufferedBikeLane................................................................................................... 9
ColoredPavement ................................................................................................. 10
PavementMarkings............................................................................................... 11
PhysicalSeparation................................................................................................ 12
BicycleSignals........................................................................................................ 13
Signs...................................................................................................................... 14
Contacts,Resources,andGettingInvolved ................................................................ 16

1
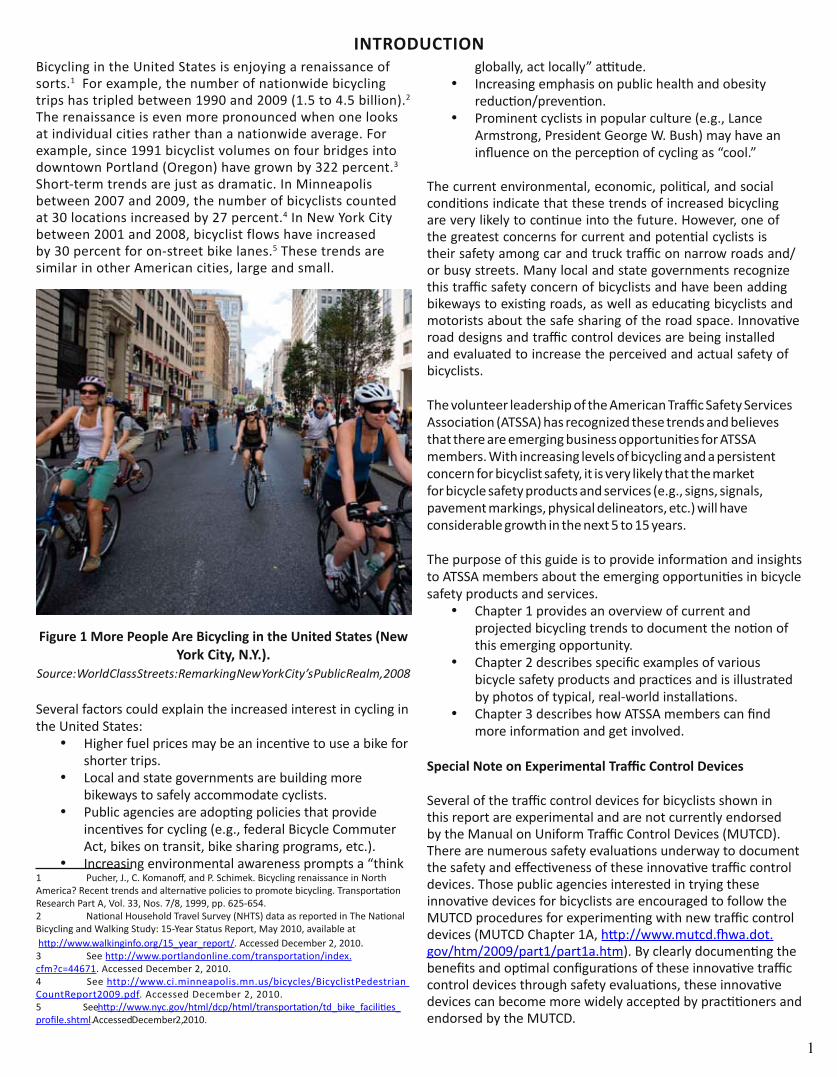
Bicycling in the United States is enjoying a renaissance of sorts.1 For example, the number of nationwide bicycling trips has tripled between 1990 and 2009 (1.5 to 4.5 billion).2 The renaissance is even more pronounced when one looks at individual cities rather than a nationwide average. For example, since 1991 bicyclist volumes on four bridges into downtown Portland (Oregon) have grown by 322 percent.3 Short-term trends are just as dramatic. In Minneapolis between 2007 and 2009, the number of bicyclists counted at 30 locations increased by 27 percent.4 In New York City between 2001 and 2008, bicyclist flows have increased by 30 percent for on-street bike lanes.5 These trends are similar in other American cities, large and small.
Figure 1 More People Are Bicycling in the United States (New York City, N.Y.).
Source: World Class Streets: Remarking New York City’s Public Realm, 2008
Several factors could explain the increased interest in cycling in the United States:
Higher fuel prices may be an incentive to use a bike for •shorter trips.Local and state governments are building more •bikeways to safely accommodate cyclists.Public agencies are adopting policies that provide •incentives for cycling (e.g., federal Bicycle Commuter Act, bikes on transit, bike sharing programs, etc.).Increasing environmental awareness prompts a “think •
1 Pucher, J., C. Komanoff, and P. Schimek. Bicycling renaissance in North America? Recent trends and alternative policies to promote bicycling. Transportation Research Part A, Vol. 33, Nos. 7/8, 1999, pp. 625-654.2 National Household Travel Survey (NHTS) data as reported in The National Bicycling and Walking Study: 15-Year Status Report, May 2010, available at http://www.walkinginfo.org/15_year_report/. Accessed December 2, 2010.3 See http://www.portlandonline.com/transportation/index.cfm?c=44671. Accessed December 2, 2010.4 See http://www.ci.minneapolis.mn.us/bicycles/BicyclistPedestrian CountReport2009.pdf. Accessed December 2, 2010.5 See http://www.nyc.gov/html/dcp/html/transportation/td_bike_facilities_profile.shtml. Accessed December 2, 2010.
globally, act locally” attitude.Increasing emphasis on public health and obesity •reduction/prevention.Prominent cyclists in popular culture (e.g., Lance •Armstrong, President George W. Bush) may have an influence on the perception of cycling as “cool.”
The current environmental, economic, political, and social conditions indicate that these trends of increased bicycling are very likely to continue into the future. However, one of the greatest concerns for current and potential cyclists is their safety among car and truck traffic on narrow roads and/or busy streets. Many local and state governments recognize this traffic safety concern of bicyclists and have been adding bikeways to existing roads, as well as educating bicyclists and motorists about the safe sharing of the road space. Innovative road designs and traffic control devices are being installed and evaluated to increase the perceived and actual safety of bicyclists.
The volunteer leadership of the American Traffic Safety Services Association (ATSSA) has recognized these trends and believes that there are emerging business opportunities for ATSSA members. With increasing levels of bicycling and a persistent concern for bicyclist safety, it is very likely that the market for bicycle safety products and services (e.g., signs, signals, pavement markings, physical delineators, etc.) will have considerable growth in the next 5 to 15 years.
The purpose of this guide is to provide information and insights to ATSSA members about the emerging opportunities in bicycle safety products and services.
Chapter 1 provides an overview of current and •projected bicycling trends to document the notion of this emerging opportunity. Chapter 2 describes specific examples of various •bicycle safety products and practices and is illustrated by photos of typical, real-world installations.Chapter 3 describes how ATSSA members can find •more information and get involved.
Special Note on Experimental Traffic Control Devices
Several of the traffic control devices for bicyclists shown in this report are experimental and are not currently endorsed by the Manual on Uniform Traffic Control Devices (MUTCD). There are numerous safety evaluations underway to document the safety and effectiveness of these innovative traffic control devices. Those public agencies interested in trying these innovative devices for bicyclists are encouraged to follow the MUTCD procedures for experimenting with new traffic control devices (MUTCD Chapter 1A, http://www.mutcd.fhwa.dot.gov/htm/2009/part1/part1a.htm). By clearly documenting the benefits and optimal configurations of these innovative traffic control devices through safety evaluations, these innovative devices can become more widely accepted by practitioners and endorsed by the MUTCD.
INTRoDUCTIoN

2
This section provides an overview of the bicycle safety market in the United States. Specifically, growth trends for seven elements of bicycling and bicyclist safety are reviewed:
Federal funding for bicycle transportation.•Bicycling levels and usage.•Bicyclist fatalities and injuries.•Membership in bicycle professional and advocacy •organizations.Bicycle sales.•Designation of bicycle friendly communities, •businesses, and states.Forecast for future bicycling conditions.•
Federal Funding for Bicycle Transportation
Federal funding for pedestrian and bicycle transportation comes from several programs including the Transportation Enhancements Program, Congestion Mitigation and Air Quality Improvement Program, Safe Routes to School, and Recreational Trails Program. As Figure 2 indicates, the federal funding for pedestrian and bicycle projects has continued to increase over the years. The sudden rise in 2009 funding was due in part to the 2009 American Recovery and Reinvestment Act (ARRA) that added more than $400 million in supplemental funds for bicycle and pedestrian projects and programs. Even without ARRA funds, FY 2009 bicycle and pedestrian obligations would have reached $783 million.6
Figure 2 Federal Funding for Bicycle and Pedestrian Projects.Source: http://www.fhwa.dot.gov/environment/bikeped/bipedfund.htm
Bicycling Levels and Usage
The national goal for bicycling and walking is to have 15.8 percent of the reported trips made by one of these two
6 FHWA, The National Bicycling and Walking Study: 15-Year Status Report, May 2010.
modes.7 According to the 2009 National Household Travel Survey (NHTS), 1 percent of all trips reported were taken by bike, an increase of 25 percent since 2001. Bicycling trips increased from 1.7 billion in 1990 to 4 billion in 2009. Figure 3 illustrates a growing trend of people bicycling to work.
Figure 3 Number of People Bicycling to Work.Source: U.S. Census 1999, 2000; American Community Survey 2005,
2006, 2007
Figure 4 shows the bicycle mode share in the top 10 cities (by mode share) from 2000 to 2008, with the highest increase in Portland (Oregon) where bicycle mode share jumped from 2 percent in 2000 to 6 percent in 2008.
Figure 4 Bicycling Trends for the Ten Cities with Highest Bike Mode Share.
Source: League of American Bicyclists
7 FHWA, The National Bicycling and Walking Study: 15-Year Status Report, May 2010.
$0
$200
$400
$600
$800
$1,000
$1,200
$1,400
1992
1993
1994
1995
1996
1997
1998
1999
2000
2001
2002
2003
2004
2005
2006
2007
2008
2009
Federal Funding for Bicycle and Pedestrian Projects ($ million)
0
100,000
200,000
300,000
400,000
500,000
600,000
700,000
1999 2000 2005 2006 2007
Number of People Bicycling to Work
0%
1%
2%
3%
4%
5%
6%
7%
8%
2000 2005 2006 2007 2008
Bicyclist Mode Share
Portland, OR
Minneapolis, MN
Seattle, WA
Sacramento, CA
San Francisco, CA
Washington, DC
Oakland, CA
Tucson, AZ
Albuquerque, NM
Philadelphia, PA
1 -- MARKET ASSESSMENT
3
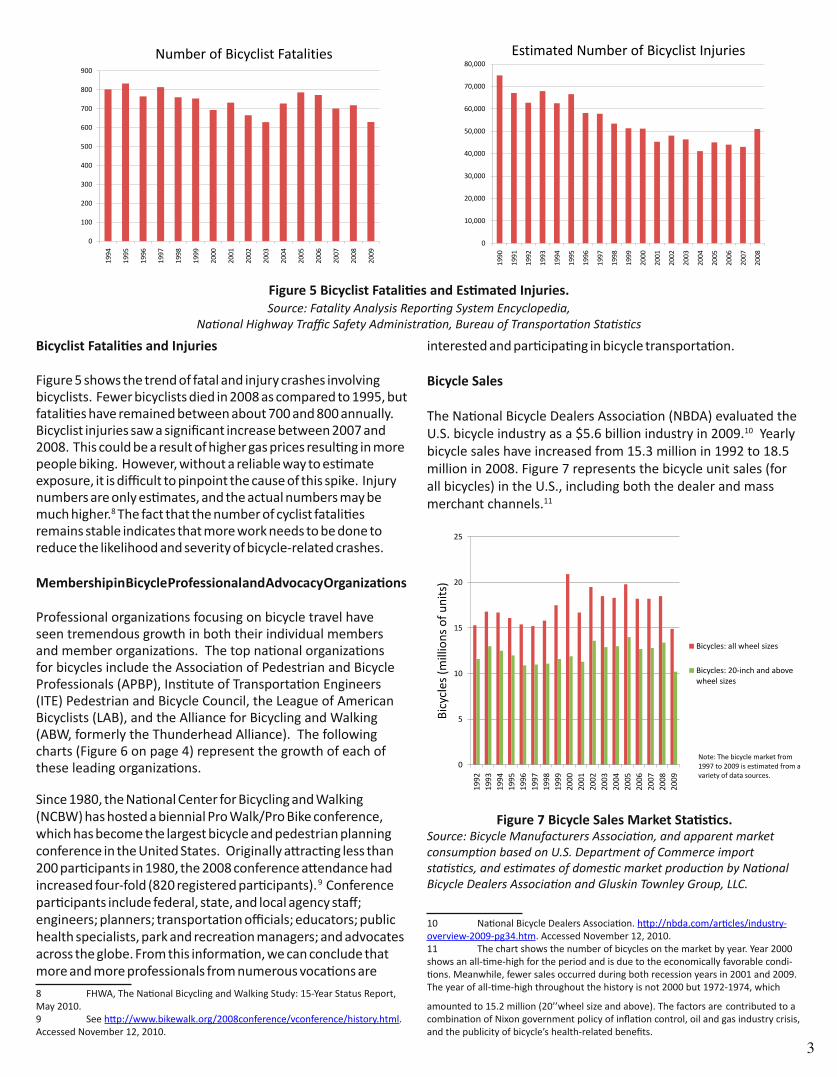
Bicyclist Fatalities and Injuries
Figure 5 shows the trend of fatal and injury crashes involving bicyclists. Fewer bicyclists died in 2008 as compared to 1995, but fatalities have remained between about 700 and 800 annually. Bicyclist injuries saw a significant increase between 2007 and 2008. This could be a result of higher gas prices resulting in more people biking. However, without a reliable way to estimate exposure, it is difficult to pinpoint the cause of this spike. Injury numbers are only estimates, and the actual numbers may be much higher.8 The fact that the number of cyclist fatalities remains stable indicates that more work needs to be done to reduce the likelihood and severity of bicycle-related crashes.
Membership in Bicycle Professional and Advocacy organizations
Professional organizations focusing on bicycle travel have seen tremendous growth in both their individual members and member organizations. The top national organizations for bicycles include the Association of Pedestrian and Bicycle Professionals (APBP), Institute of Transportation Engineers (ITE) Pedestrian and Bicycle Council, the League of American Bicyclists (LAB), and the Alliance for Bicycling and Walking (ABW, formerly the Thunderhead Alliance). The following charts (Figure 6 on page 4) represent the growth of each of these leading organizations.
Since 1980, the National Center for Bicycling and Walking (NCBW) has hosted a biennial Pro Walk/Pro Bike conference, which has become the largest bicycle and pedestrian planning conference in the United States. Originally attracting less than 200 participants in 1980, the 2008 conference attendance had increased four-fold (820 registered participants). 9 Conference participants include federal, state, and local agency staff; engineers; planners; transportation officials; educators; public health specialists, park and recreation managers; and advocates across the globe. From this information, we can conclude that more and more professionals from numerous vocations are
8 FHWA, The National Bicycling and Walking Study: 15-Year Status Report, May 2010.9 See http://www.bikewalk.org/2008conference/vconference/history.html. Accessed November 12, 2010.
interested and participating in bicycle transportation.
Bicycle Sales
The National Bicycle Dealers Association (NBDA) evaluated the U.S. bicycle industry as a $5.6 billion industry in 2009.10 Yearly bicycle sales have increased from 15.3 million in 1992 to 18.5 million in 2008. Figure 7 represents the bicycle unit sales (for all bicycles) in the U.S., including both the dealer and mass merchant channels.11
Figure 7 Bicycle Sales Market Statistics.Source: Bicycle Manufacturers Association, and apparent market consumption based on U.S. Department of Commerce import statistics, and estimates of domestic market production by National Bicycle Dealers Association and Gluskin Townley Group, LLC.
10 National Bicycle Dealers Association. http://nbda.com/articles/industry-overview-2009-pg34.htm. Accessed November 12, 2010.11 The chart shows the number of bicycles on the market by year. Year 2000 shows an all-time-high for the period and is due to the economically favorable condi-tions. Meanwhile, fewer sales occurred during both recession years in 2001 and 2009. The year of all-time-high throughout the history is not 2000 but 1972-1974, which
amounted to 15.2 million (20’’wheel size and above). The factors are contributed to a combination of Nixon government policy of inflation control, oil and gas industry crisis, and the publicity of bicycle’s health-related benefits.
0
100
200
300
400
500
600
700
800
900
1994
1995
1996
1997
1998
1999
2000
2001
2002
2003
2004
2005
2006
2007
2008
2009
Number of Bicyclist Fatalities
0
10,000
20,000
30,000
40,000
50,000
60,000
70,000
80,000
1990
1991
1992
1993
1994
1995
1996
1997
1998
1999
2000
2001
2002
2003
2004
2005
2006
2007
2008
Estimated Number of Bicyclist Injuries
Figure 5 Bicyclist Fatalities and Estimated Injuries.Source: Fatality Analysis Reporting System Encyclopedia,
National Highway Traffic Safety Administration, Bureau of Transportation Statistics
0
5
10
15
20
25
1992
1993
1994
1995
1996
1997
1998
1999
2000
2001
2002
2003
2004
2005
2006
2007
2008
2009
Bicy
cles
(mill
ions
of u
nits
)
Bicycles: all wheel sizes
Bicycles: 20-inch and above wheel sizes
Note: The bicycle market from1997 to 2009 is estimated from avariety of data sources.

4
Designation of Bicycle Friendly Communities, Businesses, and States
The League of American Bicyclists established a “Bicycle Friendly” program to provide incentives, hands-on assistance, and recognition for communities, businesses, and states that actively support bicycling. These programs include their Bicycle Friendly Community (BFC), Bicycle Friendly Business, and Bicycle Friendly State awards.
Currently, there are 158 Bicycle Friendly Communities in 43 states. As of 2010, the League has received a total of 407 applications for the Bicycle Friendly Community designation. Over the last five years, they have seen a 370 percent increase in applications and a 400 percent increase in new BFC designations (Figure 8). In 2010, the organization experienced a 20 percent growth in both applications and designations.12
Currently there are 157 Bicycle Friendly Businesses in 26
12 The League of American Bicyclists.
0
100
200
300
400
500
600
700
800
900
1,000
1998 1999 2000 2001 2002 2003 2004 2005 2006 2007 2008 2009 2010
APBP Membership
0
100
200
300
400
500
600
700
2005 2006 2007 2008 2009 2010
ITE Pedestrian & Bicycle Council Member
1
743
1,726
2,163
2,600
0
500
1,000
1,500
2,000
2,500
3,000
1975 2000 2008 2009 2010
Number of League Cycling Instructors (LCIs)
0
20
40
60
80
100
120
140
160
180
1996 1997 1998 1999 2000 2001 2002 2003 2004 2005 2006 2007 2008 2009
ABW Membership
Member Organizations Individual Members (thousands)
Figure 6 Membership Growth in Bicycle Professional organizations.Source: APBP, ITE Pedestrian/Bike Council, LAB, and ABW
0
10
20
30
40
50
60
70
80
90
100
2003 2004 2005 2006 2007 2008 2009 2010
Applications
Awards
Figure 8 Number of New Applications and Awards for Bicycle Friendly Communities.
Source: League of American Bicyclists
5
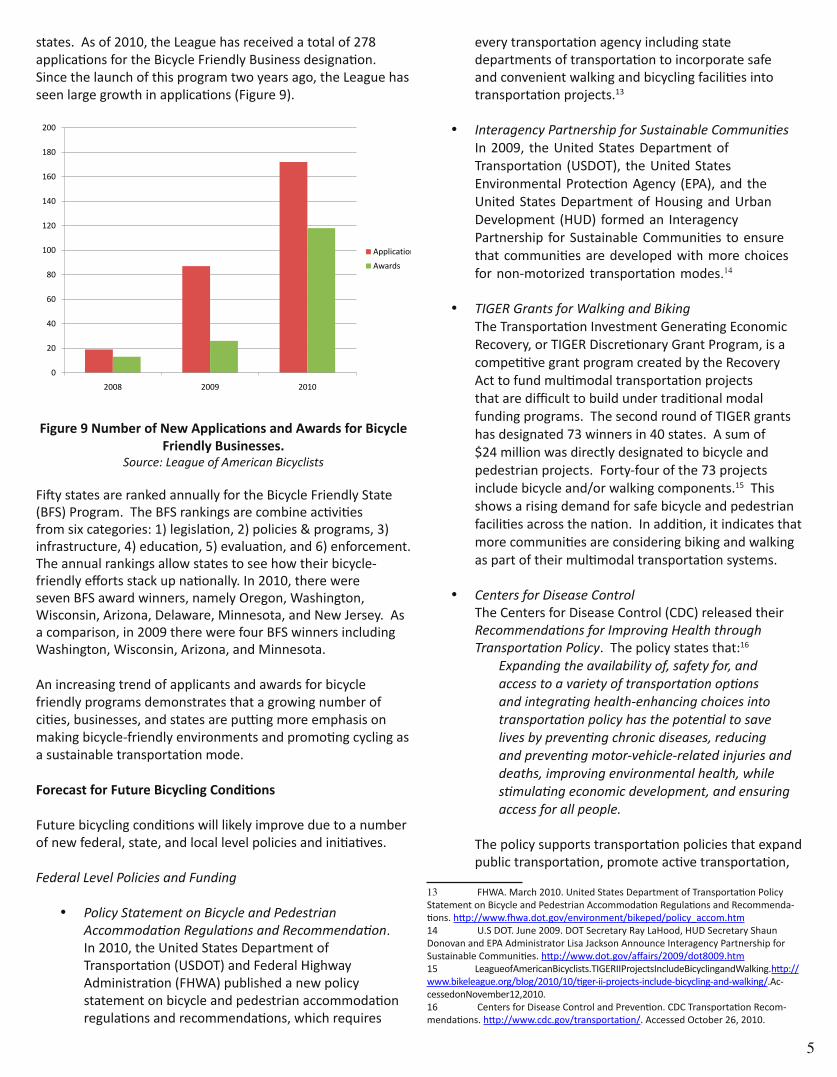
states. As of 2010, the League has received a total of 278 applications for the Bicycle Friendly Business designation. Since the launch of this program two years ago, the League has seen large growth in applications (Figure 9).
Figure 9 Number of New Applications and Awards for Bicycle Friendly Businesses.
Source: League of American Bicyclists
Fifty states are ranked annually for the Bicycle Friendly State (BFS) Program. The BFS rankings are combine activities from six categories: 1) legislation, 2) policies & programs, 3) infrastructure, 4) education, 5) evaluation, and 6) enforcement. The annual rankings allow states to see how their bicycle-friendly efforts stack up nationally. In 2010, there were seven BFS award winners, namely Oregon, Washington, Wisconsin, Arizona, Delaware, Minnesota, and New Jersey. As a comparison, in 2009 there were four BFS winners including Washington, Wisconsin, Arizona, and Minnesota. An increasing trend of applicants and awards for bicycle friendly programs demonstrates that a growing number of cities, businesses, and states are putting more emphasis on making bicycle-friendly environments and promoting cycling as a sustainable transportation mode.
Forecast for Future Bicycling Conditions
Future bicycling conditions will likely improve due to a number of new federal, state, and local level policies and initiatives.
Federal Level Policies and Funding
Policy Statement on Bicycle and Pedestrian •Accommodation Regulations and Recommendation.In 2010, the United States Department of Transportation (USDOT) and Federal Highway Administration (FHWA) published a new policy statement on bicycle and pedestrian accommodation regulations and recommendations, which requires
every transportation agency including state departments of transportation to incorporate safe and convenient walking and bicycling facilities into transportation projects.13
Interagency Partnership for Sustainable Communities•In 2009, the United States Department of Transportation (USDOT), the United States Environmental Protection Agency (EPA), and the United States Department of Housing and Urban Development (HUD) formed an Interagency Partnership for Sustainable Communities to ensure that communities are developed with more choices for non-motorized transportation modes.14
TIGER Grants for Walking and Biking•The Transportation Investment Generating Economic Recovery, or TIGER Discretionary Grant Program, is a competitive grant program created by the Recovery Act to fund multimodal transportation projects that are difficult to build under traditional modal funding programs. The second round of TIGER grants has designated 73 winners in 40 states. A sum of $24 million was directly designated to bicycle and pedestrian projects. Forty-four of the 73 projects include bicycle and/or walking components.15 This shows a rising demand for safe bicycle and pedestrian facilities across the nation. In addition, it indicates that more communities are considering biking and walking as part of their multimodal transportation systems.
Centers for Disease Control•The Centers for Disease Control (CDC) released their Recommendations for Improving Health through Transportation Policy. The policy states that:16
Expanding the availability of, safety for, and access to a variety of transportation options and integrating health-enhancing choices into transportation policy has the potential to save lives by preventing chronic diseases, reducing and preventing motor-vehicle-related injuries and deaths, improving environmental health, while stimulating economic development, and ensuring access for all people.
The policy supports transportation policies that expand public transportation, promote active transportation,
13 FHWA. March 2010. United States Department of Transportation Policy Statement on Bicycle and Pedestrian Accommodation Regulations and Recommenda-tions. http://www.fhwa.dot.gov/environment/bikeped/policy_accom.htm14 U.S DOT. June 2009. DOT Secretary Ray LaHood, HUD Secretary Shaun Donovan and EPA Administrator Lisa Jackson Announce Interagency Partnership for Sustainable Communities. http://www.dot.gov/affairs/2009/dot8009.htm15 League of American Bicyclists. TIGER II Projects Include Bicycling and Walking. http://www.bikeleague.org/blog/2010/10/tiger-ii-projects-include-bicycling-and-walking/. Ac-cessed on November 12, 2010.16 Centers for Disease Control and Prevention. CDC Transportation Recom-mendations. http://www.cdc.gov/transportation/. Accessed October 26, 2010.
0
20
40
60
80
100
120
140
160
180
200
2008 2009 2010
Application
Awards
6
and make our roads safer and more accessible for all users—including bicyclists and pedestrians of all ages and abilities. The policy recommends healthy community design, including Complete Streets and connecting transit with biking and walking networks. It also calls for increased government investment for bicycling, walking, and the Safe Routes to School Program.
U.S. Bicycle Route System – • The U.S. Bicycle Route System is a proposed national network of bicycle routes. U.S. Bicycle Routes are intended to link urban, suburban, and rural areas using a variety of appropriate facilities. These routes are nominated for numbered designation by State Departments of Transportation (DOTs) and are catalogued by the American Association of State Highway and Transportation Officials (AASHTO) through the Special Committee on U.S. Route Numbering (the same committee that assigns numbers to U.S. highways
and interstates). Applications for U.S. Bicycle Routes are accepted twice per year, at AASHTO’s spring and fall meetings17. According to the Adventure Cycling Association, “…if implemented as planned, the U.S. Bicycle Route System will become the largest official cycling network on the planet, encompassing more than 50,000 miles of routes.”18
Transportation Secretary Ray LaHood has shown great support for the proposed national bicycle network. He stated on his blog Fast Lane July 2, 2010, “The U.S. Bicycle Route System is not just a bunch of bike paths; we’re talking about a transportation system. It will facilitate travel between communities and to historic and cultural landmarks. It will give people living in more rural areas a way to travel into a nearby urban area by
17 Adventure Cycling Association. http://blog.adventurecycling.org/2010/02/us-bicycle-route-system-101.html. Accessed November 12, 2010. 18 Bateman, W. November 2010, “An Interstate Bicycling System: A system of bicycle routes to connect the nation? It’s happening.” Yes! Magazine. http://www.yesmagazine.org/planet/an-interstate-bicycle-system. Accessed December 7, 2010
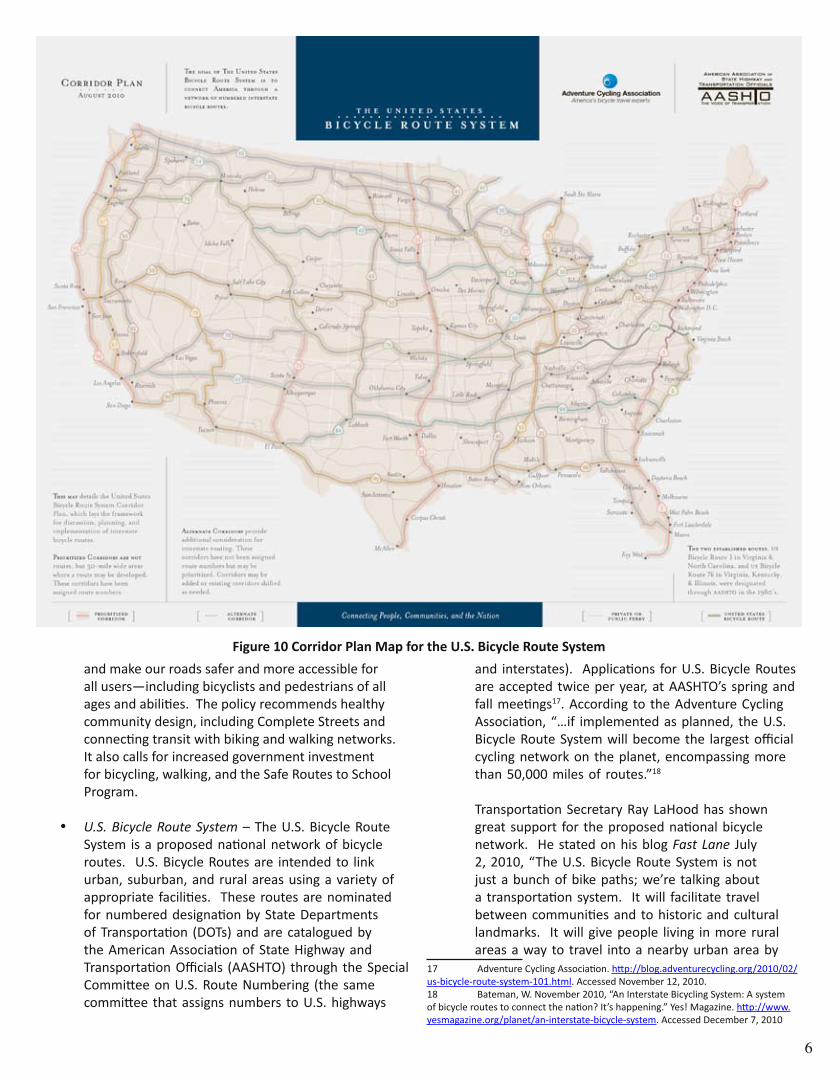
Figure 10 Corridor Plan Map for the U.S. Bicycle Route System
7
bicycle. Urban and suburban residents will have better access to rural recreation areas. And—like our interstate highway system—it will facilitate long-distance travel by bicycle, whether across one’s state or across the country.”
Currently, regulations do not require special signage for the routes; however, it is expected that once in place extensive signage along routes will become commonplace. Twenty-five states plus the District of Columbia are currently working on some level of U.S. Bicycle Route implementation.19 Figure 10 shows the August 2010 draft corridor plan for the U.S. Bicycle Route System. The corridor designations are actually 50-mile wide planning areas that states can use to connect key destinations with urban areas.20
State and Local Level Movement
Complete Streets•The overall goal of the Complete Streets effort is to provide safe and accessible design for all modes of travel, instead of focusing solely on automobiles. Pedestrian, bicycle, and transit access can have numerous benefits for a community, and Complete Streets policies offer one way for a city, region, or state to safely provide multimodal access. Through 2010, 168 jurisdictions have adopted or made a written commitment to adopt Complete Streets policies.21
Safe Routes to School•The current federal transportation legislation (i.e., SAFETEA-LU) established the Safe Routes to School Program aiming to encourage and enable children to safely walk and bike to school. The program directs funding to State Departments of Transportation for infrastructure improvements and educational and enforcement programs that promote bicycling and walking to school and increase safety.
Cities for Cycling•Cities for Cycling is a project of the National Association of City Transportation Officials (NACTO, http://www.nacto.org) to catalog, promote, and implement the world’s best bicycle transportation practices in American municipalities. This is a new effort by city governments to promote best practices in urban cycling and to increase the use of bicycles to improve urban mobility, livability, and public health while reducing traffic congestion and CO2 emissions. Cities for Cycling focuses on implementing world-class bicycle transportation systems through design innovation and the sharing of best practices.19 Adventure Cycling Association. http://www.adventurecycling.org/routes/nbrn/usbikewaysystem.cfm. Accessed November 12, 2010.20 Adventure Cycling Association. http://www.adventurecycling.org/routes/nbrn/usbikewaysystem.cfm. Accessed November 12, 2010.21 National Complete Streets Coalition. Complete Streets Atlas. http://www.completestreets.org/complete-streets-fundamentals/complete-streets-atlas/. Ac-
cessed November 12, 2010.
Bike Sharing Programs•Bike sharing programs seek to increase mobility and transportation choice by loaning and renting bicycles. It was initiated and operated successfully in Europe and modeled in the United States. Bike sharing programs are gaining widespread interest in the United States. Humana22 was among the first to implement a bike-sharing program in the states. The District of Columbia is the largest U.S. government entity to date to adopt a bike sharing program, which began in 2008 called Smart Bike. In 2010, Washington D.C. launched another bike share program-Capital Bikeshare, the largest bike sharing service in the U.S. up to date, with 1,100 bicycles and 110 stations across Washington, D.C., and Arlington, VA.23
Some municipalities provide free use of bikes with the swipe of a credit card to guard against theft. These include Denver, Colorado; Fort Collins, Colorado; and Tulsa, Oklahoma.24 Currently, there are seven states that have launched bike-sharing programs while 15 more programs in various cities and states are under study.25 Recently, New York City’s Department of Transportation (NYCDOT) issued a Request for Proposals (RFP) for private companies to provide a bike share system for the city, a 24 hour network of around 10,000 bikes that could be placed at automated kiosks below Central Park in Manhattan and in areas of Downtown Brooklyn, with a majority of bikes available in dense business districts, with hopes of implementation by the spring of 2012. The city will install 250 miles of additional bikes lanes in the five boroughs to accommodate the key features of the new “public transportation system”: durable bicycles and docking stations to provide convenient and inexpensive mobility 24 hours a day, 365 days a year. NYCDOT sees bike sharing as useful for trips under 3 miles and as a congestion-reducing, green transit option.26
Local Funding•Aside from the federal-aid highway fund, many cities and states provide funds for pedestrian and bicycle projects. Regional transportation planning agencies in California can choose to use a portion of the statewide sales tax for bicycle and pedestrian projects. In San Diego County, where this state sales tax set-aside has been combined with local tax revenues, about $8 to $9 million is designated annually for the
22 See http://www.humana.com/resources/about/healthcare_innovation/innovation.aspx. Accessed November 12, 2010.23 See http://www.capitalbikeshare.com/. Accessed November 24, 2010. 24 National Conference of State Legislatures. Encouraging Bicycling and Walking-The State Legislative Role. November 2008.25 See http://bike-sharing.blogspot.com/. Accessed November 12, 2010.26 Michael M. Grynbaum.. City to Solicit Proposals on Bike Sharing. The New York Times. http://www.nytimes.com/2010/11/23/nyregion/23bikeside.html. Ac-cessed November 22, 2010.

8
bicycle and pedestrian projects.27 Colorado Springs approved a bicycle excise tax, which charges a $4 excise tax on every bicycle or bicycle frame with a wheel size larger than 16 inches sold within the city. The ordinance requires all bicycle excise tax revenues be allocated to fund recommendations in the city’s current bicycle plan. Colorado State allows motor fuel tax revenue to be used for bicycle and pedestrian projects within the right-of-way of an existing highway project. Washington approves allocation of gas tax revenues to bicycle and pedestrian projects when it can be construed as increasing safety and is part of a comprehensive trail plan. Michigan law requires that a minimum amount 1 percent of motor fuel and vehicle registration funds be spent on non-motorized infrastructure. Illinois allocates revenues derived from the Park and Conservation Fund, which is collected from the fees paid for certificates of title.
Conclusions
This section provided a multi-faceted overview of the bicycle safety market. In general, pedestrian and bicycle projects are receiving a rising share of funding from federal-aid highway funds. More and more people are commuting by bicycles. The expanding sizes of the leading bicycle organizations represent a growing number of professionals interested and participating in bicycle transportation. Increasing numbers of cities, businesses, and states are putting strong emphasis on making a bicycle-friendly environment and promoting cycling transportation. Various federal, state, and local policies and programs are supporting better bicycling conditions in the future. The stable trend in bicycle fatalities also indicates that more work needs to be done to reduce the chance and severity of bicycle-related crashes.
In conclusion, there is an increasing demand in the bicycle market that more bicycle safety products will be needed to accommodate the expanding number and growing needs of cyclists.
27 National Conference of State Legislatures. Encouraging Bicycling and Walking-The State Legislative Role. November 2008.

9
This section describes and illustrates current and emerging bicyclist safety products and practices that are being used or evaluated. These safety products and practices help bicyclists of all ability levels—advanced, intermediate, and beginners, including children. The consistent application of signage, lane delineations, physical separation, and pavement markings across a community help create the space needed to increase bicycling levels and safety.
The types of bicycle safety products and applications described here include:
Lane delineation• .Pavement markings• .Physical separation• .Bicycle signals• .Signage• .
In almost every case, one product does not stand alone. Instead, these products and practices must be integrated to form an environment of safety for all users of the transportation network. The National Association of City Transportation Officials (NACTO) project called Cities for Cycling provides a catalog of the best practices in bicycle transportation. Their website (http://www.nacto.org) is an excellent resource for safety professionals looking to develop and improve bicycle safety products.
Lane Delineation
One of the simplest ways to improve bicycle safety is to mark the space dedicated for cyclists. The use of lane delineation comes in several forms. Bike boxes, buffered bike lanes, and colored pavement are three examples described in this section. Each of these products provides motorists and bicyclists with increased awareness of their part of the road. Lane delineations are often accompanied by signage and supplemental pavement markings.
Product Descriptions
Bicycle Box: A bicycle box is a delineated area at a signalized intersection that provides cyclists with priority for entering the intersection. The painted area indicates where motorists are required to stop and is located in advance of the crosswalk. Cyclists are encouraged to stop in the area between the cars and the crosswalk.
Buffered Bike Lanes: The hashed markings between a bicycle lane and the motor vehicle lane (or the parking area) create a buffered bike lane.
Figure 13 Buffered Bike Lanes Are a Simple Application of Lane Delineation (Brooklyn, N.Y.).
Photo Credit: www.pedbikeimages.org/Steven Faust
Figure 11 Bike Boxes Provide a Clear Path for Bicyclists of All Abilities (Portland, ore.).Photo Credit: Eric Gilliland
Figure 12 Bike Boxes Provide a Clear Space for Bicyclists at Intersections (Boston).
Photo Credit: NACTO
2 -- BICYCLIST SAFETY PRoDUCTS AND PRACTICES
10
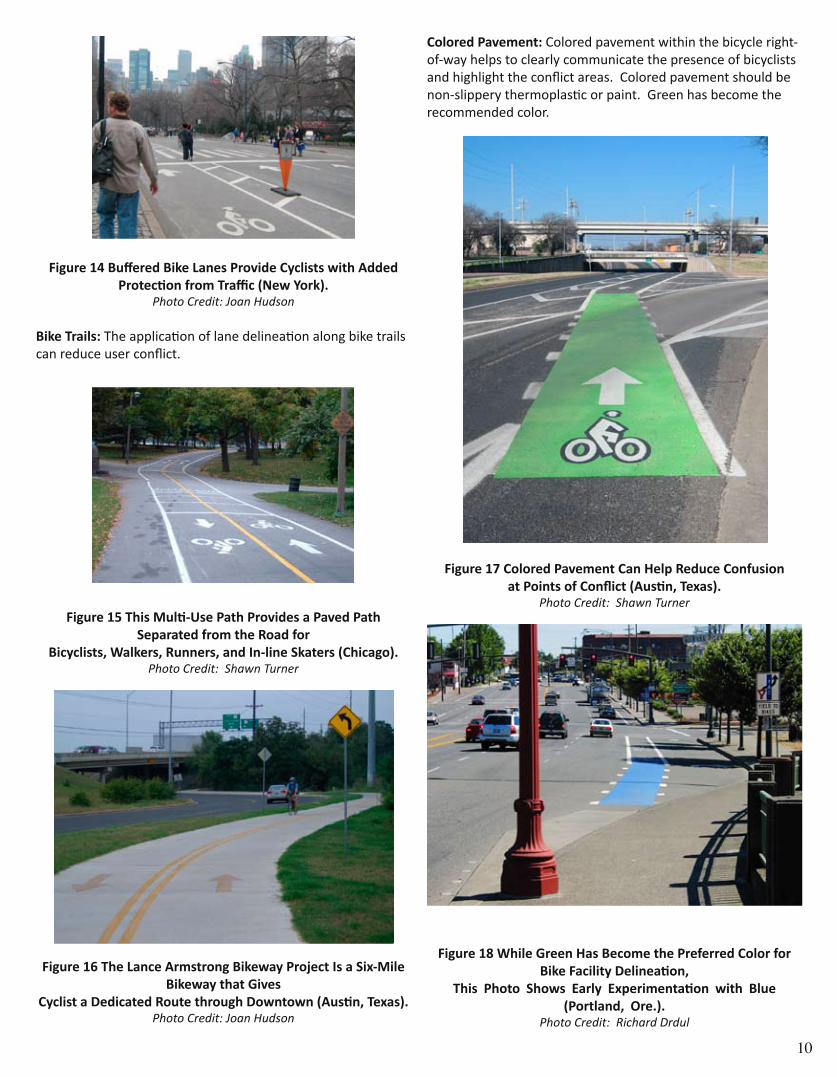
Figure 14 Buffered Bike Lanes Provide Cyclists with Added Protection from Traffic (New York).
Photo Credit: Joan Hudson
Bike Trails: The application of lane delineation along bike trails can reduce user conflict.
Figure 15 This Multi-Use Path Provides a Paved Path Separated from the Road for
Bicyclists, Walkers, Runners, and In-line Skaters (Chicago).Photo Credit: Shawn Turner
Figure 16 The Lance Armstrong Bikeway Project Is a Six-Mile Bikeway that Gives
Cyclist a Dedicated Route through Downtown (Austin, Texas).Photo Credit: Joan Hudson
Colored Pavement: Colored pavement within the bicycle right-of-way helps to clearly communicate the presence of bicyclists and highlight the conflict areas. Colored pavement should be non-slippery thermoplastic or paint. Green has become the recommended color.
Figure 17 Colored Pavement Can Help Reduce Confusion at Points of Conflict (Austin, Texas).
Photo Credit: Shawn Turner
Figure 18 While Green Has Become the Preferred Color for Bike Facility Delineation,
This Photo Shows Early Experimentation with Blue (Portland, ore.).
Photo Credit: Richard Drdul

11
Figure 19 Lane Delineation Used to Establish a Two-Way Bike Lane with Colored Pavement, Buffered Bike Lane, and
Floating Parking Area (Kent Avenue, New York City).Photo Credit: www.streetsblog.org / Clarence Eckerson, Jr.
Examples of cities with lane delineation include:Austin, Teas•Burlington, Vt• .Cambridge, Mass• .Chicago•Columbia, Mo• .Columbus, Ohio•Minneapolis•New York•Phoenix•Portland, Ore• .Salt Lake City•San Francisco•Seattle•St• . Petersburg, Fla.Tempe, Ariz• .Tucson, Ariz• .Multiple cities in Canada and Europe• .
Pavement Markings
The addition of pavement markings along bicycle routes provides motorists reminders of the presence of cyclists. Commonly found along bike lanes, bike boulevards, and shared rights-of-way, these pavement markings should differentiate the street visually from others in the area.
Product Descriptions
Bicycle Preferred Street or Bike Boulevard: Pavement markings along a low speed, low volume local street, which is optimized for bicycle travel. These streets have bicycle signing, pavement markings, and intersection crossing treatments to enhance the safety of bicyclists.
Figure 20 Small Pavement Markings along a Bike BoulevardCommunicate the Preferred Route for Bicyclists (Portland,
ore.).Photo Credit: Shawn Turner
Shared Lane Markings: Shared lane markings, or “sharrows,” are large bike stencils used to indicate a shared lane environment for bicyclists and motor vehicles. The markings show bicyclists where to ride so they are out of the door zone (i.e., the area in which a bicyclist may collide with an opening car door). Sharrows reinforce the validity of bicycle traffic on the road and encourage motorists to share the road.
Figure 21 Shared Lane Markings Let all Road Users Know that Bikes
Are a Part of the Road Traffic (Austin, TX).Photo Credit: Joan Hudson

12
Figure 22 The Shared Lane Marking as Shown in MUTCD Figure 9C-9.
Figure Credit: FHWA – MUTCD 2009 Edition
Bicycle Detection Loop Markings: Detection loop pavement markings let cyclists know where they need to position their bikes to activate the signal.
Figure 23 Bicycle Detector Pavement Markings Let Cyclists Know Where to Stop in order to Activate the Signal. Loop
Detectors Are Installed under the Markings (Portland, ore.).Photo Credit: Shawn Turner
Examples of cities using bicycle detector pavement markings include:
Arcata, Calif• .Berkeley, Calif• .Chicago•Columbia, Mo• .Davis, Calif• .Denver•Long Beach, Calif• .Minneapolis•Pasadena, Calif• .Portland, Ore• .Salt Lake City•San Francisco•San Luis Obispo, Calif• .Seattle•St Paul, Minn• .Syracuse, N.Y• .Multiple cities in North America and Europe• .
Figure 24 The Bicycle Detector Pavement Marking as Shown in MUTCD Figure 9C-7 and R10-22.
Figure Credit: FHWA – MUTCD 2009 Edition
Physical Separation
Physical separation takes bicycle safety beyond lane delineation and pavement markings. By providing bicyclists with an exclusive right-of-way, physical separation decreases potential conflicts.
Product Descriptions
Contra-Flow Bike Lanes: A one-way street for motor vehicles with two-way bicycle facilities, including an opposite direction bicycle-only lane.
Protected Bikeway/Cycle Tracks: A bicycle exclusive facility

13
that provides physical separation from motorized vehicle traffic within the right-of-way. Cycle tracks can either incorporate bicycle-only signal phases at intersections (for 100 percent separation) or utilize “mixing zones” to merge bicycle and motor vehicle traffic.
Figure 26 A Physically Separated Bikeway Runs Parallel to a Major Arterial Street (New York City).
Photo Credit: Joan Hudson
Examples of cities using physical separation for bicycle safety include:
Boulder, Co• .
Cambridge, Mass.• .Chicago•London•Madison, Wis• .Minneapolis•New York•Portland, Ore• .San Francisco•St. Petersburg, Fla• .Washington, D.C. •Multiple cities, Netherlands• .Multiple cities, Germany• .Copenhagen, Denmark• .
Figure 27 Physical Separation in This Photo Is Provided by Paint and Flexible Posts (Washington, D.C.).
Photo Credit: Eric Gilliland
Bicycle Signals
An intersection equipped with special signals for bicycles increases the safety and visibility of cyclists. They allow for cyclists to have a head start thereby reducing bicycle delays and discouraging red-light running by cyclists. When bicycle signals
Figure 25 Proper Signage Is Critical for Contra-Flow Bike Lanes,
Shown Here with Decorative Planters Used for Physical Separation (Boulder, Co.).
Photo Credit: NACTO

14
are combined with proper signing, pavement markings, and lane delineation, a safer multimodal intersection can be created.
Product Descriptions
Bicycle Signal: Bicycle activated signals assist bicyclists crossing signalized intersections by activating the green signal phase through the use of loop detectors or push-buttons.
Figure 28 This Intersection Provides a Bicycle Signal on the Bike Path (Amsterdam).
Photo Credit: Joan Hudson
Figure 29 A Bicycle-Specific Signal along a Bicycle Boulevard (Tucson, Ariz).
Photo Credit: Shawn Turner
Bicycle “Scramble”: A bicycle scramble combines an exclusive bicycle signal phase, pavement markings, signing, and lane delineation. The scramble stops all motor vehicle movements at an intersection, creating an exclusive phase for bicyclists and pedestrians to cross the intersection in any direction, including diagonally.
Examples of cities using bicycle signals for bicycle safety include:
Albany, Ore. (advance detection)• .Berkley, Calif• .Boulder, Co. (scramble)• .Davis, Calif• .New York•Portland, Ore. (scramble)• .Multiple cities, Germany• .Multiple cities, Denmark• .Multiple cities, Netherlands• .
Figure 30 Bicycle Signal and Pavement Markings for Bicycle “Scramble” (Portland, ore.).
Photo Credit: Shawn Turner
Signs
To safely integrate new bicycle infrastructure into the existing right-of-way clear and consistent signing is critical. Lane delineation, pavement markings, physical separation, and bicycle signals can be unfamiliar products to users of the transportation system. Clear and consistent signing helps communicate to pedestrians, bicyclists, motorists, truck drivers, and public transportation providers how to share the roadway.
Figure 31 Bike Boulevard Signage Indicates a Preferred Route (San Luis obispo, Calif.).
Photo Credit: www.pedbikeimages.org/Adam Fukushima

15
Figure 32 Signage Indicating that Motorists Must Yield to Bicyclists (Boston).Photo Credit: NACTO
Figure 33 The Consistent Application of Signs Helps to Streamline Communication across a City (Boston).
Photo Credit: NACTO
Figure 34 Some Locations Use Signs to Educate Both Cyclists and Motorists on the Legal Use of Roadways (San Francisco).
Photo Credit: Richard Drdul
Figure 35 Signs are Important Along Roadways and Pathways (Boulder, Co.).
Photo Credit: NACTO
Figure 36 Portland’s Bicycle Signage Includes the 3 Ds: Destination, Direction, Distance (Portland, ore).
Photo Credit: www.pedbikeimages.org / Brad Crawford
Figure 37 The National Bike Route Sign as Shown in the MUTCD as M1-9.
Figure Credit: FHWA MUTCD 2009 Edition

16
This section describes how ATSSA members can find more information and get involved in developing, refining, and marketing bicyclist safety products and practices.
Government Agencies
As with most businesses, it pays to know the right people. In many cities, the “right people” often can be identified through the bicycle advisory committee associated with the regional metropolitan planning organization (MPO). This bicycle advisory committee typically includes state and local transportation planners, engineers, advocates, and others interested in planning and funding regional bicycle programs.
MPo Database•http://www.planning.dot.gov/mpo.aspAn MPO is required by federal transportation legislation to be designated for each urbanized area with a population of more than 50,000 people in order to carry out the metropolitan transportation planning process, as a condition of Federal aid. Every MPO is responsible to develop a long-range metropolitan transportation plan (LRTP) every 4 years with a 20-year horizon and a transportation improvement program (TIP) every 4 years with a 4-year horizon.
Aside from the MPO’s bicycle advisory committee, most cities designate at least one person as a bicycle coordinator. The bicycle coordinator can usually be identified by searching the city’s website under the Public Works or Transportation Division pages. In small communities and rural areas, there is a state DOT bicycle coordinator who interfaces with local municipalities. Because federal funding for the Safe Routes to School Program is administered and managed through each state DOT, there is also a Safe Routes to School Coordinator in each state DOT.
State DoT Bicycle and Pedestrian Coordinator Contact •Informationhttp://www.walkinginfo.org/assistance/contacts.
cfm#ILState Safe Route To School Contacts•http://www.saferoutesinfo.org/contacts/
Many local and state agencies have already developed plans for funding and implementing bicycle facilities and other bicycle safety programs. These bicycle plans can often be found online using basic keyword searches.
Statewide Bicycle Plans• Keyword search: “{state name} state bicycle plan”
Local Bicycle Master Plans•Keyword search: “{city name} bicycle master plan”
State Highway Safety Plan•http://safety.fhwa.dot.gov/safetealu/shspquick.cfmKeyword search: “{state name} state highway safetyplan”
The Federal Highway Administration (FHWA) plays an administrative and technical advisory role for bicycle programs. FHWA’s Office of Safety develops, promotes, and disseminates bicyclist safety information, and the FHWA Turner-Fairbank Highway Research Center conducts and manages research to evaluate innovative bicyclist facilities and traffic control devices.
FHWA Bicycle & Pedestrian Program•http://www.fhwa.dot.gov/environment/bikeped/FHWA Safe Routes to School Program•http://safety.fhwa.dot.gov/saferoutes/FHWA office of Safety•http://safety.fhwa.dot.gov/ped_bike/FHWA Turner-Fairbank Highway Research Center•http://www.tfhrc.gov/safety/pedbike/
The National Highway Traffic Safety Administration (NHTSA) is charged with delivering safety programs to reduce deaths, injuries, and economic losses resulting from motor vehicle crashes. NHTSA conducts behavioral research and disseminates various bicyclist safety promotion and educational materials.
National Highway Traffic Safety Administration•http://www.nhtsa.gov/Bicycles
Professional organizations
There are several professional organizations that provide opportunities for networking, information sharing, and in some cases, guidance and manual development. The first four organizations (i.e., AASHTO, NCUTCD, NACTO, TRB) have designated membership, but interested observers are usually welcome at technical meetings. The last two listings (i.e., APBP, ITE) are dues-based professional organizations.
American Association of State Highway •Transportation officials (AASHTo) Joint Technical Committee on Nonmotorized Transportationhttp://design.transportation.org/Pages/•NonmotorizedTransportation.aspxNational Committee on Uniform Traffic Control •Devices (NCUTCD) Bicycle Technical Committeehttp://members.cox.net/ncutcdbtc/•National Association of City Transportation officials •(NACTo), Cities For Cycling Programhttp://www.nacto.org/citiesforcycling.html•Transportation Research Board (TRB) Committee on •Bicycle Transportationhttp://www.bicyclinginfo.org/trbbike/• Association of Pedestrian and Bicycle Professionals •(APBP)http://www.apbp.orgInstitute of Transportation Engineers (ITE), Pedestrian •and Bike Councilhttp://www.ite.org/councils/Ped_Bike
3 -- CoNTACTS, RESoURCES, AND GETTING INvoLvED
17
online Resources and Advocacy organizations
There are several online resources that provide technical information about bicyclist safety.
Pedestrian and Bicycle Information Center (PBIC),• http://www.pedbikeinfo.org
PBIC Bicycling Site, ɶ http://www.bicyclinginfo.orgPBIC Image Library, ɶ http://www.pedbikeimages.org
National Center for Bicycling and Walking• http://www.bikewalk.org/National Center for Safe Routes to School•http://www.saferoutesinfo.org/
There are several advocacy organizations that support the goal of improving bicyclist safety and access.
Adventure Cycling Association•http://www.adventurecycling.org/whoweare/index.cfmAlliance for Biking and Walking (formerly •Thunderhead Alliance)http://www.peoplepoweredmovement.org Bicycle Product Suppliers Association•http://bpsa.org/articles/our-mission-pg38.htm
Bikes Belong Coalition•
http://www.bikesbelong.org League of American Bicyclists•http://www.bikeleague.org/
National Complete Streets Coalition•http://www.completestreets.org
Rails to Trails Conservancy•http://www.railtrails.org Index of State and Local Advocacy organizations•http://www.peoplepoweredmovement.org/site/index.php/site/memberservices/C530
Getting Started
It is clear that the expansion of the bicycle market in general and the number of both recreational and work-related users in particular, will result in increased opportunities for the inclusion of safety products and devices in bicyclist facilities. ATSSA member companies will need to make their own assessments if this potential opportunity in their geographic business area is sufficient to warrant their time and attention and the dedication of company resources. As cited early in this section, a good place to start is with the area MPO, followed by the numerous other sources of information for which URLs have been included.
Afterword
We hope that you find value in the ideas provided in this publication. If there are other potential areas of business that you would like ATSSA to investigate, please call our President and CEO, Roger Wentz, at 540-368-1701 and discuss those with him, or send him an email at [email protected]. Your thoughts and input are always appreciated.


American Traffic Safety Services15 Riverside Parkway Suite 100
Fredericksburg, VA 22406