Embed Size (px)
Citation preview


Emerging Technologies inHazardous WasteManagement 8

This page intentionally left blank.

Emerging Technologies inHazardous WasteManagement 8
Edited by
D. William TedderGeorgia Institute of TechnologyAtlanta, Georgia
and
Frederick G. PohlandUniversity of PittsburghPittsburgh, Pennsylvania
New York, Boston, Dordrecht, London, MoscowKluwer Academic Publishers

eBook ISBN: 0-306-46921-9 Print ISBN: 0-306-46362-8
©2002 Kluwer Academic PublishersNew York, Boston, Dordrecht, London, Moscow
All rights reserved
No part of this eBook may be reproduced or transmitted in any form or by any means, electronic,mechanical, recording, or otherwise, without written consent from the Publisher
Created in the United States of America
Visit Kluwer Online at: http://www.kluweronline.comand Kluwer's eBookstore at: http://www.ebooks.kluweronline.com
PREFACE
This book resulted from presentations at the Emerging Technologies in Hazardous Waste Management Symposia held in Pittsburgh, Pennsylvania in September 1997, andBoston, Massachusetts in August 1998, and the Computing in Science and Engineering symposium held in Birmingham, Alabama in May 1997. Manuscripts submitted fromthese symposia were subjected to peer review and then revised by the authors. Nineteenmanuscripts were selected for inclusion in this volume based upon peer review, scientificmerit, the editors’ perceptions of lasting value or innovative features, and the general applicability of either the technology itself or the scientific methods and scholarly details provided by the authors.
This volume is a continuation of a theme initiated in 1990. Its predecessors, Emerg-ing Technologies in Hazardous Waste Management, ACS Symposium Series No. 422(I 990), Emerging Technologies in Hazardous Waste Management II, ACS Symposium Series No. 468 (1991), Emerging Technologies in Hazardous Waste Management III, ACS Symposium Series No. 518 (1993), Emerging Technologies in Hazardous Waste Manage-ment IV, ACS Symposium Series No. 554 (1994), Emerging Technologies in Hazardous Waste Management V, ACS Symposium Series No. 607 (1995), Emerging Technologies in Hazardous Waste Management VI, American Academy of Environmental Engineers Publication (1996), and Emerging Technologies in Hazardous Waste Management VII, Plenum Press (1 997), are related contributions on hazardous waste management, but each volume is different. By inspection, the reader may quickly recognize the diversity associated with this topic, and the features of its evolution, although no single volumecan do justice to the breadth and depth of technologies being developed and applied inpractice.
The contributions presented in this volume are divided into three sections. They are: (1) Soil Treatment, (2) Groundwater Treatment, and (3) Radioactive Waste Treat-ment. We trust that the reader will find them informative and useful.
D. William Tedder Georgia Institute of Technology Atlanta, Georgia 30332-0100
Frederick G. PohlandUniversity of Pittsburgh Pittsburgh, Pennsylvania 15261-2294

This page intentionally left blank.
ACKNOWLEDGMENTS
The Industrial and Engineering Chemistry (I&EC) Division of the American Chemical Society organized and sponsored the symposia. ACS Corporate Associates was a major financial cosponsor; the American Institute of Chemical Engineers (AIChE), Environmental Sciences Division, the AIChE Center for Waste Reduction Technologies, and the American Academy of Environmental Engineers were nominal cosponsors. Their generosity was essential to the overall success of the symposia and is gratefully acknowledged.

This page intentionally left blank.
CONTENTS
1. Emerging Technologies in Hazardous Waste Management VIII:An Overview . . . . . . . . . . . . . . . . . . . . . . . . . . . . . . . . . . . . . . . . . . . 1
D. William Tedder and Frederick G. Pohland
SOIL TREATMENT TECHNOLOGIES
2. Chelating Agents for Extraction of Heavy Metals from Soil: Complexing Power, Selectivity, and Recoverability . . . . . . . . . . . .
and Robert W. Peters
9P. K. Andrew Hong, Chelsea Li, Weimin Jiang, Ting-Chien Chen,
3. Electrokinetic Soil Remediation Using Novel Electrodes andModulated Reverse Electric Fields . . . . . . . . . . . . . . . . . . . . . . . . . . . 21
and Chengdong ZhouMaria E. Inman, E. Jennings Taylor, Debbra L. Myers,
4. Electrokinetic Injection of Nutrients in Layered Clay/Sand Mediafor Bioremediution Applications . . . . . . . . . . . . . . . . . . . . . . . . . . . . . . 29
M. F. Rabbi, R. J. Gale, E. Oszu-Acar, G. Breitenbeck,J. H. Pardue, A. Jackson, R. K. Seals, and D. D. Adrian
5. Integrated Remediation Process for a High Salinity IndustrialSoil Sample Contaminated with Heavy Oiland Metals . . . . . . . . . . . . . . . . . . . . . . . . . . . . . . . . . . . . . . . . . . . . . 39
Abdul Majid and Bryan D. Sparks
6. Laboratory and Field Soil Washing Experiments with SurfactantSolutions: NAPL Recovery Mechanisms . . . . . . . . . . . . . . . . . . . . . . . 55
Richard Martel, Pierre J. Gélinas, René Lefebvre, Alain Hébert, Stefan Foy, Laurent Saumure, Annie Roy, and Nathalie Roy
7. Anaerobic Microbial Activity under Electric Fields . . . . . . . . . . . . . . . . 69Krishnanand Maillacheruvu and Akram N. Alshawabkeh
ix
x Contents
GROUNDWATER TREATMENT
8. Mechanistic Factors Affecting Fenton Oxidations in Natural Waters . . . . . . . . . . . . . . . . . . . . . . . . . . . . . . . . . . . . . . . . . . . . . . . . . . . . 81
Matthew A. Tarr and Michele E. Lindsey
9. Innovative Surfactan/Cosolvent Technologies for Removal of NAPL and Sorbed Contaminants from Aquifers . . . . . . . . . . . . . . 93
Chad T. Jafvert and Timothy J. Strathmann
10. Pilot-scale Treatment of TNT-spiked Groundwater by HybridPoplar Trees . . . . . . . . . . . . . . . . . . . . . . . . . . . . . . . . . . . . . . . . . . . . . . . . 109
and Jerald L. Schnoor Phillip L. Thompson, Liz A. Ramer, Pu Yong,
11. In Situ Groundwater Remediation Using Treatment Walls . . . . . . . . . . . . 119Radisav D. Vidic and Frederick G. Pohland
12. Removal of Nitroaromatic Compounds from Water ThroughCombined Zero- Valent Metal Reduction and Enzyme-BasedOxidative Coupling Reactions ................................... 141
and K. E. TaylorH. R. Monsef, D. A. Michels, J. K. Bewtra, N. Biswas,
13. In Situ Fenton-Like Oxidation of Volatile Organics: Laboratory,Pilot and Full-Scale Demonstrations ............................. 153
and Richard J. WattsRichard S. Greenberg, Thomas Andrews, Prasad K. C. Kakarla,
14. Development of an Enhanced Ozone-Hydrogen Peroxide Advanced
Kevin C. Bower, Stephen Durik, and Christopher M. Miller Oxidation Process . . . . . . . . . . . . . . . . . . . . . . . . . . . . . . . . . . . . . . . . . . . . 167
RADIOACTIVE WASTE TREATMENT
15. Polyethylene Encapsulation of Depleted Uranium Trioxide . . . . . . . . . . . 177J. W. Adams, P. R. Lageraaen, P. D. Kalb, and B. R. Patel
16. Treatability Study on the Use of By-product Sulfur in Kazakhstan for the Stabilization of Hazardous and Radioactive Wastes . . . . . . . 187
and W. R. MichaudP. D. Kalb, L. W. Milian, S. P. Yim, R. S. Dyer,
17. Encapsulation of Nitrate Salts Using Vinylmethylpolysiloxane . . . . . . . . 199Stephen Duirk and Christopher M. Miller
18. Development of an On-Line Analyzer for Vanadous Ion
Sherman Kottle, Robert A. Stowe, and John V. Bishop in LOMI Decontamination ................................... 207

Contents xi
19. Magnetic Separation for Nuclear Material Surveillance . . . . . . . . . . . . 217Laura A. Worl, David Devlin, Dallas Hill, Dennis Padilla,
and F. Coyne Prenger
20. Transition Metal Catalysts for the Ambient Temperature Destructionof Organic Wastes Using Peroxydisulfate . . . . . . . . . . . . . . . . . . . . 229
G. Bryan Balazs, John F. Cooper, Patricia R. Lewis, andMartyn G. Adamson
Contributors . . . . . . . . . . . . . . . . . . . . . . . . . . . . . . . . . . . . . . . . . . . . . . . . . . . . . . 241Index . . . . . . . . . . . . . . . . . . . . . . . . . . . . . . . . . . . . . . . . . . . . . . . . . . . . . . . . . . . . 253

This page intentionally left blank.
1
EMERGING TECHNOLOGIES IN HAZARDOUSWASTE MANAGEMENT 8
An Overview
D. William Tedder1 and Frederick G. Pohland2
1School of Chemical EngineeringGeorgia Institute of Technology Atlanta, Georgia 30332-0100
2Department of Civil and Environmental EngineeringUniversity of Pittsburgh Pittsburgh, Pennsylvania 15261-2294
Several long-term trends in technology evolution have become apparent since these symposia first began in 1989. Earlier presenters more frequently discussed treatment methods involving extensive human intervention. Examples of this include soil inciner-ation (e.g., to destroy dioxin at Times Beach) and soil washing techniques that virtually reduce soil to sand and deplete most of its organic and inorganic nutrients. With suchharsh treatments, the residues are essentially beach sands with substantially less value, compared to their in situ uses prior to contamination. Moreover, the soil incinerationoption has inherent risks of airborne emissions.1
As the symposia have continued, the number of presentations describing extremelyharsh and expensive treatment technologies have gradually been supplanted by more subtle and gentler methods. Subsurface engineered barriers, for example, are often very helpful in controlling species migration beyond a designated area, but with lessobvious intrusion. Similarly, phytoremediation, the use of existing plant life or mixed cul-tures of microorganisms, to control hazardous species is continuing to emerge as an important technology. Bioremediation methods, particularly those utilizing in situ bacte-ria, are also of continuing interest as such species can be enlisted to control hazardous chemicals in many instances simply by providing missing nutrients (eg, phosphate or nitrogen).
The use of plants and bacteria to control organic species is readily obvious. Their use in controlling the movement and concentration of heavy metals is perhaps less obvious, but nonetheless fortuitous. Biological systems frequently exhibit high concen-tration factors for species, so trickle bed filters or other technologies utilizing suitable
Emerging Technologies in Hazardous Waste Management 8, edited by Tedder and PohlandKluwer Academic / Plenum Publishers, New York, 2000. 1
2 D. W. Tedder and F.G. Pohland
bacteria are finding increasing numbers of applications, and are often highly cost-effective. In exchange for meeting the requirements of sustaining bacterial life, mankind is able to exploit bacterial properties to control hazards, make the environment cleaner and safer and, by the way, also make it more attractive. Admittedly aesthetic perceptions are highly subjective, but it is suggested that marshlands, even when artificially created, are more attractive than settling ponds or other more obviously man-made devices.
Biological systems and engineered barriers may not be the final answers, particu-larly when heavy metals are concentrated in them, as these substrates must also be managed. Attractive methods must eventually be used for either recycling such metals to appropriate applications or placing them in appropriate final waste forms for permanent disposal. The latter method continues to be the favored approach for managing many radionuclides. However, biological systems can be a useful first step in concentrating toxicants or in some cases destroying them altogether.
Today, reasonable technical alternatives are available for managing many wastes, but questions still remain. Operational safety and user costs are paramount concerns, but better solutions are being found than those available only 10 years ago. The hazardous waste and environmental management problems resulting from industrialization at the turn of the century are not solved, but substantial progress has been made.
SOIL TREATMENT
In Chapter 2, Hong et al. address the use of chelating agents for extracting heavymetals from soil. Chelation is a potentially important method for removing metals (e.g.,Pb, Cu, Cd, Zn, Ni and Hg) from contaminated soil. This paper focuses on assessmenttechniques using predictions that are compared to experimental extraction and recovery results. The prediction of chelator complexing power, selectivity, and eventual chelator recoverability are of particular concern. Assessment techniques are outlined and results are presented for selected species from among 250 alternative chelators.
The ongoing development2–7 of electrokinetic soil remediation continues to suggestthe merit of this technology. In Chapter 3, Inman et al. examine the use of novelelectrodes and modulated reverse electric fields as a means of dealing with speciation issues that reduce overall efficiency. Modulated reverse electric fields, in conjunction with integrated ion exchange electrodes, are being studied as a means of inducing a more uniform remediation of contaminated soils, and to eliminate non-uniform pH profilesthat result from conventional electrokinetics and adversely affect speciation. Their process modifications control soil pH and enhance mass transport of heavy metals between electrodes.
In a related treatment, Rabbi et al. discuss the use of electrokinetic injection toenhance in situ bioremediation in Chapter 4 (also see Chapter 7). Their objective is touse electrokinetics to maintain higher nutrient concentrations in contaminated soil and thus to promote biological growth and destruction of the contaminants. They demon-strate the potential and versatility for this method to improve treatment at sites whereorganic contamination cannot be remediated by natural attenuation alone.
The National Research Council of Canada has developed a process for treating highly saline industrial soils contaminated with heavy oils and heavy metals found in Alberta, Canada. Majid and Sparks describe a solvent extraction soil remediation process in Chapter 5 . Heavy metal fixation is achieved by incorporating metal binding agents intothe soil agglomerates which form during the solvent extraction of organic species. After
Emerging Technologies in Hazardous Waste Management 8 3
remediation, the soils remain saline, but soluble salts can then be removed by water per-colation through a fixed bed of dried, agglomerated soil. Their goal is to provide an inte-grated treatment method which will adequately decontaminate soils, but still permitsubsequent agricultural use. More aggressive decontamination methods often render thetreated soil residues less effective for agricultural applications as mentioned above.
In Chapter 6, Martal et al. describe laboratory and field soil-washing experimentswith surfactant solutions, and summarize non-aqueous phase liquid (NAPL) recoverymechanisms. They studied solutions consisting of mixtures of anionic surfactants andalcohols, and other solvents in some cases. Their laboratory and field experiments show that residual NAPL recovery can exceed 90% while using less than six pore volumes ofconcentrated wash solution. Recovery mechanisms depend upon: (1) NAPL type, (2)micellar solution type (alcohol/surfactant or alcohol/surfactant/solvent), (3) ingredientconcentrations in the micellar solution, (4) washing direction (upward, downward, orhorizontal), (5) injection and pumping patterns, and (6) injection velocities.
In Chapter 7, Maillacheruvu and Alshawabkeh describe experiments to investigatethe effects of an electric field on anaerobic microbial activity, a topic related to thatdiscussed by Rabbi et al. in Chapter 4. Here the focus is less on the enhancement of nutri-ent transport properties by the electric field, but on effect of the electric field on micro-bial activity. They find that microbial activity, measured as a function of the ability ofanaerobic microorganisms to consume readily degradable acetate, generally decreases ifthe pH and dissolved oxygen concentrations are not controlled. Microbial activity ini-tially decreases under exposure to electric current, but recovers after a period of severalhours of exposure. This result suggests that to some extent the culture was able to accli-mate to the current, an important issue if an electric field is used to enhance the trans-port of biological nutrients through contaminated soils as suggested by Rabbi et al. inChapter 4.
GROUNDWATER TREATMENT
Results from studies on Fenton chemistry are reported in Chapter 8 by Tarr andLindsey. They focus on those chemical mechanisms which affect Fenton oxidation innatural waters. This investigation is an expansion on iron chemistry studies described inearlier volumes of this series.8–14 Their studies are related to others in this volume (Monsefet al. in Chapter 12, Greenberg et al. in Chapter 13, and Bower et al. in Chapter 14). Tarrand Lindsey find that altered hydroxyl production rates and increased hydroxyl scaveng-ing occur in natural waters. Hydroxyl binding to natural organic matter is also signifi-cant. They conclude that these three factors are key issues in determining the extent ofoxidation during pollutant destruction and reaction efficiency.They suggest that the same phenomena may also be important in soil systems.
Javert and Strathmann describe the use of surfactant and cosolvent to enhance the removal of non-aqueous phase contaminants (NAPLs) by modified pump-and-treatmethods in Chapter 9. Low NAPL recoveries may result from slow dissolutioninto groundwater, slow diffusion or desorption, or hydrodynamic isolation. They sum-marize ongoing surfactant and cosolvent studies that are designed to overcome these dif-ficulties and make pump-and-treat technology more generally applicable. This chapter complements earlier studieson NAPLs. .15,16
Phytoremediation of TNT-contaminated groundwater by a poplar hybridis described by Thompson et al. in Chapter 10. This paper describes a pilot-scale
4 D. W. Tedder and F. G. Pohland
green-house experiment that examined the irrigation of a hybrid poplar tree (Populusdeltoides Xnigra) with TNT-contaminated groundwater. The results indicate that apoplar tree remediation system may be a feasible solution for low levels of groundwatercontamination.
In Chapter 11, Vidic and Pohland describe advances in treatment wall technology.This strategy involves the construction of permanent, semi-permanent or replaceableunderground walls across the flow path of a contaminant plume. The main perceivedadvantage for this technology is reduced operation and maintenance costs. Although con-siderable design details have already been developed through field- and pilot-scale appli-cations, some critical issues still remain to be resolved. These unresolved issues includeestablishing tested and proven design procedures, and evaluating interactions (perhaps favorable) with other groundwater remediation technologies.
In Chapter 12, Monsef et al. describe the removal of nitroaromatic compounds fromwater using zero-valent metal reduction and enzyme-based oxidative coupling reactions.Again, iron plays a key role. In this case they observe that zero-valent iron is effective inthe reduction of aqueous nitrobenzene to aniline in the absence of oxygen.
A modified Fenton oxidation process, based on a proprietary catalyst, is describedby Greenberg et al. in Chapter 13. In this case, a chelated iron complex was used toenhance the degradation of organic species at a contaminated site. Laboratory, pilot, andfull-scale experiments are described in studies aimed at destroying gasoline and waste oilconstitutents. After full-scale treatment, contaminant levels were either not detected, orwere reduced to concentrations below New Jersey groundwater standards. The contam-inated site was closed after one year.
Advanced oxidation process (AOPs), particularly those utilizing ozone, have beenof interest for a number of years. In Chapter 14, Bower et al. investigate techniques formaking AOP treatment less costly and more effective. They focus on the use of fixedbeds containing sands, especially sands with high iron and manganese concentrations. They find an enhancement in phenol degradation rates, possible due to the formation ofhigher concentrations of hydroxyl radical, at pH 7. Direct ozonation was equallyeffective at pH 8.9.
RADIOACTIVE WASTE TREATMENT
The development of final waste forms remains as an important topic of study, par-ticularly for radioactive wastes. Waste forms have been a recurrent theme in previousvolumes17–25 of this series. Chapters 15-17 of this volume continue this theme in which waste encapsulation studies utilizing polyethylene, by-product sulfur from refineryoperations, and polysiloxane are presented.
The investigation by Adams et al. in Chapter 15 considers the effectiveness ofusing polyethylene for encapsulating depleted uranium trioxide. Using a single-screwextrusion process, they were able to successfully process mixtures with waste loadings up to 90wt% UO3. Leach rates increased with waste loadings, but were relativelylow. Compressive strengths of samples were nearly constant in samples containing
In Chapter 16, Kalb et al. describe their initial test results investigating the use ofby-product sulfur from Kazakhstan to stabilize waste. The by-product sulfur is itself awaste. This stream is primarily elemental sulfur resulting from the refining of petroleumreserves in that country. Kazakhstan also produces hazardous and radioactive wastes;
50-90 wt% UO3.
Emerging Technologies in Hazardous Waste Management 8 5
using by-product sulfur to encapsulate other wastes could therefore “kill two birds withone stone.” Kalb et al. focus on the use of a sulfur-polymer cement21 by reacting the by-product sulfur with organic modifiers (5 wt%). This cement was then used to encapsulatewaste, achieving up to 40 wt% loadings. Waste form performance was characterized bymeasuring compressive strength, water immersion, and accelerated leach testing.
The encapsulation of nitrate salts using polysiloxane is described in Chapter 17.Durik and Miller present results in which compressive strength, metal leaching, and voidarea measurements of polysiloxane-encapsulatedwaste were measured as a function ofwaste loading (27–48wt%) for three surrogate wastes. Cost comparisons with immobi-lization using concrete suggest that polysiloxane could be an economical alternative for the U.S. Department of Energy which now manages substantial quantities of nitrate-bearing mixed wastes.
Regardless of the origin or nature of hazardous wastes, management invariably hasa common initial need to measure their properties. This can take many forms, but wasteassay is inevitable at some point and because the wastes are hazardous, operational risksoften result from such analyses. With radioactive wastes, nondestructive assay techniques,in which radwaste drums can be analyzed without actually opening them, have becomevery important. Such improvements in waste analysis26,27are always welcome.
In Chapter 18, Kottle et al. describe the development of an on-line analyzer for vanadous ion. This technique has potential applications in nuclear power plants in con-junction with the removal of corrosion products from heat transfer systems. Its use shouldreduce personnel exposures during such operations.
The use of magnetic separation for nuclear material detection and surveillanceis described by Worl et al. in Chapter 19. In this case, technology is being developed for the capture of submicron actinide particles, or the retrieval of fission products, in order to determine more about the operation of nuclear facilities. Using high-gradientmagnetic separation, they are able to separate paramagnetic compounds from those which are diamagnetic, and thus effect some degree of separation and concentrationof the paramagnetic species. Their work has potential environmental applications, particularly relating to environmental monitoring of actinide species at very lowcontamination levels.
Direct chemical oxidation28 of wastes is an alternative to incineration29–32 and elec-trochemical oxidation.33 In Chapter 20, Balazs et al. describe the application of transi-tion metal catalysts to enhance the ambient temperature destruction of organic wasteswith peroxydisulfate. This oxidation technology is potentially applicable to many solid or liquid organics (e.g., chlorosolvents, oils and greases, detergents, contaminated soilsand sludges, explosives, chemical and biological warfare agents). Silver ion has the great-est catalytic effect, but reaction rates are reduced somewhat by the presence of chlorideion. Catalysts also affect the production of chlorine gas when treating chlorinated organics, however, this effect is still not well understood.
SUMMARY
Emerging technologies in hazardous waste management are clearly diverse in natureand involve many different disciplines. This diversity is both an advantage and, poten-tially, a disadvantage. On the one hand, it offers the possibility of favorable collabora-tion between investigators with different backgrounds and emphases on the problem. Thisaspect can be advantageous. On the other hand, diversity can easily lead to some degree
6
of confusion and misunderstanding. Thus it can also be a bit of a disadvantage, but suchdifficulties can be overcome if recognized and properly addressed.
Hazardous wastes still exist and although historical wastes have been reduced,major problems still remain, largely because of significant costs of remediation. Haz-ardous waste issues can nonetheless be solved if affected agencies, corporations, andpolitical entities are firmly and consistently resolved to do so. Clearly, technical progesshas been made since these symposia began in 1989. In many situations several technicalalternatives are available to deal with particular problems, but more progress is yet tobe made. Additional discovery is needed to further advance the basic science and tech-nology, and to make translation into practice more of a reality. While numerous techni-cal advances are being made, often their implementation is less than desired and neededto at last solve these problems. Thus, the real issue is less one of technology selection,but rather more one of social resolve and determination to see reasonable solutionsimplemented.
D. W. Tedder and F. G. Pohland
REFERENCES
1. C.D. Stelzer. Another accidental release of dioxin at Times Beach heats up the debate over the inciner-ator’s safety. Riverfront Times (St. Louis), May 15, 1996.
2. E.R. Lindgren, E.D. Mattson, and M.W. Kozak. Electrokinetic remediation of unsaturated soils. InD.W. Tedder and F.G. Pohland, editors, Emerging Technologies in Hazardous Waste Management IV,number 554 in ACS Symposium Series, pages 33-50. ACS Books, 1994.
3. E.D. Mattson and E.R. Lindgren. Electrokinetic extraction of chromate from unsaturated soils. In D.W.Tedder and F.G. Pohland, editors, Emerging Technologies in Hazardous Waste Management V, number607 in ACS Symposium Series, pages 10–20.ACS Books, 1995.
4. T.R. Krause and B. Tarman. Preliminary results from the investigation of thermal effects in electroki-netic soil remediation. In D.W. Tedder and F.G. Pohland, editors, Emerging Technologies in Hazardous Waste Management V, number 607 in ACS Symposium Series, pages 21-32.ACS Books, 1995.
5. R.F. Thornton and A.P. Shapiro. Modeling and economic analysis of in situ remediation of Cr(VI)- contaminated soil by electromigration. In D.W. Tedder and F.G. Pohland, editors, Emerging Technolo-gies in Hazardous Waste Management V, number 607 in ACS Symposium Series, pages 33–47. ACSBooks, 1995.
6. E.R. Lindgren, R.R. Rao, and B.A. Finlayson. Numerical simulation of electrokinetic phenomena. InD.W. Tedder and F.G. Pohland, editors, Emerging Technologies in Hazardous Waste Management V, number 607 in ACS Symposium Series, pages 48–43. ACS Books, 1995.
7. S.B. Martin, Jr., D.J. Dougherty, and H.E. Allen. Electrochemical recovery of EDTA and heavy metalsfrom washing of metal contaminated soil. In D.W. Tedder and F.G. Pohland, editors, Emerging Tech-nologies in Hazardous Waste Management 7, pages 159–166. Plenum Press, New York, 1997.
8. R.A. Bull and J.T. McManamon. Supported catalysts in hazardous waste treatment: Destruction ofinorganic polutants in wastewater with hydrogen peroxide. In D.W. Tedder and F.G. Pohland, editors, Emerging Technologies in Hazardous Waste Management, number 422 in ACS Symposium Series, pages 52–46.ACS Books, 1990.
9. R.A. Larson, K.A. Marley, and M.B. Schlauch. Strategies for photochemical treatment of wastewaters.In D.W. Tedder and F.G. Pohland, editors, Emerging Technologies in Hazardous Waste Management II, number 468 in ACS Symposium Series, pages 66-82. ACS Books, 1991.
10. J.J. Pignatello and Y. Sun. Photo-assisted mineralization of herbicide wastes by ferric ion catalyzed hydrogen peroxide. In D.W. Tedder and F.G. Pohland, editors, Emerging Technologies in Hazardous Waste Management III, number 518 in ACS Symposium Series, pages 77-84.ACS Books, 1993.
11. C. Sato, S.W. Leung, H. Bell, W.A. Burkett, and R.J. Watts. Decomposition of perchloroethylene andpolychlorinated biphenyls with Fenton’s reagent. In D.W. Tedder and F.G. Pohland, editors, EmergingTechnologies in Hazardous Waste Management III, number 518 in ACS Symposium Series, pages 343–357.ACS Books, 1993.
12. J.B. Carberry and S.H. Lee. Enhancement of pentachlorophenol biodegradation by Fenton’s reagentpartial oxidation. In D.W. Tedder and F.G. Pohland, editors, Emerging Technologies in Hazardous Waste Management IV, number 554 in ACS Symposium Series, pages 197–222. ACS Books, 1994.
Emerging Technologies in Hazardous Waste Management 8 7
13. M.D. Gurol, S.S. Lin, and N. Bhat. Granular iron oxide as a catalyst in chemical oxidation of organiccontaminants. In D.W. Tedder and F.G. Pohland, editors, Emerging Technologies in Hazardous Waste Management 7, pages 9-22.Plenum Press, New York, 1997.
14. G. Kand, J. Jung, K. Park, and D.K. Stevens. Mineralization of hazardous chemicals by Heme reac-tion. In D.W. Tedder and F.G. Pohland, editors, Emerging Technologies in Hazardous Waste Manage-ment 7, pages 69-80.Plenum Press, New York, 1997.
15. R.C. Chawla, C. Porzucek, J.N. Cannon, and J.H. Johnson, Jr. Importance of soil-contaminant-surfactant interactions for in situ soil washing. In D.W. Tedder and F.G. Pohland, editors, EmergingTechnologies in Hazardous Waste Management II, number468 in ACS Symposium Series, pages 316–341.ACS Books, 1991.
16. D.C.M. Augustijn and P.S.C. Rao. Enhanced removal of organic contaminants by solvent flushing. InD.W. Tedder and F.G. Pohland, editors, Emerging Technologies in Hazardous Waste Management V, number 607 in ACS Symposium Series, pages 224–236.ACS Books, 1995.
17. C.S. Shieh, I.W. Duedall, E.H. Kalajian, and F.J. Roethal. Energy waste stabilization technology for usein artificial reef construction. In D.W. Tedder and F.G. Pohland, editors, Emerging Technologies in Haz-ardous Waste Management, number 422 in ACS Symposium Series, pages 328–344. ACS Books, 1990.
18. P.L. Bishop. Contaminant leaching from solidified-stabilized wastes: Overview. In D.W. Tedder and F.G.Pohland, editors, Emerging Technologies in Hazardous Waste Management II, number 468 in ACS Sym-posium Series, pages 302 315. ACS Books, 1991.
19. P. Chu, M.T. Rafferty, T.A. Delfino, and R.F. Gitschlag. Comparison of fixation techniques for soil con-taining arsenic. In D.W. Tedder and F.G. Pohland, editors, Emerging Technologies in Hazardous Waste Management II, number 468 in ACS Symposium Series, pages 401414. ACS Books, 1991.
20. G.R. Darnell, R. Shuman, N. Chau, and E.A. Jennrich. Above grade earth-mounded concrete vault: Structural and radiological performance. In D.W. Tedder and F.G. Pohland, editors, Emerging Tech-nologies in Hazardous Waste Management II, number 468 in ACS Symposium Series, pages 415430.ACS Books, 1991.
21. G.R. Darnell. Sulfur polymer cement as a final waste form for radioactive hazardous wastes. In D.W.Tedder and F.G. Pohland, editors, Emerging Technologies in Hazardous Waste Management IV, number554 in ACS Symposium Series, pages 299-307. ACS Books, 1994.
22. L.J. Staley. Vitrification technologies for the treatment of contaminated soil. In D.W. Tedder and F.G.Pohland, editors, Emerging Technologies in Hazardous Waste Management V, number 607 in ACS Sym-posium Series, pages 102-120. ACS Books, 1995.
23. G.A. Reimann, J.D. Grandy, and G.L. Anderson. Iron-enriched basalt waste forms. In D.W. Tedder andF.G. Pohland, editors, Emerging Technologies in Hazardous Waste Management V, number 607 in ACS Symposium Series, pages 121-134. ACS Books, 1995.
24. G.J. Thomas, D.D. Reible, K.T. Valsaraj, L.J. Thibodeaux, and D. Timberlake. Capping of contami-nated sediments: Experimental results and validation of mathematical models. In D.W. Tedder and F.G. Pohland, editors, Emerging Technologies in Hazardous Waste Management VI, pages 293-310. Ameri-can Academy of Environmental Engineers, 1996.
25. D.K. Peeler and P.R. Hrma. Compositional range of durable borosilicate simulated waste glasses. InD.W. Tedder and F.G. Pohland, editors, Emerging Technologies in Hazardous Waste Management VI, pages 323-338. American Academy of Environmental Engineers, 1996.
26. K.J. Liekhus, M.E. Vaughn, B.A. Jensen, and M.J. Connolly. Method of characterizing VOC concen-tration in vented waste drums with multiple layers of confinement using limited sampling data. In D.W.Tedder and F.G. Pohland, editors, Emerging Technologies in Hazardous Waste Management VI, pages339–348. American Academy of Environmental Engineers, 1996.
27. R.S. Melarkode, A.C. Bumb, and W.S. Phillips. Use of an analytical transport model to minimize sam-pling lactions. In D.W. Tedder and F.G. Pohland, editors, Emerging Technologies in Hazardous Waste Management VI, pages 349–362. American Academy of Environmental Engineers, 1996.
28. J.R. Smith. Air-nitric acid destructive oxidation of organic wastes. In D.W. Tedder and F.G. Pohland,editors, Emerging Technologies in Hazardous Waste Management V, number 607 in ACS SymposiumSeries, pages 156–162.ACS Books, 1995.
29. T.Y. Xiong, D.K. Fleming, and S.A. Weil. Hazardous material destruction in a self-regenerationcombustor-incinerator. In D.W. Tedder and F.G. Pohland, editors, Emerging Technologies in Hazardous Waste Management II, number 468 in ACS Symposium Series, pages 12-28.ACS Books, 1991.
30. M. Flytzani-Stephanopoulos, A.F. Sarofim, L. Tognotti, H. Kopsinis, and M. Stoukides. Incineration of contaminated soils in an electrodynamic balance. In D.W. Tedder and F.G. Pohland, editors, Emerg-ing Technologies in Hazardous Waste Management II, number 468 in ACS Symposium Series, pages 29-49. ACS Books, 1991.

8 D. W. Tedder and F. G. Pohland
31. Q.Y. Han, Q.D. Zhuang, J.V.R. Heberlein, and W. Tormanen. Thermal plasma destruction of hazardouswaste with simultaneous production of valuable co-products In D.W. Tedder and F.G. Pohland, editors,Emerging Technologies in Hazardous Waste Management V, number 607 in ACS Symposium Series,pages 135–143. ACSBooks, 1995.
32. J.L. Graham, B. Dellinger, D. Klosterman, G. Glatzmaier, and G. Nix. Disposal of toxic wastes by usingconcentrated solar radiation. In D.W. Tedder and F.G. Pohland, editors, Emerging Technologies in Haz-ardous Waste Management II, number 468 in ACS Symposium Series, pages 83-109.ACS Books, 1991.
33. R.G. Hickman, J.C. Farmer, and F.T. Wang. Mediated electrochemical process for hazardous wasteincineration. In D.W. Tedder and F.G. Pohland, editors, Emerging Technologies in Hazardous WasteManagement III, number 518 in ACS Symposium Series, pages 430–451. ACS Books, 1993.
2
CHELATING AGENTS FOR EXTRACTION OFHEAVY METALS FROM SOIL
Complexing Power, Selectivity, And Recoverability
P. K. Andrew Hong*, Chelsea Li, Weimin Jiang, Ting-Chien Chen†,and Robert W.Peters‡
Department of Civil and Environmental EngineeringUniversity of UtahSalt Lake City, Utah 84112USA
ABSTRACT
Chelating extraction of heavy metals from contaminated soils is seen as a remedi-ation technique. This work addresses important consideration in the application ofchelating agents for soil remediation, namely the complexing power, selectivity, and recov-erability of the chelators with respect to heavy metal contaminants. To address these issues, an assessment technique was developed to evaluate the chelators based on com-plexation equilibria of the chelators toward the target metals including Pb, Cu, Cd, Zn, Ni, and Hg. Predictions in terms of complexing power and selectivity were made using this technique and were compared to experimental extraction results using several chela-tors including L-5-glutamyl-L-cysteinylglycine (GCG), ethylenediaminetetraacetic acid (EDTA), nitrilotris(methylene)triphosphonic acid (NTTA), and trimethylenedinitrilote-traacetic acid (TMDTA). Experimental results showed an increasing complexing abilityin the order of GCG < NTTA < TMDTA < EDTA, and an increasing selectivity towardthe metal contaminants in the order of EDTA < TMDTA < GCG < NTTA. These resultswere largely consistent with equilibrium predictions. Enhanced recovery of metals froma very strong chelator EDTA was demonstrated with the use of metal-competing cationicprecipitants (calcium hydroxide and ferric chloride) or anionic sulfide precipitant.
*To whom correspondence should be addressed.Present Address: Department of Environmental Engineering and Health, Tajen Junior College of Pharmacy,
En-Pu Hsiang, Pingtung, Taiwan Energy Systems Division, Argonne National Laboratory, Argonne, IL 60439-4815, USA
Emerging Technologies in Hazardous Waste Management 8, edited by Tedder and Pohland Kluwer Academic/Plenum Publishers, New York, 2000 . 9
10 P. K. Andrew Hong et al.
1. INTRODUCTION
Economic activities in the industrialized countries in the past have resulted in sig-nificant contamination of environmental resources including soil and groundwater.Theseactivities include vehicle operation, mining, smelting,metal plating and finishing,batteryproduction and recycling, agricultural and industrial chemical application, and inciner-ation processes. In the U.S., thousands of hazardous waste sites have been placed on theNational Priority List for clean-up of heavy metals under Superfund. Metals of partic-ular interest are cadmium, chromium, copper, lead, mercury, nickel, and zinc. Heavymetals contamination has also occurred at military installations with lead, chromium,and cadmium being most prevalent. Military operations that contributed to heavy metalscontamination include those in firing ranges, ammunition manufacturing facilities, andopen burning pits. Heavy metals are increasingly recognized as major contaminants atmilitary sites, and they now make up five of the six hazardous substances monitored mostfrequently at Army installations.1
Chelating extraction of heavy metals in soil washing operation is seen as an effec-tive remediation technique for contaminated soils. Chelators that have been used forextraction of heavy metals from soils include EDTA, NTA, DTPA, formic, succinic,oxalic, citric, acetic, humic, and fulvic acids, glycine, cysteine, SCMC, ADA, PDA,and others.2–15 While many studies have shown that chelating agents are effectivefor metals removal, relatively little work have been published relative to the recla-mation and reuse of chelating agents. Chelating extraction of heavy metals with anemphasis on recovering and reusing the chelating agents has only been addressedrecently.15–21 These recent studies have demonstrated the recovery of metals followingchelating extraction via (1) the use of electrochemicalmethod to recover strong chelatorEDTA, and (2) the elevation of solution pH to recover those chelators of moderatestrength.
This paper essays to address three important aspects of chelating extraction forremediation of heavy metals contaminated soils, namely the complexingpower, the selec-tivity, and the recoverability of the chelating agents. Outlined in this paper are assess-ment techniques for chelators in terms of their complexing ability and selectivity towardtarget metal contaminants, and the results of evaluation for about 250 chelators employ-ing this technique. Experimental results on extraction and selectivity are presented forseveral chelators. The recovery of EDTA, a strong chelator with the strength that rendersits separation from the extracted metal challenging, was successfully shown in thelaboratory.
2. ASSESSMENT TECHNIQUES AND RESULTS
2.1. Chemistry of Metals Extraction Using Chelating Agents
2.1.1. Metal Speciation in Natural Waters. In the presence of ambient natural ligandssuch as HCO3
-, CO32–, Cl-, SO4
2–, an aqueous divalent contaminant metal (MeIIaq)
speciates in various free and complex forms:
Meaq=Me2++Me(OH)x(2–x)+ Mex(OH)y
(2x–y) +Me(HnCO3)x(2-2x+nx) + MeClx
(2–x)
+ Me(SO4)x(2–x)
Chelating Agents for Extraction of Heavy Metals from Soil 11
The solubilities of contaminant metals are controlled by predominant mineralphases such as MeO(s), Me(OH)2(s), MeCO3(s), Mex(OH)y(CO3)z(s), and MeSO4(s),depending upon the pH and/or ambient ligands available.
2.1.2. Acid-Base Equilibrium of Chelating Agents. Effective chelating agents typicallyhave multiple coordination sites (i.e., ligand atoms) available for complexation with ametal center. Chelators are often multi-protic acids (HnL) capable of undergoing acid-base equilibrium reactions in the aqueous phase, e.g.:
HnL = H+ + Hn–1L– pK1
and subsequently,
Hn-mLm- = H+ + Hn-(m+1)L–(m+1) pKm+1
2.1.3. Metals Complexation with Chelating Agents. Each conjugate acid/base of thechelating agent may form a strong complex with the metal, resulting in the formation ofvarious complexes Mex(Hn–mL)y
2x–my:
pK2x–my
xMe2+ +yHn–mLm– = Mex(Hn–mL)y
with the total complexes concentration (MeLTot) given by MeLTot:2x–my
MeLTot =
Thus, the total metal solubility, MeTot, is computed by:
MeTot = Meaq + MeLTot,
The complexation power of chelating agents toward heavy metals can be deter-mined based on the equilibrium computation procedures formulated above. The strongchelator often demonstrates a total solubility with the chelator (MeTot) that is orders ofmagnitude higher than that without the chelator (Meaq).
2.2. Assessments of Complexing Power and Selectivity of Chelating Agents
The metal-ligand complexation equilibrium constant expresses the ligand's affinitytoward the target metal (divalent as shown):
Me2+ + Ln- = MeL2-n pKMe
In evaluating chelators, we have examined the equilibrium constants (pK’s) of about250 chelators for complexation with 6 divalent target metals including Pb, Cu, Cd, Zn,Ni, and Hg (Smith and Martell, 1974; 1976; 1982; 1989). The affinity of a chelator toward the target metals, whenever the equilibrium constants are available, was computed as anaverage pKtarget value:
pKtarget =(pKPb +pKCu +pKCd +pKzn +pKNi +pKHg)/6
12 P. K. Andrew Hong et al.
The affinity of the chelator toward ambient cations such as Ca and Mg was, when available, determined by the average pKambient value:
pKambient = (pKCa + pKMg)/2
Thus, a selectivity ratio can be defined as SR, where:
SR = pKtarger/pKambient
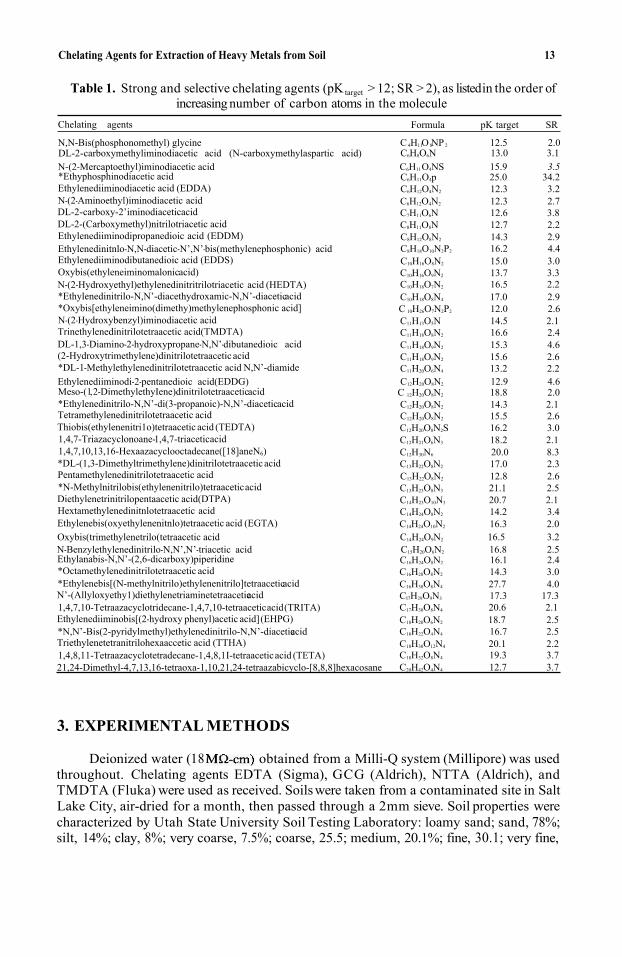
According to this formulation, a strong chelator will have large pKtarget andpKambient values, whereas a strong and selective chelator toward heavy metals will have a large pKtarget and a relatively small pKambient, thus a large SR value. Table 1 identifiesapproximately 40 chelators that have relatively large PKtarget (>12) and SR (>2) values.This table may serve to guide in the selection of chelators that are both effective and selective toward the 6 target metals.
2.3. Recovery of Moderately Strong and Very Strong Chelating Agents
For a system containing both the ligand and metal at a specified ligand to metal concentration ratio, a degree of complexation (DOC) parameter can be taken as theratio of the total metal solubility with chelation to the aqueous solubility without chela-tion, i.e., MeTot/Meaq.22 A chelating agent with a large DOC value (>>1) indicates a highdegree of complexation of the metal as afforded by the chelating agent and thus a sig-nificant enhancement of the solubilization of the metal. Contrarily, a small DOC value(≤1) of a chelating agent indicates little enhancement by chelation or the likely occur-rence of precipitation of the metal as a mineral at the specified pH of consideration. Theeffective pH ranges within which that the chelating agents bind adequately with the target metals (Pb, Cu, Cd, Zn, Ni, and Hg) have been reported for about 200 chelating agents.15,17 For strong chelating agents, the DOC’s are high over a broad pH range (e.g.3 to 12); however, for chelating agents of moderate strength, the DOC’s are high at lowor moderate pH but low at high pH. This means that a chelator of moderate strength can enhance metal solubilization by complexation at a lower pH but release the complexed metal as hydroxide or other precipitates at an elevated pH condition. This feature can be exploited to separate the chelator from extracted heavy metals, thus allow-ing the chelator for reuse. Based on this principle, the extraction, recovery, and reuse of several chelators of moderate strength have been demonstrated for Pb, Cu, Cd, and
Although the use of strong and selective chelating agents is desirable, the recovery of strong chelating agents such as EDTA for reuse remains a challenge. Beyond the control of pH as a recovery technique, this work further explores the addition of cationicprecipitants such as calcium hydroxide and ferric chloride and anionic sulfide precipitant to effect the separation and recovery of spent EDTA. This alternative approach is based on the competition of the added cations (e.g., Ca2+and Fe3+) with the target metal replac-ing the target metal in the complex, or on the competition of the added anions (e.g., S2)with EDTA for the target metal, in either case resulting in the formation of precipitates of the target metal.
Zn.15,17–21
Chelating Agents for Extraction of Heavy Metals from Soil 13
Table 1. Strong and selective chelating agents (pK target > 12; SR > 2), as listedin the order ofincreasing number of carbon atoms in the molecule
N,N-Bis(phosphonomethyl) glycine C 4H11O 8NP 2 12.5 2.0
N-(2-Mercaptoethyl)iminodiacetic acid C6H11O4NS 15.9 3.5
Chelating agents Formula pK target SR
DL-2-carboxymethyliminodiacetic acid (N-carboxymethylaspartic acid) C6H8O6N 13.0 3.1
*Ethyphosphinodiacetic acid C6H11O4p 25.0 34.2 Ethylenediiminodiacetic acid (EDDA) C6H12O4N2 12.3 3.2N-(2-Aminoethyl)iminodiacetic acid C6H12O4N2 12.3 2.7DL-2-carboxy-2’iminodiacetic acid C7H11O6N 12.6 3.8
Ethylenediiminodipropanedioic acid (EDDM) C8H12O8N2 14.3 2.9
Ethylenediiminodibutanedioic acid (EDDS) C10H16O8N2 15.0 3.0
DL-2-(Carboxymethyl)nitrilotriacetic acid C8H11O8N 12.7 2.2
Ethylenedinitnlo-N,N-diacetic-N’,N’-bis(methylenephosphonic) acid C8H18O10N2P2 16.2 4.4
Oxybis(ethyleneiminomalonic acid) C10H16O9N2 13.7 3.3N-(2-Hydroxyethyl)ethylenedinitritrilotriacetic acid (HEDTA) C10H18O7N2 16.5 2.2
N-(2-Hydroxybenzyl)iminodiacetic acid C11H13O5N 14.5 2.1
*Ethylenedinitrilo-N,N’-diacethydroxamic-N,N’-diacetic acid C10H18O8N4 17.0 2.9*Oxybis[ethyleneimino(dimethy)methylenephosphonic acid] C 10H26O7N2P2 12.0 2.6
Trinethylenedinitrilotetraacetic acid(TMDTA) C11H18O8N2 16.6 2.4DL-1,3-Diamino-2-hydroxypropane-N,N’-dibutanedioic acid C11H18O9N2 15.3 4.6(2-Hydroxytrimethylene)dinitrilotetraacetic acid C11H18O9N2 15.6 2.6
Ethylenediiminodi-2-pentanedioic acid(EDDG) C12H20O8N2 12.9 4.6*DL-1-Methylethylenedinitrilotetraacetic acid N,N’-diamide C11H20O6N4 13.2 2.2
Meso-(1, 2-DimethylethyIene)dinitrilotetraaceticacid C 12H20O8N2 18.8 2.0*Ethylenedinitrilo-N,N’-di(3-propanoic)-N,N’-diacetic acid C12H20O8N2 14.3 2.1
1,4,7-Triazacyclonoane-1,4,7-triacetic acid C12H21O6N3 18.2 2.1
Tetramethylenedinitrilotetraacetic acid C12H20O8N2 15.5 2.6Thiobis(ethylenenitri1o)tetraacetic acid (TEDTA) C12H20O8N2S 16.2 3.0
1,4,7,10,13,16-Hexaazacyclooctadecane([18]aneN6) C12H30N6 20.0 8.3 *DL-(1,3-Dimethyltrimethylene)dinitrilotetraacetic acid C13H22O8N2 17.0 2.3Pentamethylenedinitrilotetraacetic acid C13H22O8N2 12.8 2.6*N-Methylnitrilobis(ethylenenitrilo)tetraacetic acid C13H23O8N3 21.1 2.5Diethylenetrinitrilopentaacetic acid(DTPA) C14H23O10N3 20.7 2.1Hextamethylenedinitnlotetraacetic acid C14H24O8N2 14.2 3.4Ethylenebis(oxyethylenenitnlo)tetraacetic acid (EGTA) C14H24O10N2 16.3 2.0
N-Benzylethylenedinitrilo-N,N’,N’-triacetic acid C15H20O6N2 16.8 2.5 Oxybis(trimethylenetrilo(tetraacetic acid C14H24O9N2 16.5 3.2
Ethylanabis-N,N’-(2,6-dicarboxy)piperidine C16H24O8N2 16.1 2.4*Octamethylenedinitrilotetraacetic acid C16H28O8N2 14.3 3.0*Ethylenebis[(N-methylnitrilo)ethylenenitrilo]tetraacetic acid C16H30O8N4 27.7 4.0N’-(Allyloxyethy1)diethylenetriaminetetraacetic acid CI7H29O9N3 17.3 17.3 1,4,7,10-Tetraazacyclotridecane-1,4,7,10-tetraacetic acid (TRITA) C17H30O8N4 20.6 2.1Ethylenediiminobis[(2-hydroxy phenyl)acetic acid] (EHPG) C18H20O6N2 18.7 2.5*N,N’-Bis(2-pyridylmethyl)ethylenedinitrilo-N,N’-diacetic acid C18H22O4N4 16.7 2.5Triethylenetetranitrilohexaaccetic acid (TTHA) C18H30O12N4 20.1 2.21,4,8,11-Tetraazacyclotetradecane-1,4,8,1 I-tetraacetic acid (TETA) C18H32O8N4 19.3 3.721,24-Dimethyl-4,7,13,16-tetraoxa-1,10,21,24-tetraazabicyclo-[8,8,8]hexacosane C20H42O4N4 12.7 3.7
3. EXPERIMENTAL METHODS
Deionized water (18 obtained from a Milli-Q system (Millipore) was used throughout. Chelating agents EDTA (Sigma), GCG (Aldrich), NTTA (Aldrich), andTMDTA (Fluka) were used as received. Soilswere taken from a contaminated site in Salt Lake City, air-dried for a month, then passed through a 2mm sieve. Soil properties werecharacterized by Utah State University Soil Testing Laboratory: loamy sand; sand, 78%;silt, 14%; clay, 8%; very coarse, 7.5%; coarse, 25.5; medium, 20.1%; fine, 30.1; very fine,
14 P. K.AndrewHong et al.
0.1%; organic matter, 2.67%; organic carbon, 1.55%; Cu, 440mg/Kg; Pb, 1,900mg/Kg;Ni, 23.3mg/Kg; Zn, 1,800mg/Kg; and As, 685mg/Kg. Typical experiments were con-ducted in 125mL glass Erlenmeyer flasks using a batch solution volume (V) of 100mL.All flasks were sealed with stoppers to reduce exchange with the atmosphere during exper-iments. All pH adjustments were performed manually by addition of either a 5 M HNO3 or NaOH solution. pH measurements were with an Orion model SA 720pH meter. Stock metal solutions (1,000mg/L) were prepared according to ASTM Methods. A gyratory shaker table (New Brunswick Scientific Co., Model G-2) provided agitation during extrac-tion procedures. The soil was kept in suspension by operating the shaker table at 260 rpm. All experiments were conducted at the room temperature of 23 1 °C. Total dissolvedmetal concentrations (MeT) were measured in aliquots withdrawn from the reaction mix-tures and filtered through a 0.45 µm filter (Gelman Sciences sterile aerodisc), then acidi-fied with nitric acid. Metal analyses were by atomic absorption (AA) spectrometry (Perkin Elmer Model 280) using ASTM methods.23 Standard procedures were followed when available.23–26 All equilibrium constants used in calculation were obtained fromSmith and Martell.27
Extraction experiments were conducted with 5% soil slurries (i.e., 5g of soil in100mL of chelator solution). Concentrations of chelators were 10–50mM. To commence extraction, the soil was added to the chelator solutions and the pH was initially adjusted to about pH 7.5 if necessary. The mixture was continuously maintained in suspension bya shaker table. Either 4 or 24 hours was allowed for extraction. The tests of chelator recovery were performed by adding various amounts of precipitant solids (cationic or anionic) into solutions of metal-ligand complexes. The mixtures were continually agi-tated for 1 or 2 hours to promote precipitation, then centrifuged, filtered, and the con-centrations of metals in the filtrate analyzed.
4. RESULTS AND DISCUSSION
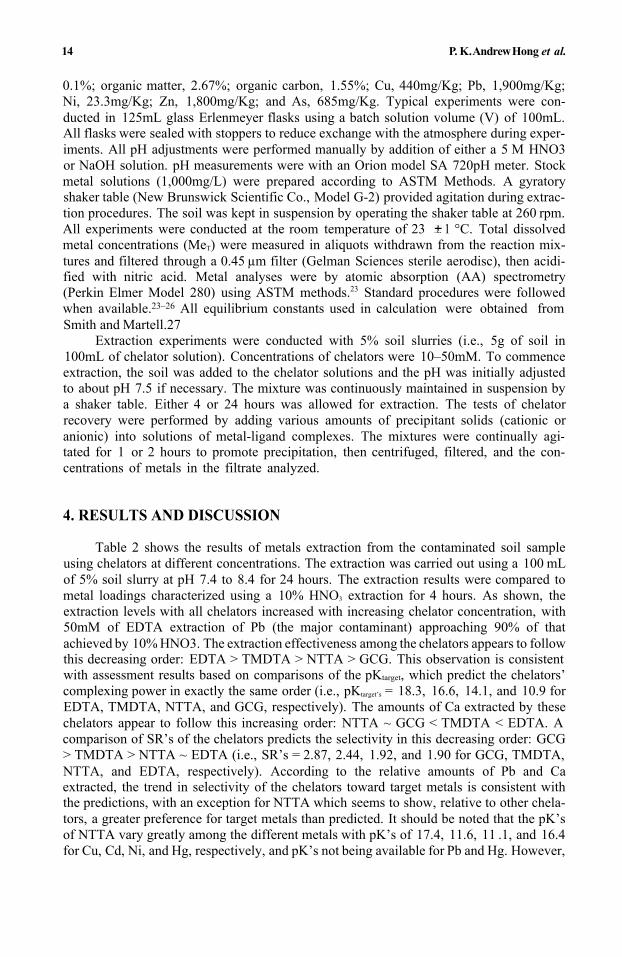
Table 2 shows the results of metals extraction from the contaminated soil sampleusing chelators at different concentrations. The extraction was carried out using a 100 mLof 5% soil slurry at pH 7.4 to 8.4 for 24 hours. The extraction results were compared to metal loadings characterized using a 10% HNO3 extraction for 4 hours. As shown, the extraction levels with all chelators increased with increasing chelator concentration, with50mM of EDTA extraction of Pb (the major contaminant) approaching 90% of that achieved by 10% HNO3. The extraction effectiveness among the chelators appears to follow this decreasing order: EDTA > TMDTA > NTTA > GCG. This observation is consistentwith assessment results based on comparisons of the pKtarget, which predict the chelators’complexing power in exactly the same order (i.e., pKtarget’s = 18.3, 16.6, 14.1, and 10.9 forEDTA, TMDTA, NTTA, and GCG, respectively). The amounts of Ca extracted by these chelators appear to follow this increasing order: NTTA ~ GCG < TMDTA < EDTA. Acomparison of SR’s of the chelators predicts the selectivity in this decreasing order: GCG> TMDTA > NTTA ~ EDTA (i.e., SR’s = 2.87, 2.44, 1.92, and 1.90 for GCG, TMDTA,NTTA, and EDTA, respectively). According to the relative amounts of Pb and Caextracted, the trend in selectivity of the chelators toward target metals is consistent with the predictions, with an exception for NTTA which seems to show, relative to other chela-tors, a greater preference for target metals than predicted. It should be noted that the pK’s of NTTA vary greatly among the different metals with pK’s of 17.4, 11.6, 11 .1, and 16.4 for Cu, Cd, Ni, and Hg, respectively, and pK’s not being available for Pb and Hg. However,
Chelating Agents for Extraction of Heavy Metals from Soil 15
Table 2. Metals extraction from soil using different chelatorconcentrations. Conditions were 100mL of 5% soil slurry,extraction pH 7.4–8.4, 24 hrs flask shaking. Metal loadings
(10% HNO3 for 4 hrs) were Pb = 2,320 g/Kg, Cu = 246 mg/Kg,Ni = 27.0mg/Kg, Zn = 391 mg/Kg, Fe = 9,850mg/Kg, and
Ca = 10,100mg/KgChelator Concentration (mM)
Chelator Metal (mg/Kg) 50 20 10
1. EDTA Pb 2,080 1,970 1,570 cu 109 93.4 68.4Ni 9 5.4 3.8Zn 23 1 194 154Fe 588 62 1 408Ca 11,500 8,990 5,400
2. NTTA Pb 1,690 1,330 1,080 cu 83.6 14.6 58.8 Ni 10.8 8.6 5.2 Zn 272 232 167 Fe 969 797 984 Ca 4,140 1,790 1,570
3. TMDTA Pb 1,820 1,500 1,410cu 87 63.4 55.8 Ni 8.6 4.8 3.2 Zn 189 167 157 Fe 346 248 232 Ca 9,400 7,330 5,090
4. GCG Pb 1,170 835 162 cu 45.4 30.8 162 Ni 5.4 3.8 3.2 Zn 141 64.8 53.4 Fe 138 53.4 14.4 Ca 4,890 1,870 1,350
the high selectivity of NTTA is not surprising as it contains three P atoms as the ligandatoms which highly prefer the target metals of higher polarizability.
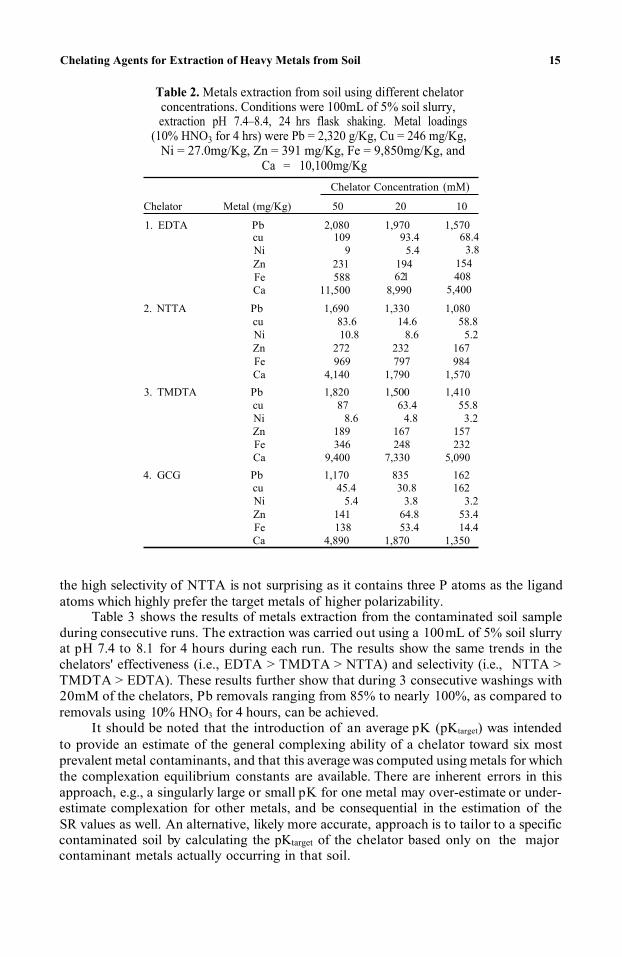
Table 3 shows the results of metals extraction from the contaminated soil sampleduring consecutive runs. The extraction was carried out using a 100 mL of 5% soil slurryat pH 7.4 to 8.1 for 4 hours during each run. The results show the same trends in thechelators' effectiveness (i.e., EDTA > TMDTA > NTTA) and selectivity (i.e., NTTA >TMDTA > EDTA). These results further show that during 3 consecutive washings with 20mM of the chelators, Pb removals ranging from 85% to nearly 100%, as compared toremovals using 10% HNO3 for 4 hours, can be achieved.
It should be noted that the introduction of an average pK (pKtarget) was intendedto provide an estimate of the general complexing ability of a chelator toward six mostprevalent metal contaminants, and that this average was computed using metals for whichthe complexation equilibrium constants are available. There are inherent errors in thisapproach, e.g., a singularly large or small pK for one metal may over-estimate or under-estimate complexation for other metals, and be consequential in the estimation of theSR values as well. An alternative, likely more accurate, approach is to tailor to a specificcontaminated soil by calculating the pKtarget of the chelator based only on the majorcontaminant metals actually occurring in that soil.
16 P. K. Andrew Hong et al.
Table 3. Metals extraction from soil during consecutive runs. Conditions were 20mM chelator, 100mL of 5% soil slurry,extraction pH 7.4–8.1, 4hrs flask shaking. Metal loadings
(10% HNO3 for 4hrs) were Pb = 2,320mg/Kg, Cu = 246mg/Kg,Ni = 27.0mg/Kg, Zn = 391mg/Kg, Fe = 9,850mg/Kg, and
Ca = 10,100mg/Kg
Metal Consecutive Extraction Run
Chelator (mg/Kg) 1 3 5 Runs Total
1. EDTA Pb 1,690 431 262 2,380c u 61.8 7.60 20.4 89.8Ni 12.2 8.8 5.6 26.6Zn 101 30.2 37.4 169Fe 227 117 548 892Ca 6,270 1,360 1,030 8,660
2. NTTA Pb 1,160 442 369 1,970 c u 38.4 6.4 19.4 64.2 Ni 20.8 5.8 5.8 32.4Zn 93.6 22 33 149 Fe 351 209 721 1,280Ca 1,640 1,420 1,280 4,340
3. TMDTA Pb 1,300 569 392 2,260c u 49.6 17.2 23 89.8Ni 9 5.6 5.2 19.8Zn 68.4 33 23.4 125Fe 116 154 453 723Ca 3,980 2,290 1,670 7,940
The recovery of metals and the chelator from metal-EDTA complexes was studied using different cationic (Ca2+, Fe3+) and anionic (S2-, PO4
3-, CO32-) precipitants.
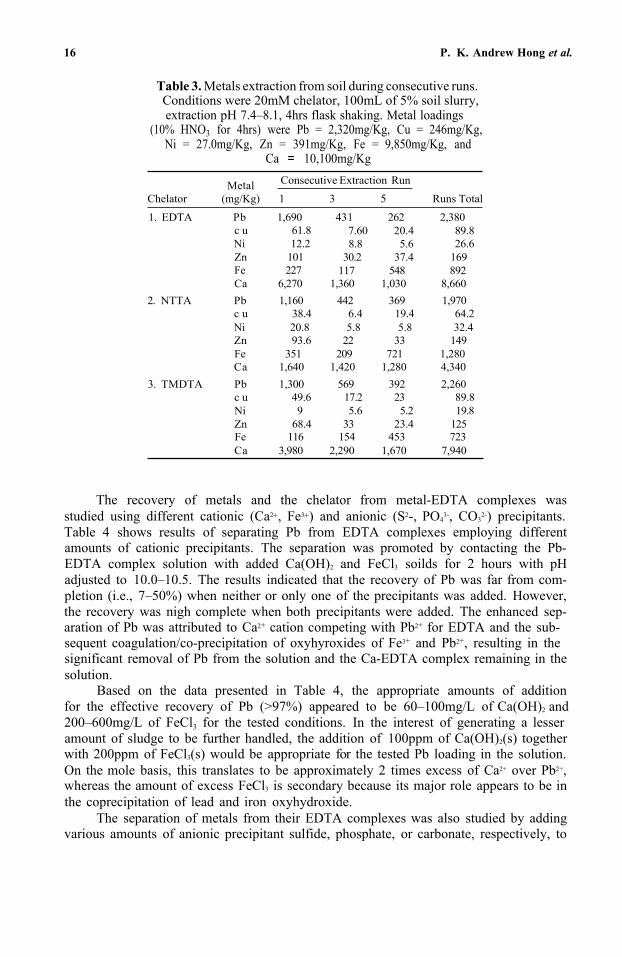
Table 4 shows results of separating Pb from EDTA complexes employing differentamounts of cationic precipitants. The separation was promoted by contacting the Pb-EDTA complex solution with added Ca(OH)2 and FeCl3 soilds for 2 hours with pH adjusted to 10.0–10.5. The results indicated that the recovery of Pb was far from com-pletion (i.e., 7–50%) when neither or only one of the precipitants was added. However, the recovery was nigh complete when both precipitants were added. The enhanced sep-aration of Pb was attributed to Ca2+ cation competing with Pb2+ for EDTA and the sub-sequent coagulation/co-precipitation of oxyhyroxides of Fe3+ and Pb2+, resulting in thesignificant removal of Pb from the solution and the Ca-EDTA complex remaining in the solution.
Based on the data presented in Table 4, the appropriate amounts of addition for the effective recovery of Pb (>97%) appeared to be 60–100mg/L of Ca(OH)2 and200–600mg/L of FeCl3 for the tested conditions. In the interest of generating a lesseramount of sludge to be further handled, the addition of 100ppm of Ca(OH)2(s) together with 200ppm of FeCl3(s) would be appropriate for the tested Pb loading in the solution. On the mole basis, this translates to be approximately 2 times excess of Ca2+ over Pb2+,whereas the amount of excess FeCl3 is secondary because its major role appears to be in the coprecipitation of lead and iron oxyhydroxide.
The separation of metals from their EDTA complexes was also studied by adding various amounts of anionic precipitant sulfide, phosphate, or carbonate, respectively, to
Chelating Agents for Extraction of Heavy Metals from Soil 17
Table 4. Separation of lead from EDTA as a function of Ca and Fe dosages. Conditions were Initial: pH0 < 2.0,
[Pb]0 = 300ppm, [EDTA] = 1 mM. At separation: pH = 10.0-10.5, time = 2hrs
Measured amounts of metals remaining Solid Added in solution
Ca(OH)2 FeCl3 Pb Ca Fe PbRecovery*
0 0 280 0.3 <1 6.70 0 600 143 8.8 1.1 52.3
100 0 150 450 <1 50.0 100 200 8.7 390 <1 97.0 100 300 4 385 <1 98.7 100 400 3.2 360 <1 98.9 100 500 0.95 340 <1 99.8 100 600 0.95 300 <1 99.8 100 700 0.6 290 <1 99.8 19 600 29 27 1.2 90.3 37 600 14 39 0.2 95.3 56 600 6 120 0.2 98.0 74 600 6 184 0.1 98.0 93 600 2.8 212 0.1 99.1
110 600 2.3 404 0.3 99.2 150 600 1.3 0.1 99.6 190 600 2 — 0.2 99.3 240 600 2.8 1.3 99.1 300 600 3 0.4 99.0 350 600 2.3 — 0.6 99.2 410 600 1.3 — 0.2 99.6 *Calculation based on decrease of Pb concentration in solution from an initial level of 300ppm. ó Not measured.
(mg/L) (mg/L) (mg/L) (mg/L) (mg/L) (%)
ó
ó
ó
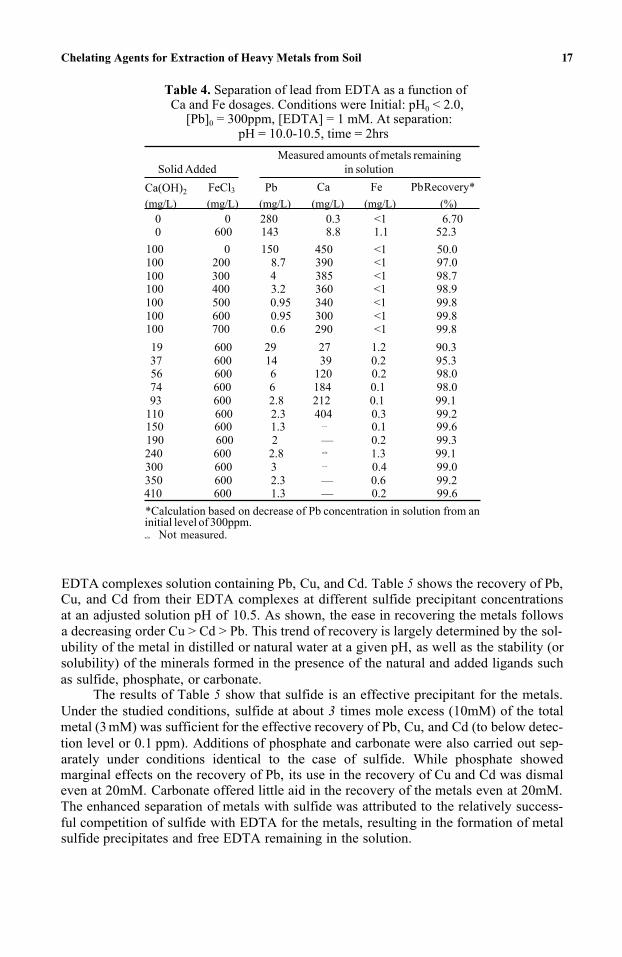
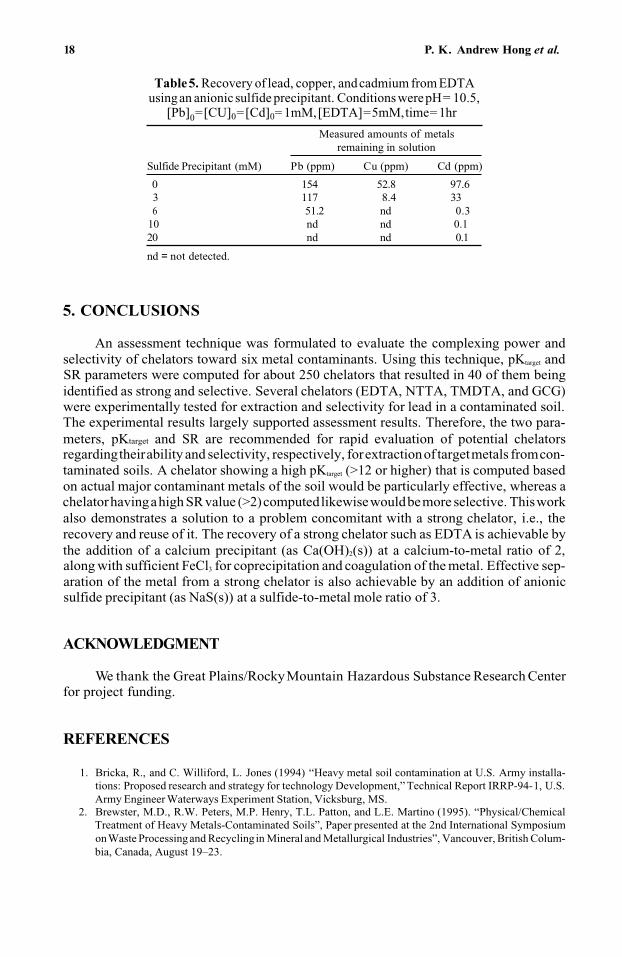
EDTA complexes solution containing Pb, Cu, and Cd. Table 5 shows the recovery of Pb, Cu, and Cd from their EDTA complexes at different sulfide precipitant concentrations at an adjusted solution pH of 10.5. As shown, the ease in recovering the metals followsa decreasing order Cu > Cd > Pb. This trend of recovery is largely determined by the sol-ubility of the metal in distilled or natural water at a given pH, as well as the stability (or solubility) of the minerals formed in the presence of the natural and added ligands such as sulfide, phosphate, or carbonate.
The results of Table 5 show that sulfide is an effective precipitant for the metals. Under the studied conditions, sulfide at about 3 times mole excess (10mM) of the total metal (3 mM) was sufficient for the effective recovery of Pb, Cu, and Cd (to below detec-tion level or 0.1 ppm). Additions of phosphate and carbonate were also carried out sep-arately under conditions identical to the case of sulfide. While phosphate showed marginal effects on the recovery of Pb, its use in the recovery of Cu and Cd was dismal even at 20mM. Carbonate offered little aid in the recovery of the metals even at 20mM. The enhanced separation of metals with sulfide was attributed to the relatively success-ful competition of sulfide with EDTA for the metals, resulting in the formation of metal sulfide precipitates and free EDTA remaining in the solution.
18 P. K. Andrew Hong et al.
Table5. Recovery of lead, copper, andcadmium from EDTAusingan anionic sulfide precipitant. ConditionswerepH= 10.5,
[Pb]0=[CU]0=[Cd]0= 1mM,[EDTA]=5mM,time= 1hr
Measured amounts of metalsremaining in solution
Sulfide Precipitant (mM) Pb (ppm) Cu (ppm) Cd (ppm)
0 154 52.8 97.63 117 8.4 336 51.2 nd 0.3
10 nd nd 0.120 nd nd 0.1
nd = not detected.
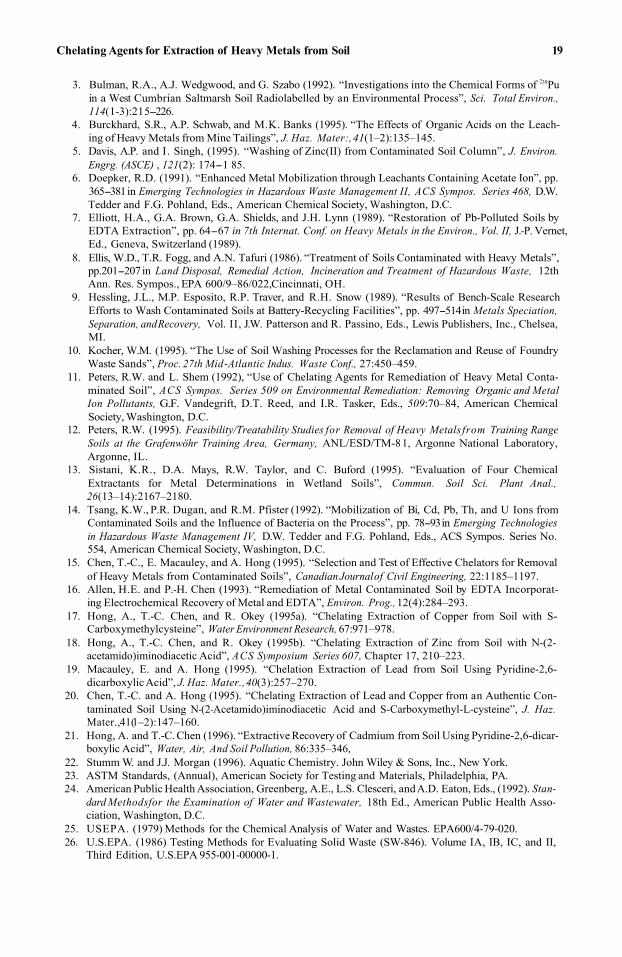
5. CONCLUSIONS
An assessment technique was formulated to evaluate the complexing power and selectivity of chelators toward six metal contaminants. Using this technique, pKtarget andSR parameters were computed for about 250 chelators that resulted in 40 of them being identified as strong and selective. Several chelators (EDTA, NTTA, TMDTA, and GCG)were experimentally tested for extraction and selectivity for lead in a contaminated soil. The experimental results largely supported assessment results. Therefore, the two para-meters, pKtarget and SR are recommended for rapid evaluation of potential chelators regarding their ability and selectivity, respectively, for extraction of target metals from con-taminated soils. A chelator showing a high pKtarget (>12 or higher) that is computed based on actual major contaminant metals of the soil would be particularly effective, whereas achelator having a high SR value (>2)computed likewise would be more selective. This work also demonstrates a solution to a problem concomitant with a strong chelator, i.e., the recovery and reuse of it. The recovery of a strong chelator such as EDTA is achievable by the addition of a calcium precipitant (as Ca(OH)2(s)) at a calcium-to-metal ratio of 2,along with sufficient FeCl3 for coprecipitation and coagulation of the metal. Effective sep-aration of the metal from a strong chelator is also achievable by an addition of anionic sulfide precipitant (as NaS(s)) at a sulfide-to-metal mole ratio of 3.
ACKNOWLEDGMENT
We thank the Great Plains/RockyMountain Hazardous Substance Research Center for project funding.
REFERENCES
1. Bricka, R., and C. Williford, L. Jones (1994) “Heavy metal soil contamination at U.S. Army installa-tions: Proposed research and strategy for technology Development,” Technical Report IRRP-94-1, U.S. Army Engineer Waterways Experiment Station, Vicksburg, MS.
2. Brewster, M.D., R.W. Peters, M.P. Henry, T.L. Patton, and L.E. Martino (1995). “Physical/Chemical Treatment of Heavy Metals-Contaminated Soils”, Paper presented at the 2nd International Symposium on Waste Processing and Recycling in Mineral and Metallurgical Industries”, Vancouver, British Colum-bia, Canada, August 19–23.
Chelating Agents for Extraction of Heavy Metals from Soil 19
3. Bulman, R.A., A.J. Wedgwood, and G. Szabo (1992). “Investigations into the Chemical Forms of 239Puin a West Cumbrian Saltmarsh Soil Radiolabelled by an Environmental Process”, Sci. Total Environ.,114(1-3):215-226.
4. Burckhard, S.R., A.P. Schwab, and M.K. Banks (1995). “The Effects of Organic Acids on the Leach-ing of Heavy Metals from Mine Tailings”, J. Haz. Mater:,41(1–2):135–145.
5. Davis, A.P. and I. Singh, (1995). “Washing of Zinc(II) from Contaminated Soil Column”, J. Environ.Engrg. (ASCE) , 121(2): 174-1 85.
6. Doepker, R.D. (1991). “Enhanced Metal Mobilization through Leachants Containing Acetate Ion”, pp. 365-381in Emerging Technologies in Hazardous Waste Management II, ACS Sympos. Series 468, D.W.Tedder and F.G. Pohland, Eds., American Chemical Society, Washington, D.C.
7. Elliott, H.A., G.A. Brown, G.A. Shields, and J.H. Lynn (1989). “Restoration of Pb-Polluted Soils byEDTA Extraction”, pp. 64-67 in 7th Internat. Conf. on Heavy Metals in the Environ., Vol. II, J.-P. Vernet,Ed., Geneva, Switzerland (1989).
8. Ellis, W.D., T.R. Fogg, and A.N. Tafuri (1986). “Treatment of Soils Contaminated with Heavy Metals”,pp.201-207in Land Disposal, Remedial Action, Incineration and Treatment of Hazardous Waste, 12thAnn. Res. Sympos., EPA 600/9–86/022, Cincinnati, OH.
9. Hessling, J.L., M.P. Esposito, R.P. Traver, and R.H. Snow (1989). “Results of Bench-Scale ResearchEfforts to Wash Contaminated Soils at Battery-Recycling Facilities”, pp. 497-514 in Metals Speciation,Separation, and Recovery, Vol. II, J.W. Patterson and R. Passino, Eds., Lewis Publishers, Inc., Chelsea, MI.
10. Kocher, W.M. (1995). “The Use of Soil Washing Processes for the Reclamation and Reuse of FoundryWaste Sands”, Proc. 27th Mid-Atlantic Indus. Waste Conf., 27:450–459.
11. Peters, R.W. and L. Shem (1992), “Use of Chelating Agents for Remediation of Heavy Metal Conta-minated Soil”, ACS Sympos. Series 509 on Environmental Remediation: Removing Organic and MetalIon Pollutants, G.F. Vandegrift, D.T. Reed, and I.R. Tasker, Eds., 509:70–84, American ChemicalSociety, Washington, D.C.
12. Peters, R.W. (1995). Feasibility/Treatability Studies for Removal of Heavy Metals from Training Range Soils at the Grafenwöhr Training Area, Germany, ANL/ESD/TM-81, Argonne National Laboratory,Argonne, IL.
13. Sistani, K.R., D.A. Mays, R.W. Taylor, and C. Buford (1995). “Evaluation of Four Chemical Extractants for Metal Determinations in Wetland Soils”, Commun. Soil Sci. Plant Anal.,26(13–14):2167–2180.
14. Tsang, K.W., P.R. Dugan, and R.M. Pfister (1992). “Mobilization of Bi, Cd, Pb, Th, and U Ions fromContaminated Soils and the Influence of Bacteria on the Process”, pp. 78-93in Emerging Technologies in Hazardous Waste Management IV, D.W. Tedder and F.G. Pohland, Eds., ACS Sympos. Series No.554, American Chemical Society, Washington, D.C.
15. Chen, T.-C., E. Macauley, and A. Hong (1995). “Selection and Test of Effective Chelators for Removalof Heavy Metals from Contaminated Soils”, Canadian Journal of Civil Engineering, 22:1185–1197.
16. Allen, H.E. and P.-H. Chen (1993). “Remediation of Metal Contaminated Soil by EDTA Incorporat-ing Electrochemical Recovery of Metal and EDTA”, Environ. Prog., 12(4):284–293.
17. Hong, A., T.-C. Chen, and R. Okey (1995a). “Chelating Extraction of Copper from Soil with S-Carboxymethylcysteine”, Water Environment Research, 67:971–978.
18. Hong, A., T.-C. Chen, and R. Okey (1995b). “Chelating Extraction of Zinc from Soil with N-(2-acetamido)iminodiacetic Acid”, ACS Symposium Series 607, Chapter 17, 210–223.
19. Macauley, E. and A. Hong (1995). “Chelation Extraction of Lead from Soil Using Pyridine-2,6-dicarboxylicAcid”, J. Haz. Mater.,40(3):257–270.
20. Chen, T.-C. and A. Hong (1995). “Chelating Extraction of Lead and Copper from an Authentic Con-taminated Soil Using N-(2-Acetamido)iminodiacetic Acid and S-Carboxymethyl-L-cysteine”, J. Haz.Mater.,41(1–2):147–160.
21. Hong, A. and T.-C. Chen (1996). “Extractive Recovery of Cadmium from Soil Using Pyridine-2,6-dicar-boxylic Acid”, Water, Air, And Soil Pollution, 86:335–346,
22. Stumm W. and J.J. Morgan (1996). Aquatic Chemistry. John Wiley & Sons, Inc., New York.23. ASTM Standards, (Annual), American Society for Testing and Materials, Philadelphia, PA.24. American Public Health Association, Greenberg, A.E., L.S. Clesceri, and A.D. Eaton, Eds., (1992). Stan-
dard Methodsfor the Examination of Water and Wastewater, 18th Ed., American Public Health Asso-ciation, Washington, D.C.
25. USEPA. (1979) Methods for the Chemical Analysis of Water and Wastes. EPA600/4-79-020.26. U.S.EPA. (1986) Testing Methods for Evaluating Solid Waste (SW-846). Volume IA, IB, IC, and II,
Third Edition, U.S.EPA 955-001-00000-1.
20 P. K.Andrew Hong et al.
27. Smith, R.E. and A.E. Martell, Critical Stability Constants. Vol. 1, Vol. 4, 5 , and 6, New York: PlenumPress, 1974, 1976, 1982, 1989.
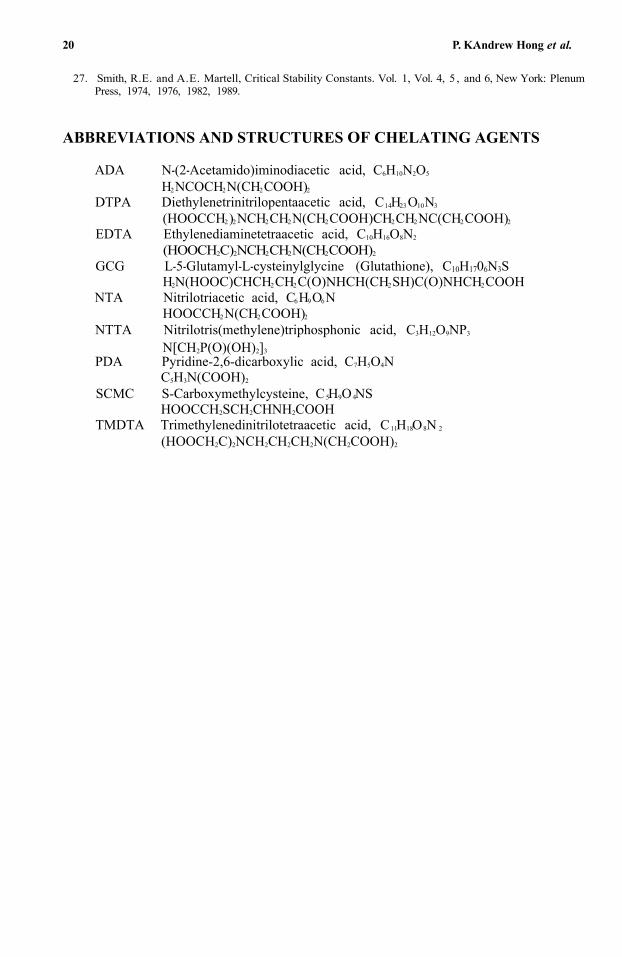
ABBREVIATIONS AND STRUCTURES OF CHELATING AGENTS
ADA N-(2-Acetamido)iminodiacetic acid, C6H10N2O5
DTPA Diethylenetrinitrilopentaacetic acid, C14H23 O10N3
EDTA Ethylenediaminetetraacetic acid, C10H16O8N2
GCG L-5-Glutamyl-L-cysteinylglycine (Glutathione), C10H1706N3S
NTA Nitrilotriacetic acid, C6H9O6N
NTTA Nitrilotris(methylene)triphosphonic acid, C3H12O9NP3
PDA Pyridine-2,6-dicarboxylic acid, C7H5O4N
SCMC S-Carboxymethylcysteine, C5H9O4NS
TMDTA Trimethylenedinitrilotetraacetic acid, C11H18O8N 2
H2NCOCH2N(CH2COOH)2
(HOOCCH2)2NCH2CH2N(CH2COOH)CH2CH2NC(CH2COOH)2
(HOOCH2C)2NCH2CH2N(CH2COOH)2
H2N(HOOC)CHCH2CH2C(O)NHCH(CH2SH)C(O)NHCH2COOH
HOOCCH2N(CH2COOH)2
N[CH2P(O)(OH)2]3
C5H3N(COOH)2
HOOCCH2SCH2CHNH2COOH
(HOOCH2C)2NCH2CH2CH2N(CH2COOH)2
3
ELECTROKINETIC SOIL REMEDIATION USINGNOVEL ELECTRODES AND MODULATEDREVERSE ELECTRIC FIELDS
Maria E. Inman, E. Jennings Taylor, Debbra L. Myers,and Chengdong Zhou
Faraday Technology, Inc.315 Huls Drive, ClaytonOhio 45315
1. ABSTRACT
Soil contamination is a widespread problem in the United States with more than4,500 sites currently on the EPA's national priorities list for clean up. The remediation ofheavy metal contamination is particularly urgent due to the high levels of contaminationand toxicity. This paper describes the investigation into a novel, two-fold approach toelectrokinetic remediation of soils contaminated with heavy metals. Modulated reverseelectric fields, in conjunction with integrated ion exchange (IIXTM) electrodes, are beingused to (a) induce a more uniform and enhanced remediation of heavy metal contami-nated soils, and (b) eliminate the non-uniform pH profile encountered in conventionalelectrokinetics, by acidification of the soil surrounding the cathode. Concentration of theheavy metal contaminants from the soil into the IIXTM electrode eliminates the need forsoil excavation and further treatment. The heavy metals absorbed into the IIXTM elec-trodes can be recovered, resulting in regeneration of the electrodes, which can then bereused in the soil treatment process.
2. BACKGROUND
The main contaminants in Superfund sites are heavy metal cations, organics andinorganic complexing agents or anions. The remediation of the heavy metal ion conta-mination is particularly urgent due to their high levels of contamination and their toxi-city. Cleanup has typically been achieved by soil excavation followed by incineration orchemical treatment of the soil. However, this process is extremely costly; it has been esti-mated to cost $2,400/yd3 for cleanup by soil excavation.' In-situ soil remediation tech-niques are therefore gaining ground as desired technologies for Superfund site cleanup.
Current address: Mitisubishi Silicon America, South Campus, 3990 Fairview Industrial Dr. SE, Salem, OR97302Emerging Technologies in Hazardous Waste Management 8, edited byTedder and PohlandKluwer Academic / Plenum Publishers, New York, 2000. 21
22 M. E. Inman et al
In electrokinetic soil remediation, a current or voltage is applied between two elec-trodes buried in the soil, and the ionic contaminants are driven towards the electrodesunder the influence of the electric field, resulting in localization of the contaminants.2,3
This localization of both anionic and cationic metal contaminants around the anode andcathode, respectively, means less soil to excavate, thereby significantly reducing the costsassociated with soil removal. Additionally, the only species introduced into the soil duringtreatment are non-hazardous protons and hydroxyl ions. One of the technical barriers tocommercial implementation of electrokinetics is due to the side reactions of water elec-trolysis at the electrodes, under the influence of the applied electric field, which result ingeneration of hydroxyl ions at the cathode:
4H2O + 4e- 4OH- + 2H2 (1)
and protons at the anode:
2H2O 4H+ + O2 + 4e- (2)
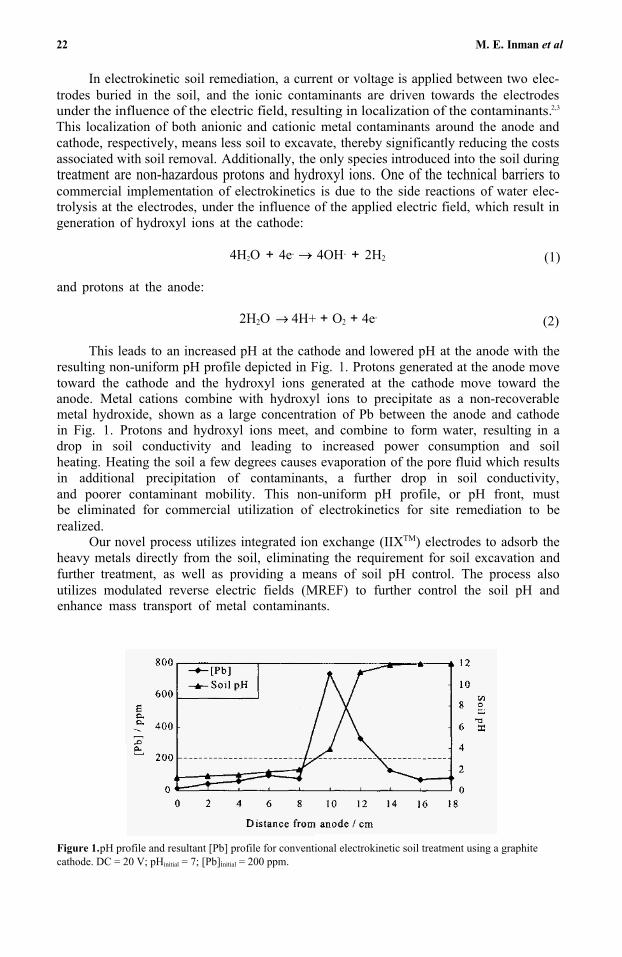
This leads to an increased pH at the cathode and lowered pH at the anode with theresulting non-uniform pH profile depicted in Fig. 1. Protons generated at the anode movetoward the cathode and the hydroxyl ions generated at the cathode move toward theanode. Metal cations combine with hydroxyl ions to precipitate as a non-recoverablemetal hydroxide, shown as a large concentration of Pb between the anode and cathodein Fig. 1. Protons and hydroxyl ions meet, and combine to form water, resulting in adrop in soil conductivity and leading to increased power consumption and soilheating. Heating the soil a few degrees causes evaporation of the pore fluid which resultsin additional precipitation of contaminants, a further drop in soil conductivity,and poorer contaminant mobility. This non-uniform pH profile, or pH front, mustbe eliminated for commercial utilization of electrokinetics for site remediation to berealized.
Our novel process utilizes integrated ion exchange (IIXTM) electrodes to adsorb theheavy metals directly from the soil, eliminating the requirement for soil excavation andfurther treatment, as well as providing a means of soil pH control. The process alsoutilizes modulated reverse electric fields (MREF) to further control the soil pH andenhance mass transport of metal contaminants.
Figure 1. pH profile and resultant [Pb] profile for conventional electrokinetic soil treatment using a graphite cathode. DC = 20 V; pHinitial = 7; [Pb]initial = 200 ppm.
Electrokinetic Soil Remediation Using Novel Electrodes and Modulated Reverse Electric Fields 23
3. TECHNICAL APPROACH
3.1. Integrated Ion Exchange (IIXTM) Cathodes
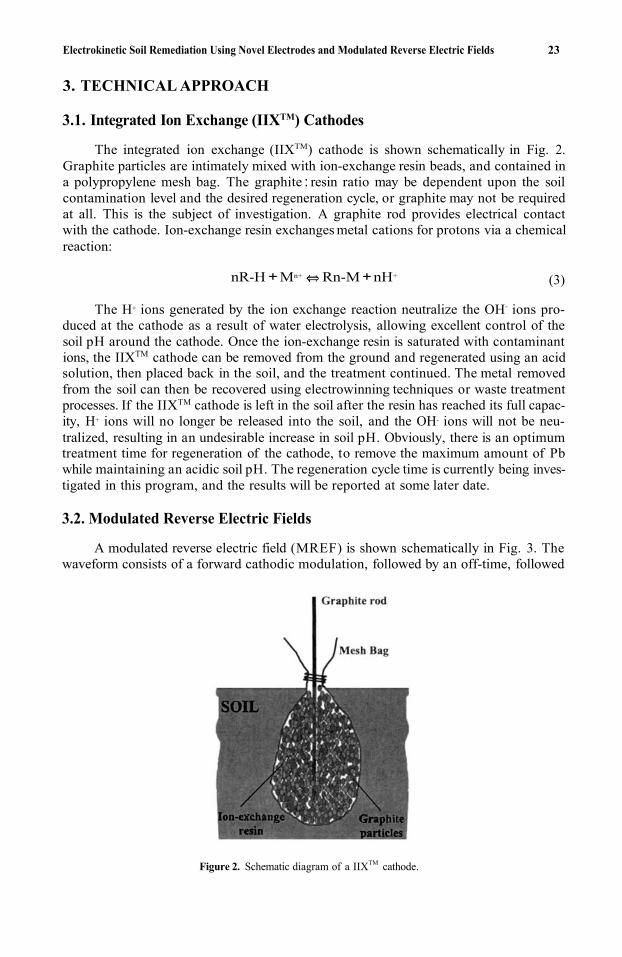
The integrated ion exchange (IIXTM) cathode is shown schematically in Fig. 2.Graphite particles are intimately mixed with ion-exchange resin beads, and contained ina polypropylene mesh bag. The graphite : resin ratio may be dependent upon the soilcontamination level and the desired regeneration cycle, or graphite may not be requiredat all. This is the subject of investigation. A graphite rod provides electrical contactwith the cathode. Ion-exchange resin exchanges metal cations for protons via a chemicalreaction:
nR-H + Mn+ Rn-M +nH+ (3)
The H+ ions generated by the ion exchange reaction neutralize the OH- ions pro-
duced at the cathode as a result of water electrolysis, allowing excellent control of thesoil pH around the cathode. Once the ion-exchange resin is saturated with contaminantions, the IIXTM cathode can be removed from the ground and regenerated using an acidsolution, then placed back in the soil, and the treatment continued. The metal removedfrom the soil can then be recovered using electrowinning techniques or waste treatmentprocesses. If the IIXTM cathode is left in the soil after the resin has reached its full capac-ity, H+ ions will no longer be released into the soil, and the OH- ions will not be neu-tralized, resulting in an undesirable increase in soil pH. Obviously, there is an optimumtreatment time for regeneration of the cathode, to remove the maximum amount of Pbwhile maintaining an acidic soil pH. The regeneration cycle time is currently being inves-tigated in this program, and the results will be reported at some later date.
3.2. Modulated Reverse Electric Fields
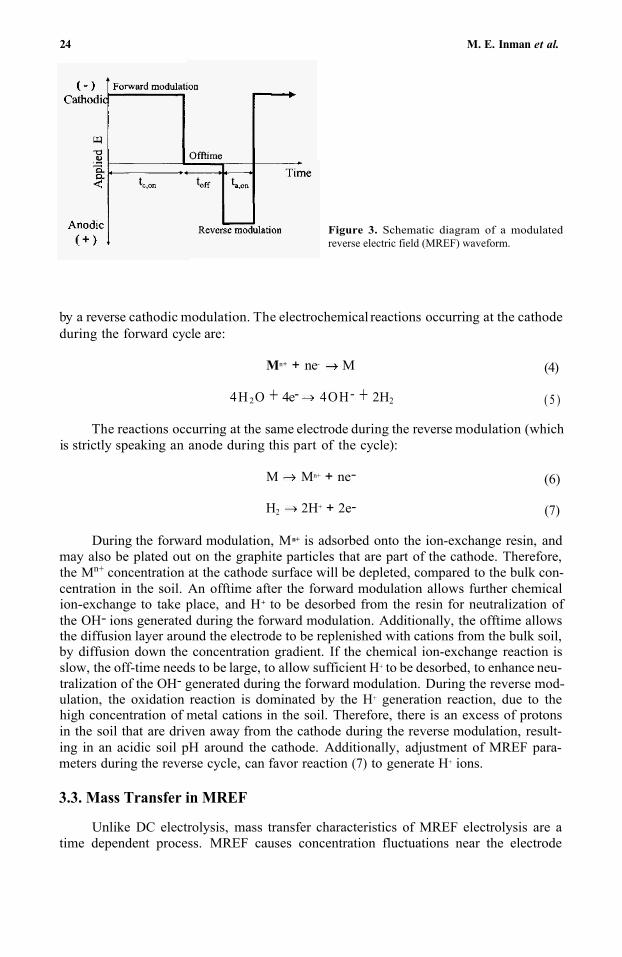
A modulated reverse electric field (MREF) is shown schematically in Fig. 3. Thewaveform consists of a forward cathodic modulation, followed by an off-time, followed
Figure 2. Schematic diagram of a IIXTM cathode.
24 M. E. Inman et al.
Figure 3. Schematic diagram of a modulatedreverse electric field (MREF) waveform.
by a reverse cathodic modulation. The electrochemical reactions occurring at the cathode during the forward cycle are:
Mn+ + ne- M
4H 2O + 4e- 4OH- + 2H2
(4)
( 5 )
The reactions occurring at the same electrode during the reverse modulation (whichis strictly speaking an anode during this part of the cycle):
M Mn+ + ne-
H2 2H+ + 2e-
(6)
(7)
During the forward modulation, Mn+ is adsorbed onto the ion-exchange resin, andmay also be plated out on the graphite particles that are part of the cathode. Therefore, the Mn+ concentration at the cathode surface will be depleted, compared to the bulk con-centration in the soil. An offtime after the forward modulation allows further chemical ion-exchange to take place, and H+ to be desorbed from the resin for neutralization ofthe OH- ions generated during the forward modulation. Additionally, the offtime allowsthe diffusion layer around the electrode to be replenished with cations from the bulk soil, by diffusion down the concentration gradient. If the chemical ion-exchange reaction is slow, the off-time needs to be large, to allow sufficient H+ to be desorbed, to enhance neu-tralization of the OH- generated during the forward modulation. During the reverse mod-ulation, the oxidation reaction is dominated by the H+ generation reaction, due to the high concentration of metal cations in the soil. Therefore, there is an excess of protonsin the soil that are driven away from the cathode during the reverse modulation, result-ing in an acidic soil pH around the cathode. Additionally, adjustment of MREF para-meters during the reverse cycle, can favor reaction (7) to generate H+ ions.
3.3. Mass Transfer in MREF
Unlike DC electrolysis, mass transfer characteristics of MREF electrolysis are a time dependent process. MREF causes concentration fluctuations near the electrode
Electrokinetic Soil Remediation Using Novel Electrodes and Modulated Reverse Electric Fields
surface to reduce the effective Nernst diffusion layer thickness. Consequently, very high instantaneous limiting current densities can be obtained with MREF electrolysis as com-pared to DC electrolysis. Modeling work by Chin4 has indicated that limiting current den-sities obtained under the pulse reverse current (PRC) conditions of low duty cycle and high frequency, can be two to three orders of magnitude greater than the DC limiting current density. Vilambi and Chin5,6 confirmed the earlier modeling work with experi-mental studies for a copper sulfate bath for selected pulse periods and duty cycles in PRC electrolysis, reporting diffusion controlled current densities as high as several hundred A/cm2, while the corresponding values for DC electrolysis were less than 1 A/cm2. There-fore, electrokinetics utilizing MREF can produce enhanced movement of ionic species through the soil, as compared to the DC process.
25
4. EXPERIMENTAL PROCEDURE
The soil remediation experiments were performed in rectangular Plexiglas cells measuring 20cm × 2cm × 4cm. White quartz sand (Aldrich Chemicals, Wisconsin)was used to simulate soil. The sand was contaminated with 200ppm Pb, from a 1 ,0 15 ppmPb AA standard solution in 1 wt% HNO3 (Aldrich Chemicals, Wisconsin). The sand pH was adjusted to 7 using 1.01 M NaOH solution (Aldrich Chemicals, Wisconsin). Bromothymol Blue was added to the sand to show color changes with changes in sand pH over the course of the experiment. The initial sand moisture content was approximately 20wt%. The anode and cathode were placed approximately 1 cmfrom opposite ends of the cell. The contaminated sand was packed firmly into each cell, and covered with parafilm to limit evaporation. The cells were hooked up in parallel to either the DC or pulse reverse rectifier for treatment. At the completion of the experiments, the sand in each cell was divided up into 10 lots, spaced evenly along the length of the cell, and analyzed for the pH, moisture content, and Pb concentration.
The IIXTM cathode was constructed from graphite particles and WACMPHion exchange resin, at a weight ratio of 1 :2. The WACMPH ion exchange resin (ResinTech Inc., Cherry Hill, New Jersey) was chosen from a variety of ion exchangeresins, for the near neutral pH sand conditions and the Pb contaminant used in testing. This is a significant advantage of this technology, in that the cathode makeup can be chosen for the sand pH and the specific contaminants in the ground to maximize performance.
Testing was performed under both DC conditions, at 20V, and using modulated reverse electric field conditions. The MREF parameters were:
Forward duty cycle, Df = 50%Forward peak voltage, Vf = 35 VReverse duty cycle, Dr = 10%Reverse peak voltage, Vr = 25VFrequency = 100HzAverage voltage = DfVf – DrVr = 15V
Please note that although the peak forward and reverse voltages used in the MREFwaveform are higher than the DC voltage, the average MREF voltage is less than that of the DC case.
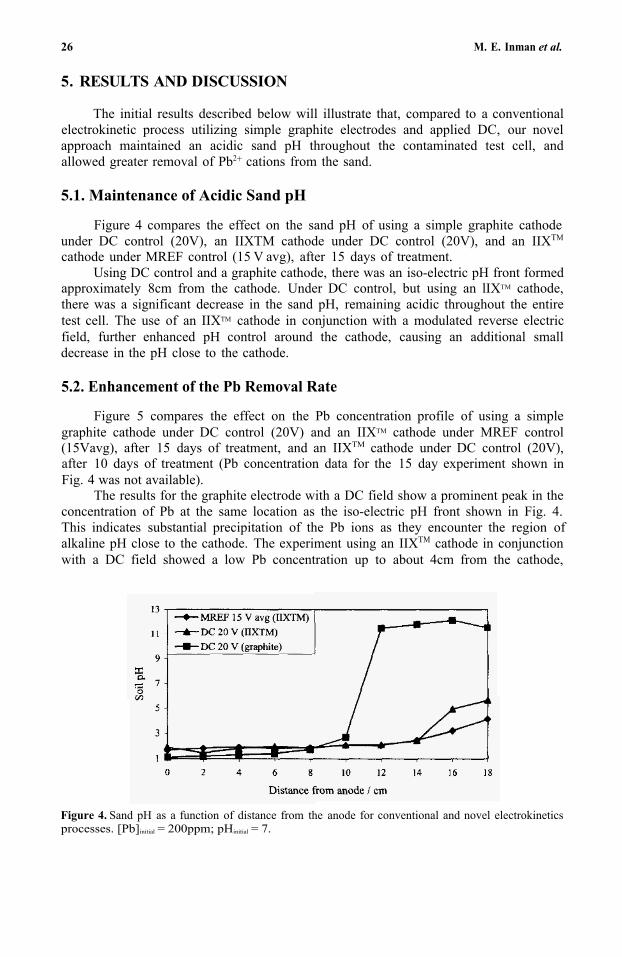
26 M. E. Inman et al.
5. RESULTS AND DISCUSSION
The initial results described below will illustrate that, compared to a conventional electrokinetic process utilizing simple graphite electrodes and applied DC, our novel approach maintained an acidic sand pH throughout the contaminated test cell, and allowed greater removal of Pb2+ cations from the sand.
5.1. Maintenance of Acidic Sand pH
Figure 4 compares the effect on the sand pH of using a simple graphite cathodeunder DC control (20V), an IIXTM cathode under DC control (20V), and an IIXTM
cathode under MREF control (15 V avg), after 15 days of treatment. Using DC control and a graphite cathode, there was an iso-electric pH front formed
approximately 8cm from the cathode. Under DC control, but using an lIXTM cathode,there was a significant decrease in the sand pH, remaining acidic throughout the entire test cell. The use of an IIXTM cathode in conjunction with a modulated reverse electric field, further enhanced pH control around the cathode, causing an additional small decrease in the pH close to the cathode.
5.2. Enhancement of the Pb Removal Rate
Figure 5 compares the effect on the Pb concentration profile of using a simple graphite cathode under DC control (20V) and an IIXTM cathode under MREF control(15Vavg), after 15 days of treatment, and an IIXTM cathode under DC control (20V), after 10 days of treatment (Pb concentration data for the 15 day experiment shown in Fig. 4 was not available).
The results for the graphite electrode with a DC field show a prominent peak in the concentration of Pb at the same location as the iso-electric pH front shown in Fig. 4. This indicates substantial precipitation of the Pb ions as they encounter the region of alkaline pH close to the cathode. The experiment using an IIXTM cathode in conjunction with a DC field showed a low Pb concentration up to about 4cm from the cathode,
Figure 4. Sand pH as a function of distance from the anode for conventional and novel electrokineticsprocesses. [Pb]initial = 200ppm; pHinitial = 7.
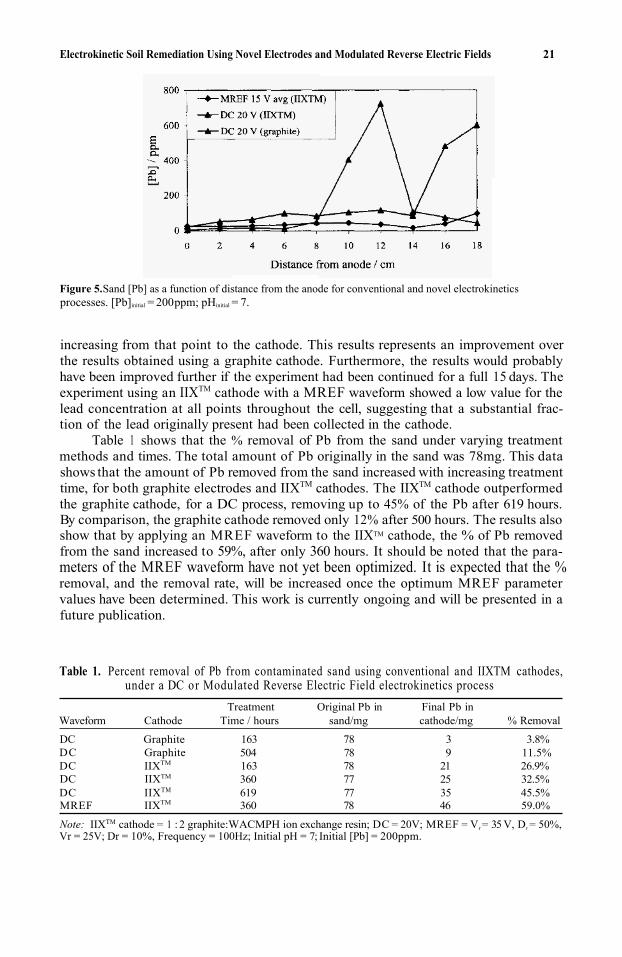
Electrokinetic Soil Remediation Using Novel Electrodes and Modulated Reverse Electric Fields 21
Figure 5. Sand [Pb] as a function of distance from the anode for conventional and novel electrokinetics processes. [Pb]initial = 200 ppm; pHinitial = 7.
increasing from that point to the cathode. This results represents an improvement overthe results obtained using a graphite cathode. Furthermore, the results would probablyhave been improved further if the experiment had been continued for a full 15 days. Theexperiment using an IIXTM cathode with a MREF waveform showed a low value for the lead concentration at all points throughout the cell, suggesting that a substantial frac-tion of the lead originally present had been collected in the cathode.
Table 1 shows that the % removal of Pb from the sand under varying treatmentmethods and times. The total amount of Pb originally in the sand was 78mg. This datashows that the amount of Pb removed from the sand increased with increasing treatmenttime, for both graphite electrodes and IIXTM cathodes. The IIXTM cathode outperformed the graphite cathode, for a DC process, removing up to 45% of the Pb after 619 hours.By comparison, the graphite cathode removed only 12% after 500 hours. The results also show that by applying an MREF waveform to the IIXTM cathode, the % of Pb removedfrom the sand increased to 59%, after only 360 hours. It should be noted that the para-meters of the MREF waveform have not yet been optimized. It is expected that the %removal, and the removal rate, will be increased once the optimum MREF parametervalues have been determined. This work is currently ongoing and will be presented in afuture publication.
Table 1. Percent removal of Pb from contaminated sand using conventional and IIXTM cathodes,under a DC or Modulated Reverse Electric Field electrokinetics process
Treatment Original Pb in Final Pb inWaveform Cathode Time / hours sand/mg cathode/mg % Removal
DC Graphite 163 78 3 3.8%DC Graphite 504 78 9 11.5%DC IIXTM 163 78 21 26.9%DC IIXTM 360 77 25 32.5%DC IIXTM 619 77 35 45.5%
Note: IIXTM cathode = 1 : 2 graphite:WACMPH ion exchange resin; DC = 20V; MREF = Vf = 35 V, Df = 50%, Vr = 25V; Dr = 10%, Frequency = 100Hz; Initial pH = 7; Initial [Pb] = 200ppm.
MREF IIXTM 360 78 46 59.0%
28 M. E. Inman et al.
6. CONCLUSIONS
The advantages of using IIXTM cathodes and modulated reverse electric fields over
1. Use of modulated reverse electric fields and IIXTM cathodes prevents forma-tion of the pH front by producing H+ ions at the cathode to neutralize the OH-ions resulting from electrolysis reactions.
2. Use of modulated reverse electric fields and IIXTM cathodes allowed acceler-ated in-situ removal of Pb from the sand, as compared to the conventional DCprocess.
3. IIXTM cathodes can be regenerated ex-situ, allowing recovery of heavy metalswithout the need for soil excavation and further treatment.
4. Multiple heavy metal contaminants can be removed from the soilsimultaneously.
5. Selection of the appropriate resin will allow the treatment process to be tai-lored to the metal cations in the contaminant site.
Future work will concentrate on optimization of the MREF waveform, determi-nation of the regeneration time for an IIXTM cathode, and transfer of this technology toactual site testing.
conventional processes are summarized below:
ACKNOWLEDGMENTS
This research was supported by a SBIR Phase II grant from the U.S. Environmen-tal Protection Agency (Contract Number: 68D60051).
REFERENCES
1, Department of Energy (1996), Subsurface Contaminants Focus Area, DOE/EM-0296.2. Acar Y.B. and Alshawabkeh A. (1993), Principles of Electrokinetic Remediation, Environmental Science
and Technology, 27, 13, p. 2638.3. Acar Y.B., Gale R.J., Alshawabkeh A. Marks R.E., Puppla S., Bricka M., and Parker R. (1995),
Electrokinetic Remediation: Basics and Technology Status, Journal of Hazardous Materials, 40, 3, pp.117-137.
4. Chin D.-T. (1983), Mass Transfer and Current-Potential Relations in Pulse Electrolysis, J. Electrochem.SOC., 130, p. 1657.
5. Vilambi N.R.K. and Chin D.-T. (1987), AESF Project 68: Study of Selective Pulse Plating, 74th AESFAnnual Technical Conference Proceedings for Sur/Fin '87, American Electroplaters and SurfaceFinishers Society Meeting, Chicago.
6. Vilambi N.R.K. and Chin D.-T. (1988), SelectivePulse Plating of Copper from an Acid Copper SulfateBath, J. Plating and Surface Finishing, 75, pp. 67-74.
4
ELECTROKINETIC INJECTION OF NUTRIENTSIN LAYERED CLAY/SAND MEDIA FORBIOREMEDIATION APPLICATIONS
M. E Rabbi1, R. J. Gale2,3, E. Oszu-Acar3, G. Breitenbeck4,J. H. Pardue1, A. Jackson1, R. K. Seals1, and D. D. Adrian1
1Department Of Civil and Environmental Engr.Louisiana State UniversityBaton Rouge, Louisiana 70803
2Department Of ChemistryLouisiana State UniversityBaton Rouge, Louisiana 70803
3Electrokinetics Inc.11552 Cedar Park AvenueBaton Rouge, Louisiana 70809
4Department of AgronomyLouisiana Sate University Baton Rouge, Louisiana 70803
1. ABSTRACT
Electrokinetic processing has been used to inject representative cationic and anionicnutrients into soil layers, which have widely different hydraulic and electrical conductiv-ities. In this case, using parallel clay and sand layers and at a practical current density,ammonium ion concentrations reached 300–35x0 mg/L in the sand and 250-300 mg/L inthe clay layer, while the respective values for sulfate ion were 900–1,000mg/L and1,000–1,200mg/L. This demonstrates the potential for bio-electrokinetic enhancement bynutrient injection for those sites which cannot be bioremediated by natural attenuationalone. Although considerable electroosmosis occurred at the neutral pH of the system, the anions could be injected upstream about one meter by 1,028 hours of processing.Both the power consumption costs and the process rates are practicable for the injection of such process additives.
2. INTRODUCTION
In situ biotreatment is an important technology for the remediation of toxic organ-ics encountered in the National Priority List. However, natural attentuation may be inad-equate in many instances since the indigenous microbes, capable of the appropriate
Emerging Technologies in Hazardous Waste Management 8, edited by Tedder and PohlandKluwer Academic/Plenum Publishers, New York, 2000. 29
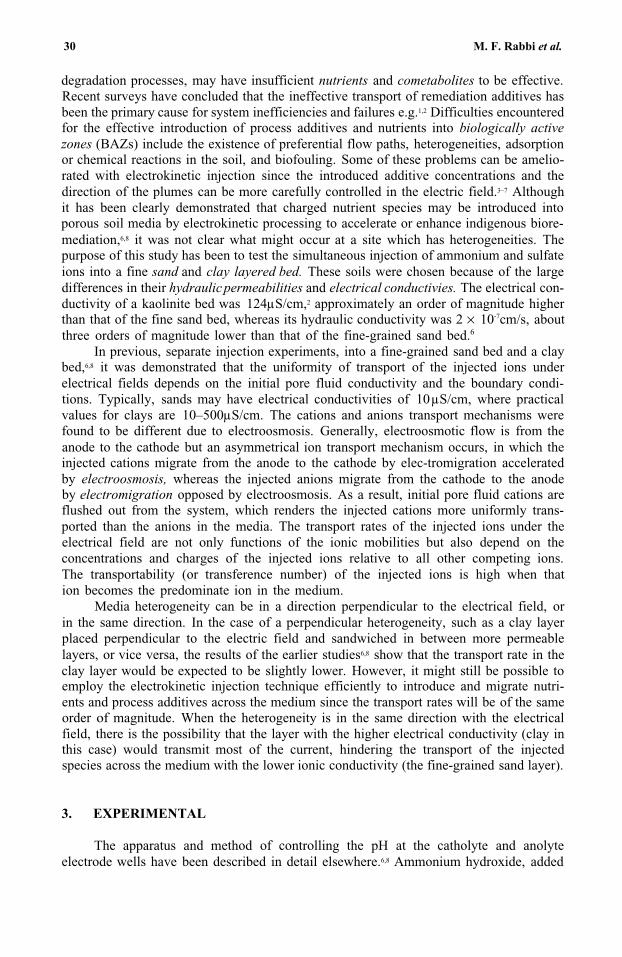
30 M. F. Rabbi et al.
degradation processes, may have insufficient nutrients and cometabolites to be effective. Recent surveys have concluded that the ineffective transport of remediation additives has been the primary cause for system inefficiencies and failures e.g.1,2 Difficulties encountered for the effective introduction of process additives and nutrients into biologically active zones (BAZs) include the existence of preferential flow paths, heterogeneities, adsorption or chemical reactions in the soil, and biofouling. Some of these problems can be amelio-rated with electrokinetic injection since the introduced additive concentrations and the direction of the plumes can be more carefully controlled in the electric field.3–7 Althoughit has been clearly demonstrated that charged nutrient species may be introduced into porous soil media by electrokinetic processing to accelerate or enhance indigenous biore-mediation,6,8 it was not clear what might occur at a site which has heterogeneities. The purpose of this study has been to test the simultaneous injection of ammonium and sulfate ions into a fine sand and clay layered bed. These soils were chosen because of the large differences in their hydraulic permeabilities and electrical conductivies. The electrical con-ductivity of a kaolinite bed was 124µS/cm,2 approximately an order of magnitude higher than that of the fine sand bed, whereas its hydraulic conductivity was 2 × 10⁻⁷cm/s, aboutthree orders of magnitude lower than that of the fine-grained sand bed.6
In previous, separate injection experiments, into a fine-grained sand bed and a clay bed,6,8 it was demonstrated that the uniformity of transport of the injected ions under electrical fields depends on the initial pore fluid conductivity and the boundary condi-tions. Typically, sands may have electrical conductivities of 10 µS/cm, where practical values for clays are 10–500µS/cm. The cations and anions transport mechanisms were found to be different due to electroosmosis. Generally, electroosmotic flow is from the anode to the cathode but an asymmetrical ion transport mechanism occurs, in which the injected cations migrate from the anode to the cathode by elec-tromigration accelerated by electroosmosis, whereas the injected anions migrate from the cathode to the anode by electromigration opposed by electroosmosis. As a result, initial pore fluid cations are flushed out from the system, which renders the injected cations more uniformly trans-ported than the anions in the media. The transport rates of the injected ions under the electrical field are not only functions of the ionic mobilities but also depend on the concentrations and charges of the injected ions relative to all other competing ions. The transportability (or transference number) of the injected ions is high when that ion becomes the predominate ion in the medium.
Media heterogeneity can be in a direction perpendicular to the electrical field, or in the same direction. In the case of a perpendicular heterogeneity, such as a clay layer placed perpendicular to the electric field and sandwiched in between more permeable layers, or vice versa, the results of the earlier studies6,8 show that the transport rate in the clay layer would be expected to be slightly lower. However, it might still be possible to employ the electrokinetic injection technique efficiently to introduce and migrate nutri-ents and process additives across the medium since the transport rates will be of the same order of magnitude. When the heterogeneity is in the same direction with the electrical field, there is the possibility that the layer with the higher electrical conductivity (clay in this case) would transmit most of the current, hindering the transport of the injected species across the medium with the lower ionic conductivity (the fine-grained sand layer).
3. EXPERIMENTAL
The apparatus and method of controlling the pH at the catholyte and anolyte electrode wells have been described in detail elsewhere.6,8 Ammonium hydroxide, added
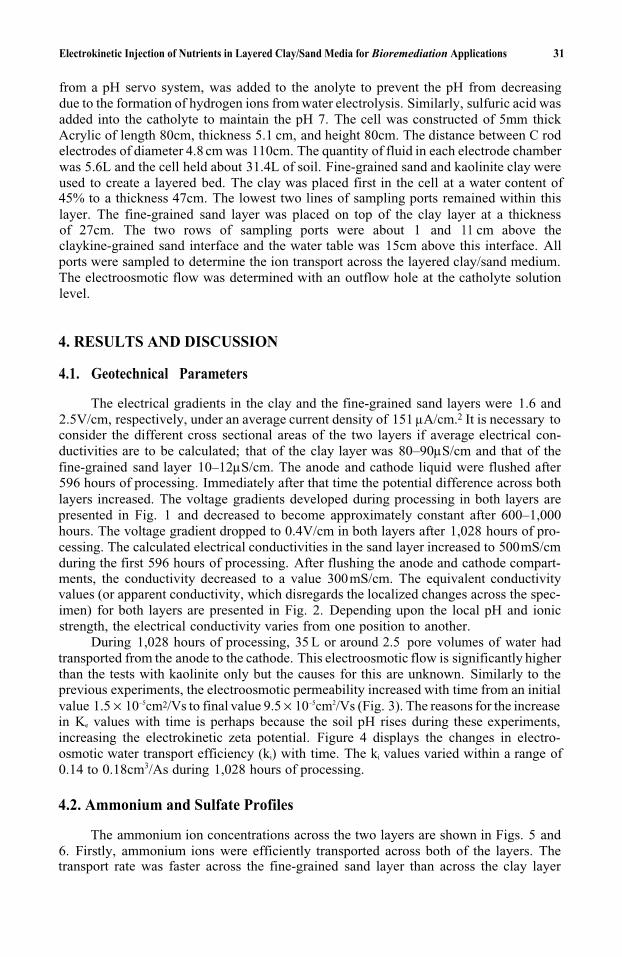
Electrokinetic Injection of Nutrients in Layered Clay/Sand Media for Bioremediation Applications 31
from a pH servo system, was added to the anolyte to prevent the pH from decreasing due to the formation of hydrogen ions from water electrolysis. Similarly, sulfuric acid was added into the catholyte to maintain the pH 7. The cell was constructed of 5mm thickAcrylic of length 80cm, thickness 5.1 cm, and height 80cm. The distance between C rodelectrodes of diameter 4.8 cm was 110cm. The quantity of fluid in each electrode chamber was 5.6L and the cell held about 31.4L of soil. Fine-grained sand and kaolinite clay were used to create a layered bed. The clay was placed first in the cell at a water content of 45% to a thickness 47cm. The lowest two lines of sampling ports remained within this layer. The fine-grained sand layer was placed on top of the clay layer at a thickness of 27cm. The two rows of sampling ports were about 1 and 11 cm above the claykine-grained sand interface and the water table was 15cm above this interface. All ports were sampled to determine the ion transport across the layered clay/sand medium. The electroosmotic flow was determined with an outflow hole at the catholyte solution level.
4. RESULTS AND DISCUSSION
4.1. Geotechnical Parameters
The electrical gradients in the clay and the fine-grained sand layers were 1.6 and 2.5V/cm, respectively, under an average current density of 151 µA/cm.2 It is necessary toconsider the different cross sectional areas of the two layers if average electrical con-ductivities are to be calculated; that of the clay layer was 80–90µS/cm and that of the fine-grained sand layer 10–12µS/cm. The anode and cathode liquid were flushed after 596 hours of processing. Immediately after that time the potential difference across both layers increased. The voltage gradients developed during processing in both layers are presented in Fig. 1 and decreased to become approximately constant after 600–1,000 hours. The voltage gradient dropped to 0.4V/cm in both layers after 1,028 hours of pro-cessing. The calculated electrical conductivities in the sand layer increased to 500mS/cmduring the first 596 hours of processing. After flushing the anode and cathode compart-ments, the conductivity decreased to a value 300mS/cm. The equivalent conductivityvalues (or apparent conductivity, which disregards the localized changes across the spec-imen) for both layers are presented in Fig. 2. Depending upon the local pH and ionic strength, the electrical conductivity varies from one position to another.
During 1,028 hours of processing, 35 L or around 2.5 pore volumes of water hadtransported from the anode to the cathode. This electroosmotic flow is significantly higherthan the tests with kaolinite only but the causes for this are unknown. Similarly to theprevious experiments, the electroosmotic permeability increased with time from an initial value 1.5 × 10⁻⁵cm2/Vs to final value 9.5 × 10⁻⁵cm2/Vs (Fig. 3). The reasons for the increasein Ke values with time is perhaps because the soil pH rises during these experiments, increasing the electrokinetic zeta potential. Figure 4 displays the changes in electro-osmotic water transport efficiency (ki) with time. The ki values varied within a range of 0.14 to 0.18cm3/As during 1,028 hours of processing.
4.2. Ammonium and Sulfate Profiles
The ammonium ion concentrations across the two layers are shown in Figs. 5 and6. Firstly, ammonium ions were efficiently transported across both of the layers. The transport rate was faster across the fine-grained sand layer than across the clay layer
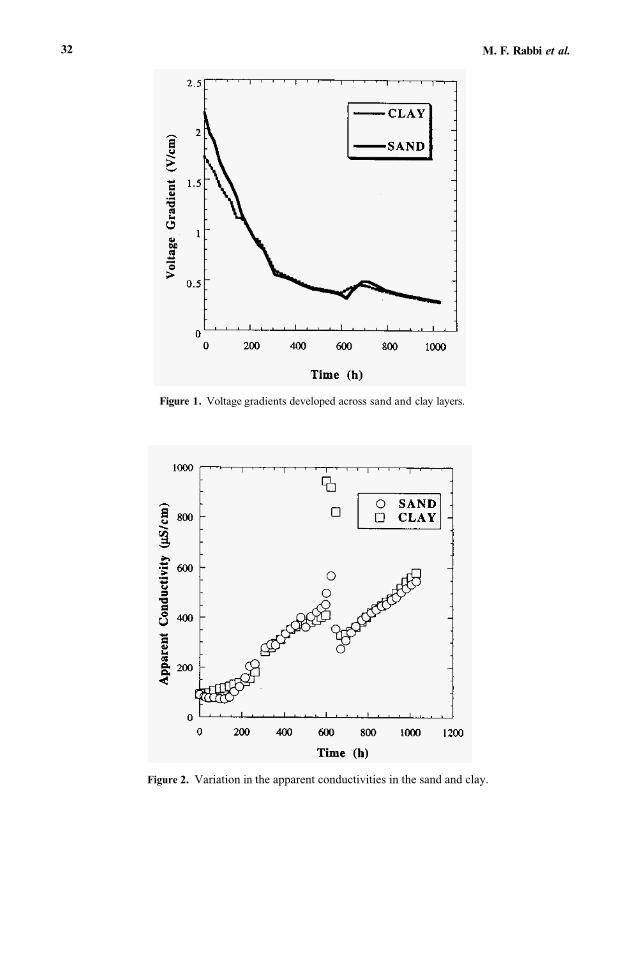
M. F. Rabbi et al.32
Figure 1. Voltage gradients developed across sand and clay layers.
Figure 2. Variation in the apparent conductivities in the sand and clay.
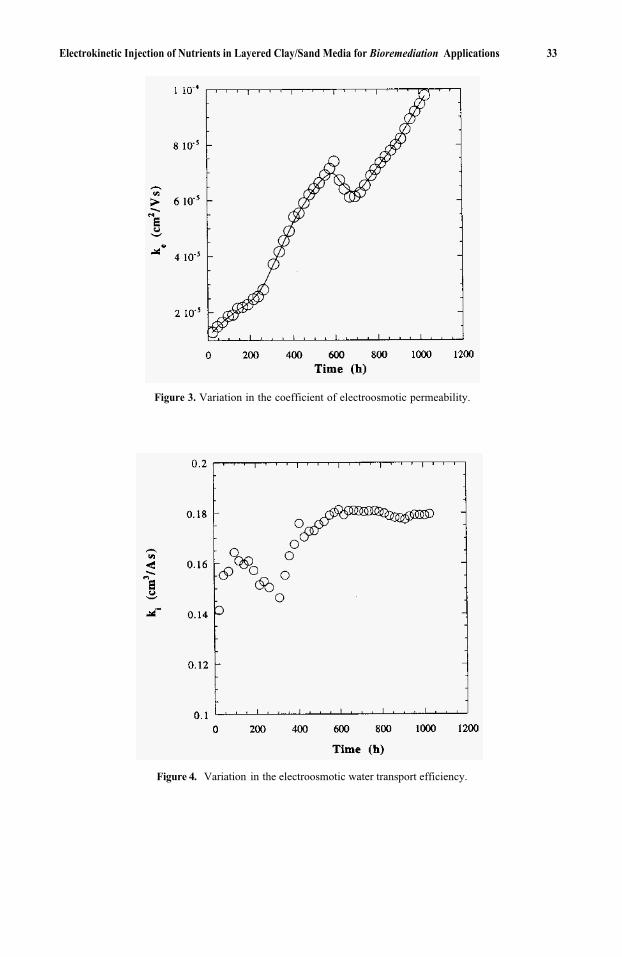
Electrokinetic Injection of Nutrients in Layered Clay/Sand Media for Bioremediation Applications 33
Figure 3. Variation in the coefficient of electroosmotic permeability.
Figure 4. Variation in the electroosmotic water transport efficiency.
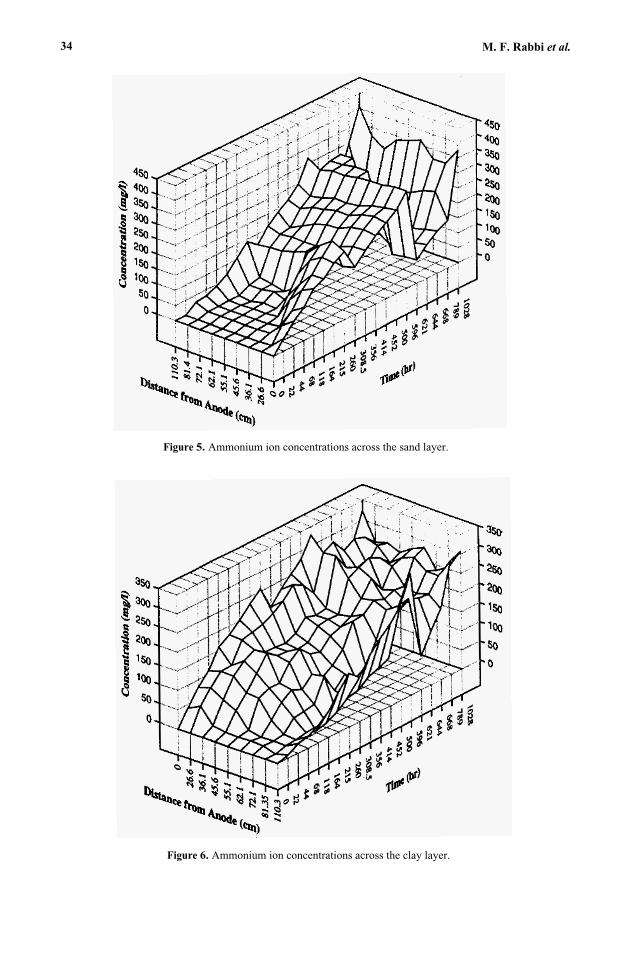
M. F. Rabbi et al.34
Figure 5. Ammonium ion concentrations across the sand layer.
Figure 6. Ammonium ion concentrations across the clay layer.
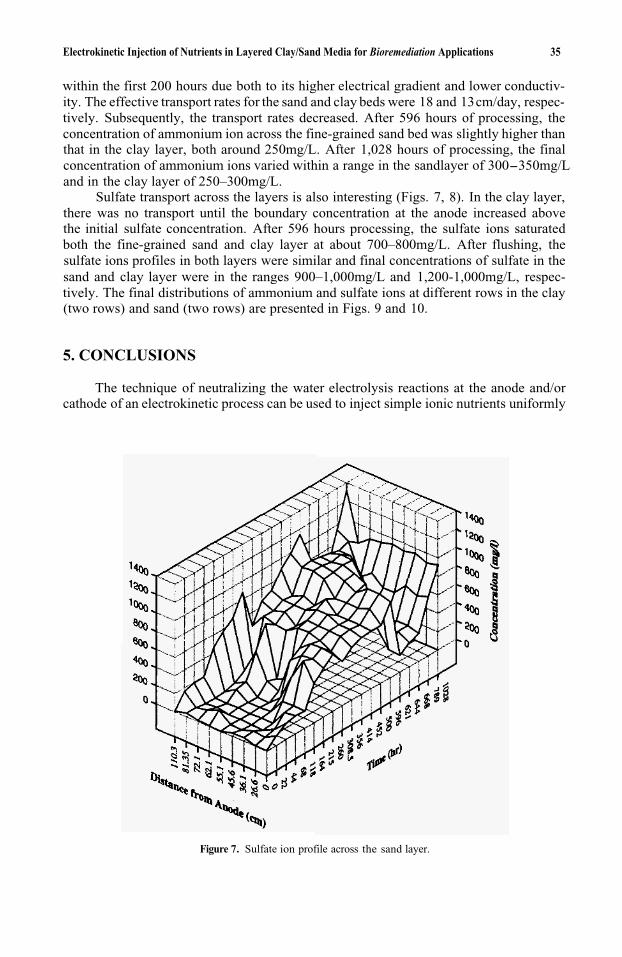
Electrokinetic Injection of Nutrients in Layered Clay/Sand Media for Bioremediation Applications 35
within the first 200 hours due both to its higher electrical gradient and lower conductiv-ity. The effective transport rates for the sand and clay beds were 18 and 13 cm/day, respec-tively. Subsequently, the transport rates decreased. After 596 hours of processing, the concentration of ammonium ion across the fine-grained sand bed was slightly higher than that in the clay layer, both around 250mg/L. After 1,028 hours of processing, the final concentration of ammonium ions varied within a range in the sandlayer of 300-350mg/Land in the clay layer of 250–300mg/L.
Sulfate transport across the layers is also interesting (Figs. 7, 8). In the clay layer, there was no transport until the boundary concentration at the anode increased above the initial sulfate concentration. After 596 hours processing, the sulfate ions saturated both the fine-grained sand and clay layer at about 700–800mg/L. After flushing, the sulfate ions profiles in both layers were similar and final concentrations of sulfate in the sand and clay layer were in the ranges 900–1,000mg/L and 1,200-1,000mg/L, respec-tively. The final distributions of ammonium and sulfate ions at different rows in the clay (two rows) and sand (two rows) are presented in Figs. 9 and 10.
5. CONCLUSIONS
The technique of neutralizing the water electrolysis reactions at the anode and/or cathode of an electrokinetic process can be used to inject simple ionic nutrients uniformly
Figure 7. Sulfate ion profile across the sand layer.
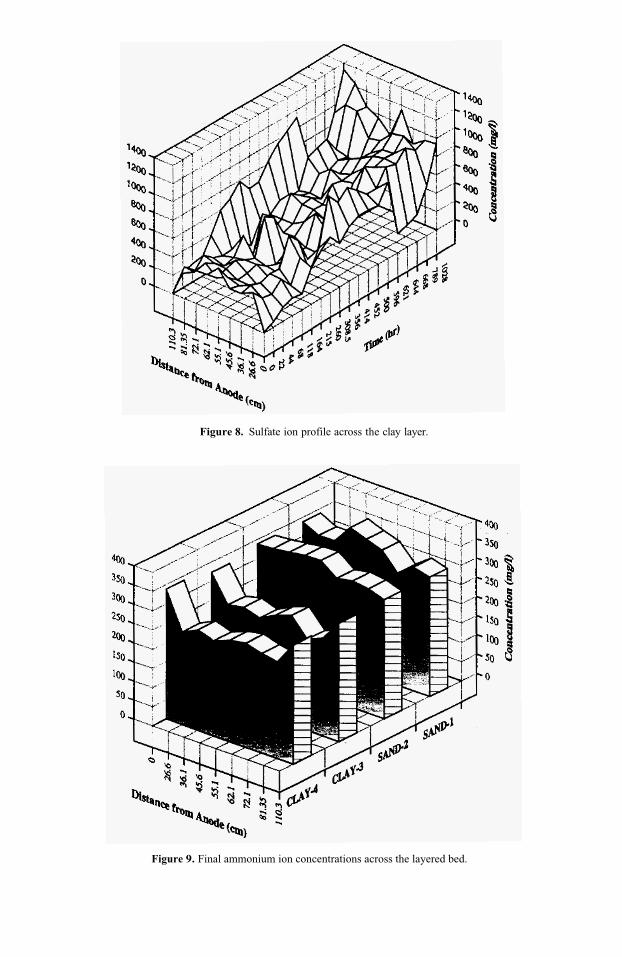
Figure 8. Sulfate ion profile across the clay layer.
Figure 9. Final ammonium ion concentrations across the layered bed.
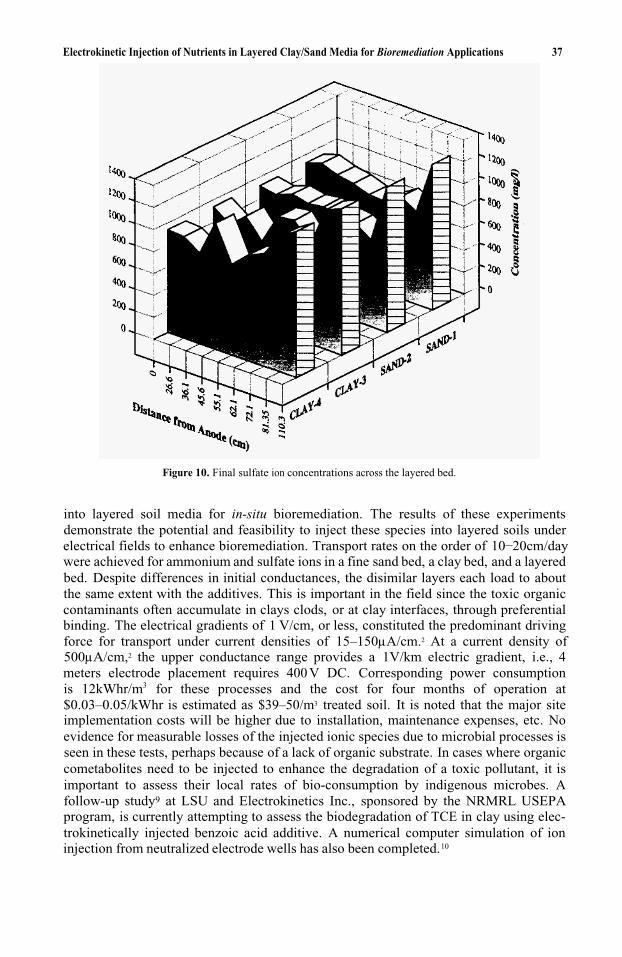
Electrokinetic Injection of Nutrients in Layered Clay/Sand Media for Bioremediation Applications 37
Figure 10. Final sulfate ion concentrations across the layered bed.
into layered soil media for in-situ bioremediation. The results of these experiments demonstrate the potential and feasibility to inject these species into layered soils under electrical fields to enhance bioremediation. Transport rates on the order of 10 20cm/day were achieved for ammonium and sulfate ions in a fine sand bed, a clay bed, and a layered bed. Despite differences in initial conductances, the disimilar layers each load to about the same extent with the additives. This is important in the field since the toxic organic contaminants often accumulate in clays clods, or at clay interfaces, through preferential binding. The electrical gradients of 1 V/cm, or less, constituted the predominant drivingforce for transport under current densities of 15–150µA/cm.2 At a current density of500µA/cm,2 the upper conductance range provides a 1V/km electric gradient, i.e., 4meters electrode placement requires 400 V DC. Corresponding power consumption is 12kWhr/m3 for these processes and the cost for four months of operation at $0.03–0.05/kWhr is estimated as $39–50/m3 treated soil. It is noted that the major siteimplementation costs will be higher due to installation, maintenance expenses, etc. Noevidence for measurable losses of the injected ionic species due to microbial processes is seen in these tests, perhaps because of a lack of organic substrate. In cases where organic cometabolites need to be injected to enhance the degradation of a toxic pollutant, it is important to assess their local rates of bio-consumption by indigenous microbes. Afollow-up study9 at LSU and Electrokinetics Inc., sponsored by the NRMRL USEPAprogram, is currently attempting to assess the biodegradation of TCE in clay using elec-trokinetically injected benzoic acid additive. A numerical computer simulation of ioninjection from neutralized electrode wells has also been completed.10
–
38 M. F. Rabbi et al.
ACKNOWLEDGMENTS
This work has been supported at Electrokinetics Inc. and LSU through the SBIRProgram of the DOE and the National Risk Management Research Laboratory(NRMRL), USEPA. Support from the LEQSF Industrial Ties Program at LouisianaState University is also gratefully recognized.
REFERENCES
1. Zappi, M., Gunnison, D., Pennington, J., Cullinane, J., Teeter, C., Brannon, C.L., and Myers, T., Tech.Report No. IRRP-93-3, US Army Corps of Engineers, Waterways Experiment Station, August 1993.
2. Cookson, J.T., Bioremediation Engineering: Design and Application, McGraw Hill, New York, NY, 1995.3. Marks, R.E., Acar, Y.B., and Gale, R.J., USP 5,458,747, 1995.4. Marks, R.E., Acar, YB., and Gale, R.J., In: Remediation of Hazardous Waste Contaminated Soils, Wise,
D.L. and Trantolo, D.J. (eds.), Marcel Dekker, 1994, pp. 406–435.5. Acar, YB., Rabbi, M.F., Ozsu-Acar, E.E., Gale, R.J., and Alshawabkeh, A.N., Chemtech, April 1996,
6. Acar, YB., Rabbi, M.F., and Ozsu-Acar, E.E., J. Geotech. & Geoenviron. Engr. 1997 123(3):239–249.7. Loo, W.W. and Chilingar, G.V., Remediation Management, Second Quarter 1997, pp. 40–41.8. Rabbi, M.F., PhD Thesis, Louisiana State University, 1997.9. Pardue, J.H., Jackson, W.A., Gale, R.J., Rabbi, M.F., Clark, B., and Ozsu-Acar, E.E., in Physical, Chem-
ical and Thermal Technologies, Remediation of Chlorinated and Recalcitrant Compounds, Wickra-manayake, G.B. and Hinchee, R.E. (eds.), Batelle Press, Columbus, Ohio, 1998, pp. 461–465.
10. Zheng, W., PhD Thesis, Louisiana State University, 1997.
pp. 40–44.
5
INTEGRATED REMEDIATION PROCESSFOR A HIGH SALINITY INDUSTRIAL SOILSAMPLE CONTAMINATED WITH HEAVY OILAND METALS
Abdul Majid1 and Bryan D. Sparks2
1Institute for Chemical Process & Environmental Technology National Research Council of CanadaMontreal Road Campus Ottawa, Ontario, K1A 0R6, Canada
2Institute for Chemical Process & Environmental Technology National Research Council of CanadaMontreal Road Campus Ottawa, Ontario, K1A 0R6, Canada
1. ABSTRACT
A highly saline industrial soil sample contaminated with heavy oils and severalheavy metals, was tested for remediation using NRC’s Solvent Extraction Soil Remedia-tion (SESR) process. The sample was provided courtesy of Newalta Corporation, a soilremediation company, based in Calgary, Alberta. Hydrocarbon contaminants wereremoved by applying both single and multistage extraction, using toluene as the solvent.Heavy metal fixation was achieved by incorporating metal binding agents into the soilagglomerates formed during the solvent extraction of organic contaminants.
The extracted solids were evaluated for their heavy metal leaching potential usingthe US-EPA’s toxicity test method 1310A and Toxicity Characteristics Leaching Proce-dure method 1311. Long term stability of the treated solids in terms of metal leaching was tested by the US-EPA’s multiple extraction procedure method 1320. The effect ofmetal binding agents on the extraction efficiency of SESR was also investigated.
After remediation by the SESR process the contaminated soil sample remainedsaline. Leaching of soluble salts from the dried agglomerates was carried out by waterpercolation through a fixed bed of dried, agglomerated soil.
2. INTRODUCTION
Contamination of soil by hazardous organic pollutants and/or heavy metals is aserious environmental problem facing the global community. Over time, these pollutants,
Emerging Technologies in Hazardous Waste Management 8, edited by Tedder and Pohland Kluwer Academic /Plenum Publishers, New York, 2000. 39
40 A. Majid and B. D. Sparks
trapped in the soil matrix, leach through inadequate holding facilities and migrate deep into the earth, finally making their way to groundwater aquifers. Once contaminated,these aquifers carry the toxins through the ecological system, bringing them into the food chain.
Typically, both heavy metals and hydrocarbon contaminants are associated withthe finer particle fractions of soils and sediments. Most techniques for the removal of metals involve contacting the soil with an aqueous solution. Similarly, some processes remove hydrocarbon contaminants by aqueous washing methods. For fine textured, high clay soils these techniques tend to produce intractable sludges having poor solid-liquidseparation characteristics. Other soil cleaning technologies, such as thermal desorption, are also poorly suited for treating fine textured top soils because of adverse effects on the associated humic matter or soil mineralogy. In such cases the treated soil may have to be landfilled or used as subsoil because of impaired soil fertility.
At the National Research Council of Canada, liquid phase agglomeration tech-niques, in combination with solvent extraction have been successfully used for the reme-diation of fine textured, organic contaminated soils. Co-agglomeration of fines with coarse particles is achieved by the addition of water to a vigorously mixed slurry of soil in the selected solvent. Water acts as a solids bridging liquid and dense soil agglomerates are formed under appropriate conditions. A simplified diagram, illustrating the condi-tions required for agglomeration, is shown on Fig. 1. The bridging liquid remains in the agglomerate pores where interfacial tension provides the forces necessary to hold the par-ticles together in the aggregates. Judicious selection of agglomerate size, by controlling water content, greatly improves the efficiency of solids-solvent separation. The latter is a prime requirement for effective process operation. Typically, only a few extraction steps are required. This combination of solvent extraction and soil remediation is known as the SESR process.
As an extension of this work, metal binding amendments are incorporated during the mixing stages for solvent extraction of the oily contaminants and agglomer-ation of the soil. The combined process thus allows concurrent removal of organics and fixation of heavy metals. A flow diagram of this integrated remediation process is shown in Fig. 2. Soil treatment by this approach should be more economical, in terms of material handling and equipment costs, than other processes, which require sep-arate extraction and leaching steps for treatment of organic contaminants and heavy metals.
Another advantage of the SESR process is the ease of salt leaching from the dried,extracted soil agglomerates. Agglomerates produced using liquid phase agglomerationtechniques are more stable than similar sized, natural aggregates of the same soil. During drying of agglomerated soil, water-soluble salts, dissolved in the agglomerate pore water, effloresce. This behavior facilitates their removal from the agglomerate surfaces by leach-ing with water.1
In this work we present the results for tests in which the SESR process is used to treat a highly saline industrial soil sample contaminated with both heavy oils and heavy metals. We investigated concurrent removal of the hydrocarbon, by solvent extratction, and fixation of heavy metals by incorporation of metal binding agents into the agglom-erates. Phosphate rock and coal combustion fly ashes were used as amendments for thispurpose. The degree of heavy metal fixation was determined by the US EPA’s ToxicityCharacteristics Leaching Procedure (TLCP) on the dried agglomerates. The leaching of soluble salts by percolation of water through a packed bed of agglomerated soil was also carried out.
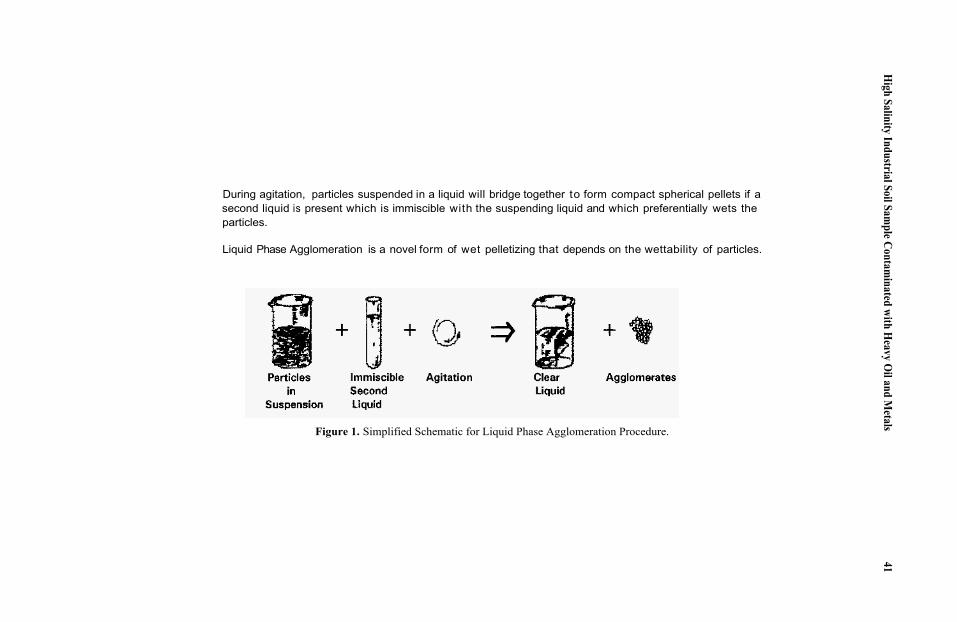
� During agitation, particles suspended in a liquid will bridge together to form compact spherical pellets if asecond liquid is present which is immiscible with the suspending liquid and which preferentially wets theparticles.
� Liquid Phase Agglomeration is a novel form of wet pelletizing that depends on the wettability of particles.
Figure 1. Simplified Schematic for Liquid Phase Agglomeration Procedure.
High Salinity Industrial Soil Sam
ple Contaminated with H
eavy Oil and M
etals41
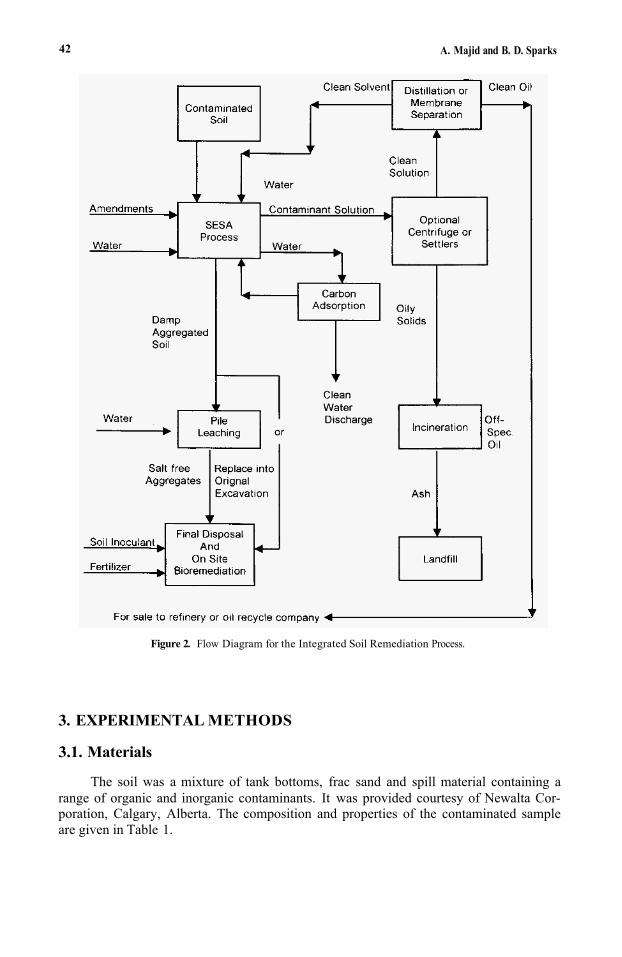
42 A. Majid and B. D. Sparks
Figure 2. Flow Diagram for the Integrated Soil Remediation Process.
3. EXPERIMENTAL METHODS
3.1. Materials
The soil was a mixture of tank bottoms, frac sand and spill material containing arange of organic and inorganic contaminants. It was provided courtesy of Newalta Cor-poration, Calgary, Alberta. The composition and properties of the contaminated sample are given in Table 1.
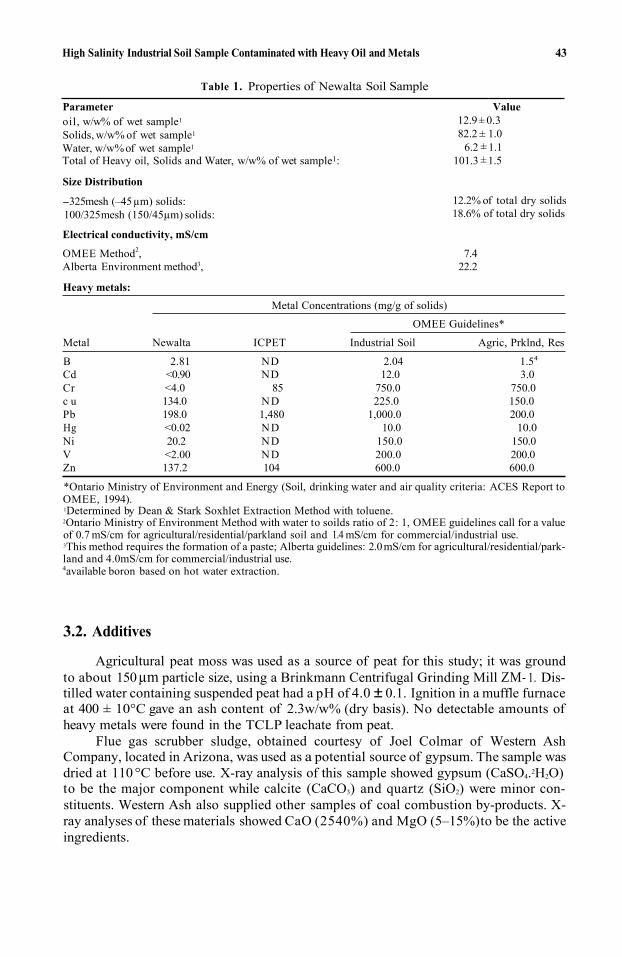
High Salinity Industrial Soil Sample Contaminated with Heavy Oil and Metals 43
Table 1. Properties of Newalta Soil Sample
Parameter Valueoil, w/w% of wet sample1
Solids, w/w% of wet sample1
Water, w/w%of wet sample1
Total of Heavy oil, Solids and Water, w/w% of wet sample1:
Size Distribution
-325mesh (–45µm) solids:100/325mesh (150/45µm) solids:
Electrical conductivity, mS/cm
12.9± 0.382.2 ± 1.0
6.2 ± 1.1101.3 ± 1.5
12.2% of total dry solids18.6% of total dry solids
OMEE Method2, 7.4Alberta Environment method3, 22.2
Heavy metals: Metal Concentrations (mg/g of solids)
OMEE Guidelines*
Metal Newalta ICPET Industrial Soil Agric, Prklnd, Res
B 2.81 ND 2.04 1.54
Cd <0.90 ND 12.0 3.0Cr <4.0 85 750.0 750.0c u 134.0 ND 225.0 150.0Pb 198.0 1,480 1,000.0 200.0Hg <0.02 ND 10.0 10.0Ni 20.2 ND 150.0 150.0V <2.00 ND 200.0 200.0Zn 137.2 104 600.0 600.0
*Ontario Ministry of Environment and Energy (Soil, drinking water and air quality criteria: ACES Report toOMEE, 1994).1Determined by Dean & Stark Soxhlet Extraction Method with toluene.2Ontario Ministry of Environment Method with water to soilds ratio of 2: 1, OMEE guidelines call for a valueof 0.7 mS/cm for agricultural/residential/parkland soil and 1.4 mS/cm for commercial/industrial use.3This method requires the formation of a paste; Alberta guidelines: 2.0mS/cm for agricultural/residential/park-land and 4.0mS/cm for commercial/industrial use.4available boron based on hot water extraction.
3.2. Additives
Agricultural peat moss was used as a source of peat for this study; it was groundto about 150µm particle size, using a Brinkmann Centrifugal Grinding Mill ZM- 1. Dis-tilled water containing suspended peat had a pH of 4.0 ± 0.1. Ignition in a muffle furnaceat 400 ± 10°C gave an ash content of 2.3w/w% (dry basis). No detectable amounts ofheavy metals were found in the TCLP leachate from peat.
Flue gas scrubber sludge, obtained courtesy of Joel Colmar of Western AshCompany, located in Arizona, was used as a potential source of gypsum. The sample wasdried at 110 °C before use. X-ray analysis of this sample showed gypsum (CaSO4.2H2O)to be the major component while calcite (CaCO3) and quartz (SiO2) were minor con-stituents. Western Ash also supplied other samples of coal combustion by-products. X-ray analyses of these materials showed CaO (2540%) and MgO (5–15%)to be the activeingredients.
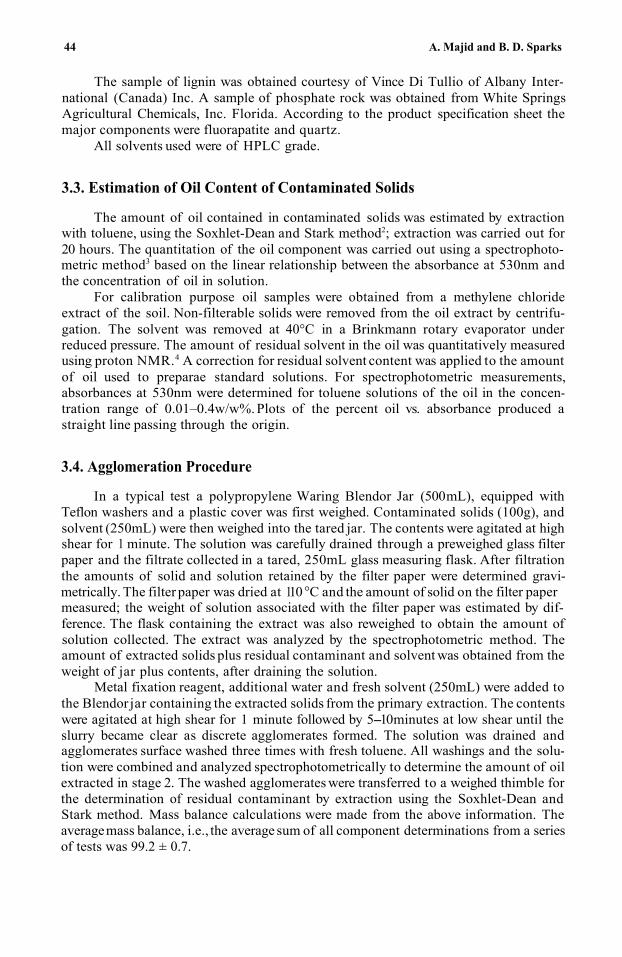
44 A. Majid and B. D. Sparks
The sample of lignin was obtained courtesy of Vince Di Tullio of Albany Inter-national (Canada) Inc. A sample of phosphate rock was obtained from White SpringsAgricultural Chemicals, Inc. Florida. According to the product specification sheet themajor components were fluorapatite and quartz.
All solvents used were of HPLC grade.
3.3. Estimation of Oil Content of Contaminated Solids
The amount of oil contained in contaminated solids was estimated by extractionwith toluene, using the Soxhlet-Dean and Stark method2; extraction was carried out for20 hours. The quantitation of the oil component was carried out using a spectrophoto-metric method3 based on the linear relationship between the absorbance at 530nm andthe concentration of oil in solution.
For calibration purpose oil samples were obtained from a methylene chlorideextract of the soil. Non-filterable solids were removed from the oil extract by centrifu-gation. The solvent was removed at 40°C in a Brinkmann rotary evaporator underreduced pressure. The amount of residual solvent in the oil was quantitatively measuredusing proton NMR.4 A correction for residual solvent content was applied to the amountof oil used to preparae standard solutions. For spectrophotometric measurements,absorbances at 530nm were determined for toluene solutions of the oil in the concen-tration range of 0.01–0.4w/w%. Plots of the percent oil vs. absorbance produced astraight line passing through the origin.
3.4. Agglomeration Procedure
In a typical test a polypropylene Waring Blendor Jar (500mL), equipped withTeflon washers and a plastic cover was first weighed. Contaminated solids (100g), andsolvent (250mL) were then weighed into the tared jar. The contents were agitated at highshear for 1 minute. The solution was carefully drained through a preweighed glass filterpaper and the filtrate collected in a tared, 250mL glass measuring flask. After filtrationthe amounts of solid and solution retained by the filter paper were determined gravi-metrically. The filter paper was dried at 110 C and the amount of solid on the filter papermeasured; the weight of solution associated with the filter paper was estimated by dif-ference. The flask containing the extract was also reweighed to obtain the amount ofsolution collected. The extract was analyzed by the spectrophotometric method. Theamount of extracted solids plus residual contaminant and solvent was obtained from theweight of jar plus contents, after draining the solution.
Metal fixation reagent, additional water and fresh solvent (250mL) were added tothe Blendor jar containing the extracted solids from the primary extraction. The contentswere agitated at high shear for 1 minute followed by 5-10minutes at low shear until theslurry became clear as discrete agglomerates formed. The solution was drained andagglomerates surface washed three times with fresh toluene. All washings and the solu-tion were combined and analyzed spectrophotometrically to determine the amount of oilextracted in stage 2. The washed agglomerates were transferred to a weighed thimble forthe determination of residual contaminant by extraction using the Soxhlet-Dean andStark method. Mass balance calculations were made from the above information. Theaveragemass balance, i.e., the average sum of all component determinations from a seriesof tests was 99.2 ± 0.7.
°
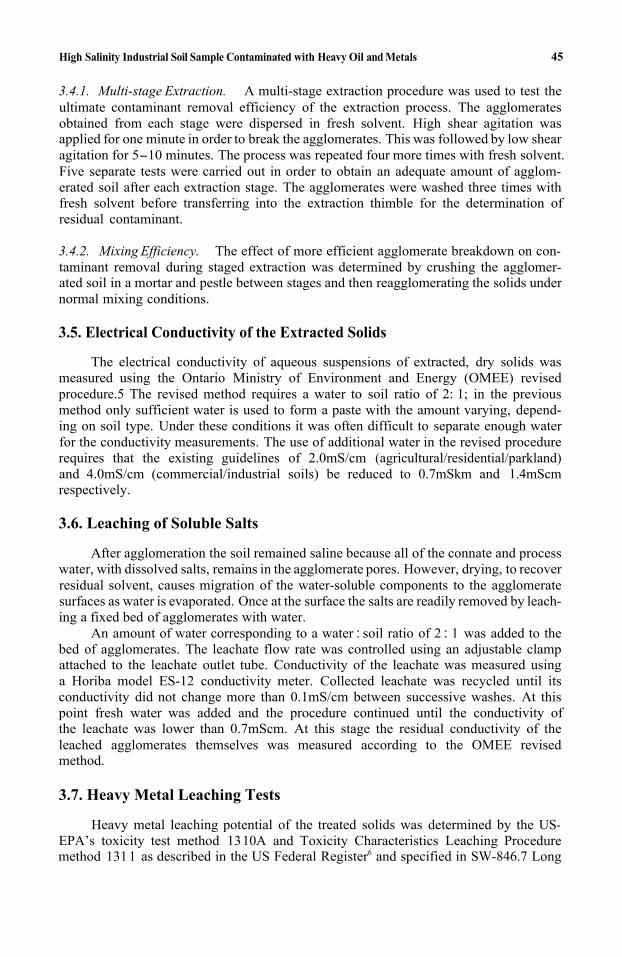
High Salinity Industrial Soil Sample Contaminated with Heavy Oil and Metals
3.4.1. Multi-stage Extraction. A multi-stage extraction procedure was used to test theultimate contaminant removal efficiency of the extraction process. The agglomeratesobtained from each stage were dispersed in fresh solvent. High shear agitation was applied for one minute in order to break the agglomerates. This was followed by low shear agitation for 5-10 minutes. The process was repeated four more times with fresh solvent.Five separate tests were carried out in order to obtain an adequate amount of agglom-erated soil after each extraction stage. The agglomerates were washed three times withfresh solvent before transferring into the extraction thimble for the determination of residual contaminant.
3.4.2. Mixing Efficiency. The effect of more efficient agglomerate breakdown on con-taminant removal during staged extraction was determined by crushing the agglomer-ated soil in a mortar and pestle between stages and then reagglomerating the solids under normal mixing conditions.
3.5. Electrical Conductivity of the Extracted Solids
45
The electrical conductivity of aqueous suspensions of extracted, dry solids was measured using the Ontario Ministry of Environment and Energy (OMEE) revised procedure.5 The revised method requires a water to soil ratio of 2: 1; in the previous method only sufficient water is used to form a paste with the amount varying, depend-ing on soil type. Under these conditions it was often difficult to separate enough water for the conductivity measurements. The use of additional water in the revised procedure requires that the existing guidelines of 2.0mS/cm (agricultural/residential/parkland)and 4.0mS/cm (commercial/industrial soils) be reduced to 0.7mSkm and 1.4mScmrespectively.
3.6. Leaching of Soluble Salts
After agglomeration the soil remained saline because all of the connate and process water, with dissolved salts, remains in the agglomerate pores. However, drying, to recover residual solvent, causes migration of the water-soluble components to the agglomerate surfaces as water is evaporated. Once at the surface the salts are readily removed by leach-ing a fixed bed of agglomerates with water.
An amount of water corresponding to a water : soil ratio of 2 : 1 was added to the bed of agglomerates. The leachate flow rate was controlled using an adjustable clamp attached to the leachate outlet tube. Conductivity of the leachate was measured using a Horiba model ES-12 conductivity meter. Collected leachate was recycled until its conductivity did not change more than 0.1mS/cm between successive washes. At this point fresh water was added and the procedure continued until the conductivity of the leachate was lower than 0.7mScm. At this stage the residual conductivity of the leached agglomerates themselves was measured according to the OMEE revised method.
3.7. Heavy Metal Leaching Tests
Heavy metal leaching potential of the treated solids was determined by the US-EPA’s toxicity test method 13 10A and Toxicity Characteristics Leaching Procedure method 131 1 as described in the US Federal Register6 and specified in SW-846.7 Long
46 A. Majid and B. D. Sparks
term stability of the treated solidsin terms of metal leachingwas tested using the agency’smultiple extraction procedure method 1320.
3.8. Analysis of Metals
sis (ICP).
3.9. Carbon Analysis of Dry Solids
Heavy metals were analyzed by Inductively Coupled Plasma Spectroscopic Analy-
Total carbon was determined using a Leco CR12 carbon analyser. Organic carbonwas determined after decomposing carbonate carbon with dilute hydrochloric acid; car-bonate carbon was then determined by difference.
3.10. Surface Analysis
X-ray photoelectron spectroscopy (XPS) was performed with a monochromatic Kαsource of x-rays. Sampleswere lightly pressed into a shallow powder sample holder, evac-uated to less than 10-6 torr pressure and then introduced into the analysis chamber of aKratos Axis XPS. A survey spectrum was run first followed by analysis of two typicalareas at high resolution.
4. RESULTS AND DISCUSSION
The SESR process has been tested on a highly saline industrial soil sample conta-minated with heavy oil and several heavy metals. Table 2 summarizes the results for asingle stage extraction using toluene as a solvent; over 90% of the contaminant is removedin a single stage application of the SESR extraction process.
4.1. The Effect of Additives (Metal Binding Agents)
Several metal binding agents, e.g., flue gas scrubber sludge, sodium and calciumphosphates, peat, lignin and coal combustion ashes were incorporated individually intothe agglomerates during processing in order to test their ability to fix leachable heavymetals. The effect of these additives on the efficiency of hydrocarbon contaminantremoval by the SESR process is illustrated by the bar chart shown on Fig. 3.
Whereas, phosphates, peat, lignin and coal combustion ashes did not affect the basicextraction efficiency of the SESR process, flue gas scrubber sludge appears to have a ben-eficial effect on oil removal. In this case the amount of contaminant removed exceededthe amount recovered using the traditional Soxhlet extraction procedure.
4.2. Residual Contaminant
The amount of residual contaminant in the treated solids was measured for massbalance purposes and to assess contaminant removal efficiency. Figure 4 plots the resid-ual contaminant data for single stage extraction (Table 2) as a function of total conta-minant removed. If the data for blank tests and the tests with ash “C” are excluded thenthe remaining data can be fitted to a second order equation with a correlation coefficient
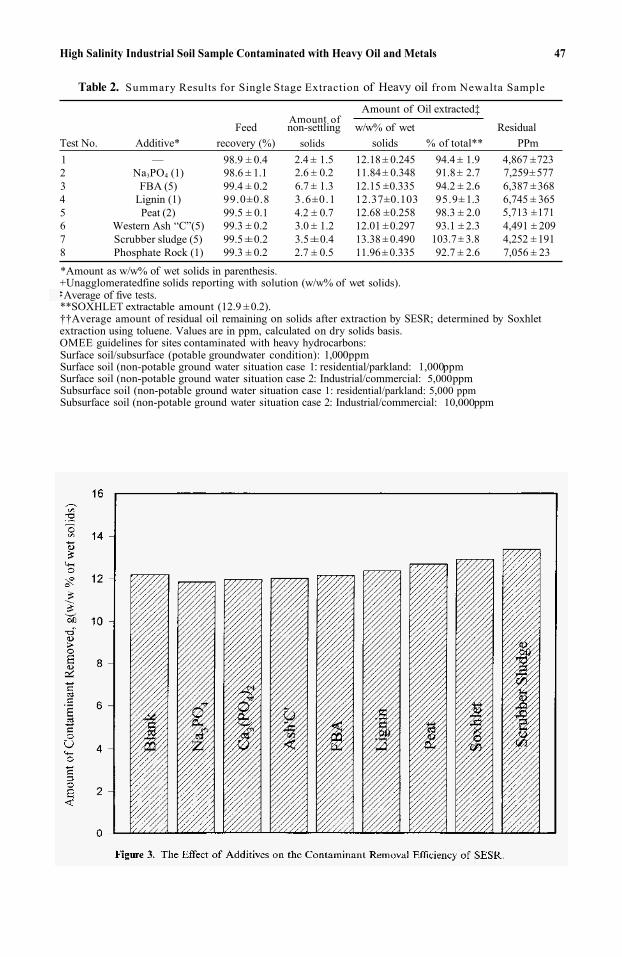
High Salinity Industrial Soil Sample Contaminated with Heavy Oil and Metals 47
Table 2. Summary Results for Single Stage Extraction of Heavy oil from Newalta Sample
Amount ofAmount of Oil extracted‡
Feed non-settling w/w% of wet ResidualTest No. Additive* recovery (%) solids % of total** PPm1 — 98.9 ± 0.4 2.4 ± 1.5 12.18 ± 0.245 94.4 ± 1.9 4,867 ± 723 2 Na3PO4 (1) 98.6 ± 1.1 2.6 ± 0.2 11.84± 0.348 91.8± 2.7 7,259±577 3 FBA (5) 99.4 ± 0.2 6.7 ± 1.3 12.15 ±0.335 94.2 ± 2.6 6,387 ±3684 Lignin (1) 99.0±0.8 3.6±0.1 12.37±0.103 95.9± 1.3 6,745 ± 365 5 Peat (2) 99.5 ± 0.1 4.2 ± 0.7 12.68 ±0.258 98.3 ± 2.0 5,713 ±1716 Western Ash “C”(5) 99.3 ± 0.2 3.0 ± 1.2 12.01 ±0.297 93.1 ± 2.3 4,491 ± 2097 Scrubber sludge (5) 99.5±0.2 3.5±0.4 13.38 ± 0.490 103.7± 3.8 4,252 ±1918 Phosphate Rock (1) 99.3 ± 0.2 2.7 ± 0.5 11.96 ± 0.335 92.7 ± 2.6 7,056 ± 23
*Amount as w/w% of wet solids in parenthesis.+Unagglomeratedfine solids reporting with solution (w/w% of wet solids).Average of five tests.
**SOXHLET extractable amount (12.9 ± 0.2).††Average amount of residual oil remaining on solids after extraction by SESR; determined by Soxhletextraction using toluene. Values are in ppm, calculated on dry solids basis.OMEE guidelines for sites contaminated with heavy hydrocarbons:Surface soil/subsurface (potable groundwater condition): 1,000ppmSurface soil (non-potable ground water situation case 1: residential/parkland: 1,000ppmSurface soil (non-potable ground water situation case 2: Industrial/commercial: 5,000ppmSubsurface soil (non-potable ground water situation case 1: residential/parkland: 5,000 ppm Subsurface soil (non-potable ground water situation case 2: Industrial/commercial: 10,000ppm
solids
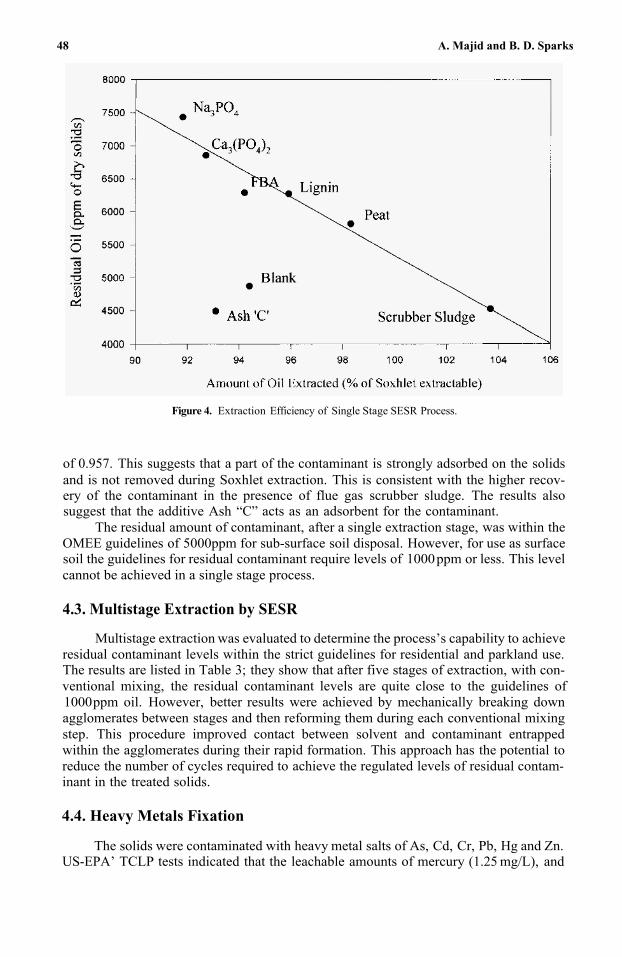
48 A. Majid and B. D. Sparks
Figure 4. Extraction Efficiency of Single Stage SESR Process.
of 0.957. This suggests that a part of the contaminant is strongly adsorbed on the solids and is not removed during Soxhlet extraction. This is consistent with the higher recov-ery of the contaminant in the presence of flue gas scrubber sludge. The results also suggest that the additive Ash “C” acts as an adsorbent for the contaminant.
The residual amount of contaminant, after a single extraction stage, was within the OMEE guidelines of 5000ppm for sub-surface soil disposal. However, for use as surface soil the guidelines for residual contaminant require levels of 1000 ppm or less. This level cannot be achieved in a single stage process.
4.3. Multistage Extraction by SESR
Multistage extraction was evaluated to determine the process’s capability to achieve residual contaminant levels within the strict guidelines for residential and parkland use. The results are listed in Table 3; they show that after five stages of extraction, with con-ventional mixing, the residual contaminant levels are quite close to the guidelines of 1000 ppm oil. However, better results were achieved by mechanically breaking down agglomerates between stages and then reforming them during each conventional mixing step. This procedure improved contact between solvent and contaminant entrapped within the agglomerates during their rapid formation. This approach has the potential to reduce the number of cycles required to achieve the regulated levels of residual contam-inant in the treated solids.
4.4. Heavy Metals Fixation
The solids were contaminated with heavy metal salts of As, Cd, Cr, Pb, Hg and Zn. US-EPA’ TCLP tests indicated that the leachable amounts of mercury (1.25 mg/L), and
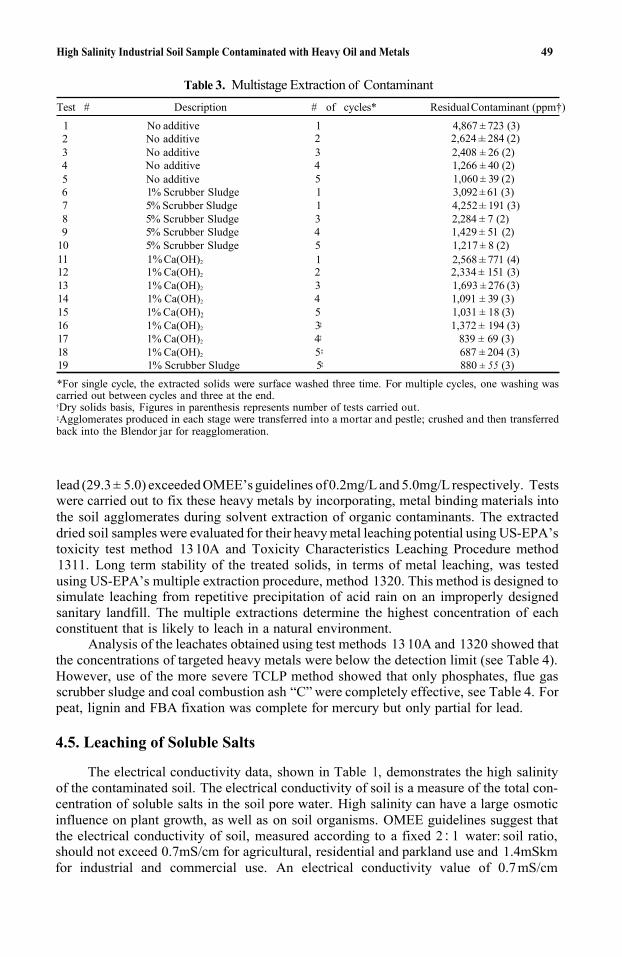
High Salinity Industrial Soil Sample Contaminated with Heavy Oil and Metals 49
Table 3. Multistage Extraction of ContaminantTest # Description # of cycles* ResidualContaminant (ppm†)
1 No additive 1 4,867 ± 723 (3) 2 No additive 2 2,624 ± 284 (2)3 No additive 3 2,408 ± 26 (2)4 No additive 4 1,266 ± 40 (2)5 No additive 5 1,060 ± 39 (2)6 1% Scrubber Sludge 1 3,092 ± 61 (3)7 5% Scrubber Sludge 1 4,252± 191 (3)8 5% Scrubber Sludge 3 2,284 ± 7 (2)9 5% Scrubber Sludge 4 1,429 ± 51 (2)
10 5% Scrubber Sludge 5 1,217 ± 8 (2)11 1% Ca(OH)2 1 2,568 ± 771 (4) 12 1% Ca(OH)2 2 2,334 ± 151 (3) 13 1% Ca(OH)2 3 1,693 ± 276 (3) 14 1% Ca(OH)2 4 1,091 ± 39 (3)15 1% Ca(OH)2 5 1,031 ± 18 (3)16 1% Ca(OH)2 3‡ 1,372 ± 194 (3)17 1% Ca(OH)2 4‡ 839 ± 69 (3)18 1% Ca(OH)2 5‡ 687 ± 204 (3)
*For single cycle, the extracted solids were surface washed three time. For multiple cycles, one washing wascarried out between cycles and three at the end.†Dry solids basis, Figures in parenthesis represents number of tests carried out.‡Agglomerates produced in each stage were transferred into a mortar and pestle; crushed and then transferred back into the Blendor jar for reagglomeration.
19 1% Scrubber Sludge 5‡ 880 ± 55 (3)
lead (29.3 ± 5.0) exceeded OMEE’s guidelines of0.2mg/L and 5.0mg/L respectively. Testswere carried out to fix these heavy metals by incorporating, metal binding materials into the soil agglomerates during solvent extraction of organic contaminants. The extracted dried soil samples were evaluated for their heavy metal leaching potential using US-EPA’stoxicity test method 13 10A and Toxicity Characteristics Leaching Procedure method 1311. Long term stability of the treated solids, in terms of metal leaching, was tested using US-EPA’s multiple extraction procedure, method 1320. This method is designed to simulate leaching from repetitive precipitation of acid rain on an improperly designed sanitary landfill. The multiple extractions determine the highest concentration of each constituent that is likely to leach in a natural environment.
Analysis of the leachates obtained using test methods 13 10A and 1320 showed that the concentrations of targeted heavy metals were below the detection limit (see Table 4). However, use of the more severe TCLP method showed that only phosphates, flue gas scrubber sludge and coal combustion ash “C” were completely effective, see Table 4. For peat, lignin and FBA fixation was complete for mercury but only partial for lead.
4.5. Leaching of Soluble Salts
The electrical conductivity data, shown in Table 1, demonstrates the high salinity of the contaminated soil. The electrical conductivity of soil is a measure of the total con-centration of soluble salts in the soil pore water. High salinity can have a large osmotic influence on plant growth, as well as on soil organisms. OMEE guidelines suggest that the electrical conductivity of soil, measured according to a fixed 2 : 1 water: soil ratio, should not exceed 0.7mS/cm for agricultural, residential and parkland use and 1.4mSkm for industrial and commercial use. An electrical conductivity value of 0.7 mS/cm
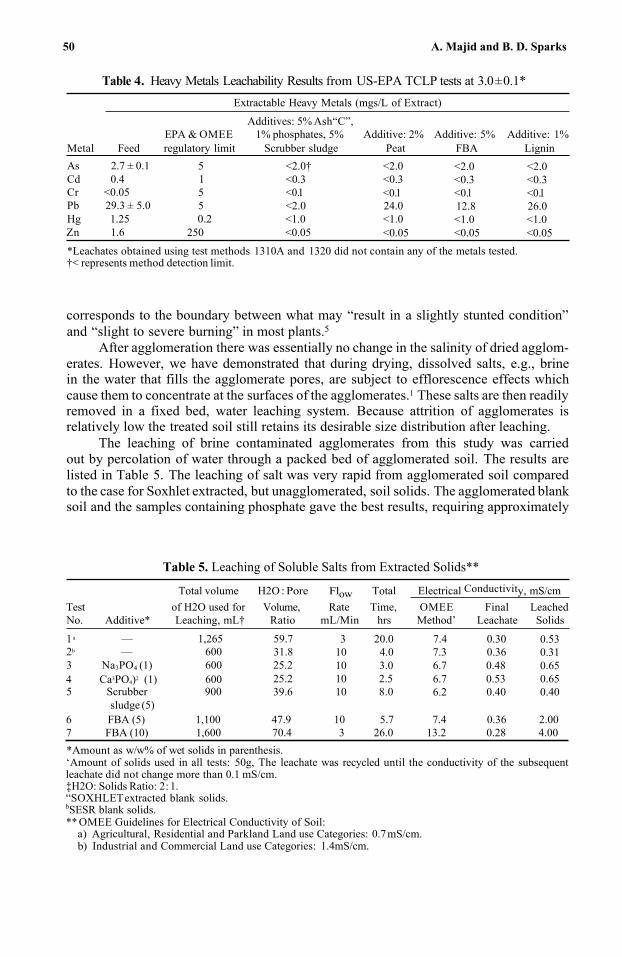
50 A. Majid and B. D. Sparks
Table 4. Heavy Metals Leachability Results from US-EPA TCLP tests at 3.0±0.1*Extractable Heavy Metals (mgs/L of Extract)
Additives: 5% Ash“C”,EPA & OMEE 1% phosphates, 5% Additive: 2% Additive: 5% Additive: 1%
Metal Feed regulatory limit Scrubber sludge Peat FBA Lignin As 2.7 ± 0.1 5 <2.0† <2.0 <2.0 <2.0Cd 0.4 1 <0.3 <0.3 <0.3 <0.3Cr <0.05 5 <0.1 <0.1 <0.1 <0.1Pb 29.3 ± 5.0 5 <2.0 24.0 12.8 26.0Hg 1.25 0.2 <1.0 <1.0 <1.0 <1.0Zn 1.6 250 <0.05 <0.05 <0.05 <0.05*Leachates obtained using test methods 1310A and 1320 did not contain any of the metals tested.†< represents method detection limit.
corresponds to the boundary between what may “result in a slightly stunted condition” and “slight to severe burning” in most plants.5
After agglomeration there was essentially no change in the salinity of dried agglom-erates. However, we have demonstrated that during drying, dissolved salts, e.g., brine in the water that fills the agglomerate pores, are subject to efflorescence effects which cause them to concentrate at the surfaces of the agglomerates.1 These salts are then readilyremoved in a fixed bed, water leaching system. Because attrition of agglomerates isrelatively low the treated soil still retains its desirable size distribution after leaching.
The leaching of brine contaminated agglomerates from this study was carried out by percolation of water through a packed bed of agglomerated soil. The results are listed in Table 5. The leaching of salt was very rapid from agglomerated soil compared to the case for Soxhlet extracted, but unagglomerated, soil solids. The agglomerated blanksoil and the samples containing phosphate gave the best results, requiring approximately
Table 5. Leaching of Soluble Salts from Extracted Solids**
Total volume H2O :Pore Flow Total Electrical Conductivity, mS/cmTest of H2O used for Volume, Rate Time, OMEE Final LeachedNo. Additive* Leaching, mL† Ratio mL/Min hrs Method’ Leachate Solids
1 a — 1,265 59.7 3 20.0 7.4 0.30 0.532b — 600 31.8 10 4.0 7.3 0.36 0.313 Na3PO4 (1) 600 25.2 10 3.0 6.7 0.48 0.654 Ca3PO4)2 (1) 600 25.2 10 2.5 6.7 0.53 0.655 Scrubber 900 39.6 10 8.0 6.2 0.40 0.40
sludge (5)6 FBA (5) 1,100 47.9 10 5.7 7.4 0.36 2.00 7 FBA (10) 1,600 70.4 3 26.0 13.2 0.28 4.00 *Amount as w/w% of wet solids in parenthesis. ‘Amount of solids used in all tests: 50g, The leachate was recycled until the conductivity of the subsequent leachate did not change more than 0.1 mS/cm.‡H2O: Solids Ratio: 2 : 1. “SOXHLETextracted blank solids. bSESR blank solids. ** OMEE Guidelines for Electrical Conductivity of Soil:
a) Agricultural, Residential and Parkland Land use Categories: 0.7mS/cm.b) Industrial and Commercial Land use Categories: 1.4mS/cm.
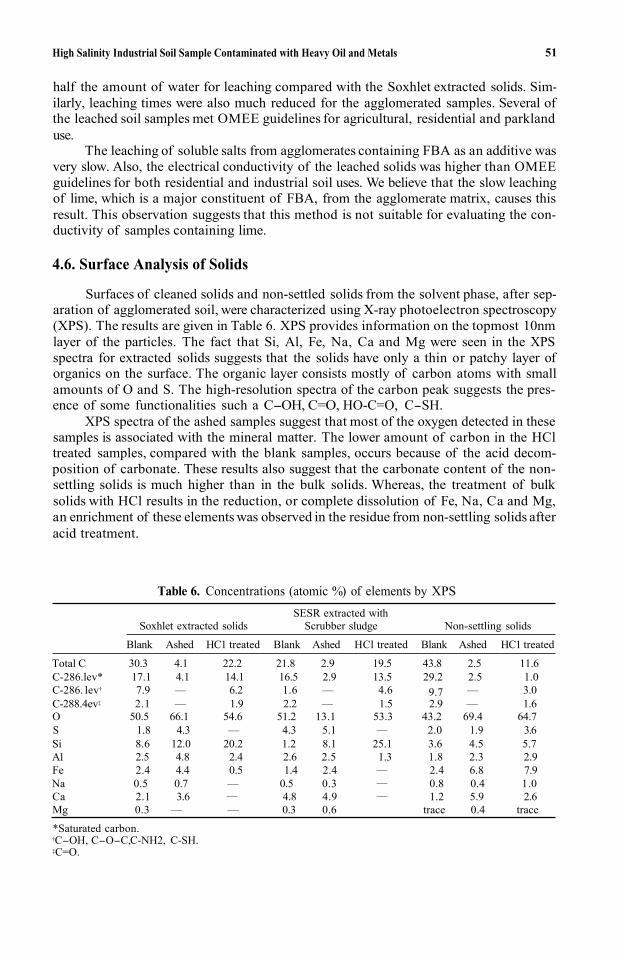
High Salinity Industrial Soil Sample Contaminated with Heavy Oil and Metals
half the amount of water for leaching compared with the Soxhlet extracted solids. Sim-ilarly, leaching times were also much reduced for the agglomerated samples. Several of the leached soil samples met OMEE guidelines for agricultural, residential and parklanduse.
The leaching of soluble salts from agglomerates containing FBA as an additive wasvery slow. Also, the electrical conductivity of the leached solids was higher than OMEE guidelines for both residential and industrial soil uses. We believe that the slow leachingof lime, which is a major constituent of FBA, from the agglomerate matrix, causes this result. This observation suggests that this method is not suitable for evaluating the con-ductivity of samples containing lime.
4.6. Surface Analysis of Solids
51
Surfaces of cleaned solids and non-settled solids from the solvent phase, after sep-aration of agglomerated soil, were characterized using X-ray photoelectron spectroscopy(XPS). The results are given in Table 6. XPS provides information on the topmost 10nmlayer of the particles. The fact that Si, Al, Fe, Na, Ca and Mg were seen in the XPSspectra for extracted solids suggests that the solids have only a thin or patchy layer oforganics on the surface. The organic layer consists mostly of carbon atoms with small amounts of O and S. The high-resolution spectra of the carbon peak suggests the pres-ence of some functionalities such a C-OH, C=O, HO-C=O, C-SH.
XPS spectra of the ashed samples suggest that most of the oxygen detected in these samples is associated with the mineral matter. The lower amount of carbon in the HCltreated samples, compared with the blank samples, occurs because of the acid decom-position of carbonate. These results also suggest that the carbonate content of the non-settling solids is much higher than in the bulk solids. Whereas, the treatment of bulksolids with HCl results in the reduction, or complete dissolution of Fe, Na, Ca and Mg,an enrichment of these elements was observed in the residue from non-settling solids afteracid treatment.
Table 6. Concentrations (atomic %) of elements by XPSSESR extracted with
Soxhlet extracted solids Scrubber sludge Non-settling solids
Blank Ashed HC1 treated Blank Ashed HCl treated Blank Ashed HC1 treated
Total C 30.3 4.1 22.2 21.8 2.9 19.5 43.8 2.5 11.6C-286.lev* 17.1 4.1 14.1 16.5 2.9 13.5 29.2 2.5 1.0C-286. lev† 7.9 — 6.2 1.6 — 4.6 9.7 — 3.0C-288.4ev‡ 2.1 — 1.9 2.2 — 1.5 2.9 — 1.6O 50.5 66.1 54.6 51.2 13.1 53.3 43.2 69.4 64.7S 1.8 4.3 — 4.3 5.1 2.0 1.9 3.6Si 8.6 12.0 20.2 1.2 8.1 25.1 3.6 4.5 5.7A1 2.5 4.8 2.4 2.6 2.5 1.3 1.8 2.3 2.9Fe 2.4 4.4 0.5 1.4 2.4 2.4 6.8 7.9Na 0.5 0.7 — 0.5 0.3 0.8 0.4 1.0Ca 2.1 3.6 4.8 4.9 1.2 5.9 2.6Mg 0.3 — — 0.3 0.6 trace 0.4 trace
*Saturated carbon.†C-OH, C-O-C,C-NH2, C-SH.‡C=O.
-
-
-
- -
52 A. Majid and B. D. Sparks
The lower carbon content of the solids extracted in the presence of flue gas scrub-ber sludge compared with the solids extracted by the Soxhlet method supports the extrac-tion results found in the SESR tests. The results suggest a beneficial effect of added flue gas scrubber sludge on oil extraction efficiency.
5. CONCLUSIONS
A highly saline, industrial soil sample, contaminated with a heavy oil and several heavy metals, was successfully remediated using a modified SESR process. During pro-cessing, concurrent removal of the hydrocarbon, by solvent extraction, and fixation of heavy metals, by incorporating metal fixation agents into the soil agglomerates formed, was achieved. Phosphate rock and coal combustion fly ashes were particularly effective for metal fixation. Over 90% of the oily contaminant was removed in the first stage ofthe SESR process. At this point the amount of residual contaminant in the treated soil was within OMEE guidelines of <5000ppm for the subsurface soil category. A five stageextraction process, without optimum mixing, reduced the residual oil contaminant to levels close to the OMEE guidelines for residential and parkland use. However, better results were achieved by improving the efficiency of mixing to provide more breakdown and reforming of agglomerates. An improvement in mixing has the potential to reduce the number of cycles required to achieve the regulated levels of residual Contaminant in the treated solids.
Additives used for the fixation of lead and mercury did not, in general, affect the basic extraction efficiency of the SESR process. However, flue gas scrubber sludge had a beneficial effect on oil removal; in this case the amount of contaminant removed exceeded the amount recovered by the Soxhlet extraction procedure. The effect was confirmed by measurement of surface carbon concentration by XPS analysis of the solids treated in different ways.
The additives tested for the fixation of heavy metals, were effective in rendering these metals non-leachable under the conditions of acid rain. However, when a more rigorous leaching procedure, such as EPA’s TCLP, was used only phosphates, flue gas scrubber sludge and coal combustion ash “C” were found to be completely effective. Peat, lignin and FBA completely fixed mercury but were only partially effective for lead.
Dried agglomerates were leached with water in a fixed bed system to remove resid-ual brine in order to meet OMEE Guidelines for soil conductivity. The required con-ductivity was reached with less water and in a shorter time for agglomerated solids compared to unagglomerated soil extracted using conventional means.
ACKNOWLEDGMENT
The authors are grateful to, Gerald Pleizier and V. Boyko for technical help.
REFERENCES
1. Meadus, F.W., Sparks, B.D., and Majid, A. “Solvent Extraction Using a Soil Agglomeration Approach”,Emerging Technologies in Hazardous Waste Management VI, 1994, 161-176,D. William Tedder andFrederick G. Pohland Editors, American Chemical Society, Washington DC.
High Salinity Industrial Soil Sample Contaminated with Heavy Oil and Metals 53
2. Syncrude analytical methods for oil sand and heavy oil processing, J.T. Bulmer and J. Star Editors.Alberta oil Sands Information Centre, Edmonton, AB, pp. 46-51 (1979).
3. Patel, M.S., “Rapid and Convenient Laboratory Method for Extraction and Subsequent Spectropho-tometric Determination of Heavy Oil Content of Bituminous Sands”; Anal. Chem. 46, 794(1974).
4. Majid, A. and Sparks, B.D., “Total Analysis of Mineral Wastes Containing Heavy Oil, Solvent, Waterand Solids”, AOSTRA J. Res. 1, 21–29(1984).
5. Ontario Ministry of Environment and Energy: Standards Development Branch, “Rationale for theDevelopment and Application of Generic Soil, Groundwater and Sediment Criteria for Use at Conta-minated Sites in Ontario”, May, 1996.
6. US EPA Federal Register. 51, (142), March 1990, Office of Solid Waste, Washington DC.7. US EPA—“Test Methods for Evaluation of Solid Waste: Physical/Chemical Methods”, SW-846, 3rd
Ed., Office of Solid Waste and Emergency Response, Washington DC, Nov. 1986.
ABBREVIATIONS
SESR Solvent Extraction Soil RemediationOMEEEPA Environmental Protection Agency TCLP Toxicity Characteristics Leaching Procedure ICP Inductively Coupled Plasma ICPETND Not Detected MScm Conductivity in mlliSiemens/cm
Ontario Ministry of the Environment and Energy
Institute for Chemical Process and Environmental Technology

This page intentionally left blank.
6
LABORATORY AND FIELD SOIL WASHING EXPERIMENTS WITHSURFACTANT SOLUTIONS
NAPL Recovery Mechanisms
Richard Martel1, Pierre J. Gelinas1, René Lefebvre1, Alain Hébert2,Stefan Foy2, Laurent Saumure2, Annie Roy1, and Nathalie Roy1
1In situ Research GroupINRS-Géoressources, 2535 boulevard LaurierC.P. 7500, Sainte-Foy, Quebec Canada G1V 4C7
2In situ Research GroupDépartement de géologie et de genie géologiqueUniversité Laval Sainte-Foy, Quebec, Canada G1K 7P4
1. ABSTRACT
During the last six years, surfactant solutions have been developed to dissolve ormobilize different NAPL types. These solutions were made with anionic surfactants andalcohols, as well as solvents in some cases. Laboratory and field tests were performedusing these solutions to recover residual NAPL in sediments and etched-glass micro-models. Surfactant washing experiments were done on: (1) small sand columns (110g);(2) a large sand column (65kg); (3) an etched glass micromodel and; (4) a test plot in anaquifer contaminated with a complex mixture of DNAPL. Washing experiments wereapplied to the recovery of diesel, Aroclor 1248, and a complex DNAPL mixture. Lab and field experiments show that it is possible to recover more than 90% of residual NAPLwith less than 6 pore volumes of a concentrated washing solution. Recovery mechanismsdepend on: (1) NAPL type, (2) micellar solution type (alcohol/surfactant or alcohol/sur-factant/solvent), (3) ingredient concentrations in the micellar solution, (4) washing direc-tion (upward, downward, horizontal), (5) injection/pumping pattern, and (6) injectionvelocity.
Emerging Technologies in Hazardous Waste Management 8, edited by Tedder and PohlandKluwer Academic /Plenum Publishers, New York, 2000. 55
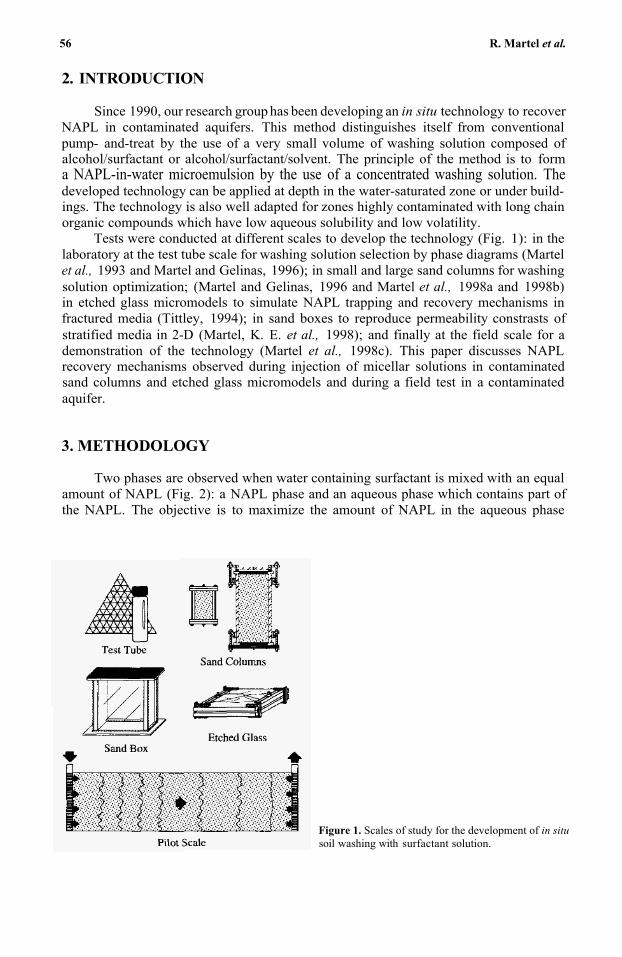
56 R. Martel et al.
2. INTRODUCTION
Since 1990, our research group has been developing an in situ technology to recover NAPL in contaminated aquifers. This method distinguishes itself from conventionalpump- and-treat by the use of a very small volume of washing solution composed of alcohol/surfactant or alcohol/surfactant/solvent. The principle of the method is to form a NAPL-in-water microemulsion by the use of a concentrated washing solution. Thedeveloped technology can be applied at depth in the water-saturated zone or under build-ings. The technology is also well adapted for zones highly contaminated with long chainorganic compounds which have low aqueous solubility and low volatility.
Tests were conducted at different scales to develop the technology (Fig. 1): in the laboratory at the test tube scale for washing solution selection by phase diagrams (Martel et al., 1993 and Martel and Gelinas, 1996); in small and large sand columns for washingsolution optimization; (Martel and Gelinas, 1996 and Martel et al., 1998a and 1998b)in etched glass micromodels to simulate NAPL trapping and recovery mechanisms infractured media (Tittley, 1994); in sand boxes to reproduce permeability constrasts of stratified media in 2-D (Martel, K. E. et al., 1998); and finally at the field scale for ademonstration of the technology (Martel et al., 1998c). This paper discusses NAPLrecovery mechanisms observed during injection of micellar solutions in contaminatedsand columns and etched glass micromodels and during a field test in a contaminatedaquifer.
3. METHODOLOGY
Two phases are observed when water containing surfactant is mixed with an equalamount of NAPL (Fig. 2): a NAPL phase and an aqueous phase which contains part of the NAPL. The objective is to maximize the amount of NAPL in the aqueous phase
Figure 1. Scales of study for the development of in situsoil washing with surfactant solution.
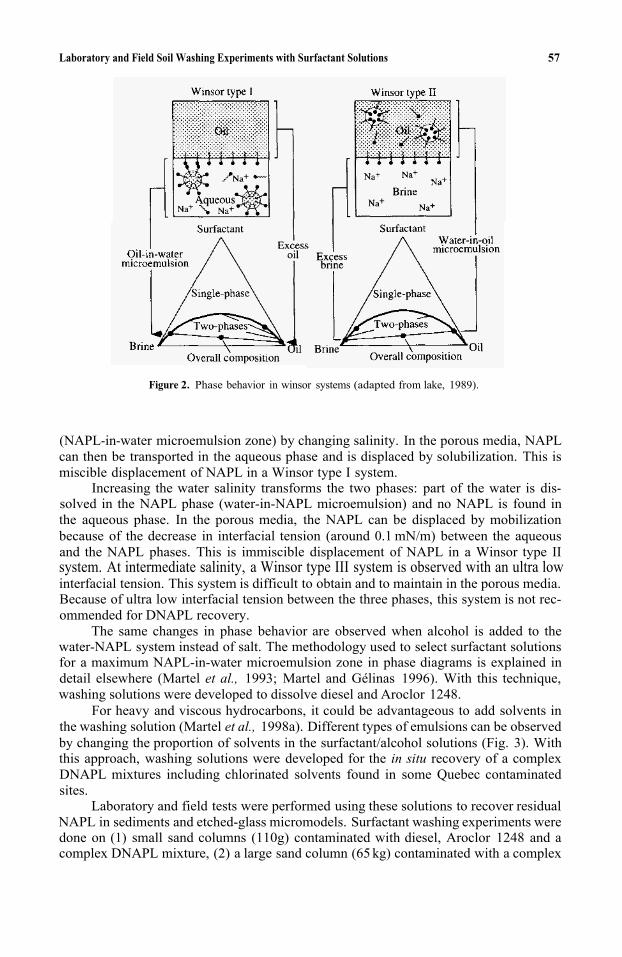
Laboratory and Field Soil Washing Experiments with Surfactant Solutions 57
Figure 2. Phase behavior in winsor systems (adapted from lake, 1989).
(NAPL-in-water microemulsion zone) by changing salinity. In the porous media, NAPL can then be transported in the aqueous phase and is displaced by solubilization. This is miscible displacement of NAPL in a Winsor type I system.
Increasing the water salinity transforms the two phases: part of the water is dis-solved in the NAPL phase (water-in-NAPL microemulsion) and no NAPL is found in the aqueous phase. In the porous media, the NAPL can be displaced by mobilization because of the decrease in interfacial tension (around 0.1 mN/m) between the aqueous and the NAPL phases. This is immiscible displacement of NAPL in a Winsor type IIsystem. At intermediate salinity, a Winsor type III system is observed with an ultra lowinterfacial tension. This system is difficult to obtain and to maintain in the porous media. Because of ultra low interfacial tension between the three phases, this system is not rec-ommended for DNAPL recovery.
The same changes in phase behavior are observed when alcohol is added to the water-NAPL system instead of salt. The methodology used to select surfactant solutions for a maximum NAPL-in-water microemulsion zone in phase diagrams is explained in detail elsewhere (Martel et al., 1993; Martel and Gélinas 1996). With this technique, washing solutions were developed to dissolve diesel and Aroclor 1248.
For heavy and viscous hydrocarbons, it could be advantageous to add solvents in the washing solution (Martel et al., 1998a). Different types of emulsions can be observed by changing the proportion of solvents in the surfactant/alcohol solutions (Fig. 3). Withthis approach, washing solutions were developed for the in situ recovery of a complex DNAPL mixtures including chlorinated solvents found in some Quebec contaminated sites.
Laboratory and field tests were performed using these solutions to recover residual NAPL in sediments and etched-glass micromodels. Surfactant washing experiments were done on (1) small sand columns (110g) contaminated with diesel, Aroclor 1248 and acomplex DNAPL mixture, (2) a large sand column (65 kg) contaminated with a complex
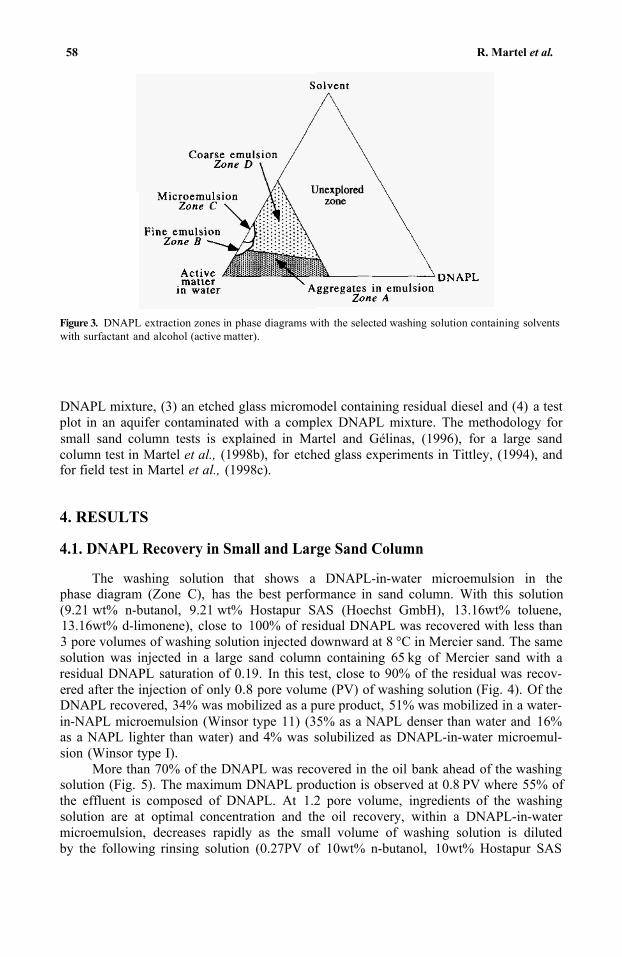
58 R. Martel et al.
Figure 3. DNAPL extraction zones in phase diagrams with the selected washing solution containing solventswith surfactant and alcohol (active matter).
DNAPL mixture, (3) an etched glass micromodel containing residual diesel and (4) a testplot in an aquifer contaminated with a complex DNAPL mixture. The methodology for small sand column tests is explained in Martel and Gélinas, (1996), for a large sand column test in Martel et al., (1998b), for etched glass experiments in Tittley, (1994), andfor field test in Martel et al., (1998c).
4. RESULTS
4.1. DNAPL Recovery in Small and Large Sand Column
The washing solution that shows a DNAPL-in-water microemulsion in the phase diagram (Zone C), has the best performance in sand column. With this solution(9.21 wt% n-butanol, 9.21 wt% Hostapur SAS (Hoechst GmbH), 13.16wt% toluene, 13.16wt% d-limonene), close to 100% of residual DNAPL was recovered with less than 3 pore volumes of washing solution injected downward at 8 °C in Mercier sand. The samesolution was injected in a large sand column containing 65 kg of Mercier sand with aresidual DNAPL saturation of 0.19. In this test, close to 90% of the residual was recov-ered after the injection of only 0.8 pore volume (PV) of washing solution (Fig. 4). Of the DNAPL recovered, 34% was mobilized as a pure product, 51% was mobilized in a water-in-NAPL microemulsion (Winsor type 11) (35% as a NAPL denser than water and 16% as a NAPL lighter than water) and 4% was solubilized as DNAPL-in-water microemul-sion (Winsor type I).
More than 70% of the DNAPL was recovered in the oil bank ahead of the washing solution (Fig. 5). The maximum DNAPL production is observed at 0.8 PV where 55% of the effluent is composed of DNAPL. At 1.2 pore volume, ingredients of the washing solution are at optimal concentration and the oil recovery, within a DNAPL-in-watermicroemulsion, decreases rapidly as the small volume of washing solution is diluted by the following rinsing solution (0.27PV of 10wt% n-butanol, 10wt% Hostapur SAS
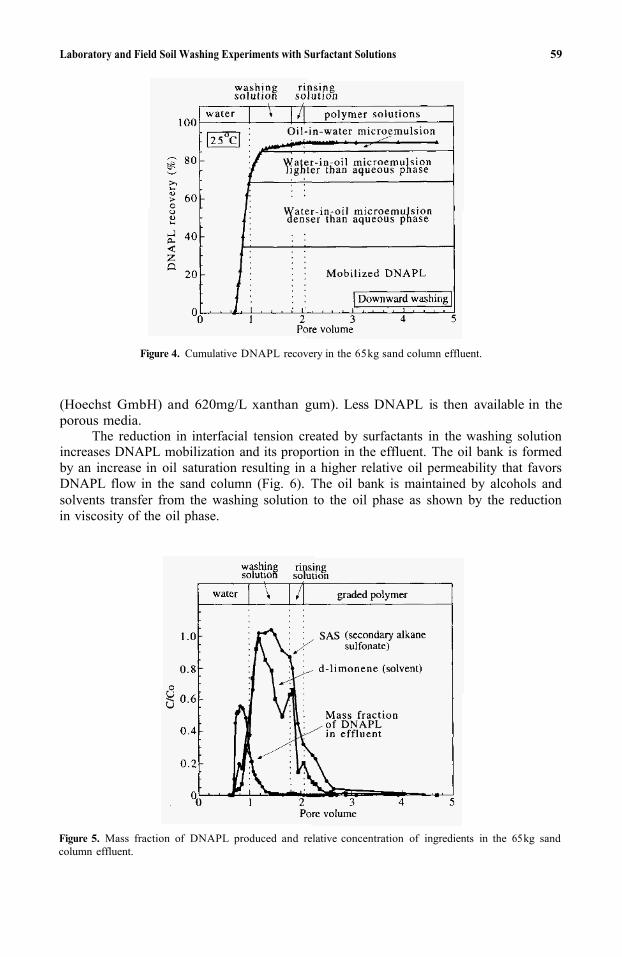
Laboratory and Field Soil Washing Experiments with Surfactant Solutions 59
Figure 4. Cumulative DNAPL recovery in the 65kg sand column effluent.
(Hoechst GmbH) and 620mg/L xanthan gum). Less DNAPL is then available in theporous media.
The reduction in interfacial tension created by surfactants in the washing solution increases DNAPL mobilization and its proportion in the effluent. The oil bank is formed by an increase in oil saturation resulting in a higher relative oil permeability that favors DNAPL flow in the sand column (Fig. 6). The oil bank is maintained by alcohols and solvents transfer from the washing solution to the oil phase as shown by the reduction in viscosity of the oil phase.
Figure 5. Mass fraction of DNAPL produced and relative concentration of ingredients in the 65kg sandcolumn effluent.
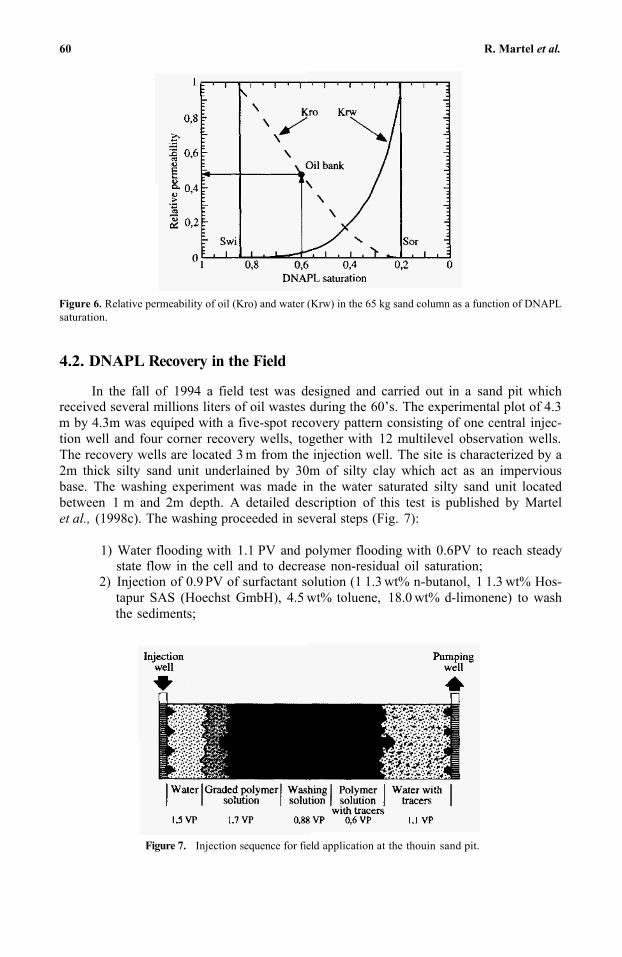
60 R. Martel et al.
Figure 6. Relative permeability of oil (Kro) and water (Krw) in the 65 kg sand column as a function of DNAPLsaturation.
4.2. DNAPL Recovery in the Field
In the fall of 1994 a field test was designed and carried out in a sand pit which received several millions liters of oil wastes during the 60’s. The experimental plot of 4.3 m by 4.3m was equiped with a five-spot recovery pattern consisting of one central injec-tion well and four corner recovery wells, together with 12 multilevel observation wells. The recovery wells are located 3 m from the injection well. The site is characterized by a 2m thick silty sand unit underlained by 30m of silty clay which act as an impervious base. The washing experiment was made in the water saturated silty sand unit located between 1 m and 2m depth. A detailed description of this test is published by Martelet al., (1998c). The washing proceeded in several steps (Fig. 7):
1) Water flooding with 1.1 PV and polymer flooding with 0.6PV to reach steady state flow in the cell and to decrease non-residual oil saturation;
2) Injection of 0.9 PV of surfactant solution (1 1.3 wt% n-butanol, 1 1.3 wt% Hos-tapur SAS (Hoechst GmbH), 4.5 wt% toluene, 18.0 wt% d-limonene) to wash the sediments;
Figure 7. Injection sequence for field application at the thouin sand pit.
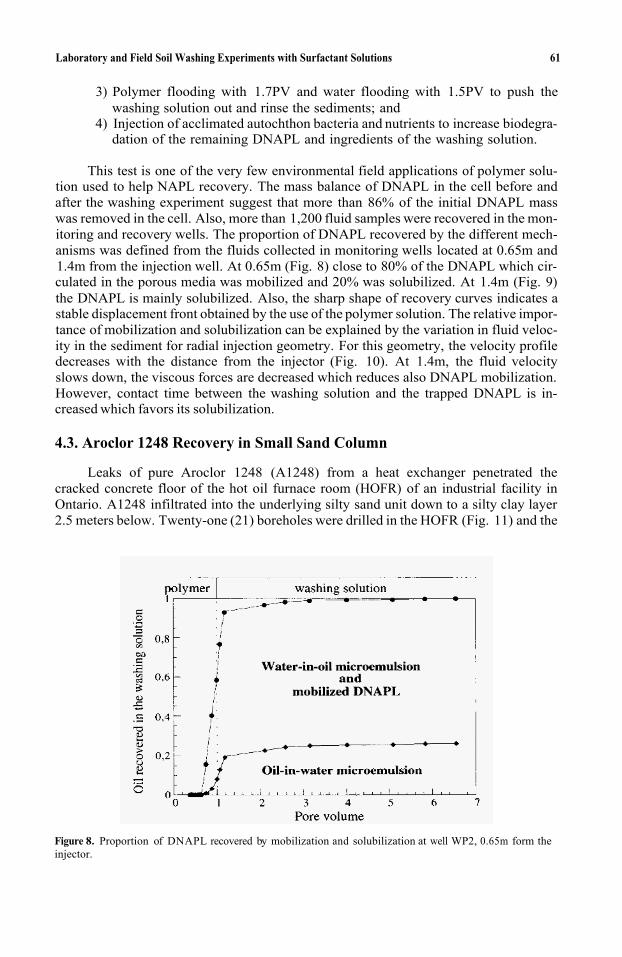
Laboratory and Field Soil Washing Experiments with Surfactant Solutions 61
3) Polymer flooding with 1.7PV and water flooding with 1.5PV to push thewashing solution out and rinse the sediments; and
4) Injection of acclimated autochthon bacteria and nutrients to increase biodegra-dation of the remaining DNAPL and ingredients of the washing solution.
This test is one of the very few environmental field applications of polymer solu-tion used to help NAPL recovery. The mass balance of DNAPL in the cell before and after the washing experiment suggest that more than 86% of the initial DNAPL masswas removed in the cell. Also, more than 1,200 fluid samples were recovered in the mon-itoring and recovery wells. The proportion of DNAPL recovered by the different mech-anisms was defined from the fluids collected in monitoring wells located at 0.65m and 1.4m from the injection well. At 0.65m (Fig. 8) close to 80% of the DNAPL which cir-culated in the porous media was mobilized and 20% was solubilized. At 1.4m (Fig. 9)the DNAPL is mainly solubilized. Also, the sharp shape of recovery curves indicates a stable displacement front obtained by the use of the polymer solution. The relative impor-tance of mobilization and solubilization can be explained by the variation in fluid veloc-ity in the sediment for radial injection geometry. For this geometry, the velocity profile decreases with the distance from the injector (Fig. 10). At 1.4m, the fluid velocity slows down, the viscous forces are decreased which reduces also DNAPL mobilization. However, contact time between the washing solution and the trapped DNAPL is in-creased which favors its solubilization.
4.3. Aroclor 1248 Recovery in Small Sand Column
Leaks of pure Aroclor 1248 (A1248) from a heat exchanger penetrated the cracked concrete floor of the hot oil furnace room (HOFR) of an industrial facility in Ontario. A1248 infiltrated into the underlying silty sand unit down to a silty clay layer 2.5 meters below. Twenty-one (21) boreholes were drilled in the HOFR (Fig. 11) and the
Figure 8. Proportion of DNAPL recovered by mobilization and solubilization at well WP2, 0.65m form theinjector.
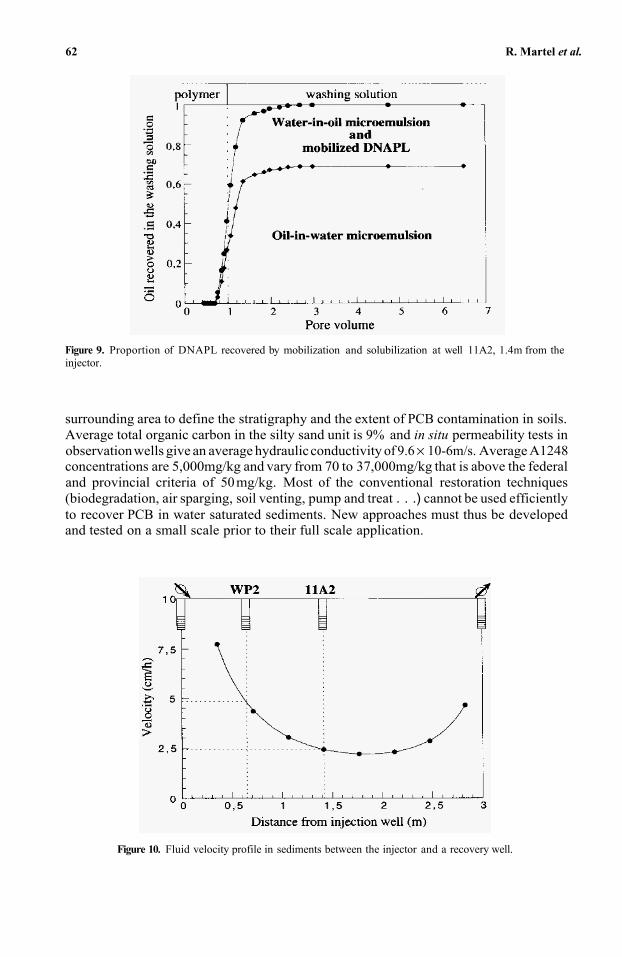
62 R. Martel et al.
Figure 9. Proportion of DNAPL recovered by mobilization and solubilization at well 11A2, 1.4m from theinjector.
surrounding area to define the stratigraphy and the extent of PCB contamination in soils. Average total organic carbon in the silty sand unit is 9% and in situ permeability tests inobservationwells give an average hydraulicconductivity of 9.6 × 10⁻⁶m/s. Average A1248concentrations are 5,000mg/kg and vary from 70 to 37,000mg/kg that is above the federal and provincial criteria of 50mg/kg. Most of the conventional restoration techniques (biodegradation, air sparging, soil venting, pump and treat . . .) cannot be used efficiently to recover PCB in water saturated sediments. New approaches must thus be developed and tested on a small scale prior to their full scale application.
Figure 10. Fluid velocity profile in sediments between the injector and a recovery well.
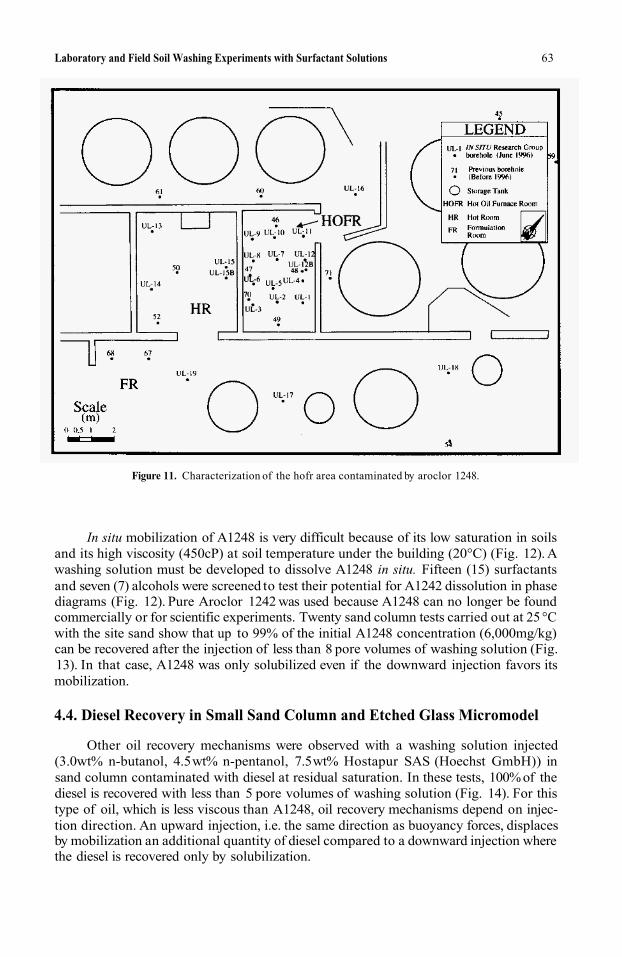
Laboratory and Field Soil Washing Experiments with Surfactant Solutions 63
Figure 11. Characterization of the hofr area contaminated by aroclor 1248.
In situ mobilization of A1248 is very difficult because of its low saturation in soilsand its high viscosity (450cP) at soil temperature under the building (20°C) (Fig. 12). Awashing solution must be developed to dissolve A1248 in situ. Fifteen (15) surfactantsand seven (7) alcohols were screened to test their potential for A1242 dissolution in phasediagrams (Fig. 12). Pure Aroclor 1242 was used because A1248 can no longer be foundcommercially or for scientific experiments. Twenty sand column tests carried out at 25 °Cwith the site sand show that up to 99% of the initial A1248 concentration (6,000mg/kg)can be recovered after the injection of less than 8 pore volumes of washing solution (Fig.13). In that case, A1248 was only solubilized even if the downward injection favors itsmobilization.
4.4. Diesel Recovery in Small Sand Column and Etched Glass Micromodel
Other oil recovery mechanisms were observed with a washing solution injected(3.0wt% n-butanol, 4.5wt% n-pentanol, 7.5wt% Hostapur SAS (Hoechst GmbH)) insand column contaminated with diesel at residual saturation. In these tests, 100% of thediesel is recovered with less than 5 pore volumes of washing solution (Fig. 14). For thistype of oil, which is less viscous than A1248, oil recovery mechanisms depend on injec-tion direction. An upward injection, i.e. the same direction as buoyancy forces, displacesby mobilization an additional quantity of diesel compared to a downward injection wherethe diesel is recovered only by solubilization.
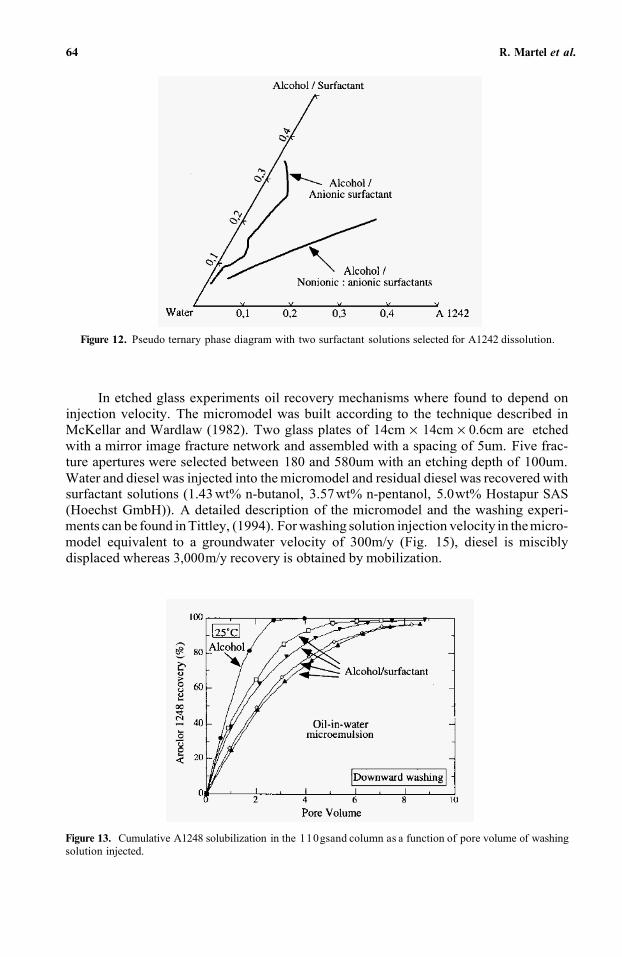
64 R. Martel et al.
Figure 12. Pseudo ternary phase diagram with two surfactant solutions selected for A1242 dissolution.
In etched glass experiments oil recovery mechanisms where found to depend on injection velocity. The micromodel was built according to the technique described in McKellar and Wardlaw (1982). Two glass plates of 14cm × 14cm × 0.6cm are etchedwith a mirror image fracture network and assembled with a spacing of 5um. Five frac-ture apertures were selected between 180 and 580um with an etching depth of 100um. Water and diesel was injected into the micromodel and residual diesel was recovered with surfactant solutions (1.43 wt% n-butanol, 3.57wt% n-pentanol, 5.0wt% Hostapur SAS(Hoechst GmbH)). A detailed description of the micromodel and the washing experi-ments can be found in Tittley, (1994). For washing solution injection velocity in the micro-model equivalent to a groundwater velocity of 300m/y (Fig. 15), diesel is misciblydisplaced whereas 3,000 m/y recovery is obtained by mobilization.
Figure 13. Cumulative A1248 solubilization in the 110gsand column as a function of pore volume of washingsolution injected.
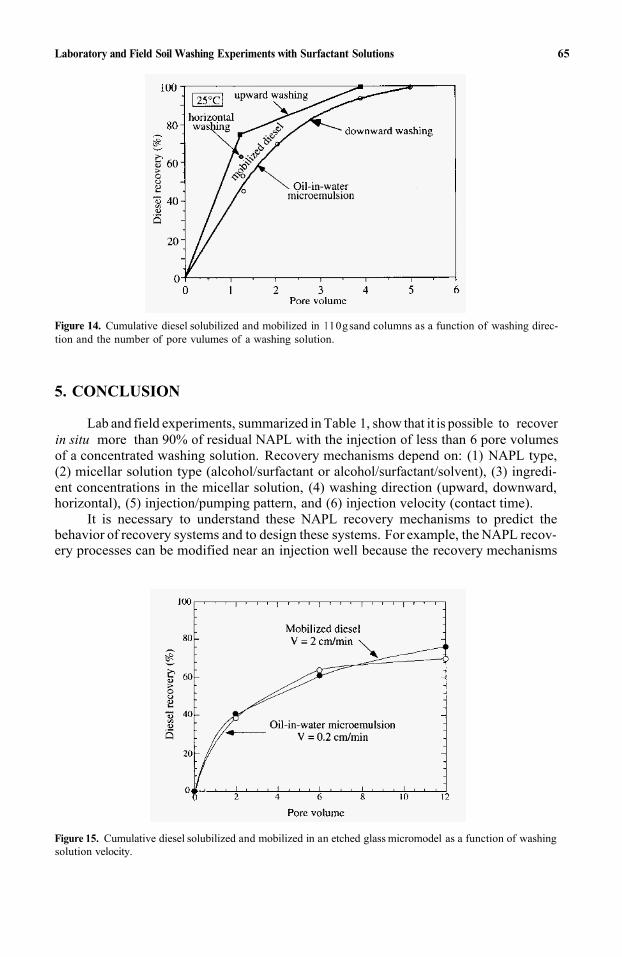
Laboratory and Field Soil Washing Experiments with Surfactant Solutions 65
Figure 14. Cumulative diesel solubilized and mobilized in 110gsand columns as a function of washing direc-tion and the number of pore vulumes of a washing solution.
5. CONCLUSION
Lab and field experiments, summarized in Table 1, show that it is possible to recoverin situ more than 90% of residual NAPL with the injection of less than 6 pore volumesof a concentrated washing solution. Recovery mechanisms depend on: (1) NAPL type,(2) micellar solution type (alcohol/surfactant or alcohol/surfactant/solvent), (3) ingredi-ent concentrations in the micellar solution, (4) washing direction (upward, downward, horizontal), (5) injection/pumping pattern, and (6) injection velocity (contact time).
It is necessary to understand these NAPL recovery mechanisms to predict the behavior of recovery systems and to design these systems. For example, the NAPL recov-ery processes can be modified near an injection well because the recovery mechanisms
Figure 15. Cumulative diesel solubilized and mobilized in an etched glass micromodel as a function of washingsolution velocity.
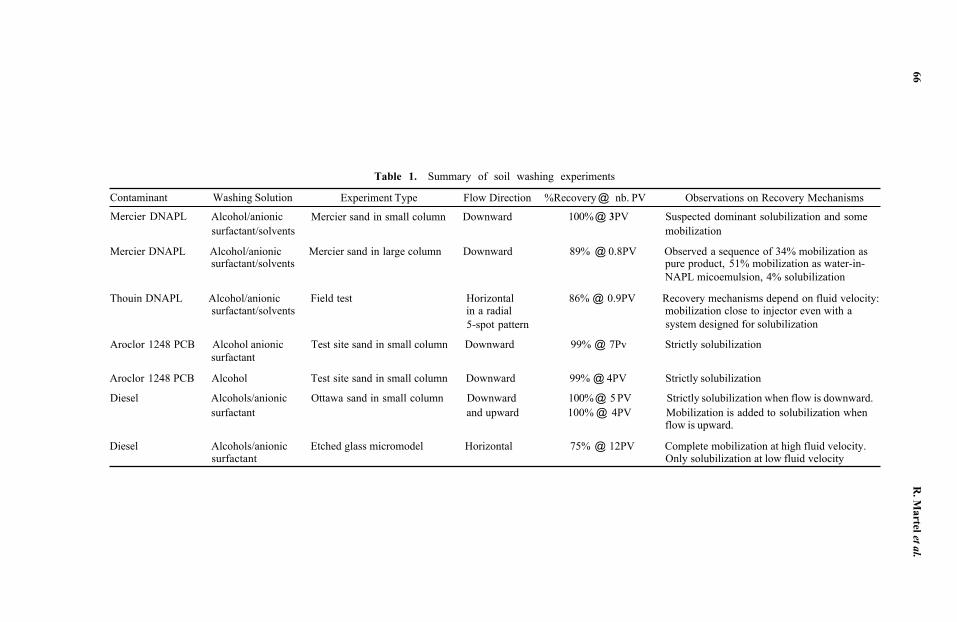
Table 1. Summary of soil washing experiments
Contaminant Washing Solution Experiment Type Flow Direction %Recovery @ nb. PV Observations on Recovery Mechanisms
Mercier DNAPL Alcohol/anionic Mercier sand in small column Downward 100%@ 3PV Suspected dominant solubilization and some
Mercier DNAPL Alcohol/anionic Mercier sand in large column Downward 89% @ 0.8PV Observed a sequence of 34% mobilization as pure product, 51% mobilization as water-in-NAPL micoemulsion, 4% solubilization
surfactant/solvents mobilization
surfactant/solvents
Thouin DNAPL Alcohol/anionic Field test Horizontal 86% @ 0.9PV Recovery mechanisms depend on fluid velocity: in a radial 5-spot pattern
surfactant/solvents mobilization close to injector even with a system designed for solubilization
Aroclor 1248 PCB Alcohol anionic Test site sand in small column Downward 99% @ 7Pv Strictly solubilization
Aroclor 1248 PCB Alcohol Test site sand in small column Downward 99% @ 4PV Strictly solubilization
Diesel Alcohols/anionic Ottawa sand in small column Downward 100%@ 5 PV Strictly solubilization when flow is downward.
surfactant
surfactant and upward 100% @ 4PV Mobilization is added to solubilization when
Diesel Alcohols/anionic Etched glass micromodel Horizontal 75% @ 12PV Complete mobilization at high fluid velocity.
flow is upward.
Only solubilization at low fluid velocity surfactant
66 R
. Martel et al.
Laboratory and Field Soil Washing Experiments with Surfactant Solutions 67
are a function of fluid velocity. This may have important implications during DNAPL recovery where vertical mobilization of the DNAPL may occur deeper in the aquifer even if the system was developed to dissolve the DNAPL.
ACKNOWLEDGMENTS
This project was funded by the DESERT Program (Development and Demonstra-tion of Site Remediation Technologies) of the Quebec Ministry of Environment and Wildlife and Environment Canada, by DOMTAR Inc. and the National Research Council of Canada through a University-Industry grant.
REFERENCES
Lake, L.W., 1989. Enhanced Oil Recovery. Prentice Hall, Englewood Cliffs, NJ. 550 pp. Martel, R., Gélinas, P.J. Desnoyers, J.E. and Masson, A. 1993. Phase diagrams to optimize surfactant solutions
for oil and DNAPL recovery in aquifers. Ground Water. v. 31, no. 5, pp. 789-800.Martel, R. and P.J. Gélinas. 1996. Surfactant solutions developed for NAPL recovery in contaminated aquifers.
Ground Water. v. 34, no. 1, pp. 143-154.Martel, R., P.J. Gélinas, and J.E. Desnoyers. 1998a. Aquifer washing by micellar solutions: 1-Optimization of
alcoho/surfactant/solvent solutions. Journal of Contaminant Hydrology. V. 29, pp. 3 19-346.Martel, R., R. Lefebvre, and P.J. Gélinas. 1998b. Aquifer washing by micellar solutions: 2-DNAPL recovery
mechanisms for an optimized alcohol/surfactant/solvent solution. Journal of Contaminant Hydrology.
Martel, R., P.J. Gélinas, and L. Saumure. 1998c. Aquifer washing by micellar solutions: 3-Field test at the Thouin sand pit (L'Assomption, Quebec, Canada). Journal of Contaminant Hydrology. V. 30, pp. 33-48.
Martel, K.E., R. Martel, R. Lefebvre, and P.J. Gélinas. 1998. Polymer solutions used to improve in situ NAPLrecovery in polluted aquifers: A laboratory evaluation. Ground Water Monitoring and Remediation. Summer pp. 103-113.
McKellar, M. and N.C. Wardlaw. 1982. A method of making two-dimensional glass micromodels of pore systems, The Journal of Canadian Petroleum Technology, July-August pp. 3941.
Roy, N., R. Martel, and P.J. Gélinas. 1995. Laboratory assessment of surfactant biodegradation in aquifers under denitrifying conditions. In: 5th Annual Symposium on Groundwater and Soil Remediation. Toronto, Ontario, October 2-5, 1995.
Tittley, M. 1994. Study of Diesel and Surfactant Solution Behavior in a Fractured Bedrock Aquifer, Using Glass Micromodels. M.Sc. Thesis. Department of Geological Engineering, Laval University, Quebec, Canada, 103 pp.
V. 30, pp. 1-31.

This page intentionally left blank.
7
ANAEROBIC MICROBIAL ACTIVITY UNDERELECTRIC FIELDS
Krishnanand Maillacheruvu1 and Akram N. Alshawabkeh2
1Assistant ProfessorDepartment of Civil Engineering and ConstructionBradley UniversityPeoria, Illinois
2Assistant ProfessorDepartment of Civil and Environmental EngineeringNortheastern UniversityBoston, Massachusetts
ABSTRACT
The impact of electric fields on some environmental conditions and on the activity of anaerobic microorganisms was investigated in this study. Experiments were conducted in plexiglass chambers with coated titanium mesh electrodes mounted on either end. Elec-tric fields of 1.5V/cm through 6V/cm were applied. Anaerobic cultures (primarily a con-sortium with methane producing bacteria) obtained from a mesophilic digester from the Redhook Wastewater Treatment Plant, Brooklyn, were used in these experiments. Results indicated that the pH decreased to as low as 4.5 even under completely mixed conditions in fed-batch reactors, if pH-control measures were not in place. Microbial activity, mea-sured as a function of the ability of the anaerobic microorganisms to consume readily degradable acetate, generally decreased as expected if the pH and dissolved oxygen were not controlled. Using sodium sulfite slightly in excess of the stoichiometric amount and sodium bicarbonate, both pH variation as well as oxygen generation were adequately con-trolled. Microbial activity initially decreased under exposure to electric current but recov-ered after a period of several hours of exposure, suggesting a degree of acclimation of the anaerobic culture to the electric current.
INTRODUCTION
Economical restoration of contaminated soils to environmentally acceptable con-ditions is an important challenge facing the scientific and technical community. Many
Emerging Technologies in Hazardous Waste Management 8, edited by Tedder and PohlandKluwer Academic/ Plenum Publishers, New York, 2000. 69
70 K. Maillacheruvu and A. N. Alshawabkeh
current in situ soil remediation technologies as well as pump-and-treat and vacuum extraction technologies depend on hydraulic and air flow for effective remediation of soils. These technologies are not as effective in the clean-up of lower hydraulic conduc-tivity (less than 10-5cm/sec), such as fine sands, silts and clays. Soil heterogeneities will also limit the feasibility of remediation by hydraulic and/or airflow. In situ bioremedia-tion is an attractive and often cost-effective option to remediate contaminated soils and groundwater. However, successful implementation of in situ bioremediation isdependentupon presence, or effective injection, of electron acceptors and nutrients into the porous medium. Effective introduction and transport of electron acceptors and nutrients is hin-dered by low soil permeabilities, preferential flow paths (channeling), soil heterogeneity, biological utilization, and chemical reactions in the soil. Several surveys have concludedthat this ineffective transport of remediation additives is the primary cause of systemfailure for some in situ bioremediation efforts (Zappi et al., 1993; NRC 1993). Compli-cations of site geohydrology, additive transport and associated reactions, coupled with the observed inefficiency in the field, have usually been approached by gross overinjec-tion. Excessive dosing combined with the shortcomings of the hydraulically driven trans-port processes can result in elevated remedial costs, potential for gas binding, andexcessive biological growth (biofouling). A technology for uniform introduction of elec-tron acceptors and nutrients has been the principal bottleneck in the successful field implementation of in situ bioremediation (Zappi et al., 1993).
Electric fields can be used to overcome injection problems associated with aquiferheterogeneities and low permeabilities. Migration of charged additives (including elec-tron acceptors and nutrients) under electric fields can result in uniform and efficient intro-duction of these additives to stimulate in situ bioremediation in the contaminated zone. Recent research has shown that ion migration through soil pore fluid under applied direct current can be substantial. Acar and Alshawabkeh (1993) demonstrated effective ion transport on the order of 5 to 10cmdday under a 1 volt/cm electric field in kaolinite soil samples with hydraulic conductivity in the order of 10–7cm/sec. However, application ofelectric current in saturated soils may result in significant changes in the environmental conditions including pH, temperature, and geochemistry. These environmental changes will potentially impact microbial activity and thus the efficiency of bioremediation of target contaminants. Several factors, including electrolysis reactions at the electrodes, transport processes under electric fields, and microbial adhesion, transport, and growth under electric fields may affect the success of enhancing bioremediation by injection of electron acceptors and nutrients under electric fields. A schematic of possible field imple-mentation of enhancing bioremediation by electric fields is presented in Fig. 1. This paper will briefly review of the impacts of electric fields on pH and geochemistry, and present the results of a study investigating the impact of electric field intensity on the behavior of anaerobic microorganisms under electric fields using completely mixed biore-actor systems to eliminate soil heterogenity effects and other complicating factors identified above.
BACKGROUND
The use of electric fields has emerged as an innovative method for in situ restoration of contaminated hazardous waste sites. This technique uses low-level direct current on the order of few Amps per square meter of cross-sectional area between the electrodes or an electric potential difference on the order of a few volts per cm across electrodes placed in
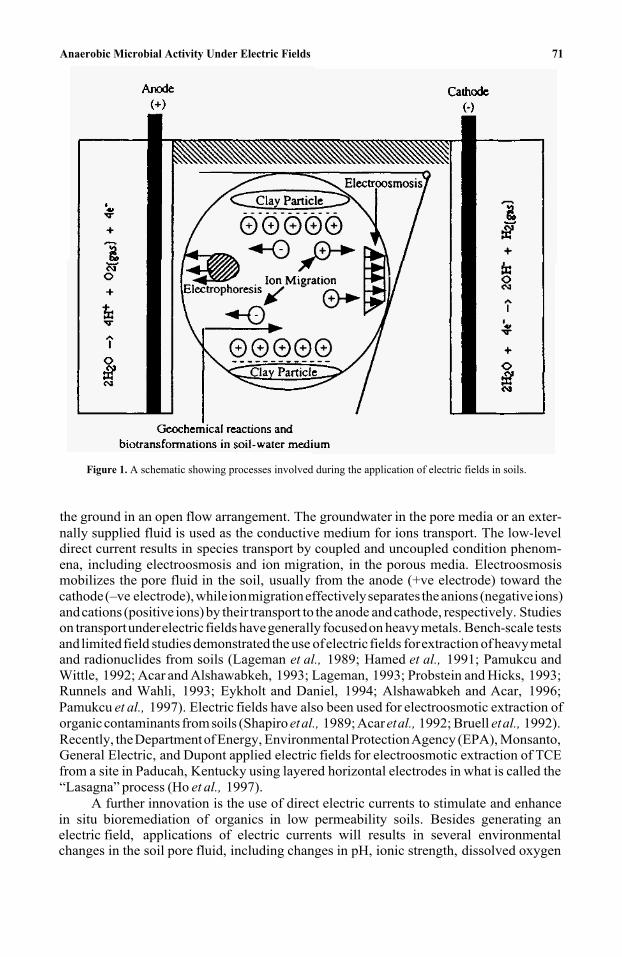
Anaerobic Microbial Activity Under Electric Fields 71
Figure 1. A schematic showing processes involved during the application of electric fields in soils.
the ground in an open flow arrangement. The groundwater in the pore media or an exter-nally supplied fluid is used as the conductive medium for ions transport. The low-leveldirect current results in species transport by coupled and uncoupled condition phenom-ena, including electroosmosis and ion migration, in the porous media. Electroosmosis mobilizes the pore fluid in the soil, usually from the anode (+ve electrode) toward the cathode(–ve electrode), whileionmigrationeffectivelyseparates theanions (negativeions)and cations (positive ions) by their transport to the anode and cathode, respectively. Studies on transport under electric fields have generally focused on heavy metals. Bench-scale tests and limited field studies demonstrated the use of electric fields for extraction of heavy metal and radionuclides from soils (Lageman et al., 1989; Hamed et al., 1991; Pamukcu and Wittle, 1992; Acar and Alshawabkeh, 1993; Lageman, 1993; Probstein and Hicks, 1993; Runnels and Wahli, 1993; Eykholt and Daniel, 1994; Alshawabkeh and Acar, 1996; Pamukcu et al., 1997). Electric fields have also been used for electroosmotic extraction of organic contaminants from soils (Shapiro et al., 1989; Acar et al., 1992; Bruell et al., 1992).Recently, the Department of Energy, Environmental Protection Agency (EPA), Monsanto, General Electric, and Dupont applied electric fields for electroosmotic extraction of TCEfrom a site in Paducah, Kentucky using layered horizontal electrodes in what is called the “Lasagna” process (Ho et al., 1997).
A further innovation is the use of direct electric currents to stimulate and enhancein situ bioremediation of organics in low permeability soils. Besides generating an electric field, applications of electric currents will results in several environmental changes in the soil pore fluid, including changes in pH, ionic strength, dissolved oxygen
72 K. Maillacheruvu and A. N. Alshawabkeh
concentration, and temperature. Most of these environmental changes result from elec-trolysis reactions at the electrodes. It is well established that application of electric cur-rents through electrodes immersed in water cause oxidation at the anode and reduction at the cathode as described in the following reactions,
2H2O 4H++O2+4e– (Anode)
2H2O + 2e- 2OH– + H2 (Cathode)
Acid is produced at the anode, dropping the pH to around 2, and a base isintroduced at the cathode, increasing the pH to around 10–12. Unless these pH changes are neutralized, extreme environmental conditions are produced, limiting microbial growth and biotransformation. Further, oxygen gas is one of the products of electroly-sis reaction at the anode, which will also affect the anaerobic microbial growth. Substrate utilization is usually an indication of microbial growth. The conventional theory of sub-strate utilization by microorganisms is based on the bioavailability of contaminants, pres-ence of the appropriate microbial consortia, temperature, pH and adequate time of contact. Optimum pH for bacterial growth is near neutral, with pH range for growth between 5 and 9 (Gaudy and Gaudy, 1988). Acar et al. (1996, 1997) showed that it is possible to inject ammonium and sulfate ions (as electron acceptors) in fine sand and kaolinite at rates of about 5 to 20cm/day under electric fields and also neutralize the electrolyte pH by addition of basic/acidic species at the electrodes. A combination of several of these techniques may offer some potential for in situ bioremediation under electric fields.
Most microorganisms grow rapidly at temperatures between 20 °C and 45 °C and are capable of growing over a range of 30°C to 40°C (Gaudy and Gaudy, 1988). An increase in temperature above 45 °C will significantly limit the growth of most microbes (some could survive high temperatures). Temperature increase due to current applica-tion will depend upon field strength and resistivity of the medium. Acar and Alshawabkeh (1996) reported 10°C increase in temperature in an unenhanced (no addi-tives were used to control electrolyte pH changes) large-scale test on extraction of lead from kaolinite.
Additionally, the dependency of reversible sorption of bacteria on charge/electro-static interactions indicates that an applied electric field may play a significant role in bac-terial adhesion and transport in subsurface environments. As microbes are generally negatively charged, they will migrate under electric fields by electrophoresis. The role of bacterial surface itself (e.g., lipid content and surface charge) could influence the elec-trophoretic mobility of bacteria in porous media. However, it should be noted that trans-port of microorganisms might not be strictly governed by electrophoresis alone, since microorganisms, as living entities, may be subject to other influences or “attractors.” Studies that investigate bioremediation by electric fields are rare. DeFlaunn and Condee (1997) demonstrated the possibility of pure bacterial cultures transport in bench-scale soil samples under application of an electric current. While it is clear that bacteria could be transported by electrophoresis, it is necessary to assess what electric field inten-sity they can sustain and what effects the electric field may have on the activity of the microorganisms.
While complex environmental changes in the soil pores under electric fields will impact microbial behavior; this study was targeted at investigation of the impact of electric fields on the activity of unacclimated anaerobic consortia. The selection of
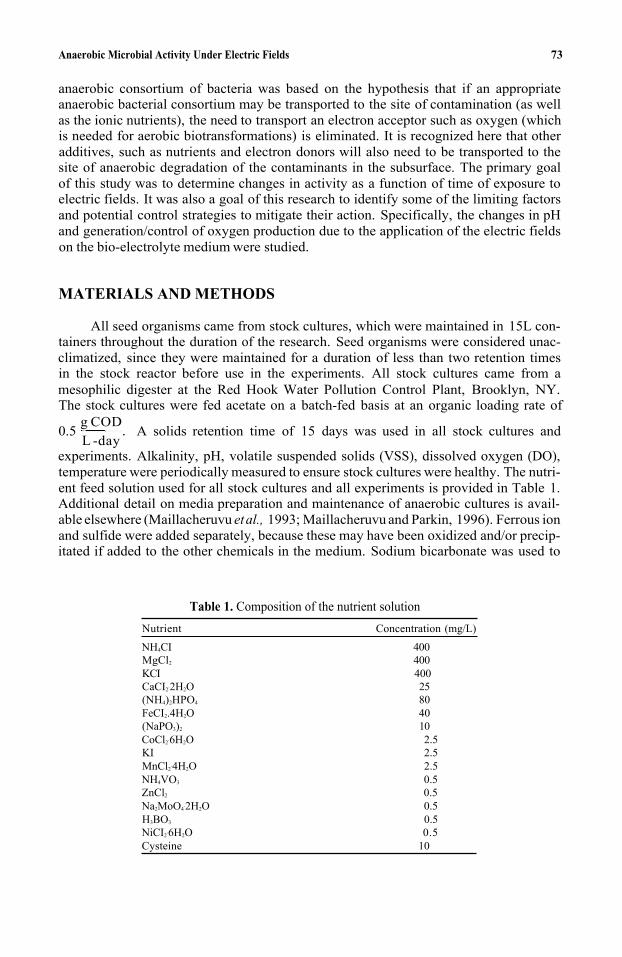
Anaerobic Microbial Activity Under Electric Fields 73
anaerobic consortium of bacteria was based on the hypothesis that if an appropriate anaerobic bacterial consortium may be transported to the site of contamination (as well as the ionic nutrients), the need to transport an electron acceptor such as oxygen (which is needed for aerobic biotransformations) is eliminated. It is recognized here that other additives, such as nutrients and electron donors will also need to be transported to the site of anaerobic degradation of the contaminants in the subsurface. The primary goal of this study was to determine changes in activity as a function of time of exposure to electric fields. It was also a goal of this research to identify some of the limiting factors and potential control strategies to mitigate their action. Specifically, the changes in pH and generation/control of oxygen production due to the application of the electric fields on the bio-electrolyte medium were studied.
MATERIALS AND METHODS
All seed organisms came from stock cultures, which were maintained in 15L con-tainers throughout the duration of the research. Seed organisms were considered unac-climatized, since they were maintained for a duration of less than two retention times in the stock reactor before use in the experiments. All stock cultures came from a mesophilic digester at the Red Hook Water Pollution Control Plant, Brooklyn, NY.The stock cultures were fed acetate on a batch-fed basis at an organic loading rate of
0.5 . A solids retention time of 15 days was used in all stock cultures and
experiments. Alkalinity, pH, volatile suspended solids (VSS), dissolved oxygen (DO),temperature were periodically measured to ensure stock cultures were healthy. The nutri-ent feed solution used for all stock cultures and all experiments is provided in Table 1.Additional detail on media preparation and maintenance of anaerobic cultures is avail-able elsewhere (Maillacheruvu etal., 1993; Maillacheruvu and Parkin, 1996). Ferrous ionand sulfide were added separately, because these may have been oxidized and/or precip-itated if added to the other chemicals in the medium. Sodium bicarbonate was used to
g CODL -day
Table 1. Composition of the nutrient solution Nutrient Concentration (mg/L)
NH4CI 400MgCl2 400KCI 400CaCI2
.2H2O 25(NH4)2HPO4 80FeCI2.4H2O 40 (NaPO3)2 10CoCl2
.6H2O 2.5KI 2.5MnCl2
.4H2O 2.5 NH4VO3 0.5ZnCl2 0.5Na2MoO4
.2H2O 0.5H3BO3 0.5NiCI2
.6H2O 0.5Cysteine 10
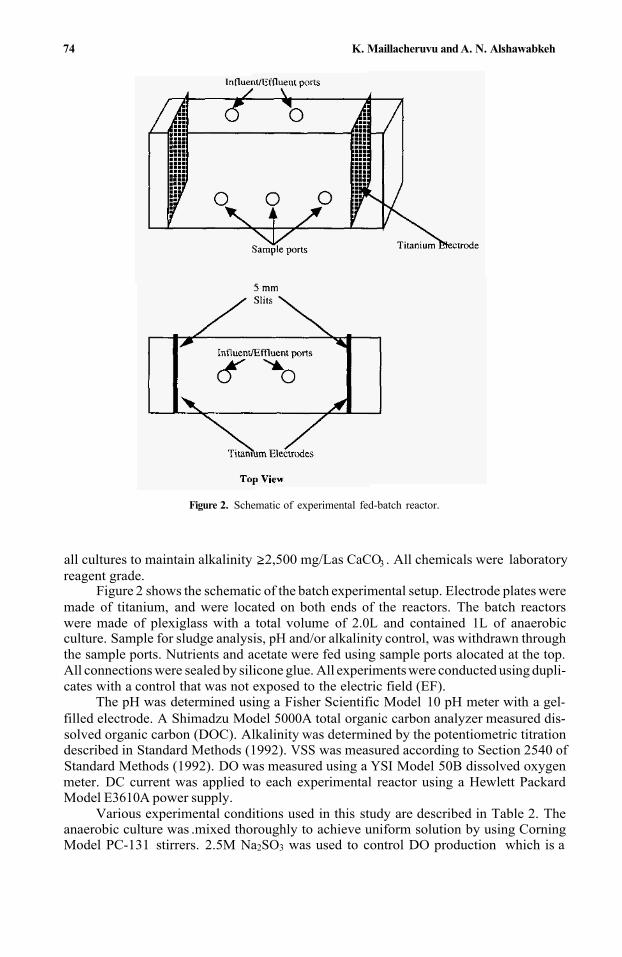
74 K. Maillacheruvu and A. N. Alshawabkeh
Figure 2. Schematic of experimental fed-batch reactor.
all cultures to maintain alkalinity 3reagent grade.
Figure 2 shows the schematic of the batch experimental setup. Electrode plates weremade of titanium, and were located on both ends of the reactors. The batch reactors were made of plexiglass with a total volume of 2.0L and contained 1L of anaerobicculture. Sample for sludge analysis, pH and/or alkalinity control, was withdrawn through the sample ports. Nutrients and acetate were fed using sample ports alocated at the top. All connections were sealed by silicone glue. All experiments were conducted using dupli-cates with a control that was not exposed to the electric field (EF).
The pH was determined using a Fisher Scientific Model 10 pH meter with a gel-filled electrode. A Shimadzu Model 5000A total organic carbon analyzer measured dis-solved organic carbon (DOC). Alkalinity was determined by the potentiometric titrationdescribed in Standard Methods (1992). VSS was measured according to Section 2540 ofStandard Methods (1992). DO was measured using a YSI Model 50B dissolved oxygen meter. DC current was applied to each experimental reactor using a Hewlett Packard Model E3610A power supply.
Various experimental conditions used in this study are described in Table 2. The anaerobic culture was .mixed thoroughly to achieve uniform solution by using Corning Model PC-131 stirrers. 2.5M Na2SO3 was used to control DO production which is a
2,500 mg/Las CaCO . All chemicals were laboratory
Anaerobic Microbial Activity Under Electric Fields 75
Table 2. Experimental ConditionsDescription
Experiment Electric Field Strength Na2SO3 NaHCO3
Control A None YES YES Control B None NO YES A. 1 3.0V/cm YES YES A.2 6.0V/cm YES YES A.3 6.0V/cm NO YES B. 1 1.5V/cm YES YES B.2 4.5 V/cm YES YES B.3 4.5 V/cm NO YES C.1 1.5V/cm NO YESC.2 1.5V/CM YES NO
byproduct of the electrochemical reactions taking place in an electrolyte medium. After a brief startup period of five-six days (although not enough to reach steady state), batch reactor experiments were begun. The current, pH, and the electric potential differences were monitored on a continuous basis. After one day of current application, the anaer-obic culture that was pumped out using a B-D 10-ml syringe for in situ pH, VSS, andDOC analysis was separated into two parts. One part of the sample was immediately analyzed (designated the “to sample”) for DOC concentration while the other part allowed to “recover” for a period of 24 hours in an evacuated glass vial to preserve anaerobic conditions. After 24 hours had elapsed the DOC was measured again. The second part of the sample was designated the “t24 sample”. This process was carried out throughout the duration of the experiments, both in the presence and in the absence of electric current. Filtered samples were acidified using 2.0 N HCI to a pH of about 3,prior to DOC analysis. All DOC analyses were conducted using a Shimadzu TOC 5000A analyzer.
RESULTS AND DISCUSSION
The effect of electric current on environmental conditions such as pH and dissolved oxygen was evaluated. It was found that even in a completely mixed batch reactor system used in this study, the pH decreased rapidly at first and reached a value of between 4.5 and 4.8 after 48 hours of exposure. This is significant since the pH needs to be buffered around 7.0 for most biological systems, and particularly anaerobic bacteria other than acid-formers. A concomitant drop in the alkalinity was also observed during this period. These results are interesting since the hydroxyl ion production and hydrogen ion (H+)production would be expected to cancel each other out and result in a near-zero change in pH. One explanation for this result may be that the hydroxyl ions are either complexed or eliminated from the solution before reacting with the hydrogen ion. In the experimental reactors, pH buffering was achieved through use of NaHCO3 and keeping the alkalinity levels at around 2,500 to 3,500mg/L as CaCO3. In actual soils, depending on the buffer-ing capacity available as carbonate salts, additional amounts of bicarbonate or other appropriate buffer needs to be used (injected). This is consistent with the results obtained on acid front movement in soils being treated with electrokinetic techniques.
Dissolved oxygen was produced in the reactor and was found to be proportional to the amount of electric current. This is consistent with the theory of electrokinetic
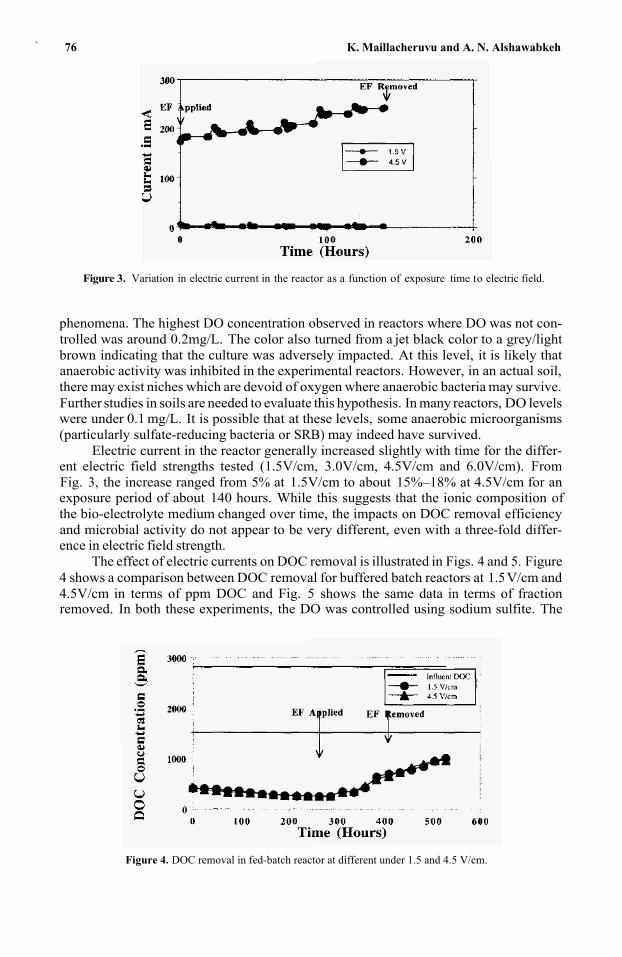
-76 K. Maillacheruvu and A. N. Alshawabkeh
Figure 3. Variation in electric current in the reactor as a function of exposure time to electric field.
phenomena. The highest DO concentration observed in reactors where DO was not con-trolled was around 0.2mg/L. The color also turned from a jet black color to a grey/light brown indicating that the culture was adversely impacted. At this level, it is likely that anaerobic activity was inhibited in the experimental reactors. However, in an actual soil, there may exist niches which are devoid of oxygen where anaerobic bacteria may survive. Further studies in soils are needed to evaluate this hypothesis. In many reactors, DO levelswere under 0.1 mg/L. It is possible that at these levels, some anaerobic microorganisms (particularly sulfate-reducing bacteria or SRB) may indeed have survived.
Electric current in the reactor generally increased slightly with time for the differ-ent electric field strengths tested (1.5V/cm, 3.0V/cm, 4.5V/cm and 6.0V/cm). From Fig. 3, the increase ranged from 5% at 1.5V/cm to about 15%–18% at 4.5V/cm for an exposure period of about 140 hours. While this suggests that the ionic composition of the bio-electrolyte medium changed over time, the impacts on DOC removal efficiency and microbial activity do not appear to be very different, even with a three-fold differ-ence in electric field strength.
The effect of electric currents on DOC removal is illustrated in Figs. 4 and 5. Figure4 shows a comparison between DOC removal for buffered batch reactors at 1.5V/cm and 4.5V/cm in terms of ppm DOC and Fig. 5 shows the same data in terms of fraction removed. In both these experiments, the DO was controlled using sodium sulfite. The
Figure 4. DOC removal in fed-batch reactor at different under 1.5 and 4.5 V/cm.
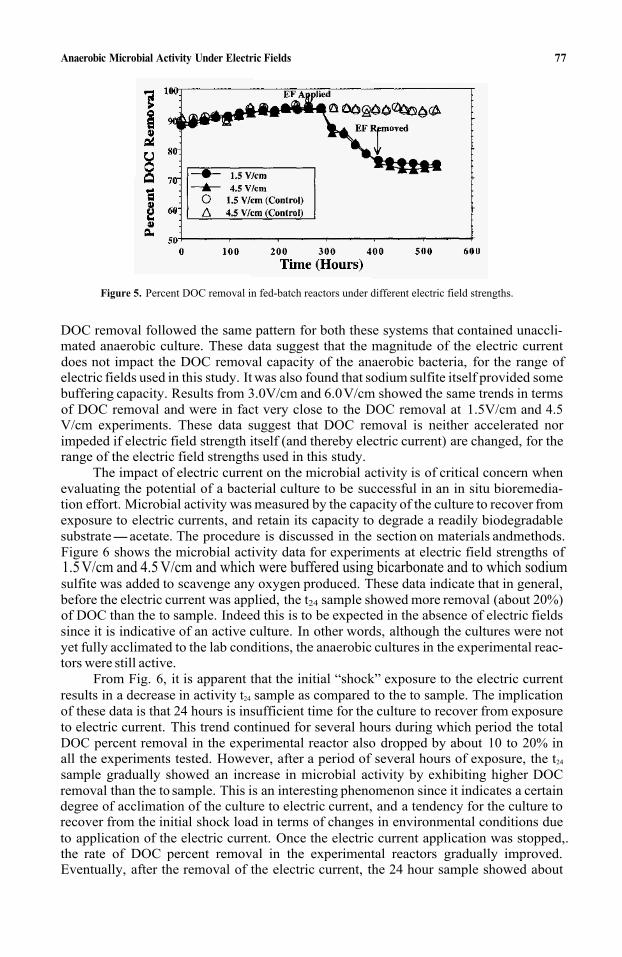
Anaerobic Microbial Activity Under Electric Fields 77
Figure 5. Percent DOC removal in fed-batch reactors under different electric field strengths.
DOC removal followed the same pattern for both these systems that contained unaccli-mated anaerobic culture. These data suggest that the magnitude of the electric current does not impact the DOC removal capacity of the anaerobic bacteria, for the range of electric fields used in this study. It was also found that sodium sulfite itself provided somebuffering capacity. Results from 3.0V/cm and 6.0V/cm showed the same trends in terms of DOC removal and were in fact very close to the DOC removal at 1.5V/cm and 4.5V/cm experiments. These data suggest that DOC removal is neither accelerated nor impeded if electric field strength itself (and thereby electric current) are changed, for the range of the electric field strengths used in this study.
The impact of electric current on the microbial activity is of critical concern when evaluating the potential of a bacterial culture to be successful in an in situ bioremedia-tion effort. Microbial activity was measured by the capacity of the culture to recover fromexposure to electric currents, and retain its capacity to degrade a readily biodegradable substrate-acetate. The procedure is discussed in the section on materials andmethods.Figure 6 shows the microbial activity data for experiments at electric field strengths of 1.5V/cm and 4.5 V/cm and which were buffered using bicarbonate and to which sodiumsulfite was added to scavenge any oxygen produced. These data indicate that in general, before the electric current was applied, the t24 sample showed more removal (about 20%)of DOC than the to sample. Indeed this is to be expected in the absence of electric fields since it is indicative of an active culture. In other words, although the cultures were notyet fully acclimated to the lab conditions, the anaerobic cultures in the experimental reac-tors were still active.
From Fig. 6, it is apparent that the initial “shock” exposure to the electric current results in a decrease in activity t24 sample as compared to the to sample. The implication of these data is that 24 hours is insufficient time for the culture to recover from exposureto electric current. This trend continued for several hours during which period the total DOC percent removal in the experimental reactor also dropped by about 10 to 20% inall the experiments tested. However, after a period of several hours of exposure, the t24
sample gradually showed an increase in microbial activity by exhibiting higher DOC removal than the to sample. This is an interesting phenomenon since it indicates a certain degree of acclimation of the culture to electric current, and a tendency for the culture to recover from the initial shock load in terms of changes in environmental conditions due to application of the electric current. Once the electric current application was stopped,. the rate of DOC percent removal in the experimental reactors gradually improved. Eventually, after the removal of the electric current, the 24 hour sample showed about
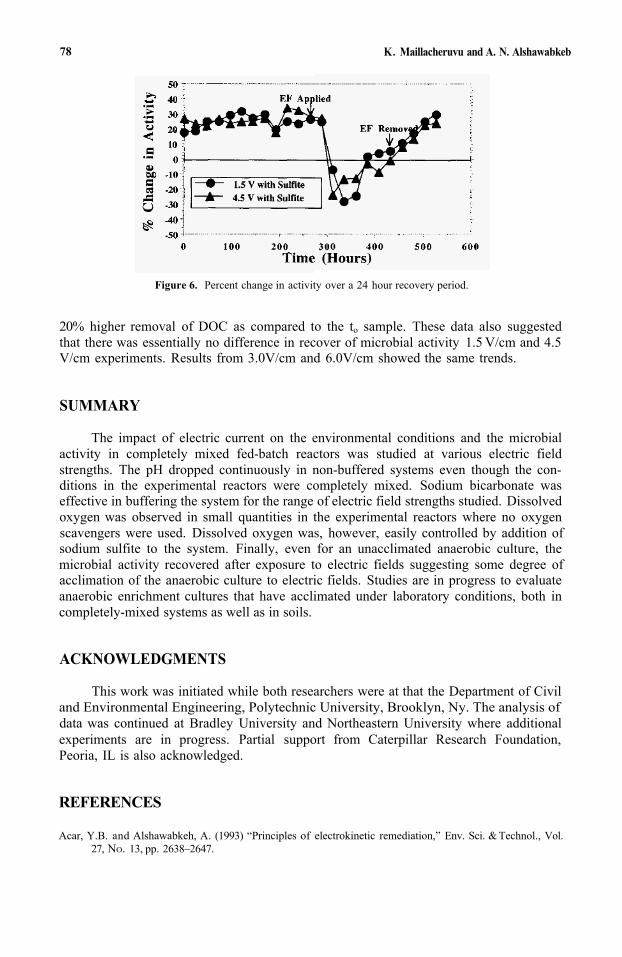
78 K. Maillacheruvu and A. N. Alshawabkeb
Figure 6. Percent change in activity over a 24 hour recovery period.
20% higher removal of DOC as compared to the to sample. These data also suggested that there was essentially no difference in recover of microbial activity 1.5 V/cm and 4.5 V/cm experiments. Results from 3.0V/cm and 6.0V/cm showed the same trends.
SUMMARY
The impact of electric current on the environmental conditions and the microbialactivity in completely mixed fed-batch reactors was studied at various electric field strengths. The pH dropped continuously in non-buffered systems even though the con-ditions in the experimental reactors were completely mixed. Sodium bicarbonate was effective in buffering the system for the range of electric field strengths studied. Dissolved oxygen was observed in small quantities in the experimental reactors where no oxygen scavengers were used. Dissolved oxygen was, however, easily controlled by addition of sodium sulfite to the system. Finally, even for an unacclimated anaerobic culture, the microbial activity recovered after exposure to electric fields suggesting some degree of acclimation of the anaerobic culture to electric fields. Studies are in progress to evaluate anaerobic enrichment cultures that have acclimated under laboratory conditions, both incompletely-mixed systems as well as in soils.
ACKNOWLEDGMENTS
This work was initiated while both researchers were at that the Department of Civil and Environmental Engineering, Polytechnic University, Brooklyn, Ny. The analysis of data was continued at Bradley University and Northeastern University where additional experiments are in progress. Partial support from Caterpillar Research Foundation,Peoria, IL is also acknowledged.
REFERENCES
Acar, Y.B. and Alshawabkeh, A. (1993) “Principles of electrokinetic remediation,” Env. Sci. & Technol., Vol.27, NO. 13, pp. 2638–2647.
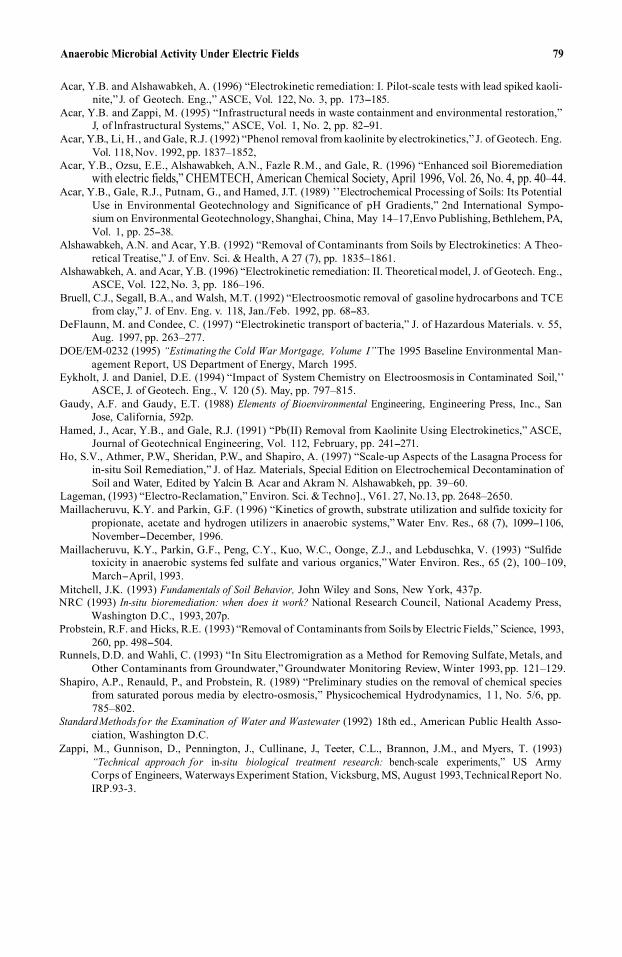
Anaerobic Microbial Activity Under Electric Fields 79
Acar, Y.B. and Alshawabkeh, A. (1996) “Electrokinetic remediation: I. Pilot-scale tests with lead spiked kaoli-
Acar, Y.B. and Zappi, M. (1995) “Infrastructural needs in waste containment and environmental restoration,”
Acar, Y.B., Li, H., and Gale, R.J. (1992) “Phenol removal from kaolinite by electrokinetics,” J. of Geotech. Eng.
Acar, Y.B., Ozsu, E.E., Alshawabkeh, A.N., Fazle R.M., and Gale, R. (1996) “Enhanced soil Bioremediationwith electric fields,” CHEMTECH, American Chemical Society, April 1996, Vol. 26, No. 4, pp. 40–44.
Acar, Y.B., Gale, R.J., Putnam, G., and Hamed, J.T. (1989) ’’Electrochemical Processing of Soils: Its PotentialUse in Environmental Geotechnology and Significance of pH Gradients,” 2nd International Sympo-sium on Environmental Geotechnology, Shanghai, China, May 14–17,Envo Publishing, Bethlehem, PA,Vol. 1, pp. 25-38.
Alshawabkeh, A.N. and Acar, Y.B. (1992) “Removal of Contaminants from Soils by Electrokinetics: A Theo-retical Treatise,” J. of Env. Sci. & Health, A 27 (7), pp. 1835–1861.
Alshawabkeh, A. and Acar, Y.B. (1996) “Electrokinetic remediation: II. Theoretical model, J. of Geotech. Eng.,ASCE, Vol. 122, No. 3, pp. 186–196.
Bruell, C.J., Segall, B.A., and Walsh, M.T. (1992) “Electroosmotic removal of gasoline hydrocarbons and TCEfrom clay,” J. of Env. Eng. v. 118, Jan./Feb. 1992, pp. 68-83.
DeFlaunn, M. and Condee, C. (1997) “Electrokinetic transport of bacteria,” J. of Hazardous Materials. v. 55,Aug. 1997, pp. 263–277.
DOE/EM-0232 (1995) “Estimating the Cold War Mortgage, Volume I”The 1995 Baseline Environmental Man-agement Report, US Department of Energy, March 1995.
Eykholt, J. and Daniel, D.E. (1994) “Impact of System Chemistry on Electroosmosis in Contaminated Soil,’’ASCE, J. of Geotech. Eng., V. 120 (5). May, pp. 797–815.
Gaudy, A.F. and Gaudy, E.T. (1988) Elements of Bioenvironmental Engineering, Engineering Press, Inc., SanJose, California, 592p.
Hamed, J., Acar, Y.B., and Gale, R.J. (1991) “Pb(II) Removal from Kaolinite Using Electrokinetics,” ASCE,Journal of Geotechnical Engineering, Vol. 112, February, pp. 241-271.
Ho, S.V., Athmer, P.W., Sheridan, P.W., and Shapiro, A. (1997) “Scale-up Aspects of the Lasagna Process forin-situ Soil Remediation,” J. of Haz. Materials, Special Edition on Electrochemical Decontamination ofSoil and Water, Edited by Yalcin B. Acar and Akram N. Alshawabkeh, pp. 39–60.
nite,” J. of Geotech. Eng.,” ASCE, Vol. 122, No. 3, pp. 173-185.
J, of lnfrastructural Systems,” ASCE, Vol. 1, No. 2, pp. 82-91.
Vol. 118, Nov. 1992, pp. 1837–1852,
Lageman, (1993) “Electro-Reclamation,” Environ. Sci. & Techno]., V61. 27, No.13, pp. 2648–2650.Maillacheruvu, K.Y. and Parkin, G.F. (1996) “Kinetics of growth, substrate utilization and sulfide toxicity for
propionate, acetate and hydrogen utilizers in anaerobic systems,” Water Env. Res., 68 (7), 1099-1106,November-December, 1996.
Maillacheruvu, K.Y., Parkin, G.F., Peng, C.Y., Kuo, W.C., Oonge, Z.J., and Lebduschka, V. (1993) “Sulfidetoxicity in anaerobic systems fed sulfate and various organics,”Water Environ. Res., 65 (2), 100–109,March-April, 1993.
Mitchell, J.K. (1993) Fundamentals of Soil Behavior, John Wiley and Sons, New York, 437p.NRC (1993) In-situ bioremediation: when does it work? National Research Council, National Academy Press,
Washington D.C., 1993, 207p.Probstein, R.F. and Hicks, R.E. (1993) “Removal of Contaminants from Soils by Electric Fields,” Science, 1993,
260, pp. 498-504.Runnels, D.D. and Wahli, C. (1993) “In Situ Electromigration as a Method for Removing Sulfate, Metals, and
Other Contaminants from Groundwater,” Groundwater Monitoring Review, Winter 1993, pp. 121–129.Shapiro, A.P., Renauld, P., and Probstein, R. (1989) “Preliminary studies on the removal of chemical species
from saturated porous media by electro-osmosis,” Physicochemical Hydrodynamics, 1 1, No. 5/6, pp.
Standard Methods for the Examination of Water and Wastewater (1992) 18th ed., American Public Health Asso-ciation, Washington D.C.
Zappi, M., Gunnison, D., Pennington, J., Cullinane, J., Teeter, C.L., Brannon, J.M., and Myers, T. (1993)“Technical approach for in-situ biological treatment research: bench-scale experiments,” US ArmyCorps of Engineers, Waterways Experiment Station, Vicksburg, MS, August 1993,TechnicalReport No.
785–802.
IRP.93-3.

This page intentionally left blank.
8
MECHANSTIC FACTORS AFFECTING FENTONOXIDATIONS IN NATURAL WATERS
Matthew A. Tarr and Michele E. Lindsey
Department of ChemistryUniversity of New OrleansNew Orleans, Louisiana 70148
1. ABSTRACT
The use of Fenton’s reagent (Fe(II) + H2O2 yields hydroxyl radical) has been appliedto remediation of contaminated soil sites and treatment of industrial waste streams. However, degradation of dissolved organic pollutants by Fenton’s reagent is strongly affected by the presence of other dissolved species. Natural organic matter (NOM) exertsthree main influences on hydroxyl radical mediated oxidation of pollutants: 1) reductionof hydroxyl radical concentration through scavenging, 2) reduction in hydroxyl radical formation rate and efficiency through iron binding or redox coupling, and 3) sequester-ing of pollutants away from hydroxyl radical through pollutant-NOM binding. Seques-tering of pollutants away from hydroxyl radical appears to be a significant mechanism for reducing degradation efficiency. All three effects must be accounted for in developing models for in situ degradation. Furthermore, the effects observed in the presence of natural organic matter may be similar to effects of non-pollutant organic compoundspresent in industrial waste streams.
2. INTRODUCTION
For decades, the use of chemicals for industrial, agricultural, and personal appli-cations has been widespread, resulting in many benefits to society. Unfortunately the potential for enormous harm to the environment was not recognized until recently, and consequently, severe contamination exists in thousands of sites worldwide. Only in recent years has awareness of such problems risen, and as a result, considerable effort has been put forth in the development of new technologies for the remediation of contaminatedsites. Examples of such sites are superfund sites, agrochemical distribution and applica-tion sites, industrial sites, harbors, and military sites. At many of these locations, conta-mination of soil and water may consist of mixtures of environmentally refractory, toxic compounds at relatively high concentration. Remediation of such sites often requires spe-cialized methods due to the diversity of contaminants present.
Emerging Technologies in Hazardous Waste Management 8, edited by Tedder and PohlandKluwer Academic/ Plenum Publishers, New York, 2000. 81
82 M. A. Tarr and M. E. Lindsey
Many techniques are currently in use for remediating contaminated sites. Among these are washing or extraction, incineration, vitrification, bioremediation, and chemical degradation.
Bioremediation has become one of the more promising techniques for treatment of non-volatile organic contaminants. However, several limitations have prevented its widespread application. Among the drawbacks to bioremediation are inhibition by non-pollutant metabolites, toxicity of contaminants at high concentration, and an inabilityto deal with contaminant mixtures.1
Such limitations of bioremediation have been illustrated in many studies.Haggblom,2 et al. showed that the biodegradation of six chlorinated aromatics could becarried out individually, but no conditions could be found to achieve degradation of a mixture of all six compounds. Other researchers obtained similar results with 2,4,5-trichlorophenoxyacetic acid (2,4,5-T) and 2,4-dichlorophenoxyacetic acid (2,4-D),3 andwith chlorinated phenols.4 Furthermore, some compounds are biodegraded at low con-centrations, but become toxic at higher concentrations.5,6
Treatment of dense non-aqueous phase liquids (DNAPLs) has also been problem-atic. Methods for DNAPL removal have generally relied on intact removal of theDNAPL by pumping or extraction. However, pumping and extraction can be time con-suming, requires additional treatment of the recovered material, and can leave residual material.7 The residual material remaining in the soil may result in continuous release ofdissolved DNAPL into aquifers.8 Other remediation techniques involve the addition ofalcohols, surfactants, or organic solvents to promote dissolution or displacement of the DNAPL.9,10 In addition to possible limitations in remediation efficiency, these techniqueshave the added drawback of introducing potentially unwanted chemicals into thecontaminated site.
Chemical oxidation of pollutants is another widely investigated technique fordecontamination. These techniques rely on the addition or formation of reactive specieswhich then degrade the pollutants present. Among these methods are ozone treatment, ultraviolet photocatalysis, supercritical water oxidation, and Fenton type catalytic degra-dation with hydrogen peroxide. These techniques rely on generation of reactive speciessuch as the hydroxyl radical (HO.), the hydrated electron [e-(aq)], singlet oxygen (1O2),superoxide (O2
-.), and other species.Hydroxyl radical is one of the strongest oxidants known, and reacts rapidly with a
wide variety of compounds. It is the key oxidant in the degradation of pollutants byultraviolet/ozone treatment,11 ultraviolet/peroxide treatment,11 titanium dioxide photo-catalysis,12iron/hydrogen peroxide treatment,13 and sonolysis.14 The highly reactive, non-specific nature of the hydroxyl radical makes it useful in degrading a wide variety ofspecies. Although photolytic and photocatalytic methods can by very effective, they are limited to optically transparent systems. Iron/H2O2 and sonolysis systems are not limitedin this manner, and may be applicable to soil systems, as well as aqueous systems.
The Fenton reaction (Equation 1) is part of a catalytic cycle which produces hydroxyl radical from hydrogen peroxide.13
H2O2 +Fe2+ Fe3++HO-+HO.
(1)
In addition, some strongly oxidizing iron complexes may also be formed. These rad-icals results in degradation of a wide array of compounds. Reaction of HO.with alkanesproceeds with a rate constant of 107 – 1091/(mol.s), and reactions with alkenes and aro-matics have rate constants on the order of 109 – 10101/(mol.s).15
Mechanistic Factors Affecting Fenton Oxidations in Natural Waters 83
Ferric species are also capable of producing hydroxyl radical in the Haber-Weissprocess13:
H2O2 + Fe+ Fe2+ + H+ + HO2.
H2O2 + Fe2+ Fe3+ + HO- + HO.
H2O2 + HO H2O + HO2.
HO2. + Fe3+ O2 + Fe2+ + H+
HO2. + Fe2+ HO2
- + Fe3+
(2)
(3)
(4)
(5)
(6)
Iron/peroxide systems have been used to degrade a number of contaminants, mostly in the aqueous phase. Degradation of the herbicides 2,4-D and 2,4,5-T in aqueous solu-tion by Fe(II)/H2O2 or Fe(III)/H2O2 has been reported.
16 Reactions were pH sensitive, andacid conditions were necessary for iron solubility. Vella and Munder17 used Fe(II)/H2O2
for the degradation of phenolic compounds in water. Again, a low pH (4) was used. Although complete elimination of the parent compound could be achieved for chlori-nated and other phenols, the presence of phosphate significantly hindered degradation.
In order to allow reaction at near neutral pH, researchers have utilized iron chelat-ing agents.18,19 In these studies, several iron chelates were found to be active in degradingpollutants, although the chelator was also degraded at a slower rate.18This may be advan-tageous, since added organic species will not persist in the treated material. Three chela-tors were found to be particularly useful in the degradation of several pesticides in aqueous solution,19 including the natural product gallic acid. Although no reference toexperimental results is given, the authors note that these iron complexes may be useful for remediation in soil systems.
Fenton reagents have also been used for the degradation of perchloroethylene (PCE) and polychlorinated biphenyls (PCB’s) adsorbed on sand.20 These species cannotbe successfully biodegraded due to their toxicity to microorganisms. The treatmentrequired adjustment of the pH to 3 and resulted in significant decomposition of PCE;however, PCB treatment resulted in the formation of chlorinated degradation products. When the pH was raised to 7, degradation was severely limited.
Work on the use of Fe/H2O2 systems for remediation continues,21–23 with additional studies involving biphasic systems (soil/water or immiscible solvent/water).24–27 One pos-sible drawback to the use of iron/H2O2 systems for aqueous and soil remediation is the interaction between iron and non-contaminant species present in the system. As men-tioned above, phosphate has been observed to inhibit Fenton type degradation, and some iron complexes are inactive towards H2O2 mediated degradation. Reports are available showing both inhibition28 and acceleration29 of HO production in the presence of addi-tional chemical species. Another important drawback is the scavenging of hydroxyl radical by non-pollutant species.
Although success of Fe/H2O2 in aqueous and simple soil systems has been demon-strated, fundamental information is critically lacking, preventing the widespread appli-cation of these techniques. Investigation of the microchemical factors in Fe/H2O2 systemsis necessary to allow engineering of this technique in real-world sites. Once such factors have been determined, this technique may provide a low cost, highly efficient alternative for in situ remediation of contaminated soils, especially where high contaminant con-centrations or mixtures preclude the use of bioremediation. Furthermore, this method would provide a relatively generic procedure, and would be applicable to a wide variety
84 M. A. Tarr and M. E. Lindsey
of wastes in diverse matrices, possibly including soil, sediment, groundwater, and indus-trial waste streams.
3. EXPERIMENTAL
In this study, several types of water were used: high purity water (Barnstead Nano-pureUV), high purity water with Suwannee River fulvic acid or humic acid added, watercollected from a West Pearl River tributary at Crawford Landing (CL), Louisiana, and water collected from a small water body connecting Lake Pontchartrain and Lake Mau-repas (LM), Louisiana. Natural water samples were filtered through pre-combusted (450
oC) glass fiber filters with a nominal cut-off of 0.5 µm (Rundfilter MN GF-2, Macherey-Nagel, Düren, Germany), and subsequently stored in the dark at 4°C. Standard Suwan-nee River fulvic acid and humic acid were obtained from the International Humic Substances Society (http://www.ihss.gatech.edu).
Pentachlorophenol (99+%), benzoic acid (99.5%), p-hydroxybenzoic acid (99%), o-cresol (99+%), phenanthrene (99+%), and pyrene (99%, optical grade) were purchased from Aldrich. Phenol (99+%) was purchased from Fisher and Fe(II) perchlorate hexahy-drate (99+%) was purchased from Alfa. H2O2 was purchased from EM Science. All reagents were used as received.
High performance liquid chromatography was performed using a Hewlett-Packard1090 liquid chromatograph. All separations were carried out with a Spherisorb ODs-2column, 25 × 4.6cm, 2µm particle size (Alltech), and detection was performed with anabsorbance detector at 254 nm. Pentachlorophenol (PCP) was analyzed using a mobile phase of 80/20 acetonitrile/water (1% acetic acid) with a flow rate of 1mLmin–1 and a 20µL injection loop. Benzoic acid (BA) and its hydroxylated products were analyzed with gradient elution and on-column pre-concentration.30 BA samples were acidified to pH ~3 prior to injection using a 1.5mL loop. The eluent consisted of 15/85 acetonitrile/water (pH 2 with HCl) for 3 minutes followed by a linear gradient to 80/20 acetonitrile/water (pH 2 with HCl) in 13 minutes.
Degradation studies were typically carried out in 10–15mL solutions. To each solution a small aliquot of aqueous Fe(ClO4)2 was added, followed by addition of a small aliquot of H2O2 to initiate degradation. The added concentrations of iron and peroxide in each reaction were adjusted by varying the volume and concentration of the added aliquots. All reactions were carried out in the dark and were shaken on an orbital shaker. Reactions were quenched by adding 0.5mL of n-propanol. Iron solutions were prepared fresh each day and H2O2 was standardized against thiosulfate on a regularbasis.
4. RESULTS AND DISCUSSION
Studies in this laboratory have demonstrated a dramatic decrease in oxidation effi-ciency in the presence of natural organic matter (NOM). Figure 1 presents data for the oxidation of pentachlorophenol in pure water and in CL natural water (10.9mg/L dis-solved organic carbon). The initial degradation rate and the total amount degraded are both lower in the presence of DOM. Furthermore, similar results were obtained withsamples of LM natural water, indicating that this phenomenon is general to natural waters. Three causes for the decreased degradation are likely: scavenging of hydroxylradical by NOM, alteration of the HO. production rate by iron - NOM interaction ,18,19,28,29
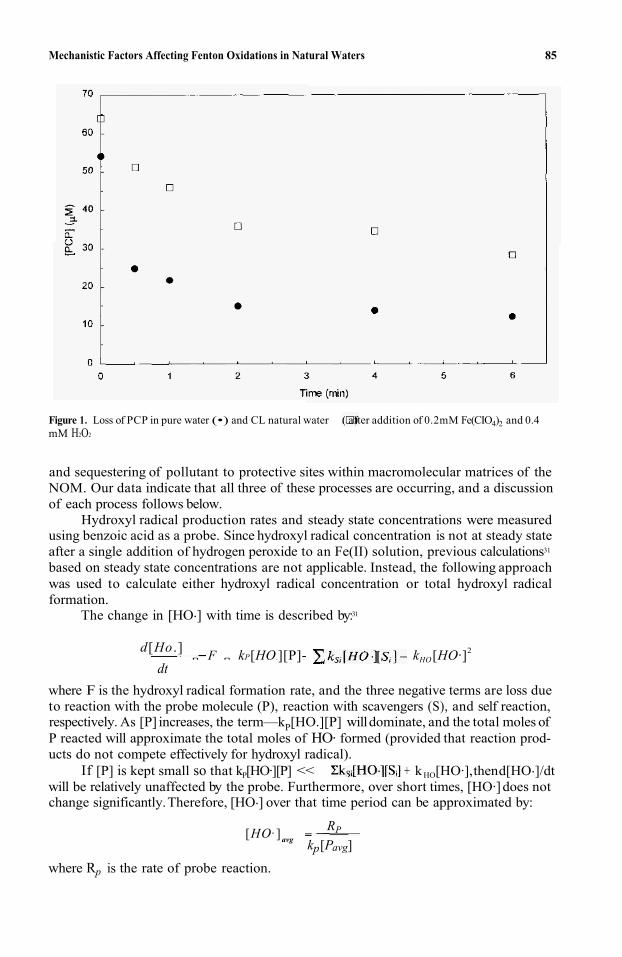
Mechanistic Factors Affecting Fenton Oxidations in Natural Waters 85
Figure 1. Loss of PCP in pure water (•) and CL natural water after addition of 0.2mM Fe(CIO4)2 and 0.4mM H2O2
and sequestering of pollutant to protective sites within macromolecular matrices of theNOM. Our data indicate that all three of these processes are occurring, and a discussionof each process follows below.
Hydroxyl radical production rates and steady state concentrations were measuredusing benzoic acid as a probe. Since hydroxyl radical concentration is not at steady state after a single addition of hydrogen peroxide to an Fe(II) solution, previous calculations31
based on steady state concentrations are not applicable. Instead, the following approachwas used to calculate either hydroxyl radical concentration or total hydroxyl radicalformation.
The change in [HO.] with time is described by:31
d[Ho .] ñ F ñ kP[HO.][P]- kHO[HO.]2
dt
where F is the hydroxyl radical formation rate, and the three negative terms are loss dueto reaction with the probe molecule (P), reaction with scavengers (S), and self reaction,respectively. As [P] increases, the term—kP[HO.][P] willdominate, and the total moles ofP reacted will approximate the total moles of HO. formed (provided that reaction prod-ucts do not compete effectively for hydroxyl radical).
If [P] is kept small so that kP[HO.][P] << + kHO[HO.], then d[HO.]/dtwill be relatively unaffected by the probe. Furthermore, over short times, [HO.] does notchange significantly.Therefore, [HO.] over that time period can be approximated by:
RP[HO.]avg kp[Pavg]
where Rp is the rate of probe reaction.
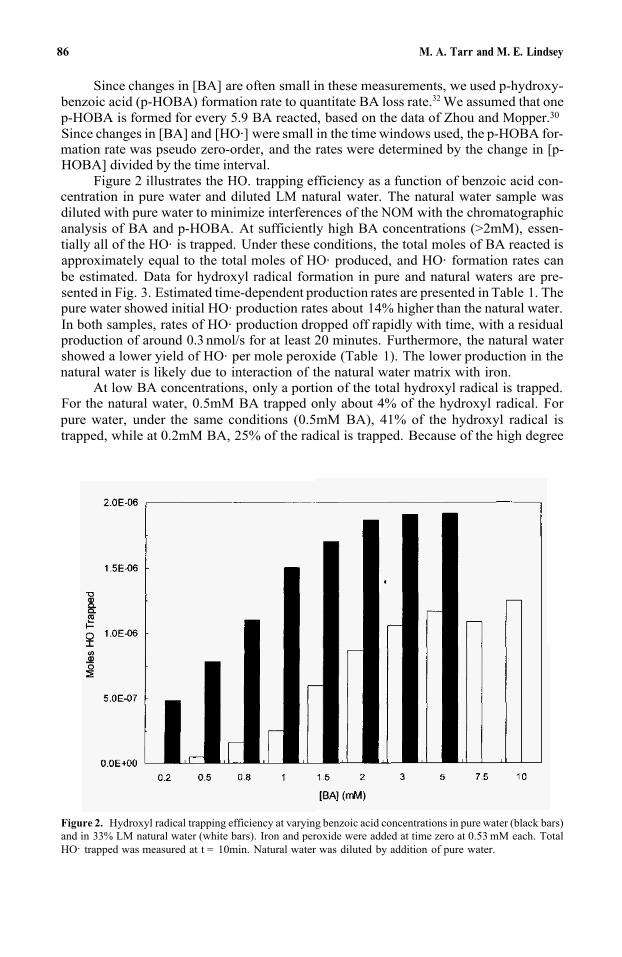
86 M. A. Tarr and M. E. Lindsey
Since changes in [BA] are often small in these measurements, we used p-hydroxy-benzoic acid (p-HOBA) formation rate to quantitate BA loss rate.32 We assumed that one p-HOBA is formed for every 5.9 BA reacted, based on the data of Zhou and Mopper.30
Since changes in [BA] and [HO.] were small in the time windows used, the p-HOBA for-mation rate was pseudo zero-order, and the rates were determined by the change in [p-HOBA] divided by the time interval.
Figure 2 illustrates the HO. trapping efficiency as a function of benzoic acid con-centration in pure water and diluted LM natural water. The natural water sample was diluted with pure water to minimize interferences of the NOM with the chromatographic analysis of BA and p-HOBA. At sufficiently high BA concentrations (>2mM), essen-tially all of the HO. is trapped. Under these conditions, the total moles of BA reacted isapproximately equal to the total moles of HO. produced, and HO. formation rates canbe estimated. Data for hydroxyl radical formation in pure and natural waters are pre-sented in Fig. 3. Estimated time-dependent production rates are presented in Table 1. Thepure water showed initial HO. production rates about 14% higher than the natural water.In both samples, rates of HO. production dropped off rapidly with time, with a residualproduction of around 0.3 nmol/s for at least 20 minutes. Furthermore, the natural water showed a lower yield of HO. per mole peroxide (Table 1). The lower production in thenatural water is likely due to interaction of the natural water matrix with iron.
At low BA concentrations, only a portion of the total hydroxyl radical is trapped.For the natural water, 0.5mM BA trapped only about 4% of the hydroxyl radical. For pure water, under the same conditions (0.5mM BA), 41% of the hydroxyl radical istrapped, while at 0.2mM BA, 25% of the radical is trapped. Because of the high degree
Figure 2. Hydroxyl radical trapping efficiency at varying benzoic acid concentrations in pure water (black bars)and in 33% LM natural water (white bars). Iron and peroxide were added at time zero at 0.53 mM each. TotalHO. trapped was measured at t = 10min. Natural water was diluted by addition of pure water.
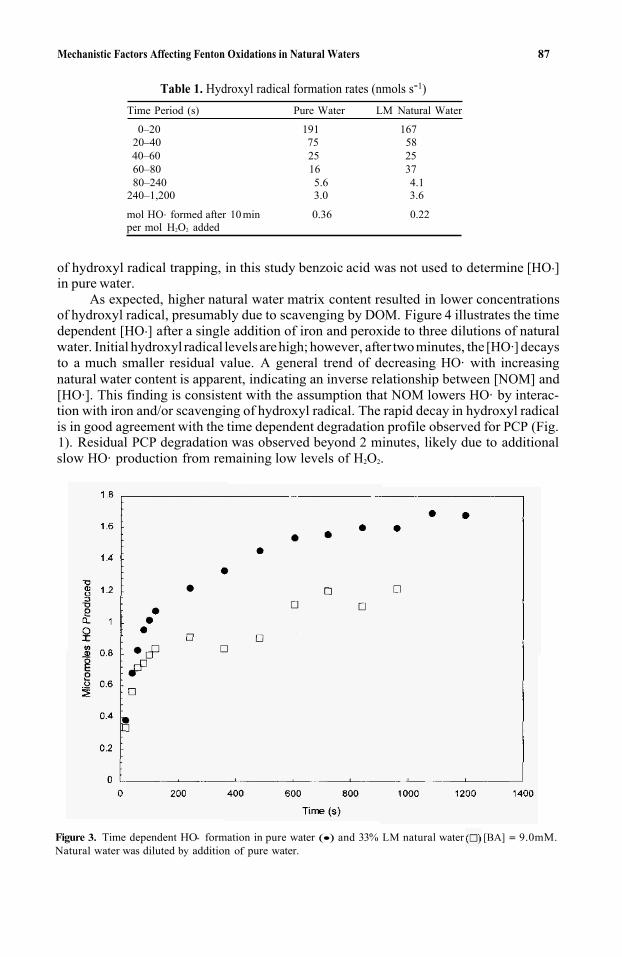
Mechanistic Factors Affecting Fenton Oxidations in Natural Waters 87
Table 1. Hydroxyl radical formation rates (nmols s-1)Time Period (s) Pure Water LM Natural Water
0–20 191 16720–40 75 5840–60 25 2560–80 16 3780–240 5.6 4.1
240–1,200 3.0 3.6
mol HO. formed after 10 min 0.36 0.22per mol H2O2 added
of hydroxyl radical trapping, in this study benzoic acid was not used to determine [HO.]in pure water.
As expected, higher natural water matrix content resulted in lower concentrationsof hydroxyl radical, presumably due to scavenging by DOM. Figure 4 illustrates the timedependent [HO.] after a single addition of iron and peroxide to three dilutions of naturalwater. Initial hydroxyl radical levelsarehigh; however, after twominutes, the [HO.] decaysto a much smaller residual value. A general trend of decreasing HO. with increasingnatural water content is apparent, indicating an inverse relationship between [NOM] and[HO.]. This finding is consistent with the assumption that NOM lowers HO. by interac-tion with iron and/or scavenging of hydroxyl radical. The rapid decay in hydroxyl radical is in good agreement with the time dependent degradation profile observed for PCP (Fig.1). Residual PCP degradation was observed beyond 2 minutes, likely due to additional slow HO. production from remaining low levels of H2O2.
Figure 3. Time dependent HO- formation in pure water (•) and 33% LM natural water [BA] = 9.0mM.Natural water was diluted by addition of pure water.
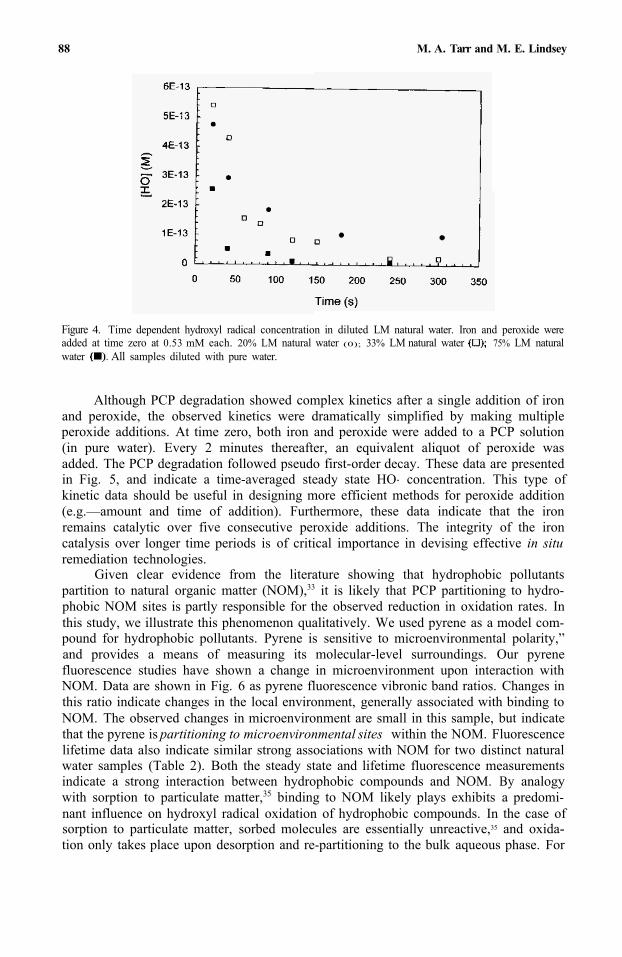
88 M. A. Tarr and M. E. Lindsey
Figure 4. Time dependent hydroxyl radical concentration in diluted LM natural water. Iron and peroxide wereadded at time zero at 0.53 mM each. 20% LM natural water (0); 33% LM natural water 75% LM naturalwater All samples diluted with pure water.
Although PCP degradation showed complex kinetics after a single addition of iron and peroxide, the observed kinetics were dramatically simplified by making multiple peroxide additions. At time zero, both iron and peroxide were added to a PCP solution (in pure water). Every 2 minutes thereafter, an equivalent aliquot of peroxide was added. The PCP degradation followed pseudo first-order decay. These data are presented in Fig. 5, and indicate a time-averaged steady state HO. concentration. This type ofkinetic data should be useful in designing more efficient methods for peroxide addition(e.g.—amount and time of addition). Furthermore, these data indicate that the iron remains catalytic over five consecutive peroxide additions. The integrity of the iron catalysis over longer time periods is of critical importance in devising effective in situremediation technologies.
Given clear evidence from the literature showing that hydrophobic pollutants partition to natural organic matter (NOM),33 it is likely that PCP partitioning to hydro-phobic NOM sites is partly responsible for the observed reduction in oxidation rates. In this study, we illustrate this phenomenon qualitatively. We used pyrene as a model com-pound for hydrophobic pollutants. Pyrene is sensitive to microenvironmental polarity,” and provides a means of measuring its molecular-level surroundings. Our pyrene fluorescence studies have shown a change in microenvironment upon interaction with NOM. Data are shown in Fig. 6 as pyrene fluorescence vibronic band ratios. Changes inthis ratio indicate changes in the local environment, generally associated with binding to NOM. The observed changes in microenvironment are small in this sample, but indicate that the pyrene is partitioning to microenvironmental sites within the NOM. Fluorescencelifetime data also indicate similar strong associations with NOM for two distinct natural water samples (Table 2). Both the steady state and lifetime fluorescence measurements indicate a strong interaction between hydrophobic compounds and NOM. By analogywith sorption to particulate matter,35 binding to NOM likely plays exhibits a predomi-nant influence on hydroxyl radical oxidation of hydrophobic compounds. In the case of sorption to particulate matter, sorbed molecules are essentially unreactive,35 and oxida-tion only takes place upon desorption and re-partitioning to the bulk aqueous phase. For
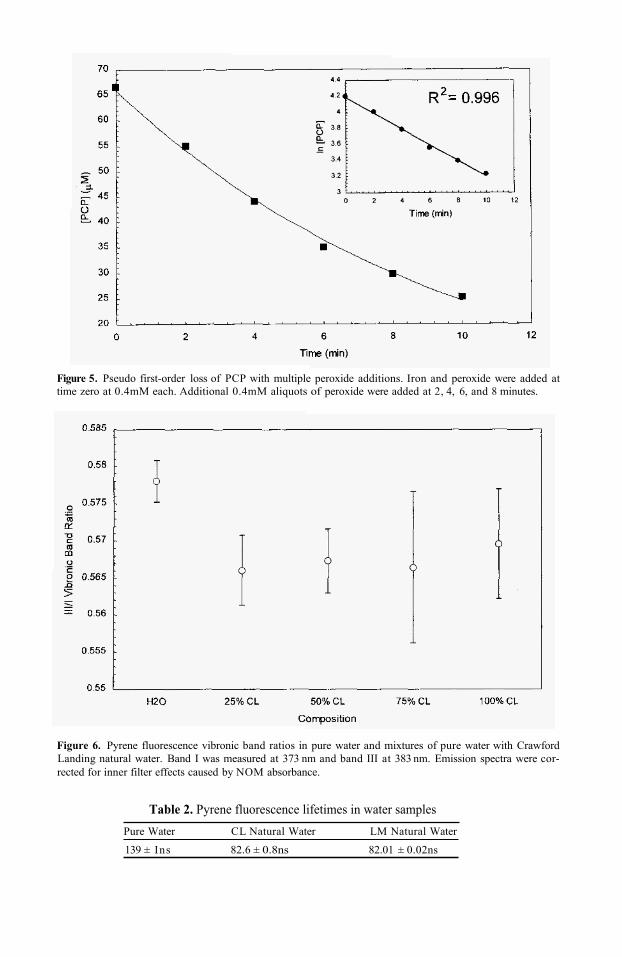
Figure 5. Pseudo first-order loss of PCP with multiple peroxide additions. Iron and peroxide were added attime zero at 0.4mM each. Additional 0.4mM aliquots of peroxide were added at 2, 4, 6, and 8 minutes.
Figure 6. Pyrene fluorescence vibronic band ratios in pure water and mixtures of pure water with CrawfordLanding natural water. Band I was measured at 373 nm and band III at 383 nm. Emission spectra were cor-rected for inner filter effects caused by NOM absorbance.
Table 2. Pyrene fluorescence lifetimes in water samplesPure Water CL Natural Water LM Natural Water
139 ± Ins 82.6 ± 0.8ns 82.01 ± 0.02ns
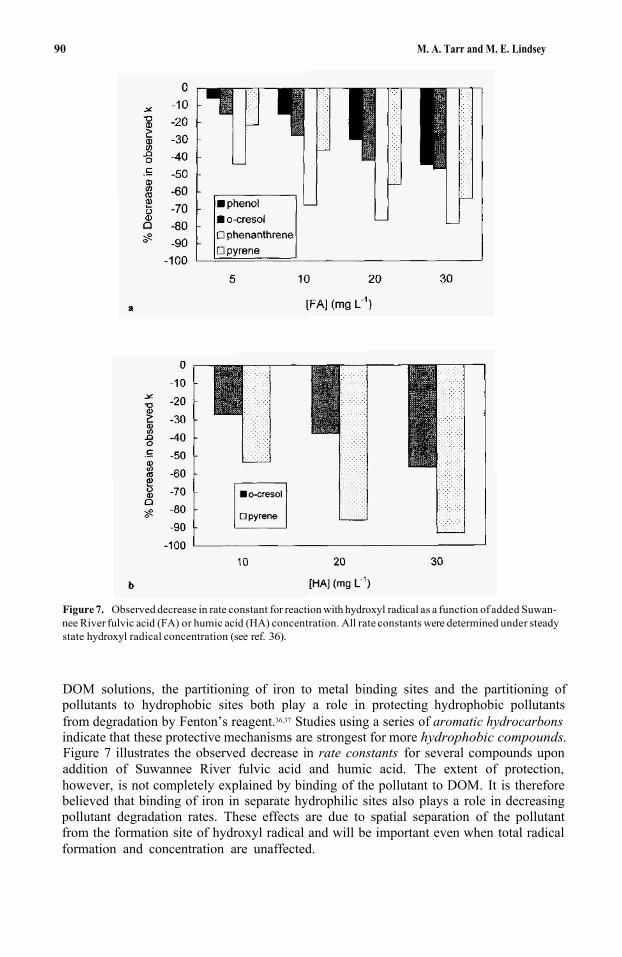
90 M. A. Tarr and M. E. Lindsey
Figure 7. Observed decrease in rate constant for reaction with hydroxyl radical as a function of added Suwan-nee River fulvic acid (FA) or humic acid (HA) concentration. All rate constants were determined under steadystate hydroxyl radical concentration (see ref. 36).
DOM solutions, the partitioning of iron to metal binding sites and the partitioning of pollutants to hydrophobic sites both play a role in protecting hydrophobic pollutants from degradation by Fenton’s reagent.36,37 Studies using a series of aromatic hydrocarbonsindicate that these protective mechanisms are strongest for more hydrophobic compounds.Figure 7 illustrates the observed decrease in rate constants for several compounds uponaddition of Suwannee River fulvic acid and humic acid. The extent of protection, however, is not completely explained by binding of the pollutant to DOM. It is therefore believed that binding of iron in separate hydrophilic sites also plays a role in decreasing pollutant degradation rates. These effects are due to spatial separation of the pollutant from the formation site of hydroxyl radical and will be important even when total radical formation and concentration are unaffected.
Mechanistic Factors Affecting Fenton Oxidations in Natural Waters 91
5. CONCLUSION
To date, our studies have shown that all three factors studied (altered HO. pro-duction rate, increased HO. scavenging, and binding to NOM) are occurring duringFenton oxidation in the presence of natural organic matter. These three factors are thekey issues in determining the extent and efficiency of oxidation. Although hydroxylradical formation and scavenging rates change upon addition of natural organic matter,the microenvironmental effects that result in spatial separation of pollutants and hydroxylradical appear to be the most important factors for hydrophobic compounds. Clearly, allthree factors most be accounted for in order to accurately predict degradation rates andto determine the peroxide loading required for complete degradation. The research todate illustrates that the effects of dissolved organic matter are complicated and requireadditional study in order to effectively engineer efficient in situ remediation or wastestream treatment based on Fenton’s reagent.
ACKNOWLEDGMENT
This work was supported by the Louisiana Board of Regents under grantLEQSF(1998-01)-RD-A-34.
REFERENCES
1. “Biotechnology in Bioremediation of Pesticide Contaminated Sites,” J.S. Karns in Pesticide WasteManagement, J. Bourke, A.S. Felsot, T.J. Gilding, J.K. Jensen, and J.N. Seiber, Eds., ACS SymposiumSeries #510, 1992, pp. 148-156.
2. Haggblom, M.M., Rivera, M.D., and Young, L.Y. Appl. Environ. Microbiol. 1993, 59, 1 162–67.3. Haugland, R.A., Schlemm, D.J., Lyons, R.P. III, Sferra, P.R., and Chaktabarty, A.M. Appl. Environ.
Microbiol. 1990, 56, 1357–62.4. Smith, LA. and Novak, J.T. Water Air Soil Pollution 1987, 33, 29–42.5. Crawford, R.L. and Mohn, W.W. Enz. Microb Technol. 1985, 7, 617-20.6. Racke, K.D., Coats, J.R., and Titus, K.R. J. Environ. Sci. Health 1988, B23, 527–39.7. Michalski, A., Metlitz, M.N., and Whitman, I.L. Ground Wat. Mon. Remed. 1995, 15, 90–100. 8. Butcher, J.B. and Gauthier, T.D. Ground Wat. 1994, 32, 71-78.9. Brandes, D. and Farley, K.J. Wat. Environ. Res. 1993, 65, 869–78.
10. Martel, R., Gelinas, P.J., Desonoyers, J.E., and Masson, A. Ground Wat. 1993, 31, 789–800.1 1. “Comparative Aspects of Advanced Oxidation Processes,” D.F. Ollis in Emerging Technologies in
Hazardous Waste Management III, D.W. Tedder and F.G. Pohland, Eds., ACS Symposium Series #518,1993, pp. 18-34.
12. Ollis, D.F., Pelizzetti, E., and Serpone, N. Environ. Sci. Technol. 1991, 25, 1523–29.13. Walling, C. Acc. Chem. Res. 1975, 8, 125–131.14. Riesz, P. and Kondo, T. Free Rad. Biol. Med. 1992, 13, 247–70.15. Buxton, G.V., Greenstock, C.L., Helman, W.P., and Ross, A.B. J. Phys. Chem. Reference Data 1988,
17(2), 513-886.16. Pignatello, J.J. Environ. Sci. Technol. 1992, 26, 944–51.17. “Toxic Pollutant Destruction,” P.A. Vella and J.A. Munder in Emerging Technologies in Hazardous
Waste Management III, D.W. Tedder and F.G. Pohland, Eds., ACS Symposium Series #518, 1993, pp.85–105.
18. Sun, Y. and Pignatello, J.J. J. Agric. Food Chem. 1992, 40, 322–27.19. Sun, Y. and Pignatello, J.J. J. Agric. Food Chem. 1993, 41, 308–12.20. “Decomposition of Perchloroethylene and Polychlorinated Biphenyls with Fenton’s Reagent,” C. Sato,
S.W. Leung, H. Bell, W.A. Burkett, and R.J. Watts in Emerging Technologies in Hazardous WasteManagement III, D.W. Tedder and F.G. Pohland, Eds., ACS Symposium Series #518,1993, pp. 343–356.

92 M. A. Tarr and M. E. Lindsey
21. Lipezynska-Kochany, E., Sprah, G., and Harms, S. Chemosphere 1995, 30(1), 9-20.22. Gau, S.H. and Chang, F.S. Water Sci. Technol. 1996, 34(7–8), 455–462.23. Kim, Y.K. and Huh, I.R. Environ. Eng. Sci. 1997, 14(1), 73-79.24. Yeh, C.K. and Novak, J.T. Water Environ. Res. 1995, 67, 828–34.25. Pignatello, J.J. and Chupa, G. Environ. Toxicology and Chem. 1994, 13, 423–27.26. Ronen, Z . , Horvathgordon, M., and Bollag, J.M. Environ. Toxicology and Chem. 1994, 13, 21-26.27. Watts, R.J., Udell, M.D., and Monsen, R.M. Water Environ. Res. 1993, 65, 83–44.28. Croft, S., Gilbert, B.C., Smith, J.R.L., Stell, J.K., andsanderson, W.R. J. Chem. Soc. PerkinTrans. 1992,
2, 153.29. Puppo, A. Phytochem. 1992,31, 85-88.30. Zhou, X. and Mopper, K. Mar. Chem. 1990, 30,71–8831. “Reaction of Oxygen Species in Natural Waters,” N.V. Blough and R.G. Zepp, in Reactive Oxygen
Species in Chemistry, C.S. Foote and J.S. Valentine, Eds., Chapman and Hall, 1994.32. Lindsey, M.E. and Tarr, M.A. Chemosphere 1999, in press.33. McCarthy, J.F. and Jimenez, B.D. Environ. Sci. Technol. 1985, 19, 1072-76.34. Kalyanasundaram, K. and Thomas, J.K. J. Am. Chem. Soc. 1977,99,2039.35. Sedlak D.L. and Andren. A.W. Wat. Res. 1994, 28, 1207-1536. Lindsey, M.E. and Tarr, M.A. Environ. Sci. Technol. 1999, submitted.37. Lindsey, M.E. and Tarr, M.A. Wat. Res. 1999, submitted.
9
INNOVATIVE SURFACTANT/COSOLVENTTECHNOLOGIES FOR REMOVAL OF NAPL ANDSORBED CONTAMINANTS FROM AQUIFERS
Chad T. Jafvert and Timothy J. Strathmann
Purdue UniversitySchool of Civil EngineeringPurdue University1284 Civil Engineering BuildingWest Lafayette, Indiana 47907
ABSTRACT
Conventional pump-and-treat removal of nonaqueous phase liquids and sorbedcontaminants from groundwater has proved unsuccessful in many cases for a variety ofreasons. To overcome some of the limitations of these methods, innovative technologiesare currently under development which attempt to increase subsurface contaminantremoval efficiencies through the addition of surfactants and/or cosolvents. The rationalebehind the use of these substances for improving groundwater contaminant removal, aswell as several case studies are reviewed.
INTRODUCTION AND DESCRIPTION
Conventional “pump-and-treat’’ remediation of dissolved, sorbed, and/or non-aqueous phase contaminants (NAPLs) from the subsurface has proved often times to bevery inefficient and costly. Low recoveries often have resulted from: (i) slow dissolutionof NAPLs into the ground-water, (ii) slow diffusion of contaminants from low conduc-tivity zones to high conductivity zones, (iii) slow desorption of sorbed contaminants, and(iv) hydrodynamic isolation in dead-end zones. The first three factors result because manyorganic compounds in the subsurface have a greater affinities for organic phases (includ-ing natural organic matter and NAPL phases) which decreases effective-dissolution,-diffusion, and -desorption rates.
Upon reaching the water table of an unconfined aquifer, light nonaqueousphase liquids (LNAPLs) typically spread on the water-table surface. Dense nonaqueous
Emerging Technologies in Hazardous Waste Management 8, edited by Tedder and PohlandKluwer Academic/ Plenum Publishers, New York, 2000. 93

94 C. T. Jafvert and T. J. Strathmann
phase liquids (DNAPLs), on the other hand, tend to sink into the ground-water creat-ing a plug or volume of often times reduced hydraulic conductivity with respect to the surrounding water. When NAPL phases occur, three general zones of contamination may be described. These are the source or residual zone, the concentrated plume (where the center of mass in the ground-water plume occurs), and the dilute ground water plume.
Direct pump-and-treat of NAPL phases often results in “fingering” of the non-aqueous phase liquid as water moves through or around it to the well head. Conventional pump-and-treat, with reinjection of the local groundwater behind the plug, in an attempt to mobilize the NAPL often fails because water passes through or around the NAPL plug due to the high interfacial tension between the NAPL and water. The NAPL acts as a long-term continuous source of contaminant, through slow chemical dissolution into the ground water. High interfacial tension at the NAPL-water interface, and the result-ing capillary forces, assure that oil droplet release to the mobile water phase does not occur. At some sites, the initial pump-and-treat recoveries (with local ground water) and the estimated NAPL or sorbed residual volumes in the subsurface suggest that remedia-tion times of decades to centuries would be required for greater than 90% contaminantremoval. To overcome these limitations, innovative technologies are currently underdevelopment which enhance flushing efficiency through the use of surfactants, cosolvents, or other chemical agents. Several of these technologies and initial field demonstrations of their application are discussed in this chapter.
SURFACTANTS
One class of chemical substances that has been proposed for enhancing pump-and-treat remediation of NAPL and sorbed contaminants from the subsurface are surfac-tants. The goal of surfactant flushing is to decrease the required flushing volume by mobilizing and/or solubilizing nonaqueous liquid phases and solubilizing sorbed contam-inants. These phenomena occur because surfactants:
1) may lower the NAPL-water interfacial tension, thereby decreasing capillary
2) may be used to create a Winsor type III middle phase microemulsion (see
3) may form micelles or single phase microemulsions that can solubilize contam-
forces within the porous media
Fig. 1)
inants (with added cosurfactants, usually alcohols)
When removal of NAPL or sorbed compounds is the intent, anionic and/or non-ionic surfactants are utilized to minimize loss of surfactant to the aquifer solids. Cationic, and to a lesser extent zwitterionic, surfactants strongly sorb to aquifer solids making them impractical for such uses. Several researchers, interested in retarding the migration of contaminant plumes, however, are examining the potential of cationic surfactants for increasing the carbon content of the aquifer solids, thereby reducing subsurface trans-port of hydrophobic contaminants. Others are interested in facilitating the bioremedia-tion of contaminants through the addition of surfactants.
Surfactant molecules possess both polar (hydrophilic) and nonpolar (hydrophobic) regions. The polar region is commonly composed of a sulfate, sulfonate, carboxylate, or polyethoxylate group, and often contains a succinate or sorbitan group. The nonpolar
Innovative Technologies for Removal of NAPL and Sorbed Contaminants from Aquifers 95
region generally takes the form of a linear hydrocarbon chain; however, sometimes the hydrocarbon chain is branched and may contain phenolic or other aromatic groups. Because of their unique structure, surfactants are amphiphilic (both loving) in nature. The polar group has a high affinity for (high solubility in) polar solvents, such as water, whereas the nonpolar group has a high affinity for nonpolar or hydrophobic solvents or phases, which include most organic liquids. Upon addition to water, the large energy requirement for solubilization of the nonpolar portion of the surfactant molecule in the water is minimized by either transference of this region of the molecule to a nonpolar solvent through the liquid-liquid interface, or by self assemblage of these groups into aggregates known as micelles.
Overall partitioning of the surfactant molecules at the water-NAPL interface reduces the thermodynamic energy required to form this interface. Without surfactant present, the large amount of energy required to form a water-NAPL interface is com-pensated for physically by reducing the interfacial surface area. This results in a “rigid”or “taut” boundary between the two phases which is characterized by a high interfacial tension. By reducing the energy requirement to create the interface, the added surfactant increases the interfacial area and decreases “tautness”, resulting in a lower interfacial tension. An increase in interfacial area may result in spontaneous formation of droplets, of very thin alternating sheets of water and NAPL separated by surfactant layers (lamella), or of other structures which mobilize the NAPL material. NAPL-in-waterdroplets which form spontaneously (i.e., no mixing energy required) are referred to as “single phase” microemulsions (SPME). “Single phase” refers to the fact that only one aqueous phase (i.e., the microemulsion phase) is present during their development, as opposed to “middle phase” microemulsions (MPME) (also referred to as Winsor type III microemulsions), which are formed in the presence of an additional aqueousphase.
Micelles
Self assembly of the nonpolar groups results in the formation of surfactant aggregates known as micelles. In micelle formation, individual surfactant molecules (monomers) orient themselves so that the hydrophobic groups fill the core of a sphere, while the exterior polar groups are in contact with the surrounding aqueous phase water molecules. Formation of these aggregates does not require a second phase or the addi-tion of another organic compound; however, other organic molecules may be solubilized within the micelles. Typical surfactant micelles are composed of 50 to 100 monomers.Micelle formation is surfactant concentration dependent. At surfactant concentrations below a “critical micelle concentration” (cmc), virtually no micelles exist. Surfactant doses in excess of the cmc produce micelles at a concentration equal to the difference between the total surfactant concentration and the cmc. The term “critical micelle con-centration” is really a misnomer, as this value is the “specific monomer concentration”that is in equilibrium with the micelles. The concentration of micelles has little effect on the cmc. This is analagous to precipitation reactions, where the amount of solid in equi-librium with a saturated aqueous phase is not dependent on the aqueous saturation con-centration. Surfactant micelles are sometimes considered to be a pseudo-phase because they can not be separated from the aqueous phase in which they reside without destroy-ing them. They are dynamic entities, forming and dissaggregating spontaneously and nearly instantaneously in water upon a change in surfactant concentration. Due to counter-ion association on charged micelles, cmc values of anionic surfactants decrease
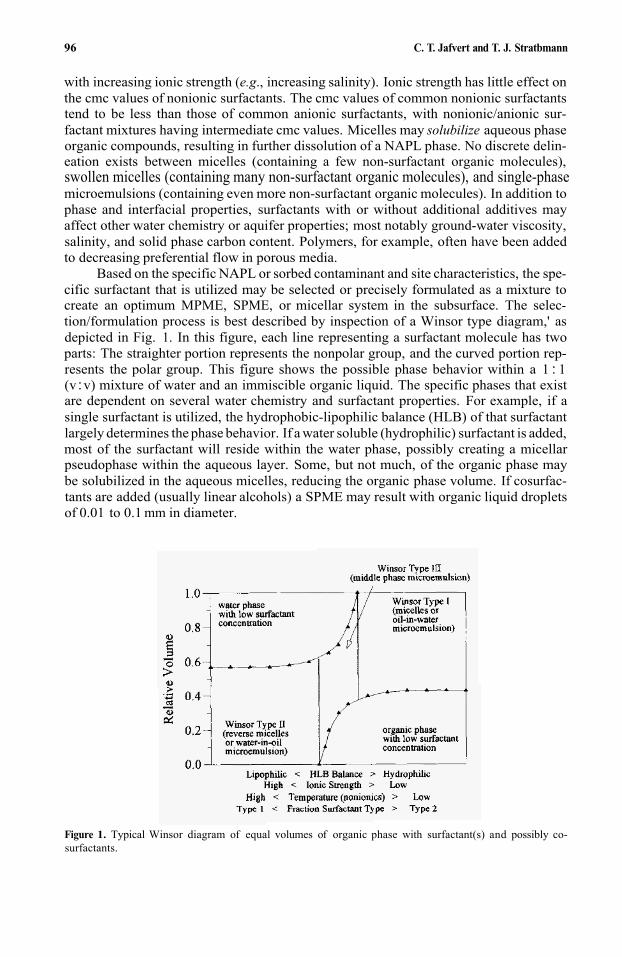
96 C. T. Jafvert and T. J. Stratbmann
with increasing ionic strength (e.g., increasing salinity). Ionic strength has little effect onthe cmc values of nonionic surfactants. The cmc values of common nonionic surfactants tend to be less than those of common anionic surfactants, with nonionic/anionic sur-factant mixtures having intermediate cmc values. Micelles may solubilize aqueous phaseorganic compounds, resulting in further dissolution of a NAPL phase. No discrete delin-eation exists between micelles (containing a few non-surfactant organic molecules), swollen micelles (containing many non-surfactant organic molecules), and single-phasemicroemulsions (containing even more non-surfactant organic molecules). In addition to phase and interfacial properties, surfactants with or without additional additives may affect other water chemistry or aquifer properties; most notably ground-water viscosity, salinity, and solid phase carbon content. Polymers, for example, often have been added to decreasing preferential flow in porous media.
Based on the specific NAPL or sorbed contaminant and site characteristics, the spe-cific surfactant that is utilized may be selected or precisely formulated as a mixture to create an optimum MPME, SPME, or micellar system in the subsurface. The selec-tion/formulation process is best described by inspection of a Winsor type diagram,' asdepicted in Fig. 1. In this figure, each line representing a surfactant molecule has two parts: The straighter portion represents the nonpolar group, and the curved portion rep-resents the polar group. This figure shows the possible phase behavior within a 1 : 1(v :v) mixture of water and an immiscible organic liquid. The specific phases that exist are dependent on several water chemistry and surfactant properties. For example, if a single surfactant is utilized, the hydrophobic-lipophilic balance (HLB) of that surfactant largely determines the phase behavior. If a water soluble (hydrophilic) surfactant is added, most of the surfactant will reside within the water phase, possibly creating a micellar pseudophase within the aqueous layer. Some, but not much, of the organic phase may be solubilized in the aqueous micelles, reducing the organic phase volume. If cosurfac-tants are added (usually linear alcohols) a SPME may result with organic liquid droplets of 0.01 to 0.1 mm in diameter.
Figure 1. Typical Winsor diagram of equal volumes of organic phase with surfactant(s) and possibly co-surfactants.
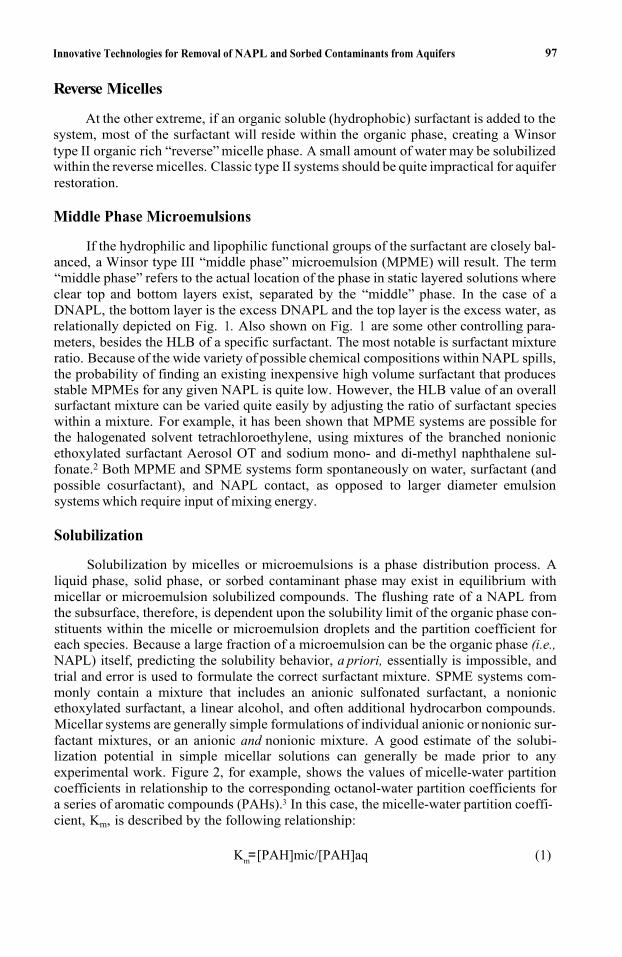
Innovative Technologies for Removal of NAPL and Sorbed Contaminants from Aquifers
Reverse Micelles
97
At the other extreme, if an organic soluble (hydrophobic) surfactant is added to the system, most of the surfactant will reside within the organic phase, creating a Winsor type II organic rich “reverse” micelle phase. A small amount of water may be solubilized within the reverse micelles. Classic type II systems should be quite impractical for aquifer restoration.
Middle Phase Microemulsions
If the hydrophilic and lipophilic functional groups of the surfactant are closely bal-anced, a Winsor type III “middle phase” microemulsion (MPME) will result. The term “middle phase” refers to the actual location of the phase in static layered solutions where clear top and bottom layers exist, separated by the “middle” phase. In the case of a DNAPL, the bottom layer is the excess DNAPL and the top layer is the excess water, as relationally depicted on Fig. 1. Also shown on Fig. 1 are some other controlling para-meters, besides the HLB of a specific surfactant. The most notable is surfactant mixture ratio. Because of the wide variety of possible chemical compositions within NAPL spills, the probability of finding an existing inexpensive high volume surfactant that produces stable MPMEs for any given NAPL is quite low. However, the HLB value of an overall surfactant mixture can be varied quite easily by adjusting the ratio of surfactant species within a mixture. For example, it has been shown that MPME systems are possible for the halogenated solvent tetrachloroethylene, using mixtures of the branched nonionic ethoxylated surfactant Aerosol OT and sodium mono- and di-methyl naphthalene sul-fonate.2 Both MPME and SPME systems form spontaneously on water, surfactant (andpossible cosurfactant), and NAPL contact, as opposed to larger diameter emulsion systems which require input of mixing energy.
Solubilization
Solubilization by micelles or microemulsions is a phase distribution process. Aliquid phase, solid phase, or sorbed contaminant phase may exist in equilibrium with micellar or microemulsion solubilized compounds. The flushing rate of a NAPL from the subsurface, therefore, is dependent upon the solubility limit of the organic phase con-stituents within the micelle or microemulsion droplets and the partition coefficient for each species. Because a large fraction of a microemulsion can be the organic phase (i.e.,NAPL) itself, predicting the solubility behavior, a priori, essentially is impossible, and trial and error is used to formulate the correct surfactant mixture. SPME systems com-monly contain a mixture that includes an anionic sulfonated surfactant, a nonionic ethoxylated surfactant, a linear alcohol, and often additional hydrocarbon compounds.Micellar systems are generally simple formulations of individual anionic or nonionic sur-factant mixtures, or an anionic and nonionic mixture. A good estimate of the solubi-lization potential in simple micellar solutions can generally be made prior to anyexperimental work. Figure 2, for example, shows the values of micelle-water partition coefficients in relationship to the corresponding octanol-water partition coefficients for a series of aromatic compounds (PAHs).3 In this case, the micelle-water partition coeffi-cient, Km, is described by the following relationship:
Km=[PAH]mic/[PAH]aq (1)
98 C. T. Jafvert and T. J. Strathmann
Figure 2. The relationship between the micelle-water partition coefficient (Km) and the octanol-water partitioncoefficient (Kow) for the anionic surfactant sodium—dodecylsulfate(from (3)).
where [PAH]mic has units of mass (mole) contaminant per mass (mole) of surfactant and [PAH]aq has units of mass (mole) contaminant per volume (L) of water. This relation-ship can be somewhat deceiving. It would appear that those compounds which are the least water soluble have the greatest solubility within the micelles. This is not true as these values represent partition constants only, and not absolute solubilities. Through this series of compounds, as the Kow value increases, water solubility decreases (recall this isa log scale). For example, the solubility of perylene in water is only 0.0002mg/L, whereas benzene’s solubility is 1,800mg/L, a difference of more than 61og units. To produce a 4log unit increase in the micelle-water partition coefficient, the solubility within the micelles must actually decrease approximately 2 log units.
Indeed, at saturation under standard pressure and temperature, approximately 35benzene molecules can be solubilized by one dodecylsulfate micelle composed of 60 to 70 surfactant molecules, whereas, on average much less than one perylene molecule is solubilized within each micelle. Micellization of contaminants, therefore, generally will require significant surfactant doses. The molar solubilization ratio (MSR) is the ratio of contaminant molecules solubilized to surfactant molecules within micelles at saturation. Hence, for benzene the ratio is approximately 0.5 for micelles composed of dodecylsulfate. The MSR for most halogenated ethenes and ethanes (PCE, TCE, 1,2-DCA, etc.) is of this same order (0.2 to 0.5), meaning that for every ten surfactant mol-ecules applied, approximately 2 to 5 molecules of chlorinated ethane or ethene may be recovered.
Solubilization within SPME systems is somewhat similar to simple micellar systems. In this case, however, because of the much larger volume of the microemulsion phase,more NAPL is solubilized. These systems are more complex in that the stability of the phase is partly determined by the partitioning to the subsurface materials of the many
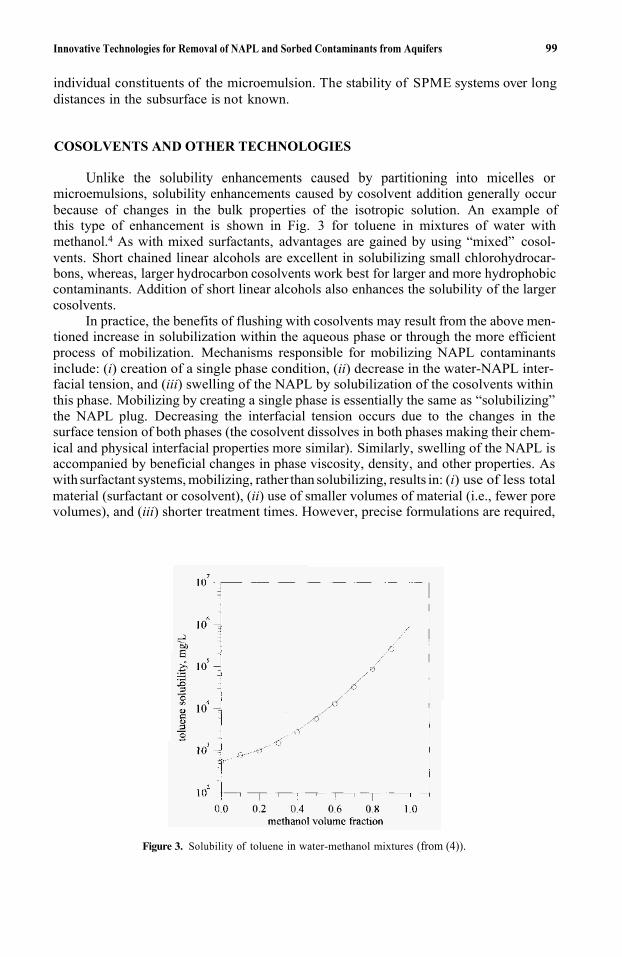
Innovative Technologies for Removal of NAPL and Sorbed Contaminants from Aquifers
individual constituents of the microemulsion. The stability of SPME systems over longdistances in the subsurface is not known.
99
COSOLVENTS AND OTHER TECHNOLOGIES
Unlike the solubility enhancements caused by partitioning into micelles ormicroemulsions, solubility enhancements caused by cosolvent addition generally occurbecause of changes in the bulk properties of the isotropic solution. An example ofthis type of enhancement is shown in Fig. 3 for toluene in mixtures of water with methanol.4 As with mixed surfactants, advantages are gained by using “mixed” cosol-vents. Short chained linear alcohols are excellent in solubilizing small chlorohydrocar-bons, whereas, larger hydrocarbon cosolvents work best for larger and more hydrophobiccontaminants. Addition of short linear alcohols also enhances the solubility of the larger cosolvents.
In practice, the benefits of flushing with cosolvents may result from the above men-tioned increase in solubilization within the aqueous phase or through the more efficient process of mobilization. Mechanisms responsible for mobilizing NAPL contaminants include: (i) creation of a single phase condition, (ii) decrease in the water-NAPL inter- facial tension, and (iii) swelling of the NAPL by solubilization of the cosolvents within this phase. Mobilizing by creating a single phase is essentially the same as “solubilizing” the NAPL plug. Decreasing the interfacial tension occurs due to the changes in the surface tension of both phases (the cosolvent dissolves in both phases making their chem-ical and physical interfacial properties more similar). Similarly, swelling of the NAPL is accompanied by beneficial changes in phase viscosity, density, and other properties. As with surfactant systems, mobilizing, rather than solubilizing, results in: (i) use of less total material (surfactant or cosolvent), (ii) use of smaller volumes of material (i.e., fewer pore volumes), and (iii) shorter treatment times. However, precise formulations are required,
Figure 3. Solubility of toluene in water-methanol mixtures (from (4)).
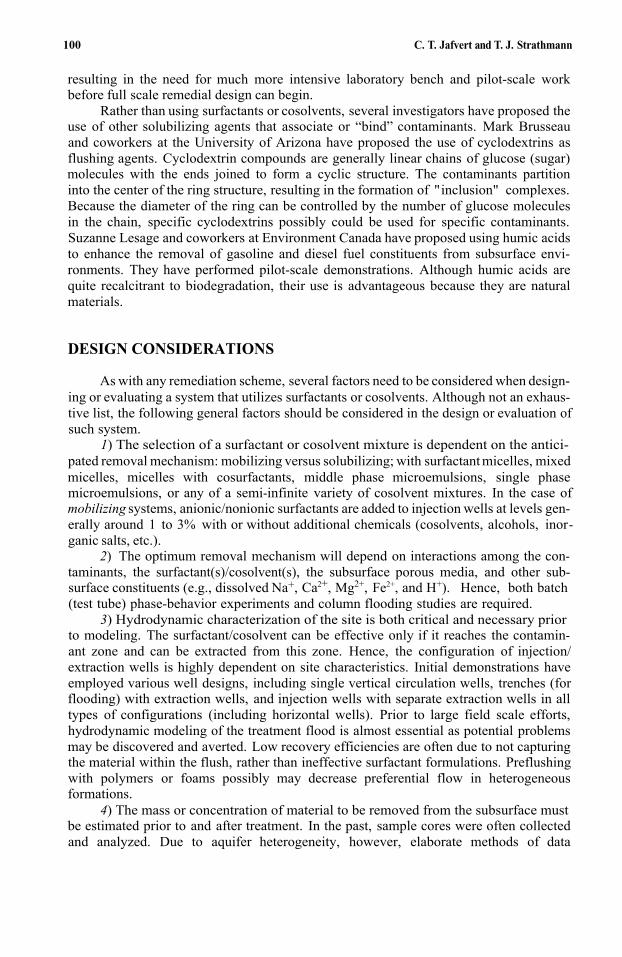
100 C. T. Jafvert and T. J. Strathmann
resulting in the need for much more intensive laboratory bench and pilot-scale work before full scale remedial design can begin.
Rather than using surfactants or cosolvents, several investigators have proposed the use of other solubilizing agents that associate or “bind” contaminants. Mark Brusseau and coworkers at the University of Arizona have proposed the use of cyclodextrins as flushing agents. Cyclodextrin compounds are generally linear chains of glucose (sugar)molecules with the ends joined to form a cyclic structure. The contaminants partitioninto the center of the ring structure, resulting in the formation of "inclusion" complexes.Because the diameter of the ring can be controlled by the number of glucose molecules in the chain, specific cyclodextrins possibly could be used for specific contaminants. Suzanne Lesage and coworkers at Environment Canada have proposed using humic acids to enhance the removal of gasoline and diesel fuel constituents from subsurface envi-ronments. They have performed pilot-scale demonstrations. Although humic acids are quite recalcitrant to biodegradation, their use is advantageous because they are natural materials.
DESIGN CONSIDERATIONS
As with any remediation scheme, several factors need to be considered when design-ing or evaluating a system that utilizes surfactants or cosolvents. Although not an exhaus-tive list, the following general factors should be considered in the design or evaluation ofsuch system.
1) The selection of a surfactant or cosolvent mixture is dependent on the antici- pated removal mechanism: mobilizing versus solubilizing; with surfactant micelles, mixed micelles, micelles with cosurfactants, middle phase microemulsions, single phase microemulsions, or any of a semi-infinite variety of cosolvent mixtures. In the case of mobilizing systems, anionic/nonionic surfactants are added to injection wells at levels gen-erally around 1 to 3% with or without additional chemicals (cosolvents, alcohols, inor-ganic salts, etc.).
2) The optimum removal mechanism will depend on interactions among the con-taminants, the surfactant(s)/cosolvent(s), the subsurface porous media, and other sub-surface constituents (e.g., dissolved Na+, Ca2+, Mg2+, Fe2+, and H+). Hence, both batch(test tube) phase-behavior experiments and column flooding studies are required.
3) Hydrodynamic characterization of the site is both critical and necessary prior to modeling. The surfactant/cosolvent can be effective only if it reaches the contamin-ant zone and can be extracted from this zone. Hence, the configuration of injection/ extraction wells is highly dependent on site characteristics. Initial demonstrations have employed various well designs, including single vertical circulation wells, trenches (for flooding) with extraction wells, and injection wells with separate extraction wells in all types of configurations (including horizontal wells). Prior to large field scale efforts, hydrodynamic modeling of the treatment flood is almost essential as potential problems may be discovered and averted. Low recovery efficiencies are often due to not capturing the material within the flush, rather than ineffective surfactant formulations. Preflushing with polymers or foams possibly may decrease preferential flow in heterogeneous formations.
4) The mass or concentration of material to be removed from the subsurface must be estimated prior to and after treatment. In the past, sample cores were often collected and analyzed. Due to aquifer heterogeneity, however, elaborate methods of data
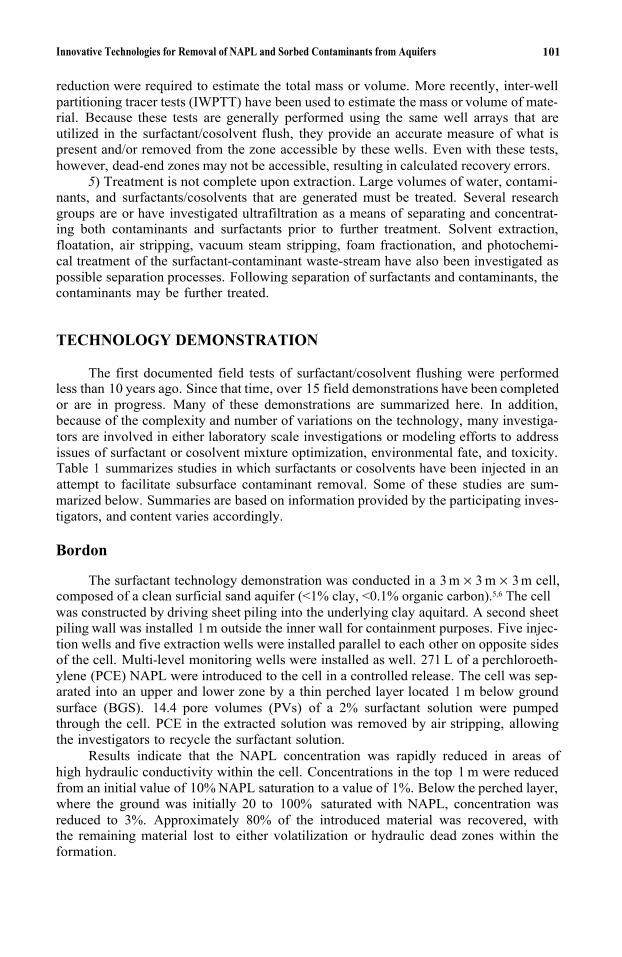
Innovative Technologies for Removal of NAPL and Sorbed Contaminants from Aquifers
reduction were required to estimate the total mass or volume. More recently, inter-wellpartitioning tracer tests (IWPTT) have been used to estimate the mass or volume of mate-rial. Because these tests are generally performed using the same well arrays that are utilized in the surfactant/cosolvent flush, they provide an accurate measure of what is present and/or removed from the zone accessible by these wells. Even with these tests, however, dead-end zones may not be accessible, resulting in calculated recovery errors.
5) Treatment is not complete upon extraction. Large volumes of water, contami- nants, and surfactants/cosolvents that are generated must be treated. Several research groups are or have investigated ultrafiltration as a means of separating and concentrat-ing both contaminants and surfactants prior to further treatment. Solvent extraction,floatation, air stripping, vacuum steam stripping, foam fractionation, and photochemi-cal treatment of the surfactant-contaminant waste-stream have also been investigated as possible separation processes. Following separation of surfactants and contaminants, the contaminants may be further treated.
101
TECHNOLOGY DEMONSTRATION
The first documented field tests of surfactant/cosolvent flushing were performed less than 10 years ago. Since that time, over 15 field demonstrations have been completed or are in progress. Many of these demonstrations are summarized here. In addition, because of the complexity and number of variations on the technology, many investiga-tors are involved in either laboratory scale investigations or modeling efforts to address issues of surfactant or cosolvent mixture optimization, environmental fate, and toxicity. Table 1 summarizes studies in which surfactants or cosolvents have been injected in an attempt to facilitate subsurface contaminant removal. Some of these studies are sum-marized below. Summaries are based on information provided by the participating inves-tigators, and content varies accordingly.
Bordon
The surfactant technology demonstration was conducted in a 3 m × 3 m × 3 m cell,composed of a clean surficial sand aquifer (<1% clay, <0.1% organic carbon).5,6 The cell was constructed by driving sheet piling into the underlying clay aquitard. A second sheet piling wall was installed 1 m outside the inner wall for containment purposes. Five injec-tion wells and five extraction wells were installed parallel to each other on opposite sides of the cell. Multi-level monitoring wells were installed as well. 271 L of a perchloroeth-ylene (PCE) NAPL were introduced to the cell in a controlled release. The cell was sep-arated into an upper and lower zone by a thin perched layer located 1 m below ground surface (BGS). 14.4 pore volumes (PVs) of a 2% surfactant solution were pumpedthrough the cell. PCE in the extracted solution was removed by air stripping, allowing the investigators to recycle the surfactant solution.
Results indicate that the NAPL concentration was rapidly reduced in areas of high hydraulic conductivity within the cell. Concentrations in the top 1 m were reduced from an initial value of 10% NAPL saturation to a value of 1%. Below the perched layer,where the ground was initially 20 to 100% saturated with NAPL, concentration wasreduced to 3%. Approximately 80% of the introduced material was recovered, with the remaining material lost to either volatilization or hydraulic dead zones within theformation.
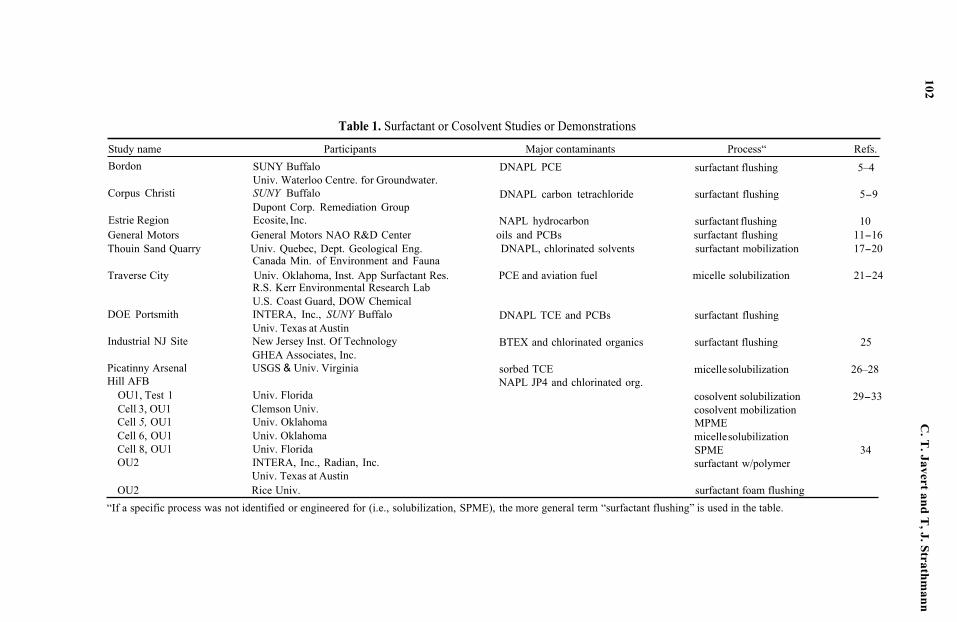
Table 1. Surfactant or Cosolvent Studies or Demonstrations
Study name Participants Major contaminants Process“ Refs. Bordon SUNY Buffalo DNAPL PCE surfactant flushing 5–4
Corpus Christi SUNY Buffalo DNAPL carbon tetrachloride surfactant flushing 5-9
Estrie Region Ecosite, Inc. NAPL hydrocarbon surfactant flushing 10
Univ. Waterloo Centre. for Groundwater.
Dupont Corp. Remediation Group
General Motors General Motors NAO R&D Center oils and PCBs surfactant flushing 11-16Thouin Sand Quarry Univ. Quebec, Dept. Geological Eng. DNAPL, chlorinated solvents surfactant mobilization 17-20
Canada Min. of Environment and Fauna
R.S. Kerr Environmental Research Lab U.S. Coast Guard, DOW Chemical
Univ. Texas at Austin
GHEA Associates, Inc.
Traverse City Univ. Oklahoma, Inst. App Surfactant Res. PCE and aviation fuel micelle solubilization 21-24
DOE Portsmith INTERA, Inc., SUNY Buffalo DNAPL TCE and PCBs surfactant flushing
Industrial NJ Site New Jersey Inst. Of Technology BTEX and chlorinated organics surfactant flushing 25
Picatinny Arsenal USGS & Univ. Virginia sorbed TCE micelle solubilization 26–28 Hill AFB NAPL JP4 and chlorinated org.
OU1, Test 1 Univ. Florida cosolvent solubilization 29-33Cell 3, OU1 Clemson Univ. cosolvent mobilization Cell 5, OU1 Univ. Oklahoma MPMECell 6, OU1 Univ. Oklahoma micelle solubilization Cell 8, OU1 Univ. Florida SPME 34OU2 INTERA, Inc., Radian, Inc. surfactant w/polymer
OU2 Rice Univ. surfactant foam flushing Univ. Texas at Austin
“If a specific process was not identified or engineered for (i.e., solubilization, SPME), the more general term “surfactant flushing” is used in the table.
102 C
. T. Javert an
d T
, J. Strath
man
n
Innovative Technologies for Removal of NAPL and Sorbed Contaminants from Aquifers 103
Corpus Christi
Carbon tetrachloride (CTET) was present at the demonstration site in a shallowaquifer, underlain by a thick clay aquitard.5–9 The target zone was a 12ft thick fine grainsand lens (variable smectitic clay content 1 to 15%, 0.025 to 0.031% organic carbon, and 12,000mg/L total dissolved solids) located between 12 to 24ft BGS. Hydraulic conduc-tivity was moderate (≥ 10-3 cm/sec). An array of 6 injection wells and a single centralextraction well were installed. Surfactant was recycled in subsequent flushing PVs duringpart of the test demonstration.
Prior to surfactant addition, concentrations of CTET in monitoring wells wasbetween 200–300mg/L. Concentrations jumped to 800-900mg/L when surfactant con-centrations reached 0.5% in monitoring wells. Approximately 73 gallons of CTET was removed using 12.5 PVs of surfactant solution.
Estrie Region
This commercial surfactant demonstration site was located beneath a machine shop in Estrie Region, in Quebec, Canada.10The contamination zone extended from 2 to 4.3m beneath a concrete slab floor. The volume of contaminated soil was estimated to be 1,800m3 with approximately 1 m of a free floating hydrocarbon phase. The soil was char-acterized as a fine sand (10–12% silt). The water table was located approximately 3mBGS. Hydraulic conductivity in the zone of contamination was estimated at 10–4cm/sec.400 injection-extraction wells were installed in 3 distinct zones: A peripheral network tohydraulically isolate the contamination, a second zone used only to extract surfactant-contaminant solution, and a third zone which was used both to inject and extract mate-rial. The extract was processed in an on-site wastewater treatment system. Laboratory feasibility trials were performed to: Select the surfactant; evaluate biodegradability and toxicity of wash solutions; and plan hydraulic controls. A computerized system for dataacquisition was installed to monitor ground-water movement. Nonionic biodegradable surfactants were selected for use.
Over a 50-day combined washing period (20 and 30 days in 1993 and 1994, respec-tively) 37.6m3 of free phase oil was recovered. 8 subsequent cycles of washing (60 day period of time) resulted in approximately 160,000 kg of oil recovered (mostly emulsified). Following extraction, high levels of hydrocarbon degrading microorganisms weredetected in the soil.
General Motors
The test site for this demonstration was located on a five acre parcel surrounded by a previously installed containment wall which extends to a depth of 60ft BGS.11–16
Contamination was confined to the upper 15ft of subsurface fill material. Contamina-tion was estimated from soil cores to be approximately 6,000 ppm PCBs and 67,000ppm miscellaneous oils. Surfactant solution was applied to a test plot within the test site, 10 ft in diameter by 5 ft deep. The extracted leachate contained both PCBs and otheroils. Biotreatment of the leachate facilitated removal of both the surfactant and oil contaminants. The PCBs were then removed by adsorption on activated carbon. In other tests performed on the leachate, the surfactant solution was concentrated using a Romicon Model HF-Lab-5 ultrafiltration unit with either a PM500 or a XM50 membrane.
104 C. T. Jafvert and T. J. Strathmann
Approximately 10% of the contaminants were recovered using 5.7 PVs of surfactant solution. An additional 14% was recovered using 2.3 PVs during a similar test the follow-ing year. In the ultrafiltration experiments, 67% of the surfactant mass was recovered with the PM500 membrane, with 90 and 83% of the PCBs and oils being retained, respectively. The XM50 membrane did not capture the surfactant quite as efficiently (46%), but retained approximately the same fraction of PCB and oil (94% and 89%, respectively).
Thouin Sand Quarry
The site for this surfactant technology demonstration was located approximately20km northeast of Montreal, Quebec, Canada.17–20 The test site was characterized by a2m thick silty sand layer underlain by a 30m thick deposit of silty clay. Waste oils and organic compounds dissolved in water were detected in nearby ditches and creeks. Onecentral injection well, four recovery wells (spaced in a square), and 12 multilevel obser-vation wells were installed in the 4.3m x 4.3m test plot. Recovery wells were located 3meters from the injection well. Soil samples collected during well installation indicated that the initial NAPL concentration was approximately 55,000mg/kg dry soil. During the test demonstration the plot was flooded in the following sequence: (1) 1.34PV water, (2)0.54PV polymer, (3) 0.9PV surfactant, (4) 1.6PV polymer, (5) 1.4PV water, (6) and finallywith an injection of bacteria and nutrients to increase biodegradation of the remaining DNAPL.
In the zone swept by the washing solution, 86% of the residual NAPL was recov-ered using the rinse schedule described above. Insufficient flow in regions between the extraction wells resulted in low recoveries of NAPL in some areas. The use of a polymer solution before and after injection of the surfactant solution appeared to be beneficial in reducing preferential flow paths, despite soil heterogeneity.
Traverse City
This surfactant demonstration site consisted of a highly conductive sand formationwith natural ground-water velocities between 3 and 5ft/day.21–24 The saturated zone was located less than 10ft BGS. Soil contamination at the site consisted of PCE (1,000µg/kg)and aviation fuel (1,000mg/kg). Groundwater PCE levels were typically 10µg/L. The objectives of the demonstration were to evaluate a vertical circulation well (VCW) system,and to maximize surfactant recovery. The VCW system was a single borehole well system with two 5ft screen lengths separated by a 3ft spacer. The screens were isolated from eachother within the well with packers. Water/surfactant was injected through the top screen and water/contaminants/surfactant extracted through the bottom screen. 540 gallons of surfactant solution (Dowfax 8390) were added at a surfactant concentration 10 times the cmc value (3.8 wt%).
Due to the high hydraulic conductivity at the site, in order to capture both the sur-factant and solubilized contaminants with the VCW, the extraction rate needed to exceed the injection rate by a factor of 10 to 15. After accounting for dilution water added, esti-mated recovery enhancements due to surfactant addition were 40 to 90 times of back-ground water flushing alone.
Picatinny Arsenal
The site of this surfactant flushing demonstration project was located on a golfcourse.26–28 TCE contamination was detected within a sand and gravel aquifer at soil
Innovative Technologies for Removal of NAPL and Sorbed Contaminants from Aquifers
concentrations of approximately 1 to 5 mg/kg and aqueous phase concentrations of 1 to5mg/L. The water table was approximately 10ft BGS, with a lower confining layer (10 to 15 ft thick) located at 50 ft BGS. The test site was up gradient from an existing pump-and-treat system, installed as an interim remedy, as the site is a listed Superfund site. Three injection wells, 10 ft apart, were installed perpendicular to the natural gradient and tangential to the pump-and-treat extraction well, approximately 100 yards down-gradi-ent from the zone of contamination. One monitoring well was located 30ft up-gradientand three monitoring wells located down-gradient at 10 ft intervals from the injection wells. Clean water was pumped to all three injection wells for approximately 30 days at 3 gal/min. Water in the center injection well was replaced with 400mg/L of surfactant (Triton X-100) at the same flow rate for 30 days while clean water continued in the outer wells. Clean water was pumped to all three wells for an additional 4 months. The purpose of this study was to investigate whether the surfactant would increase the rate of de-sorption of TCE from the solid phase.
Hill Air Force Base Sites
105
Nine test cells for various remediation demonstration projects were constructed at Operational Unit 1 (OU1) on Hill Air Force Base (HAFB), near Salt Lake City, Utah.29–34 Studies are completed, underway, or in design stages at Operational Unit 2(OU2). HAFB is a CERCLA site listed on the National Priorities List. In general approx-imately 6 to 9%) residual NAPL existed within the saturated zone pore space of eachcell. The NAPL was composed largely of JP4 jet fuel (approx. 90 to 95%), with lesser amounts of chlorinated organic solvents (chloroalkenes and chlorobenzenes) and even some PCBs. A nearby landfill contributed to the contamination. Technologies underinvestigation, each with a dedicated field cell, included: steam flushing for NAPL mobi-lization (Tyndall AFB and Praxis Environmental Technologies), air sparging (Michigan Tech.), flushing with cyclodextrins (U. of Arizona), flushing with co-solvents (Clemson), flushing with a surfactant/alcohol single phase microemulsion (SPME) (U. of Florida), flushing with a surfactant that “solubilizes” (U. of Oklahoma), flushing with a surfac-tant that “mobilizes” (U. of Oklahoma), and in-well sparging (same as in-well aeration) (U. of Arizona). In addition, at Operational Unit 2, two demonstrations using surfac-tants were performed.
All the test cells at OU1 were similar in design. Each cell (3m × 5m in surface area)was constructed by driving sheet piling into a clay layer approximately 30 BGS. A sandand gravel aquifer extends from approximately 15ft BGS down to the clay aquitard. Four injection and three extraction wells were installed on opposite sides of each cell. 12 evenly spaced sampling wells, each with nested ports at 5 vertical depths, were installed in the interior of each cell. Prior to and following treatment of each cell, a partitioning tracer test was performed. The mix of tracers were designed according to the expected volumeof NAPL within the cell before and after treatment. Some of the surfactant or cosolvent demonstrations are summarized below.
Test 1, OU1
The first demonstration carried out at HAFB consisted of treatment with a cosolvent mixture. An inter-well partitioning tracer test was conducted prior to intro-duction of cosolvent mixtures. Prior to all testing, the water table in the cell was raised to 5m BGS to saturate the NAPL smear zone. In the cosolvent flushing test,
106 C. T. Jafvert and T. J. Strathmann
approximately 40,000 L (10PVs) of the cosolvent mixture (70% ethanol, 12% n-pentanol,and 28% water) was pumped through the cell over a 15 day period. The intent was to solubilize (not mobilize) the NAPL. An inter-well partitioning tracer test was carried out following the cosolvent flush. During tests, samples were collected from the 12 dedicated monitoring wells and the 3 extraction wells. Soil cores were also collected. The first tracer test indicated a NAPL content of 7% of the porosity. Results indicated that >90% of several target contaminants and >75% of the total NAPL mass was removed duringtreatment.
Cells 5,6, and 8 at OU1
The intent of the demonstration project in cell 5 was to mobilize the NAPL within a middle phase microemulsion (MPME). The MPME was formulated using an aerosol OT/Tween series surfactant mixture with added CaCl2. The intent in cell 6 was to solu-bilize the NAPL within surfactant micelles. An overall 3.6wt% solution of Dowfax 8390 was employed to accomplish solubilization. The specific Dowfax surfactant was chosen largely because of its low sorption potential in the subsurface, resulting from the pres-ence of dual negative charges on each monomer. Ten PVs of surfactant were used, fol-lowed by 5PVs of water. This system is less efficient than the mobilizing system used in Cell 5. The intent with the demonstration in cell 8 was to solubilize NAPL constituents within a SPME system (Brij 97 with n-pentanol as a cosurfactant). Initial laboratory studies were performed in batch, column, and 2-D tanks using the NAPL and sedimen-tary material from the site and other materials. Pre- and post-treatment partitioning tracer tests were performed. Samples were collected from the 12 multiport sampling wells and the three extraction wells.
OU2 Test 1
The surfactant demonstration test at OU2 on HAFB took place in a shallow sand and gravel aquifer. 3 injection and 3 extraction wells were installed with a monitoringwell midway between the injectors and extractors, and a fourth injection well located 10ft behind the line of 3 injection wells. The project was scheduled in 2 phases. In the firstphase a pilot test was performed: (1) To demonstrate that hydraulic control of injected fluids was possible, (2) to quantify the volume of NAPL by conducting a partitioning tracer test between the injector and extractor wells, (3) to show that surfactant could be injected and extracted at the designed rates, (4) to test a steam stripper on the effluent stream, and (5) to identify potential problems and gain some experience with the sam-pling and chemical analysis methods. The goal of the second phase was to attempt to remove as much of the DNAPL with a micellar flood as possible. A partitioning tracer test was carried out subsequent to the surfactant flood.
The following results were obtained during the first phase of the project. The par-titioning tracer test indicated that approximately 800 gallons of NAPL is present in the test section of the aquifer. During the solubilization test, with an 8% surfactant injection over 0.6 days (0.6 pore volumes), the TCE concentration in the central monitoring wellrose from approximately 600mg/L prior to the injection to 40,000mg/L after. Themaximum DNAPL solubilization capacity was calculated to be 61,000 mg/L for this sur-factant injection concentration. Problems with surfactant foaming in the steam stripper were encountered.
Innovative Technologies for Removal of NAPL and Sorbed Contaminants from Aquifers 107
REFERENCES
1. Winsor, PA., “Hydrotropy, solubilization, and related emulsification processes, Part I,” Trans. Faraday Soc.,54:376–399, 1948.
2. Shiau, B.J., Sabatini, D.A., and Harwell, J.H., Ground Water 32:561–569, 1994.3. Jafvert, C.T., “Sediment and saturated-soil-associated reactions involving an anionic surfactant
(dodecylsulfate). 2. Partitioning of PAH compounds among phases,” Environ. Sci. Technol. 25:1039-1045, 1991.
4. Yalkowski, S.H., “Solubility of Organic Solutes in Mixed Aqueous Solvent,” Final Report to the R.S.Kerr Research Lab., U.S. EPA, contract CR811852-01-0, 1985.
5. Fountain, J.C., Waddell-Sheets, C., Lagowski, A., Taylor, C., Frazier, D., and Byrne, M., “Chapter 13:Enhanced removal of dense nonaqueous-phase liquids using surfactants,” in Surfactant-EnhancedSubsurface Remediation: Emerging Technologies, ACS Symposium Series 594, Dave A. Sabatini, RobertC. Knox, and Jeffrey H. Harwell, eds., 1995.
6. Fountain, J.C. and Hodge, D., “Project summary: Extraction of organic pollutants using enhancedsurfactant flushing: Initial field test (part 1). NY State Center for Hazardous Waste Management,February, 1992.
7. Fountain, J.C., “Project summary: Extraction of organic pollutants using enhanced sur-factantflushing, part II,” NY State Center for Hazardous Waste Management, November 1993.
8. Fountain, J.C. and Waddell-Sheets, C., “A pilot field test of surfactant enhanced aquifer remediation:Corpus Christi, Texas,”Extended Abstract from ACS symposium in Atlanta Georgia, September 27-29,1993.
9. Fountain, J.C., “A pilot scale test of surfactant enhanced pump and treat,” in Proceedings of Air andWaste Management Association’s86th Annual Meeting, Denver, June 13-18, 1993.
10. Ross, A., Boulanger, C., and Tremblay, C., “In situ remediation of hydrocarbon contamination usingan injection-extraction process,” Remediation Management, March/April, pp 42-45, 1996.
1 I. Abdul, A.S. and Gibson, T.L., “Laboratory studies of surfactant-enhanced washing of polychlorinatedbiphenyls from sandy materials,” Environ. Sci. and Technol, 25:565–670, 1991.
12. Ang, C.C. and Abdul, A.S., “Aqueous surfactant washing of residual oil contamination from sandysoil,” Ground Water Monitoring Review, 11:121–127, 1991.
13. Ang, C.C. and Abdul, A.S., “A laboratory study of the biodegradation of an alcohol ethoxylatesurfactant by native soil microbes,” J. of Hydrology, 138:191–209, 1991.
14. Abdul, A.S., Gibson, T.L., Ang, C.C., Smith, J.C., and Sobczynski, R.E., “In situ surfactant washing ofpolychlorinated biphenyls and oils from a contaminated site,” Ground Water, 30:219–231, 1992.
15. Abdul, A.S. and Ang, C.C., “In situ surfactant washing of polychlorinated biphenyls and oils from acontaminated field site: Phase II pilot study,” Ground Water, 32: 727-734,1994.
16. Ang, C.C. and Abdul, A.S., “Evaluation of an ultrafiltration method for surfactant recovery and reuseduring in situ washing of contaminated sites: Laboratory and field studies,” Ground Water Monitoring and Remediation, 1994.
17. Martel, R., Gélinas, P., Desnoyers, Jacques E., and Masson Anne, “Phase diagrams to optimizesurfactant solutions for oil and DNAPL recovery in aquifers,” Ground Water, 31:789–800, 1993.
18. Martel, R., Gélinas, P., and Laurent, S., “In situ recovery of DNAPL in sand aquifers: clean-up testusing surfactants at Thouin Sand Quarry,” presented at the 5th Annual Symposium on Ground-waterand Soil Remediation, Toronto, Ontario Canada, Oct. 2-6, 1995.
19. Martel, R. and Gélinas, P, “Surfactant solutions developed for NAPL recovery in contaminatedaquifers,” Ground Water, 34:143-154, 1996.
20. Martel, R. and Gelinas, P., “Residual diesel measurement in sand columns after surfactant/alcoholwashing,” Ground Water, 34:162-167,1996.
21. Knox, R.C., Sabatini, D.A., Harwell, J.H., West, C.C., Blaha, F., Griffin, C., Wallick, D., and Quencer,L., “Traverse City field test,” presented at Workshop on In Situ Surfactant Use, Kansas City, MO,sponsored by the R.S. Kerr Environmental Research Laboratory, Ada OK, held September 20,199s.
22. Sabatini, D.A., Knox, R.C., Harwell, J.H.,Soerens,T.S., Chen, L., Brown, R.E., and West C.C., “Designof a surfactant remediation field demonstration based on laboratory and modeling studies,” in review,Ground Water, submitted September 20, 1996.
23. Knox, R.C., Sabatini, D.A., Harwell, J.H., Brown, R.E., West, C.C., Blaha, F., and Griffin, S.,“Surfactant remediation field demonstration using a vertical circulation well,” in review, Ground Water, submitted September 20, 1996.
108 C. T. Jafvert and T. J. Strathmann
24. Sabatini, D.A., Knox, R.C., and Harwell, J.H. eds., Surfactant Enhanced Subsurface Remediation: Emerging Technologies, ACS Symposium Series, number 594, American Chemical Society, Washington,D.C., 312 pages, 1995.
25. Gotlieb, I., Bozzelli, J.W., and Gotlieb, E., “Soil and Water Decontamination by Extraction withSurfactants,”Seper. Sci. and Technol., 28:793–804, 1993.
26. Di Cesare, D. and Smith, J.A., “Effects of Surfactants on the Desorption Rate of Nonionic OrganicCompounds from Soil to Water,” Reviews of Environmental Contamination and Toxicology, 134:1-29,1994.
27. Deitsch, J.J. and Smith, J.A., “Surfactant Enhanced Remediation of Ground Water at Picatinny Arsenal,New Jersey,” in Morganwalp, D.W. and Aronson, D.A., eds., U.S. Geological Survey Toxics Substances Hydrology Program-Proceedings of the Technical Meeting Colorado Springs, Colorado- September20–24, 1993, U.S. Geological Survey Water Resources Investigations Report 94-4015, 1994.
28. Deitsch, J.J. and Smith, J.A., ‘‘Effect of Triton X-100 on the Rate of Trichloroethene Desorption fromSoil to Water,” Environmental Science and Technology, 29:1069-1080,1995.
29. Annable, M.D., Rao, P.S.C., Hatfield, K., Graham, W.D., and Wood, A.L., “Use of Partit-ioningTracers for Measuring Residual Napl Distribution in a Contaminated Aquifer: Preliminary Results froma Field-Scale Test,” proceedings, 2nd Tracer Workshop, U. of Texas, Austin, TX.
30. Pope, G.A., Jin, M., Dwarakanath, V., Rouse, B., and Sepehrnoori, K., “Partitioning Tracer Tests toCharacterize Organic Contaminants,” proceedings, 2nd Tracer Workshop, U. of Texas, Austin, TX.
31. Augestijin, D.C.M. and Rao, P.S.C., “Enhanced Removal of Organic Contaminants by Solvent Flush-ing,’’ACS Symposium Series, submitted, 1995.
32. Rao, P.S.C., Lee, L.S., and Wood, A.L., “Solubility, sorption, and transport of hydrophobic organicchemicals in Complex Mixtures,” U.S. Environmental Protection Agency, EPA/600-M-91-009, March,1991.
33. Wood, A., Lynn, Bouchard, D., Brusseau, M., and Rao, P.S.C., “Cosolvent effects on sorption andmobility of Organic Contaminants in Soils,” Chemosphere, 21:575–587, 1990.
34. Monthly Progress Reports available from the Advanced Applied Technology Demonstration Facilityfor Environmental Technology, at DOD/AATDF, Rice University, Energy & Environmental SystemsInstitute, M.S. 316, P.O. Box 1892 (or 6100 S. Main St.), Houston, Texas 77251 (or 77005).
10
PILOT-SCALE TREATMENT OF TNT-SPIKEDGROUNDWATER BY HYBRID POPLAR TREES
Phillip L. Thompson1*, Liz A. Ramer2, Pu Yong2,and Jerald L. Schnoor2
1Department of Civil and Environmental Engineering Room 524 ENGRSeattle University Seattle, Washington 98122
2Department of Civil and Environmental Engineering116 ERFUniversity of IowaIowa City, Iowa 52242
ABSTRACT
Groundwater contaminated with TNT (2,4,6-trinitrotoluene) is common at ammu-nition waste sites around the world. Phytoremediation or the use of plants to remediateenvironmental contamination is a promising means of addressing this problem. Thispaper describes a pilot-scale, greenhouse experiment that examined the irrigation ofhybrid poplar trees (Populus deltoides × nigra, DN34) with TNT-spiked groundwater.TNT removal and metabolite production were monitored and showed that up to 90% ofthe TNT could be removed with only minor production of metabolites. Biomass pro-duction, water use and TNT toxicity were also evaluated under these more natural (non-laboratory) conditions. The results indicated that a poplar tree remediation system maybe a feasible solution for low-levels of groundwater contamination.
1. INTRODUCTION
Large volumes of liquid wastes containing residual TNT (2,4,6-trinitrotoluene) aregenerated at munitions production facilities which often creates a red or pink wastestream.1,2 These waste streams were once discharged into lagoons,3 and although this dis-posal method is no longer practiced, thousands of acres across the United States are stillhighly toxic.4
*To whom correspondence may be addressed
Emerging Technologies in Hazardous Waste Management 8, edited by Tedder and Pohland Kluwer Academic/ Plenum Publishers, New York, 2000. 109
110 P. L. Thompson et al.
TNT has an estimated log Kow (octanol-water partition coefficient) of 1.9,5 andPennington et al.6 tested soils from 13 army ammunition plants finding an average soilpartition coefficient (Kd) of 4.0 L/kg. Hence, TNT can be moderately mobile in the envi-ronment and can pose a significant threat to groundwater. Since one-half of the U.S. pop-ulation drinks groundwater,7 there is considerable interest and regulatory pressure to reduce health risks associated with such contamination. TNT is toxic to a variety ofhigher-order organisms’ and can cause cytopenia (a disorder of the blood-formingtissues) resulting in reduced production of leukocytes, erythrocytes, and reticulocytes inmammals.’
Phytoremediation or the use of plants to remediate wastes may be relatively inex-pensive when compared to more traditional clean-up methods such as excavation and incineration. A number of studies have evaluated. the uptake and fate of TNT withinplants,10–22 clearly showing plants are capable of absorption and transformation. Our early studies” of TNT toxicity to 8-inch cuttings in a temperature-controlledlaboratory indicated that concentrations greater than 5 mg/L were detrimental to hybrid poplar trees (Populus deltoides × nigra, DN34). The objective of this research wasto evaluate the performance of large poplar trees exposed to TNT by monitoringthe rates of transpiration and removal of TNT as well as develop an understandingof water use by these larger trees. Another important aspect of this study was the real-time measurement of environmental conditions (light intensity, temperature, humidity), because it reinforces that the conditions were not typical of the constant temperature and generally low light intensity found in most laboratory studies. This project was approached as if it were an actual groundwater treatment system. For example, large cuttings (greater than 1 meter in length) were allowed to grow for three months and then were exposed to 5mg/L TNT for 4 weeks and 25mg/L for the final week of the experi-ment. In addition to monitoring TNT concentrations, this study quantified 4-amino-2,6-dinitrotoluene (4ADNT) and 2-amino-4, 6-dinitrotoluene (2ADNT) which have been identified as the primary transformation products of both microorganisms’ and poplar trees.”
2. MATERIALS AND METHODS
2.1. Cutting Selection
A total of fifteen, 1.2 meter, poplar branches (Populus deltoides × nigra, DN34) werecut from dormant trees in Amana, Iowa. These branches were planted 23cm deep in sand-filled pots, and 100 percent showed bud-break after a two-week period. Eleven of the trees were successfully maintained for the duration of the experiment, and six were chosen for data analysis, because they were of similar size and were transpiring at similar rates at the time dosing with TNT began.
2.2. Instrumentation
The temperature and humidity within the greenhouse was measured with a Per-ception II weather station (Davis Instruments Corp.). Temperature calibration was veri-fied with an analog thermometer, and a psychrometer was used to calibrate the humidity sensor. Solar radiation in the photosynthetically active region (PAR) was measured at the canopy crown with an LI-190SA quantum sensor (LI-COR). Incident radiation was
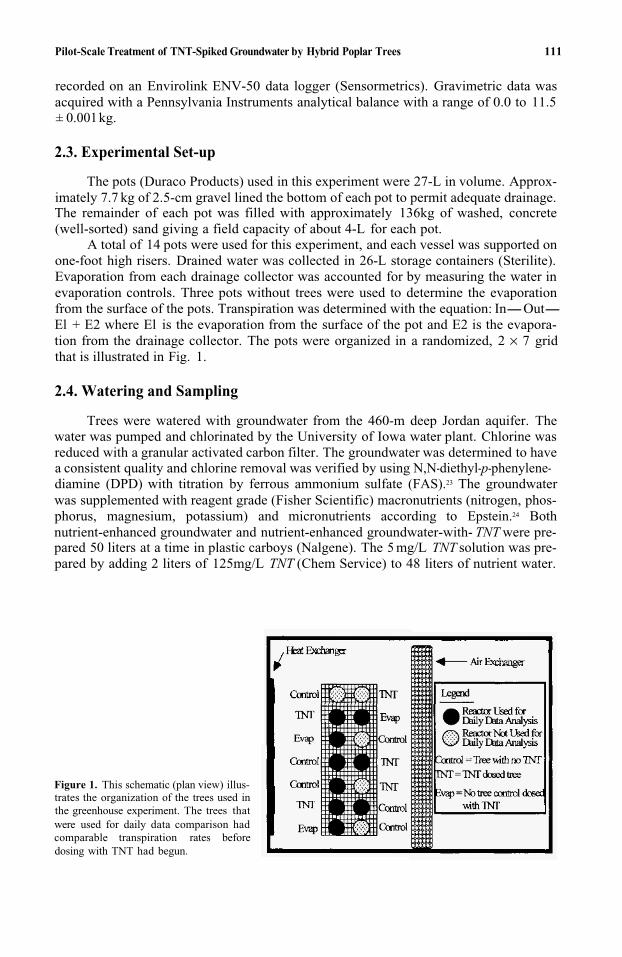
Pilot-Scale Treatment of TNT-Spiked Groundwater by Hybrid Poplar Trees 111
recorded on an Envirolink ENV-50 data logger (Sensormetrics). Gravimetric data was acquired with a Pennsylvania Instruments analytical balance with a range of 0.0 to 11.5 ± 0.001kg.
2.3. Experimental Set-up
The pots (Duraco Products) used in this experiment were 27-L in volume. Approx-imately 7.7 kg of 2.5-cm gravel lined the bottom of each pot to permit adequate drainage. The remainder of each pot was filled with approximately 136kg of washed, concrete (well-sorted) sand giving a field capacity of about 4-L for each pot.
A total of 14 pots were used for this experiment, and each vessel was supported on one-foot high risers. Drained water was collected in 26-L storage containers (Sterilite). Evaporation from each drainage collector was accounted for by measuring the water in evaporation controls. Three pots without trees were used to determine the evaporationfrom the surface of the pots. Transpiration was determined with the equation: In-Out-El + E2 where El is the evaporation from the surface of the pot and E2 is the evapora-tion from the drainage collector. The pots were organized in a randomized, 2 × 7 gridthat is illustrated in Fig. 1.
2.4. Watering and Sampling
Trees were watered with groundwater from the 460-m deep Jordan aquifer. The water was pumped and chlorinated by the University of Iowa water plant. Chlorine was reduced with a granular activated carbon filter. The groundwater was determined to have a consistent quality and chlorine removal was verified by using N,N-diethyl-p-phenylene-diamine (DPD) with titration by ferrous ammonium sulfate (FAS).23 The groundwater was supplemented with reagent grade (Fisher Scientific) macronutrients (nitrogen, phos-phorus, magnesium, potassium) and micronutrients according to Epstein.24 Bothnutrient-enhanced groundwater and nutrient-enhanced groundwater-with- TNT were pre-pared 50 liters at a time in plastic carboys (Nalgene). The 5 mg/L TNT solution was pre-pared by adding 2 liters of 125mg/L TNT (Chem Service) to 48 liters of nutrient water.
Figure 1. This schematic (plan view) illus-trates the organization of the trees used inthe greenhouse experiment. The trees thatwere used for daily data comparison hadcomparable transpiration rates beforedosing with TNT had begun.
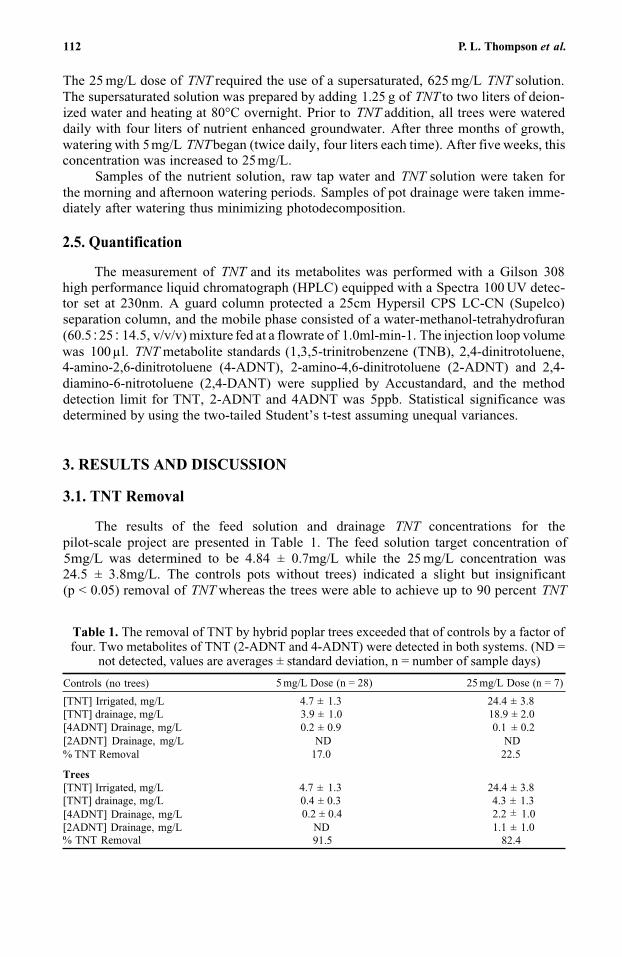
112 P. L. Thompson et al.
The 25 mg/L dose of TNT required the use of a supersaturated, 625 mg/L TNT solution.The supersaturated solution was prepared by adding 1.25 g of TNT to two liters of deion-ized water and heating at 80°C overnight. Prior to TNT addition, all trees were watered daily with four liters of nutrient enhanced groundwater. After three months of growth,watering with 5 mg/L TNTbegan (twice daily, four liters each time). After five weeks, this concentration was increased to 25mg/L.
Samples of the nutrient solution, raw tap water and TNT solution were taken for the morning and afternoon watering periods. Samples of pot drainage were taken imme-diately after watering thus minimizing photodecomposition.
2.5. Quantification
The measurement of TNT and its metabolites was performed with a Gilson 308high performance liquid chromatograph (HPLC) equipped with a Spectra 100 UV detec-tor set at 230nm. A guard column protected a 25cm Hypersil CPS LC-CN (Supelco) separation column, and the mobile phase consisted of a water-methanol-tetrahydrofuran(60.5 : 25 : 14.5, v/v/v) mixture fed at a flowrate of 1.0ml-min-1. The injection loop volumewas 100 µl. TNT metabolite standards (1,3,5-trinitrobenzene (TNB), 2,4-dinitrotoluene,4-amino-2,6-dinitrotoluene (4-ADNT), 2-amino-4,6-dinitrotoluene (2-ADNT) and 2,4-diamino-6-nitrotoluene (2,4-DANT) were supplied by Accustandard, and the method detection limit for TNT, 2-ADNT and 4ADNT was 5ppb. Statistical significance was determined by using the two-tailed Student’s t-test assuming unequal variances.
3. RESULTS AND DISCUSSION
3.1. TNT Removal
The results of the feed solution and drainage TNT concentrations for the pilot-scale project are presented in Table 1. The feed solution target concentration of5mg/L was determined to be 4.84 ± 0.7mg/L while the 25 mg/L concentration was24.5 ± 3.8mg/L. The controls pots without trees) indicated a slight but insignificant(p < 0.05) removal of TNT whereas the trees were able to achieve up to 90 percent TNT
Table 1. The removal of TNT by hybrid poplar trees exceeded that of controls by a factor of four. Two metabolites of TNT (2-ADNT and 4-ADNT) were detected in both systems. (ND =
not detected, values are averages ± standard deviation, n = number of sample days)
Controls (no trees)
[TNT] Irrigated, mg/L 4.7 ± 1.3 24.4 ± 3.8[TNT] drainage, mg/L 3.9 ± 1.0 18.9 ± 2.0
[2ADNT] Drainage, mg/L ND ND % TNT Removal 17.0 22.5
Trees[TNT] Irrigated, mg/L 4.7 ± 1.3 24.4 ± 3.8 [TNT] drainage, mg/L 0.4 ± 0.3 4.3 ± 1.3
5 mg/L Dose (n = 28) 25 mg/L Dose (n = 7)
[4ADNT] Drainage, mg/L 0.2 ± 0.9 0.1 ± 0.2
[4ADNT] Drainage, mg/L 0.2 ± 0.4 2.2 1.0[2ADNT] Drainage, mg/L ND 1.1 ± 1.0 % TNT Removal 91.5 82.4
±
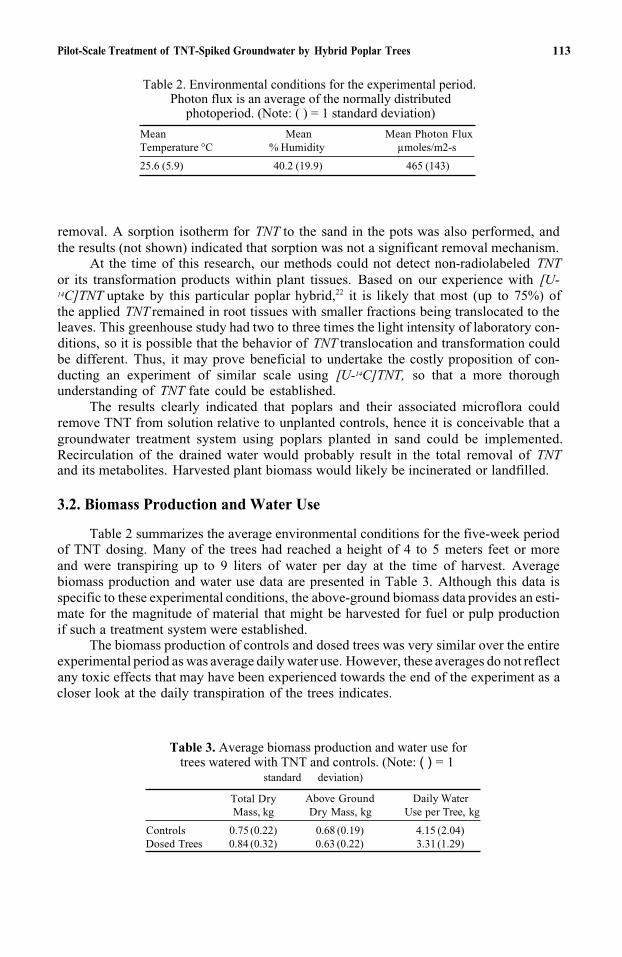
Pilot-Scale Treatment of TNT-Spiked Groundwater by Hybrid Poplar Trees 113
Table 2. Environmental conditions for the experimental period. Photon flux is an average of the normally distributed
photoperiod. (Note: ( ) = 1 standard deviation)
Mean Mean Mean Photon FluxTemperature °C % Humidity µmoles/m2-s
25.6 (5.9) 40.2 (19.9) 465 (143)
removal. A sorption isotherm for TNT to the sand in the pots was also performed, and the results (not shown) indicated that sorption was not a significant removal mechanism.
At the time of this research, our methods could not detect non-radiolabeled TNTor its transformation products within plant tissues. Based on our experience with [U-14C]TNT uptake by this particular poplar hybrid,22 it is likely that most (up to 75%) ofthe applied TNT remained in root tissues with smaller fractions being translocated to the leaves. This greenhouse study had two to three times the light intensity of laboratory con-ditions, so it is possible that the behavior of TNT translocation and transformation could be different. Thus, it may prove beneficial to undertake the costly proposition of con-ducting an experiment of similar scale using [U-14C]TNT, so that a more thorough understanding of TNT fate could be established.
The results clearly indicated that poplars and their associated microflora could remove TNT from solution relative to unplanted controls, hence it is conceivable that a groundwater treatment system using poplars planted in sand could be implemented. Recirculation of the drained water would probably result in the total removal of TNTand its metabolites. Harvested plant biomass would likely be incinerated or landfilled.
3.2. Biomass Production and Water Use
Table 2 summarizes the average environmental conditions for the five-week period of TNT dosing. Many of the trees had reached a height of 4 to 5 meters feet or more and were transpiring up to 9 liters of water per day at the time of harvest. Average biomass production and water use data are presented in Table 3. Although this data is specific to these experimental conditions, the above-ground biomass data provides an esti-mate for the magnitude of material that might be harvested for fuel or pulp production if such a treatment system were established.
The biomass production of controls and dosed trees was very similar over the entire experimental period as was average daily water use. However, these averages do not reflect any toxic effects that may have been experienced towards the end of the experiment as acloser look at the daily transpiration of the trees indicates.
Table 3. Average biomass production and water use for trees watered with TNT and controls. (Note: ( ) = 1
standard deviation)
Total Dry Above Ground Daily WaterMass, kg Dry Mass, kg Use per Tree, kg
Controls 0.75 (0.22) 0.68 (0.19) 4.15 (2.04)Dosed Trees 0.84 (0.32) 0.63 (0.22) 3.31 (1.29)
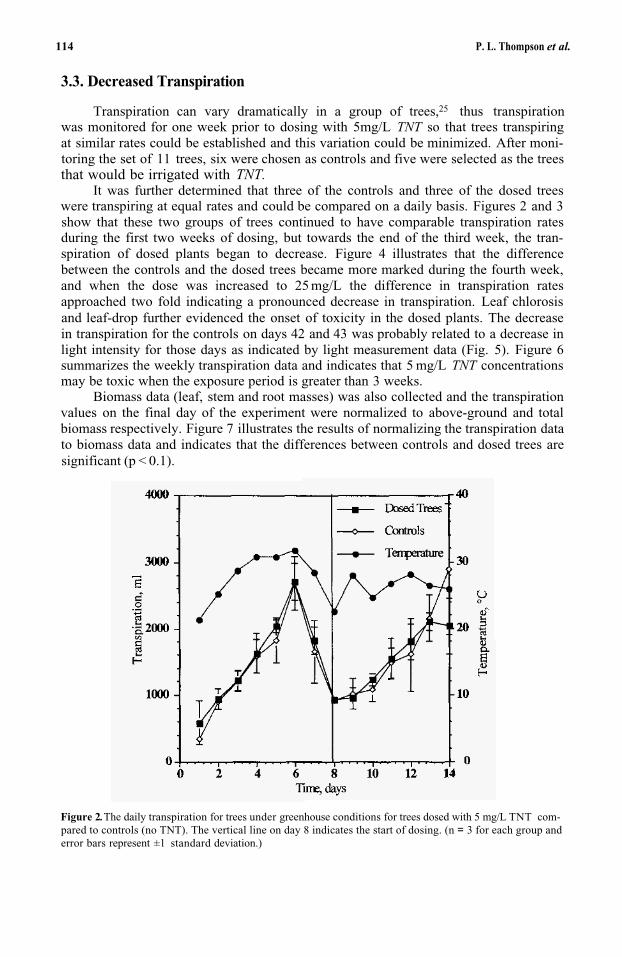
114 P. L. Thompson et al.
3.3. Decreased Transpiration
Transpiration can vary dramatically in a group of trees,25 thus transpirationwas monitored for one week prior to dosing with 5mg/L TNT so that trees transpiringat similar rates could be established and this variation could be minimized. After moni-toring the set of 11 trees, six were chosen as controls and five were selected as the trees that would be irrigated with TNT.
It was further determined that three of the controls and three of the dosed trees were transpiring at equal rates and could be compared on a daily basis. Figures 2 and 3show that these two groups of trees continued to have comparable transpiration rates during the first two weeks of dosing, but towards the end of the third week, the tran-spiration of dosed plants began to decrease. Figure 4 illustrates that the difference between the controls and the dosed trees became more marked during the fourth week, and when the dose was increased to 25 mg/L the difference in transpiration rates approached two fold indicating a pronounced decrease in transpiration. Leaf chlorosis and leaf-drop further evidenced the onset of toxicity in the dosed plants. The decrease in transpiration for the controls on days 42 and 43 was probably related to a decrease in light intensity for those days as indicated by light measurement data (Fig. 5). Figure 6summarizes the weekly transpiration data and indicates that 5 mg/L TNT concentrationsmay be toxic when the exposure period is greater than 3 weeks.
Biomass data (leaf, stem and root masses) was also collected and the transpiration values on the final day of the experiment were normalized to above-ground and total biomass respectively. Figure 7 illustrates the results of normalizing the transpiration data to biomass data and indicates that the differences between controls and dosed trees aresignificant (p < 0.1).
Figure 2.The daily transpiration for trees under greenhouse conditions for trees dosed with 5 mg/L TNT com-pared to controls (no TNT). The vertical line on day 8 indicates the start of dosing. (n = 3 for each group and error bars represent ±1 standard deviation.)
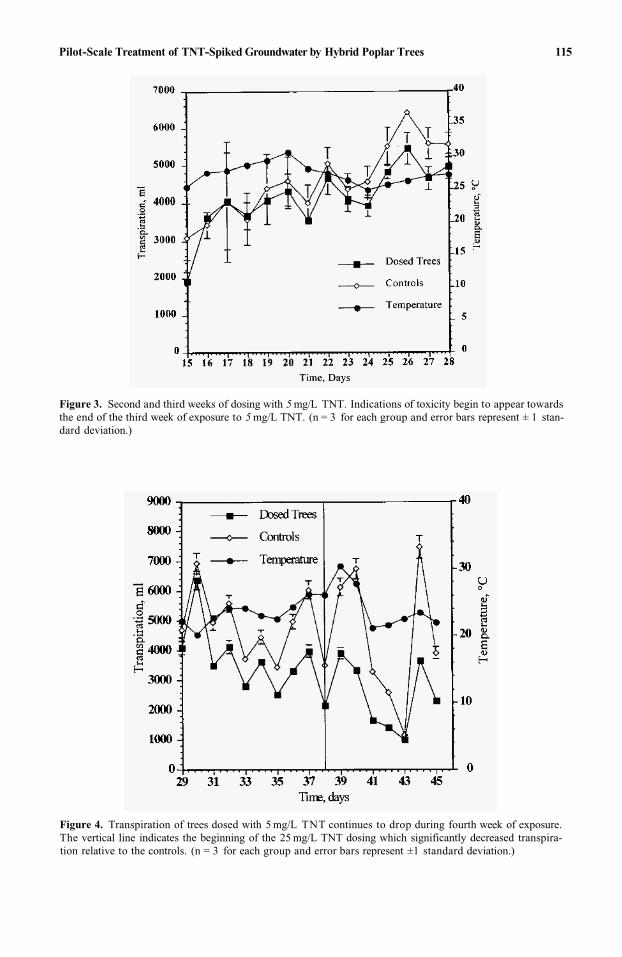
Pilot-Scale Treatment of TNT-Spiked Groundwater by Hybrid Poplar Trees 115
Figure 3. Second and third weeks of dosing with 5 mg/L TNT. Indications of toxicity begin to appear towardsthe end of the third week of exposure to 5 mg/L TNT. (n = 3 for each group and error bars represent ± 1 stan-dard deviation.)
Figure 4. Transpiration of trees dosed with 5 mg/L TNT continues to drop during fourth week of exposure.The vertical line indicates the beginning of the 25 mg/L TNT dosing which significantly decreased transpira-tion relative to the controls. (n = 3 for each group and error bars represent ±1 standard deviation.)
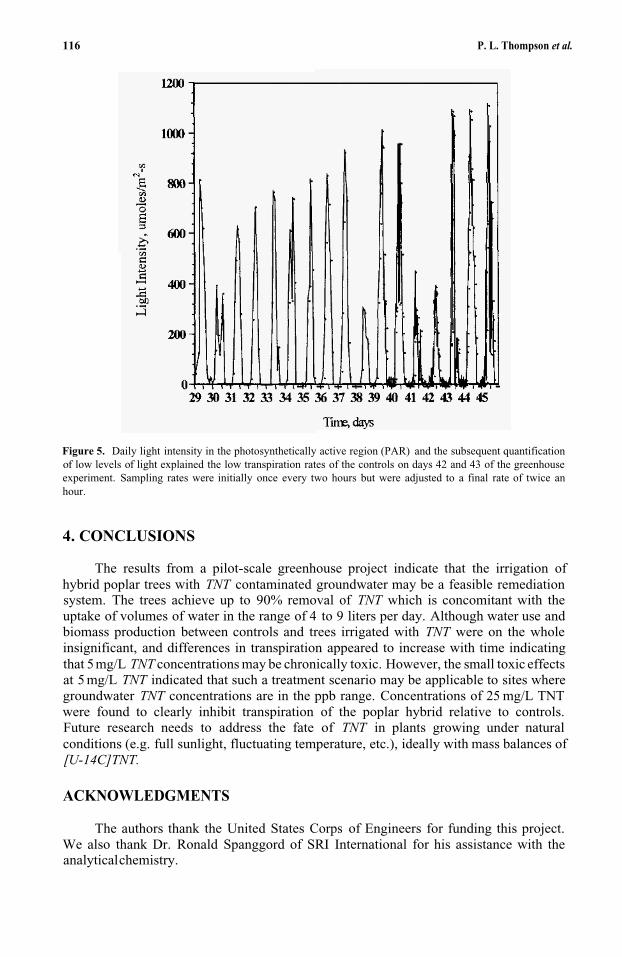
116 P. L. Thompson et al.
Figure 5. Daily light intensity in the photosynthetically active region (PAR) and the subsequent quantificationof low levels of light explained the low transpiration rates of the controls on days 42 and 43 of the greenhouseexperiment. Sampling rates were initially once every two hours but were adjusted to a final rate of twice anhour.
4. CONCLUSIONS
The results from a pilot-scale greenhouse project indicate that the irrigation ofhybrid poplar trees with TNT contaminated groundwater may be a feasible remediationsystem. The trees achieve up to 90% removal of TNT which is concomitant with theuptake of volumes of water in the range of 4 to 9 liters per day. Although water use andbiomass production between controls and trees irrigated with TNT were on the wholeinsignificant, and differences in transpiration appeared to increase with time indicating that 5mg/L TNT concentrations may be chronically toxic. However, the small toxic effectsat 5 mg/L TNT indicated that such a treatment scenario may be applicable to sites wheregroundwater TNT concentrations are in the ppb range. Concentrations of 25 mg/L TNTwere found to clearly inhibit transpiration of the poplar hybrid relative to controls. Future research needs to address the fate of TNT in plants growing under naturalconditions (e.g. full sunlight, fluctuating temperature, etc.), ideally with mass balances of [U-14C]TNT.
ACKNOWLEDGMENTS
The authors thank the United States Corps of Engineers for funding this project.We also thank Dr. Ronald Spanggord of SRI International for his assistance with the analytical chemistry.
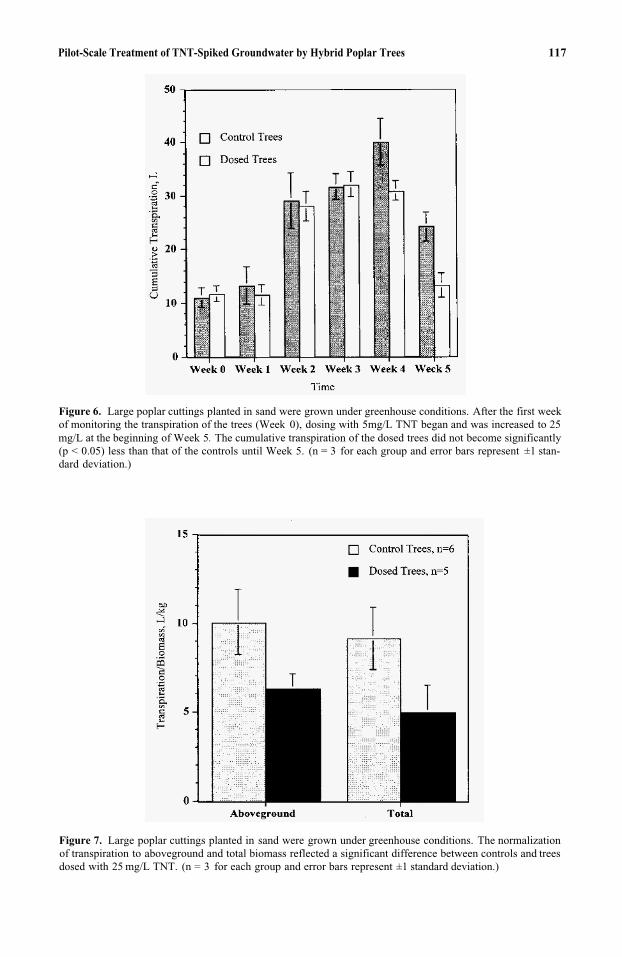
Pilot-Scale Treatment of TNT-Spiked Groundwater by Hybrid Poplar Trees 117
Figure 6. Large poplar cuttings planted in sand were grown under greenhouse conditions. After the first weekof monitoring the transpiration of the trees (Week 0), dosing with 5mg/L TNT began and was increased to 25mg/L at the beginning of Week 5. The cumulative transpiration of the dosed trees did not become significantly(p < 0.05) less than that of the controls until Week 5. (n = 3 for each group and error bars represent ±1 stan- dard deviation.)
Figure 7. Large poplar cuttings planted in sand were grown under greenhouse conditions. The normalization of transpiration to aboveground and total biomass reflected a significant difference between controls and trees dosed with 25 mg/L TNT. (n = 3 for each group and error bars represent ±1 standard deviation.)
118 P. L. Thompson et al.
REFERENCES
1. Urbanski, T., Chemistry and Technolgy of Explosives. MacMillan. New York, 1964.2. Won, W.D., Heckly, R.J., Glover, D.J., and Hoffsommer, J.C., Appl. Microbio. 1974, 5, 513.3. Higson, F.H., Adv. Appl. Microbio. 1992, 27, 1.4. Funk, S.B., Roberts, D.J., Crawford, D.L., and Crawford, R.L., Appl. Environ. Microbio. 1993,7,2171.5. Haderlein, S.B., Weissmahr, K.W., and Schwarzenbach, R.P., Environ. Sci. Technol. 1996, 30, 612.6. Pennington, J.C. and Patrick, R.P., Journ. Environ. Qual. 1990, 19, 559.7. Browner, C.M., Statement Before the U.S. Senate Committee on Environment and Public Works. March
5th, 1998.8. Kaplan, D.L., Biotransformation Pathways of Hazardous Energetic Organo-Nitro Compounds.
Portfolio Publishing Co, Houston, 1990.9. Harris, J.W. and Kellermeyer, R.W., The red cell: production, metabolism, destruction, normal and
abnormal, Harvard University Press: Cambridge, 1970.10. Schott, C.D. and Worthley, E.G., “The Toxicity of TNT and Related Wastes to an Aquatic Flowering
Plant, ‘Lemna Perpusilla’ Torr,” Final Report. Edgewood Arsenal, Aberdeen Proving Ground, MD,report EB-TR-74016, 1974.
11. Leggett, D.C. and Palazzo, A.J., Journ. Environ. Qual. 1986, 15, 49.12. Harvey, S.D., et al. Journ. Chrom. 1990, 518, 361.13. Hughes, J.B., et al. Environ. Sci. Technol. 1997, 31, 266.14. Bhadra, R.D., et al. Environ. Sci. Technol. 1999, 33, 446.15. Goerge, E., et al. Environ. Sci. Pol. Res. 1994, 1, 229.16. Medina, V.F. and McCutcheon, S.C., Bioremed. 1996, 7, 31.17. Peterson, M.M., et al. Environ. Pollut. 1998,99, 53.18. Peterson, M.M., Environ. Pollut. 1996, 93, 57.19. Scheidemann, P.A., et al. J. Plant Physiol. 1998, 152, 242.20. Vanderford, M., Shanks, J.V., and Hughes, J.B., Biotechnol. Letters, 1997, 19: 277.21. Thompson, P.L., Ramer L.A., Guffey, A.P., and Schnoor, J.L., Environ. Tox. Chem. 1997, 17, 902.22. Thompson, P.L., Ramer, L.A., and Schnoor, J.L., Environ. Sci. Technol, 1998, 32, 975.23. Greenberg, A.E., Clesceri, L.S., and Eaton, A.D., Standard Methods for the Examination of Water and
Wastewater. American Public Health Association, Washington D.C., 1992.24. Epstein, E., Mineral nutrition of plants: Principles and perspectives; John Wiley and Sons, Inc., New
York, 1972.25. Dye, P.J. and Olbrich, B.W., Plant, Cell and Environment, 1993, 16, 45.
11
IN SITU GROUNDWATER REMEDIATION USINGTREATMENT WALLS
Radisav D. Vidic and Frederick G. Pohland
Department of Civil and Environmental Engineering University of Pittsburgh Pittsburgh, Pennsylvania 15261
ABSTRACT
Development of treatment wall technology for the clean up of contaminated ground-water resources has expanded in the past few years. The main perceived advan-tage of this technology over ex situ and other in situ ground-water remediationapproaches is reduced operation and maintenance costs. Since the first commercial application of zero-valent iron using a funnel-and-gate system for the removal of chlo-rinated hydrocarbons in February, 1995, several field- and pilot-scale studies are evalu-ating the feasibility of this technology for treatment of both organic and inorganic contaminants.
Although, considerable design details have already been developed through field-and pilot-scale applications of this technology, some critical issues (e.g., establishing tested and proven design procedures, improving construction technologies, documenting long-term performance, and evaluating synergy with other ground-water remediationtechnologies) still remain to be resolved. Currently planned field-scale tests and many ongoing laboratory studies are designed to address these issues and facilitate wider imple-mentation of this technology.
1. TECHNOLOGY DESCRIPTION
Treatment walls involve construction of permanent, semi-permanent, or replace-able units across the flow path of a contaminant plume. As the contaminated ground-water moves passively through the treatment wall, the contaminants are removed by physical, chemical and/or biological processes, including precipitation, sorption, oxida-tion/reduction, fixation, or degradation. These mechanically simple barriers may contain metal-based catalysts, chelating agents, nutrients and oxygen, or other agents that are placed either in the path of the plumes to prevent further migration or immediately down-gradient of the contaminant source to prevent plume formation (Fig. 1). The reactions that take place in such systems depend on a number of parameters such as pH, oxida-tion/reduction potential, concentrations, and kinetics. Therefore, successful application
Emerging Technologies in Hazardous Waste Management 8, edited by Tedder and PohlandKluwer Academic/Plenum Publishers, New York, 2000. 119
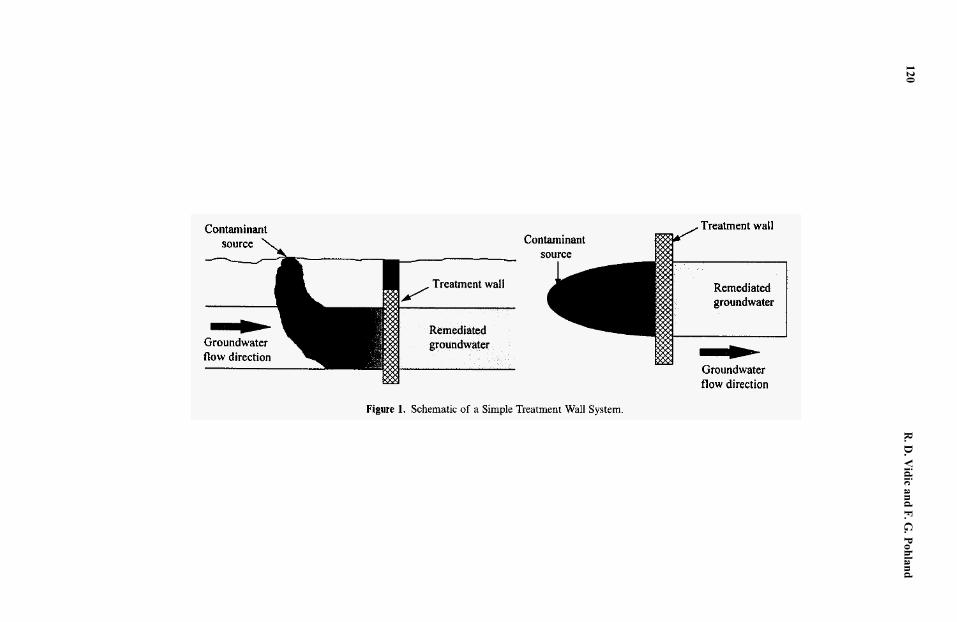
120R
.D.V
idic and F.G.P
ohland
In Situ Groundwater Remediation Using Treatment Walls 121
of this technology requires a sufficient characterization of contaminants, ground-waterflow regime and subsurface geology.
Permeable reactive walls potentially have several advantages over conventional pump-and-treat methods for ground-water remediation. Reactive walls can degrade orimmobilize contaminants in situ without any need to bring them up to the surface. They also do not require continuous input of energy, because a natural gradient of ground-water flow is used to carry contaminants through the reaction zone. Only periodic replacement or rejuvenation of the reaction medium might be required after its capacity is exhausted or it is clogged by precipitants and/or microorganisms. Furthermore, tech-nical and regulatory problems related to ultimate discharge requirements of effluents from pump-and-treat systems are avoided with this technology.
The key issues associated with the application of treatment walls are discussed below.
1.1. Site Characterization
Site characterization is the first step in assessing the potential applicability of treatment wall technology for ground-water remediation, and involves hydrological, geological, and geochemical description of the site and contaminant properties and distribution.
Hydrogeologic modeling and monitoring of the site define the basic dimensions of the contaminant plume, direction of the plume movement, and most appropriate loca-tion for the treatment wall. Site geologic characterization includes lithology, stratigraphy, grain size distribution and structural relationships, and should be documented in a set of geologic cross sections for the wall location. Hydrologic characterization of the site should include aquifer/aquitard boundaries, hydraulic conductivity, and ground-watergradient and flow direction.
Spatial distribution of the contaminant as well as its properties (solubility, vapor pressure, specific density, partitioning, etc.) and chemical relationship to site geologyshould be determined using literature information and analytical testing of soil and ground-water samples collected during site investigations.
Many of the above-mentioned parameters are difficult to determine with certainty which results in considerable variation in the level of contaminant mass flux. Therefore,treatment wall design must account for this inherent variability by incorporating features or safety factors capable of compensating for uncertainty.
1.2. Treatment Wall Design
Major issues associate with the design of a treatment wall include the selection of the reactive media (chemical makeup, particle size distribution, proportion and com-position of admixtures, etc.), residence time in the reaction zone, and the reaction zone size for appropriate life span, as well as addressing issues like the effect of the reaction zone medium on ground-water quality and the ultimate fate or disposition of a treatment wall.
Selection of the reactive media is based on the type (i.e., organic vs. inorganic) and concentration of ground-water contaminants to be treated, ground-water flow velocity and water quality parameters, and the available reaction mechanisms for the removal of contaminants (i.e., sorption, precipitation, and degradation). Tables 1 and 2 in Section 3
122 R. D. Vidic and F. G. Pohland
provide useful information for the initial selection and effectiveness of various reactive media for different contaminants.
Typically, treatment wall system design is based on the results of treatability studies that can incorporate both batch reaction tests and laboratory- or field-scale column experiments. Batch tests are intended to obtain initial measures of media reactivity (i.e., degradation half life, sorption kinetics and capacity, etc.) that form the basis of the reactor design. Alternatively, literature information can be utilized to asses the initial information about media reactivity (e.g., Johnson, et al., 1996 provide a comprehensivereview of the kinetic data obtained for zero-valent iron degradation of halogenated hydrocarbons). Column tests are typically conducted by packing a column with the reac-tive medium and passing the contaminated groundwater through the column until steady-state performance of the reactor is obtained. Flow velocities are adjusted to simulate ground-water velocity and reactor residence time. In addition, information about geo-chemical reactions between the contaminated groundwater and the reactive medium aswell as the impact of the treatment wall on ground-water quality can be assessed from these studies. Information about several batch and column studies can be found later in the text.
Life span of sorption and precipitation barriers is limited by the ultimate capacity of the medium to facilitate appropriate removal reactions. Once the ultimate capacity of the medium is exhausted, contaminant breakthrough will occur. In addition, contami-nant release or resolubilization may occur after the plume or reactive medium isexpanded. In the case of sorption and precipitation barriers for treatment of radioactive contaminants (i.e., Sr, U), an important issue is the possibility of exceeding the limits forClass A low-level nuclear waste as a result of excessive accumulation of these materials on the surface of the reactive medium. This might mean that the wall would have to be replaced at that time, regardless of the fact that the ultimate capacity of the medium might not be exhausted, because low-level nuclear waste above Class A must besolidified/stabilized. Alternatively, it might be possible to rejuvenate the media by in situleaching methods. These issues are generally not of concern for the treatment walls designed for contaminant degradation.
1.3. Installation and Construction
Several methods have been conceived for the installation of permeable treatment walls (MSE, 1996). Most experience with installation of these walls pertains to relatively shallow emplacements (less than 10m) using standard geotechnical design and con-struction approaches, although a few technologies for deeper installations have beenidentified.
In the simplest case, a trench of the appropriate width can be excavated to inter-cept the contaminated strata and backfilled with reactive material (Fig. 2). This method would normally be limited to shallow depths in stable geologic materials. More often, steps like shoring of the trench and use of an appropriate slurry or steel sheet piling are required for excavation to greater depths. Unlike conventional construction approachesfor ground-water cutoff walls that utilize a soil-bentonite slurry (or cement or cement-bentonite slurry), installation of permeable treatment walls requires use of biodegrad-able polymers instead of bentonite or cement to avoid the problems of plugging the wall with residual slurry material.
Frequent criticism that the life expectancy of the reactive media in a treatment wallmay degrade with time has been addressed by developing a construction approach
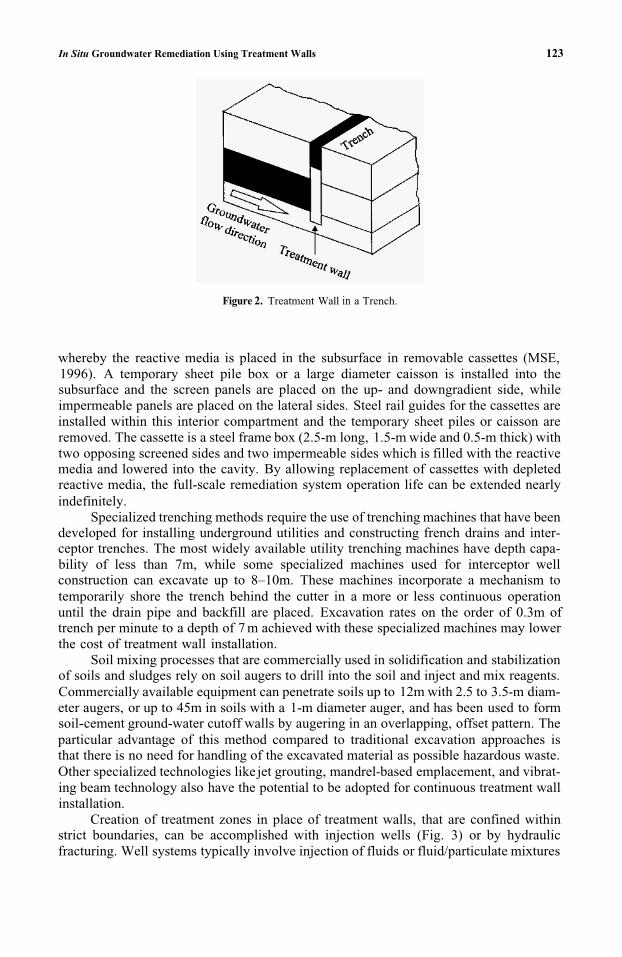
In Situ Groundwater Remediation Using Treatment Walls 123
Figure 2. Treatment Wall in a Trench.
whereby the reactive media is placed in the subsurface in removable cassettes (MSE,1996). A temporary sheet pile box or a large diameter caisson is installed into the subsurface and the screen panels are placed on the up- and downgradient side, while impermeable panels are placed on the lateral sides. Steel rail guides for the cassettes are installed within this interior compartment and the temporary sheet piles or caisson are removed. The cassette is a steel frame box (2.5-m long, 1.5-m wide and 0.5-m thick) with two opposing screened sides and two impermeable sides which is filled with the reactive media and lowered into the cavity. By allowing replacement of cassettes with depleted reactive media, the full-scale remediation system operation life can be extended nearly indefinitely.
Specialized trenching methods require the use of trenching machines that have been developed for installing underground utilities and constructing french drains and inter-ceptor trenches. The most widely available utility trenching machines have depth capa-bility of less than 7m, while some specialized machines used for interceptor well construction can excavate up to 8–10m. These machines incorporate a mechanism to temporarily shore the trench behind the cutter in a more or less continuous operation until the drain pipe and backfill are placed. Excavation rates on the order of 0.3m of trench per minute to a depth of 7 m achieved with these specialized machines may lower the cost of treatment wall installation.
Soil mixing processes that are commercially used in solidification and stabilization of soils and sludges rely on soil augers to drill into the soil and inject and mix reagents. Commercially available equipment can penetrate soils up to 12m with 2.5 to 3.5-m diam-eter augers, or up to 45m in soils with a 1-m diameter auger, and has been used to form soil-cement ground-water cutoff walls by augering in an overlapping, offset pattern. The particular advantage of this method compared to traditional excavation approaches is that there is no need for handling of the excavated material as possible hazardous waste. Other specialized technologies like jet grouting, mandrel-based emplacement, and vibrat-ing beam technology also have the potential to be adopted for continuous treatment wall installation.
Creation of treatment zones in place of treatment walls, that are confined within strict boundaries, can be accomplished with injection wells (Fig. 3) or by hydraulic fracturing. Well systems typically involve injection of fluids or fluid/particulate mixtures
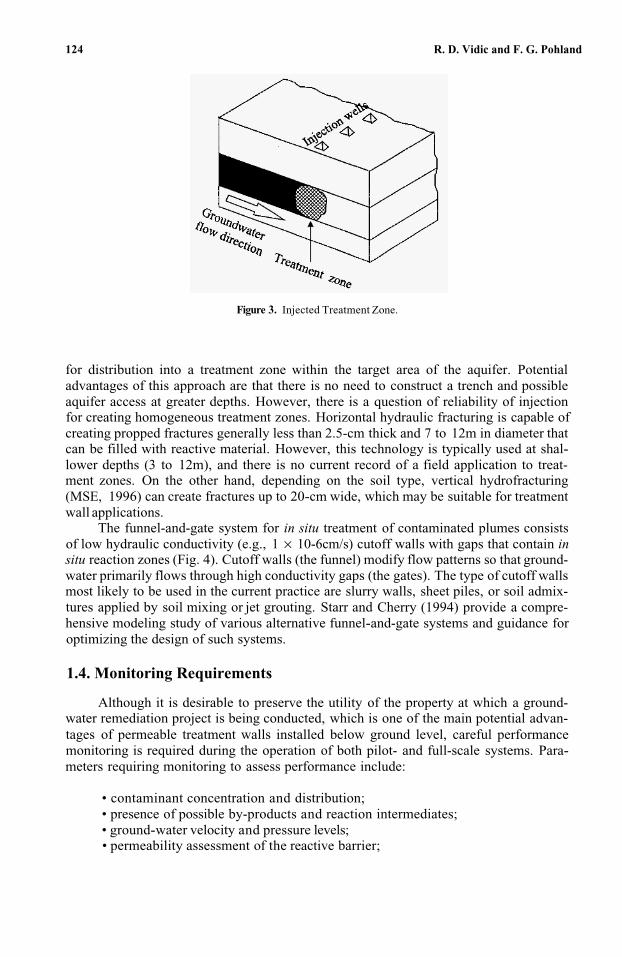
124 R. D. Vidic and F. G. Pohland
Figure 3. Injected Treatment Zone.
for distribution into a treatment zone within the target area of the aquifer. Potential advantages of this approach are that there is no need to construct a trench and possible aquifer access at greater depths. However, there is a question of reliability of injection for creating homogeneous treatment zones. Horizontal hydraulic fracturing is capable ofcreating propped fractures generally less than 2.5-cm thick and 7 to 12m in diameter that can be filled with reactive material. However, this technology is typically used at shal-lower depths (3 to 12m), and there is no current record of a field application to treat-ment zones. On the other hand, depending on the soil type, vertical hydrofracturing (MSE, 1996) can create fractures up to 20-cm wide, which may be suitable for treatmentwall applications.
The funnel-and-gate system for in situ treatment of contaminated plumes consists of low hydraulic conductivity (e.g., 1 × 10⁻⁶cm/s) cutoff walls with gaps that contain insitu reaction zones (Fig. 4). Cutoff walls (the funnel) modify flow patterns so that ground-water primarily flows through high conductivity gaps (the gates). The type of cutoff walls most likely to be used in the current practice are slurry walls, sheet piles, or soil admix-tures applied by soil mixing or jet grouting. Starr and Cherry (1994) provide a compre-hensive modeling study of various alternative funnel-and-gate systems and guidance for optimizing the design of such systems.
1.4. Monitoring Requirements
Although it is desirable to preserve the utility of the property at which a ground-water remediation project is being conducted, which is one of the main potential advan-tages of permeable treatment walls installed below ground level, careful performance monitoring is required during the operation of both pilot- and full-scale systems. Para-meters requiring monitoring to assess performance include:
• contaminant concentration and distribution;• presence of possible by-products and reaction intermediates;• ground-water velocity and pressure levels;• permeability assessment of the reactive barrier;
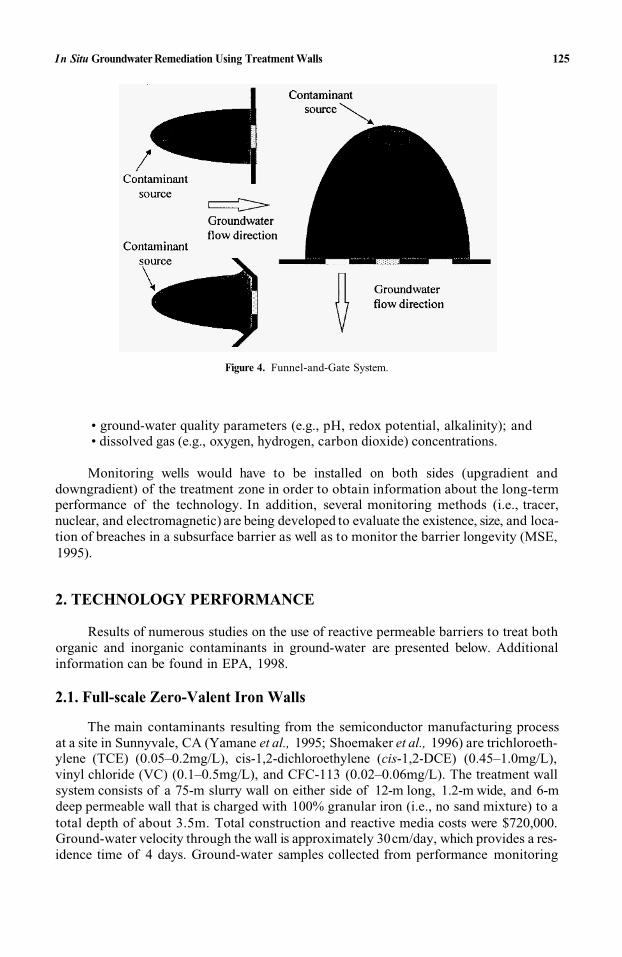
In Situ Groundwater Remediation Using Treatment Walls 125
Figure 4. Funnel-and-Gate System.
• ground-water quality parameters (e.g., pH, redox potential, alkalinity); and• dissolved gas (e.g., oxygen, hydrogen, carbon dioxide) concentrations.
Monitoring wells would have to be installed on both sides (upgradient anddowngradient) of the treatment zone in order to obtain information about the long-termperformance of the technology. In addition, several monitoring methods (i.e., tracer, nuclear, and electromagnetic) are being developed to evaluate the existence, size, and loca-tion of breaches in a subsurface barrier as well as to monitor the barrier longevity (MSE, 1995).
2. TECHNOLOGY PERFORMANCE
Results of numerous studies on the use of reactive permeable barriers to treat bothorganic and inorganic contaminants in ground-water are presented below. Additionalinformation can be found in EPA, 1998.
2.1. Full-scale Zero-Valent Iron Walls
The main contaminants resulting from the semiconductor manufacturing processat a site in Sunnyvale, CA (Yamane et al., 1995; Shoemaker et al., 1996) are trichloroeth-ylene (TCE) (0.05–0.2mg/L), cis-1,2-dichloroethylene (cis-1,2-DCE) (0.45–1.0mg/L),vinyl chloride (VC) (0.1–0.5mg/L), and CFC-113 (0.02–0.06mg/L). The treatment wall system consists of a 75-m slurry wall on either side of 12-m long, 1.2-m wide, and 6-mdeep permeable wall that is charged with 100% granular iron (i.e., no sand mixture) to atotal depth of about 3.5m. Total construction and reactive media costs were $720,000.Ground-water velocity through the wall is approximately 30cm/day, which provides a res-idence time of 4 days. Ground-water samples collected from performance monitoring
126 R. D. Vidic and F. G. Pohland
wells within the wall showed no volatile organic compounds (VOCs) above the detection limit of 0.5µg/L.
Treatment wall installed at Moffet Federal Airfield, CA consists of two wing walls, 6.5m long, constructed of interlocking sheet piles which channel the groundwater into a3.2-m wide, 3.2-m thick, and 8.2-m deep reaction cell. There is 0.6m of concrete beneath the wall to prevent ground-water infiltration from below. Groundwater flowing into the wall encounters 0.6m of pea gravel, 2m of 100% granular iron and another 0.6m of pea gravel. Pea gravel was used to ensure adequate distribution of groundwater, because there are sand channels in the area. Preliminary estimates place the cost of the wall at approx-imately $300,000. Ground-water quality sampling was performed in June, 1996 and indi-cated that the influent TCE concentration of 850–1,180µg/L was degraded to 3-320 µg/Lwithin 0.3m into the iron wall, and to 11–36pg/L within 1.3m into the wall. Samples taken from the downgradient pea gravel section of the wall indicated TCE concentra-tions of 16–45µg/L, which were assumed to be residual TCE contamination within the pea gravel remaining from the wall installation. Although there was no VC in the influ-ent groundwater, 3 µg/L was detected 0.3 m into the iron wall, while no VC was detected within 0.6m of the iron wall.
A treatment wall consisting of an iron-sand mixture was installed at Canadian Forces Base, Borden, Ontario (EPA, 1995; Shoemaker et al., 1996) approximately 5mdowngradient from the source of contaminant plume. The plume was about 2m wide and 1 m thick, with maximum concentrations along the axis of about 250mg/L of TCEand 43mg/L of PCE. The wall was constructed using sealable joint sheet piling to a depth of about 10m, with a total width of 1.5m and length of 5.5m (transverse to the flow). The reactive media backfill consisted of 22% by weight iron grindings col-lected from a local machine shop, and 78% concrete sand to ensure sufficient porosityof the wall. Ground-water flow velocity was about 10cm/day, which provided a resi-dence time in the wall of approximately 15 days. During the four-year monitoring period, the wall consistently removed 90% of TCE and 86% of PCE in the incoming water. The principal product detected at a monitoring point located downgradient of the wall was 1,2-DCE, with a maximum concentration of 0.2mg/L. No vinyl chloride was detected in the treated groundwater. No visible precipitate formed on the surface of iron grindings, although losses of 185 mg/L and 82 mg/L of calcium and bicarbonate, respec-tively, were measured across the wall. Subsequent laboratory studies aimed at simulating the performance of the treatment wall revealed that a higher percentage of iron grind-ings in the wall might have resulted in complete removal of TCE and PCE across the wall.
Zero-valent iron has been evaluated for the removal of chromate through a treat-ment wall constructed at the U.S. Coast Guard Air Station, Elizabeth City, NC as a seriesof large-diameter augered holes in a staggered 3-row array (Powell et al. 1995; Puls et al., 1995). Twenty one 20-cm columns were installed to a depth of 6.7m throughout a 5.5m2
area. The mixed waste contaminant plume was between 4.2 and 6m below the surface, and the water table ranged from 1.5 to 2m below the surface. Columns were charged with a mixture of 50% iron filings (two types), 25% clean coarse sand and 25% aquifer mate-rial, to a depth between 3 and 8m below the surface. Untreated groundwater contained 1–3mg/L of Cr(VI) and a total concentration of TCE and DCE of 6.5mg/L that were reduced to below 0.01 mg/L and 1.5mg/L in the treated water, respectively. Most of theorganic reduction was due to a decrease in TCE concentration of about 75%, while 1,2-DCE showed almost no change. Dissolved iron in the groundwater increased from
In Situ Groundwater Remediation Using Treatment Walls
0.05mg/L to 1-20mg/L, while dissolved oxygen decreased from 0.6mg/L to below 0.1 mg/L with a slight increase in alkalinity.
A funnel-and-gate system installed at the Lowry Air Force Base, CO consists of a3.5-m wide and 1.6-m thick gate with 5-m long cutoff walls, oriented at a 45° upgradi-ent angle, that were installed on each side of the reaction zone (Duster et al., 1996).Ground-water level is approximately 2.6m below the surface, and the top of the weath-ered claystone bedrock confining layer is approximately 5.7m below the surface. The pre-dominant contaminant in the incoming groundwater was TCE (source located 100mupgradient from the wall location) at a concentration of 850µg/L, while the average total concentration of all other chlorinated hydrocarbons (VC, 1,1 -DCE, trans- and cis-1,2-DCE, 1,1, 1-trichloroethane (TCA), 1,1-dichloroethane (DCA), 1,2-DCA, and PCE) was about 300 µg/L. Results during a six-month monitoring period indicate complete degra-dation of the chlorinated hydrocarbons within the first 0.3-m of the wall (9 hours resi-dence time). Only cis-1,2-DCE was present at significant concentrations (10 µg/L) after9 hours of residence time inside the wall, having the highest calculated half-life among all contaminants of 2.2 hours. By approximately 18 hours of residence time (0.6m intothe wall) all analytes had degraded to their respective analytical quantitation limits. Redox potential in groundwater dropped to about -500mVwhile pH increased from 6.5to 10.0 across the wall. Total alkalinity decreased rapidly with cross-sectional distance into the wall from about 550mg/L to below 50mg/L, while Fe+2 and Fe+3 were not detectedat concentrations above 1 mg/L due to precipitation of iron salts. Cost analysis estimated a decrease in treatment costs from $440,000 per kilogram of contaminants removed from groundwater during the first year of operation down to $50,000 per kilogram of conta-minants removed for a 10 year treatment period.
2.2. Pilot-Scale Studies with Zero-Valent Iron
127
A pilot-scale study conducted at the SGL Printed Circuit Site, Wayne, NJ utilized commercial granular iron for the removal of 4-12mg/Lof PCE, 1mg/L of TCE, and0.15 mg/L of 1,2-DCE from contaminated groundwater (Vogan et al., 1995; Shoemaker et al., 1996). Design of the pilot-scale reactor was based on half-lives, determined using100% granular iron, of 0.4–0.6 hr for PCE, 0.5–0.7 hr for TCE, 1.5-3.7 hr for DCE, and 1.2-0.9 for vinyl chloride. In order to achieve a New Jersey standard of 0.01 mg/L for 1,2-DCE, residence time in the fixed-bed reactor was set at 24hr. The reactor was built in a 2.4-m diameter fiberglass tank filled with granular iron to a depth of 1.7 m. Concentra-tion profiles for PCE, TCE, and cis-1,2-DCE after 30 and 60 days of operation showed nondetectable levels in the effluent. In fact, disappearance of all three constituents occurred about midway through the reactor. Based on laboratory testing, calcium car-bonate, siderite, and possibly iron hydroxide could have precipitated in the reactor.
Three different reactive media: (1) fine grade iron filings (40-mesh) from Master-Builder, Inc., (2) stock iron filings (-8 + 50-mesh) from Peerless Metal Powders &Abra-sive, Inc., and (3) palladized iron filings obtained by chemically plating palladium (at 0.05% of iron) on a 40-mesh iron filings from Fisher Scientific, were tested in parallel treatment trains for the removal of TCE from a contaminated groundwater at Portsmouth Gaseous Diffusion Plant in Piketon, OH (Liang et al., 1996). Each treatmenttrain consisted of three 55-gal drums packed with a total of 488 L of iron filings except in the case of palladized iron where only one drum packed with 45L was used due to much faster TCE degradation rates on palladized iron observed in the laboratory studies.
128 R. D. Vidic and F. G. Pohland
This pilot plant was constructed on February 29, 1996 and operations began on March 5, 1996. During the initial start-up phase of this study, problems with maintaining gravityflow through the system (1.1–1.5L/min), encountered due to the build-up of the gas (believed to be hydrogen produced by reductive dissociation of water by iron filings) in the drums and manifolds, were resolved by installing pressure release valves on the drums. During first week of operation, influent TCE concentrations on the order of 170 µg/L were reduced in all treatment trains to below detection limit (2µg/L). After 51 days of operation, eflluent TCE concentrations were still below detection limit in the treatment train (1), while they were 3 and 12µg/L in the treatment trains (2) and (3), respectively. TCE half-lives increased from 1.4, 14, and 19 minutes after seven days of operation to half-lives of 4.1, 16, and 35 minutes after 51 days of operation for the treatment rains (3), (1), and (2), respectively. The more rapid deterioration of palladized iron filings may be attributed to the substantially higher number of pore volumes that have passed through this treatment train (about 3345 pore volumes compared to 331 pore volumes for the treatment trains (1) and (2)), as well as possible reactions of sulfides with palladium.
Contaminated groundwater at Hill AFB, UT was treated above ground in a 1.4-mlong and 0.3-m diameter fiberglass canister filled with 100% Master Builder iron, “Blend B, GX-27” (Strongsville, OH) (Shoemaker et al., 1996). The reactor was operated in an upflow mode with a flow rate of 0.38 to 3.8L/min. Influent pH was stable at about 7.5, while dissolved oxygen varied from 4 to 6mg/L. Effluent pH rose above 9 while dis-solved oxygen (DO) decreased to 1–2mg/L. The majority of the influent TCE, at 2mg/L, was degraded prior to reaching the first port, located about 22cm into the canister. Concentrations of cis 1,2-DCE and VC were observed to increase within the canister, but were below 0.001 mg/L in the effluent, while ethane and ethene in the effluent accounted for 60% of the initial TCE mass in the influent. The experiment was terminated when the pressure drop across the canister increased from an initial value of 3.45 kPa to 6.89 kPa. X-ray diffraction tests indicated that precipitation of iron and ,calcium carbonatecompounds caused clogging of the bed.
Pilot-scale tests using a contaminated groundwater from an electronics manufac-turing facility located near Belfast, Northern Ireland, were performed in a 100-cm long acrylic column charged with 100% granular iron and equipped with several sampling ports along the column length (Thomas et al., 1995). The results of TCE analyses of the groundwater indicate that TCE is present at a maximum identified concentrations of up to 390mg/L. Column tests at flow velocities of 109 and 54cm/day were conducted until steady state contaminant profiles were established in each test. Using the flow velocity, the distance along the column was converted to time and the degradation rate constantswere calculated for the organic compounds using a first-order kinetic model. Rapid declines in TCE concentration were observed for both tests and the detection limits werereached between 40 and 60cm along the column. Calculated half-lives for TCE were 1.2 hours (flow velocity of 109cm/day) and 3.7 hours (flow velocity of 54cm/day). Concen-trations of cis-1,2-DCE increased to between 10 and 22mg/L due to dechlorination ofDCE. Interpretation of cis-1,2-DCE profiles was difficult because of the presence of methyl ethyl ketone (MEK) in groundwater which eluted at the same time on the photo ionization detector as the target compound. Since MEK should be neither produced nor degraded in the presence of iron, the declines in the combined cis-1,2-DCE/MEK con-centration was used to calculate cis-1,2-DCE half-lives of 12.5 and 23.9 hours for the flow rates of 109 and 54cm/day, respectively. VC was produced due to TCE and cis-1,2-DCE degradation with a maximum concentration in the downstream portion of the
In Situ Groundwater Remediation Using Treatment Walls 129
column reaching 100–300µg/L. No substantial increase in the pH over the influent levels was observed in these tests, most likely due to the high concentration of dissolved organ-ics in the groundwater. Measured Eh declined from about 250mV to about -200mV and marked increases in iron were measured in the column effluent due to the corrosion of iron metal by water.
Four different iron millings or filings (70-99.9% iron in spherical particles, cylin-drical pieces and polygons with densities ranging from 7.81-8.06 g/mL) from various iron fabrication processes were investigated for the removal of ground-water contamination at Moffet Federal Airfield, CA (PRC, 1996) using batch and column studies. The ground-water used in the batch studies contained approximately 22mg/L of TCE, while thesample collected for column studies contained 1.2mg/L TCE and 0.12mg/L PCE. TCE removal efficiency in batch tests ranged from 64% to 100% for different iron types, while the column tests revealed a TCE half-life of 0.63 hr and a PCE half-life of 0.29 hr. In addition, half-lives of the reaction by-products 1,2-DCE and VC were estimated at 3.1 hr and 4.7 hr, respectively.
Four different treatment zones were installed below surface in the path of the uranium mill tailing drainage at UMTRA Site in Durango, CO. Two were in baffle style boxes about 1.8 × 1 × 1.2m and two were horizontal beds approximately 4.5 × 9m with0.3m of steel wool. Bi-metallic, zero-valent iron steel wool, and zero-valent iron foam from Cercona are the media being tested at the site. Influent concentrations have varied from May through July in the range of 2.9–5.9mg/l for U, 0.9 for Mo and 27–32mg/l for NO3-. The first test started in May 1996 with Cercona iron foam in the baffle design as the first media to be tested. The earliest results showed a decrease in U concentration to 0.4mg/L and NO3- to 20mg/L. The results after 3 months of operation showed a decreasein U and nitrate to below detection limits while Mo decreased to 0.02mg/L. Although not confirmed, it is suspected that biological reduction enhanced by the high hydrogenenvironment produced by the contact between iron and water has resulted in the removalof nitrate from the system.
2.3. Oxygen Releasing Compounds
The study in Borden, Ontario, Canada evaluated the ability of a proprietary solid peroxide formulation (referred to as an oxygen-releasing compound or ORC) to provide sufficient dissolved oxygen and enhance biodegradation of benzene and toluene (Bianchi-Mosquera et al., 1994). Benzene (3,947 ± 284µg/L) and toluene (3,819 ± 264µg/L) wereinjected through 16 1.5-m sections of 25-cm O.D. PVC well screen jetted to approximately 1.5 m below ground surface. Background samples were collected from a location approx-imately 4 m upgradient from the source, while the downgradient concentrations were monitored along the lines of four monitoring points (0.6-cm stainless steel sampling points with a 2.5-cm screen) located every 0.5m from the source. ORC in briquette form raised the concentration of DO in the groundwater to as much as 15 mg/L, while benzene and toluene concentrations decreased below detection limits. After the injection ofbenzene and toluene ceased, the DO levels rose to 45.6mg/L and the oxygen production continued for at least 10 weeks. ORC in the pencil form also released oxygen into the groundwater, but the levels of DO were not as high as with ORC in the briquette form, and benzene and toluene concentrations remained above those measured when briquettes were used.
A total of 20 PVC wells was installed and loaded with a total of 342 oxygen releas-ing compound (ORC) socks to remediate a groundwater at a site in Belen, NM, where
130 R. D. Vidic and F. G. Pohland
an unknown quantity of gasoline spill occurred for an unknown length of time (Koenigsberg et al., 1995; Johnson and Methvin, 1996). The aquifer is shallow, uncon-fined and comprised mainly of well sorted sands, with a groundwater level at 1.5 m bellow ground surface and the average groundwater gradient of 0.0015. The range of intersti-tial velocities at the site was estimated at 3.0–3.3cm/day. The average background con-centration of DO and BTEX were approximately 1 and 2mg/L, respectively. Less than two weeks after installation, dissolved oxygen mass increased an order of magnitude (maximum levels in excess of 18mg/L) and remained constant for at least another month. There was a 78% decrease in the total BTEX mass in the immediate viscinity of the barrier and 58% decrease in the broad study area of 36 x 30m. After three months ofoperation, approximately half of the oxygen placed in the system was exhausted and a concomitant decrease in the BTEX mass was observed. After 279 days of operation, 47% of the socks were replaced with fresh ones, since an increase in BTEX levels was observed. BTEX levels were once again noted to decrease from about 10mg/L to below detectionlimits in proportion to the available oxygen.
2.4. In Situ Microbial Filters
The study conducted at Chico Municipal Airport, CA demonstrated the effective-ness of resting-state (no nutrients) in situ microbial filters approach for remediating groundwater contaminated with TCE (Duba et al., 1996). The first field test of this tech-nology, conducted at the Wilson Corners site at the Kennedy Space Center, FL, was ter-minated prematurely because only 1–2ppm of the total contaminant load was biodegraded. This low biodegradation rate was attributed to insufficient oxygen in the groundwater. A second field trial was conducted at Chico Municipal Airport in Chico, CA where the groundwater was contaminated with 425 ± 50µg/L of TCE and the dis-solved oxygen was 7.0mg/L. About 5.4kg (dry weight) of a pure strain methanotrophic bacteria, Methylosinus trichosporium OB3b, was suspended in groundwater and injectedinto the aquifer through a single well at a depth of 28m and at a rate of 3.8L/min. Approximately 50% of the injected bacteria attached to the soil, forming an in situ, fixed-bed, quasi-spherical bioreactor with an average radius of about 1.2 m. Contaminated groundwater was subsequently withdrawn through the biofilter by extracting groundwa-ter through the injection well at 3.8L/min for 30hr and then at 2L/min for the remain-ing 39 days of the field experiment. During the first 50hr of ground-water withdrawal, 98% of TCE was biodegraded. TCE concentration in the extraction well then gradually increased as biofilter degradation capacity and/or longevity were exceeded in variousparts of the biofilter.
In situ nitrate attenuation by heterotrophic denitrification using an alternative septic system design that utilizes a treatment wall charged with an organic carbon source (sawdust) is currently being evaluated at three sites in Ontario (Long Point, Killarney, and Borden), Canada (Robertson and Cherry, 1995). Two barrier configurations (hori-zontal layer positioned in the vadose zone below a conventional septic-system infiltra-tion bed and a vertical wall intercepting a horizontally-flowing downgradient plume) were evaluated in four field trials. During one year of operation, both barrier configurationhave been successful in substantial attenuation (60 to 100%) of input NO3
- levels of upto 125mg/L as N. Mass balance calculations and preliminary results suggest that conve-niently sized barriers have the potential to last for decades without replenishment of the reactive material.
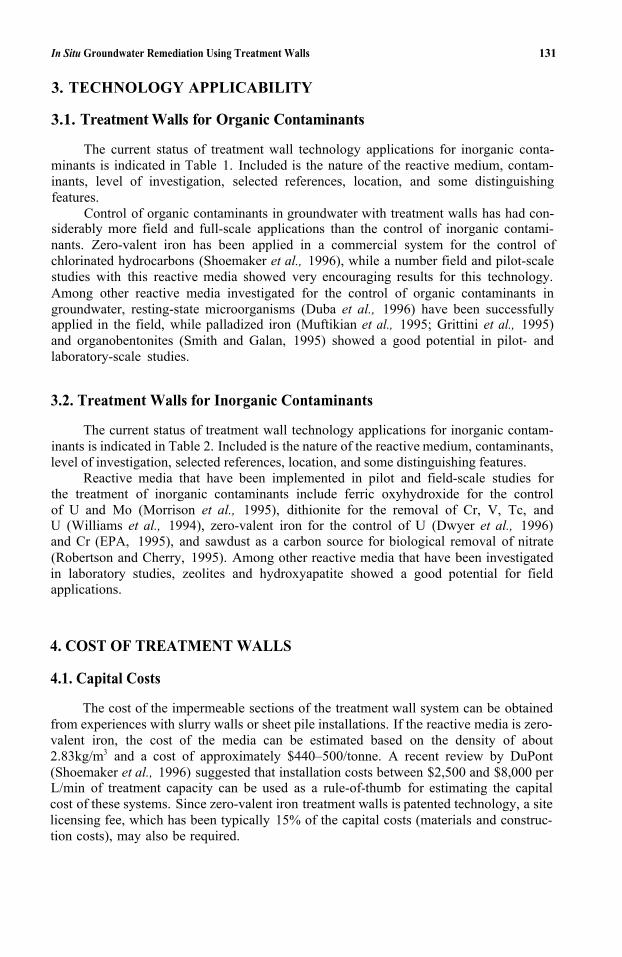
In Situ Groundwater Remediation Using Treatment Walls 131
3. TECHNOLOGY APPLICABILITY
3.1. Treatment Walls for Organic Contaminants
The current status of treatment wall technology applications for inorganic conta-minants is indicated in Table 1. Included is the nature of the reactive medium, contam-inants, level of investigation, selected references, location, and some distinguishing features.
Control of organic contaminants in groundwater with treatment walls has had con-siderably more field and full-scale applications than the control of inorganic contami-nants. Zero-valent iron has been applied in a commercial system for the control of chlorinated hydrocarbons (Shoemaker et al., 1996), while a number field and pilot-scalestudies with this reactive media showed very encouraging results for this technology. Among other reactive media investigated for the control of organic contaminants in groundwater, resting-state microorganisms (Duba et al., 1996) have been successfully applied in the field, while palladized iron (Muftikian et al., 1995; Grittini et al., 1995)and organobentonites (Smith and Galan, 1995) showed a good potential in pilot- andlaboratory-scale studies.
3.2. Treatment Walls for Inorganic Contaminants
The current status of treatment wall technology applications for inorganic contam-inants is indicated in Table 2. Included is the nature of the reactive medium, contaminants, level of investigation, selected references, location, and some distinguishing features.
Reactive media that have been implemented in pilot and field-scale studies for the treatment of inorganic contaminants include ferric oxyhydroxide for the control of U and Mo (Morrison et al., 1995), dithionite for the removal of Cr, V, Tc, andU (Williams et al., 1994), zero-valent iron for the control of U (Dwyer et al., 1996)and Cr (EPA, 1995), and sawdust as a carbon source for biological removal of nitrate(Robertson and Cherry, 1995). Among other reactive media that have been investigated in laboratory studies, zeolites and hydroxyapatite showed a good potential for field applications.
4. COST OF TREATMENT WALLS
4.1. Capital Costs
The cost of the impermeable sections of the treatment wall system can be obtained from experiences with slurry walls or sheet pile installations. If the reactive media is zero-valent iron, the cost of the media can be estimated based on the density of about 2.83kg/m3 and a cost of approximately $440–500/tonne. A recent review by DuPont(Shoemaker et al., 1996) suggested that installation costs between $2,500 and $8,000 perL/min of treatment capacity can be used as a rule-of-thumb for estimating the capital cost of these systems. Since zero-valent iron treatment walls is patented technology, a site licensing fee, which has been typically 15% of the capital costs (materials and construc-tion costs), may also be required.
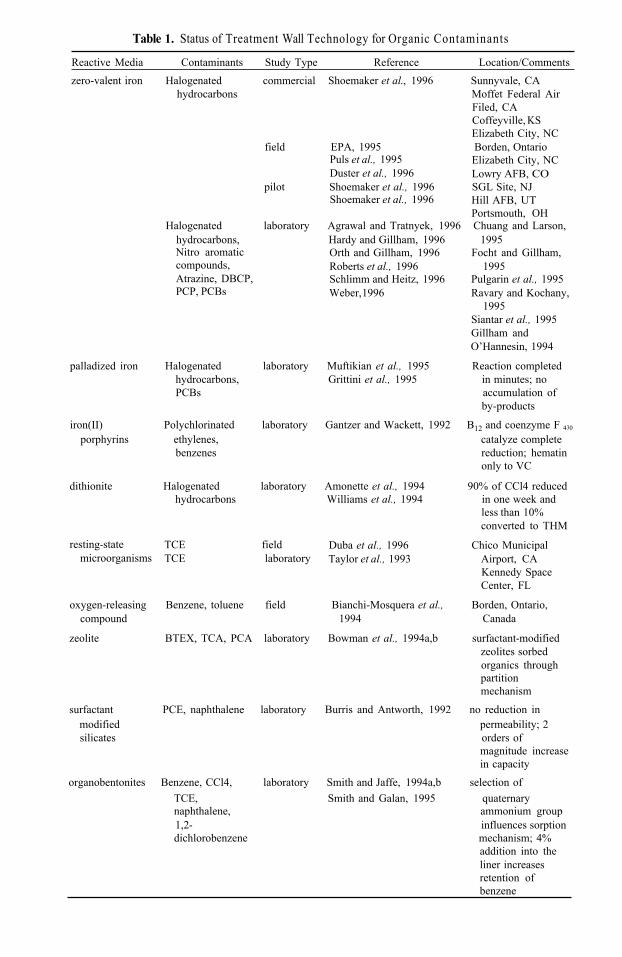
Table 1. Status of Treatment Wall Technology for Organic Contaminants
Reactive Media Contaminants Study Type Reference Location/Comments zero-valent iron Halogenated commercial Shoemaker et al., 1996 Sunnyvale, CA
hydrocarbons Moffet Federal Air Filed, CA Coffeyville, KSElizabeth City, NC
field EPA, 1995 Borden, Ontario Elizabeth City, NC Lowry AFB, CO
pilot Shoemaker et al., 1996 SGL Site, NJ Hill AFB, UTPortsmouth, OH
Puls et al., 1995Duster et al., 1996
Shoemaker et al., 1996
Halogenated laboratory Agrawal and Tratnyek, 1996 Chuang and Larson,
Nitro aromatic Orth and Gillham, 1996 Focht and Gillham, compounds, Roberts et al., 1996 1995Atrazine, DBCP, Schlimm and Heitz, 1996 Pulgarin et al., 1995PCP, PCBs Weber, 1996 Ravary and Kochany,
hydrocarbons, Hardy and Gillham, 1996 1995
1995Siantar et al., 1995Gillham and O’Hannesin, 1994
palladized iron Halogenated laboratory Muftikian et al., 1995 Reaction completed hydrocarbons, Grittini et al., 1995 in minutes; noPCBs accumulation of
by-products
iron(II) Polychlorinated laboratory Gantzer and Wackett, 1992 B12 and coenzyme F 430
porphyrins ethylenes, catalyze complete benzenes reduction; hematin
dithionite Halogenated laboratory Amonette et al., 1994 90% of CCl4 reduced
only to VC
hydrocarbons Williams et al., 1994 in one week andless than 10% converted to THM
resting-state TCE field Duba et al., 1996 Chico Municipalmicroorganisms TCE laboratory Taylor et al., 1993 Airport, CA
Kennedy Space Center, FL
oxygen-releasing Benzene, toluene field Bianchi-Mosquera et al., Borden, Ontario,
zeolite BTEX, TCA, PCA laboratory Bowman et al., 1994a,b surfactant-modifiedzeolites sorbed organics through partitionmechanism
compound 1994 Canada
surfactant PCE, naphthalene laboratory Burris and Antworth, 1992 no reduction in modified permeability; 2 silicates orders of
magnitude increase in capacity
TCE, Smith and Galan, 1995 quaternary naphthalene, ammonium group 1,2- influences sorption dichlorobenzene mechanism; 4%
organobentonites Benzene, CCl4, laboratory Smith and Jaffe, 1994a,b selection of
addition into the liner increases retention of benzene
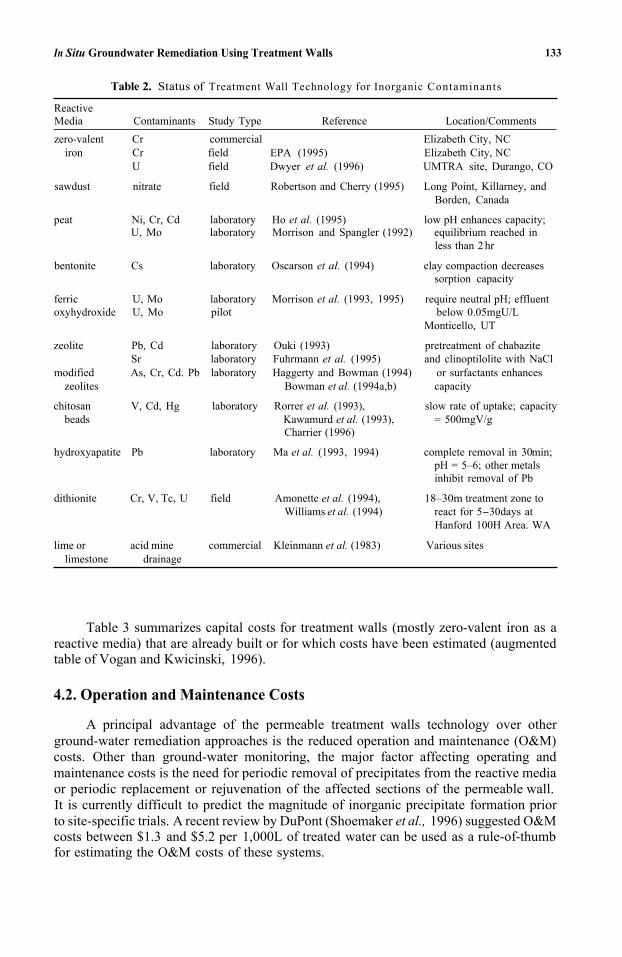
In Situ Groundwater Remediation Using Treatment Walls 133
Table 2. Status of Treatment Wall Technology for Inorganic Contaminants
ReactiveMedia Contaminants Study Type Reference Location/Comments zero-valent Cr commercial Elizabeth City, NC
iron Cr field EPA (1995) Elizabeth City, NCU field Dwyer et al. (1996) UMTRA site, Durango, CO
sawdust nitrate field Robertson and Cherry (1995) Long Point, Killarney, and
peat Ni, Cr, Cd laboratory Ho et al. (1995) low pH enhances capacity;
Borden, Canada
U, Mo laboratory Morrison and Spangler (1992) equilibrium reached in less than 2 hr
bentonite Cs laboratory Oscarson et al. (1994) clay compaction decreases sorption capacity
ferric U, Mo laboratory Morrison et al. (1993, 1995) require neutral pH; effluent oxyhydroxide U, Mo pilot below 0.05mgU/L
Monticello, UT
zeolite Pb, Cd laboratory Ouki (1993) pretreatment of chabazite
modified As, Cr, Cd. Pb laboratory Haggerty and Bowman (1994) or surfactants enhances Sr laboratory Fuhrmann et al. (1995) and clinoptilolite with NaCl
zeolites Bowman et al. (1994a,b) capacity
beads Kawamurd et al. (1993), = 500mgV/gchitosan V, Cd, Hg laboratory Rorrer et al. (1993), slow rate of uptake; capacity
Charrier (1996)
hydroxyapatite Pb laboratory Ma et al. (1993, 1994) complete removal in 30min;pH = 5–6; other metalsinhibit removal of Pb
dithionite Cr, V, Tc, U field Amonette et al. (1994), 18–30m treatment zone toWilliams et al. (1994) react for 5-30days at
Hanford 100H Area. WA
lime or acid mine commercial Kleinmann et al. (1983) Various siteslimestone drainage
Table 3 summarizes capital costs for treatment walls (mostly zero-valent iron as areactive media) that are already built or for which costs have been estimated (augmented table of Vogan and Kwicinski, 1996).
4.2. Operation and Maintenance Costs
A principal advantage of the permeable treatment walls technology over otherground-water remediation approaches is the reduced operation and maintenance (O&M)costs. Other than ground-water monitoring, the major factor affecting operating and maintenance costs is the need for periodic removal of precipitates from the reactive media or periodic replacement or rejuvenation of the affected sections of the permeable wall. It is currently difficult to predict the magnitude of inorganic precipitate formation priorto site-specific trials. A recent review by DuPont (Shoemaker et al., 1996) suggested O&Mcosts between $1.3 and $5.2 per 1,000L of treated water can be used as a rule-of-thumbfor estimating the O&M costs of these systems.
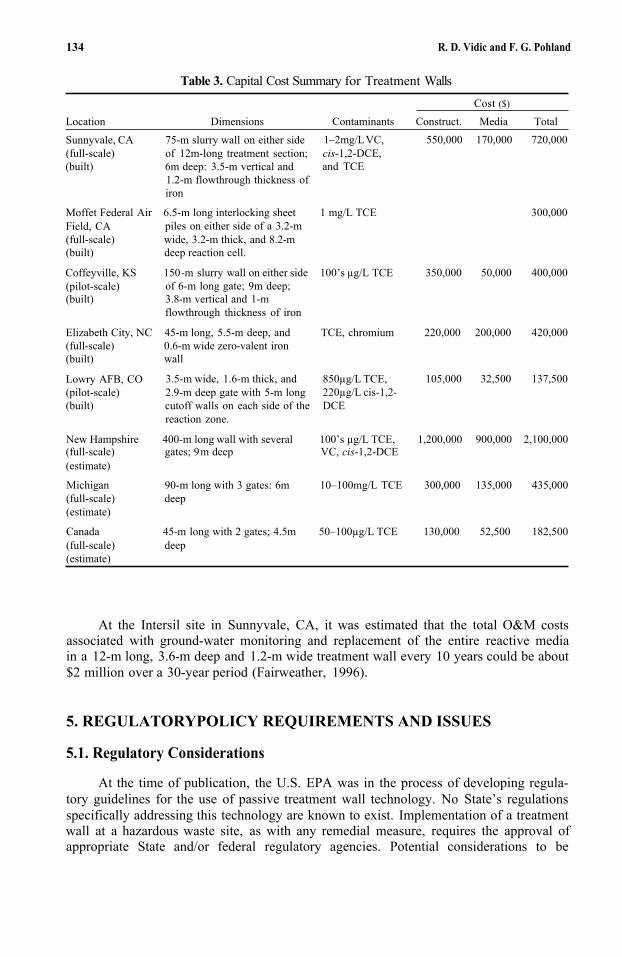
134 R. D. Vidic and F. G. Pohland
Table 3. Capital Cost Summary for Treatment Walls
Cost ($)
Location Dimensions Contaminants Construct. Media Total
Sunnyvale, CA 75-m slurry wall on either side 1–2mg/LVC, 550,000 170,000 720,000(full-scale) of 12m-long treatment section; cis-1,2-DCE,(built) 6m deep: 3.5-m vertical and and TCE
1.2-m flowthrough thickness of iron
Moffet Federal Air 6.5-m long interlocking sheet 1 mg/L TCE 300,000Field, CA (full-scale)(built) deep reaction cell.
Coffeyville, KS 150-m slurry wall on either side 100’s µg/L TCE 350,000 50,000 400,000(pilot-scale)(built) 3.8-m vertical and 1-m
piles on either side of a 3.2-m wide, 3.2-m thick, and 8.2-m
of 6-m long gate; 9m deep;
flowthrough thickness of iron
Elizabeth City, NC 45-m long, 5.5-m deep, and TCE, chromium 220,000 200,000 420,000 (full-scale) 0.6-m wide zero-valent iron (built) wall
Lowry AFB, CO 3.5-m wide, 1.6-m thick, and 850µg/L TCE, 105,000 32,500 137,500 (pilot-scale) 2.9-m deep gate with 5-m long 220µg/L cis-1,2-(built) cutoff walls on each side of the DCE
New Hampshire 400-m long wall with several 100’s µg/L TCE, 1,200,000 900,000 2,100,000
(estimate)
Michigan 90-m long with 3 gates: 6m 10–100mg/L TCE 300,000 135,000 435,000(full-scale) deep (estimate)
Canada 45-m long with 2 gates; 4.5m 50–100µg/L TCE 130,000 52,500 182,500 (full-scale) deep (estimate)
reaction zone.
(full-scale) gates; 9m deep VC, cis-1,2-DCE
At the Intersil site in Sunnyvale, CA, it was estimated that the total O&M costs associated with ground-water monitoring and replacement of the entire reactive media in a 12-m long, 3.6-m deep and 1.2-m wide treatment wall every 10 years could be about $2 million over a 30-year period (Fairweather, 1996).
5. REGULATORYPOLICY REQUIREMENTS AND ISSUES
5.1. Regulatory Considerations
At the time of publication, the U.S. EPA was in the process of developing regula-tory guidelines for the use of passive treatment wall technology. No State’s regulations specifically addressing this technology are known to exist. Implementation of a treatment wall at a hazardous waste site, as with any remedial measure, requires the approval of appropriate State and/or federal regulatory agencies. Potential considerations to be
In Situ Groundwater Remediation Using Treatment Walls 135
addressed as part of this approval process involve site investigation, design and moni-toring issues, including those listed below:
• Sufficient characterization of site geology, hydrology, contaminant distribution,and vectors impacting human health and the environment to permit adequatedesign of the treatment wall;
• Ability of the proposed design to account for uncertainties inherent in subsur-face investigations/treatments;
• Ability of the proposed design to capture and adequately remediate the verticaland horizontal extent of the ground-water plume;
• Monitoring to measure concentrations of by-products in groundwater potentiallyproduced through treatment wall reactions;
• Monitoring to measure potential releases of gaseous by-products; and• Monitoring to characterize precipitate formation and wall clogging that may limit
the effectiveness of the treatment method.
Implementation of passive treatment wall technology does not involve removal ofgroundwater or air from the subsurface. Therefore, unlike other remedial technologiessuch as pump-and-treat and soil vapor extraction, it does not require permits for dis-charges of groundwater or air to the environment.
5.2. Health and Safety Issues
Health and safety issues involved in the use of treatment wall technology aremainly associated with installation of the wall and will vary according to the method ofinstallation used (trenching, drilling, injection, etc.). Health and safety concerns associ-ated with these installation methods will generally be the same as for any other applica-tion of the particular installation technique. Exposure of workers to hazardoussubstances during installation and operation of the wall may be lower than with otherconventional treatment technologies due to lack of direct contact with contaminatedmaterials.
As stated above, monitoring is required to ensure that any groundwater andair releases that may result from use of treatment wall technology do not impact offsitereceptors.
Impacts from treatment wall installation and maintenance may be less than withother technologies due to the placement of all treatment materials underground, withminimal disturbance to surface activities.
6. FUTURE NEEDS
6.1. Design and Construction
At present, there is a general need to establish tested and proven design proceduresand protocols for treatment wall technology. Protocols for site characterization have beenfairly well developed so far, but the criteria for selecting the location of a treatment wallis still quite empirical. Therefore, there is a need to develop better predictive models thatcan assist in determining optimal location and sizing of the wall. These models shouldnot only include ground-water hydrology and hydraulics and contaminant transport and
136 R. D. Vidic and F. G. Pohland
fate in the subsurface, but also chemical reactions occurring inside the wall. It is partic- ularly important to account for by-product generation, precipitate formation and clog- ging of the wall, and loss of media reactivity.
A major potential limitation of treatment wall technology is the potential forconstructing the wall at depths greater than 10m. Wall installation at depths of 10 to 30 m presents additional difficulty and escalates construction costs to the point that they may become limiting for the implementation of this technology. Installations atdepths greater than 30 m are only theoretically possible with current technologies. More- over, the existence of surface obstructions (e.g., buildings, roads) and underground utilities represents additional challenges to the placement of treatment walls in the subsurface.
6.2. Implementation Issues
A particular concern with treatment wall technology is the question of long-termperformance under variable conditions that are commonly associated with contaminated groundwaters (e.g., seasonal variations in ground-water flow velocity and patterns, variations in the contaminant speciation and concentration). Loss of permeability over time as a result of particle invasion, chemical precipitation, or microbial activity, and possible gradual loss of media reactivity as the reactant is either depleted or coated by reaction by-products, need to be resolved before this technology can be applied with widerconfidence. Currently planned field-scale tests and many ongoing laboratory studies are designed to address some of these issues.
Investigations are needed to provide more fundamental understanding of thereactions pathways and possible by-products that might be generated by the reactions of contaminants with the reactive media. This could enable engineering manipulations to force certain, more desirable reaction pathways. In addition, development of novel reactive media and optimization of the existing ones could possibly improve competi- tiveness of treatment walls with other in situ and ex situ ground-water remediation technologies.
The reduction of chlorinated solvents by zero-valent iron requires contact between the organic compound and iron surface, which limits treatment with Fe(0) to water-soluble chemicals. Treatment of many soil contaminants which have functional groups that are reducible, but are strongly sorbed to sediments and soil samples (e.g., PCBs,dioxin, DDT, toxaphene, mirex, lindane, hexachlorobenzene), may not be feasible with this technology. This also applies for many other reactive media that are being investi- gated for use in treatment walls. Subsequently, there is a need to investigate the possibil-ity of utilizing treatment sequences, e.g., combining in situ soil washing technologies withtreatment walls.
REFERENCES
Agrawal, A. and Tratnyek, P.G. (1996) “Reduction of Nitro Aromatic Compounds by Zero-Valent Iron Metal.” Environ. Sci. Technol., 30:1, 153-160.
Amonette, J.E., Szecsody, J.E., Schaef, H.T., Templeton, J.C., Gorby, Y.A., and Fruchter, J.S. (1994) “AbioticReduction of Aquifer Materials by Dithionite: A Promising In-Situ Remediation Technology.” 33rd Hanford Symposium on Health and the Environment, November 7-1 I, Pasco, WA, Battelle Press, Columbus, OH.
In Situ Groundwater Remediation Using Treatment Walls 137
Bianchi-Mosquera, G.C., Allen-King, R.M., and Mackay, D.M. (1994) “Enhanced Degradation of Dissolved Benzene and Toluene Using a Solid Oxygen-Releasing Compound.” Groundwater Monitoring and Remediation, 14: 1, 120–128.
Bowman, R.S., Haggerty, G.M., Huddleston, R.G., Neel, D., and Flynn, M.M. (1994) “Sorption of Nonpolar Organic Compounds, Inorganic Cations, and Inorganic Oxyanions by Surfactant-ModifiedZeolites.” Proceeding of the 207th ACS National Meeting, San Diego, CA, March 13-17. Chapter 5, 54–64.
Bowman, R.S., Flynn, M.M., Haggerty, G.M., Huddleston, R.G., and Neel, D. (1994) “Organo-Zeolitesfor Sorption of Nonpolar Organics, Inorganic Cations, and Inorganic Anions.” Proceedings of 1993CSCE-ASCE National Conference on Environmental Engineering, July 12-14, Montreal, Quebec. Canada, 1103-1 109.
Burris, D.R. and Antworth, C.P. (1992) “In Situ Modification of an Aquifer Material by a Cationic Surfactant to Enhance Retardation of Organic Contaminants.” J. Contaminant Hydrology, 10, 325–337.
Burris, D.R., Campbell, T.J., and Manoranjan, V.S. (1995) “Sorption of Trichloroethylene and Tetra-chloroethylene in a Batch Reactive Metallic Iron-Water System.” Environ. Sci. Technol., 29: 11. 2850–2855.
Charrier, M.J., Guibal. E., Roussy, J., Delanghe, B., and Le Cloirec, P. (1996) “Vanadium(IV) Sorption by Chitosan: Kinetics and Equilibrium.” Water Research, 30:2, 465–475.
Chuang, F.W. and Larson, R.A. ( 1995) “Zero-Valent Iron-Promoted Dechlorination of Polychlori-nated Biphenyls (PCBs).” Proceedings of 209th ACS National Meeting, Anaheim. CA, April 2 -7,771–774.
Duba, A.G., Jackson, K.J., Jovanovich, M.C., Knapp, R.B., and Taylor, R.T. (1996) “TCE Remediation Using In Situ Resting-State Bioaugmentation.” Environ. Sci. Technol.. 30:6, 1982–1989.
Duster, D., Edwards. R., Faile, M., Gallant, W., Gibeau, E., Myller, B., Nevling, K., and O’Grady, B. (1996) “Preliminary Performance Results from a Zero Valence Metal Reactive Wall for the Passive Treatment of Chlorinated Organic Compounds in Groundwater.” Presented at Tri-Service Environmental Tech-nology Workshop, May 20-22, Hershey, PA.
Dwyer, B.P., Marozas, D.C., Cantrell, K., and Stewart, W. (1996) “Laboratory and Field Scale Demonstration of Reactive Barrier Systems.” Proceedings of the 1996 Spectrum Conference in Seattle, WA, August 18–23.
Environmental Protection Agency (1995) In Situ Remediation Technology Status Report: Treatment Walls, United States Environmental Protection Agency. EPA542-K-94-004, Washington. DC.
Environmental Protection Agency (1998) Permeable Reactive Barrier Technologies for Contaminant Remedi-ation. United States Environmental Protection Agency, EPA/600/R-98/125, Washington, DC.
Fairweather, V. (1996) “When Toxics Meet Metal.” Civil Engineering. 66:5, 44–48.Focht, R.M. and Gillham, R.W. (1995) ”Dechlorination of 1,2,3-Tricliloropropane by Zero-Valent Iron.”
Proceedings of 209th ACS National Meeting, Anaheim, CA. April 2-7, 741–744. Fuhrmann, M., Aloysius, D., and Zhou, H. (1995) “Permeable, Subsurface Sorbent Barrier for 90Sr: Labora-
tory Studies of Natural and Synthetic Materials.” Proceedings of Waste Management ‘95, February, 26–March 2, 1995. Tuscon, AZ.
Gantzer, C.J. and Wackett (1992) “Reductive Dechlorination Catalyzed by Bacterial Transition-MetalCoenzymes.” Environ. Sci. Technol., 25:4,71 5–722.
Gillham, R.W. and O’Hannesin, S.F. (1994) “Enhanced Degradation of Halogenated Aliphatics by Zero-ValentIron.” Ground Water, 32:6, 958 -967.
Grittini. C., Malcomson, M., Fernando, Q., and Korte, N. (1995) “Rapid Dechlorination of Polychlorinated Biphenyls on the Surface of Pd/Fe Bimetallic System.” Environ. Sci. Technol., 29: 1, 2898–2900.
Haggerty, G.M. and Bowman, R.S. (1994) “Sorption of Chromate and Other Inorganic Anions by Organo-Zeolite.” Environ. Sci. Technol., 28:3, 452-458.
Hardy, L.I. and Gillham, R.W. (1996) “Formation of Hydrocarbons from the Reduction of Aqueous CO2 by Zero-Valent Iron.” Environ. Sci Technol., 30: 1, 57-65.
Ho, Y.S., Wase, D.A., and Forster, C.G. (1995) “Batch Nickel Removal from Aqueous Solution by Sphagnum Moss Peat.” Water Research, 29:5, 1327–1332,
Johnson, T.L., Scherer, M.M., and Tratnyek, P.G. (1996) “Kinetics of Halogenated Organic Compound Degradation by Iron Metal.” Environ. Sci. Technol., 30:8. 2634–2641.
Kawamura, Y., Mitsuhashi, M., Tanibe, H., and Yoshida, H. (1993) “‘Adsorption of Metal Ions on Polyami-nated Highly Porous Chitosan Chelating Resin.” Ind. Eng. Chem., 32, 386–391.
Kleinmann, R.L.P., Tiernan, T.O., Solch, J.G., and Harris, R.L. (1983) “A Low-Cost, Low-MaintenanceTreatment System for Acid Mine Drainage Using Sphagnum Moss and Limestone.” National Sympo-
138 R. D. Vidic and F. G. Pohland
sium on Surface Mining, Hydrology, Sedimentology and Reclamation, University of Kentucky, Lexing-ton, KY.
Koenigsberg, S., Johnson, J., Odenkrantz, J., and Norris, R. (1995) “Enhanced Intrinsic Bioremediation of Hydrocarbons with Oxygen Release Compound (ORC)” Sixth West Coast Conference on Contaminated Soils and Groundwater, March 11-14, Newport Beach, CA.
Liang, L., West, O.R., Korte, N.E., Goodlaxson, J.D., Anderson, ED., Welch, C.A., and Pelfry, M. (1996) “A Field-Scale Test of Trichloroethylene Dechlorination using Iron Filings.” Interim Report on the X-749/K-120 Groundwater Treatment Facility submitted to Department of Energy, Piketon OH, May,1996.
Ma, Q.Y., Traina, S.J., Logan, T.J., and Ryan, J.A. (1993) “In Situ Lead Immobilization by Apatite.” Environ.Sci. Technol., 27:9, 1803-1810.
Ma, Q,Y., Traina, S.J., Logan, T.J., and Ryan, J.A. (1994) “Effects of Aqueous Al, Cd, Cu, Fe(II), Ni, and Zn on Pb Immobilization by Apatite.” Environ. Sci. Technol., 28:7, 1219–1228.
Matheson, L.J. and Tratnyek, P.G. (1994) “Reductive Dehalogenation of Chlorinated Methanes by Iron Metal.” Environ. Sci. Technol., 28:12, 2045–2053.
Morrison, S.J. and Spangler, R.R. (1992) “Extraction of Uranium and Molybdenum from Aqueous Solution: A Survey of Industrial Materials for Use in Chemical Barriers for Uranium Mill Tailings Remediation.” Environ. Sci. Technol., 26:10, 1922–1931.
Morrison, S.J. and Spangler, R.R. (1993) “Chemical Barriers for Controlling Groundwater Contamination.” Environ. Progress, 12:3, 175-181.
Morrison, S.J., Spangler, R.R., and Tripathi, V.S. (1995) “Adsorption of Uranium(VI) on Amorphous Ferric Oxyhydroxide at High Concentrations of Dissolved Carbon(IV) and Sulfur(VI).” J. ContaminantHydrology, 17, 333-346.
Morrison, S.J., Tripathi, V.S., and Spangler, R.R. (1995) “Coupled Reaction/Transport Modeling of a Chemi-cal Barrier for Controlling Uranium(VI) Contamination in Groundwater.” J. Contaminant Hydrology, 17, 347–363.
MSE Technology Applications (1995) “Subsurface Barriers Monitoring and Verification Technologies” Report for U.S. Department of Energy (TTP #PE1-5-10-06).
MSE Technology Applications (1996) “Analysis of Technologies for the Emplacement and Performance Assessment of Subsurface Reactive Barriers for DNAPL Containment” Report for U.S. Department of Energy (TTP #PE1-6-PL-31) under Contract No. DE-AC22-88ID12735.
Muftikian, R., Fernando, Q., and Korte, N. (1995) “A Method for the Rapid Dechlorination of Low Molecu-lar Weight Chlorinated Hydrocarbons in Water.” Water Research, 29: 10, 2434–2439.
Orth, WS. and Gillham, R.W. (1996) “Dechlorination of Trichloroethene in Aqueous Solution Using Fe0.”Environ. Sci. Technol., 30:1, 66-71.
Oscarson, D.W., Hume, H.B., and King, F. (1994) “Sorption of Cesium on Compacted Bentonite.” Clays andClay Minerals, 42:6, 731-736.
Ouki, S.K., Cheesman, C., and Perry, R. (1993) “Effects of Conditioning and Treatment of Chabazite and Clinoptilolite Prior to Lead and Cadmium Removal.” Environ. Sci. Technol., 27:6, 1108-1 116.
PRC Environmental Management, Inc. (1 996) Final Iron Curtain Bench-Scale Study Report, Department of the Navy Contract No. N62474-88-D-5086.
Pulgarin, C., Schwitzguebel, J.P., Peringer, P., Pdjonk, G.M., Bandara, J., and Kiwi, J. (1995) “Abiotic Degradation of Atrazine on Zero-valent Iron Activated by Visible Light.” Proceedings of 209th ACS National Meeting, Anaheim, CA, April 2-7, 767–770.
Puls, R.W., Powell, R.M., and Paul, C.J. (1995) “In Situ Remediation of Ground Water Contaminated with Chromate and Chlorinated Solvents Using Zero-Valent Iron: A Field Study.” Proceedings of the 209th ACS National Meeting, Anaheim, CA, April 2-7, 788-791.
Ravary, C. and Lipczynska-Kochany, E. (1 995) “Abiotic Aspects of Zero-Valent Iron Induced Degradation of Aqueous Pentachlorophenol.” Proceedings of 209th ACS National Meeting, Anaheim, CA, April 2-7,738–740.
Roberts, A.L., Totten, L.A., Arnold, W.A., Burris, D.R., and Campbell, T.J. (1996) “Reductive Elimination of Chlorinated Ethylenes by Zero-Valent Metals.” Environ. Sci. Technol., 30:8, 2654–2659.
Robertson, W.D. and Cherry, J.A. (1995) “In Situ Denitrification of Septic-System Nitrate Using Reactive Porous Media Barriers: Field Trials.” Ground Water, 33:1, 99-1 11.
Rorrer, G.L., Hsien, T.Y., and Way, J.D. (1993) “Synthesis of Porous-Magnetic Chitosan Beads for Removal of Cadmium Ions from Waste Water.” Ind. Eng. Chem., 32, 2170-2178.
Schlimm, C. and Heitz, E. (1996) “Development of Wastewater Treatment Process: Reductive Dehalogenation of Chlorinated Hydrocarbons by Metals.” Environmental Progress, 15: 1, 38-47.
In Situ Groundwater Remediation Using Treatment Walls 139
Siantar, D.P., Schrier, C.G., and Reinhard, M. (1 995) “Transformation of the Pesticide 1,2-Dibromo-3-Chloropropane (DBCP) and Nitrate by Iron Powder and by H2/Pd/Al2O3.” Proceedings of 209th ACS National Meeting, Anaheim, CA, April 2–7, 745–748.
Shoemaker, S.H., Greiner, J.F., and Gillham, R.W. (1996), in Assessment of Barrier Containment Technologies: A Comprehensive Treatment for Environmental Remediation Applications, R.R. Rumer and J.K. Mitchell, Eds., Chapter 11: Permeable Reactive Barriers. report prepared for US DOE, US EPA, and DuPont Company.
Smith, J.A. and Jaffe, P.R. (1994) “Benzene Transport thorough Landfill Liners Containing Organophilic Bentonite.” J. Env. Engineering, ASCE, 120:6, 1559-1577.
Smith, J.A. and Jaffe, P.R. (1 994) “Adsorptive Selectivity of Organic-Cation-Modified Bentonite for Nonionic Organic Contaminants.” Water, Air and Soil Pollution, 72, 205–21 1.
Smith, J.A. and Galan, A. (1995) “Sorption of Nonionic Organic Contaminants to Single and Dual Organic Cation Bentonites from Water.” Environ. Sci. Technol., 29:3, 685–692.
Starr, R.C. and Cherry, J.A. (1994) “In Situ Remediation of Contaminated Ground Water: The Funnel-and-Gate System.” Ground Water, 32:3, 465–476.
Taylor, R.T., Hanna, M.L., Shah, N.N., Shonnard, D.R., Duba, A.G., Durham, W.B., Jackson, K.J., Knapp, R.B., Wijesinghe, A.M., Knezovich, J.P., and Jovanovich, M.C. (1993) “In situ Bioremediation of Trichloroethylene-Contaminated Water by a Resting-Cell Methanotrophic Microbial Filter.” J. Hydro-logical Sciences, 38:4, 323–342.
Thomas, A.O., Drury, D.M., Norris, G., O’Hannesin, S.F., and Vogan, J.L. (1995) “The In-Situ Treatmentof Trichloroethene-Contaminated Groundwater Using a Reactive Barrier-Results of Laboratory Fea-sibility Studies and Preliminary Design Considerations.” Contaminated Soil ‘95, W.J. van den Brink, R. Bosman, and F. Arendt, Eds., Kluwer Academic Publishers, Netherlands, 1083–1091.
Vogan, J.L., Gillham, R.W., O’Hannesin, S.F., Matulewicz, W.H., and Rhodes, J.E. (1995) “Site Specific Degradation of VOCs in Groundwater Using Zero Valent Iron.” Proceedings of 209th ACS National Meeting, Anaheim, CA, April 2-7, 800-804.
Vogan, J. and Kwicinski, L. (1996) “Iron Walls Treat Groundwater.” Pennsylvania’s Environment: Business, Technology & The Environment, 1:12, 10–1 1.
Weber. E.J. (1996) “Iron-Mediated Reductive Transformations: Investigation of Reaction Mechanism.” Environ. Sci. Technol., 30:2, 716–719.
Williams, M.D., Yabusaki, S.B., Cole, C.R., and Vermeul, V.R. (1994) “In-Situ Redox Manipulation Field Experiment: Design Analysis.” Thirty-Third Hanford Symposium on Health and the Environment, November 7-1 1, Pasco, WA, Battelle Press, Columbus, OH.
Yamane, C.L., Warner, S.D.. Gallinati, J.D., Szerdy, F.S., Delfino, T.A., Hankins, D.A., and Vogan, J.L. (1995)“Installation of a Subsurface Groundwater Treatment Wall Composed of Granular Zero-Valent Iron.” Proceedings of 209th ACS National Meeting, Anaheim, CA, April 2-7, 792–795.

This page intentionally left blank.
12
REMOVAL OF NITROAROMATIC COMPOUNDSFROM WATER THROUGH COMBINED ZERO-VALENT METAL REDUCTION AND ENZYME-BASED OXIDATIVE COUPLINGREACTIONS
H. R. Monsef1, D. A. Michels1, J. K. Bewtra2, N. Biswas2,and K. E. Taylor1*
1Chemistry & Biochemistry and2Civil & Environmental Engineering College of Engineering & ScienceUniversity of Windsor Windsor, Ontario Canada N9B 3P4
1. ABSTRACT
Peroxiduse-catalyzed oxidative coupling, previously shown to be an effective strat-egy for removal of phenols from water, has been optimized for analogous reaction and removal of several anilines. Nitroaromatic compounds, even when they are phenolic or anilino compounds, are outside the scope of peroxidase catalysis. However, zero-valentiron has been found effective in conversion of aqueous nitrobenzene to aniline, quicklyand quantitatively in the 0.5 to 10mM concentration range in the absence of oxygen.The sequential application of these two steps, zero-valent iron reduction followed by peroxidase-catalyzed oxidative coupling, to nitrobenzene and preliminary results in thedevelopment of a continuous flow system for removal of nitrobenzene from water arepresented.
2. INTRODUCTION
Enzymes such as peroxidases, in the presence of hydrogen peroxide, and laccases, inthe presence of oxygen, catalyze the oxidation of a wide variety of phenols, biphenols, anilines, benzidines and related heteroaromatic compounds. The reactive radicals gener-ated (phenoxy1 radicals from phenols, anilinium cation radicals from anilines) diffusefrom the enzyme's active center into solution and form dimers, trimers, etc. The
*corresponding author; Tel.: 519-253-3000, ext. 3526; Fax: 519-973-7098; e-mail: [email protected]
Emerging Technologies in Hazardous Waste Management 8, edited by Tedder and Pohland Kluwer Academic/Plenum Publishers, New York, 2000. 141
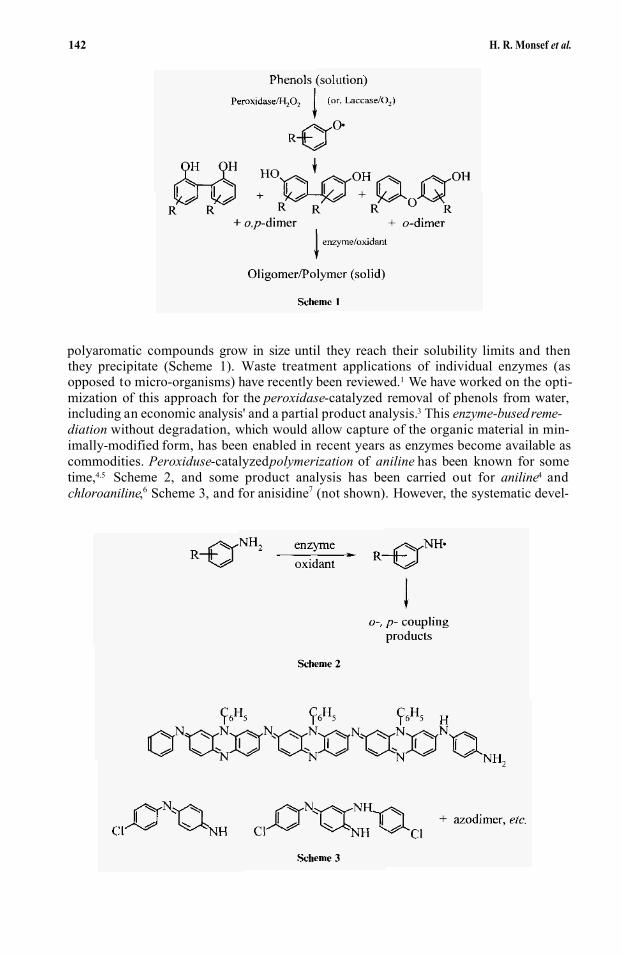
142 H. R. Monsef et al.
polyaromatic compounds grow in size until they reach their solubility limits and thenthey precipitate (Scheme 1). Waste treatment applications of individual enzymes (asopposed to micro-organisms) have recently been reviewed.1 We have worked on the opti-mization of this approach for the peroxidase-catalyzed removal of phenols from water,including an economic analysis' and a partial product analysis.3 This enzyme-busedreme-diation without degradation, which would allow capture of the organic material in min-imally-modified form, has been enabled in recent years as enzymes become available ascommodities. Peroxiduse-catalyzedpolymerization of aniline has been known for sometime,4.5 Scheme 2, and some product analysis has been carried out for aniline4 andchloroaniline,6 Scheme 3, and for anisidine7 (not shown). However, the systematic devel-
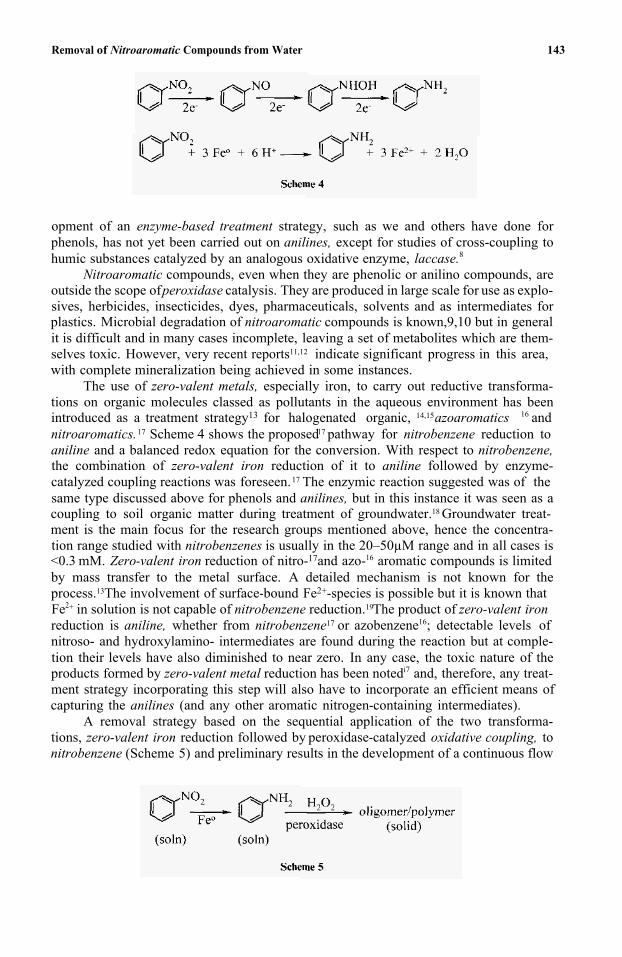
Removal of Nitroaromatic Compounds from Water 143
opment of an enzyme-based treatment strategy, such as we and others have done for phenols, has not yet been carried out on anilines, except for studies of cross-coupling tohumic substances catalyzed by an analogous oxidative enzyme, laccase.8
Nitroaromatic compounds, even when they are phenolic or anilino compounds, areoutside the scope of peroxidase catalysis. They are produced in large scale for use as explo-sives, herbicides, insecticides, dyes, pharmaceuticals, solvents and as intermediates for plastics. Microbial degradation of nitroaromatic compounds is known,9,10 but in generalit is difficult and in many cases incomplete, leaving a set of metabolites which are them-selves toxic. However, very recent reports11,12 indicate significant progress in this area,with complete mineralization being achieved in some instances.
The use of zero-valent metals, especially iron, to carry out reductive transforma-tions on organic molecules classed as pollutants in the aqueous environment has been introduced as a treatment strategy13 for halogenated organic, 14,15azoaromatics 16 andnitroaromatics.17 Scheme 4 shows the proposed17 pathway for nitrobenzene reduction toaniline and a balanced redox equation for the conversion. With respect to nitrobenzene,the combination of zero-valent iron reduction of it to aniline followed by enzyme-catalyzed coupling reactions was foreseen.17 The enzymic reaction suggested was of thesame type discussed above for phenols and anilines, but in this instance it was seen as a coupling to soil organic matter during treatment of groundwater.18 Groundwater treat-ment is the main focus for the research groups mentioned above, hence the concentra-tion range studied with nitrobenzenes is usually in the 20–50µM range and in all cases is <0.3 mM. Zero-valent iron reduction of nitro-17and azo-16 aromatic compounds is limitedby mass transfer to the metal surface. A detailed mechanism is not known for theprocess.13The involvement of surface-bound Fe2+-species is possible but it is known thatFe2+ in solution is not capable of nitrobenzene reduction.19The product of zero-valent ironreduction is aniline, whether from nitrobenzene17 or azobenzene16; detectable levels ofnitroso- and hydroxylamino- intermediates are found during the reaction but at comple-tion their levels have also diminished to near zero. In any case, the toxic nature of the products formed by zero-valent metal reduction has been notedi7 and, therefore, any treat-ment strategy incorporating this step will also have to incorporate an efficient means of capturing the anilines (and any other aromatic nitrogen-containing intermediates).
A removal strategy based on the sequential application of the two transforma-tions, zero-valent iron reduction followed by peroxidase-catalyzed oxidative coupling, tonitrobenzene (Scheme 5) and preliminary results in the development of a continuous flow
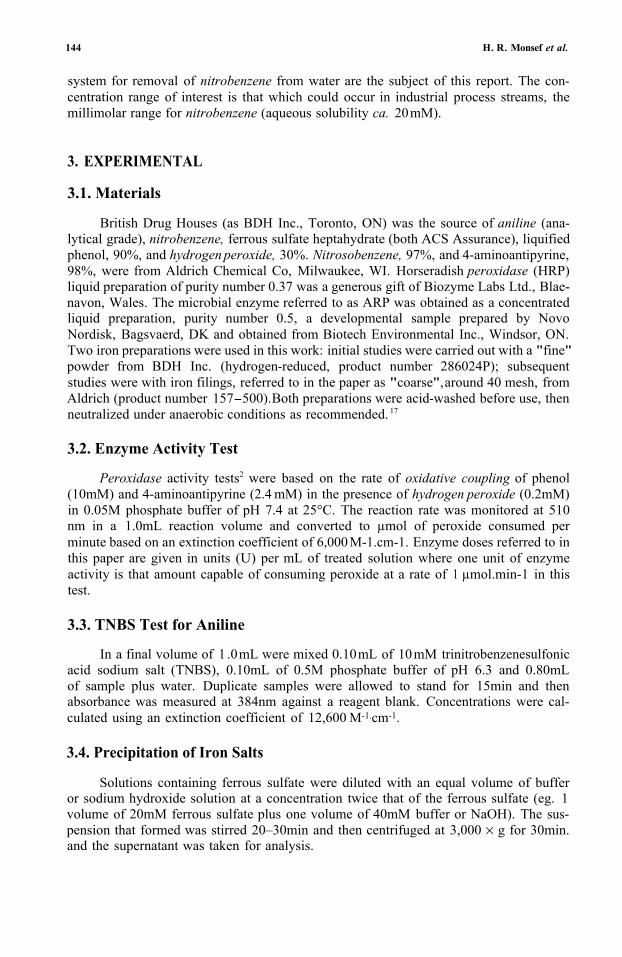
144 H. R. Monsef et al.
system for removal of nitrobenzene from water are the subject of this report. The con-centration range of interest is that which could occur in industrial process streams, the millimolar range for nitrobenzene (aqueous solubility ca. 20mM).
3. EXPERIMENTAL
3.1. Materials
British Drug Houses (as BDH Inc., Toronto, ON) was the source of aniline (ana-lytical grade), nitrobenzene, ferrous sulfate heptahydrate (both ACS Assurance), liquified phenol, 90%, and hydrogen peroxide, 30%. Nitrosobenzene, 97%, and 4-aminoantipyrine,98%, were from Aldrich Chemical Co, Milwaukee, WI. Horseradish peroxidase (HRP)liquid preparation of purity number 0.37 was a generous gift of Biozyme Labs Ltd., Blae-navon, Wales. The microbial enzyme referred to as ARP was obtained as a concentrated liquid preparation, purity number 0.5, a developmental sample prepared by Novo Nordisk, Bagsvaerd, DK and obtained from Biotech Environmental Inc., Windsor, ON. Two iron preparations were used in this work: initial studies were carried out with a "fine"powder from BDH Inc. (hydrogen-reduced, product number 286024P); subsequent studies were with iron filings, referred to in the paper as "coarse", around 40 mesh, from Aldrich (product number 157-500). Both preparations were acid-washed before use, then neutralized under anaerobic conditions as recommended. 17
3.2. Enzyme Activity Test
Peroxidase activity tests2 were based on the rate of oxidative coupling of phenol(10mM) and 4-aminoantipyrine (2.4 mM) in the presence of hydrogen peroxide (0.2mM)in 0.05M phosphate buffer of pH 7.4 at 25°C. The reaction rate was monitored at 510 nm in a 1.0mL reaction volume and converted to µmol of peroxide consumed per minute based on an extinction coefficient of 6,000 M-1.cm-1. Enzyme doses referred to in this paper are given in units (U) per mL of treated solution where one unit of enzymeactivity is that amount capable of consuming peroxide at a rate of 1 µmol.min-1 in this test.
3.3. TNBS Test for Aniline
In a final volume of 1 .0mL were mixed 0.10mL of 10mM trinitrobenzenesulfonicacid sodium salt (TNBS), 0.10mL of 0.5M phosphate buffer of pH 6.3 and 0.80mL of sample plus water. Duplicate samples were allowed to stand for 15min and then absorbance was measured at 384nm against a reagent blank. Concentrations were cal-culated using an extinction coefficient of 12,600 M-1.cm-1.
3.4. Precipitation of Iron Salts
Solutions containing ferrous sulfate were diluted with an equal volume of bufferor sodium hydroxide solution at a concentration twice that of the ferrous sulfate (eg. 1volume of 20mM ferrous sulfate plus one volume of 40mM buffer or NaOH). The sus-pension that formed was stirred 20–30min and then centrifuged at 3,000 × g for 30min.and the supernatant was taken for analysis.
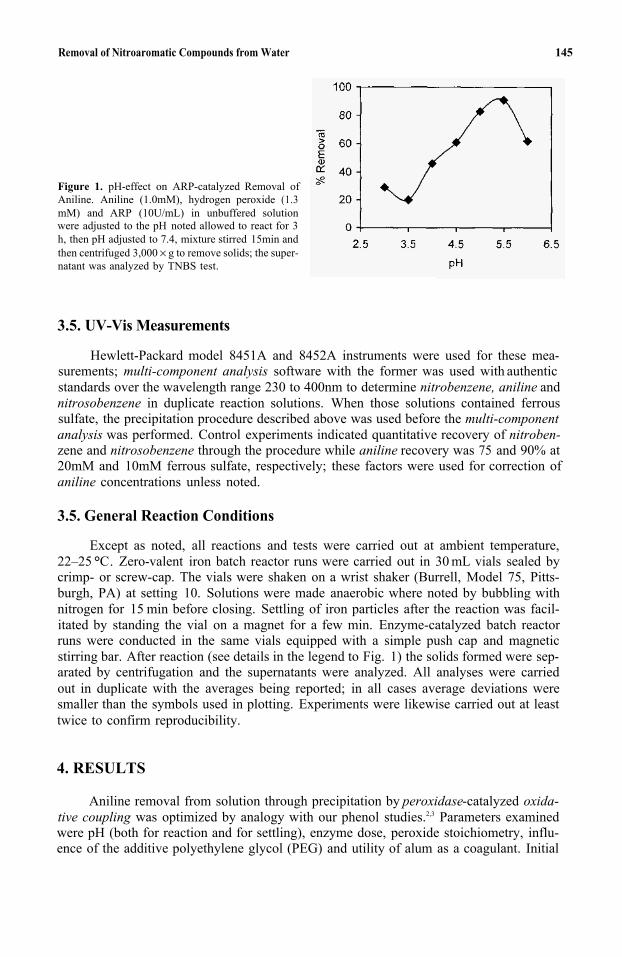
Removal of Nitroaromatic Compounds from Water 145
Figure 1. pH-effect on ARP-catalyzed Removal of Aniline. Aniline (1.0mM), hydrogen peroxide (1.3mM) and ARP (10U/mL) in unbuffered solution were adjusted to the pH noted allowed to react for 3h, then pH adjusted to 7.4, mixture stirred 15min and then centrifuged 3,000 × g to remove solids; the super-natant was analyzed by TNBS test.
3.5. UV-Vis Measurements
Hewlett-Packard model 8451A and 8452A instruments were used for these mea-surements; multi-component analysis software with the former was used with authenticstandards over the wavelength range 230 to 400nm to determine nitrobenzene, aniline andnitrosobenzene in duplicate reaction solutions. When those solutions contained ferrous sulfate, the precipitation procedure described above was used before the multi-componentanalysis was performed. Control experiments indicated quantitative recovery of nitroben-zene and nitrosobenzene through the procedure while aniline recovery was 75 and 90% at20mM and 10mM ferrous sulfate, respectively; these factors were used for correction of aniline concentrations unless noted.
3.5. General Reaction Conditions
Except as noted, all reactions and tests were carried out at ambient temperature, 22–25 °C. Zero-valent iron batch reactor runs were carried out in 30 mL vials sealed bycrimp- or screw-cap. The vials were shaken on a wrist shaker (Burrell, Model 75, Pitts- burgh, PA) at setting 10. Solutions were made anaerobic where noted by bubbling withnitrogen for 15 min before closing. Settling of iron particles after the reaction was facil- itated by standing the vial on a magnet for a few min. Enzyme-catalyzed batch reactor runs were conducted in the same vials equipped with a simple push cap and magnetic stirring bar. After reaction (see details in the legend to Fig. 1) the solids formed were sep-arated by centrifugation and the supernatants were analyzed. All analyses were carried out in duplicate with the averages being reported; in all cases average deviations weresmaller than the symbols used in plotting. Experiments were likewise carried out at least twice to confirm reproducibility.
4. RESULTS
Aniline removal from solution through precipitation by peroxidase-catalyzed oxida-tive coupling was optimized by analogy with our phenol studies.2,3 Parameters examinedwere pH (both for reaction and for settling), enzyme dose, peroxide stoichiometry, influ-ence of the additive polyethylene glycol (PEG) and utility of alum as a coagulant. Initial
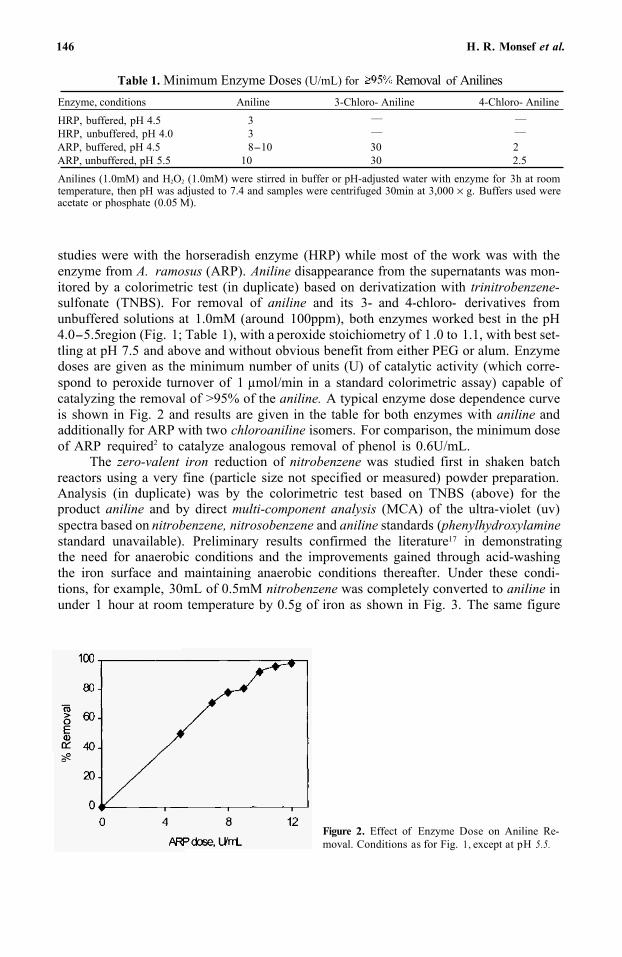
146 H. R. Monsef et al.
Table 1. Minimum Enzyme Doses (U/mL) fo r Removal of AnilinesEnzyme, conditions Aniline 3-Chloro- Aniline 4-Chloro- Aniline
— —HRP, buffered, pH 4.5 3HRP, unbuffered, pH 4.0 3ARP, buffered, pH 4.5 8-10 30 2
— —
ARP, unbuffered, pH 5.5 10 30 2.5Anilines (1.0mM) and H2O2 (1.0mM) were stirred in buffer or pH-adjusted water with enzyme for 3h at roomtemperature, then pH was adjusted to 7.4 and samples were centrifuged 30min at 3,000 × g. Buffers used wereacetate or phosphate (0.05 M).
studies were with the horseradish enzyme (HRP) while most of the work was with theenzyme from A. ramosus (ARP). Aniline disappearance from the supernatants was mon-itored by a colorimetric test (in duplicate) based on derivatization with trinitrobenzene-sulfonate (TNBS). For removal of aniline and its 3- and 4-chloro- derivatives fromunbuffered solutions at 1.0mM (around 100ppm), both enzymes worked best in the pH 4.0-5.5 region (Fig. 1; Table 1), with a peroxide stoichiometry of 1 .0 to 1.1, with best set-tling at pH 7.5 and above and without obvious benefit from either PEG or alum. Enzyme doses are given as the minimum number of units (U) of catalytic activity (which corre-spond to peroxide turnover of 1 µmol/min in a standard colorimetric assay) capable ofcatalyzing the removal of >95% of the aniline. A typical enzyme dose dependence curve is shown in Fig. 2 and results are given in the table for both enzymes with aniline andadditionally for ARP with two chloroaniline isomers. For comparison, the minimum dose of ARP required2 to catalyze analogous removal of phenol is 0.6U/mL.
The zero-valent iron reduction of nitrobenzene was studied first in shaken batchreactors using a very fine (particle size not specified or measured) powder preparation. Analysis (in duplicate) was by the colorimetric test based on TNBS (above) for theproduct aniline and by direct multi-component analysis (MCA) of the ultra-violet (uv) spectra based on nitrobenzene, nitrosobenzene and aniline standards (phenylhydroxylaminestandard unavailable). Preliminary results confirmed the literature17 in demonstratingthe need for anaerobic conditions and the improvements gained through acid-washingthe iron surface and maintaining anaerobic conditions thereafter. Under these condi-tions, for example, 30mL of 0.5mM nitrobenzene was completely converted to aniline inunder 1 hour at room temperature by 0.5g of iron as shown in Fig. 3. The same figure
Figure 2. Effect of Enzyme Dose on Aniline Re-moval. Conditions as for Fig. 1, except at pH 5.5.
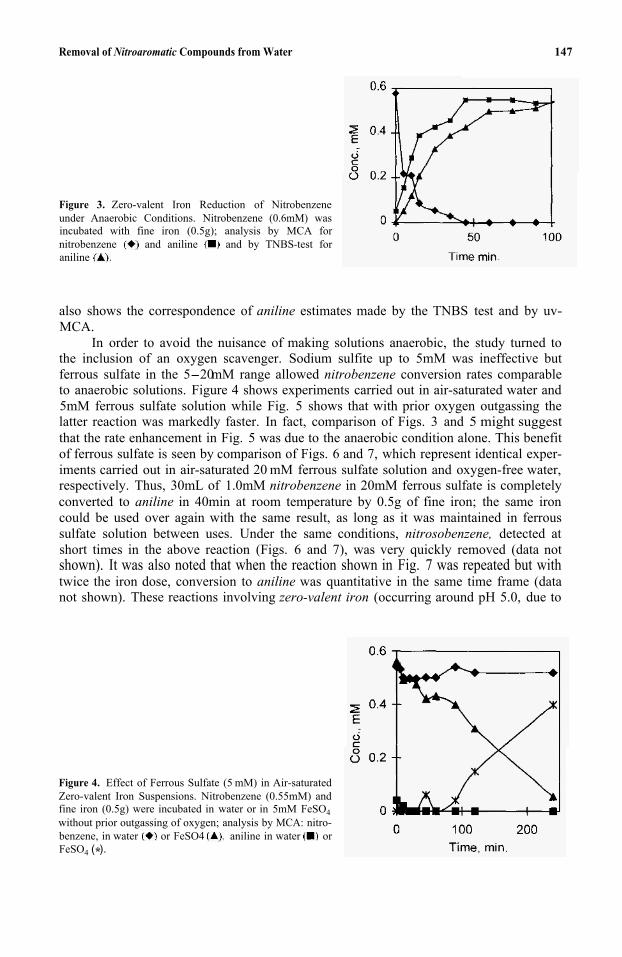
Removal of Nitroaromatic Compounds from Water 147
Figure 3. Zero-valent Iron Reduction of Nitrobenzeneunder Anaerobic Conditions. Nitrobenzene (0.6mM) wasincubated with fine iron (0.5g); analysis by MCA fornitrobenzene and aniline and by TNBS-test foraniline
also shows the correspondence of aniline estimates made by the TNBS test and by uv-MCA.
In order to avoid the nuisance of making solutions anaerobic, the study turned to the inclusion of an oxygen scavenger. Sodium sulfite up to 5mM was ineffective but ferrous sulfate in the 5-20mM range allowed nitrobenzene conversion rates comparableto anaerobic solutions. Figure 4 shows experiments carried out in air-saturated water and5mM ferrous sulfate solution while Fig. 5 shows that with prior oxygen outgassing thelatter reaction was markedly faster. In fact, comparison of Figs. 3 and 5 might suggest that the rate enhancement in Fig. 5 was due to the anaerobic condition alone. This benefitof ferrous sulfate is seen by comparison of Figs. 6 and 7, which represent identical exper-iments carried out in air-saturated 20 mM ferrous sulfate solution and oxygen-free water, respectively. Thus, 30mL of 1.0mM nitrobenzene in 20mM ferrous sulfate is completely converted to aniline in 40min at room temperature by 0.5g of fine iron; the same iron could be used over again with the same result, as long as it was maintained in ferrous sulfate solution between uses. Under the same conditions, nitrosobenzene, detected at short times in the above reaction (Figs. 6 and 7), was very quickly removed (data notshown). It was also noted that when the reaction shown in Fig. 7 was repeated but withtwice the iron dose, conversion to aniline was quantitative in the same time frame (data not shown). These reactions involving zero-valent iron (occurring around pH 5.0, due to
Figure 4. Effect of Ferrous Sulfate (5 mM) in Air-saturatedZero-valent Iron Suspensions. Nitrobenzene (0.55mM) and fine iron (0.5g) were incubated in water or in 5mM FeSO4without prior outgassing of oxygen; analysis by MCA: nitro-benzene, in water or FeSO4 aniline in water or FeSO4 (*).
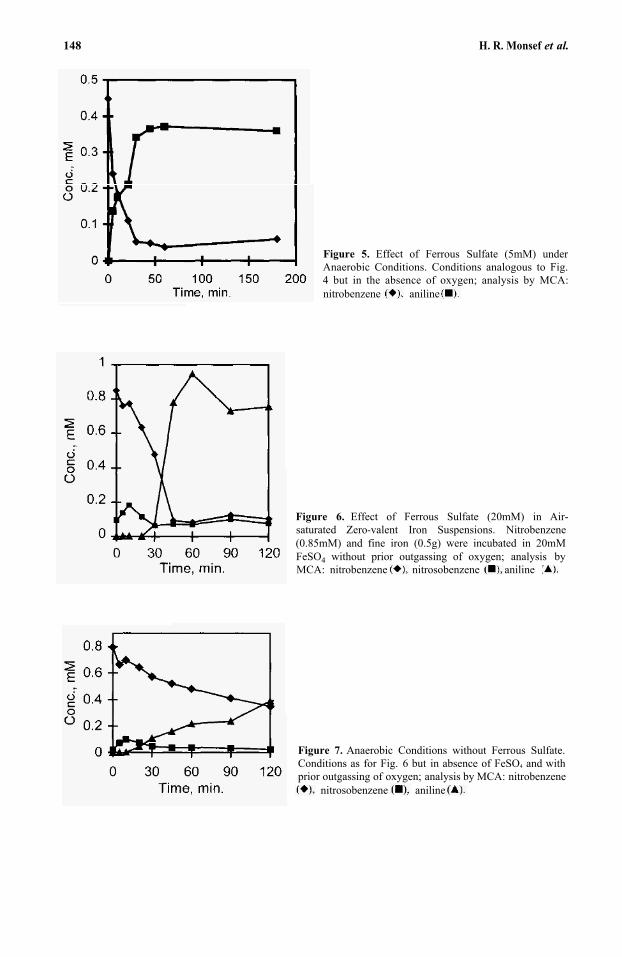
148 H. R. Monsef et al.
Figure 5. Effect of Ferrous Sulfate (5mM) underAnaerobic Conditions. Conditions analogous to Fig. 4 but in the absence of oxygen; analysis by MCA: nitrobenzene aniline
Figure 6. Effect of Ferrous Sulfate (20mM) in Air-saturated Zero-valent Iron Suspensions. Nitrobenzene (0.85mM) and fine iron (0.5g) were incubated in 20mMFeSO4 without prior outgassing of oxygen; analysis byMCA: nitrobenzene nitrosobenzene aniline
Figure 7. Anaerobic Conditions without Ferrous Sulfate.Conditions as for Fig. 6 but in absence of FeSO4 and with prior outgassing of oxygen; analysis by MCA: nitrobenzene
nitrosobenzene aniline
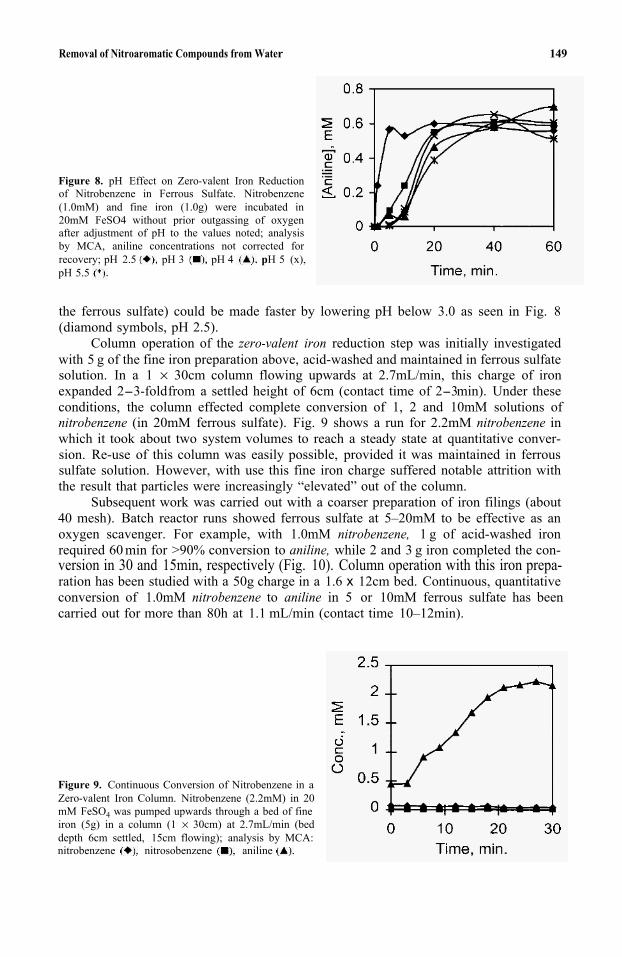
Removal of Nitroaromatic Compounds from Water 149
Figure 8. pH Effect on Zero-valent Iron Reductionof Nitrobenzene in Ferrous Sulfate. Nitrobenzene (1.0mM) and fine iron (1.0g) were incubated in 20mM FeSO4 without prior outgassing of oxygen after adjustment of pH to the values noted; analysis by MCA, aniline concentrations not corrected for recovery; pH 2.5 pH 3 pH 4 pH 5 (x),pH 5.5
the ferrous sulfate) could be made faster by lowering pH below 3.0 as seen in Fig. 8(diamond symbols, pH 2.5).
Column operation of the zero-valent iron reduction step was initially investigatedwith 5 g of the fine iron preparation above, acid-washed and maintained in ferrous sulfate solution. In a 1 × 30cm column flowing upwards at 2.7mL/min, this charge of ironexpanded 2-3-foldfrom a settled height of 6cm (contact time of 2-3min). Under theseconditions, the column effected complete conversion of 1, 2 and 10mM solutions of nitrobenzene (in 20mM ferrous sulfate). Fig. 9 shows a run for 2.2mM nitrobenzene inwhich it took about two system volumes to reach a steady state at quantitative conver- sion. Re-use of this column was easily possible, provided it was maintained in ferrous sulfate solution. However, with use this fine iron charge suffered notable attrition with the result that particles were increasingly “elevated” out of the column.
Subsequent work was carried out with a coarser preparation of iron filings (about40 mesh). Batch reactor runs showed ferrous sulfate at 5–20mM to be effective as an oxygen scavenger. For example, with 1.0mM nitrobenzene, 1 g of acid-washed iron required 60 min for >90% conversion to aniline, while 2 and 3 g iron completed the con- version in 30 and 15min, respectively (Fig. 10). Column operation with this iron prepa-ration has been studied with a 50g charge in a 1.6 x 12cm bed. Continuous, quantitative conversion of 1.0mM nitrobenzene to aniline in 5 or 10mM ferrous sulfate has beencarried out for more than 80h at 1.1 mL/min (contact time 10–12min).
Figure 9. Continuous Conversion of Nitrobenzene in aZero-valent Iron Column. Nitrobenzene (2.2mM) in 20 mM FeSO4 was pumped upwards through a bed of fineiron (5g) in a column (1 × 30cm) at 2.7mL/min (beddepth 6cm settled, 15cm flowing); analysis by MCA: nitrobenzene nitrosobenzene aniline
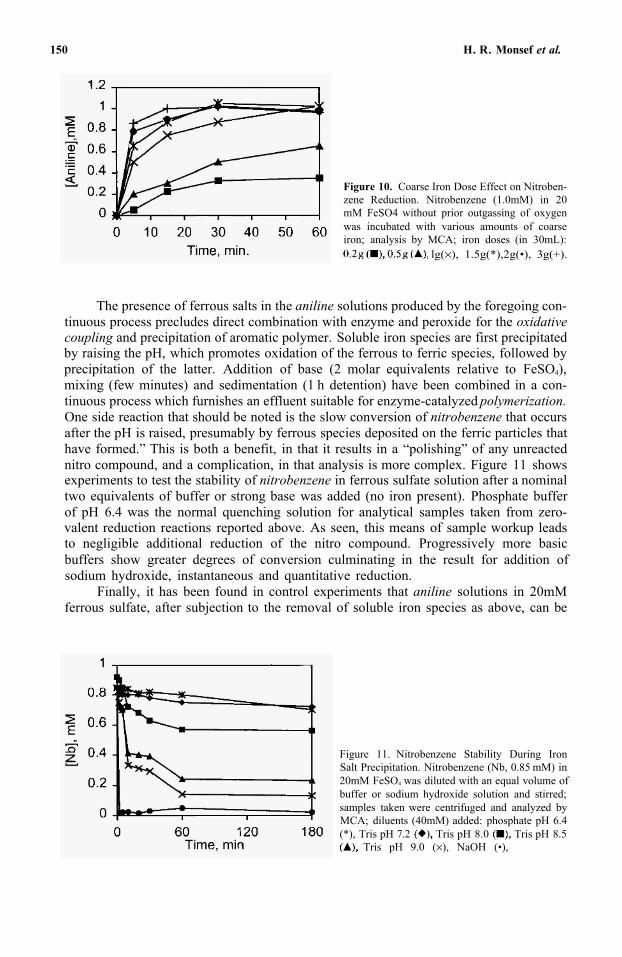
150 H. R. Monsef et al.
Figure 10. Coarse Iron Dose Effect on Nitroben-zene Reduction. Nitrobenzene (1.0mM) in 20 mM FeSO4 without prior outgassing of oxygen was incubated with various amounts of coarse iron; analysis by MCA; iron doses (in 30mL):
lg(×), 1.5g(*),2g(•), 3g(+).
The presence of ferrous salts in the aniline solutions produced by the foregoing con-tinuous process precludes direct combination with enzyme and peroxide for the oxidativecoupling and precipitation of aromatic polymer. Soluble iron species are first precipitated by raising the pH, which promotes oxidation of the ferrous to ferric species, followed by precipitation of the latter. Addition of base (2 molar equivalents relative to FeSO4),mixing (few minutes) and sedimentation (1 h detention) have been combined in a con-tinuous process which furnishes an effluent suitable for enzyme-catalyzed polymerization.One side reaction that should be noted is the slow conversion of nitrobenzene that occurs after the pH is raised, presumably by ferrous species deposited on the ferric particles that have formed.” This is both a benefit, in that it results in a “polishing” of any unreacted nitro compound, and a complication, in that analysis is more complex. Figure 11 showsexperiments to test the stability of nitrobenzene in ferrous sulfate solution after a nominal two equivalents of buffer or strong base was added (no iron present). Phosphate buffer of pH 6.4 was the normal quenching solution for analytical samples taken from zero-valent reduction reactions reported above. As seen, this means of sample workup leads to negligible additional reduction of the nitro compound. Progressively more basic buffers show greater degrees of conversion culminating in the result for addition of sodium hydroxide, instantaneous and quantitative reduction.
Finally, it has been found in control experiments that aniline solutions in 20mM ferrous sulfate, after subjection to the removal of soluble iron species as above, can be
Figure 11. Nitrobenzene Stability During Iron Salt Precipitation. Nitrobenzene (Nb, 0.85 mM) in 20mM FeSO4 was diluted with an equal volume ofbuffer or sodium hydroxide solution and stirred; samples taken were centrifuged and analyzed by MCA; diluents (40mM) added: phosphate pH 6.4 (*), Tris pH 7.2 Tris pH 8.0 Tris pH 8.5 Tris pH 9.0 (×), NaOH (•),
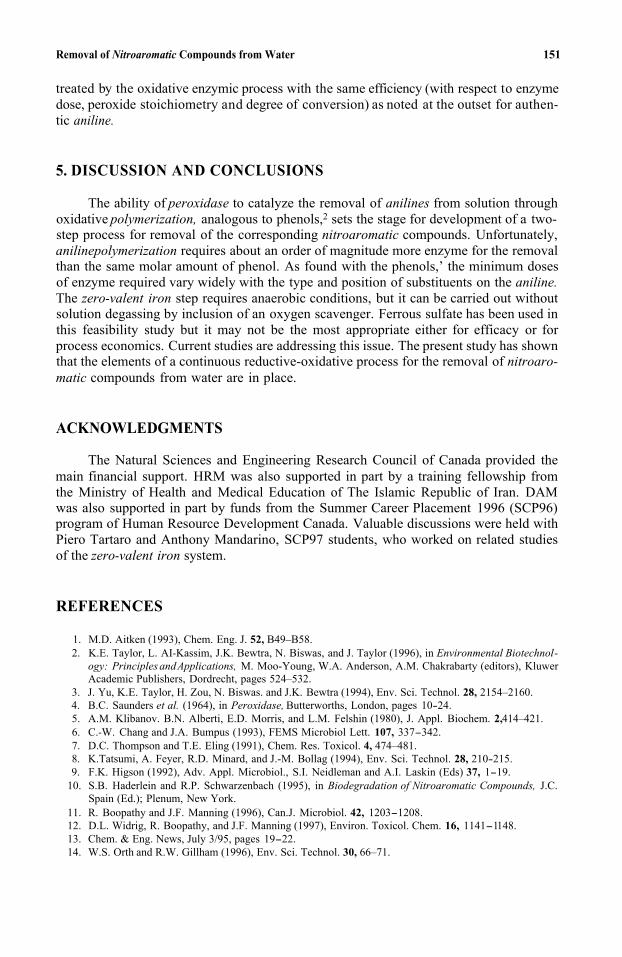
Removal of Nitroaromatic Compounds from Water 151
treated by the oxidative enzymic process with the same efficiency (with respect to enzymedose, peroxide stoichiometry and degree of conversion) as noted at the outset for authen-tic aniline.
5. DISCUSSION AND CONCLUSIONS
The ability of peroxidase to catalyze the removal of anilines from solution through oxidative polymerization, analogous to phenols,2 sets the stage for development of a two-step process for removal of the corresponding nitroaromatic compounds. Unfortunately, aniline polymerization requires about an order of magnitude more enzyme for the removal than the same molar amount of phenol. As found with the phenols,’ the minimum dosesof enzyme required vary widely with the type and position of substituents on the aniline.The zero-valent iron step requires anaerobic conditions, but it can be carried out without solution degassing by inclusion of an oxygen scavenger. Ferrous sulfate has been used in this feasibility study but it may not be the most appropriate either for efficacy or for process economics. Current studies are addressing this issue. The present study has shown that the elements of a continuous reductive-oxidative process for the removal of nitroaro-matic compounds from water are in place.
ACKNOWLEDGMENTS
The Natural Sciences and Engineering Research Council of Canada provided the main financial support. HRM was also supported in part by a training fellowship from the Ministry of Health and Medical Education of The Islamic Republic of Iran. DAMwas also supported in part by funds from the Summer Career Placement 1996 (SCP96) program of Human Resource Development Canada. Valuable discussions were held with Piero Tartaro and Anthony Mandarino, SCP97 students, who worked on related studies of the zero-valent iron system.
REFERENCES
1. M.D. Aitken (1993), Chem. Eng. J. 52, B49–B58. 2. K.E. Taylor, L. AI-Kassim, J.K. Bewtra, N. Biswas, and J. Taylor (1996), in Environmental Biotechnol-
ogy: Principles and Applications, M. Moo-Young, W.A. Anderson, A.M. Chakrabarty (editors), Kluwer Academic Publishers, Dordrecht, pages 524–532.
3. J. Yu, K.E. Taylor, H. Zou, N. Biswas. and J.K. Bewtra (1994), Env. Sci. Technol. 28, 2154–2160. 4. B.C. Saunders et al. (1964), in Peroxidase, Butterworths, London, pages 10-24.5. A.M. Klibanov. B.N. Alberti, E.D. Morris, and L.M. Felshin (1980), J. Appl. Biochem. 2,414–421.6. C.-W. Chang and J.A. Bumpus (1993), FEMS Microbiol Lett. 107, 337-342.7. D.C. Thompson and T.E. Eling (1991), Chem. Res. Toxicol. 4, 474–481. 8. K.Tatsumi, A. Feyer, R.D. Minard, and J.-M. Bollag (1994), Env. Sci. Technol. 28, 210-215.9. F.K. Higson (1992), Adv. Appl. Microbiol., S.I. Neidleman and A.I. Laskin (Eds) 37, 1-19.
10. S.B. Haderlein and R.P. Schwarzenbach (1995), in Biodegradation of Nitroaromatic Compounds, J.C.Spain (Ed.); Plenum, New York.
11. R. Boopathy and J.F. Manning (1996), Can.J. Microbiol. 42, 1203-1208.12. D.L. Widrig, R. Boopathy, and J.F. Manning (1997), Environ. Toxicol. Chem. 16, 1141-1 148. 13. Chem. & Eng. News, July 3/95, pages 19-22.14. W.S. Orth and R.W. Gillham (1996), Env. Sci. Technol. 30, 66–71.

152 H. R. Monsef et al.
15. T.L. Johnson, M.M. Scherer, and P.G. Tratnyek (1996), Env. Sci. Technol. 30, 2634–2640.16. E.J. Weber (1996), Env. Sci. Technol. 30, 716–719.17. A. Agrawal and P.G. Tratnyek (1996), Env. Sci. Technol. 30, 153–160.18. J.-M. Bollag (1992), Env. Sci. Technol. 26, 1876–1881.19. J. Klausen, S.P. Trober, S.B. Haderlein, and R.P. Schwarzenbach (1995), Env. Sci. Technol. 29,
23962404.
13
IN SITU FENTON-LIKE OXIDATION OFVOLATILE ORGANICS
Laboratory, Pilot and Full-scale Demonstrations
Richard S. Greenberg1, Thomas Andrews1, Prasad K. C. Kakarla1,and Richard J. Watts2
1In-Situ Oxidative Technologies, Inc.Lawrenceville, New Jersey, USA
2Department of Civil & Environmental Eng.Washington State UniversityPullman, Washington, USA
1. ABSTRACT
Laboratory, pilot, and full-scale experiments were used to evaluate and optimize the ISOTECSM remedial process at a warehousing facility in Union, N. J. Based on mod-ified Fenton's oxidative chemistry, the ISOTECSM process uses a proprietary catalyticagent which delays formation of reactive hydroxyl radicals. This allows adequate disper-sion of the hydroxyl radicals, which is an oxidizing agent, throughout a contaminant plume. Groundwater at the site was contaminated with high levels of gasoline and waste oil constituents, principally benzene, toluene, ethylebenzene, xylenes (BTEX) and methyl-t-butylether (MTBE). Bench scale microcosm studies were used to evaluate the appro-priate site-specific stoichiometric relationships between catalyst, stabilizers, and oxidizers; the effect of contaminant type and concentration; and the pH optima. Based on results of the laboratory studies, a pilot-scale study was performed at the site. One injection point for catalyst, stabilizers, and oxidant was installed in the contaminated zone at the site, with one hydraulically connected downgradient well used for monitoring. A single treat-ment of the reagents in the optimal stoichiometry determined from the laboratory study was injected in situ over a period of three days. A 98.5% reduction in volatile organics was observed in the area treated, with the radial extent of treatment estimated to be approximately 20 feet, based on the presence of hydroxyl radicals detected in hydrauli-cally connected areas and at the surface. The full-scale process employed six injection points and three treatment cycles over a three month period. Subsequent to treatment,contaminant levels were either non-detectable or were reduced to below applicable New
Emerging Technologies in Hazardous Waste Management 8, edited by Tedder and Pohland Kluwer Academic /Plenum Publishers, New York, 2000. 153
154 R. S. Greenberg et al.
Jersey groundwater standards, with regulatory closure on the site achieved in less thanone year.
2. INTRODUCTION
Remediation of groundwater contamination is a chronic environmental problemdue primarily to the complexity associated with a subsurface soil-water matrix. In most cases, contamination exists in both soil and aqueous phases dictated by the correspond-ing distribution coefficient (Kd) and the octanol water partition coefficient (Kow) (Watts1997). Several factors limit the application of conventional treatment techniques to sub-surface contamination. For example, pump and treat and soil vapor extraction (SVE) have high capital and operational costs, large treatment time spans, and are not effectiveagainst sorbed contaminants. In situ bioremediation also is plagued by large treatment time spans and is limited by the oxygen supply to subsurface microorganisms and the absence of indigenous microbial strains to degrade the recalcitrant (or biorefractory) con-taminants (Thomas and Ward 1989).
Recent years saw a significant increase in the use of catalyzed hydrogen peroxide(known as Fenton's reagent) for soil and groundwater remediation because of its ability to oxidize a wide variety of contaminants in a short time frame. Hydroxyl radicals arethe principal oxidant involved in Fenton's process (Haber and Weiss 1934) and are known to react with most contaminants at near diffusion controlled rates i.e. at rates approach-ing 1 × 10¹⁰M-1s-1 (Dorfman and Adams 1973). Early researchers successfully trans-formed benzenes and toluenes into phenols, cresols, and biphenyls using Fenton's reagent(Merz and Waters 1949; Baxendale and Magee 1953). Eisenhauer (1964) suggested oxi-dation of phenol, an aromatic compound, by hydroxyl radicals into cis, cis-muconic acid, a linear compound, by virtue of ring breakage. More recently, other contaminants such as p-toluenesulfonicacid (Feuerstein et al. 1981), formaldehyde (Murphy et al. 1989), per-chloroethene (Leung et al. 1992), and trichloroethene (Ravikumar and Gurol 1994) wereoxidized successfully using catalyzed hydrogen peroxide. Furthermore, Stanton and Watts (1995) and Watts et al. (1991,1994) oxidized strongly sorbed contaminants in soils includ-ing hexadecane, octachlorodibenzo-p-dioxin (OCDD), and hexachlorobenzene. Two mechanisms were proposed as possible for contaminant oxidation with hydroxyl radicals in a soil-water matrix (Watts et al. 1994): (1) desorption of the contaminants followed by contaminant oxidation under normal or aggressive reaction conditions, and (2) contam-inant oxidation on the surface of the soils when hydroxyl radicals break the soil-waterbarrier under aggressive conditions.
Most research in the past was performed at bench scale level although the poten-tial of Fenton’s/Fenton-like reactions for in situ soil and groundwater remediation wasrecognized. In the 1990s, growth in commercial usage of Fenton's reagent to achieve full-scale remediation occurred. The process was used in reactors for industrial waste treat-ment (Bigda 1996) and also for in situ groundwater remediation (ISOTECSM or In-SituOxidative Technologies, Inc.).
ISOTECSM is actively involved in the in-situ application of catalyzed hydrogen per-oxide for soil and groundwater remediation. The ISOTECSM process involves injection ofhydrogen peroxide and proprietary iron-based catalysts directly into or around areas of known contamination in the subsurface. A site specific delivery system designed to treat organic contaminants within an area of concern (AOC) is utilized. The injectants react
In Situ Fenton-Like Oxidation of Volatile Organics
in the subsurface generating hydroxyl radicals which oxidize the organic contaminants to produce carbon dioxide and water.
In the ISOTECSM process, a series of laboratory studies are first performed on rep-resentative samples to determine the preliminary treatment quantities and the site spe-cific stoichiometry of reagents needed. Application is later tested in the field during a pilot program to determine process efficiency and extent of treatment, which may vary depending on the site’s subsurface characteristics. Based on a successful laboratory study and pilot program, full-scale treatment of the site is performed.
The objective of this paper is to discuss (a) the laboratory studies on a representa-tive contaminated sample for potential application of the ISOTECSM process, and (b) themacroscale field pilot study at a warehousing facility in Union, New Jersey with gasoline and waste oil contamination followed by full-scale application of the ISOTECSM processand case closure.
155
3. MATERIALS AND ANALYSIS
3.1. Materials
All chemicals used for proprietary laboratory scale ISOTECSM catalyst (chelated iron complex) preparation were reagent grade and purchased from Aldrich (Milwaukee, WI). Stock hydrogen peroxide (35%), sodium thiosulfate, and potassium iodide (reagent grade) were purchased from Fisher Scientific. Ammonium molybdate and starch were purchased from Aldrich (Milwaukee, WI). Distilled Water (Polar Spring) was used for all laboratory reagent preparation and analyses. The hydrogen peroxide field test kit was pur-chased from Hach (Colorado). Bulk quantities of chemicals and equipment used for full-scale remediation were obtained from local suppliers in New Jersey.
3.2. Analysis
All laboratory analyses was performed by a EPA certified analytical laboratory. Pre-and post-treatment groundwater samples were analyzed for volatile organics (EPA Method 624 + 10), with total iron (Fe) and total organic carbon (TOC) also measuredduring the post-treatment event. Field sampling parameters, as specified within the NewJersey Department of Environmental Protection (NJDEP), Field Sampling Procedures Manual (FSPM), dated May, 1992, were measured during the sampling events. In addi-tion, qualitative tests for hydrogen peroxide and ISOTEC’s proprietary method of directly detecting hydroxyl radicals, utilizing a color free radical trap, were conducted during the pilot program and full-scale remediation. The laboratory hydrogen peroxide analysis was performed using a modified thiosulfate technique (FMC 1989). Field monitoring for hydrogen peroxide was performed using the Hach hydrogen peroxide test kit.
4. LABORATORY STUDIES
4.1. Optimization Experiments
In order to optimize the oxidation of gasoline contaminated water, three-levelrotatable central composite design experiments (Diamond 1989) were performed. A
156 R. S. Greenberg et al.
representative sample contaminated with high concentrations of BTEX, MTBE, and TBA (t-butyl alcohol) was used for the experiments. The catalyst (chelated iron complex)and oxidizer (stabilized hydrogen peroxide) concentrations were varied from 0–75 ppmand 0–530ppm respectively. Response surfaces (curves that represent percent contami-nant destruction as a function of oxidizer, catalyst, and stabilizer concentrations) to opti-mize percent contaminant destruction were generated using the catalyst and oxidizer asindependent variables at a fixed stabilizer concentration. Although pH adjustment tohigher acidic range was performed initially, the final pH of the treated samples varied according to the concentrations of the reagents added.
4.2. Bench Scale Studies
The groundwater sample which exhibited the highest contaminant levels was col-lected from MW-2 at the warehousing facility (see site description under “Field Studies”) and analyzed for dissolved iron and volatile organic concentrations. The optimum reagent combination obtained from the central composite experiments was used as the basis for the laboratory study. Specific concentrations and volumes of the reagents to be injected in the field were determined based on a series of bench scale studies which tested several catalyst and oxidizer amendments in the optimal pH range of 3–4 (Watts et al. 1990).The bench scale studies were conducted in 140ml vials sealed with aluminum caps con-taining rubber septums to facilitate easy injection of the reagents with minimum volatilization loss. Samples were placed in vials with enough head space for the prede-termined reagent volumes to be injected. A control sample was set up to correct for anyvolatilization loss. The catalyst mix and oxidizer were injected into each experimental vial as hourly treatment cycles with one treatment corresponding to half the concentration of the optimum combination obtained from the central composite experiments. A totalof three treatments were completed with a vial sacrificed after each treatment for volatiles analysis. All experimental vials were left undisturbed at room temperature for approxi-mately 48 hours and periodically monitored for oxidant concentration and pH variations. After determining that the oxidizer was fully consumed, all samples were analyzed for volatile organics. The treatment efficiencies determined from the results of each reagent amendment was further used to arrive at the proprietary reagent combination and treat-ment cycles specific to the samples.
4.3. Microcosm Studies
The above study only tested the oxidation capability of the reagents for site specific contaminants of interest in water and did not examine the interactive effects of a soil-water matrix. Therefore, additional microcosm studies were performed in glass tanks inan effort to gain insight into a real subsurface environment. Soil collected from an uncon-taminated zone of the warehousing facility was used as the media in order to simulate down-gradient flow effects of the injected reagents. Factors such as organic content or permeability were not considered due to the difficulty associated with replicating those specific conditions and in lieu of a forthcoming field pilot study (described under “Field Studies”). Hence, the objective of these experiments was to confirm that the optimum chemical combination determined for the contaminant concentrations in aqueous form was capable of treating a contaminant plume within a soil-water matrix.
The microcosm study was set up in a 10 gallon glass tank [10"W x 12"H x 20"L;see Fig. 1]. The tank was divided into three compartments using two Plexiglas panels per-
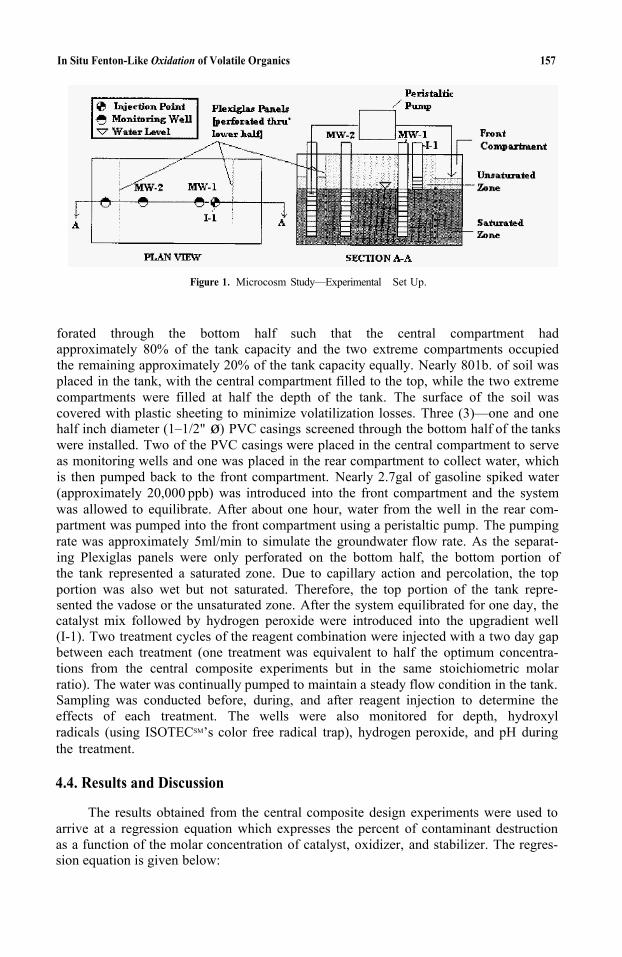
In Situ Fenton-Like Oxidation of Volatile Organics 157
Figure 1. Microcosm Study—Experimental Set Up.
forated through the bottom half such that the central compartment hadapproximately 80% of the tank capacity and the two extreme compartments occupied the remaining approximately 20% of the tank capacity equally. Nearly 801b. of soil was placed in the tank, with the central compartment filled to the top, while the two extreme compartments were filled at half the depth of the tank. The surface of the soil wascovered with plastic sheeting to minimize volatilization losses. Three (3)—one and one half inch diameter (1–1/2" ø) PVC casings screened through the bottom half of the tankswere installed. Two of the PVC casings were placed in the central compartment to serve as monitoring wells and one was placed in the rear compartment to collect water, which is then pumped back to the front compartment. Nearly 2.7gal of gasoline spiked water (approximately 20,000 ppb) was introduced into the front compartment and the system was allowed to equilibrate. After about one hour, water from the well in the rear com- partment was pumped into the front compartment using a peristaltic pump. The pumping rate was approximately 5ml/min to simulate the groundwater flow rate. As the separat- ing Plexiglas panels were only perforated on the bottom half, the bottom portion ofthe tank represented a saturated zone. Due to capillary action and percolation, the top portion was also wet but not saturated. Therefore, the top portion of the tank repre-sented the vadose or the unsaturated zone. After the system equilibrated for one day, the catalyst mix followed by hydrogen peroxide were introduced into the upgradient well (I-1). Two treatment cycles of the reagent combination were injected with a two day gap between each treatment (one treatment was equivalent to half the optimum concentra- tions from the central composite experiments but in the same stoichiometric molar ratio). The water was continually pumped to maintain a steady flow condition in the tank. Sampling was conducted before, during, and after reagent injection to determine the effects of each treatment. The wells were also monitored for depth, hydroxyl radicals (using ISOTECSM’s color free radical trap), hydrogen peroxide, and pH during the treatment.
4.4. Results and Discussion
The results obtained from the central composite design experiments were used to arrive at a regression equation which expresses the percent of contaminant destruction as a function of the molar concentration of catalyst, oxidizer, and stabilizer. The regres- sion equation is given below:
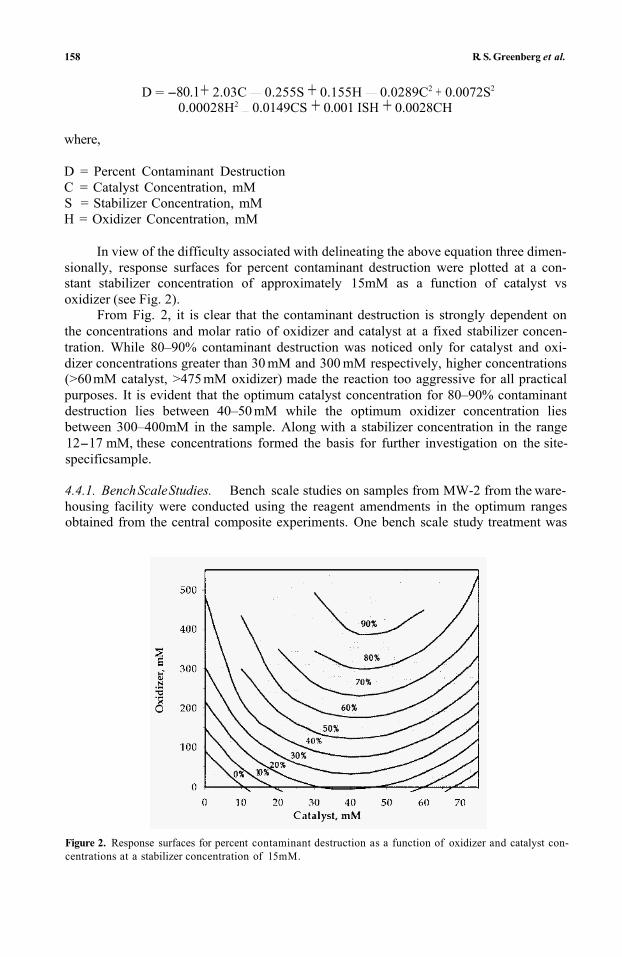
158 R. S. Greenberg et al.
D = -80.1+ 2.03C – 0.255S + 0.155H – 0.0289C2 + 0.0072S2
– 0.00028H2– 0.0149CS + 0.001 ISH + 0.0028CH
where,
D = Percent Contaminant Destruction C = Catalyst Concentration, mM S = Stabilizer Concentration, mM H = Oxidizer Concentration, mM
In view of the difficulty associated with delineating the above equation three dimen-sionally, response surfaces for percent contaminant destruction were plotted at a con-stant stabilizer concentration of approximately 15mM as a function of catalyst vs oxidizer (see Fig. 2).
From Fig. 2, it is clear that the contaminant destruction is strongly dependent onthe concentrations and molar ratio of oxidizer and catalyst at a fixed stabilizer concen-tration. While 80–90% contaminant destruction was noticed only for catalyst and oxi-dizer concentrations greater than 30 mM and 300 mM respectively, higher concentrations(>60mM catalyst, >475 mM oxidizer) made the reaction too aggressive for all practical purposes. It is evident that the optimum catalyst concentration for 80–90% contaminantdestruction lies between 40–50 mM while the optimum oxidizer concentration liesbetween 300–400mM in the sample. Along with a stabilizer concentration in the range 12-17 mM, these concentrations formed the basis for further investigation on the site-specific sample.
4.4.1. BenchScaleStudies. Bench scale studies on samples from MW-2 from the ware-housing facility were conducted using the reagent amendments in the optimum rangesobtained from the central composite experiments. One bench scale study treatment was
Figure 2. Response surfaces for percent contaminant destruction as a function of oxidizer and catalyst con-centrations at a stabilizer concentration of 15mM.
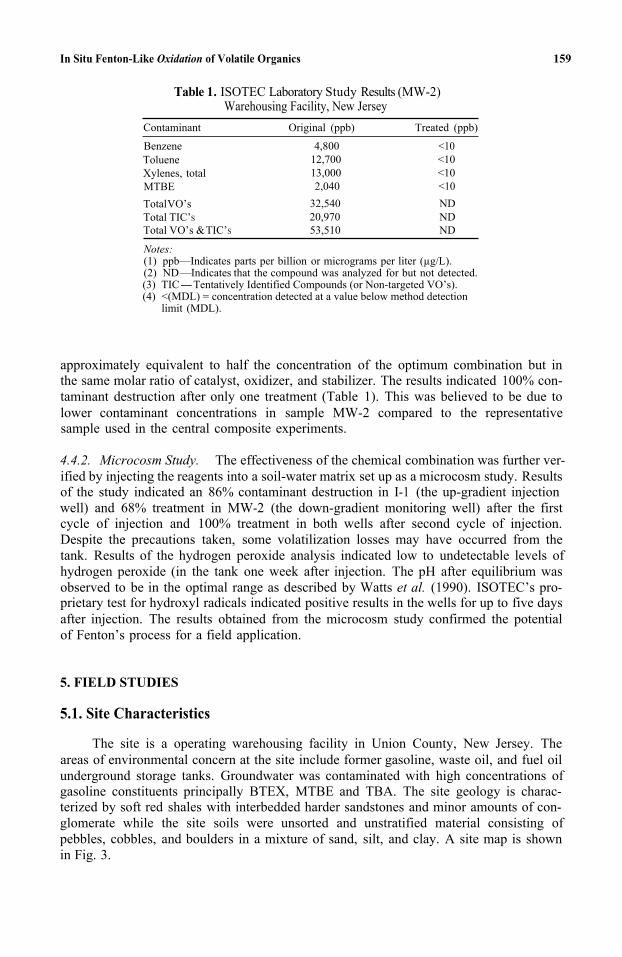
In Situ Fenton-Like Oxidation of Volatile Organics 159
Table 1. ISOTEC Laboratory Study Results (MW-2)Warehousing Facility, New Jersey
Contaminant Original (ppb) Treated (ppb)
Benzene 4,800 <10Toluene 12,700 <10 Xylenes, total 13,000 <10 MTBE 2,040 <10Total VO’s 32,540 ND Total TIC’S 20,970 ND Total VO’s &TIC’S 53,510 ND
Notes:(1) ppb—Indicates parts per billion or micrograms per liter (µg/L). (2) ND—Indicates that the compound was analyzed for but not detected.(3) TIC-Tentatively Identified Compounds (or Non-targeted VO’s). (4) <(MDL) = concentration detected at a value below method detection
limit (MDL).
approximately equivalent to half the concentration of the optimum combination but in the same molar ratio of catalyst, oxidizer, and stabilizer. The results indicated 100% con- taminant destruction after only one treatment (Table 1). This was believed to be due to lower contaminant concentrations in sample MW-2 compared to the representativesample used in the central composite experiments.
4.4.2. Microcosm Study. The effectiveness of the chemical combination was further ver-ified by injecting the reagents into a soil-water matrix set up as a microcosm study. Results of the study indicated an 86% contaminant destruction in I-1 (the up-gradient injectionwell) and 68% treatment in MW-2 (the down-gradient monitoring well) after the first cycle of injection and 100% treatment in both wells after second cycle of injection.Despite the precautions taken, some volatilization losses may have occurred from the tank. Results of the hydrogen peroxide analysis indicated low to undetectable levels ofhydrogen peroxide (in the tank one week after injection. The pH after equilibrium wasobserved to be in the optimal range as described by Watts et al. (1990). ISOTEC’s pro-prietary test for hydroxyl radicals indicated positive results in the wells for up to five days after injection. The results obtained from the microcosm study confirmed the potential of Fenton’s process for a field application.
5. FIELD STUDIES
5.1. Site Characteristics
The site is a operating warehousing facility in Union County, New Jersey. The areas of environmental concern at the site include former gasoline, waste oil, and fuel oil underground storage tanks. Groundwater was contaminated with high concentrations of gasoline constituents principally BTEX, MTBE and TBA. The site geology is charac-terized by soft red shales with interbedded harder sandstones and minor amounts of con-glomerate while the site soils were unsorted and unstratified material consisting of pebbles, cobbles, and boulders in a mixture of sand, silt, and clay. A site map is shownin Fig. 3.
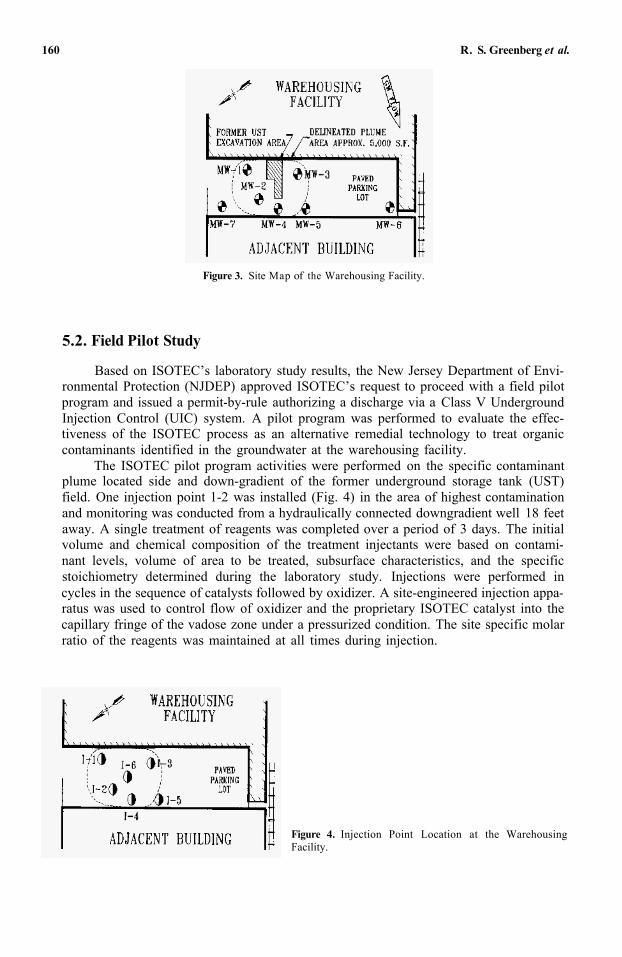
160 R. S. Greenberg et al.
Figure 3. Site Map of the Warehousing Facility.
5.2. Field Pilot Study
Based on ISOTEC’s laboratory study results, the New Jersey Department of Envi-ronmental Protection (NJDEP) approved ISOTEC’s request to proceed with a field pilot program and issued a permit-by-rule authorizing a discharge via a Class V UndergroundInjection Control (UIC) system. A pilot program was performed to evaluate the effec-tiveness of the ISOTEC process as an alternative remedial technology to treat organic contaminants identified in the groundwater at the warehousing facility.
The ISOTEC pilot program activities were performed on the specific contaminant plume located side and down-gradient of the former underground storage tank (UST) field. One injection point 1-2 was installed (Fig. 4) in the area of highest contamination and monitoring was conducted from a hydraulically connected downgradient well 18 feet away. A single treatment of reagents was completed over a period of 3 days. The initialvolume and chemical composition of the treatment injectants were based on contami-nant levels, volume of area to be treated, subsurface characteristics, and the specific stoichiometry determined during the laboratory study. Injections were performed in cycles in the sequence of catalysts followed by oxidizer. A site-engineered injection appa-ratus was used to control flow of oxidizer and the proprietary ISOTEC catalyst into the capillary fringe of the vadose zone under a pressurized condition. The site specific molar ratio of the reagents was maintained at all times during injection.
Figure 4. Injection Point Location at the WarehousingFacility.
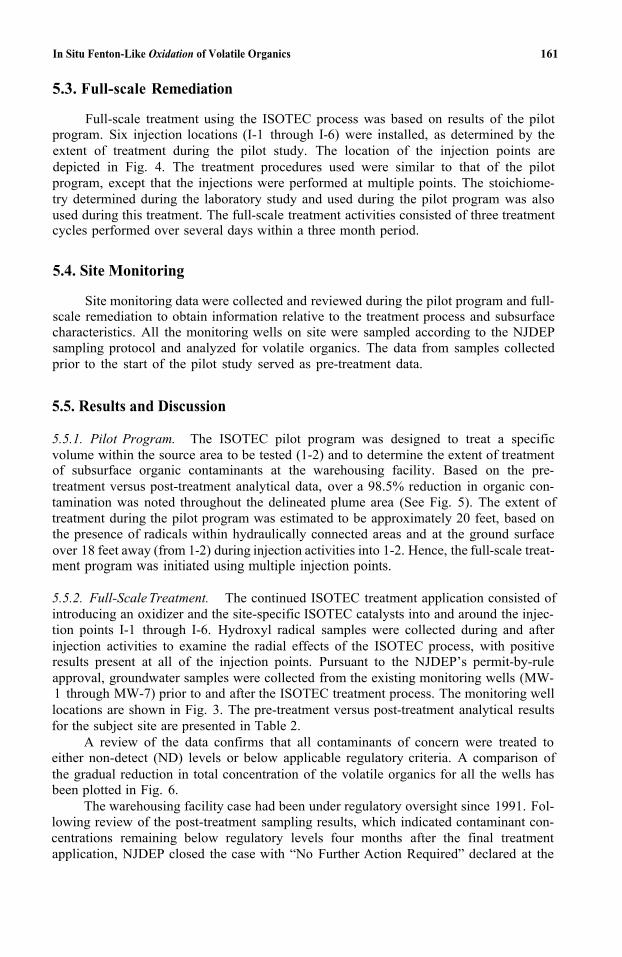
In Situ Fenton-Like Oxidation of Volatile Organics 161
5.3. Full-scale Remediation
Full-scale treatment using the ISOTEC process was based on results of the pilot program. Six injection locations (I-1 through I-6) were installed, as determined by the extent of treatment during the pilot study. The location of the injection points are depicted in Fig. 4. The treatment procedures used were similar to that of the pilot program, except that the injections were performed at multiple points. The stoichiome-try determined during the laboratory study and used during the pilot program was also used during this treatment. The full-scale treatment activities consisted of three treatment cycles performed over several days within a three month period.
5.4. Site Monitoring
Site monitoring data were collected and reviewed during the pilot program and full-scale remediation to obtain information relative to the treatment process and subsurface characteristics. All the monitoring wells on site were sampled according to the NJDEP sampling protocol and analyzed for volatile organics. The data from samples collected prior to the start of the pilot study served as pre-treatment data.
5.5. Results and Discussion
5.5.1. Pilot Program. The ISOTEC pilot program was designed to treat a specificvolume within the source area to be tested (1-2) and to determine the extent of treatment of subsurface organic contaminants at the warehousing facility. Based on the pre-treatment versus post-treatment analytical data, over a 98.5% reduction in organic con-tamination was noted throughout the delineated plume area (See Fig. 5). The extent oftreatment during the pilot program was estimated to be approximately 20 feet, based onthe presence of radicals within hydraulically connected areas and at the ground surface over 18 feet away (from 1-2) during injection activities into 1-2. Hence, the full-scale treat-ment program was initiated using multiple injection points.
5.5.2. Full-Scale Treatment. The continued ISOTEC treatment application consisted ofintroducing an oxidizer and the site-specific ISOTEC catalysts into and around the injec-tion points I-1 through I-6. Hydroxyl radical samples were collected during and after injection activities to examine the radial effects of the ISOTEC process, with positive results present at all of the injection points. Pursuant to the NJDEP’s permit-by-ruleapproval, groundwater samples were collected from the existing monitoring wells (MW-1 through MW-7) prior to and after the ISOTEC treatment process. The monitoring well locations are shown in Fig. 3. The pre-treatment versus post-treatment analytical results for the subject site are presented in Table 2.
A review of the data confirms that all contaminants of concern were treated to either non-detect (ND) levels or below applicable regulatory criteria. A comparison of the gradual reduction in total concentration of the volatile organics for all the wells has been plotted in Fig. 6.
The warehousing facility case had been under regulatory oversight since 1991. Fol- lowing review of the post-treatment sampling results, which indicated contaminant con-centrations remaining below regulatory levels four months after the final treatment application, NJDEP closed the case with “No Further Action Required” declared at the
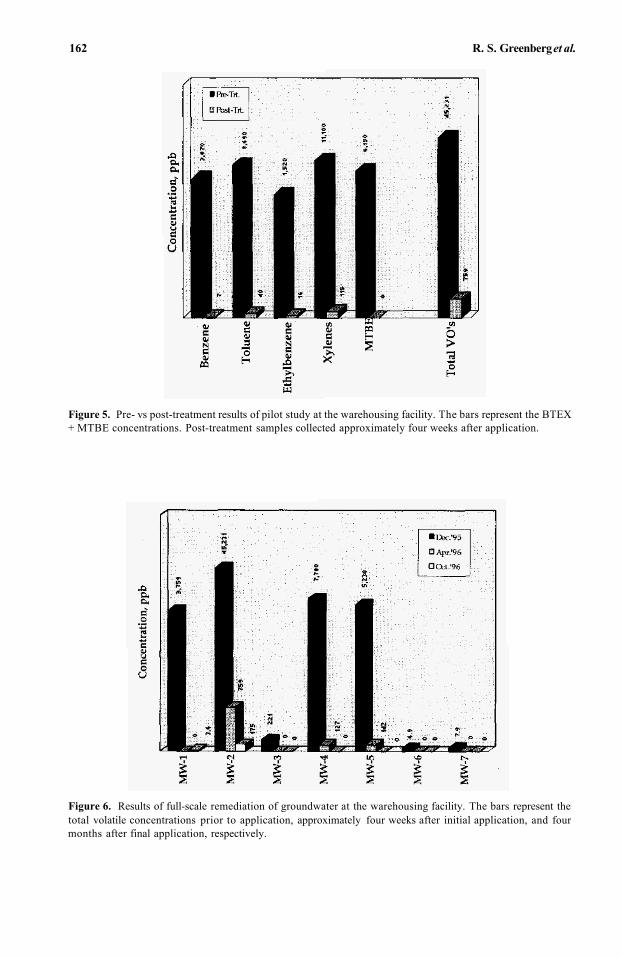
162 R. S. Greenberget al.
Figure 5. Pre- vs post-treatment results of pilot study at the warehousing facility. The bars represent the BTEX+ MTBE concentrations. Post-treatment samples collected approximately four weeks after application.
Figure 6. Results of full-scale remediation of groundwater at the warehousing facility. The bars represent thetotal volatile concentrations prior to application, approximately four weeks after initial application, and fourmonths after final application, respectively.
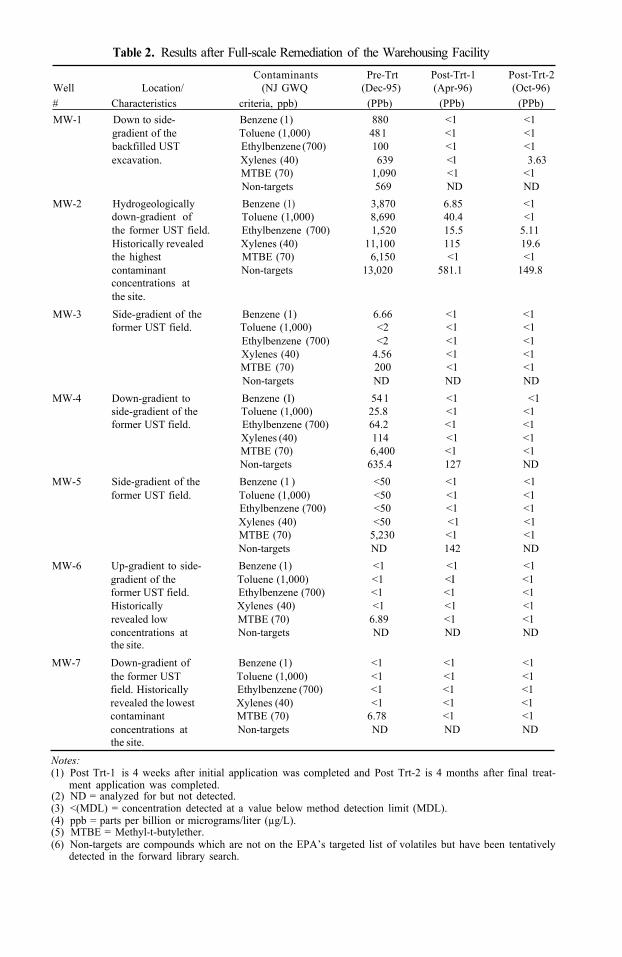
Table 2. Results after Full-scale Remediation of the Warehousing FacilityContaminants Pre-Trt Post-Trt-1 Post-Trt-2
Well Location/ (NJ GWQ (Dec-95) (Apr-96) (Oct-96)# Characteristics criteria, ppb) (PPb) (PPb) (PPb)MW-1 Down to side- Benzene (1) 880 <1 <1
gradient of the Toluene (1,000) 48 1 <1 <1backfilled UST Ethylbenzene (700) 100 <1 <1excavation. Xylenes (40) 639 <1 3.63
MTBE (70) 1,090 <1 <1Non-targets 569 ND ND
MW-2 Hydrogeologically Benzene (1) 3,870 6.85 <1down-gradient of Toluene (1,000) 8,690 40.4 <1the former UST field. Ethylbenzene (700) 1,520 15.5 5.1 1
the highest MTBE (70) 6,150 <1 <1Historically revealed Xylenes (40) 11,100 115 19.6
contaminant Non-targets 13,020 581.1 149.8 concentrations at the site.
MW-3 Side-gradient of the Benzene (1) 6.66 <1 <1former UST field. Toluene (1,000) <2 <1 <1
Ethylbenzene (700) <2 <1 <1Xylenes (40) 4.56 <1 <1 MTBE (70) 200 <1 <1 Non-targets ND ND ND
MW-4 Down-gradient to Benzene (I) 541 <1 <1side-gradient of the Toluene (1,000) 25.8 <1 <1former UST field. Ethylbenzene (700) 64.2 <1 <1
Xylenes (40) 114 <1 <1 MTBE (70) 6,400 <1 <1
MW-5 Side-gradient of the Benzene (1 ) <50 <1 <1former UST field. Toluene (1,000) <50 <1 <1
Ethylbenzene (700) <50 <1 <1Xylenes (40) <50 <1 <1MTBE (70) 5,230 <1 <1
MW-6 Up-gradient to side- Benzene (1) <1 <1 <1gradient of the Toluene (1,000) <1 <I <1 former UST field. Ethylbenzene (700) <1 <1 <1 Historically Xylenes (40) <1 <1 <1revealed low MTBE (70) 6.89 <1 <1
Non-targets 635.4 127 ND
Non-targets ND 142 ND
concentrations at Non-targets ND ND NDthe site.
MW-7 Down-gradient of Benzene (1) <1 <1 <1the former UST Toluene (1,000) <1 <1 <1 field. Historically Ethylbenzene (700) <1 <1 <1 revealed the lowest Xylenes (40) <1 <1 <1 contaminant MTBE (70) 6.78 <1 <1concentrations at Non-targets ND ND NDthe site.
Notes:(1) Post Trt-1 is 4 weeks after initial application was completed and Post Trt-2 is 4 months after final treat-
ment application was completed.(2) ND = analyzed for but not detected.(3) <(MDL) = concentration detected at a value below method detection limit (MDL).(4) ppb = parts per billion or micrograms/liter (µg/L).(5) MTBE = Methyl-t-butylether.(6) Non-targets are compounds which are not on the EPA’s targeted list of volatiles but have been tentatively
detected in the forward library search.
164 R. S. Greenberg et al.
site. ISOTEC’s treatment activities were completed over several days within a six month period, with the case closed in under a year from start to finish.
6. SUMMARY AND CONCLUSIONS
The in situ oxidation of gasoline and waste oil contaminated groundwater was con-ducted at a warehousing facility in New Jersey using catalyzed hydrogen peroxide (ISOTECSM process). The laboratory studies used three level central composite experi-ments followed by bench scale studies on representative aqueous samples to identify achemical combination that was best suited for contaminant destruction at the subject site. The chemical combination was further verified in microcosms set up as a soil-watermatrix in glass tanks. The microcosm study achieved 100% destruction of BTEX andMTBE.
Field studies were conducted at the subject site with groundwater contamination. A pilot study was initially performed with a significant contaminant destruction (98.5%)observed. In addition, hydroxyl radicals were detected in a hydraulically connected down-gradient well indicating the radial effect and the potential for full-scale remediation. Full-scale remediation was conducted using similar procedures as the pilot study with multiple injection points utilized to cover the entire contaminant plume. Following three treat-ments and review of monthly monitoring data which indicated contaminant levels at either non-detect (ND) or below applicable regulatory criteria for four months thereafter, the subject site was closed by NJDEP declaring a “No Further Action Required” on the site.
REFERENCES
Baxendale, J.H. and Magee, J. (1953) “The Oxidation of Benzene by Hydrogen Peroxide and Iron Salts.” Disc.
Bigda, R.J. (1996) “Fenton’s Chemistry: An Effective Advanced Oxidation Process.” Environ. Technol.,
Diamond, W.J. (1989) “Practical Experiment Designs for Engineers and Scientists.” 2nd Edn., Van Nostrand
Dorfman, L.M. and Adams, G.E. (1973) “Reactivity of the Hydroxyl Radical”. National Bureau of’ Standards,
Eisenhauer, H.R. (1964) “Oxidation of Phenolic Wastes.” JWPCF, 36, 11 16-1128.Feuerstein, W., Gilbert, E., and Eberle, S.H. (1981) “Model Experiments for the Oxidation of Aromatic
FMC Corporation (1989) Technical Bulletin: Hydrogen Peroxide. Haber, F. and Weiss, J.J. (1934) “The Catalytic Decomposition of Hydrogen Peroxide by Iron Salts”. Proc. Roy.
Leung, S.W., Watts, R.J., and Miller, G.C. (1992) “Degradation of Perchloroethylene by Fenton’s Reagent:
Mertz, J.H. and Waters, W. (1949) J. Chem. Soc, 2427.Murphy, P., Murphy, W.J., Boegli, M., Price, K., and Moody, C.D. (1989) “A Fenton-like Reaction to
Ravikumar, J.X. and Gurol, M.D. (1994) “Chemical Oxidation of Chlorinated Organics by Hydrogen
Thomas, J.M. and Ward, C.H. (1989) “In situ Biorestoration of Organic Contaminants in the Subsurface”.
Watts, R.J., Udell, M.D., Rauch, P.A., and Leung, S.W. (1990) “Treatment of Pentachlorophenol Contami-
Faraday Soc., 14, 160-167.
May/June 1996, 34–39.
Reinhold, NY.
Report # NSRDS-NBS-46.
Compounds by Hydrogen Peroxide in Wastewater Treatment.” Vom Wasser, 56, 35-54.
Soc. London, Ser. A, 147, 332–351.
Speciation and Pathway.” J. Environ. Qual., 21, 377-38 1.
Neutralize Formaldehyde Waste Solutions.” Environ. Sci. Technol., 23, 166–169.
Peroxide in the Presence of Sand.” Environ. Sci. Technol., 28, 394–400.
Environ. Sci. Technol., 23,760–766.
nated Soils using Fenton’s Reagent.” Haz. Waste Haz. Mater., 7, 335-345.

In Situ Fenton-Like Oxidation of Volatile Organics 165
Watts, R.J., Smith, B.R., and Miller, G.C. (I 991) “Treatment of Octachlorodibenzo-p-dioxin (OCDD) in
Watts. R.J., Kong, S., Dippre. M., and Barnes, W.T. (1994) “Oxidation of Sorbed Hexachlorobenzene in Soils
Watts, R.J. (1997) “Hazardous Wastes: Sources, Pathways, Receptors”. John Wiley & Sons, Chapter 5. Publi-
Surface Soils Using Catalyzed Hydrogen Peroxide.” Chemosphere., 23. 949-956.
Using Catalyzed Hydrogen Peroxide.” J. Haz. Mat., 39, 33-47.
cation scheduled for Fall 1997.

This page intentionally left blank.
14
DEVELOPMENT OF AN ENHANCED
OXIDATION PROCESSOZONE-HYDROGEN PEROXIDE ADVANCED
Kevin C. Bower, Stephen Duirk, and Christopher M. Miller*
Department of Civil Engineering 210 Auburn Science and Engineering Center University of Akron Akron, Ohio 44325-3905
ABSTRACT
Advanced chemical oxidation processes (AOP’s), particularly processes using .ozone,involve a rapidly growing area of environmental research and applications. A need exists, however, for improvements to AOP’s to make them less costly and more effective. This paper evaluated the addition of a fixed bed of sand to the conventional H2O2-O3 processas a function of reactor configuration, pH, and sand type. The West Liberty sand con-sisting of the greatest concentrations of iron and manganese yielded the best results,showing 15% more phenol removal than Muscatine sand and 28% more removal than no sand (i.e. H2O2-O3). Phenol degradation product formation and disappearance rates in comparison to the direct ozonation and O3-H2O2 processes indicate metal-oxide sand surface-catalyzed H2O2 decomposition improves the conventional O3-H2O2 advancedoxidation process at pH 7. Analysis of results suggests the enhancement is a result of increased formation of essential oxygen radical intermediates (i.e. hydroxyl radical).Direct ozonation, however, was equally effective at phenol removal at pH 8.9 because the conjugate base of phenol (i.e. phenate ion) has a direct ozonation reaction rate constant six orders of magnitude greater than phenol.
1. INTRODUCTION AND BACKGROUND
Hazardous organic chemicals in drinking water supplies continue to be an envi-ronmental threat. One class of technologies to clean up contaminated water includes
*Corresponding author Fax: (330) 972-6020; e-mail address: [email protected]
Emerging Technologies in Hazardous Waste Management 8, edited by Tedder and PohlandKluwer Academic / Plenum Publishers, New York, 2000. 167
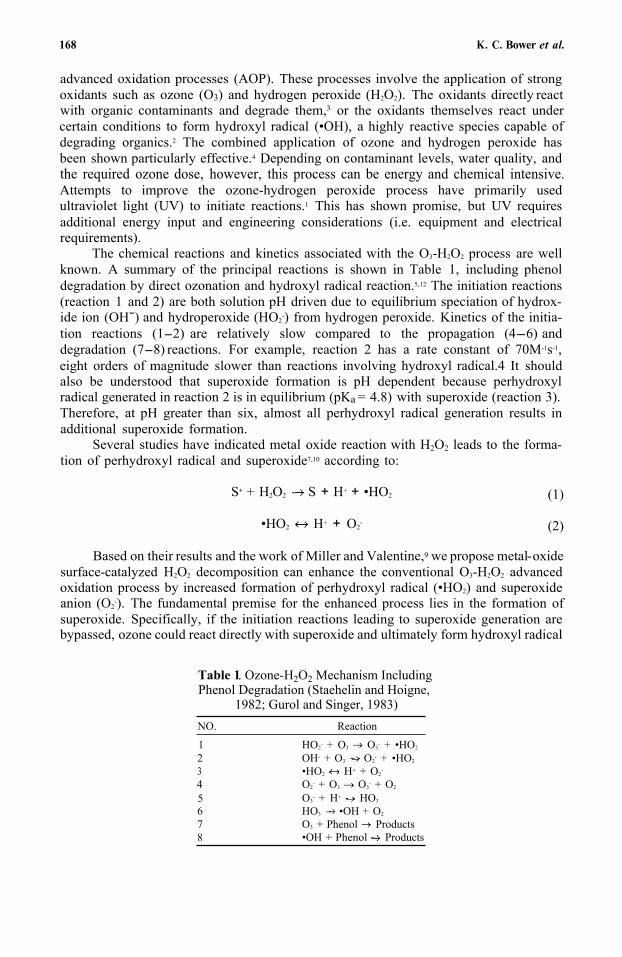
168 K. C. Bower et al.
advanced oxidation processes (AOP). These processes involve the application of strong oxidants such as ozone (O3) and hydrogen peroxide (H2O2). The oxidants directly reactwith organic contaminants and degrade them,3 or the oxidants themselves react undercertain conditions to form hydroxyl radical (•OH), a highly reactive species capable ofdegrading organics.2 The combined application of ozone and hydrogen peroxide has been shown particularly effective.4 Depending on contaminant levels, water quality, and the required ozone dose, however, this process can be energy and chemical intensive.Attempts to improve the ozone-hydrogen peroxide process have primarily used ultraviolet light (UV) to initiate reactions.1 This has shown promise, but UV requires additional energy input and engineering considerations (i.e. equipment and electrical requirements).
The chemical reactions and kinetics associated with the O3-H2O2 process are well known. A summary of the principal reactions is shown in Table 1, including phenoldegradation by direct ozonation and hydroxyl radical reaction.5,12 The initiation reactions (reaction 1 and 2) are both solution pH driven due to equilibrium speciation of hydrox-ide ion (OH-) and hydroperoxide (HO2
-) from hydrogen peroxide. Kinetics of the initia-tion reactions (1-2) are relatively slow compared to the propagation (4-6) anddegradation (7-8) reactions. For example, reaction 2 has a rate constant of 70M-1s-1,eight orders of magnitude slower than reactions involving hydroxyl radical.4 It should also be understood that superoxide formation is pH dependent because perhydroxyl radical generated in reaction 2 is in equilibrium (pKa = 4.8) with superoxide (reaction 3).Therefore, at pH greater than six, almost all perhydroxyl radical generation results in additional superoxide formation.
Several studies have indicated metal oxide reaction with H2O2 leads to the forma-tion of perhydroxyl radical and superoxide7,10 according to:
S+ + H2O2 S + H+ + •HO2
•HO2 H+ + O2-
(1)
(2)
Based on their results and the work of Miller and Valentine,9 we propose metal-oxide surface-catalyzed H2O2 decomposition can enhance the conventional O3-H2O2 advancedoxidation process by increased formation of perhydroxyl radical (•HO2) and superoxide anion (O2
-). The fundamental premise for the enhanced process lies in the formation of superoxide. Specifically, if the initiation reactions leading to superoxide generation are bypassed, ozone could react directly with superoxide and ultimately form hydroxyl radical
Table 1. Ozone-H2O2 Mechanism Including Phenol Degradation (Staehelin and Hoigne,
1982; Gurol and Singer, 1983)NO. Reaction
123456
HO2- + O3 O3
- + •HO2
OH- + O3 O2- + •HO2
•HO2 H+ + O2-
O2- + O3 O3
- + O2
O3- + H+ HO3
HO3 •OH + O2
78
O3 + Phenol Products •OH + Phenol Products
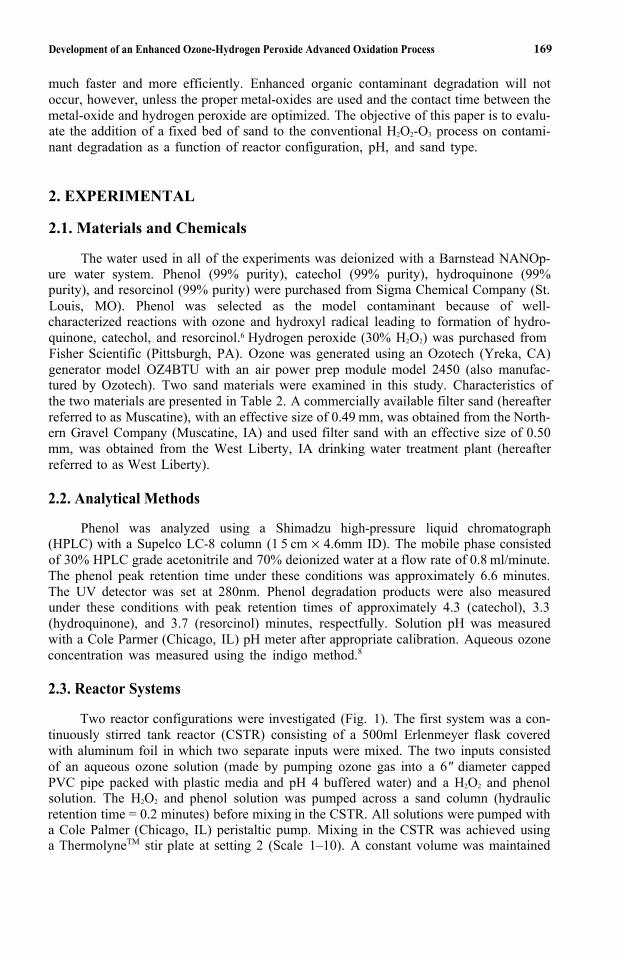
Development of an Enhanced Ozone-Hydrogen Peroxide Advanced Oxidation Process 169
much faster and more efficiently. Enhanced organic contaminant degradation will not occur, however, unless the proper metal-oxides are used and the contact time between the metal-oxide and hydrogen peroxide are optimized. The objective of this paper is to evalu-ate the addition of a fixed bed of sand to the conventional H2O2-O3 process on contami-nant degradation as a function of reactor configuration, pH, and sand type.
2. EXPERIMENTAL
2.1. Materials and Chemicals
The water used in all of the experiments was deionized with a Barnstead NANOp-ure water system. Phenol (99% purity), catechol (99% purity), hydroquinone (99% purity), and resorcinol (99% purity) were purchased from Sigma Chemical Company (St. Louis, MO). Phenol was selected as the model contaminant because of well-characterized reactions with ozone and hydroxyl radical leading to formation of hydro-quinone, catechol, and resorcinol.6 Hydrogen peroxide (30% H2O2) was purchased fromFisher Scientific (Pittsburgh, PA). Ozone was generated using an Ozotech (Yreka, CA) generator model OZ4BTU with an air power prep module model 2450 (also manufac-tured by Ozotech). Two sand materials were examined in this study. Characteristics of the two materials are presented in Table 2. A commercially available filter sand (hereafterreferred to as Muscatine), with an effective size of 0.49 mm, was obtained from the North-ern Gravel Company (Muscatine, IA) and used filter sand with an effective size of 0.50 mm, was obtained from the West Liberty, IA drinking water treatment plant (hereafter referred to as West Liberty).
2.2. Analytical Methods
Phenol was analyzed using a Shimadzu high-pressure liquid chromatograph (HPLC) with a Supelco LC-8 column (1 5 cm × 4.6mm ID). The mobile phase consistedof 30% HPLC grade acetonitrile and 70% deionized water at a flow rate of 0.8 ml/minute.The phenol peak retention time under these conditions was approximately 6.6 minutes.The UV detector was set at 280nm. Phenol degradation products were also measuredunder these conditions with peak retention times of approximately 4.3 (catechol), 3.3(hydroquinone), and 3.7 (resorcinol) minutes, respectfully. Solution pH was measuredwith a Cole Parmer (Chicago, IL) pH meter after appropriate calibration. Aqueous ozoneconcentration was measured using the indigo method.8
2.3. Reactor Systems
Two reactor configurations were investigated (Fig. 1). The first system was a con-tinuously stirred tank reactor (CSTR) consisting of a 500ml Erlenmeyer flask covered with aluminum foil in which two separate inputs were mixed. The two inputs consisted of an aqueous ozone solution (made by pumping ozone gas into a 6" diameter cappedPVC pipe packed with plastic media and pH 4 buffered water) and a H2O2 and phenol solution. The H2O2 and phenol solution was pumped across a sand column (hydraulic retention time = 0.2 minutes) before mixing in the CSTR. All solutions were pumped witha Cole Palmer (Chicago, IL) peristaltic pump. Mixing in the CSTR was achieved using a ThermolyneTM stir plate at setting 2 (Scale 1–10). A constant volume was maintained
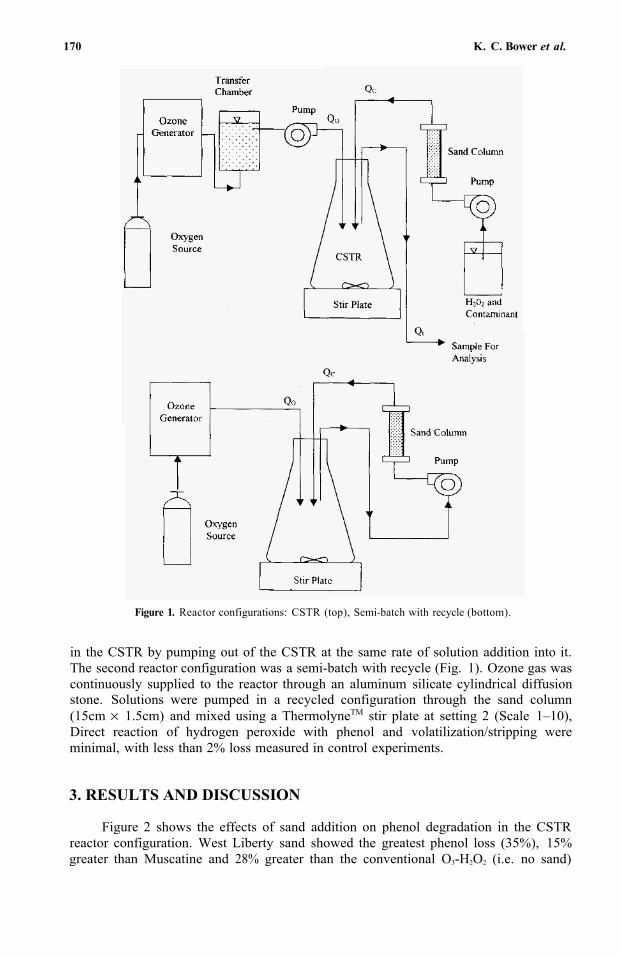
170 K. C. Bower et al.
Figure 1. Reactor configurations: CSTR (top), Semi-batch with recycle (bottom).
in the CSTR by pumping out of the CSTR at the same rate of solution addition into it.The second reactor configuration was a semi-batch with recycle (Fig. 1). Ozone gas was continuously supplied to the reactor through an aluminum silicate cylindrical diffusion stone. Solutions were pumped in a recycled configuration through the sand column (15cm × 1.5cm) and mixed using a ThermolyneTM stir plate at setting 2 (Scale 1–10),Direct reaction of hydrogen peroxide with phenol and volatilization/stripping wereminimal, with less than 2% loss measured in control experiments.
3. RESULTS AND DISCUSSION
Figure 2 shows the effects of sand addition on phenol degradation in the CSTR reactor configuration. West Liberty sand showed the greatest phenol loss (35%), 15% greater than Muscatine and 28% greater than the conventional O3-H2O2 (i.e. no sand)
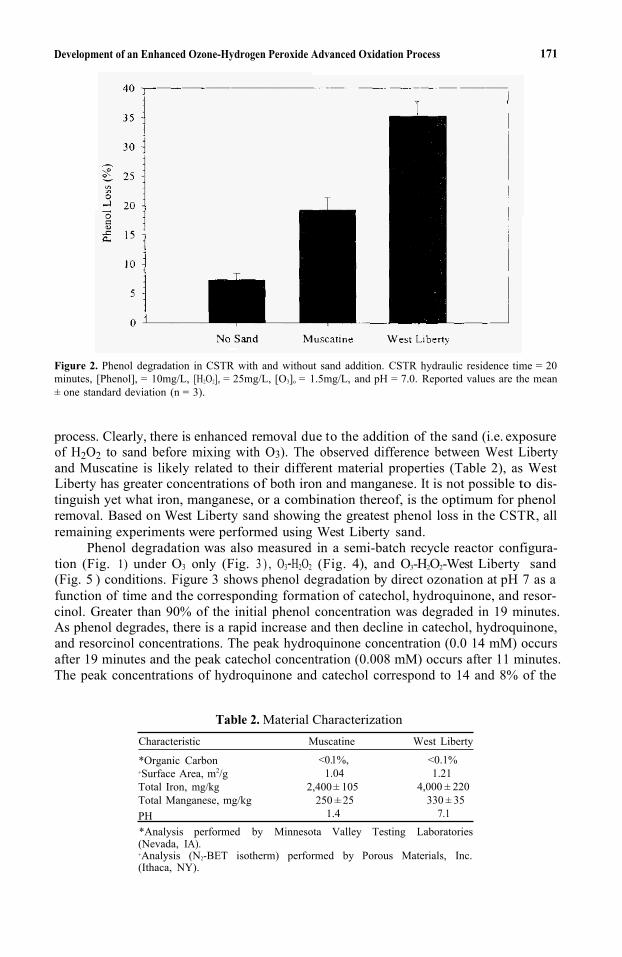
Development of an Enhanced Ozone-Hydrogen Peroxide Advanced Oxidation Process 171
Figure 2. Phenol degradation in CSTR with and without sand addition. CSTR hydraulic residence time = 20minutes, [Phenol], = 10mg/L, [H2O2]o = 25mg/L, [O3]o = 1.5mg/L, and pH = 7.0. Reported values are the mean± one standard deviation (n = 3).
process. Clearly, there is enhanced removal due to the addition of the sand (i.e. exposureof H2O2 to sand before mixing with O3). The observed difference between West Liberty and Muscatine is likely related to their different material properties (Table 2), as West Liberty has greater concentrations of both iron and manganese. It is not possible to dis-tinguish yet what iron, manganese, or a combination thereof, is the optimum for phenol removal. Based on West Liberty sand showing the greatest phenol loss in the CSTR, allremaining experiments were performed using West Liberty sand.
Phenol degradation was also measured in a semi-batch recycle reactor configura-tion (Fig. 1) under O3 only (Fig. 3 ) , O3-H2O2 (Fig. 4), and O3-H2O2-West Liberty sand(Fig. 5 ) conditions. Figure 3 shows phenol degradation by direct ozonation at pH 7 as afunction of time and the corresponding formation of catechol, hydroquinone, and resor-cinol. Greater than 90% of the initial phenol concentration was degraded in 19 minutes.As phenol degrades, there is a rapid increase and then decline in catechol, hydroquinone, and resorcinol concentrations. The peak hydroquinone concentration (0.0 14 mM) occurs after 19 minutes and the peak catechol concentration (0.008 mM) occurs after 11 minutes.The peak concentrations of hydroquinone and catechol correspond to 14 and 8% of the
Table 2. Material Characterization Characteristic Muscatine West Liberty
*Organic Carbon <0.1%, <0.1%+Surface Area, m2/g 1.04 1.21 Total Iron, mg/kg 2,400 ± 105 4,000 ± 220 Total Manganese, mg/kg 250 ±25 330 ± 35 PH 1.4 7.1*Analysis performed by Minnesota Valley Testing Laboratories (Nevada, IA).+Analysis (N2-BET isotherm) performed by Porous Materials, Inc. (Ithaca, NY).
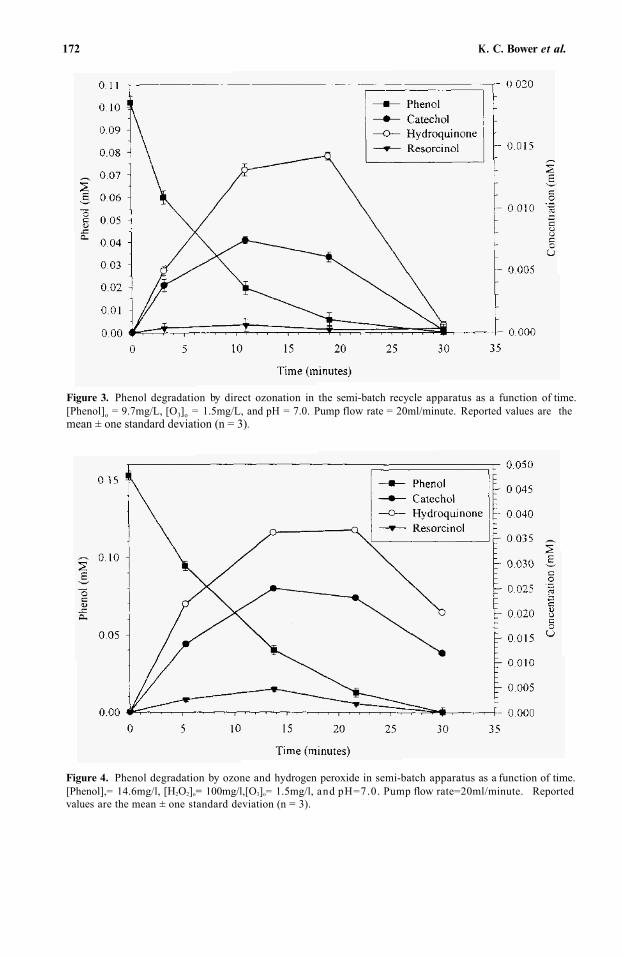
172 K. C. Bower et al.
Figure 3. Phenol degradation by direct ozonation in the semi-batch recycle apparatus as a function of time.[Phenol]o = 9.7mg/L, [O3]o = 1.5mg/L, and pH = 7.0. Pump flow rate = 20ml/minute. Reported values are themean ± one standard deviation (n = 3).
Figure 4. Phenol degradation by ozone and hydrogen peroxide in semi-batch apparatus as a function of time.[Phenol],= 14.6mg/l, [H2O2]o= 100mg/l,[O3]o= 1.5mg/l, and pH=7.0. Pump flow rate=20ml/minute. Reportedvalues are the mean ± one standard deviation (n = 3).
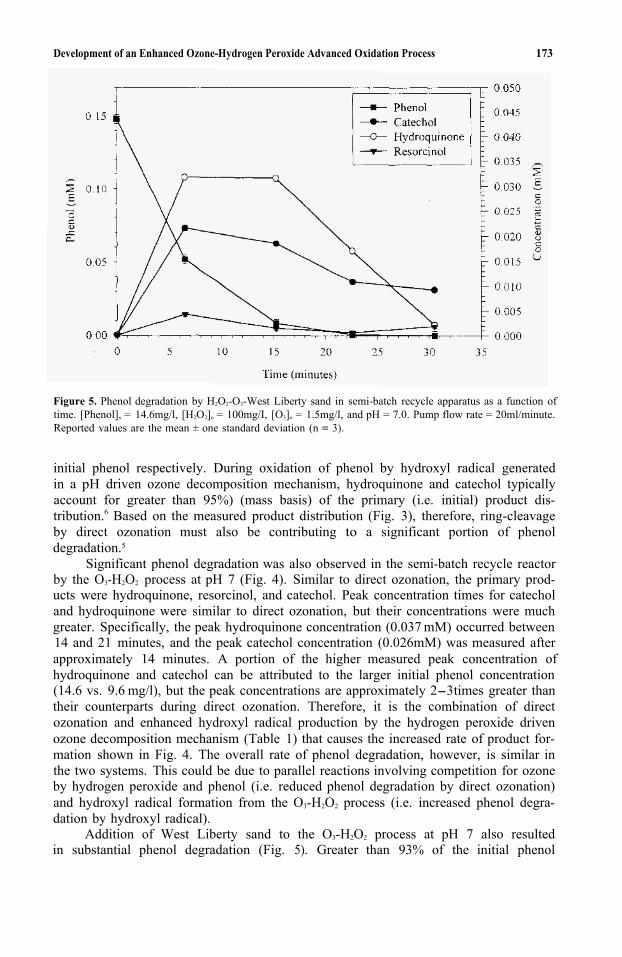
Development of an Enhanced Ozone-Hydrogen Peroxide Advanced Oxidation Process 173
Figure 5. Phenol degradation by H2O2-O3-West Liberty sand in semi-batch recycle apparatus as a function oftime. [Phenol], = 14.6mg/l, [H2O2]o = 100mg/I, [O3]o = 1.5mg/l, and pH = 7.0. Pump flow rate = 20ml/minute. Reported values are the mean ± one standard deviation (n = 3).
initial phenol respectively. During oxidation of phenol by hydroxyl radical generated in a pH driven ozone decomposition mechanism, hydroquinone and catechol typically account for greater than 95%) (mass basis) of the primary (i.e. initial) product dis-tribution.6 Based on the measured product distribution (Fig. 3), therefore, ring-cleavage by direct ozonation must also be contributing to a significant portion of phenol degradation.5
Significant phenol degradation was also observed in the semi-batch recycle reactor by the O3-H2O2 process at pH 7 (Fig. 4). Similar to direct ozonation, the primary prod-ucts were hydroquinone, resorcinol, and catechol. Peak concentration times for catechol and hydroquinone were similar to direct ozonation, but their concentrations were much greater. Specifically, the peak hydroquinone concentration (0.037 mM) occurred between 14 and 21 minutes, and the peak catechol concentration (0.026mM) was measured after approximately 14 minutes. A portion of the higher measured peak concentration of hydroquinone and catechol can be attributed to the larger initial phenol concentration (14.6 vs. 9.6 mg/l), but the peak concentrations are approximately 2-3 times greater than their counterparts during direct ozonation. Therefore, it is the combination of direct ozonation and enhanced hydroxyl radical production by the hydrogen peroxide driven ozone decomposition mechanism (Table 1) that causes the increased rate of product for-mation shown in Fig. 4. The overall rate of phenol degradation, however, is similar in the two systems. This could be due to parallel reactions involving competition for ozone by hydrogen peroxide and phenol (i.e. reduced phenol degradation by direct ozonation) and hydroxyl radical formation from the O3-H2O2 process (i.e. increased phenol degra-dation by hydroxyl radical).
Addition of West Liberty sand to the O3-H2O2 process at pH 7 also resulted in substantial phenol degradation (Fig. 5). Greater than 93% of the initial phenol
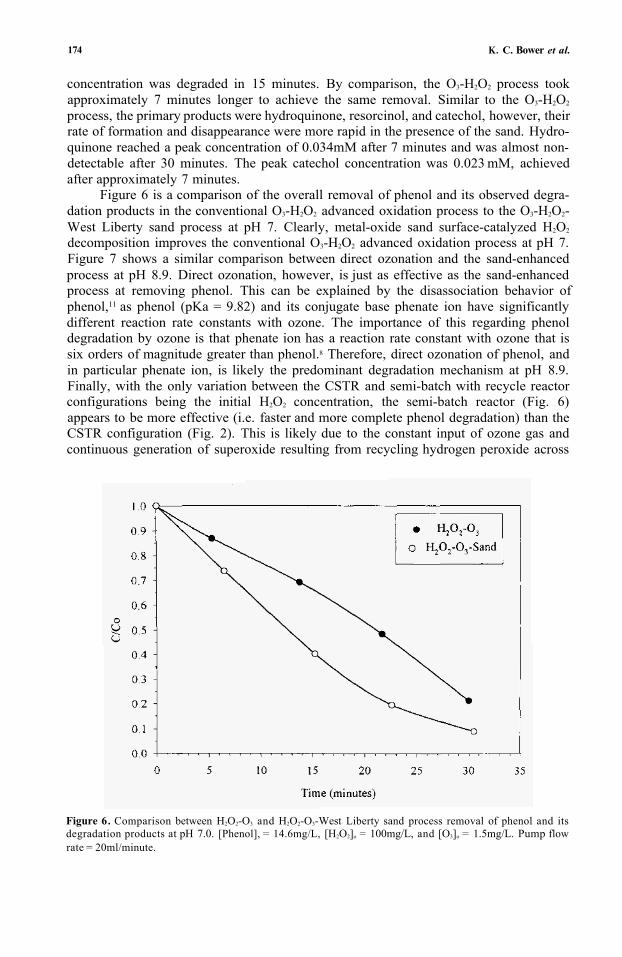
174 K. C. Bower et al.
concentration was degraded in 15 minutes. By comparison, the O3-H2O2 process took approximately 7 minutes longer to achieve the same removal. Similar to the O3-H2O2
process, the primary products were hydroquinone, resorcinol, and catechol, however, their rate of formation and disappearance were more rapid in the presence of the sand. Hydro-quinone reached a peak concentration of 0.034mM after 7 minutes and was almost non-detectable after 30 minutes. The peak catechol concentration was 0.023 mM, achieved after approximately 7 minutes.
Figure 6 is a comparison of the overall removal of phenol and its observed degra-dation products in the conventional O3-H2O2 advanced oxidation process to the O3-H2O2-West Liberty sand process at pH 7. Clearly, metal-oxide sand surface-catalyzed H2O2
decomposition improves the conventional O3-H2O2 advanced oxidation process at pH 7.Figure 7 shows a similar comparison between direct ozonation and the sand-enhancedprocess at pH 8.9. Direct ozonation, however, is just as effective as the sand-enhancedprocess at removing phenol. This can be explained by the disassociation behavior ofphenol,11 as phenol (pKa = 9.82) and its conjugate base phenate ion have significantlydifferent reaction rate constants with ozone. The importance of this regarding phenol degradation by ozone is that phenate ion has a reaction rate constant with ozone that is six orders of magnitude greater than phenol.8 Therefore, direct ozonation of phenol, and in particular phenate ion, is likely the predominant degradation mechanism at pH 8.9.Finally, with the only variation between the CSTR and semi-batch with recycle reactor configurations being the initial H2O2 concentration, the semi-batch reactor (Fig. 6)appears to be more effective (i.e. faster and more complete phenol degradation) than the CSTR configuration (Fig. 2). This is likely due to the constant input of ozone gas and continuous generation of superoxide resulting from recycling hydrogen peroxide across
Figure 6. Comparison between H2O2-O3 and H2O2-O3-West Liberty sand process removal of phenol and itsdegradation products at pH 7.0. [Phenol], = 14.6mg/L, [H2O2]o = 100mg/L, and [O3]o = 1.5mg/L. Pump flowrate = 20ml/minute.
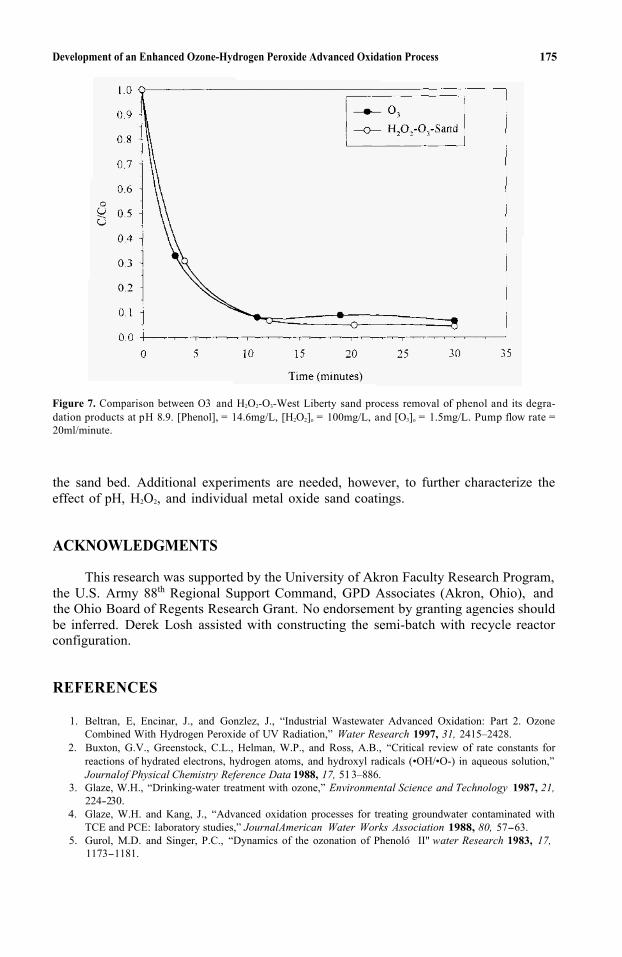
Development of an Enhanced Ozone-Hydrogen Peroxide Advanced Oxidation Process 175
Figure 7. Comparison between O3 and H2O2-O3-West Liberty sand process removal of phenol and its degra-dation products at pH 8.9. [Phenol], = 14.6mg/L, [H2O2]o = 100mg/L, and [O3]o = 1.5mg/L. Pump flow rate =20ml/minute.
the sand bed. Additional experiments are needed, however, to further characterize the effect of pH, H2O2, and individual metal oxide sand coatings.
ACKNOWLEDGMENTS
This research was supported by the University of Akron Faculty Research Program, the U.S. Army 88th Regional Support Command, GPD Associates (Akron, Ohio), andthe Ohio Board of Regents Research Grant. No endorsement by granting agencies should be inferred. Derek Losh assisted with constructing the semi-batch with recycle reactorconfiguration.
REFERENCES
1. Beltran, E, Encinar, J., and Gonzlez, J., “Industrial Wastewater Advanced Oxidation: Part 2. OzoneCombined With Hydrogen Peroxide of UV Radiation,” Water Research 1997, 31, 2415–2428.
2. Buxton, G.V., Greenstock, C.L., Helman, W.P., and Ross, A.B., “Critical review of rate constants forreactions of hydrated electrons, hydrogen atoms, and hydroxyl radicals (•OH/•O-) in aqueous solution,” Journalof Physical Chemistry Reference Data 1988, 17, 513–886.
3. Glaze, W.H., “Drinking-water treatment with ozone,” Environmental Science and Technology 1987, 21,224-230.
4. Glaze, W.H. and Kang, J., “Advanced oxidation processes for treating groundwater contaminated with TCE and PCE: Iaboratory studies,” Journal American Water Works Association 1988, 80, 57-63.
5. Gurol, M.D. and Singer, P.C., “Dynamics of the ozonation of Phenoló II" water Research 1983, 17,1173-1181.

176 K. C. Bower et al.
6. Huang, C.R. and Shu, H.Y, “The reaction kinetics, decomposition pathways and intermediate forma-tions of phenol in ozonation, UV/O3 and UV/H2O2 processes,” Journal of Hazardous Materials 1995,41, 47-64.
7. Kitajima, N., Fukuzumi, S., and Ono, Y., “Formation of superoxide ion during the decomposition of hydrogen peroxide on supported metal oxides,” The Journalof Physical Chemistry 1978, 82, 1505-1 509.
8. Langlais, B., Reckhow, D.A., and Brink, D.Ed. 1991. Ozone in Water Treatment; Lewis Publishers:Chelsea, pp. 569.
9. Miller, C.M. and Valentine, R.L., “Hydrogen peroxide decomposition and quinoline degradation in the presence of aquifer material,” Water Research 1995, 29, 2353–2359.
10. Ono, Y., Matsumura, T., Kitajima, N., and Fukuzumi, S., “Formation of superoxide ion during the decomposition of hydrogen peroxide on supported metals,” Journal of Physical Chemistry 1977, 81,1307–1311.
11. Schwarzenbach, R.P., Gschwend, P.M., and Imboden, D.M. 1993. Environmental Organic Chemistry; Wiley-Interscience: New York.
12. Staehelin, J. and Hoigne, J., “Decomposition of ozone in water: rate of initiation by hydroxide ions and hydrogen peroxide,” Environmental Science und Technology 1982. 16, 676-681.
15
POLYETHYLENE ENCAPSULATION OFDEPLETED URANIUM TRIOXIDE1
J. W. Adams, P. R. Lageraaen, P. D. Kalb, and B. R. Patel
Brookhaven National LaboratoryDepartment of Advanced Technology Environmental & Waste Management GroupBuilding 830 PO Box 5,000 Upton, New York 11973-5000
1. ABSTRACT
Depleted uranium, in the form of uranium trioxide (UO3) powder, was encapsu- lated in molten polyethylene forming a stable, dense composite henceforth known as DUPoly (patent pending). Materials were fed by calibrated volumetric feeders to a single screw extruder where they were heated and mixed to form a homogeneous molten extru- date. Oxide loadings as high as 90 weight percent (wt%) UO3 were successfully processed, yielding a maximum product density of 4.2 g/cm3. Performance testing included com-pressive strength, water immersion, and leach testing. Compressive strengths of samples with 50–90wt% UO3 were nearly constant, with a mean value exceeding 15MPa (2,200psi). Leach rates, which increased as a function of sample waste loading, were less than 1.1% after 11 days at ambient temperature for samples containing 90wt% UO3.Ninety day water immersion tests showed sensitivity to “batch” processed UO3 forsamples containing >85 wt% of the oxide. Considering that UO3 should be insoluble in water, these results indicate the probable presence of other, more soluble uranium com-pounds. Samples containing UO3 produced by a “continuous” process showed no dete-rioration at up to 90 wt% waste loadings.
2. INTRODUCTION
U.S. Department of Energy (DOE) facilities maintain large inventories of depleteduranium (DU). Novel applications are currently being sought to convert these materials
1 Work performed under the auspices of the U.S. Department of Energy
Emerging Technologies in Hazardous Waste Management 8, edited by Tedder and Pohland Kluwer Academic/Plenum Publishers, New York, 2000. 177
178 J. W. Adams et al.
to stable, useful secondary products. Uses that provide a positive benefit to society while allowing potential recovery or extraction of the uranium are desirable, but techniques for stabilization of DU for long-term storage or disposal are also being evaluated. Potential applications will likely exploit the high density, shielding effectiveness and nuclear ap-plicability of these materials. This study, in particular, was initiated to investigate thefeasibility of processing DU (e.g., UO3 powder) by polyethylene microencapsulation,to mitigate potential health effects and produce useful radiation shielding and otherproducts.
Natural uranium ore in the form of U3O8 contains about 0.7 wt% of the fissionable isotope 235U, with the remainder of uranium present as
238U. Reactor fuel is produced
from the ore by converting it to uranium hexafluoride gas and enriching the pro-portion of 235U to around 3.5%, leaving the remaining portion depleted in 235U. Thisresidual material, with 235U concentrations at around 0.25%, is known as depleteduranium. Approximately 560,000 metric tons of DU in the form of UF6, containing an equivalent mass of 379,000 metric tons of uranium, are stored at the DOE Paducah,Portsmouth, and Oak Ridge Gaseous Diffusion plants. Some of the UF6 has been con-verted to uranium trioxide (UO3); about 20,000 metric tons of DU are currently storedat the Savannah River Site. UO3 from Savannah River was used in this preliminaryinvestigation.
Alternatives for management of the DU inventory under consideration by the U.S.DOE include: (1) continue current management plan (no action); (2) revise current prac-tices for long-term storage as either UF6 or in an oxide form; (3) use of DU in shielding or high density applications; (4) disposal of DU1. Since uranium and uranium oxides areconsidered valuable resources, use of the material (option 3) is most attractive. As DUPoly will attenuate neutron as well as gamma radiation, there is currently significant interest for its use in spent fuel storage and transport casks and low-level waste storage, transport and disposal packages. The high density and workability of the material make it appealing for use as a ballast in nautical and aeronautical applications.
Treatment of DU materials by polyethylene encapsulation is a desirable option because of the immediate availability of the technology and proven record to effectively and efficiently process similar powder and granular materials. In addition, the process is very flexible. Polyethylene products can be heated and reworked if future needs change. DU can potentially be retrieved from DUPoly by chemical and/or thermal processing ifneeded as a resource in the future. Over the last twelve years, Brookhaven National Lab-oratory (BNL) has extensively developed the polyethylene encapsulation extrusion process for low-level radioactive, hazardous, and mixed wastes.2–9 During processing, filler mate-rials (e.g., waste) are mechanically mixed into the molten polyethylene binder, producing a workable homogeneous product. The process is not susceptible to chemical interactions between the waste and binder, enabling a wide range of acceptable waste types, high waste loadings, and technically simple processing under heterogeneous waste conditions. The process has evolved from proof-of-principle, through bench-scale development and testing, to full-scale technology demonstration and technology transfer.
3. EQUIPMENT AND PROCEDURES
Representative samples of depleted UO3 powder were obtained from Westinghouse Savannah River Company (WSRC). Savannah River alone maintains over 22 million kg (50 million pounds) of depleted UO3 stored in 55-gallon drums. This inventory consists
Polyethylene Encapsulation of Depleted Uranium Trioxide
of material of two distinct lots corresponding to two different processes used to prepare the oxide, batch and continuous. Over 99% of this inventory was produced with the batchprocess. The remaining 1% of the inventory, produced by a newer continuous process, is chemically identical but is characterized by a slightly larger particle size. Extrusion process runs described below were carried out using the batch process material.
The UO3 materials shipped from WSRC were characterized in a recent report by Carolina Metals, Inc.10 The drummed material was described as a 200 mesh (74µmaverage particle size), 96.5% uranium trioxide with trace impurities of aluminum, iron, phosphorous, sodium, silicon, chromium, and nickel. The material has a bulk density range of about 2.5 g/cm3 (uncompacted) to about 3.6g/cm3 (compacted). The 235U contentwas assayed at approximately 0.2% and the plutonium content at 3ppb. Gross gamma was 53,1100 dpm per gram of uranium.
A 32-mm (1.25-inch diameter) single-screw, non-vented, Killion extruder was usedfor processibility testing as shown in Fig. 1. The extruder is equipped with a basic metering screw, three heating/cooling barrel zones, and an individually heated die. The polyethylene and the DU powder were metered to the extruder through AccuRate, 300Series, volumetric feeders. These feeders are designed to provide a constant volume output at a given operating setting (varies as a percentage from zero to 100% output).Due to differing densities of feed materials, calibration of the feeders was required witheach material. The resulting data provided feeder output in g/min versus feeder speed setting.
For a given process run, a number of different samples were taken in replicate (typ- ically ten for statistical assurance) to monitor the process and characterize the extruder output. Rate samples were one minute collections of the extruder output to determineprocess consistency over time. Low variation between replicate rate samples indicated theoutput was continuous and that the material was successfully processed at a given DUloading. Grab samples were small (approximately 3-log) specimens of the output product taken for pycnometer density measurement. Low variation between replicate grab samples indicated that the DU material fed well and was consistently well mixed with thepolyethylene as it was processed in the extruder. 2 × 4 samples, nominal 5.1-cm (2.0in)diameter by 10.2-cm (4.0 in) tall right cylindrical specimens, were fabricated for com-pressive strength11 and immersion testing as shown in Fig. 2. Specimens were formed inpre-heated brass molds, compressed with up to 0.2 MPa (25 psi) pressure. ALT samples, for use in Accelerated Leach Testing,12 were nominal 2.5-cm (1.0in) diameter by 2.5-cm(1 .0 in) tall right cylinders fabricated in individual Teflon molds. These samples were also compression molded with up to 1.7MPa (250psi) pressure. Disk samples, for use in future attenuation studies, were formed in glass petri dishes with <0.1 MPa (10psi) pressure. Disks were nominally 11.7-cm (4.5 in) diameter and were fabricated at varying thick- nesses, up to approximately 2.5cm (1 .0 in).
179
4. PROCESS RESULTS
Processibility testing with UO3 was initially conducted at a loading of 50Wt%. This loading was selected based on previous microencapsulation experience. Process results at 50wt% were not immediately successful because the extrudate contained trapped gases, producing voids in samples during cooling. DU powders were oven-dried overnight at the maximum process temperature (160°C) to ensure removal of any excess moisture prior to extrusion.
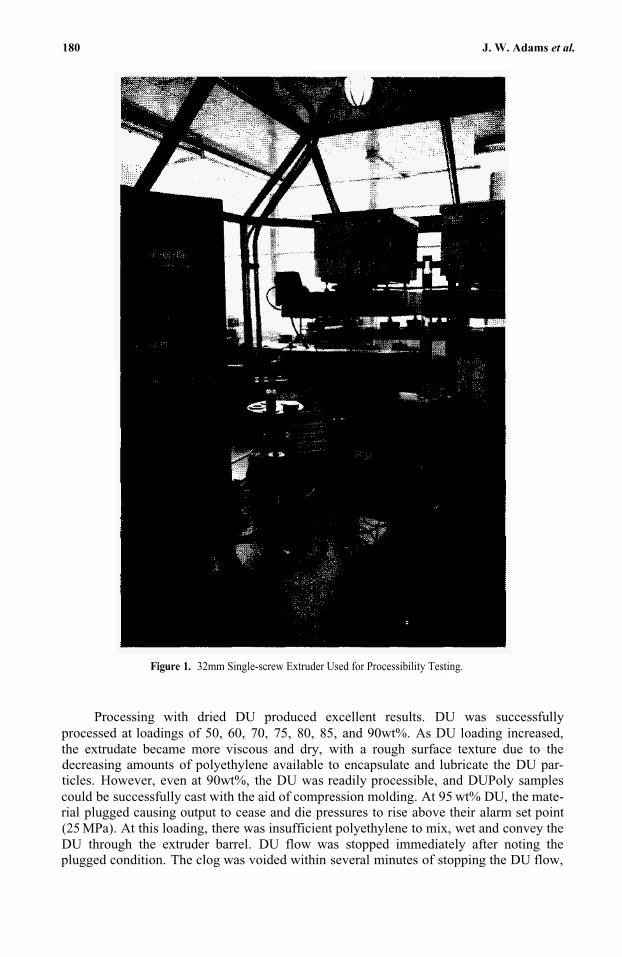
180 J. W. Adams et al.
Figure 1. 32mm Single-screw Extruder Used for Processibility Testing.
Processing with dried DU produced excellent results. DU was successfully processed at loadings of 50, 60, 70, 75, 80, 85, and 90wt%. As DU loading increased, the extrudate became more viscous and dry, with a rough surface texture due to the decreasing amounts of polyethylene available to encapsulate and lubricate the DU par-ticles. However, even at 90wt%, the DU was readily processible, and DUPoly samples could be successfully cast with the aid of compression molding. At 95 wt% DU, the mate- rial plugged causing output to cease and die pressures to rise above their alarm set point (25 MPa). At this loading, there was insufficient polyethylene to mix, wet and convey the DU through the extruder barrel. DU flow was stopped immediately after noting the plugged condition. The clog was voided within several minutes of stopping the DU flow,
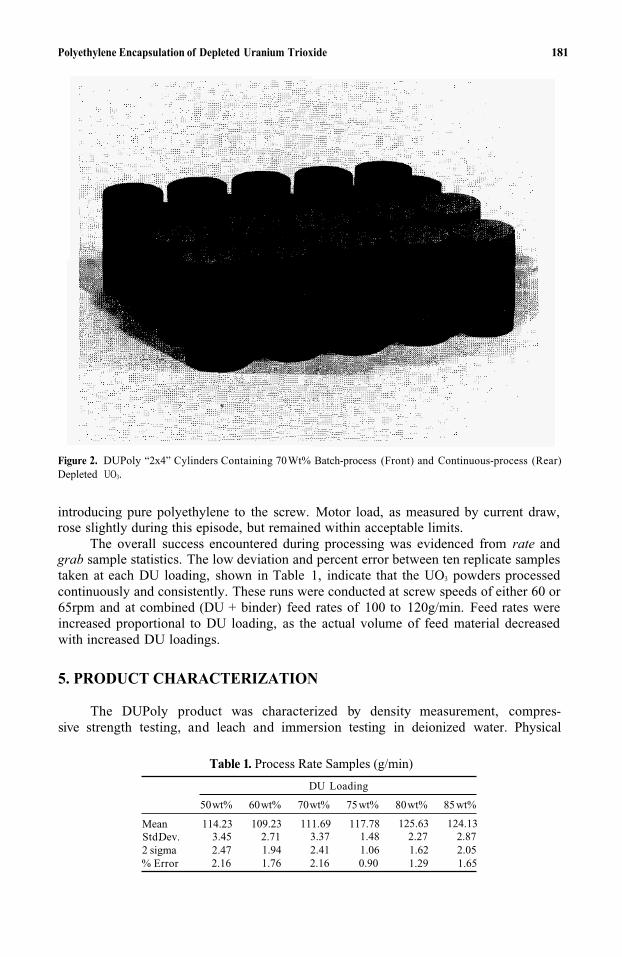
Polyethylene Encapsulation of Depleted Uranium Trioxide 181
Figure 2. DUPoly “2x4” Cylinders Containing 70Wt% Batch-process (Front) and Continuous-process (Rear)Depleted UO3.
introducing pure polyethylene to the screw. Motor load, as measured by current draw, rose slightly during this episode, but remained within acceptable limits.
The overall success encountered during processing was evidenced from rate andgrab sample statistics. The low deviation and percent error between ten replicate samplestaken at each DU loading, shown in Table 1, indicate that the UO3 powders processed continuously and consistently. These runs were conducted at screw speeds of either 60 or 65rpm and at combined (DU + binder) feed rates of 100 to 120g/min. Feed rates wereincreased proportional to DU loading, as the actual volume of feed material decreasedwith increased DU loadings.
5. PRODUCT CHARACTERIZATION
The DUPoly product was characterized by density measurement, compres-sive strength testing, and leach and immersion testing in deionized water. Physical
Table 1. Process Rate Samples (g/min)
DU Loading
50wt% 60wt% 70wt% 75wt% 80wt% 85wt%
Mean 114.23 109.23 111.69 117.78 125.63 124.13Std.Dev. 3.45 2.71 3.37 1.48 2.27 2.872 sigma 2.47 1.94 2.41 1.06 1.62 2.05% Error 2.16 1.76 2.16 0.90 1.29 1.65
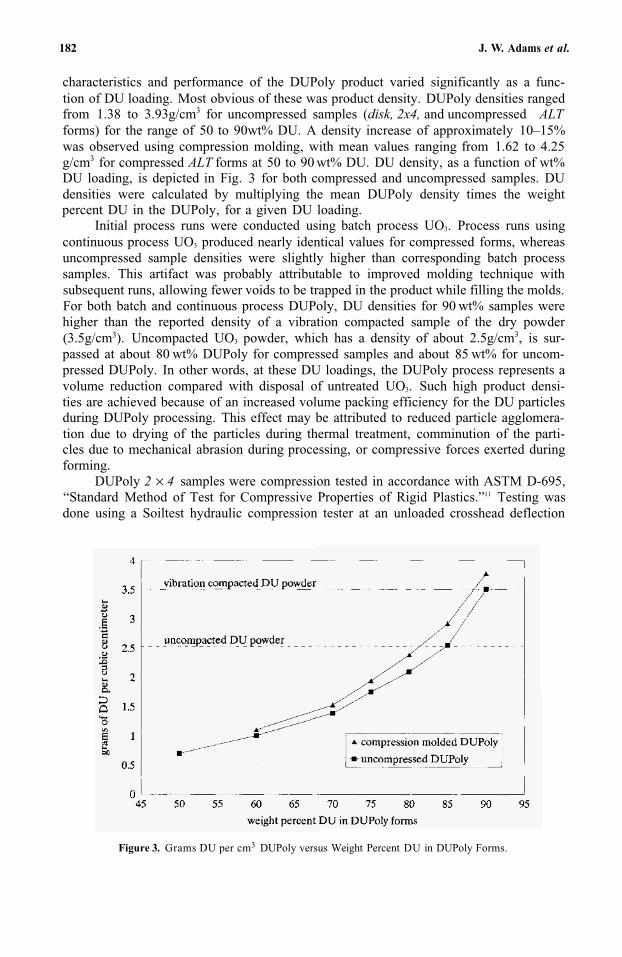
182 J. W. Adams et al.
characteristics and performance of the DUPoly product varied significantly as a func-tion of DU loading. Most obvious of these was product density. DUPoly densities ranged from 1.38 to 3.93g/cm3 for uncompressed samples (disk, 2x4, and uncompressed ALTforms) for the range of 50 to 90wt% DU. A density increase of approximately 10–15%was observed using compression molding, with mean values ranging from 1.62 to 4.25 g/cm3 for compressed ALT forms at 50 to 90 wt% DU. DU density, as a function of wt% DU loading, is depicted in Fig. 3 for both compressed and uncompressed samples. DUdensities were calculated by multiplying the mean DUPoly density times the weightpercent DU in the DUPoly, for a given DU loading.
Initial process runs were conducted using batch process UO3. Process runs using continuous process UO3 produced nearly identical values for compressed forms, whereas uncompressed sample densities were slightly higher than corresponding batch process samples. This artifact was probably attributable to improved molding technique with subsequent runs, allowing fewer voids to be trapped in the product while filling the molds. For both batch and continuous process DUPoly, DU densities for 90 wt% samples were higher than the reported density of a vibration compacted sample of the dry powder (3.5g/cm3). Uncompacted UO3 powder, which has a density of about 2.5g/cm3, is sur-passed at about 80 wt% DUPoly for compressed samples and about 85 wt% for uncom-pressed DUPoly. In other words, at these DU loadings, the DUPoly process represents avolume reduction compared with disposal of untreated UO3. Such high product densi-ties are achieved because of an increased volume packing efficiency for the DU particles during DUPoly processing. This effect may be attributed to reduced particle agglomera-tion due to drying of the particles during thermal treatment, comminution of the parti-cles due to mechanical abrasion during processing, or compressive forces exerted duringforming.
DUPoly 2 × 4 samples were compression tested in accordance with ASTM D-695,“Standard Method of Test for Compressive Properties of Rigid Plastics.”11 Testing wasdone using a Soiltest hydraulic compression tester at an unloaded crosshead deflection
Figure 3. Grams DU per cm3 DUPoly versus Weight Percent DU in DUPoly Forms.
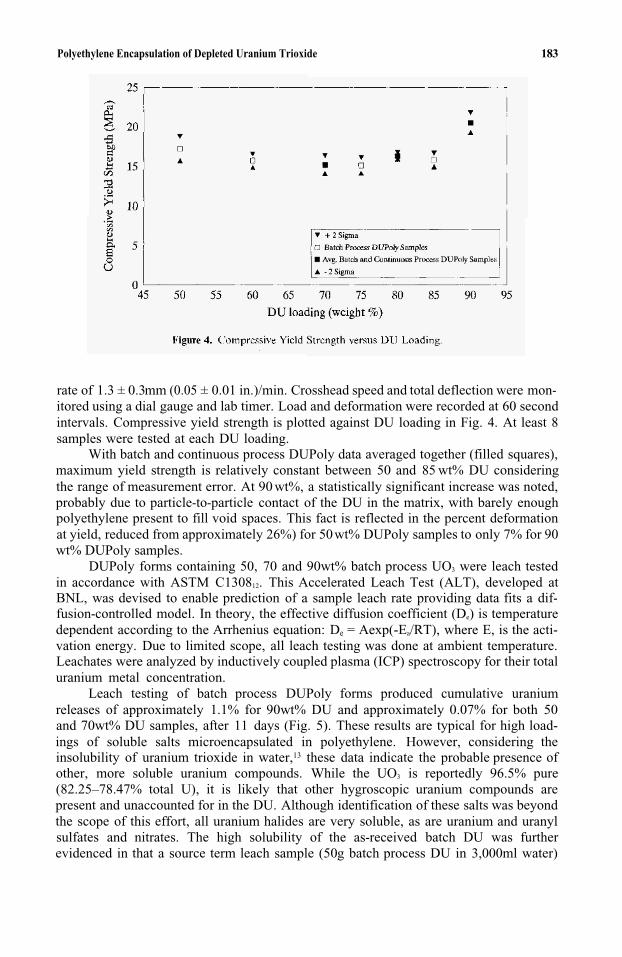
Polyethylene Encapsulation of Depleted Uranium Trioxide 183
rate of 1.3 ± 0.3mm (0.05 ± 0.01 in.)/min. Crosshead speed and total deflection were mon-itored using a dial gauge and lab timer. Load and deformation were recorded at 60 second intervals. Compressive yield strength is plotted against DU loading in Fig. 4. At least 8samples were tested at each DU loading.
With batch and continuous process DUPoly data averaged together (filled squares), maximum yield strength is relatively constant between 50 and 85 wt% DU considering the range of measurement error. At 90 wt%, a statistically significant increase was noted,probably due to particle-to-particle contact of the DU in the matrix, with barely enough polyethylene present to fill void spaces. This fact is reflected in the percent deformation at yield, reduced from approximately 26%) for 50wt% DUPoly samples to only 7% for 90wt% DUPoly samples.
DUPoly forms containing 50, 70 and 90wt% batch process UO3 were leach testedin accordance with ASTM C130812. This Accelerated Leach Test (ALT), developed at BNL, was devised to enable prediction of a sample leach rate providing data fits a dif-fusion-controlled model. In theory, the effective diffusion coefficient (De) is temperature dependent according to the Arrhenius equation: De = Aexp(-Ea/RT), where E, is the acti-vation energy. Due to limited scope, all leach testing was done at ambient temperature. Leachates were analyzed by inductively coupled plasma (ICP) spectroscopy for their totaluranium metal concentration.
Leach testing of batch process DUPoly forms produced cumulative uranium releases of approximately 1.1% for 90wt% DU and approximately 0.07% for both 50 and 70wt% DU samples, after 11 days (Fig. 5). These results are typical for high load-ings of soluble salts microencapsulated in polyethylene. However, considering the insolubility of uranium trioxide in water,13 these data indicate the probable presence ofother, more soluble uranium compounds. While the UO3 is reportedly 96.5% pure (82.25–78.47% total U), it is likely that other hygroscopic uranium compounds are present and unaccounted for in the DU. Although identification of these salts was beyond the scope of this effort, all uranium halides are very soluble, as are uranium and uranyl sulfates and nitrates. The high solubility of the as-received batch DU was furtherevidenced in that a source term leach sample (50 g batch process DU in 3,000ml water)
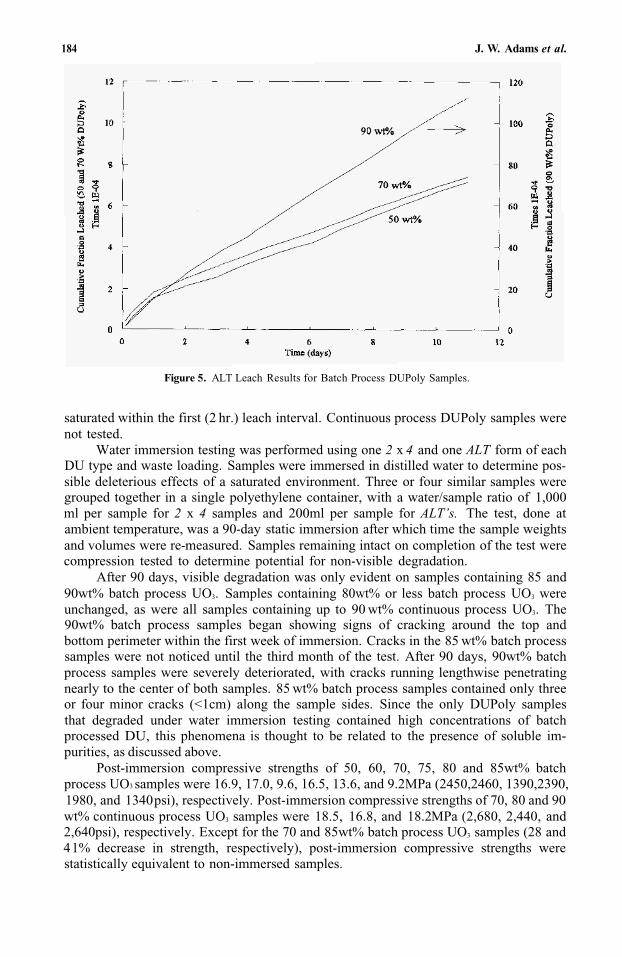
184 J. W. Adams et al.
Figure 5. ALT Leach Results for Batch Process DUPoly Samples.
saturated within the first (2 hr.) leach interval. Continuous process DUPoly samples werenot tested.
Water immersion testing was performed using one 2 x 4 and one ALT form of eachDU type and waste loading. Samples were immersed in distilled water to determine pos-sible deleterious effects of a saturated environment. Three or four similar samples were grouped together in a single polyethylene container, with a water/sample ratio of 1,000 ml per sample for 2 x 4 samples and 200ml per sample for ALT’s. The test, done atambient temperature, was a 90-day static immersion after which time the sample weights and volumes were re-measured. Samples remaining intact on completion of the test were compression tested to determine potential for non-visible degradation.
After 90 days, visible degradation was only evident on samples containing 85 and90wt% batch process UO3. Samples containing 80wt% or less batch process UO3 wereunchanged, as were all samples containing up to 90 wt% continuous process UO3. The90wt% batch process samples began showing signs of cracking around the top and bottom perimeter within the first week of immersion. Cracks in the 85 wt% batch process samples were not noticed until the third month of the test. After 90 days, 90wt% batch process samples were severely deteriorated, with cracks running lengthwise penetrating nearly to the center of both samples. 85 wt% batch process samples contained only three or four minor cracks (<1cm) along the sample sides. Since the only DUPoly samples that degraded under water immersion testing contained high concentrations of batch processed DU, this phenomena is thought to be related to the presence of soluble im-purities, as discussed above.
Post-immersion compressive strengths of 50, 60, 70, 75, 80 and 85wt% batch process UO3 samples were 16.9, 17.0, 9.6, 16.5, 13.6, and 9.2MPa (2450,2460, 1390,2390, 1980, and 1340 psi), respectively. Post-immersion compressive strengths of 70, 80 and 90 wt% continuous process UO3 samples were 18.5, 16.8, and 18.2 MPa (2,680, 2,440, and 2,640psi), respectively. Except for the 70 and 85wt% batch process UO3 samples (28 and41% decrease in strength, respectively), post-immersion compressive strengths were statistically equivalent to non-immersed samples.
Polyethylene Encapsulation of Depleted Uranium Trioxide 185
6. CONCLUSIONS
Depleted UO3 powders, representative of the depleted uranium inventory at the Savannah River Site, were successfully stabilized by polyethylene encapsulation usingBNL’s single-screw extrusion process. Material corresponding to two different processes used to prepare the oxide, batch and continuous, were processed. Loadings as high as90 wt% DU were successfully achieved for both lots. A maximum product density of 4.2 g/cm3 was obtained. Additional process improvements are under consideration which are expected to lead to DUPoly product densities as high as 7.2g/cm3.
Waste form performance testing of microencapsulated UO3 included compressive strength, water immersion and leach testing. Compression test results were in keeping with measurements made with other waste materials encapsulated in polyethylene, typi-cally around 14MPa (-- 2,000psi). Leach rates, which varied according to UO3 loading,were similarly in line with polyethylene waste forms bearing high salt waste loadings: approximately 1% after 11 days for samples containing 90wt% UO3. Considering the insolubility of uranium trioxide, however, these leach data indicate the probable presence of other, more soluble uranium compounds present in the batch process UO3 powder.The continuous process DUPoly material was not tested. Ninety-day water immersion tests concluded that water absorption was inconsequential except for batch process DUPoly samples at very high (>A5wt%) waste loadings. Sample degradation in batch process DUPoly corresponds to the increased leach rate observed during ALT testing, probably resulting from hygroscopic impurities. In contrast, continuous process DU showed no evidence of swelling/cracking during 90-day immersion testing even at the highest DU loading of 90 wt%. Therefore, continuous process DU provides a significantlymore stable and durable product.
REFERENCES
1. U.S. DOE, “Alternative Strategies for the Long-Term Management and Use of Depleted Uranium Hexafluoride, Notice of Intent,” 61 Fed Reg 2239, January 25, 1996.
2. Kalb, P.D. and P. Colombo, “Polyethylene Solidification of Low-Level Wastes, Topical Report,” BNL-51867, Brookhaven National Laboratory, Upton, NY, October 1984.
3. Kalb, P.D., J.H. Heiser, and P. Colombo, “Polyethylene Encapsulation of Nitrate Salt Wastes: Waste Form Stability, Process Scale-up, and Economics,” BNL-52293, Brookhaven National Laboratory, Upton NY, July 1991.
4. Kalb, P.D. and M. Fuhrmann, “Polyethylene Encapsulation of Single-Shell Tank Wastes,” BNL-52365,Brookhaven National Laboratory, Upton, NY, September 1992.
5. Kalb. P.D., J.H. Heiser, and P. Colombo, “Long-Term Durability of Polyethylene for Encapsulation ofLow-Level Radioactive, Hazardous. and Mixed Wastes,” Emerging Technologies in Hazardous Waste Management III, D. W. Tedder and R.G. Pohland, ed., American Chemical Society Symposium Series 518, Washington, D.C., 1993.
6. Kalb, P.D., J.W. Adams, M. Meyer, and H. Holmes Burns, “Thermoplastic Encapsulation Treatability Study for a Mixed Waste Incinerator Off-Gas Scrubbing Solution,” Third International Symposium on Stabilization/Solidification of Hazardous, Radioactive, and Mixed Wastes, November 1993.
7. Adams, J.W. and P.D. Kalb, “Thermoplastic Stabilization Treatability Study for a Chloride, Sulfate and Nitrate Salts Mixed Waste Surrogate.” Emerging Technologies in Hazardous Waste Management VI,American Chemical Society, D.W. Tedder and R.G. Pohland, ed., in press.
8. Kalb, P.D. and P.R. Lageraaen, “Full-Scale Technology Demonstration of a Polyethylene Encapsula-tion Process for Radioactive, Hazardous, and Mixed Wastes,” Journal of Environmental Science andHealth, in press.
9. Lageraaen, P.R., B.R. Patel, P.D. Kalb, and J.W. Adams, “Treatability Studies for Polyethylene Encap-sulation of INEL Low-Level Mixed Wastes,” BNL-62620, Brookhaven National Laboratory, Upton,NY, October 1995.

186 J. W.Adams et al.
10. Brady, S.D., D.A. Krough, and R.P. Laporte, “Depleted Uranium Trioxide (UO3) Characterization and Storage,” 94AB62387P-00F, Carolina Metals, Inc., January 1995.
11. ASTM, “Standard Method of Test for Compressive Properties of Rigid Plastics,” D695, AmericanSociety for Testing and Materials, Philadelphia, PA, 1969.
12. ASTM, “Accelerated Leach Test for Diffusive Releases from Solidified Waste and a Computer Program to Model Diffusive, Fractional Leaching from Cylindrical Waste Forms,” C 1308, American Society for Testing and Materials, Philadelphia, PA, 1995.
13. CRC Handbook of Chemistry and Physics, ed. R.C. Weast and M.J. Astle, CRC Press, Inc, Boca Raton,FL, 1981.
16
TREATABILITY STUDY ON THE USE OF
THE STABILIZATION OF HAZARDOUS ANDRADIOACTIVE WASTES*
BY-PRODUCT SULFUR IN KAZAKHSTAN FOR
P. D. Kalb, L. W. Milian1, S. P. Yim2, R. S. Dyer, and W. R. Michaud3
1Brookhaven National Laboratory Department of Advanced Technology Environmental & Waste Management Group Building 830PO Box 5000 Upton, New York 11973-5000
2Korean Atomic Energy Research Institute Nuclear Environment Management Center 150 Dukjin-dongYusong-gu, Taejon 305-600Korea
3U.S. Environmental Protection Agency Office of International Activities Ronald Reagan Building 1300 Pennsylvania Avenue Washington, DC 20004
1. ABSTRACT
The Republic of Kazakhstan generates significant quantities of excess elemental sulfur from the production and refining of petroleum reserves. In addition, the country also produces hazardous and radioactive wastes which require treatment/stabilization. Inan effort to find secondary uses for the elemental sulfur, simultaneously produce a mate-rial which could be used to encapsulate, and reduce the dispersion of harmful contami-nants into the environment, BNL evaluated the use of the sulfur polymer cement (SPC)
*Work performed under the auspices of the U.S. Department of Energy
Emerging Technologies in Hazardous Waste Management 8, edited by Tedder and Pohland Kluwer Academic /Plenum Publishers, New York, 2000. 187
188 P. D. Kalb et al.
produced from by-product sulfur in Kazakhstan. This thermoplastic binder materialforms a durable waste form with low leaching properties and is compatible with a widerange of waste types. Several hundred kilograms of Kazakhstan sulfur were shipped to the U.S. and converted to SPC (by reaction with 5 weight percent (wt%) organic modi-fiers for use in this study. A phosphogypsum sand waste generated in Kazakhstan during the purification of phosphate fertilizer was selected for treatment. Waste loadings of40wt% were easily achieved. Waste form performance testing included compressive strength, water immersion, and Accelerated Leach Testing.
2. INTRODUCTION
Chevron Oil Corp., together with the Kazakhstan Ministry of Oil and Gas, hasformed a partnership (Tengizchevroil) to explore, develop, and market oil and gas reserves in the Tengiz region of Kazakhstan on the northern shore of the Caspian sea. The growing oil industry in Kazakhstan is already one of their major industries. However, due to limited resources and the required infrastructure to manage resulting toxic and hazardous wastes, there is a growing potential for environmental consequences arising from oil production, refining operations and other environmentally sensitive industries that will need to be addressed. This project, sponsored by the U.S. Environmental Pro-tection Agency Office of International Activities, is investigating potential environmen-tal solutions to foster both commercial and environmental sustainable development in Kazakhstan.
Large quantities of by-product sulfur are currently generated by the cleanup of hydrogen sulfide in the production of petroleum and natural gas at the Tengizchevroil fields in Kazakhstan. Currently about 1,200 metric tons/day of sulfur are generated fromprocessing 60,000 barrels of oil/day, but oil production is expected to grow rapidly. The by-product sulfur has little commercial or social benefit and presently, much of it is dis-posed as waste. Tengizchevroil has obtained special permission from the Kazakhstan Ministry of the Environment to “block and store” the sulfur by-product, a process in which the molten sulfur is cooled into large solid blocks for storage. But as the volume of sulfur residue increases with increased oil and gas production, this practice may no longer be sound or acceptable. In addition, hazardous oil and gas residuals (e.g., incin- erator ash, blowdown solutions), as well as toxic and hazardous wastes generated by other past, currently operating and emerging industries throughout Kazakhstan are produced and require treatment prior to disposal.
This paper evaluates the feasibility of using sulfur polymer (produced from by- product sulfur in the Tengiz region of Kazakhstan) to encapsulate hazardous and radioac-tive wastes generated on site, at other sites in Kazakhstan, and elsewhere in eastern Europe. Phosphogypsum sand waste generated in Kazakhstan from the production of fertilizerswas used for this treatability study. This waste was characterized, encapsulated in sulfur polymer and subjected to selected standardized performance tests (e.g., NRC, ASTM) to evaluate mechanical integrity, durability, and leaching properties.
3. SULFUR POLYMER ENCAPSULATION
Using techniques developed by the US. Bureau of Mines1,2 by-product sulfur can be successfully converted into a stable, durable alternative to concrete with numerous
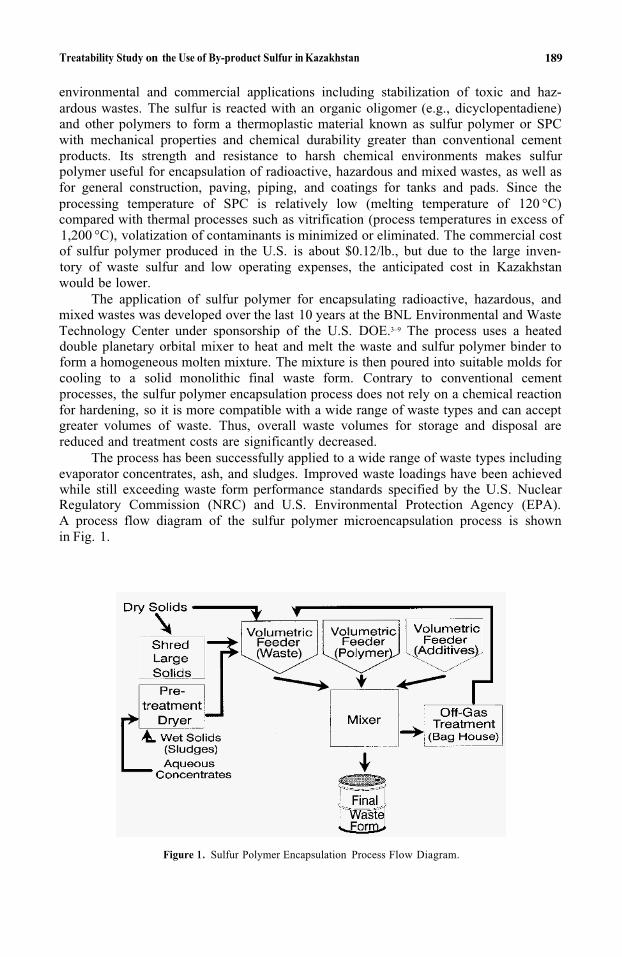
Treatability Study on the Use of By-product Sulfur in Kazakhstan
environmental and commercial applications including stabilization of toxic and haz- ardous wastes. The sulfur is reacted with an organic oligomer (e.g., dicyclopentadiene) and other polymers to form a thermoplastic material known as sulfur polymer or SPC with mechanical properties and chemical durability greater than conventional cement products. Its strength and resistance to harsh chemical environments makes sulfur polymer useful for encapsulation of radioactive, hazardous and mixed wastes, as well as for general construction, paving, piping, and coatings for tanks and pads. Since the processing temperature of SPC is relatively low (melting temperature of 120 °C) compared with thermal processes such as vitrification (process temperatures in excess of 1,200 °C), volatization of contaminants is minimized or eliminated. The commercial cost of sulfur polymer produced in the U.S. is about $0.12/lb., but due to the large inven-tory of waste sulfur and low operating expenses, the anticipated cost in Kazakhstan would be lower.
The application of sulfur polymer for encapsulating radioactive, hazardous, and mixed wastes was developed over the last 10 years at the BNL Environmental and Waste Technology Center under sponsorship of the U.S. DOE.3–9 The process uses a heated double planetary orbital mixer to heat and melt the waste and sulfur polymer binder to form a homogeneous molten mixture. The mixture is then poured into suitable molds for cooling to a solid monolithic final waste form. Contrary to conventional cement processes, the sulfur polymer encapsulation process does not rely on a chemical reaction for hardening, so it is more compatible with a wide range of waste types and can accept greater volumes of waste. Thus, overall waste volumes for storage and disposal are reduced and treatment costs are significantly decreased.
The process has been successfully applied to a wide range of waste types including evaporator concentrates, ash, and sludges. Improved waste loadings have been achieved while still exceeding waste form performance standards specified by the U.S. NuclearRegulatory Commission (NRC) and U.S. Environmental Protection Agency (EPA). A process flow diagram of the sulfur polymer microencapsulation process is shown in Fig. 1.
189
Figure 1. Sulfur Polymer Encapsulation Process Flow Diagram.
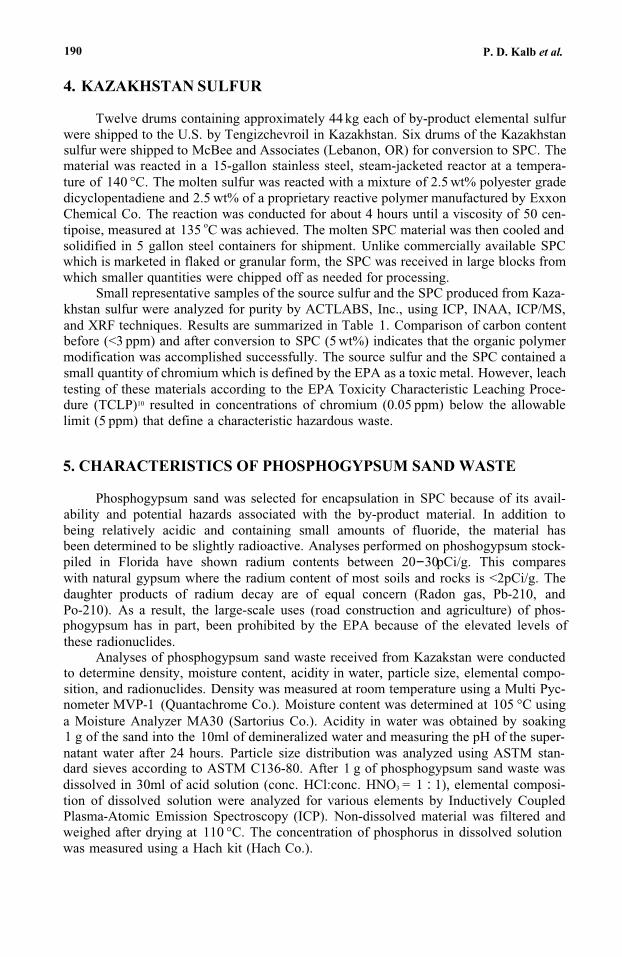
P. D. Kalb et al.190
4. KAZAKHSTAN SULFUR
Twelve drums containing approximately 44 kg each of by-product elemental sulfur were shipped to the U.S. by Tengizchevroil in Kazakhstan. Six drums of the Kazakhstansulfur were shipped to McBee and Associates (Lebanon, OR) for conversion to SPC. The material was reacted in a 15-gallon stainless steel, steam-jacketed reactor at a tempera-ture of 140 °C. The molten sulfur was reacted with a mixture of 2.5 wt% polyester grade dicyclopentadiene and 2.5 wt% of a proprietary reactive polymer manufactured by Exxon Chemical Co. The reaction was conducted for about 4 hours until a viscosity of 50 cen-tipoise, measured at 135 oC was achieved. The molten SPC material was then cooled andsolidified in 5 gallon steel containers for shipment. Unlike commercially available SPC which is marketed in flaked or granular form, the SPC was received in large blocks from which smaller quantities were chipped off as needed for processing.
Small representative samples of the source sulfur and the SPC produced from Kaza-khstan sulfur were analyzed for purity by ACTLABS, Inc., using ICP, INAA, ICP/MS, and XRF techniques. Results are summarized in Table 1. Comparison of carbon content before (<3 ppm) and after conversion to SPC (5 wt%) indicates that the organic polymermodification was accomplished successfully. The source sulfur and the SPC contained asmall quantity of chromium which is defined by the EPA as a toxic metal. However, leach testing of these materials according to the EPA Toxicity Characteristic Leaching Proce-dure (TCLP)10 resulted in concentrations of chromium (0.05 ppm) below the allowable limit (5 ppm) that define a characteristic hazardous waste.
5. CHARACTERISTICS OF PHOSPHOGYPSUM SAND WASTE
Phosphogypsum sand was selected for encapsulation in SPC because of its avail-ability and potential hazards associated with the by-product material. In addition to being relatively acidic and containing small amounts of fluoride, the material has been determined to be slightly radioactive. Analyses performed on phoshogypsum stock-piled in Florida have shown radium contents between 20-30pCi/g. This compareswith natural gypsum where the radium content of most soils and rocks is <2pCi/g. The daughter products of radium decay are of equal concern (Radon gas, Pb-210, and Po-210). As a result, the large-scale uses (road construction and agriculture) of phos-phogypsum has in part, been prohibited by the EPA because of the elevated levels of these radionuclides.
Analyses of phosphogypsum sand waste received from Kazakstan were conducted to determine density, moisture content, acidity in water, particle size, elemental compo-sition, and radionuclides. Density was measured at room temperature using a Multi Pyc-nometer MVP-1 (Quantachrome Co.). Moisture content was determined at 105 °C using a Moisture Analyzer MA30 (Sartorius Co.). Acidity in water was obtained by soaking 1 g of the sand into the 10ml of demineralized water and measuring the pH of the super-natant water after 24 hours. Particle size distribution was analyzed using ASTM stan-dard sieves according to ASTM C136-80. After 1 g of phosphogypsum sand waste was dissolved in 30ml of acid solution (conc. HCl:conc. HNO3 = 1 : 1), elemental composi-tion of dissolved solution were analyzed for various elements by Inductively Coupled Plasma-Atomic Emission Spectroscopy (ICP). Non-dissolved material was filtered and weighed after drying at 110 °C. The concentration of phosphorus in dissolved solutionwas measured using a Hach kit (Hach Co.).
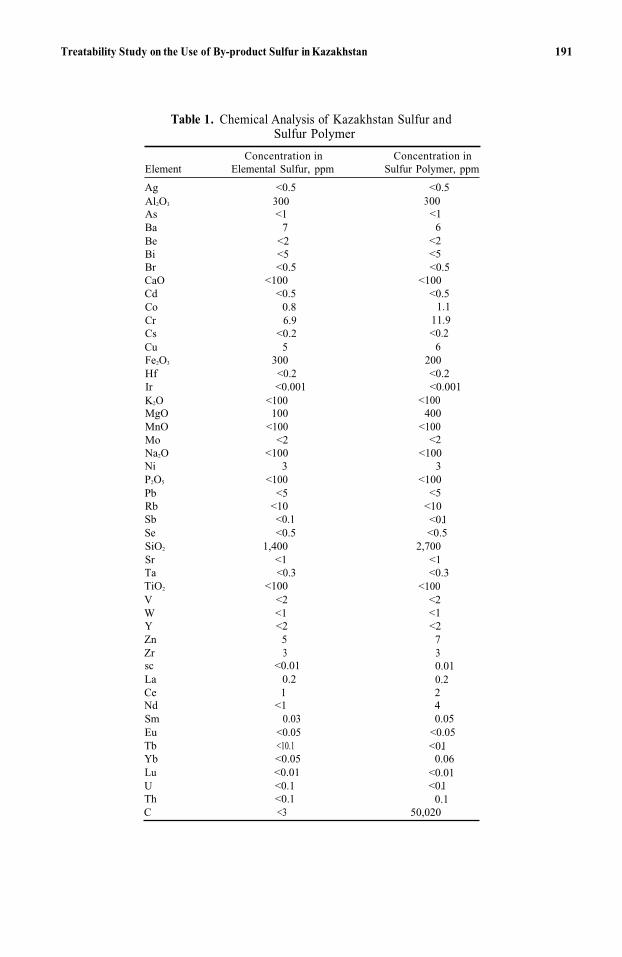
Treatability Study on the Use of By-product Sulfur in Kazakhstan 191
Table 1. Chemical Analysis of Kazakhstan Sulfur andSulfur Polymer
Element Elemental Sulfur, ppm Sulfur Polymer, ppm
Ag <0.5 <0.5Al2O3 300 300As <1 <1Ba 7 6Be <2 <2Bi <5 <5Br <0.5 <0.5CaO <100 <100Cd <0.5 <0.5Co 0.8 1.1Cr 6.9 11.9Cs <0.2 <0.2Cu 5 6Fe2O3 300 200Hf <0.2 <0.2Ir <0.001 <0.001K2O <100 <100MgO 100 400MnO <100 <100Mo <2 <2Na2O <100 <100Ni 3 3P2O5 <100 <100Pb <5 <5Rb <10 <10Sb <0.1 <0. 1 Se <0.5 <0.5SiO2 1,400 2,700Sr <1 <1Ta <0.3 <0.3TiO2 <100 <100V <2 <2W <1 <1Y <2 <2Zn 5 7Zr 3 3sc <0.01 0.01La 0.2 0.2Ce 1 2Nd <1 4Sm 0.03 0.05Eu <0.05 <0.05Tb <10.1 <0. 1 Yb <0.05 0.06Lu <0.01 <0.01U <0.1 <0. 1 Th <0. 1 0.1C <3 50,020
Concentration in Concentration in
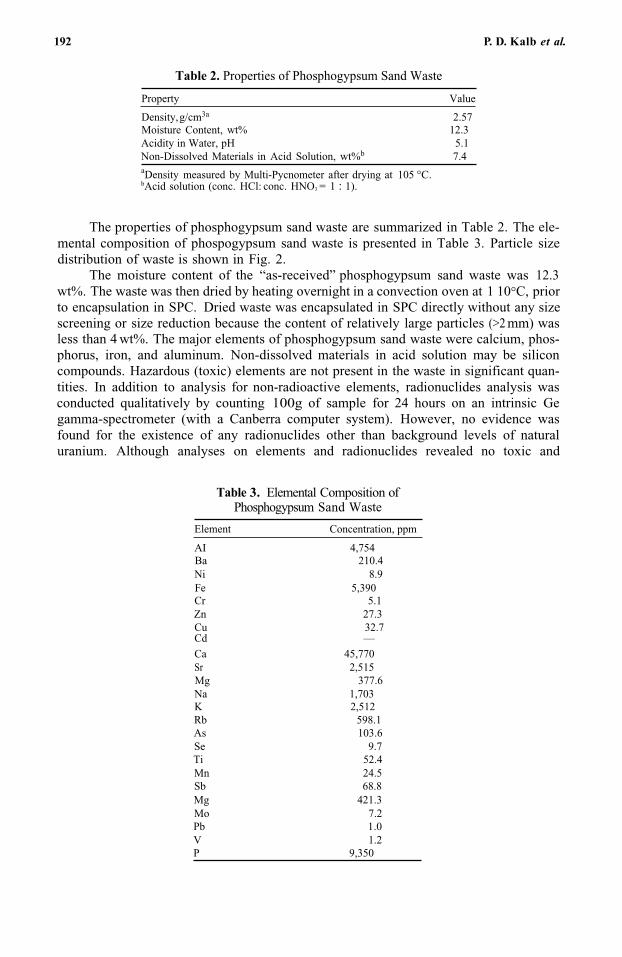
192 P. D. Kalb et al.
Table 2. Properties of Phosphogypsum Sand Waste
Property Value
Density,g/cm3a 2.57Moisture Content, wt% 12.3Acidity in Water, pH 5.1 Non-Dissolved Materials in Acid Solution, wt%b 7.4aDensity measured by Multi-Pycnometer after drying at 105 °C.bAcid solution (conc. HCl: conc. HNO3 = 1 : 1).
The properties of phosphogypsum sand waste are summarized in Table 2. The ele- mental composition of phospogypsum sand waste is presented in Table 3. Particle sizedistribution of waste is shown in Fig. 2.
The moisture content of the “as-received” phosphogypsum sand waste was 12.3wt%. The waste was then dried by heating overnight in a convection oven at 1 10°C, priorto encapsulation in SPC. Dried waste was encapsulated in SPC directly without any sizescreening or size reduction because the content of relatively large particles (>2 mm) was less than 4 wt%. The major elements of phosphogypsum sand waste were calcium, phos-phorus, iron, and aluminum. Non-dissolved materials in acid solution may be silicon compounds. Hazardous (toxic) elements are not present in the waste in significant quan- tities. In addition to analysis for non-radioactive elements, radionuclides analysis was conducted qualitatively by counting 100g of sample for 24 hours on an intrinsic Ge gamma-spectrometer (with a Canberra computer system). However, no evidence was found for the existence of any radionuclides other than background levels of natural uranium. Although analyses on elements and radionuclides revealed no toxic and
Table 3. Elemental Composition ofPhosphogypsum Sand Waste
Element Concentration, ppm
AI 4,754Ba 210.4Ni 8.9 Fe 5,390 Cr 5.1 Zn 27.3 Cu 32.7 Cd —Ca 45,770 Sr 2,515Mg 377.6 Na 1,703 K 2,512Rb 598.1 As 103.6Se 9.7Ti 52.4 Mn 24.5 Sb 68.8Mg 421.3Mo 7.2 Pb 1 .0 V 1.2P 9,350
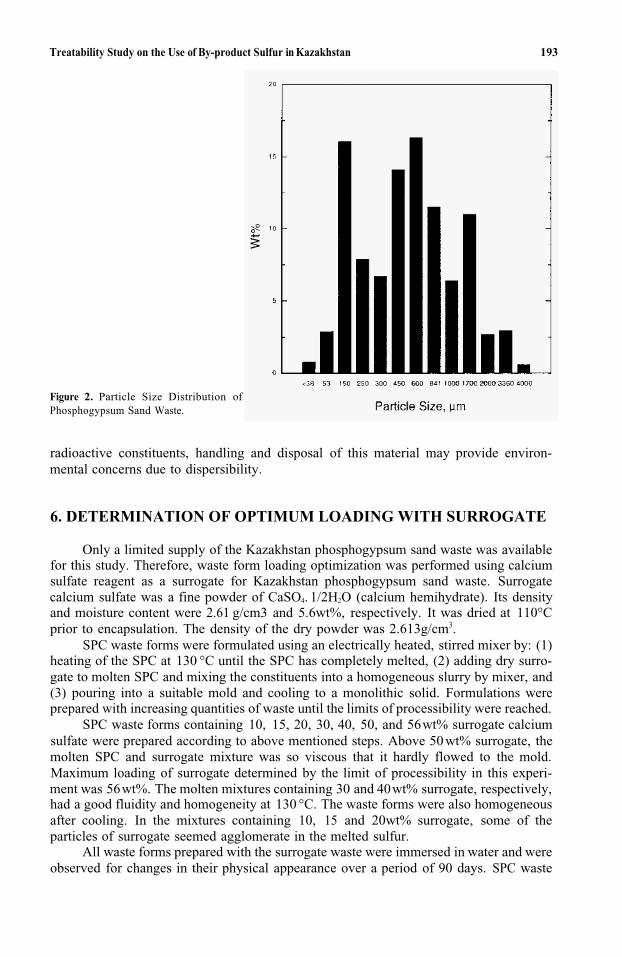
Treatability Study on the Use of By-product Sulfur in Kazakhstan 193
Figure 2. Particle Size Distribution ofPhosphogypsum Sand Waste.
radioactive constituents, handling and disposal of this material may provide environ- mental concerns due to dispersibility.
6. DETERMINATION OF OPTIMUM LOADING WITH SURROGATE
Only a limited supply of the Kazakhstan phosphogypsum sand waste was available for this study. Therefore, waste form loading optimization was performed using calcium sulfate reagent as a surrogate for Kazakhstan phosphogypsum sand waste. Surrogate calcium sulfate was a fine powder of CaSO4. 1/2H2O (calcium hemihydrate). Its density and moisture content were 2.61 g/cm3 and 5.6wt%, respectively. It was dried at 110°Cprior to encapsulation. The density of the dry powder was 2.613g/cm3.
SPC waste forms were formulated using an electrically heated, stirred mixer by: (1)heating of the SPC at 130 °C until the SPC has completely melted, (2) adding dry surro-gate to molten SPC and mixing the constituents into a homogeneous slurry by mixer, and (3) pouring into a suitable mold and cooling to a monolithic solid. Formulations were prepared with increasing quantities of waste until the limits of processibility were reached.
SPC waste forms containing 10, 15, 20, 30, 40, 50, and 56 wt% surrogate calcium sulfate were prepared according to above mentioned steps. Above 50 wt% surrogate, the molten SPC and surrogate mixture was so viscous that it hardly flowed to the mold. Maximum loading of surrogate determined by the limit of processibility in this experi- ment was 56 wt%. The molten mixtures containing 30 and 40wt% surrogate, respectively, had a good fluidity and homogeneity at 130 °C. The waste forms were also homogeneous after cooling. In the mixtures containing 10, 15 and 20wt% surrogate, some of the particles of surrogate seemed agglomerate in the melted sulfur.
All waste forms prepared with the surrogate waste were immersed in water and were observed for changes in their physical appearance over a period of 90 days. SPC waste
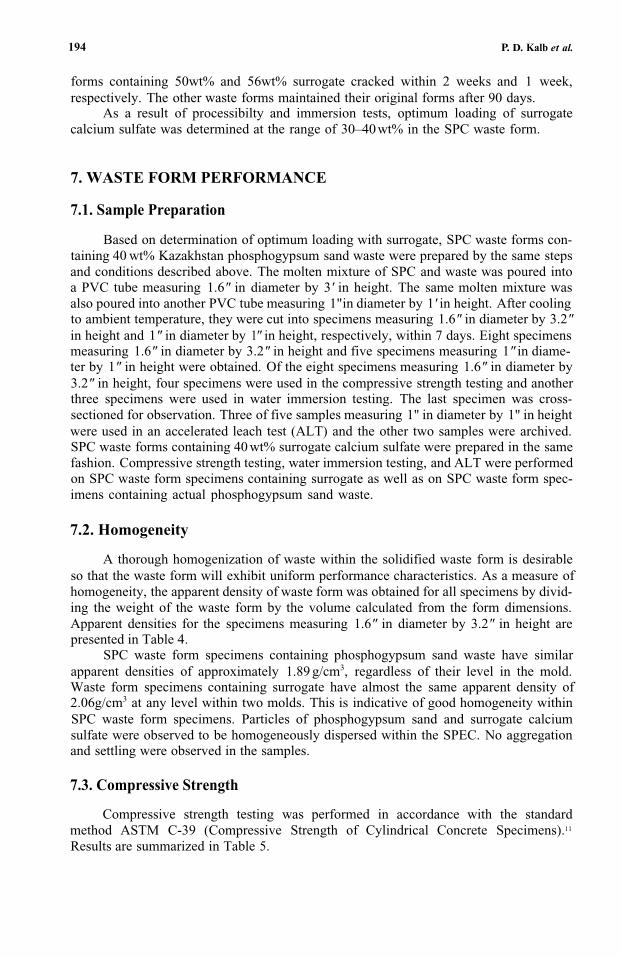
P. D. Kalb et al.
forms containing 50wt% and 56wt% surrogate cracked within 2 weeks and 1 week,respectively. The other waste forms maintained their original forms after 90 days.
As a result of processibilty and immersion tests, optimum loading of surrogate calcium sulfate was determined at the range of 30–40 wt% in the SPC waste form.
194
7. WASTE FORM PERFORMANCE
7.1. Sample Preparation
Based on determination of optimum loading with surrogate, SPC waste forms con-taining 40 wt% Kazakhstan phosphogypsum sand waste were prepared by the same stepsand conditions described above. The molten mixture of SPC and waste was poured intoa PVC tube measuring 1.6" in diameter by 3' in height. The same molten mixture wasalso poured into another PVC tube measuring 1"in diameter by 1' in height. After coolingto ambient temperature, they were cut into specimens measuring 1.6" in diameter by 3.2"in height and 1" in diameter by 1" in height, respectively, within 7 days. Eight specimensmeasuring 1.6" in diameter by 3.2" in height and five specimens measuring 1" in diame- ter by 1" in height were obtained. Of the eight specimens measuring 1.6" in diameter by3.2" in height, four specimens were used in the compressive strength testing and anotherthree specimens were used in water immersion testing. The last specimen was cross-sectioned for observation. Three of five samples measuring 1" in diameter by 1" in heightwere used in an accelerated leach test (ALT) and the other two samples were archived. SPC waste forms containing 40 wt% surrogate calcium sulfate were prepared in the same fashion. Compressive strength testing, water immersion testing, and ALT were performed on SPC waste form specimens containing surrogate as well as on SPC waste form spec-imens containing actual phosphogypsum sand waste.
7.2. Homogeneity
A thorough homogenization of waste within the solidified waste form is desirable so that the waste form will exhibit uniform performance characteristics. As a measure of homogeneity, the apparent density of waste form was obtained for all specimens by divid-ing the weight of the waste form by the volume calculated from the form dimensions. Apparent densities for the specimens measuring 1.6" in diameter by 3.2" in height arepresented in Table 4.
SPC waste form specimens containing phosphogypsum sand waste have similar apparent densities of approximately 1.89 g/cm3, regardless of their level in the mold. Waste form specimens containing surrogate have almost the same apparent density of 2.06g/cm3 at any level within two molds. This is indicative of good homogeneity withinSPC waste form specimens. Particles of phosphogypsum sand and surrogate calcium sulfate were observed to be homogeneously dispersed within the SPEC. No aggregationand settling were observed in the samples.
7.3. Compressive Strength
Compressive strength testing was performed in accordance with the standard method ASTM C-39 (Compressive Strength of Cylindrical Concrete Specimens).11
Results are summarized in Table 5.
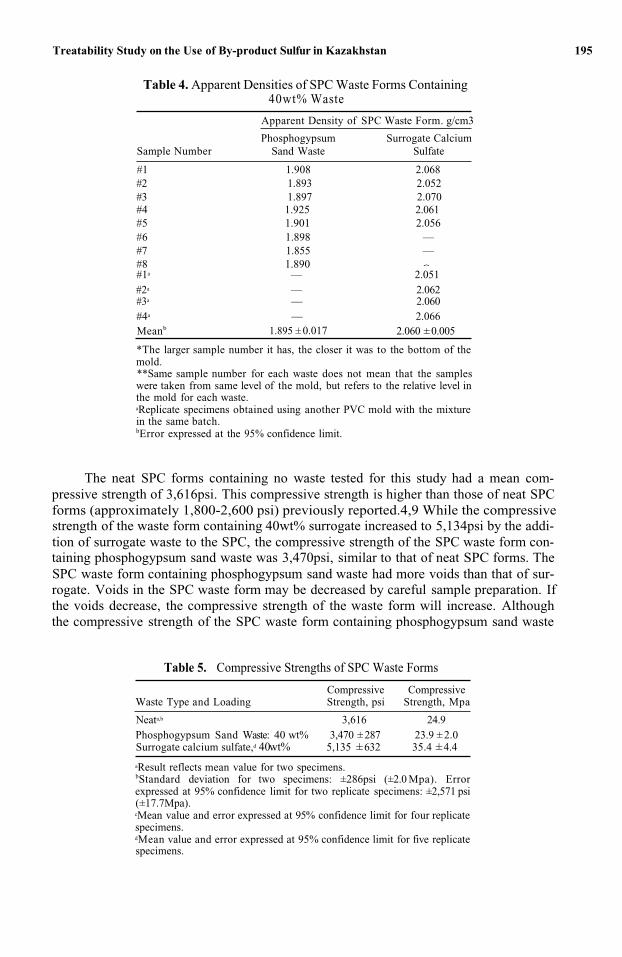
Treatability Study on the Use of By-product Sulfur in Kazakhstan 195
Table 4. Apparent Densities of SPC Waste Forms Containing40wt% Waste
Apparent Density of SPC Waste Form. g/cm3
Phosphogypsum Surrogate Calcium Sample Number Sand Waste Sulfate
#1 1.908 2.068#2 1.893 2.052#3 1.897 2.070#4 1.925 2.061#5 1.901 2.056#6 1.898 — #7 1.855 —#8 1.890 #1a — 2.051#2a — 2.062#3a — 2.060#4a — 2.066Meanb
*The larger sample number it has, the closer it was to the bottom of themold.**Same sample number for each waste does not mean that the samples were taken from same level of the mold, but refers to the relative level inthe mold for each waste.aReplicate specimens obtained using another PVC mold with the mixturein the same batch.bError expressed at the 95% confidence limit.
ó
1.895 ±0.017 2.060 ±0.005
The neat SPC forms containing no waste tested for this study had a mean com-pressive strength of 3,616psi. This compressive strength is higher than those of neat SPCforms (approximately 1,800-2,600 psi) previously reported.4,9 While the compressive strength of the waste form containing 40wt% surrogate increased to 5,134psi by the addi-tion of surrogate waste to the SPC, the compressive strength of the SPC waste form con-taining phosphogypsum sand waste was 3,470psi, similar to that of neat SPC forms. The SPC waste form containing phosphogypsum sand waste had more voids than that of sur- rogate. Voids in the SPC waste form may be decreased by careful sample preparation. If the voids decrease, the compressive strength of the waste form will increase. Althoughthe compressive strength of the SPC waste form containing phosphogypsum sand waste
Table 5. Compressive Strengths of SPC Waste Forms
Waste Type and Loading Strength, psi Strength, Mpa
Neata,b 3,616 24.9Phosphogypsum Sand Waste: 40 wt%
aResult reflects mean value for two specimens. bStandard deviation for two specimens: ±286psi (±2.0 Mpa). Errorexpressed at 95% confidence limit for two replicate specimens: ±2,571 psi(±17.7Mpa).cMean value and error expressed at 95% confidence limit for four replicatespecimens.dMean value and error expressed at 95% confidence limit for five replicatespecimens.
Compressive Compressive
23.9 ±2.03,470 ±287Surrogate calcium sulfate,d 40wt% 5,135 ±632 35.4 ±4.4
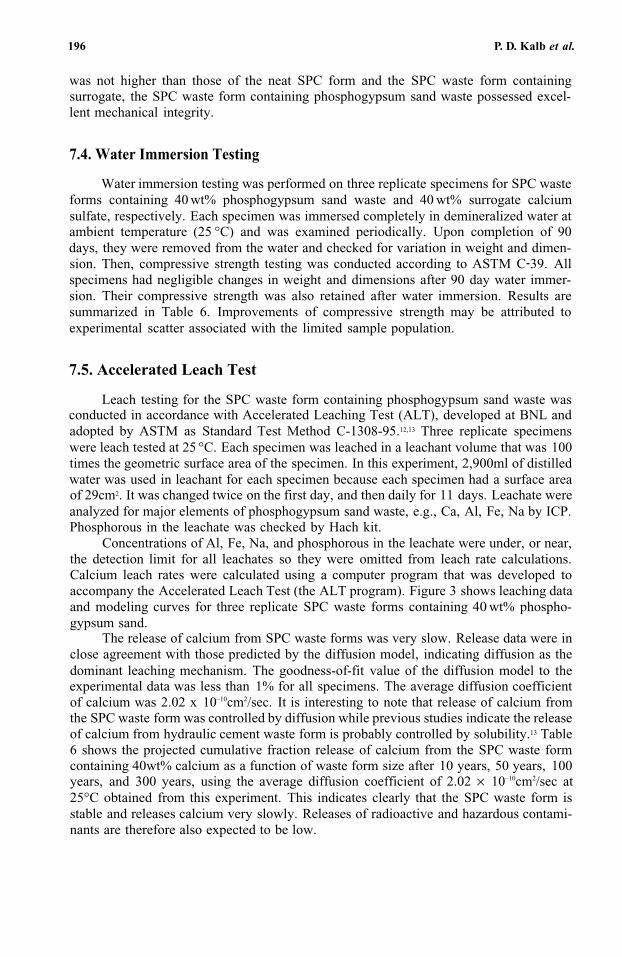
196 P. D. Kalb et al.
was not higher than those of the neat SPC form and the SPC waste form containing surrogate, the SPC waste form containing phosphogypsum sand waste possessed excel-lent mechanical integrity.
7.4. Water Immersion Testing
Water immersion testing was performed on three replicate specimens for SPC waste forms containing 40 wt% phosphogypsum sand waste and 40 wt% surrogate calcium sulfate, respectively. Each specimen was immersed completely in demineralized water at ambient temperature (25 °C) and was examined periodically. Upon completion of 90 days, they were removed from the water and checked for variation in weight and dimen-sion. Then, compressive strength testing was conducted according to ASTM C-39. Allspecimens had negligible changes in weight and dimensions after 90 day water immer-sion. Their compressive strength was also retained after water immersion. Results are summarized in Table 6. Improvements of compressive strength may be attributed toexperimental scatter associated with the limited sample population.
7.5. Accelerated Leach Test
Leach testing for the SPC waste form containing phosphogypsum sand waste was conducted in accordance with Accelerated Leaching Test (ALT), developed at BNL andadopted by ASTM as Standard Test Method C-1308-95.12,13 Three replicate specimens were leach tested at 25 °C. Each specimen was leached in a leachant volume that was 100times the geometric surface area of the specimen. In this experiment, 2,900ml of distilledwater was used in leachant for each specimen because each specimen had a surface area of 29cm2. It was changed twice on the first day, and then daily for 11 days. Leachate were analyzed for major elements of phosphogypsum sand waste, e.g., Ca, Al, Fe, Na by ICP. Phosphorous in the leachate was checked by Hach kit.
Concentrations of Al, Fe, Na, and phosphorous in the leachate were under, or near, the detection limit for all leachates so they were omitted from leach rate calculations. Calcium leach rates were calculated using a computer program that was developed toaccompany the Accelerated Leach Test (the ALT program). Figure 3 shows leaching dataand modeling curves for three replicate SPC waste forms containing 40 wt% phospho-gypsum sand.
The release of calcium from SPC waste forms was very slow. Release data were in close agreement with those predicted by the diffusion model, indicating diffusion as the dominant leaching mechanism. The goodness-of-fit value of the diffusion model to the experimental data was less than 1% for all specimens. The average diffusion coefficient of calcium was 2.02 x 10⁻¹⁰cm2/sec. It is interesting to note that release of calcium fromthe SPC waste form was controlled by diffusion while previous studies indicate the release of calcium from hydraulic cement waste form is probably controlled by solubility.13 Table6 shows the projected cumulative fraction release of calcium from the SPC waste form containing 40wt% calcium as a function of waste form size after 10 years, 50 years, 100years, and 300 years, using the average diffusion coefficient of 2.02 × 10⁻¹⁰cm2/sec at25°C obtained from this experiment. This indicates clearly that the SPC waste form is stable and releases calcium very slowly. Releases of radioactive and hazardous contami-nants are therefore also expected to be low.
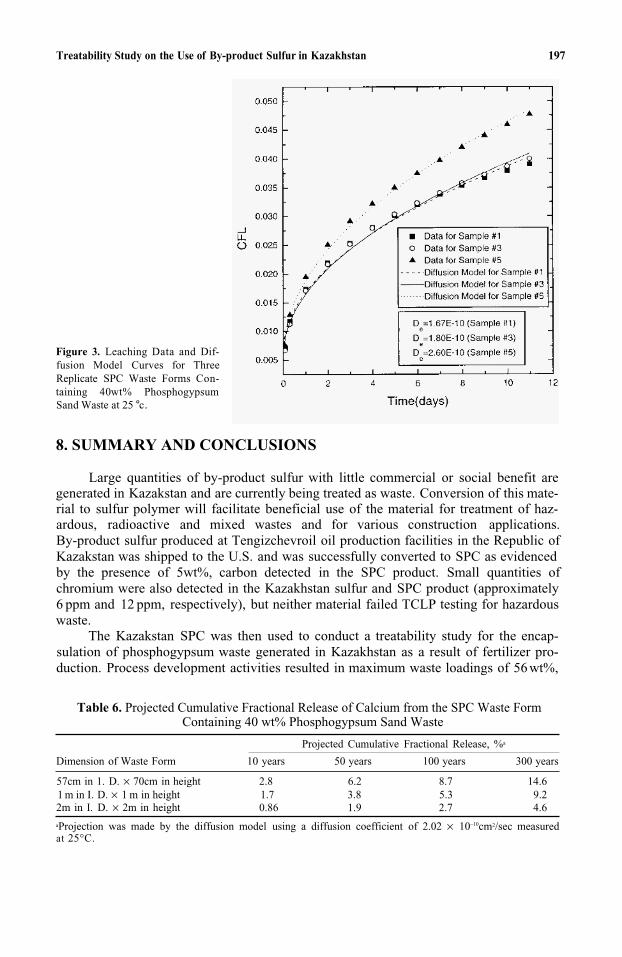
Treatability Study on the Use of By-product Sulfur in Kazakhstan 197
Figure 3. Leaching Data and Dif-fusion Model Curves for ThreeReplicate SPC Waste Forms Con-taining 40 wt% PhosphogypsumSand Waste at 25°c.
8. SUMMARY AND CONCLUSIONS
Large quantities of by-product sulfur with little commercial or social benefit are generated in Kazakstan and are currently being treated as waste. Conversion of this mate-rial to sulfur polymer will facilitate beneficial use of the material for treatment of haz-ardous, radioactive and mixed wastes and for various construction applications. By-product sulfur produced at Tengizchevroil oil production facilities in the Republic ofKazakstan was shipped to the U.S. and was successfully converted to SPC as evidencedby the presence of 5wt%, carbon detected in the SPC product. Small quantities of chromium were also detected in the Kazakhstan sulfur and SPC product (approximately 6 ppm and 12 ppm, respectively), but neither material failed TCLP testing for hazardouswaste.
The Kazakstan SPC was then used to conduct a treatability study for the encap- sulation of phosphogypsum waste generated in Kazakhstan as a result of fertilizer pro-duction. Process development activities resulted in maximum waste loadings of 56 wt%,
Table 6. Projected Cumulative Fractional Release of Calcium from the SPC Waste Form Containing 40 wt% Phosphogypsum Sand Waste
Projected Cumulative Fractional Release, %a
Dimension of Waste Form 10 years 50 years 100 years 300 years
57cm in 1. D. × 70cm in height 2.8 6.2 8.7 14.61 m in I. D. × 1 m in height 1.7 3.8 5.3 9.22m in I. D. × 2m in height 0.86 1.9 2.7 4.6
aProjection was made by the diffusion model using a diffusion coefficient of 2.02 × 10⁻¹⁰cm2/sec measuredat 25°C.
198 P. D. Kalb et al.
but optimal mixing and pouring was limited to mixtures containing 40wt% waste. At 40 wt% waste loading, homogeneity was demonstrated by the close agreement of appar-ent density measurements throughout the waste forms. Performance testing of SPC waste forms included compression, water immersion, and accelerated leaching. Compressive strength for neat Kazakhstan SPC waste forms was about 1.5 times greater than previ-ous data for domestic SPC. The compressive strength of SPC waste forms containing phosphogypsum sand waste was 3,470psi, similar to that of neat SPC forms. Although the compressive strength of the SPC waste forms containing phosphogypsum sand waste was not higher than those of the neat SPC forms and the SPC waste forms containing surrogate, the SPC waste forms containing phosphogypsum sand waste possessed excel-lent mechanical integrity. Waste forms containing 40 wt% waste did not show any dete-rioration under saturated conditions in water immersion. Their compressive strength was also retained after water immersion. Accelerated Leach Testing revealed diffusion is the dominant leaching mechanism and projected leaching for a full size water form (2m in diameter × 2m in height) is <5% after 300 years.
REFERENCES
1. Sullivan T.A. and W.C. Mcbee, “Development and Testing of Superior Sulfur Concretes,” RI-8160,Bureau of Mines, U.S. Dept. of the Interior, Washington, DC, 1976.
2. Mcbee, W.C., T.A. Sullivan, and B.W. Jong, “Modified Sulfur Cements for Use in Concretes, Flexible Pavings, Coatings and Grouts,” RI-8545, Bureau of Mines, U.S. Dept. of the Interior, Washington, DC, 1981.
3. Colombo, P., P.D. Kalb, and J.H. Heiser, “Process for the Encapsulation and Stabilization of Radioac-tive Hazardous and Mixed Wastes,” U.S. Patent No. 5,678,234, Oct. 14, 1997.
4. Kalb P.D. and P. Colombo, “Modified Sulfur Cement Solidification of Low-Level Waste, Topical Report,” BNL-51923, Brookhaven National Laboratory, NY, October 1985.
5. Kalb P.D., J.H. Heiser III, and P. Colombo, “Modified Sulfur Cement Encapsulation of Mixed Waste Contaminated Incineration Fly Ash,” Waste Management Vol. 11, Number 3, pp. 147-153, Pergammon Press, New York, 1991.
6. Adams J.W. and P.D. Kalb, “Thermoplastic Stabilization of a Chloride, Sulfate, and Nitrate Salts Mixed Waste Surrogate,” Proceedings of the I&EC Special Symposium, Emerging Technologies for HazardousWastes, American Chemical Society, Atlanta, GA, September 19-20, 1995.
7. Kalb P.D., J.W. Adams, M.L. Meyer, and H.H. Burns, “Thermoplastic Encapsulation Treatability Study for a Mixed Waste Incinerator Off-Gas Scrubbing Solution,” stabilization and Solidification of Hazardous, Radioactive, and Mixed Wastes, ASTM STP1240. T.M. Gilliam, and C.C. Wiles, eds., American Society for Testing and Materials, Philadelphia, PA, 1995.
8. Kalb P.D., L.W. Milian, A.J. Grebenkov, and S.P. Rutenkroger, “Thermoplastic Process Treatability for Contaminated Hearth Ash from the Republic of Belarus.” Proceedings of the 1996 International Conference on Incineration and Thermal Treatment Technologies, Savannah, GA, May 6–10, 1996.
9. Kalb P.D., J.H. Heiser III, R. Pietrzak, and P. Colombo, “Durability of Incineration Ash Waste Encap-sulated in Modified Sulfur Cement,” Proceedings of the 199 1 Incineration Conference, Knoxville, TN, May 13-17, 1991.
10. U.S. Environmental Protection Agency, “Toxicity Characteristic Leaching Procedure,”40 CFR 261, Fed. Reg. 55, 11863, March 29, 1990.
11. ASTM, “Standard Method of Test for Compressive Strength of Cylindrical Concrete Specimens,” C39-72, American Society for Testing and Materials, Philadelphia, PA, 1975.
12. Fuhrmann M., R.F. Pietrzak, J. Heiser III, E.M. Franz, and P. Colombo, “User’s Guide for the Accel-erated Leach Test Computer Program,” BNL-52267, Brookhaven National Laboratory, Upton, NY,11973, 1990.
13. ASTM, “Standard Method of Test for Accelerated Leach Test for Diffusive Releases from Solidified Waste and a Computer Program to Model Diffusive, Fractional Leaching from Cylindrical Waste Forms,” ASTM C1308-95, American Society for Testing and Materials, West Conshohocken, PA, 1996.
17
ENCAPSULATION OF NITRATE SALTS USINGVINYLMETHYLPOLYSILOXANE
Stephen Duirk and Christopher M. Miller
Department of Civil Engineering 2 10 Auburn Science and Engineering Center University of Akron Akron, Ohio 44325-3905
ABSTRACT
The Department of Energy has an immediate need for multiple technologies to transport and dispose of low level mixed waste. Solidification/stabilization (S/S) processes offer one possible solution that encapsulates sludge and dry hazardous wastes in a low permeability solid form. The advantage of vinylmethylpolysiloxane over other organic solidification processes is its ability to cure at ambient temperature. This paper examined compressive strength, metal leaching, and void area measurements of vinylmethylpolysiloxane-encapsulated waste as a function of waste loading (28-48 wt%) for three surrogate wastes having compositions similar to those found at national laboratories. Compressive strength was greater than 4,390 kPa for all but one sample (48 wt% waste load-High Chloride waste). Image analysis shows void area increases lin-early with increasing waste load, attributed to an increasing total sample volume physi-cally occupied by the waste. Leaching test results indicate metal specific behavior and waste composition effects on Toxicity Characteristic Leaching Procedure (TCLP) con-centrations. Cadmium diffusion from the encapsulated waste is slow (leach index >10 at all waste loads). Cost comparison of vinylmethylpolysiloxane to cement shows that it could be an economical waste disposal alternative.
1. INTRODUCTION
Low level mixed waste (LLMW) resulting from nuclear weapons research and dis-mantling activities is present in large quantities at several Department of Energy (DOE) national labs.1 It is estimated that approximately 82,000m3 of LLMW is currently stored,and an additional 137,000m3 is expected to be generated over the next 20 years. The largest storage facilities are Hanford and Idaho National Engineering Laboratory (INEL)
Emerging Technologies in Hazardous Waste Management 8, edited by Tedder and Pohland Kluwer Academic/Plenum Publishers, New York, 2000. 199
200 S. Duirk and C. M. Miller
which contain 36,000 and 35,000m3 of LLMW, respectively.2 This waste, which containsboth hazardous and low-level radioactive materials, can be extremely toxic to humansand animals.
It is estimated that the federal government will spend between $234 and $289 billion on environmental remediation over the next 75 years at sites owned by the Departments of Defense, Energy, Interior, and Agriculture.3 Encapsulation is one type of solidifica -tion/stabilization (S/S) technique that has been shown to effectively treat many difficult wastes in both liquid and solid form for disposal.4,5 Encapsulation is a nondestructive process that involves mixing waste with reagents to create physical and/or chemical reac-tions.6 S/S processes are designed to reduce leaching and mobility of contaminants, im- prove handling, and decrease the surface area over which loss of contaminants can occur.7
S/S processes can be grouped into inorganic processes (cement and pozzolanic binders) and organic processes (thermoplastic and thermosetting polymer binders). One organic process that has not been evaluated is a vinylmethylpolysiloxane (VMPS) based system, typically referred to as silicone or polysiloxane. Silicone polymers were first devel-oped in 1950.8 The silicon backbone and room temperature cure capability of siliconesmay offer potential advantages for binding hazardous waste because of favorable thermal, chemical, and mechanical properties. Furthermore, it is believed that waste loads greater than traditional solidification technologies could also be achieved.' The purposeof this paper is to present compressive strength, metal leaching, and void area measure- ments as a function of waste loading for three surrogate wastes having compositions similar to those found at national laboratories. One commercial vinylmethylpolysiloxane formulation (GE RTV-664a,b) was examined at variable waste loads (28–48 wt%). Com- pressive strength and heavy metal leaching results should provide insight into the poten-tial and use of polysiloxane as a viable DOE waste management option.
2. EXPERIMENTAL
2.1. Materials and Chemicals
The water used in all experiments was de-ionized with a Barnstead NANOpurewater system. All chemicals used in waste surrogates and reagent solutions were pur-chased through Fisher Scientific (Pittsburgh, PA), GFS Chemicals (Powell, OH), or Aldrich Chemical Co. (Milwaukee, WI). General Electric silicone compound and platinum catalyst (GE RTV-664a,b) were obtained from General Electric Silicones (Waterford, NY).
2.2. Surrogate Waste Compositions
Three surrogate wastes were studied, hereafter referred to as Nitrate Salt (NS), High Nitrate (HN), and High Chloride (HC). Their compositions are shown in Table 1. Thesewastes were modeled after salt materials found at the Idaho National Engineering Lab- oratory.10Surrogates were prepared in one kg batches by crushing and sieving the mate-rial so that it passed a 0.6mm sieve, but was retained on a 0.3mm sieve.
2.3. Encapsulation Procedure
Depending on the selected waste load, various masses of base material VMPS, catalyst (manufacture recommends 10 wt% catalyst to base material), and waste were
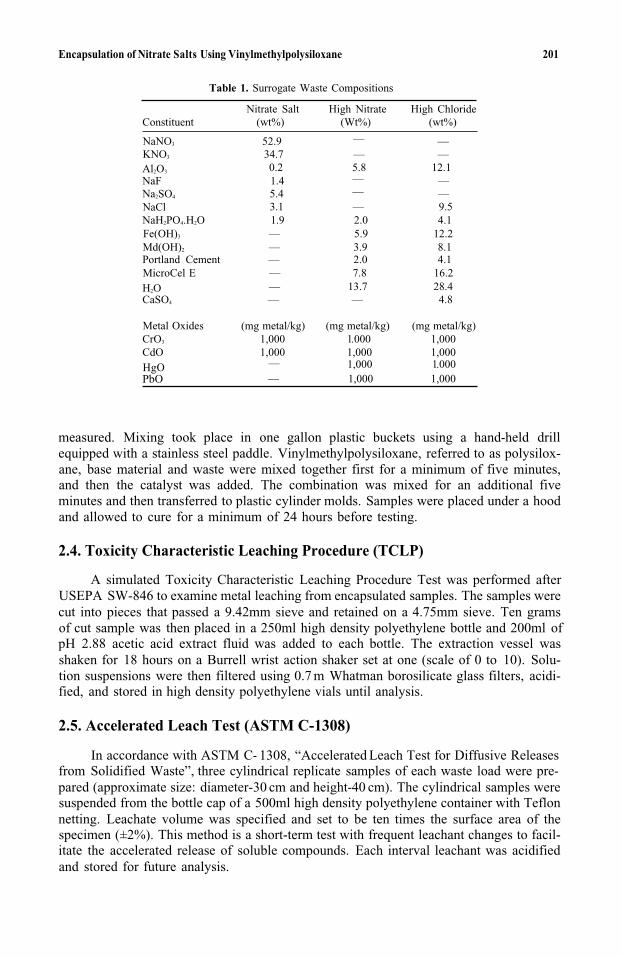
Encapsulation of Nitrate Salts Using Vinylmethylpolysiloxane 201
Table 1. Surrogate Waste Compositions
Nitrate Salt High Nitrate High Chloride Constituent (wt%) (Wt%) (wt%)
NaNO3 52.9 — KNO3 34.7 — — Al2O3 0.2 5.8 12.1 NaF 1.4 —Na2SO4 5.4 —NaCl 3.1 — 9.5 NaH2PO4.H2O 1 .9 2.0 4.1 Fe(OH)3 — 5.9 12.2Md(OH)2 — 3.9 8.1Portland Cement — 2.0 4.1MicroCel E — 7.8 16.2H2O — 13.7 28.4CaSO4 — — 4.8
—
——
Metal Oxides (mg metal/kg) (mg metal/kg) (mg metal/kg) CrO3 1,000 1 .000 1,000 CdO 1,000 1,000 1,000
1,000 1 .000 — 1,000 1,000
HgOPbO
measured. Mixing took place in one gallon plastic buckets using a hand-held drill equipped with a stainless steel paddle. Vinylmethylpolysiloxane, referred to as polysilox-ane, base material and waste were mixed together first for a minimum of five minutes, and then the catalyst was added. The combination was mixed for an additional five minutes and then transferred to plastic cylinder molds. Samples were placed under a hood and allowed to cure for a minimum of 24 hours before testing.
2.4. Toxicity Characteristic Leaching Procedure (TCLP)
A simulated Toxicity Characteristic Leaching Procedure Test was performed afterUSEPA SW-846 to examine metal leaching from encapsulated samples. The samples werecut into pieces that passed a 9.42mm sieve and retained on a 4.75mm sieve. Ten grams of cut sample was then placed in a 250ml high density polyethylene bottle and 200ml of pH 2.88 acetic acid extract fluid was added to each bottle. The extraction vessel was shaken for 18 hours on a Burrell wrist action shaker set at one (scale of 0 to 10). Solu- tion suspensions were then filtered using 0.7 m Whatman borosilicate glass filters, acidi- fied, and stored in high density polyethylene vials until analysis.
2.5. Accelerated Leach Test (ASTM C-1308)
In accordance with ASTM C- 1308, “Accelerated Leach Test for Diffusive Releasesfrom Solidified Waste”, three cylindrical replicate samples of each waste load were pre-pared (approximate size: diameter-30 cm and height-40 cm). The cylindrical samples were suspended from the bottle cap of a 500ml high density polyethylene container with Teflon netting. Leachate volume was specified and set to be ten times the surface area of the specimen (±2%). This method is a short-term test with frequent leachant changes to facil- itate the accelerated release of soluble compounds. Each interval leachant was acidified and stored for future analysis.
—
202 S. Duirk and C. M. Miller
2.6. Analytical Methods
Compressive strength was conducted according to ASTM D-695. Cylindrical samples with a 1 : 2 (diameter:height) aspect ratio were smoothed if necessary with a scrollsaw and then placed in a Geotest instrument with a 906 kg rated loadcell. The load was applied until the sample failed or the maximum load was achieved. TCLP and Acceler-ated Leach Test metal samples were analyzed using a Perkin Elmer Plasma 400 induc-tively coupled plasma atomic emission spectrometer (ICP-AES) with manufacturer recommended wavelengths for each metal. Image analysis was used to determine encap-sulated sample void area (due to both gas generation during curing and waste occupa-tion). Three samples from a cylindrical specimen (top, middle, and bottom third of cylinder) were cut, briefly exposed to water to dissolve waste particles, and then allowed to dry prior to analysis. Sample images were captured using an Olympus SZH10 stereo microscope with a magnification of 8.75 and analyzed using Optimas version 6.1 image analysis software. All pH measurements were done with an Accument Basic pH meter after appropriate calibration.
3. RESULTS AND DISCUSSION
3.1. Compressive Strength
Compressive strength was measured to determine the mechanical integrity of the solidified waste form. Table 2 shows compressive strength results for each waste and the corresponding waste loads. The NS waste was tested at 28, 38, and 48 wt% waste load. NS waste encapsulated samples exceeded the maximum load of the testing apparatus,corresponding to a compressive strength greater than 4,390 kPa for all waste loads. HN and HC wastes were tested at waste loading of 28 and 48 wt%. HN encapsulated waste behaved similar to the NS and exceeded the maximum load of the testing apparatus. HC waste also surpassed the capacity of the testing apparatus at 28 wt% waste load, however, at 48 wt%, the specimen failed at 2,830 kPa. Therefore, HC encapsulated waste exhibited a decrease in strength with increasing waste load. This behavior is not completely unex-pected with increasing waste load because the polymer system becomes more waste-like(i.e. brittle) resulting in reduced compressive load bearing capacity.
3.2. Image Analysis
Image analysis was performed on all three wastes to determine void area as a func-tion of waste load. The NS waste was examined at 28, 38, and 48 wt% waste load while
Table 2. Compressive Strength as a Function of Waste Load
Waste Waste Load (wt%) Compressive Strength (kPa)
Nitrate Salt 28 >4,39038 >9,39048 >9,390
High Nitrate 28 >9,39048 >4,390
High Chloride 28 >4,390 48 2,830
Encapsulation of Nitrate Salts Using Vinylmethylpolysiloxane 203
Table 3. Void Area Analysis as a Function of Waste Load
Sample
Waste Type Waste Load (wt%) 1 2 3 Avg. ± STD Dev.
Nitrate Salt 28 14.2% 14.9% 13.9% 14.3 ±0.51%)38 17,1% 17.5% 17.7% 17.4±0.31%48 22.3% 22.4% 21.3% 22.0 ± 0.61%
High Nitrate 28 18.6% 16.2% 16.4% 17.1 ± 1.3%48 22.1% 22.7% 20.2% 21.7 ± 1.3%
High Chloride 28 16.7% 21.9% 24.3% 21.0 ± 3.9%48 18.8% 2 1.0% 12.6% 17.5 ±4.4%
the HN and HC wastes were examined at 28 and 48% waste load. The NS and HN wastesexhibited increasing void area with increasing waste load (Table 3). This trend is expected because increasing waste load results in a higher percentage of volume physically occu-pied by the waste. The HC waste, however, did not show any statistically significant difference for the two waste loads. HC waste was difficult to mix resulting in a non-homo-geneous sample and highly variable measurements (Table 3). Image analysis of all samples also indicated that the waste is physically captured and not chemically bound by the polysiloxane.10
3.3. Heavy Metal Leaching
TCLP for NS, HN, and HC wastes was performed to evaluate heavy metal leach- ing from the encapsulated waste form. The NS waste was examined for leaching of cadmium and chromium at 28, 38, and 48 wt% waste load. Increasing waste load from 28 to 48wt% increased cadmium leaching from 1.97mg/L to 3.27mg/L and chromium from 1.87mg/L to 4.14mg/L (Table 4). The increase in metal concentration for both cadmium and chromium is approximately proportional to waste load.
TCLP tests were also used to determine the observed diffusion behavior of cadmium from NS encapsulated waste as a function of waste load. Samples were taken at 0.08 (5 minutes), 1, 4, 8, and 18 hours. The five minute sample was taken to measureinstantaneous dissolution of the waste exposed by the cut surface. Soluble cadmium con-centrations were converted to cumulative fraction leached (CFL) for each time intervaland plotted versus the square root of time (Fig. 1). The linearity of Fig. 1 indicates trans-port controlled dissolution of cadmium.11 Depending on waste load, approximately 5-7%(i.e. CFL) of the total 13-15%leached in the first five minutes. Therefore, instantaneous
Table 4. TCLP Results as a Function of Waste Load
Metal (mg/l)Waste Load Waste (wt%) Cd Cr Hg Pb
Nitrate Salt 28 1.97 1.87 38 2.45 3.01 — ó48 3.21 4.14 — —
High Nitrate 28 0.30 0.34 ND* ND*48 0.05 1.26 0.05 ND*
High Chloride 28 0.69 0.47 0.01 ND*48 0.18 0.64 0.01 ND*
— —
ND*: Below detection limits (<0.01 mg/L).
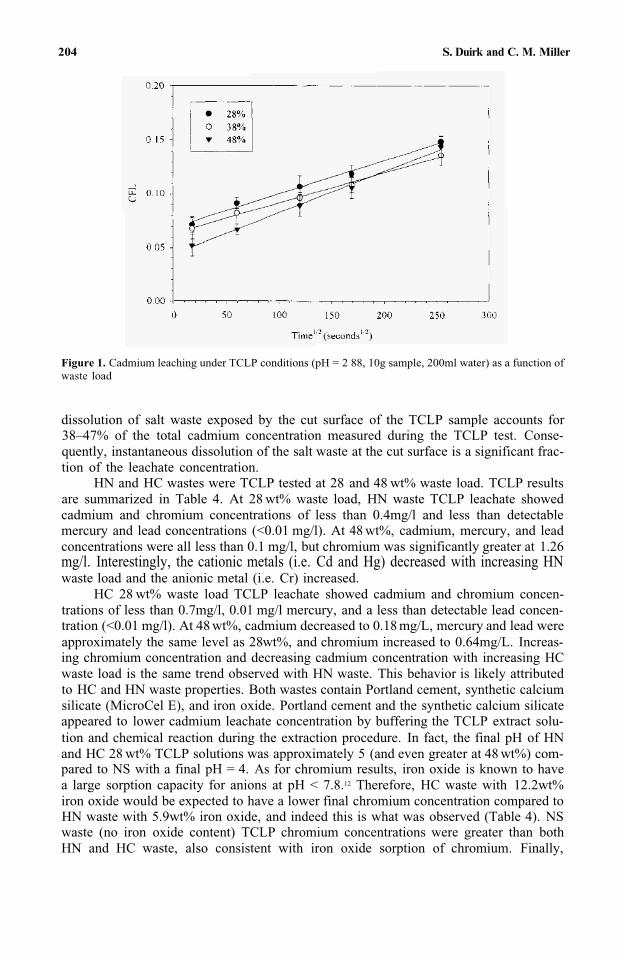
204 S. Duirk and C. M. Miller
Figure 1. Cadmium leaching under TCLP conditions (pH = 2 88, 10g sample, 200ml water) as a function ofwaste load
dissolution of salt waste exposed by the cut surface of the TCLP sample accounts for 38–47% of the total cadmium concentration measured during the TCLP test. Conse-quently, instantaneous dissolution of the salt waste at the cut surface is a significant frac- tion of the leachate concentration.
HN and HC wastes were TCLP tested at 28 and 48 wt% waste load. TCLP results are summarized in Table 4. At 28 wt% waste load, HN waste TCLP leachate showed cadmium and chromium concentrations of less than 0.4mg/l and less than detectable mercury and lead concentrations (<0.01 mg/l). At 48 wt%, cadmium, mercury, and lead concentrations were all less than 0.1 mg/l, but chromium was significantly greater at 1.26mg/l. Interestingly, the cationic metals (i.e. Cd and Hg) decreased with increasing HNwaste load and the anionic metal (i.e. Cr) increased.
HC 28 wt% waste load TCLP leachate showed cadmium and chromium concen- trations of less than 0.7mg/l, 0.01 mg/l mercury, and a less than detectable lead concen-tration (<0.01 mg/l). At 48 wt%, cadmium decreased to 0.18 mg/L, mercury and lead were approximately the same level as 28 wt%, and chromium increased to 0.64mg/L. Increas-ing chromium concentration and decreasing cadmium concentration with increasing HCwaste load is the same trend observed with HN waste. This behavior is likely attributed to HC and HN waste properties. Both wastes contain Portland cement, synthetic calcium silicate (MicroCel E), and iron oxide. Portland cement and the synthetic calcium silicate appeared to lower cadmium leachate concentration by buffering the TCLP extract solu-tion and chemical reaction during the extraction procedure. In fact, the final pH of HN and HC 28 wt% TCLP solutions was approximately 5 (and even greater at 48 wt%) com- pared to NS with a final pH = 4. As for chromium results, iron oxide is known to have a large sorption capacity for anions at pH < 7.8.12 Therefore, HC waste with 12.2wt% iron oxide would be expected to have a lower final chromium concentration compared to HN waste with 5.9wt% iron oxide, and indeed this is what was observed (Table 4). NS waste (no iron oxide content) TCLP chromium concentrations were greater than both HN and HC waste, also consistent with iron oxide sorption of chromium. Finally,
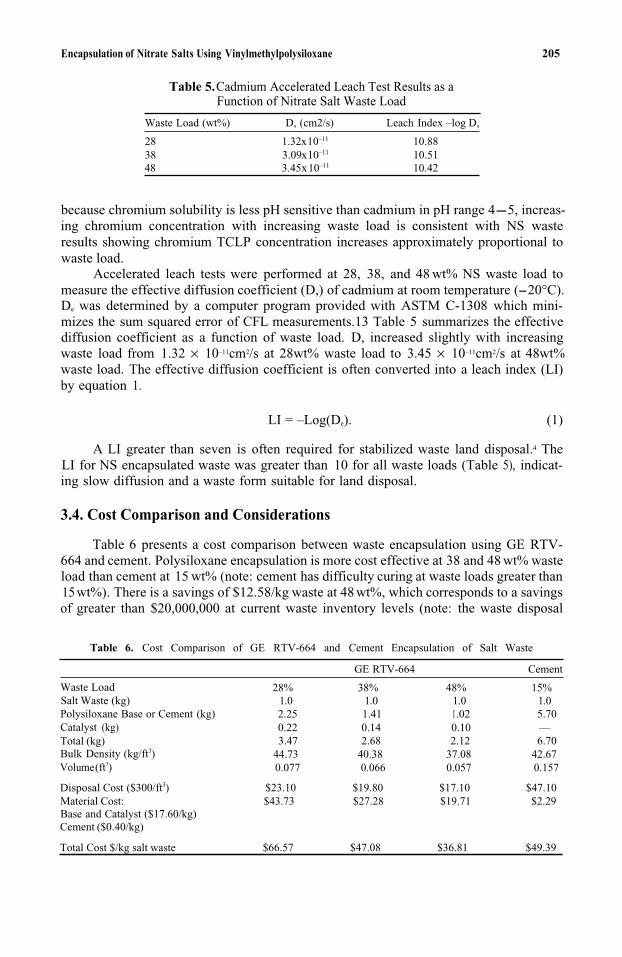
Encapsulation of Nitrate Salts Using Vinylmethylpolysiloxane 205
Table 5. Cadmium Accelerated Leach Test Results as a Function of Nitrate Salt Waste Load
Waste Load (wt%) D, (cm2/s) Leach Index –log D,
28 1.32x10⁻¹¹ 10.8838 3.09x10⁻¹¹ 10.5148 3.45x10⁻¹¹ 10.42
because chromium solubility is less pH sensitive than cadmium in pH range 4-5, increas-ing chromium concentration with increasing waste load is consistent with NS wasteresults showing chromium TCLP concentration increases approximately proportional to waste load.
Accelerated leach tests were performed at 28, 38, and 48 wt% NS waste load to measure the effective diffusion coefficient (D,) of cadmium at room temperature (--20°C). De was determined by a computer program provided with ASTM C-1308 which mini-mizes the sum squared error of CFL measurements.13 Table 5 summarizes the effectivediffusion coefficient as a function of waste load. D, increased slightly with increasing waste load from 1.32 × 10⁻¹¹cm2/s at 28wt% waste load to 3.45 × 10⁻¹¹cm2/s at 48wt%waste load. The effective diffusion coefficient is often converted into a leach index (LI)by equation 1.
LI = –Log(De). (1)
A LI greater than seven is often required for stabilized waste land disposal.4 TheLI for NS encapsulated waste was greater than 10 for all waste loads (Table 5), indicat-ing slow diffusion and a waste form suitable for land disposal.
3.4. Cost Comparison and Considerations
Table 6 presents a cost comparison between waste encapsulation using GE RTV-664 and cement. Polysiloxane encapsulation is more cost effective at 38 and 48 wt% wasteload than cement at 15 wt% (note: cement has difficulty curing at waste loads greater than 15wt%). There is a savings of $12.58/kg waste at 48 wt%, which corresponds to a savings of greater than $20,000,000 at current waste inventory levels (note: the waste disposal
Table 6. Cost Comparison of GE RTV-664 and Cement Encapsulation of Salt Waste
GE RTV-664 Cement
Waste Load 28% 38% 48% 15% Salt Waste (kg) 1 .0 1 .0 1 .0 1 .0 Polysiloxane Base or Cement (kg) 2.25 1.41 I .02 5.70Catalyst (kg) 0.22 0.14 0.10 —Total (kg) 3.47 2.68 2.12 6.70Bulk Density (kg/ft3) 44.73 40.38 37.08 42.67Volume(ft3) 0.077 0.066 0.057 0.157
Disposal Cost ($300/ft3) $23.10 $19.80 $17.10 $47.10 Material Cost: $43.73 $27.28 $19.71 $2.29Base and Catalyst ($17.60/kg)Cement ($0.40/kg)
Total Cost $/kg salt waste $66.57 $47.08 $36.81 $49.39
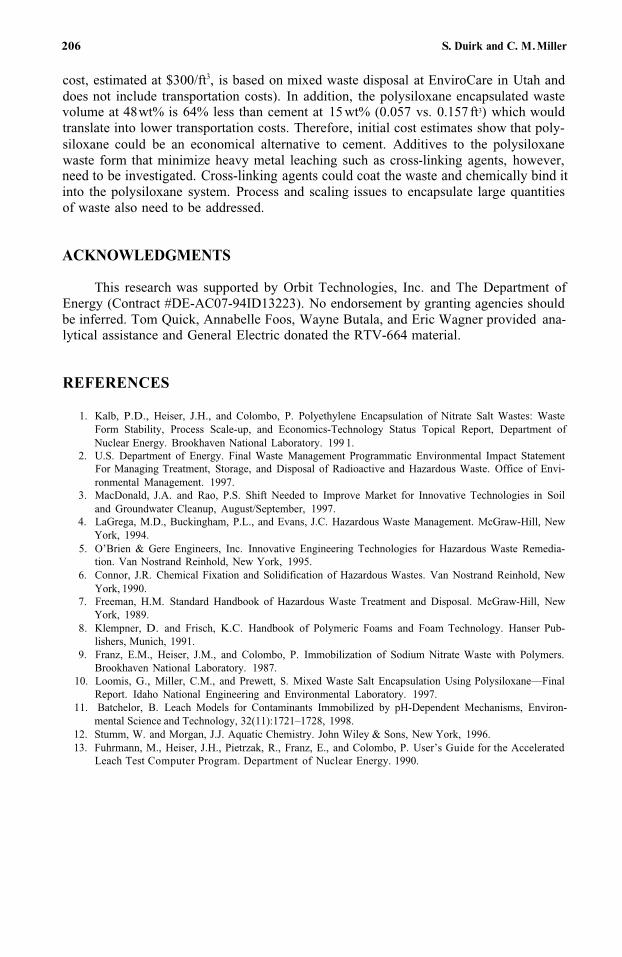
206 S. Duirk and C. M. Miller
cost, estimated at $300/ft3, is based on mixed waste disposal at EnviroCare in Utah and does not include transportation costs). In addition, the polysiloxane encapsulated wastevolume at 48wt% is 64% less than cement at 15 wt% (0.057 vs. 0.157 ft3) which wouldtranslate into lower transportation costs. Therefore, initial cost estimates show that poly-siloxane could be an economical alternative to cement. Additives to the polysiloxane waste form that minimize heavy metal leaching such as cross-linking agents, however, need to be investigated. Cross-linking agents could coat the waste and chemically bind itinto the polysiloxane system. Process and scaling issues to encapsulate large quantities of waste also need to be addressed.
ACKNOWLEDGMENTS
This research was supported by Orbit Technologies, Inc. and The Department of Energy (Contract #DE-AC07-94ID13223). No endorsement by granting agencies should be inferred. Tom Quick, Annabelle Foos, Wayne Butala, and Eric Wagner provided ana-lytical assistance and General Electric donated the RTV-664 material.
REFERENCES
1. Kalb, P.D., Heiser, J.H., and Colombo, P. Polyethylene Encapsulation of Nitrate Salt Wastes: Waste Form Stability, Process Scale-up, and Economics-Technology Status Topical Report, Department of Nuclear Energy. Brookhaven National Laboratory. 199 1.
2. U.S. Department of Energy. Final Waste Management Programmatic Environmental Impact Statement For Managing Treatment, Storage, and Disposal of Radioactive and Hazardous Waste. Office of Envi-ronmental Management. 1997.
3. MacDonald, J.A. and Rao, P.S. Shift Needed to Improve Market for Innovative Technologies in Soil and Groundwater Cleanup, August/September, 1997.
4. LaGrega, M.D., Buckingham, P.L., and Evans, J.C. Hazardous Waste Management. McGraw-Hill, New York, 1994.
5. O’Brien & Gere Engineers, Inc. Innovative Engineering Technologies for Hazardous Waste Remedia-tion. Van Nostrand Reinhold, New York, 1995.
6. Connor, J.R. Chemical Fixation and Solidification of Hazardous Wastes. Van Nostrand Reinhold, New York, 1990.
7. Freeman, H.M. Standard Handbook of Hazardous Waste Treatment and Disposal. McGraw-Hill, New York, 1989.
8. Klempner, D. and Frisch, K.C. Handbook of Polymeric Foams and Foam Technology. Hanser Pub-lishers, Munich, 1991.
9. Franz, E.M., Heiser, J.M., and Colombo, P. Immobilization of Sodium Nitrate Waste with Polymers. Brookhaven National Laboratory. 1987.
10. Loomis, G., Miller, C.M., and Prewett, S. Mixed Waste Salt Encapsulation Using Polysiloxane—Final Report. Idaho National Engineering and Environmental Laboratory. 1997.
11. Batchelor, B. Leach Models for Contaminants Immobilized by pH-Dependent Mechanisms, Environ-mental Science and Technology, 32(11):1721–1728, 1998.
12. Stumm, W. and Morgan, J.J. Aquatic Chemistry. John Wiley & Sons, New York, 1996. 13. Fuhrmann, M., Heiser, J.H., Pietrzak, R., Franz, E., and Colombo, P. User’s Guide for the Accelerated
Leach Test Computer Program. Department of Nuclear Energy. 1990.
18
DEVELOPMENT OF AN ON-LINEANALYZER FOR VANADOUS IONIN LOMI DECONTAMINATION
Sherman Kottle1, Robert A. Stowe2, and John V. Bishop1
1Lake Service Company Lake Jackson, Texas
2VanTek CorporationMidland, Michigan
ABSTRACT
An automatic, repetitive titrimeter was developed for the determination of vanadous ion concentration during chemical decontamination of nuclear power plants by means of the LOMI method. The LOMI (an acronym for low oxidation state, metal ion) treatment is used during refueling shut-downs to reduce the exposure of plant personnel to radiation by removing radioactive deposits which have accumulated inpumps and piping. A dilute aqueous mixture of vanadous formate and picolinic acid (2-pyridine carboxylic acid) reduces, complexes, and dissolves oxide deposits which contain radioisotopes which were produced by neutron activation of the products of corrosion and wear. The titrimeter makes it possible to follow depletion of the V(II) concentrationas the process proceeds. The instrument automatically withdraws samples of the circu-lating chemicals, performs a titration with Fe(III), and determines the end point by means of oxidation-reduction electrodes. Means were found to secure rapid and meaningful elec-trode response. That made it possible to design and assemble an instrument which wassuccessful in laboratory simulations and field use.
INTRODUCTION
In nuclear power plants, mechanical wear and corrosion liberate small quantities of metals into the heat transfer system which become radioactive as the result of neutronabsorption. The radioisotopes so formed become part of a refractory layer of metal oxides on the inner surfaces of the stainless steel pipes and pumps. They produce aradiation field external to the equipment which must be minimized in order to minimize radiation exposure to plant workers. The radiation field is a major cost factor as well as
Emerging Technologies in Hazardous Waste Management 8, edited by Tedder and PohlandKluwer Academic/Plenum Publishers, New York, 2000 207
208 S. Kottle et al.
a safety factor because it limits the working time permitted to operating personnel. It has become widely accepted to remove the radioactivity by chemical means during scheduled refueling shut-downs. The removed material is then concentrated by means of ion exchange to minimize the volume of radioactive waste for disposal. The importance of radiation field control and decontamination techniques has made it the subject of a series of conferences which are sponsored by EPRI (Electric Power Research Institute) and which are reported upon in a series of monographs available from them.'
One of the decontamination procedures which is widely used is the LOMI (acronym for low oxidation state, metal ion) process, in which a dilute aqueous mixture of vanadousformate and picolinic acid (2-pyridinecarboxylic acid) is circulated at elevated temperature through the system which is to be cleaned.2 The coating which must be dissolved is com-posed primarily of iron, chromium, and nickel oxides, and their mixed oxides. It is desired to use chemicals for cleaning which are not aggressive to the materials of construction, yet will dissolve this very insoluble coating and the accompanying radioactive species. This is accomplished by a dilute mixture of vanadous formate and picolinic acid through a process of reduction and chelation. The dissolved metals are subsequently removed from the circulating solution for disposal by means of cation and anion resin beds.
The operators follow the course of the process by laboratory analysis of sampleswithdrawn from the circulating chemicals. The radioactivity and metals are assayed by scintillation spectroscopy and ICP spectrometry, respectively. There has been no rapid, convenient way for the operating personnel to monitor the vanadous ion concentration to insure that cessation of corrosion product and radioactivity removal is the result of successful completion of the cleaning process and is not the result of depletion of thereducing agent.
The laboratory method employed commercially for the analysis of vanadous formate solution relies on redox titration with visual end point detection.3 Analysisfor V(II) in decontamination is made difficult by the low concentration, in the range 0–500ppm, and its reactivity with atmospheric oxygen, which makes securing samples and transporting them to the laboratory difficult.
The vanadous picolinate complex exhibits a molar absorbance of 3,800 M–1 cm–1 at660nm, which is more than adequate for colorimetric analysis in the LOMI rangeof 0–0.010M.4
We studied direct photometric measurement of the complex and foundexcellent analytical sensitivity. A prototype on-line colorimeter was evaluated at a nuclear plant. It was found not to be effective because of excessive interference by light-absorbing material of extremely small particle size which was present in the system.5
In the present work, we elected to take advantage of the strong reducing action of the V(II). We considered both direct measurement of the redox potential and the use ofa redox titration. Noble metal oxidation-reduction electrodes have been shown to be responsive to the vanadous picolinate complex, but electrode equilibration in LOMI solu-tions was found to require up to 40 minutes in the absence of iron and 5-10minuteswhen iron was present.6 Our preliminary tests showed that equilibration was slow and the potentials were not entirely stable. It was necessary to overcome those limitations to make an online instrument successful.
EXPERIMENTAL PROCEDURES
The laboratory apparatus which was employed is illustrated in Fig. 1. Experimentswere carried out in a closed, cylindrical vessel of 100 ml volume which was fabricated
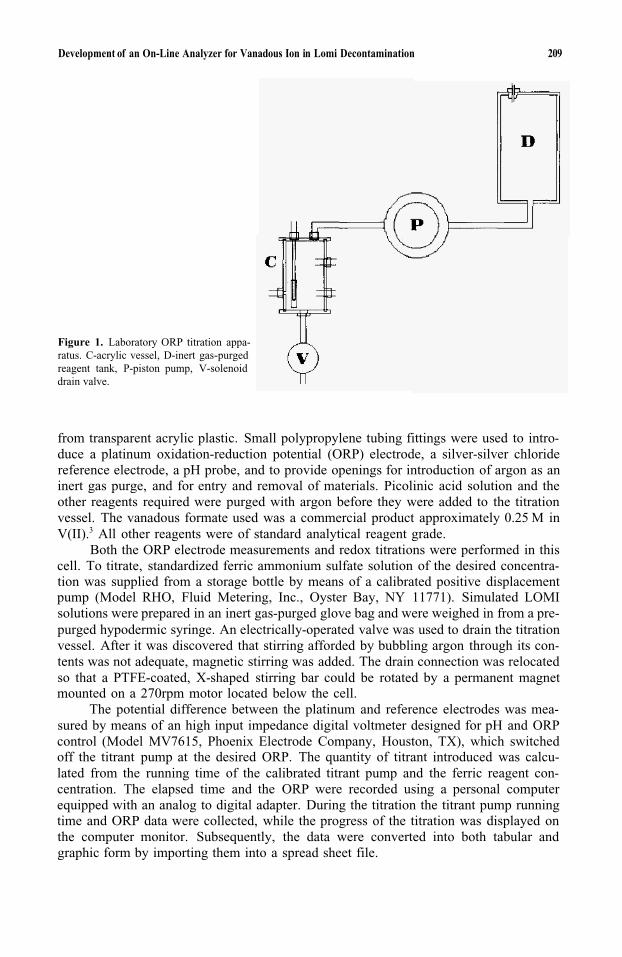
Development of an On-Line Analyzer for Vanadous Ion in Lomi Decontamination 209
Figure 1. Laboratory ORP titration appa-ratus. C-acrylic vessel, D-inert gas-purgedreagent tank, P-piston pump, V-solenoiddrain valve.
from transparent acrylic plastic. Small polypropylene tubing fittings were used to intro-duce a platinum oxidation-reduction potential (ORP) electrode, a silver-silver chloride reference electrode, a pH probe, and to provide openings for introduction of argon as an inert gas purge, and for entry and removal of materials. Picolinic acid solution and the other reagents required were purged with argon before they were added to the titration vessel. The vanadous formate used was a commercial product approximately 0.25 M inV(II).3 All other reagents were of standard analytical reagent grade.
Both the ORP electrode measurements and redox titrations were performed in this cell. To titrate, standardized ferric ammonium sulfate solution of the desired concentra-tion was supplied from a storage bottle by means of a calibrated positive displacement pump (Model RHO, Fluid Metering, Inc., Oyster Bay, NY 11771). Simulated LOMIsolutions were prepared in an inert gas-purged glove bag and were weighed in from a pre-purged hypodermic syringe. An electrically-operated valve was used to drain the titration vessel. After it was discovered that stirring afforded by bubbling argon through its con-tents was not adequate, magnetic stirring was added. The drain connection was relocated so that a PTFE-coated, X-shaped stirring bar could be rotated by a permanent magnet mounted on a 270rpm motor located below the cell.
The potential difference between the platinum and reference electrodes was mea-sured by means of an high input impedance digital voltmeter designed for pH and ORPcontrol (Model MV7615, Phoenix Electrode Company, Houston, TX), which switched off the titrant pump at the desired ORP. The quantity of titrant introduced was calcu-lated from the running time of the calibrated titrant pump and the ferric reagent con-centration. The elapsed time and the ORP were recorded using a personal computer equipped with an analog to digital adapter. During the titration the titrant pump running time and ORP data were collected, while the progress of the titration was displayed on the computer monitor. Subsequently, the data were converted into both tabular and graphic form by importing them into a spread sheet file.
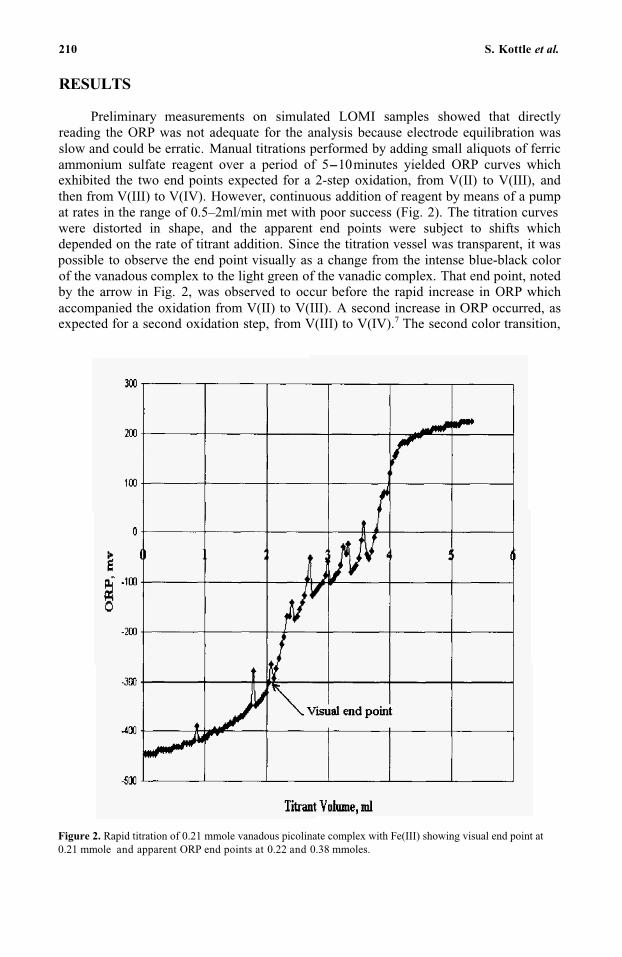
210 S. Kottle et al.
RESULTS
Preliminary measurements on simulated LOMI samples showed that directly reading the ORP was not adequate for the analysis because electrode equilibration was slow and could be erratic. Manual titrations performed by adding small aliquots of ferric ammonium sulfate reagent over a period of 5-10minutes yielded ORP curves which exhibited the two end points expected for a 2-step oxidation, from V(II) to V(III), andthen from V(III) to V(IV). However, continuous addition of reagent by means of a pump at rates in the range of 0.5–2ml/min met with poor success (Fig. 2). The titration curveswere distorted in shape, and the apparent end points were subject to shifts which depended on the rate of titrant addition. Since the titration vessel was transparent, it was possible to observe the end point visually as a change from the intense blue-black color of the vanadous complex to the light green of the vanadic complex. That end point, noted by the arrow in Fig. 2, was observed to occur before the rapid increase in ORP whichaccompanied the oxidation from V(II) to V(III). A second increase in ORP occurred, asexpected for a second oxidation step, from V(III) to V(IV).7 The second color transition,
Figure 2. Rapid titration of 0.21 mmole vanadous picolinate complex with Fe(III) showing visual end point at0.21 mmole and apparent ORP end points at 0.22 and 0.38 mmoles.
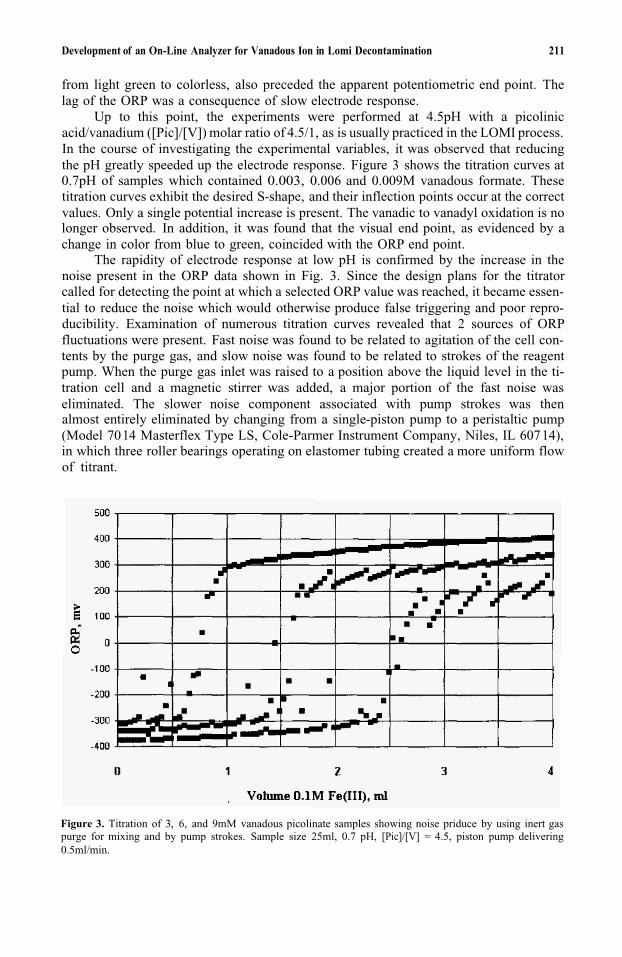
Development of an On-Line Analyzer for Vanadous Ion in Lomi Decontamination 211
from light green to colorless, also preceded the apparent potentiometric end point. The lag of the ORP was a consequence of slow electrode response.
Up to this point, the experiments were performed at 4.5pH with a picolinic acid/vanadium ([Pic]/[V]) molar ratio of 4.5/1, as is usually practiced in the LOMI process.In the course of investigating the experimental variables, it was observed that reducing the pH greatly speeded up the electrode response. Figure 3 shows the titration curves at 0.7pH of samples which contained 0.003, 0.006 and 0.009M vanadous formate. These titration curves exhibit the desired S-shape, and their inflection points occur at the correct values. Only a single potential increase is present. The vanadic to vanadyl oxidation is no longer observed. In addition, it was found that the visual end point, as evidenced by achange in color from blue to green, coincided with the ORP end point.
The rapidity of electrode response at low pH is confirmed by the increase in the noise present in the ORP data shown in Fig. 3. Since the design plans for the titrator called for detecting the point at which a selected ORP value was reached, it became essen-tial to reduce the noise which would otherwise produce false triggering and poor repro-ducibility. Examination of numerous titration curves revealed that 2 sources of ORPfluctuations were present. Fast noise was found to be related to agitation of the cell con-tents by the purge gas, and slow noise was found to be related to strokes of the reagent pump. When the purge gas inlet was raised to a position above the liquid level in the ti- tration cell and a magnetic stirrer was added, a major portion of the fast noise was eliminated. The slower noise component associated with pump strokes was then almost entirely eliminated by changing from a single-piston pump to a peristaltic pump (Model 7014 Masterflex Type LS, Cole-Parmer Instrument Company, Niles, IL 607 14), in which three roller bearings operating on elastomer tubing created a more uniform flow of titrant.
Figure 3. Titration of 3, 6, and 9mM vanadous picolinate samples showing noise priduce by using inert gaspurge for mixing and by pump strokes. Sample size 25ml, 0.7 pH, [Pic]/[V] = 4.5, piston pump delivering 0.5ml/min.
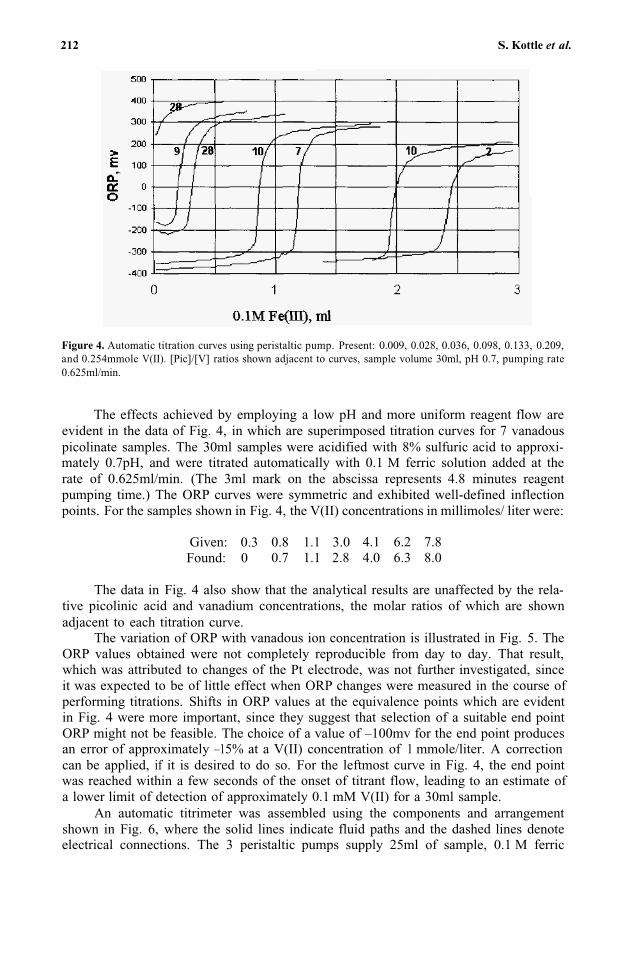
212 S. Kottle et al.
Figure 4. Automatic titration curves using peristaltic pump. Present: 0.009, 0.028, 0.036, 0.098, 0.133, 0.209,and 0.254mmole V(II). [Pic]/[V] ratios shown adjacent to curves, sample volume 30ml, pH 0.7, pumping rate 0.625ml/min.
The effects achieved by employing a low pH and more uniform reagent flow are evident in the data of Fig. 4, in which are superimposed titration curves for 7 vanadouspicolinate samples. The 30ml samples were acidified with 8% sulfuric acid to approxi-mately 0.7pH, and were titrated automatically with 0.1 M ferric solution added at the rate of 0.625ml/min. (The 3ml mark on the abscissa represents 4.8 minutes reagent pumping time.) The ORP curves were symmetric and exhibited well-defined inflection points. For the samples shown in Fig. 4, the V(II) concentrations in millimoles/ liter were:
Given: 0.3 0.8 1.1 3.0 4.1 6.2 7.8Found: 0 0.7 1.1 2.8 4.0 6.3 8.0
The data in Fig. 4 also show that the analytical results are unaffected by the rela-tive picolinic acid and vanadium concentrations, the molar ratios of which are shown adjacent to each titration curve.
The variation of ORP with vanadous ion concentration is illustrated in Fig. 5. TheORP values obtained were not completely reproducible from day to day. That result, which was attributed to changes of the Pt electrode, was not further investigated, since it was expected to be of little effect when ORP changes were measured in the course of performing titrations. Shifts in ORP values at the equivalence points which are evident in Fig. 4 were more important, since they suggest that selection of a suitable end point ORP might not be feasible. The choice of a value of –100mv for the end point produces an error of approximately –15% at a V(II) concentration of 1 mmole/liter. A correctioncan be applied, if it is desired to do so. For the leftmost curve in Fig. 4, the end point was reached within a few seconds of the onset of titrant flow, leading to an estimate ofa lower limit of detection of approximately 0.1 mM V(II) for a 30ml sample.
An automatic titrimeter was assembled using the components and arrangement shown in Fig. 6, where the solid lines indicate fluid paths and the dashed lines denoteelectrical connections. The 3 peristaltic pumps supply 25ml of sample, 0.1 M ferric
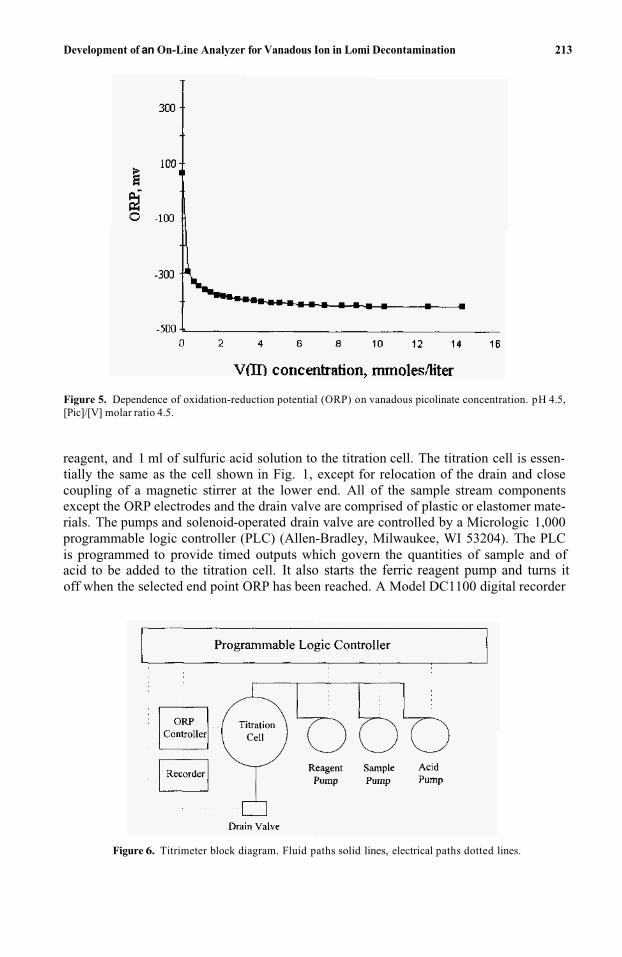
Development of an On-Line Analyzer for Vanadous Ion in Lomi Decontamination 213
Figure 5. Dependence of oxidation-reduction potential (ORP) on vanadous picolinate concentration. pH 4.5,[Pic]/[V] molar ratio 4.5.
reagent, and 1 ml of sulfuric acid solution to the titration cell. The titration cell is essen-tially the same as the cell shown in Fig. 1, except for relocation of the drain and close coupling of a magnetic stirrer at the lower end. All of the sample stream components except the ORP electrodes and the drain valve are comprised of plastic or elastomer mate-rials. The pumps and solenoid-operated drain valve are controlled by a Micrologic 1,000 programmable logic controller (PLC) (Allen-Bradley, Milwaukee, WI 53204). The PLC is programmed to provide timed outputs which govern the quantities of sample and ofacid to be added to the titration cell. It also starts the ferric reagent pump and turns itoff when the selected end point ORP has been reached. A Model DC1100 digital recorder
Figure 6. Titrimeter block diagram. Fluid paths solid lines, electrical paths dotted lines.
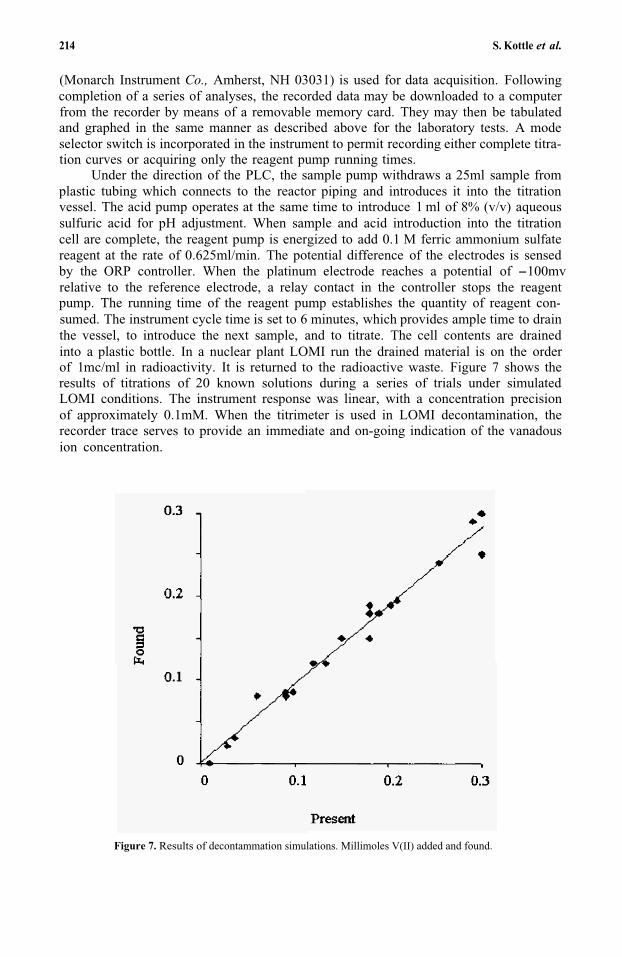
214 S. Kottle et al.
(Monarch Instrument Co., Amherst, NH 03031) is used for data acquisition. Following completion of a series of analyses, the recorded data may be downloaded to a computer from the recorder by means of a removable memory card. They may then be tabulated and graphed in the same manner as described above for the laboratory tests. A modeselector switch is incorporated in the instrument to permit recording either complete titra-tion curves or acquiring only the reagent pump running times.
Under the direction of the PLC, the sample pump withdraws a 25ml sample from plastic tubing which connects to the reactor piping and introduces it into the titrationvessel. The acid pump operates at the same time to introduce 1 ml of 8% (v/v) aqueous sulfuric acid for pH adjustment. When sample and acid introduction into the titration cell are complete, the reagent pump is energized to add 0.1 M ferric ammonium sulfate reagent at the rate of 0.625ml/min. The potential difference of the electrodes is sensed by the ORP controller. When the platinum electrode reaches a potential of -100mvrelative to the reference electrode, a relay contact in the controller stops the reagent pump. The running time of the reagent pump establishes the quantity of reagent con-sumed. The instrument cycle time is set to 6 minutes, which provides ample time to drain the vessel, to introduce the next sample, and to titrate. The cell contents are drainedinto a plastic bottle. In a nuclear plant LOMI run the drained material is on the order of 1mc/ml in radioactivity. It is returned to the radioactive waste. Figure 7 shows the results of titrations of 20 known solutions during a series of trials under simulated LOMI conditions. The instrument response was linear, with a concentration precision of approximately 0.1mM. When the titrimeter is used in LOMI decontamination, the recorder trace serves to provide an immediate and on-going indication of the vanadous ion concentration.
Figure 7. Results of decontammation simulations. Millimoles V(II) added and found.
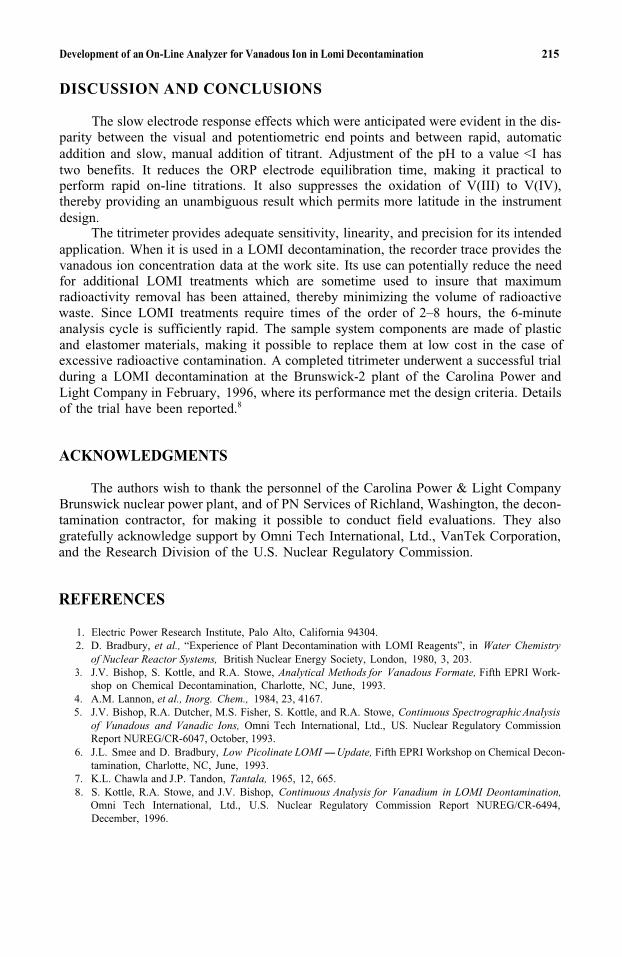
Development of an On-Line Analyzer for Vanadous Ion in Lomi Decontamination 215
DISCUSSION AND CONCLUSIONS
The slow electrode response effects which were anticipated were evident in the dis-parity between the visual and potentiometric end points and between rapid, automatic addition and slow, manual addition of titrant. Adjustment of the pH to a value <I hastwo benefits. It reduces the ORP electrode equilibration time, making it practical to perform rapid on-line titrations. It also suppresses the oxidation of V(III) to V(IV),thereby providing an unambiguous result which permits more latitude in the instrument design.
The titrimeter provides adequate sensitivity, linearity, and precision for its intended application. When it is used in a LOMI decontamination, the recorder trace provides the vanadous ion concentration data at the work site. Its use can potentially reduce the need for additional LOMI treatments which are sometime used to insure that maximum radioactivity removal has been attained, thereby minimizing the volume of radioactivewaste. Since LOMI treatments require times of the order of 2–8 hours, the 6-minute analysis cycle is sufficiently rapid. The sample system components are made of plasticand elastomer materials, making it possible to replace them at low cost in the case of excessive radioactive contamination. A completed titrimeter underwent a successful trial during a LOMI decontamination at the Brunswick-2 plant of the Carolina Power and Light Company in February, 1996, where its performance met the design criteria. Details of the trial have been reported.8
ACKNOWLEDGMENTS
The authors wish to thank the personnel of the Carolina Power & Light Company Brunswick nuclear power plant, and of PN Services of Richland, Washington, the decon- tamination contractor, for making it possible to conduct field evaluations. They also gratefully acknowledge support by Omni Tech International, Ltd., VanTek Corporation, and the Research Division of the U.S. Nuclear Regulatory Commission.
REFERENCES
1. Electric Power Research Institute, Palo Alto, California 94304. 2. D. Bradbury, et al., “Experience of Plant Decontamination with LOMI Reagents”, in Water Chemistry
of Nuclear Reactor Systems, British Nuclear Energy Society, London, 1980, 3, 203. 3. J.V. Bishop, S. Kottle, and R.A. Stowe, Analytical Methods for Vanadous Formate, Fifth EPRI Work-
shop on Chemical Decontamination, Charlotte, NC, June, 1993. 4. A.M. Lannon, et al., Inorg. Chem., 1984, 23, 4167. 5. J.V. Bishop, R.A. Dutcher, M.S. Fisher, S. Kottle, and R.A. Stowe, Continuous Spectrographic Analysis
of Vunadous and Vanadic Ions, Omni Tech International, Ltd., US. Nuclear Regulatory Commission Report NUREG/CR-6047, October, 1993.
6. J.L. Smee and D. Bradbury, Low Picolinate LOMI-Update, Fifth EPRI Workshop on Chemical Decon-tamination, Charlotte, NC, June, 1993.
7. K.L. Chawla and J.P. Tandon, Tantala, 1965, 12, 665.8. S. Kottle, R.A. Stowe, and J.V. Bishop, Continuous Analysis for Vanadium in LOMI Deontamination,
Omni Tech International, Ltd., U.S. Nuclear Regulatory Commission Report NUREG/CR-6494, December, 1996.

This page intentionally left blank.
19
MAGNETIC SEPARATION FOR NUCLEARMATERIAL SURVEILLANCE
Laura A. Worl1, David Devlin, Dallas Hill, Dennis Padilla,and F. Coyne Prenger
1NMT-11 MS-E505Los Alamos National Laboratory Los Alamos, NM 87545
ABSTRACT
A high performance superconducting magnet is being developed for particle retrieval from field collected samples. Results show that the ratio of matrix fiber diameter to the diameter of the captured particles is an important parameter. The development of new matrix materials is being pursued through the controlled corrosion of stainless steel wool, or the deposition of nickel dendrites on the existing stainless steel matrix material. We have also derived a model from a continuity equation that uses empirically determined capture cross section values. This enables the prediction of high gradient magnetic sepa-rator performance for a variety of materials and applications. The model can be used tooptimize the capture cross section and thus increase the capture efficiency.
1. INTRODUCTION
Magnetic separation has received much attention recently due to industrial,1–3
medical4,5 and governmental6–8 interest in selective separation technologies. Currently, theDepartment of Energy (DOE) is developing technologies for single particle capture ofsubmicron actinide particles from forensic samples of interest.
High gradient magnetic separation (HGMS) utilizes large magnetic field gradients to effectively separate micron sized paramagnetic particles. Because actinide compounds are paramagnetic, HGMS can extract and concentrate micron sized actinides and actinide containing particulates with no sample destruction. Most host materials, such as air, water and organic matter are diamagnetic, which will allow for a physical separa-tion of the paramagnetic actinides from these materials. Typically, HGMS separators consist of a high field solenoid magnet, the bore of which contains a fine-structuredferromagnetic matrix material. The matrix fibers locally distort the magnetic field
Emerging Technologies in Hazardous Waste Management 8, edited by Tedder and Pohland Kluwer Academic/ Plenum Publishers, New York, 2000. 217
218 L. A. Worl et al.
generating high field gradients at the surface of the filaments. These areas then becometrapping sites for paramagnetic particles and are the basis for the magnetic separation.Because of the commercial availability of 45-micron diameter stainless steelwool, HGMSof micron sized materials has been demonstrated in the kaolin clay industry,9 for soilremediation,10,11 and for water treatment.12–14 The magnetic capture of smaller particles(submicron) can be obtained by increasing the magnetic force between the fibers and theparamagnetic particles. One approach towards increasing the magnetic force is to reducethe size of the matrix filament, which is believed to be the most effective method ofimproving separator efficiency. Ritter15 and others16 have examined submicron sizedspheres for the collection of nanometer sized particles. In addition, fractionation methodsfor HGMS of nanometer particles is underdevelopment.17,18 We are in investigating den-dritic growth on surfaces, and controlled corrosion of stainless steel wool filaments toaugment matrix surface topography in an effort to reduce the effective matrix capturediameter.
Much work19–25 has been done to model the behavior of the paramagnetic particlesas they interact with the magnetized matrix. Dynamic effects have been investigated byanalyzing particle trajectories in homogeneous materials, and the influence of particlebuildup on the matrix elements and their effect on the flow field have been studied. Thesestudies, though requiring simplifyingassumptions, provide useful insights into importantaspects of this complex problem. In particular, they identify appropriate independentvariables that form the basis for this investigation. The matrix materials currently usedfor HGMS are inhomogeneous and have a complex cross section. In addition, the para-magnetic particles are nonspherical and include a range of particle sizes. All of thesefactors discourage precise analytical treatment. Therefore, our approach is semi-empirical combining a mechanistic analytical model with empirical input from controlledexperiments.
We have described previously, a rate model26 that is derived from a force balance onindividual paramagnetic particles in the immediate vicinity of a matrix fiber. The modelassumes that if the magnetic capture forces are greater than the competing viscous dragand gravity forces, the particle is captured and removed from the flow stream. The ratemodel depends on the magnitude of the capture cross section (separation coefficient) asdetermined by the force balance on the particle. In this work we have expanded the modelto include the loading behavior of particles on the matrix fibersusing the continuity equa-tion19 and we utilize capture rate data from the experimental results. The resulting ana-lytical model predicts the critical separation parameters for submicron single particlecollection presented in this work. It thus provides a predictive tool for HGMS tests con-ducted here, and can be used for designing both prototype and full-scale units forspecific applications.
2. EXPERIMENTAL
The magnet system used for the studies described here was a six inch warm-boresuperconducting high gradient magnetic separator (manufactured by Cyromagnetics,Inc.) with an 8 tesla maximum field strength. The matrix material of extruded stainlesssteel wool was obtained from MEMTEC, Inc. The matrix body canister was designedand machined in our laboratories. The matrix body was packed to achieve a 94% voidfraction. The experiments described here were conducted with CuO, Pr2O3 or PuO2 and
Magnetic Separation for Nuclear Material Surveillance 219
were used to define the significant separation and magnet design parameters. CuO and Pr2O3 were obtained from CERAC; PuO2 was obtained from ongoing work in our laboratories.
Specific ranges of micron and submicron particles of Pr2O3 and PuO2 were obtained by sedimentation and decantation procedures, relying on the relationship that exists between settling velocity and particle diameter in Stokes Law.27,28 Particle sizes were verified by dynamic light scattering for particle size analysis.
For the HGMS experiments, a constant volume of solution was pumped through the magnetic matrix using a peristaltic pump at constant flowrate. Experimental variables that were systematically examined included applied magnetic field strength, flow veloc-ity, carrier fluid and paramagnetic particle size. Typically, one to two passes through the matrix were performed using 100–200ml of feed solution. Back-flushing of the magnetic matrix was done at zero magnetic field, with the flow direction reversed.
Feed and effluent samples were analyzed for contaminant concentration. Samples containing praseodymium were analyzed by ICP-MS where the detection limits are typ-ically less than 1 parts per billion (ppb). In cases where a pre-concentration step is incor-porated in the sample preparation, the detection limits can be more sensitive. Samples were analyzed for copper using a spectrophotometric method” where the detection limits are typically 2–5 parts per million (ppm). Plutonium samples were analyzed by liquid scintillation with a Packard Instrument for liquid scintillation analysis. For Pu-239 analy-sis, a detection limit of 6 parts per trillion (ppt) was obtained for samples with no pre-concentration steps. If lower detection limits are desired, a pre-concentration step in the sample preparation is required. In most cases, duplicate samples were analyzed to checkconsistency. Mass balances for the paramagnetic materials were determined for each HGMS test. Separation efficiencies were determined using the paramagnetic mass values determined by three different methods: (1) mass values from backwash and feed, (2) massvalues from feed and effluent, and (3) mass values from backwash and effluent. The three methods would all give the same result for separation efficiency if the mass balance error was zero. The data is summarized below with the separation values calculated from the effluent and feed values, method (2).
Controlled corrosion studies were conducted on MEMTEC 430 series stainless steel wool. The material was cleaned by an ethanol bath prior to etching. The material was etched using HCl acid solution to obtain a general corrosion pattern. The material was exposed to a 2.9M HCI solution for a brief time period, rinsed with de-ionized water and dried. The material was weighed and on average a forty to fifty percent weight loss was obtained. The material was characterized after corrosion by SEM.
Also, in a parallel approach, nickel dendrites were deposited on the extruded steel wool matrix by chemical vapor deposition of Ni(CO)4 described previously.30 The reactoris a hot-wall reactor as opposed to the previous cold-wall system. This type of system is easier to scale for deposition on large mats. The extreme toxicity of nickel carbonyl required special precautions in the vapor deposition system. All the valves were pneu-matically controlled so the reactor could be activated or shut down remotely. Vacuum lines and gas flush systems were also remotely controlled. The system was operated in a hood within a room, which was also operated on its own exhaust system at a negativepressure with respect to the building. Mass flow controllers regulated argon carrier gases. The nickel carbonyl flow was regulated using a calibrated rotometer. The exhaust gases were passed through a hot scrubber at 500 °C to consume unused nickel carbonyl leaving the reaction zone. During operation the lines were heated to 40°C to avoid condensation
220 L. A. Worl et al.
of carbonyl. The sample was placed in the middle of the reaction chamber. Processing parameters were adjusted to optimize the nickel dendrite distribution. The material was characterized by SEM.
3. RESULTS/DISCUSSION
A series of HGMS experiments were performed using particulate oxides of copper, praseodymium or plutonium suspended in a liquid. The experimental data were corre-lated with the analytical model. The experimental results and the correlated model results are discussed below. The model validation has been demonstrated previously with a sys-tematic series of soil remediation tests.26
3.1. Model Formulation
The mathematical model is based on a geometry comprised of a highly porous bed of ferromagnetic parallel cylinders describing the matrix elements. These elements are arranged in a regular staggered manner and are orientated at right angles to both the flow and magnetic field directions. The application of HGMS involves passing a slurry of the contaminated sample through a magnetized volume. In the separation, there are several key independent experimental variables affecting the performance of the mag-netic separation system. Variable ranges that we have studied are listed in Table 1. Wehave defined the variables as either material characteristics or operating parameters. Thesignificance of these parameters has been discussed elsewhere.26
The model is formulated from the continuity equation and an expression for the capture rate of the paramagnetic particles. We start with the continuity equation19 for thematrix given by
(1)
Where, c is the contaminant concentration, is the matrix void fraction, ρm is thematrix packing density, n is the mass of particles captured per unit mass of packing, Uo
is the superficial velocity, t is time and z is axial distance through the matrix. This for-mulation describes the distribution of particles in a magnetic filter and can be used to generate breakthrough curves for the filter.
Table 1. Independent Variables for Magnetic Separator
Material Characteristics Separator Parameters
Particle Size: 0.2-5.0 µm Matrix Element Size: 25 µm Paramagnetic Particle Concentration: 50–0.3 ppm Matrix Element Spacing: 80 µm Solids Concentration: <1 wt% Magnetic Field Strength: 2.0–6.5 T Magnetic Susceptibility* (×106): 200–2,400 Matrix Material: 430 Stainless SteelCarrier Fluid: water or dodecane Residence Time: 2–30sSlurry pH: 7 (water) Superficial Velocity: -0.5-2.0 cm/s
*SI units.
Magnetic Separation for Nuclear Material Surveillance 221
The rate of particle capture given by the partial derivative of n with respect to t isrelated to the capture cross section, of the magnetic separator. This relationship is given by eq 2, where Dm is the diameter of the matrix wire.
(2)
We determine the capture cross section empirically from experiments and have cor- related the results.26 In summary from the previous work, we found that the capture crosssection is significantly less that one, which implies that the particles can be swept around the matrix elements by the fluid flow even if the particles occupy an upstream capture zone defined by the projected area of the matrix element. The capture cross section wasfound to be proportional to the magnetic force and the particle diameter and inversely proportional to the matrix element diameter and the matrix element spacing. This indi- cates that the improved capture of submicron particles can be achieved by decreasing thematrix element diameter and the spacing between the matrix elements.
3.2. Single Particle Collection
Assuming a spherical particle with a known density, the concentration of a specific diameter particle can be calculated. The single particle concentrations for plutonium oxide at various particle diameters are shown in Table 2. For a concentration of 4 partsper billion (ppb) of a 0.8 micron particle, there would be approximately 1300 plutoniumoxide particles in 1 ml of solution. In the initial feed concentrations for our experiments, we typically use starting plutonium concentrations in the range of 2-15 ppb and an initialvolume of l00ml. This would translate to approximately 6,500 particles with a 0.8 microndiameter in the feed solution. In these applications, we attempt to extract all the 6,500particles to get below the single particle threshold.
3.2.1. Pr2O3. HGMS experiments on praseodymium oxide in water were conducted inorder to optimize the system parameters for single particle collection. These experiments were performed with small particulate Pr2O3, which serves as a surrogate for plutonium and can be detected at less than 1 ppb levels by ICP-MS. In our experiments, the three particle size ranges that were studied include 0.2–0.8, 0.8–2 and 2–5µm sized particles. For the single particle threshold for Pr2O3 of these particle size ranges we must be below the 1 ppb level for 7µm sized particles and below the 1 parts per trillion (ppt) level for 0.7 µm sized particles. With Pr2O3 particles, we were able to approach single particle capture because ppb effluent concentrations were achieved.
The results for the magnetic separation of Pr2O3 particles in water are shown inTable 3. The variables that were examined include particle size, applied magnetic field
Table 2. The calculated number of PuO2 particles in concentrations of 4 parts per billion to 3 parts per trillion
[PuO2] (ppb 5 µm Particle Count 0.8µm Particle Count 0.2µm Particle Count
4 5 1,300 83,330 0.006 0.008 2 1250.003 0.004 1 62
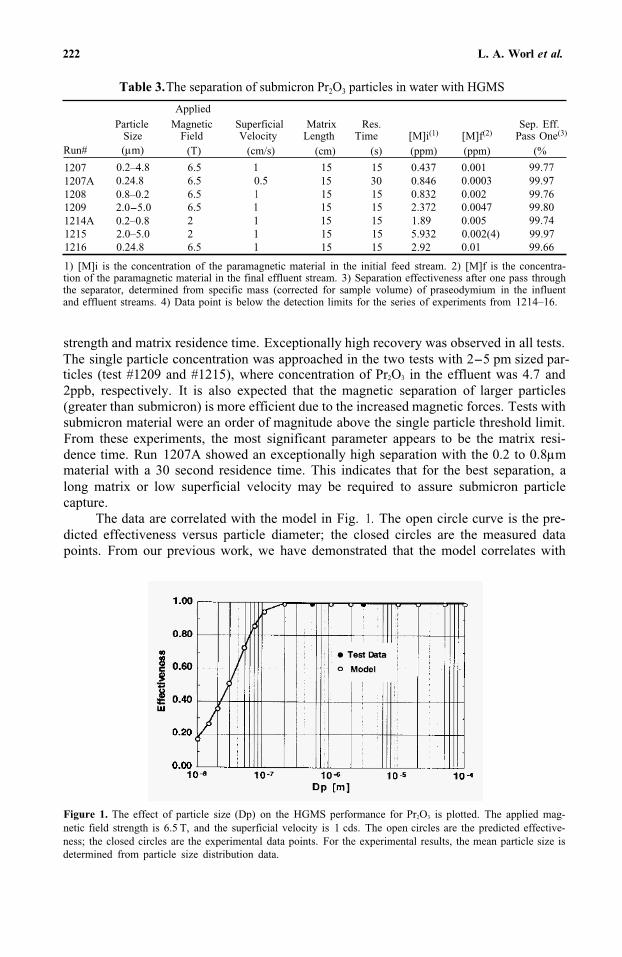
222 L. A. Worl et al.
Table 3.The separation of submicron Pr2O3 particles in water with HGMS
AppliedParticle Magnetic Superficial Matrix Res. Sep. Eff.
Size Field Velocity Length Time [M]i(1) [M]f(2) Pass One(3)
Run# (µm) (T) (cm/s) (cm) (s) (ppm) (ppm) (%
1207 0.2–4.8 6.5 1 15 15 0.437 0.001 99.771207A 0.24.8 6.5 0.5 15 30 0.846 0.0003 99.971208 0.8–0.2 6.5 1 15 15 0.832 0.002 99.761209 2.0-5.0 6.5 1 15 15 2.372 0.0047 99.801214A 0.2–0.8 2 1 15 15 1.89 0.005 99.741215 2.0–5.0 2 1 15 15 5.932 0.002(4) 99.971216 0.24.8 6.5 1 15 15 2.92 0.01 99.66
1) [M]i is the concentration of the paramagnetic material in the initial feed stream. 2) [M]f is the concentra-tion of the paramagnetic material in the final effluent stream. 3) Separation effectiveness after one pass through the separator, determined from specific mass (corrected for sample volume) of praseodymium in the influent and effluent streams. 4) Data point is below the detection limits for the series of experiments from 1214–16.
strength and matrix residence time. Exceptionally high recovery was observed in all tests. The single particle concentration was approached in the two tests with 2-5 pm sized par- ticles (test #1209 and #1215), where concentration of Pr2O3 in the effluent was 4.7 and 2ppb, respectively. It is also expected that the magnetic separation of larger particles (greater than submicron) is more efficient due to the increased magnetic forces. Tests with submicron material were an order of magnitude above the single particle threshold limit. From these experiments, the most significant parameter appears to be the matrix resi- dence time. Run 1207A showed an exceptionally high separation with the 0.2 to 0.8µm material with a 30 second residence time. This indicates that for the best separation, along matrix or low superficial velocity may be required to assure submicron particle capture.
The data are correlated with the model in Fig. 1. The open circle curve is the pre- dicted effectiveness versus particle diameter; the closed circles are the measured data points. From our previous work, we have demonstrated that the model correlates with
Figure 1. The effect of particle size (Dp) on the HGMS performance for Pr2O3 is plotted. The applied mag-netic field strength is 6.5 T, and the superficial velocity is 1 cds. The open circles are the predicted effective-ness; the closed circles are the experimental data points. For the experimental results, the mean particle size is determined from particle size distribution data.
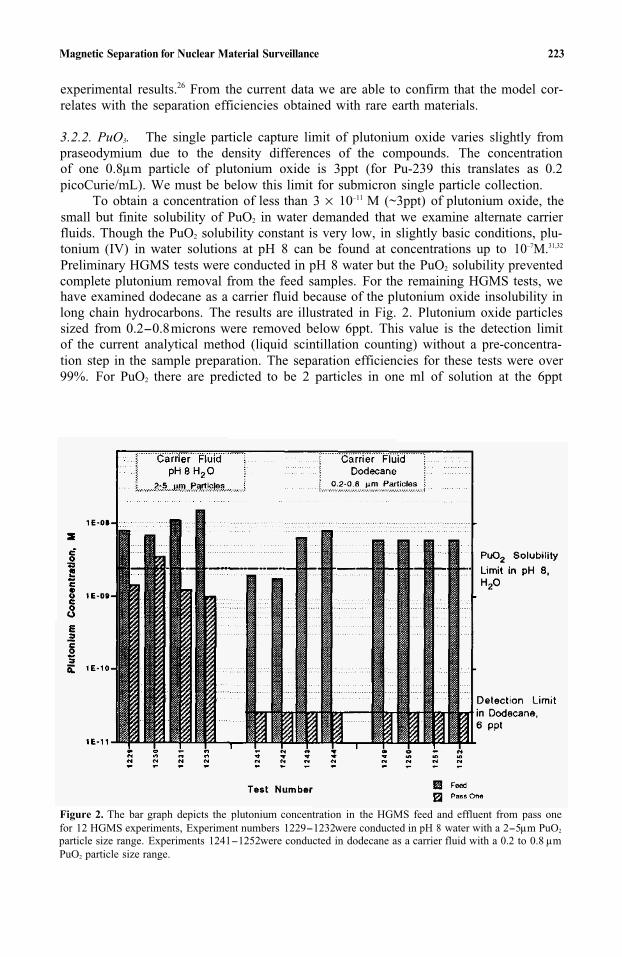
Magnetic Separation for Nuclear Material Surveillance 223
experimental results.26 From the current data we are able to confirm that the model cor- relates with the separation efficiencies obtained with rare earth materials.
3.2.2. PuO3. The single particle capture limit of plutonium oxide varies slightly from praseodymium due to the density differences of the compounds. The concentration of one 0.8µm particle of plutonium oxide is 3ppt (for Pu-239 this translates as 0.2 picoCurie/mL). We must be below this limit for submicron single particle collection.
To obtain a concentration of less than 3 × 10–11 M (~3ppt) of plutonium oxide, thesmall but finite solubility of PuO2 in water demanded that we examine alternate carrier fluids. Though the PuO2 solubility constant is very low, in slightly basic conditions, plu-tonium (IV) in water solutions at pH 8 can be found at concentrations up to 10–7M.31,32
Preliminary HGMS tests were conducted in pH 8 water but the PuO2 solubility prevented complete plutonium removal from the feed samples. For the remaining HGMS tests, we have examined dodecane as a carrier fluid because of the plutonium oxide insolubility in long chain hydrocarbons. The results are illustrated in Fig. 2. Plutonium oxide particles sized from 0.2-0.8microns were removed below 6ppt. This value is the detection limitof the current analytical method (liquid scintillation counting) without a pre-concentra-tion step in the sample preparation. The separation efficiencies for these tests were over99%. For PuO2 there are predicted to be 2 particles in one ml of solution at the 6ppt
Figure 2. The bar graph depicts the plutonium concentration in the HGMS feed and effluent from pass onefor 12 HGMS experiments, Experiment numbers 1229-1232 were conducted in pH 8 water with a 2-5 µm PuO2
particle size range. Experiments 1241-1252 were conducted in dodecane as a carrier fluid with a 0.2 to 0.8 µm PuO2 particle size range.
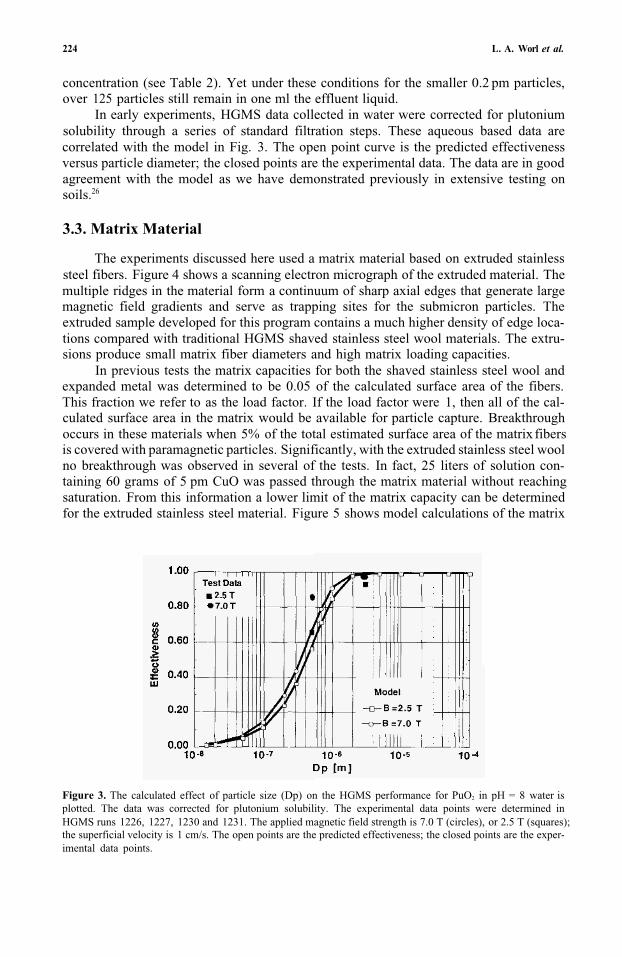
224 L. A. Worl et al.
concentration (see Table 2). Yet under these conditions for the smaller 0.2 pm particles, over 125 particles still remain in one ml the effluent liquid.
In early experiments, HGMS data collected in water were corrected for plutonium solubility through a series of standard filtration steps. These aqueous based data are correlated with the model in Fig. 3. The open point curve is the predicted effectiveness versus particle diameter; the closed points are the experimental data. The data are in good agreement with the model as we have demonstrated previously in extensive testing on soils.26
3.3. Matrix Material
The experiments discussed here used a matrix material based on extruded stainless steel fibers. Figure 4 shows a scanning electron micrograph of the extruded material. The multiple ridges in the material form a continuum of sharp axial edges that generate large magnetic field gradients and serve as trapping sites for the submicron particles. The extruded sample developed for this program contains a much higher density of edge loca-tions compared with traditional HGMS shaved stainless steel wool materials. The extru- sions produce small matrix fiber diameters and high matrix loading capacities.
In previous tests the matrix capacities for both the shaved stainless steel wool and expanded metal was determined to be 0.05 of the calculated surface area of the fibers. This fraction we refer to as the load factor. If the load factor were 1, then all of the cal- culated surface area in the matrix would be available for particle capture. Breakthrough occurs in these materials when 5% of the total estimated surface area of the matrix fibersis covered with paramagnetic particles. Significantly, with the extruded stainless steel woolno breakthrough was observed in several of the tests. In fact, 25 liters of solution con-taining 60 grams of 5 pm CuO was passed through the matrix material without reachingsaturation. From this information a lower limit of the matrix capacity can be determinedfor the extruded stainless steel material. Figure 5 shows model calculations of the matrix
Figure 3. The calculated effect of particle size (Dp) on the HGMS performance for PuO2 in pH = 8 water isplotted. The data was corrected for plutonium solubility. The experimental data points were determined in HGMS runs 1226, 1227, 1230 and 1231. The applied magnetic field strength is 7.0 T (circles), or 2.5 T (squares);the superficial velocity is 1 cm/s. The open points are the predicted effectiveness; the closed points are the exper-imental data points.
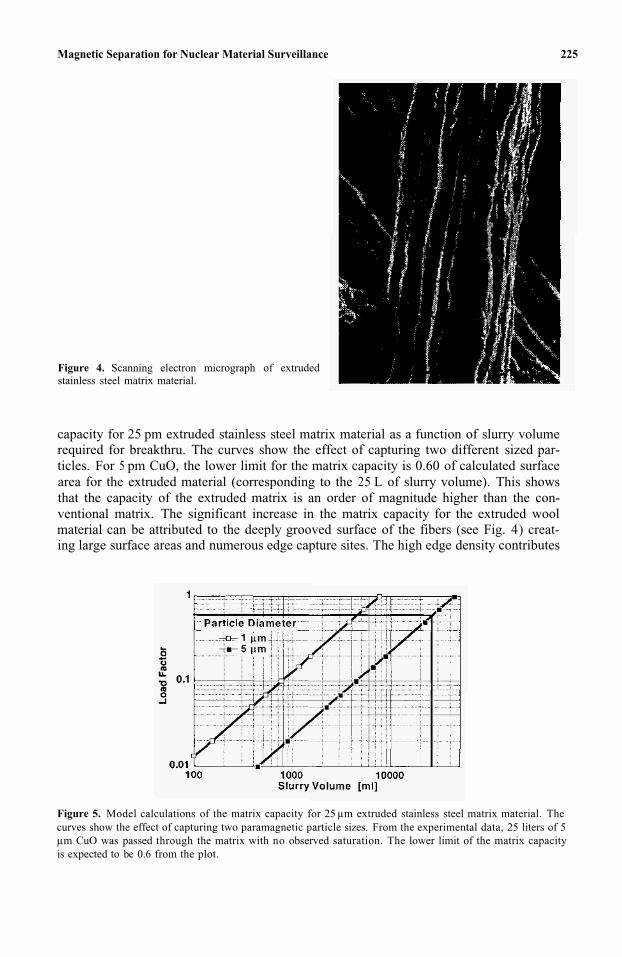
Magnetic Separation for Nuclear Material Surveillance 225
Figure 4. Scanning electron micrograph of extrudedstainless steel matrix material.
capacity for 25 pm extruded stainless steel matrix material as a function of slurry volume required for breakthru. The curves show the effect of capturing two different sized par- ticles. For 5 pm CuO, the lower limit for the matrix capacity is 0.60 of calculated surface area for the extruded material (corresponding to the 25 L of slurry volume). This shows that the capacity of the extruded matrix is an order of magnitude higher than the con-ventional matrix. The significant increase in the matrix capacity for the extruded wool material can be attributed to the deeply grooved surface of the fibers (see Fig. 4) creat-ing large surface areas and numerous edge capture sites. The high edge density contributes
Figure 5. Model calculations of the matrix capacity for 25 µm extruded stainless steel matrix material. Thecurves show the effect of capturing two paramagnetic particle sizes. From the experimental data, 25 liters of 5µm CuO was passed through the matrix with no observed saturation. The lower limit of the matrix capacityis expected to be 0.6 from the plot.
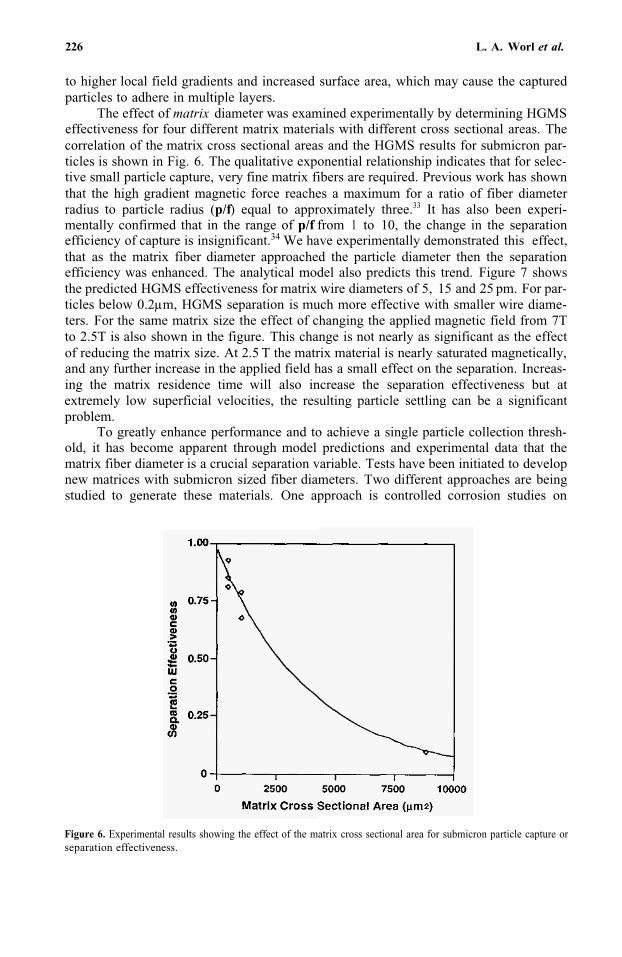
226 L. A. Worl et al.
to higher local field gradients and increased surface area, which may cause the captured particles to adhere in multiple layers.
The effect of matrix diameter was examined experimentally by determining HGMSeffectiveness for four different matrix materials with different cross sectional areas. The correlation of the matrix cross sectional areas and the HGMS results for submicron par-ticles is shown in Fig. 6. The qualitative exponential relationship indicates that for selec-tive small particle capture, very fine matrix fibers are required. Previous work has shown that the high gradient magnetic force reaches a maximum for a ratio of fiber diameterradius to particle radius (p/f) equal to approximately three.33 It has also been experi-mentally confirmed that in the range of p/f from 1 to 10, the change in the separationefficiency of capture is insignificant.34 We have experimentally demonstrated this effect,that as the matrix fiber diameter approached the particle diameter then the separation efficiency was enhanced. The analytical model also predicts this trend. Figure 7 shows the predicted HGMS effectiveness for matrix wire diameters of 5, 15 and 25 pm. For par-ticles below 0.2µm, HGMS separation is much more effective with smaller wire diame-ters. For the same matrix size the effect of changing the applied magnetic field from 7T to 2.5T is also shown in the figure. This change is not nearly as significant as the effect of reducing the matrix size. At 2.5 T the matrix material is nearly saturated magnetically,and any further increase in the applied field has a small effect on the separation. Increas-ing the matrix residence time will also increase the separation effectiveness but at extremely low superficial velocities, the resulting particle settling can be a significantproblem.
To greatly enhance performance and to achieve a single particle collection thresh-old, it has become apparent through model predictions and experimental data that the matrix fiber diameter is a crucial separation variable. Tests have been initiated to develop new matrices with submicron sized fiber diameters. Two different approaches are being studied to generate these materials. One approach is controlled corrosion studies on
Figure 6. Experimental results showing the effect of the matrix cross sectional area for submicron particle capture orseparation effectiveness.
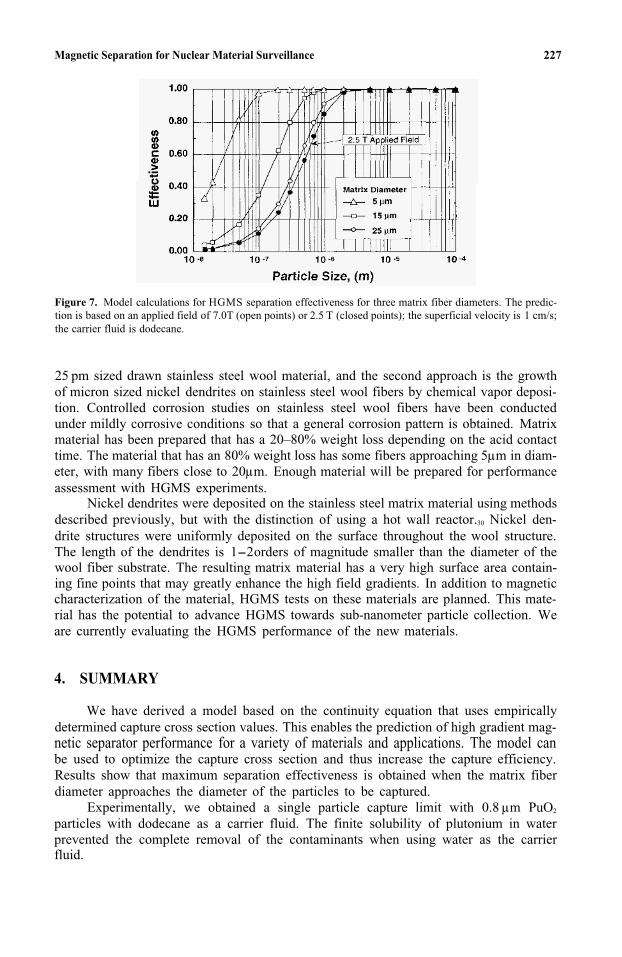
Magnetic Separation for Nuclear Material Surveillance 227
Figure 7. Model calculations for HGMS separation effectiveness for three matrix fiber diameters. The predic-tion is based on an applied field of 7.0T (open points) or 2.5 T (closed points); the superficial velocity is 1 cm/s;the carrier fluid is dodecane.
25 pm sized drawn stainless steel wool material, and the second approach is the growth of micron sized nickel dendrites on stainless steel wool fibers by chemical vapor deposi-tion. Controlled corrosion studies on stainless steel wool fibers have been conducted under mildly corrosive conditions so that a general corrosion pattern is obtained. Matrix material has been prepared that has a 20–80% weight loss depending on the acid contact time. The material that has an 80% weight loss has some fibers approaching 5µm in diam- eter, with many fibers close to 20µm. Enough material will be prepared for performance assessment with HGMS experiments.
Nickel dendrites were deposited on the stainless steel matrix material using methods described previously, but with the distinction of using a hot wall reactor.30 Nickel den-drite structures were uniformly deposited on the surface throughout the wool structure. The length of the dendrites is 1-2 orders of magnitude smaller than the diameter of the wool fiber substrate. The resulting matrix material has a very high surface area contain- ing fine points that may greatly enhance the high field gradients. In addition to magnetic characterization of the material, HGMS tests on these materials are planned. This mate-rial has the potential to advance HGMS towards sub-nanometer particle collection. We are currently evaluating the HGMS performance of the new materials.
4. SUMMARY
We have derived a model based on the continuity equation that uses empirically determined capture cross section values. This enables the prediction of high gradient mag-netic separator performance for a variety of materials and applications. The model canbe used to optimize the capture cross section and thus increase the capture efficiency. Results show that maximum separation effectiveness is obtained when the matrix fiber diameter approaches the diameter of the particles to be captured.
Experimentally, we obtained a single particle capture limit with 0.8 µm PuO2
particles with dodecane as a carrier fluid. The finite solubility of plutonium in water prevented the complete removal of the contaminants when using water as the carrier fluid.
228 L. A. Worl et al.
The development of new matrix materials is being pursued through the controlledcorrosion of stainless steel wool, or the deposition of nickel dendrites on the existing stain-less steel matrix material. The new materials are promising for the submicron collection of paramagnetic particles. HGMS experiments on the new materials are planned.
REFERENCES
1. Svoboda, J. Magnetic Methods for the Treatment of Minerals; Elsevier: New York, 1987. 2. J. Lyman in High-Gradient Magnetic Separation, Unit Operations for Treatment of Hazardous Industrial
Wastes, D.J. De Renzo, ed. Noyes Data Corp., Park Ridge, New Jersey, 1978, pp. 590–609. 3. Arvidson, B.R. and Henderson, D. Minerals Engineering, 1997, 10, 127.4. Richards, A.J., Roath, O.S., Smith, R.J.S., and Watson, J.H.P. IEEE Trans. On Magnetics, 1996, 32(2),
459.5. Pourfarzaneh, M., Snavely, K., and Lawlor, J. Genetic Engineering News, 1995, 15, (13).6. Avens, L.R., Hill, D.D., Prenger, F.C., Stewart, W.F., Tolt, T.L., and Worl, L.A. “Process to Remove
Actinides from Soil Using Magnetic Separation,” The Regents of the University of California, Office of Technology Transfer, Alameda, CA, United States (US. Corporation), US Patent 5538701 960723, 1996.
7. Nuñez, L., Buchholz, B.A., and Vandegrift, G.F. Sep. Sci. & Tech., 1995, 30, 1455–1472.8. Ritter, J.A., Zamecnik, J.R., Hutson, N.D., Smith, M.E., and Carter, J.T. Wat. Sci. Tech. 1992, 25, 269.9. Iannicelli, J. Clays and Clay Minerals, 1976, 24, 64–68.
10. Schake, A.R., Avens, L.R., Hill, D.D., Padilla, D., Prenger, F.C., and Worl, L.A. Conference Proceed-ings, Conference: 207. Spring National Meeting of the American Chemical Society (ACS), San Diego, CA (United States), 13-18 Mar 1994.
11. Coe, B.T., Gerber, R., and Witts, D. IEEE Trans. On Magnetics, 1998, 34(4) 2126–2128.12. Yiacoumi, S., Rountree, D.A., and Tsouris, C. J. of Colloid and Interface Science, 1996, 184, 477438.13. Emory, B.B. IEEE Trans. On Magnetics, 1981, Mag-17, 3296.14. Kolm, H., Kelland, J., and Kelland, D. Sci. Am., 1975, 46.15. Ebner, A.D., Ritter, J.A., and Ploehn, H.J. Separation and Purification Technology, 1997, 11, 199.16. Haque, M.F., Aidun, R., Moyer, C., and Arajs, S. J. Appl. Phys. 1988, 63, 3239.17. Tsukamoto, 0. and Ohizumi, T. IEEE Transactions on Appl. Superconductivity, 1995, 5(2), 31 1–3 13.18. Kelland, D.R. IEEE Trans. On Magnetics, 1998, 34(4), 2123–2125.19. Akoto, I.Y IEEE Transactions on Magnetics, 1977, Mag-13(5), 1486.20. Friedlander, F.J., Takayasu, M., Retttig, J.B., and Kentzer, C.P. IEEE Transactions on Magnetics, 1978,
21. Lawson, W.F., Simons, W.H., and Treat, R.P. Journalof Applied Physics, 1977, 48(8), 3213-3224.22. Luborsky, F.E. and Drummond, B.J. IEEE Transactions on Magnetics, 1976, Mag-12(5), 463–465.23. Nesset, J.E. and Finch, J.A. Industrial Applications of Magnetic Separation, Conference Proceedings,
pp. 188-196, July 1978. 24. Stekly, Z.J.J. and Minervini, J.V. IEEE Transactions on Magnetics, 1976, Mag-12(5) pp. 474479.25. Watson, J.H.P. J. Applied Physics, 1973, 44(9) 4209–4213. 26. Prenger, F.C., Stewart, W.F., Hill, D.D., Avens, L.R., Worl, L.A., Schake, A., deAguero, K.J., Padilla,
D.D., and Tolt, T.L. Adv. in Cryogenic Engineering, 1994, 34, 485.27. Tanner and Jackson, Soil Science Society Amer. Proc. 1947, 12.28. Methods of Soil Analysis, Part I, Klute, A. ed., American Society of Agronomy, Inc. Soil Science Society
of America, Inc. Madison, Wisconsin, 1986, Chapter 15.29. Stephens, B.G., Felkel, H.L., and Spinelli, W.M. Anal. Chem. 1974, 46, 692.30. Grimmer, D.P., Herr, K.C., and McCreary, W.J. J. Vac. Sci. Technol., 1978, 15, 59.31. Allard, B. in Actinides in Perspective, Edelstein, N.M. Ed. Proceedings of the Actinides-1981 Confer-
ence, Pergamon Press, New York, 1982, 553–580. 32. Delegard, C.H. Radiochim Acta, 1987, 41, 11-21.33. Oberteuffer, J.A. IEEE Trans. Mag., MAG-10 (1974), 223. 34. Collan, H.K., Jantunen, J., Kokkala, M., and Ritvos, A. IEEE Trans. Mag., MAG-14, (1978), 398.
Mag-14(6), 1158–1164.
20
TRANSITION METAL CATALYSTS FOR THEAMBIENT TEMPERATURE DESTRUCTION OFORGANIC WASTES USING PEROXYDISULFATE
G. Bryan Balazs, John F. Cooper, Patricia R. Lewis, and Martyn G. Adamson
Lawrence Livermore National Laboratory Livermore, California 94550
1. ABSTRACT
Destruction of the organic components of hazardous or mixed waste has been demonstrated in a process known as Direct Chemical Oxidation (DCO). This technol-ogy, developed over the last six years at Lawrence Livermore National Laboratory (LLNL), is an aqueous-based process which mineralizes almost all organics through oxidative destruction by peroxydisulfate. The process typically operates at 80-100 °C but there are obvious advantages to lowering this operating temperature to near ambient for the treatment of volatile materials, or for situations where heating the waste is impracti-cal (e.g., large area decontamination of soil). For the purposes of quantifying transition metal catalytic activity in a prototype DCO system, the Destruction and Removal Effi-ciencies (DRE’s) for the oxidation of several model organic substrates in acid peroxy-disulfate solutions have been measured. Results are presented for the enhancement of destruction rates of ethylene glycol, 1,3-dichloro-2-propanol, tributyl phosphate, and a “real world” waste surrogate using catalysts such as ionic Ag, Cu, Co, and Fe.
2. INTRODUCTION
Direct Chemical Oxidation (DCO) is a non-thermal, ambient pressure, aqueous-based technology for the oxidative destruction of the organic components of hazardous or mixed waste streams. The process has been developed for applications in waste treat-ment and chemical demilitarization and decontamination at LLNL since 1992, and is applicable to the destruction of virtually all solid or liquid organics, including: chloro-solvents, oils and greases, detergents, organic-contaminated soils or sludges, explosives, chemical and biological warfare agents, and PCB’s.1–15
Emerging Technologies in Hazardous Waste Management 8, edited by Tedder and Pohland Kluwer Academic/Plenum Publishers, New York, 2000. 229
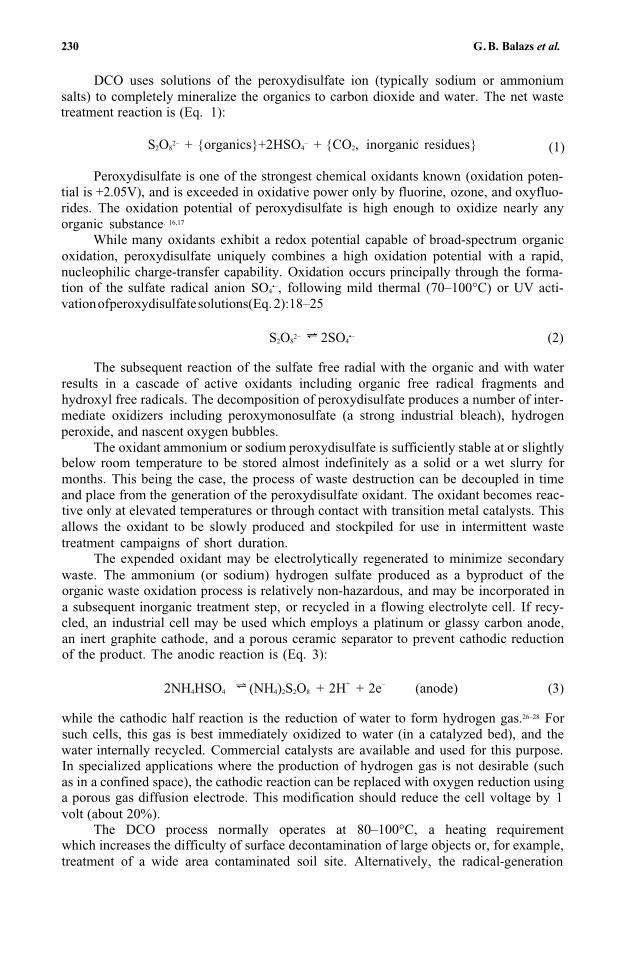
230 G. B. Balazs et al.
DCO uses solutions of the peroxydisulfate ion (typically sodium or ammoniumsalts) to completely mineralize the organics to carbon dioxide and water. The net wastetreatment reaction is (Eq. 1):
S2O82– + {organics}+2HSO4
– + {CO2, inorganic residues} (1)
Peroxydisulfate is one of the strongest chemical oxidants known (oxidation poten-tial is +2.05V), and is exceeded in oxidative power only by fluorine, ozone, and oxyfluo-rides. The oxidation potential of peroxydisulfate is high enough to oxidize nearly anyorganic substance. 16,17
While many oxidants exhibit a redox potential capable of broad-spectrum organic oxidation, peroxydisulfate uniquely combines a high oxidation potential with a rapid, nucleophilic charge-transfer capability. Oxidation occurs principally through the forma-tion of the sulfate radical anion SO4
•–, following mild thermal (70–100°C) or UV acti-vation of peroxydisulfate solutions(Eq. 2):18–25
S2O82– 2SO4
•– (2)
The subsequent reaction of the sulfate free radial with the organic and with water results in a cascade of active oxidants including organic free radical fragments and hydroxyl free radicals. The decomposition of peroxydisulfate produces a number of inter-mediate oxidizers including peroxymonosulfate (a strong industrial bleach), hydrogen peroxide, and nascent oxygen bubbles.
The oxidant ammonium or sodium peroxydisulfate is sufficiently stable at or slightlybelow room temperature to be stored almost indefinitely as a solid or a wet slurry for months. This being the case, the process of waste destruction can be decoupled in time and place from the generation of the peroxydisulfate oxidant. The oxidant becomes reac-tive only at elevated temperatures or through contact with transition metal catalysts. This allows the oxidant to be slowly produced and stockpiled for use in intermittent waste treatment campaigns of short duration.
The expended oxidant may be electrolytically regenerated to minimize secondary waste. The ammonium (or sodium) hydrogen sulfate produced as a byproduct of the organic waste oxidation process is relatively non-hazardous, and may be incorporated in a subsequent inorganic treatment step, or recycled in a flowing electrolyte cell. If recy-cled, an industrial cell may be used which employs a platinum or glassy carbon anode, an inert graphite cathode, and a porous ceramic separator to prevent cathodic reduction of the product. The anodic reaction is (Eq. 3):
2NH4HSO4 (NH4)2S2O8 + 2H+ + 2e– (anode) (3)
while the cathodic half reaction is the reduction of water to form hydrogen gas.26–28 Forsuch cells, this gas is best immediately oxidized to water (in a catalyzed bed), and the water internally recycled. Commercial catalysts are available and used for this purpose. In specialized applications where the production of hydrogen gas is not desirable (such as in a confined space), the cathodic reaction can be replaced with oxygen reduction using a porous gas diffusion electrode. This modification should reduce the cell voltage by 1volt (about 20%).
The DCO process normally operates at 80–100°C, a heating requirement which increases the difficulty of surface decontamination of large objects or, for example, treatment of a wide area contaminated soil site. Alternatively, the radical-generation
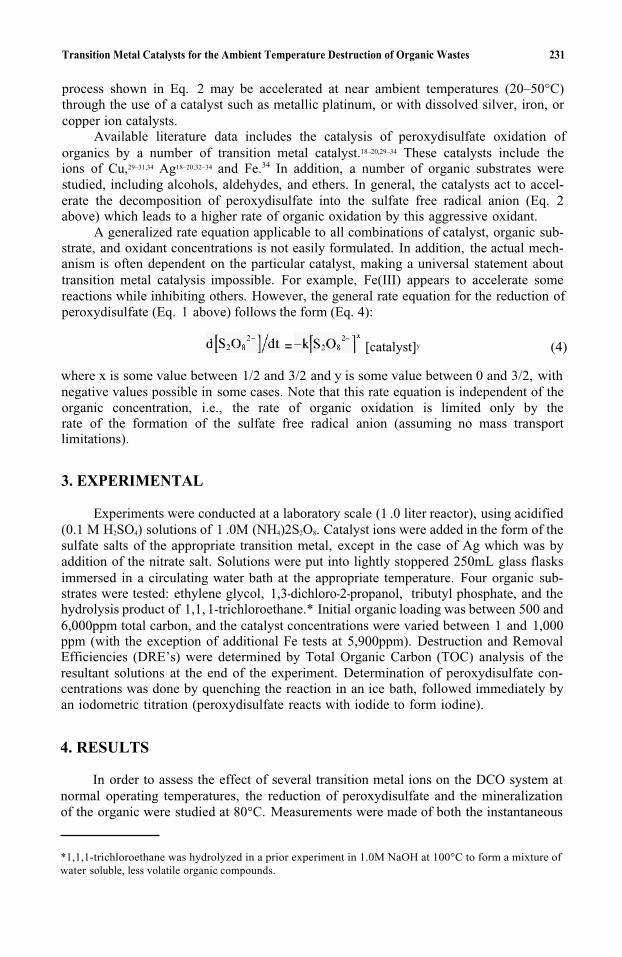
Transition Metal Catalysts for the Ambient Temperature Destruction of Organic Wastes 231
process shown in Eq. 2 may be accelerated at near ambient temperatures (20–50°C)through the use of a catalyst such as metallic platinum, or with dissolved silver, iron, or copper ion catalysts.
Available literature data includes the catalysis of peroxydisulfate oxidation oforganics by a number of transition metal catalyst.18–20,29–34 These catalysts include theions of Cu,29–31,34 Ag18–20,32–34 and Fe.34 In addition, a number of organic substrates werestudied, including alcohols, aldehydes, and ethers. In general, the catalysts act to accel-erate the decomposition of peroxydisulfate into the sulfate free radical anion (Eq. 2 above) which leads to a higher rate of organic oxidation by this aggressive oxidant.
A generalized rate equation applicable to all combinations of catalyst, organic sub-strate, and oxidant concentrations is not easily formulated. In addition, the actual mech-anism is often dependent on the particular catalyst, making a universal statement about transition metal catalysis impossible. For example, Fe(III) appears to accelerate somereactions while inhibiting others. However, the general rate equation for the reduction of peroxydisulfate (Eq. 1 above) follows the form (Eq. 4):
= [catalyst]y (4)
where x is some value between 1/2 and 3/2 and y is some value between 0 and 3/2, withnegative values possible in some cases. Note that this rate equation is independent of the organic concentration, i.e., the rate of organic oxidation is limited only by the rate of the formation of the sulfate free radical anion (assuming no mass transport limitations).
3. EXPERIMENTAL
Experiments were conducted at a laboratory scale (1 .0 liter reactor), using acidified (0.1 M H2SO4) solutions of 1 .0M (NH4)2S2O8. Catalyst ions were added in the form of the sulfate salts of the appropriate transition metal, except in the case of Ag which was by addition of the nitrate salt. Solutions were put into lightly stoppered 250mL glass flasks immersed in a circulating water bath at the appropriate temperature. Four organic sub-strates were tested: ethylene glycol, 1,3-dichloro-2-propanol, tributyl phosphate, and the hydrolysis product of 1,1, 1-trichloroethane.* Initial organic loading was between 500 and 6,000ppm total carbon, and the catalyst concentrations were varied between 1 and 1,000ppm (with the exception of additional Fe tests at 5,900ppm). Destruction and Removal Efficiencies (DRE’s) were determined by Total Organic Carbon (TOC) analysis of the resultant solutions at the end of the experiment. Determination of peroxydisulfate con-centrations was done by quenching the reaction in an ice bath, followed immediately by an iodometric titration (peroxydisulfate reacts with iodide to form iodine).
4. RESULTS
In order to assess the effect of several transition metal ions on the DCO system at normal operating temperatures, the reduction of peroxydisulfate and the mineralization of the organic were studied at 80°C. Measurements were made of both the instantaneous
*1,1,1-trichloroethane was hydrolyzed in a prior experiment in 1.0M NaOH at 100°C to form a mixture of water soluble, less volatile organic compounds.
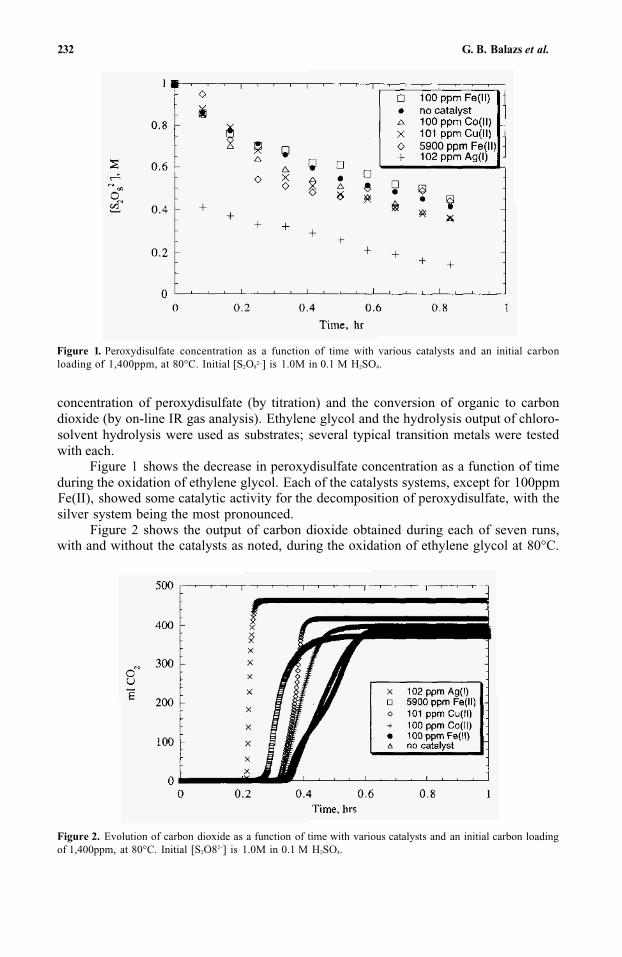
232 G. B. Balazs et al.
Figure 1. Peroxydisulfate concentration as a function of time with various catalysts and an initial carbonloading of 1,400ppm, at 80°C. Initial [S2O8
2–] is 1.0M in 0.1 M H2SO4.
concentration of peroxydisulfate (by titration) and the conversion of organic to carbon dioxide (by on-line IR gas analysis). Ethylene glycol and the hydrolysis output of chloro-solvent hydrolysis were used as substrates; several typical transition metals were tested with each.
Figure 1 shows the decrease in peroxydisulfate concentration as a function of time during the oxidation of ethylene glycol. Each of the catalysts systems, except for 100ppm Fe(II), showed some catalytic activity for the decomposition of peroxydisulfate, with the silver system being the most pronounced.
Figure 2 shows the output of carbon dioxide obtained during each of seven runs, with and without the catalysts as noted, during the oxidation of ethylene glycol at 80°C.
Figure 2. Evolution of carbon dioxide as a function of time with various catalysts and an initial carbon loadingof 1,400ppm, at 80°C. Initial [S2O82–] is 1.0M in 0.1 M H2SO4.
Transition Metal Catalysts for the Ambient Temperature Destruction of Organic Wastes 233
The expected output based on the amount of ethylene glycol initially added was 420ml CO2 with a system measurement precision of ±10%. All of the results fall within thisrange, but the silver system is noticeably different, both in terms of a higher CO2 outputas well as a much steeper rise. Although the latter result is expected due to the catalytic activity, a reason for the former observation is not known.
Previous work on the effect of transition metal catalysts on the rate of oxidation of organic substrates by peroxydisulfate18–20,29–34 focused primarily on the decomposition of the peroxydisulfate, and not on the mineralization of the organic. For the current work, it was felt that a more realistic approach with regard to waste treatment by DCO was to measure the overall Destruction and Removal Efficiencies (DRE’s) on a matrix of catalysts, temperatures, and organic substrates. In addition, most of this current work isfocused on 20–50°C as this regime is closer to temperatures likely to be encountered when using DCO to treat waste under close to ambient conditions. No additional oxidant was added in most cases, except as noted, in order to more closely simulate a “one-pass’’ treat-ment approach.
Results for ethylene glycol are shown in Figs. 3-5,while those for 1,3-dichloro-2-propanol are showed in Figs. 6 and 7. Tributyl phosphate is only partially soluble in water, and results with this organic substrate gave inconsistent results. The initial conditions of the tributyl phosphate experiments were such that the added level of organic was 1,700 ppm as carbon, but TOC results on this initial solution gave results of 200-300 ppmas carbon. Indeed, a second phase was observed on the walls of the reaction flasks and thus the data are judged to be invalid.
Figure 3. Cumulative Destruction and Removal Efficiency (DRE) for ethylene glycol (1,800ppm as carbon) at50°C with various catalysts.
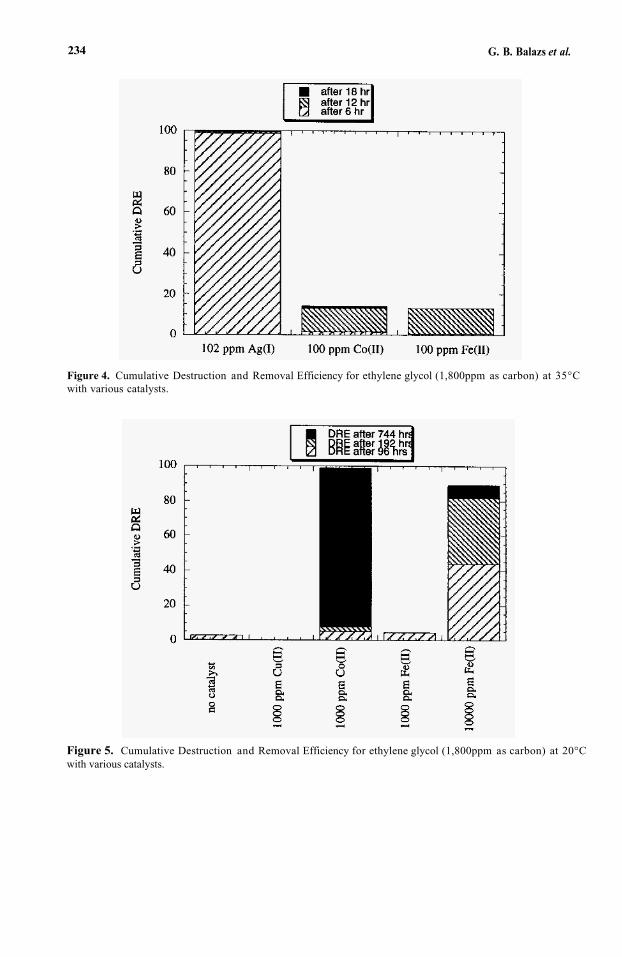
G. B. Balazs et al.234
Figure 4. Cumulative Destruction and Removal Efficiency for ethylene glycol (1,800ppm as carbon) at 35°Cwith various catalysts.
Figure 5. Cumulative Destruction and Removal Efficiency for ethylene glycol (1,800ppm as carbon) at 20°Cwith various catalysts.
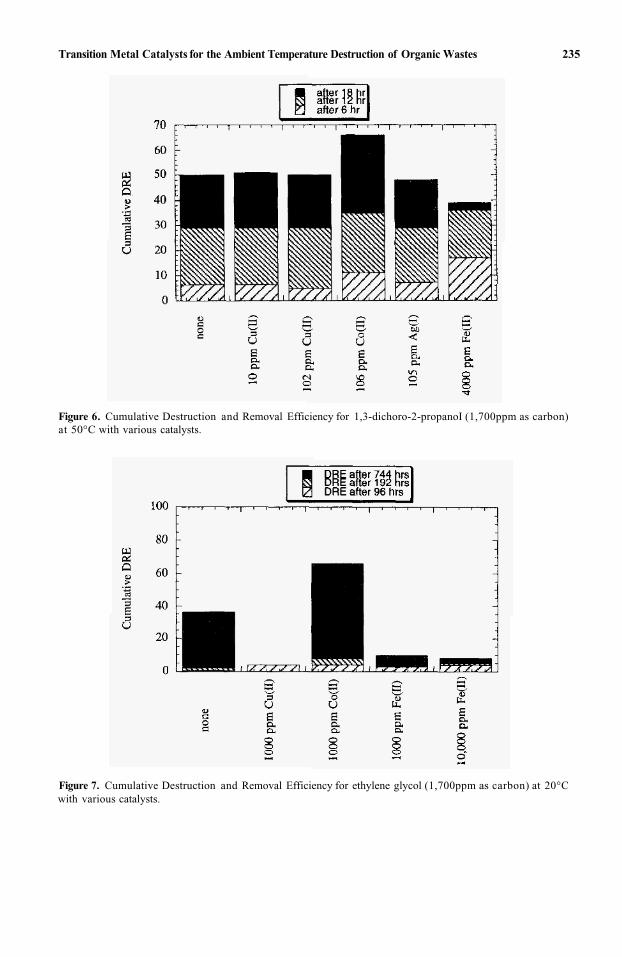
Transition Metal Catalysts for the Ambient Temperature Destruction of Organic Wastes 235
Figure 6. Cumulative Destruction and Removal Efficiency for 1,3-dichoro-2-propanoI (1,700ppm as carbon)at 50°C with various catalysts.
Figure 7. Cumulative Destruction and Removal Efficiency for ethylene glycol (1,700ppm as carbon) at 20°Cwith various catalysts.
236 G. B. Balazs et al.
5. CONCLUSIONS
As shown in Figs. 1 and 2, the concentration of peroxydisulfate decreases rapidly at 80°C due to its reduction by the organic and, to a lesser extent, water. All of the added transition metals tested had some effect (with the exception of low concentrations of iron), and this effect was towards an acceleration of the peroxydisulfate decomposition rate. In the case of ethylene glycol as the added organic substrate (Fig. 1), silver ion showed the highest perturbation, which is expected based on the fact that silver showedthe highest catalytic effect in the destruction tests. The effect of silver was not nearly as pronounced in tests where chloride ion was present. However, based on results obtained with and without catalysts at 80°C, peroxydisulfate does not appear to be a very aggres-sive oxidant at concentrations of less than about 0.3M. Catalysts did not change this cutoff value appreciably. Thus, any DCO waste treatment system would have to keep the oxidant concentration greater than 0.5 M for optimal efficiency.
During the experiments, it was noted that additional heat outputs were obtained at 80°C with the catalysts, and the amount of extra heat correlated well with the accelera-tion in peroxydisulfate decomposition/organic destruction. As noted in the organic destruction tests detailed in the following section, silver exhibited the most pronouncedeffect. As the oxidative destruction of organics is exothermic, any organic waste treat-ment system using peroxydisulfate must take into account the extra heat output encoun-tered when transition metal ions (especially silver) are present. As an additional safety note, the combination of an aggressive oxidant, the possible presence of chlorine species when treating chloro-organics, an exothermic reaction, and the possibility of reaction catalysis depending on the species present in the waste stream mandate that reactor mate-rial, sizing, throughputs, and heat generation be taken into consideration. In addition,because of the release of carbon dioxide gas, the system design and materials must incorporate means to prevent pressure buildup.
It was noted that, when treating chlorinated organics, catalysts also affected the production of chlorine gas. However, this effect followed no logical pattern; in some cases the chlorine production (observed by watching the reactor offgas trap color) was immediate and quantitative and in other cases it was minimal.
For the organic destruction tests on surrogate waste materials shown in Figs. 3-7, all of the transition metals studied exhibited some effect on the rate of oxidation of the organic substrates by peroxydisulfate, although the magnitudes varied greatly. This is not surpris-ing, as peroxydisulfate has a sufficient oxidation potential to oxidize all of the transition metals to their highest valent state, and the participation of these higher valence states in organic oxidations is well-known.35–38 It was generally the case that the transition metals which exhibited the most facile organic oxidation capability (Ag(II), Co(III), Fe(III)) also exhibited the most pronounced catalytic effect in these studies. Note that this order of cat-alytic effectiveness is surprisingly similar to the results obtained on Mediated Electro-chemical Systems as described in Refs 35-38.Although an all-encompassing maxim for the rate enhancements obtained with a specific catalyst is not possible, a general rule of thumb is that the effectiveness of the catalysts followed the general order Ag >> Co > Cu, Fe > Pt. Individual results varied depending on the temperature regime, the organic sub-strate, and the matrix. This has been noted before in the literature.18–20,29–34 The above results lead to the conclusion that catalysis of organic destruction by peroxydisulfate is merely due to the formation of another, favorably solvated transition metal cation with a high oxidation potential.
Transition Metal Catalysts for the Ambient Temperature Destruction of Organic Wastes 237
Complete destruction of the organics tested was achievable with silver as a catalyst, even at 20 °C in a relatively short time, and cobalt, iron or copper showed some enhance-ment although a much longer time was required. This result is backed by previous litera-ture studies as discussed above. However, it was also noted in this current study that different organic substrates exhibited different behavior with respect to catalysis.
In all the cases studied, the enhancement of the organic destruction rate was a func-tion of the catalyst concentration, and this is reflected in the literature as well (Eq. 4). Thus, higher rates of organic destruction can be achieved with higher catalyst con-centrations. Due to the copious data available in the literature, a systematic reinvestigation of the order of the catalyst concentration on the rate equation was not attempted.
Although rate equations such as that shown in Eq. 4 would predict that destruc-tion of organics might be faster with higher oxidant concentrations, the present work was not sufficiently detailed to either bolster or refute this statement. Additional oxidant made only a slight difference in DRE’s, at least at close to ambient conditions. However, with higher organic loadings it may be necessary to periodically replenish the oxidant in waste treatment systems. See also the following section regarding oxidant concentration.
During catalyzed oxidations, there is an incubation period during which the carbon content of the solutions is unchanged from the initial value. This is presumably reflective of the fact that oxidation is occurring, but has not proceeded to the stage of evolvingcarbon dioxide from the solution and thus the carbon content of the solution remains unchanged from the original value. This incubation period was not noticed with silver, as oxidations with this catalyst proceeded much faster than the sampling timescales at the temperatures tested.
In waste systems containing chloride ion, or containing organic chlorine, silver ionis ineffective as a catalyst. AgCl, being highly insoluble, immediately precipitates thus removing the active catalyst. Along these same lines, silver will be ineffective as a cata-lyst in systems where the pH is sufficiently high to result in the precipitation of silverhydroxide. In fact, this latter characteristic would presumably be extendable to all poten-tial transition metal catalysts in systems at high pH.
This work was performed under the auspices of the U.S. Department of Energy bythe Lawrence Livermore National Laboratory under contract number W-7405-ENG-48.
REFERENCES
1. Bryan Balazs, John Cooper, Peter Hsu, Pat Lewis, and Martyn Adamson, “Direct Chemical Oxidation: Destruction of chlorinated solvents by aqueous peroxydisulfate,” poster presentation, SERDP Symposium, Washington, D.C., December 3-5, 1997.
2. Peter Hsu, John Cooper, Bryan Balazs, Pat Lewis, and Martyn Adamson, “Process Engineering of DirectChemical Oxidation for the Treatment of Insoluble Chlorinated Solvents in Waste Streams," UCRL-JC-128142abs., presented at AlChE Spring National Meeting, New Orleans, LA, March 8-12, 1998.
3. Bryan Balazs, John Cooper, Peter Hsu, Pat Lewis, Joe Penland, Larry Finnie, and Martyn Adamson, “Integrated Direct Chemical Oxidation System for the Non-Thermal Destruction of Chlorosolvents,” WM ‘98 Proceedings, Tucson, AZ, March 1-5, 1998. UCRL-JC-128131.
4. John F. Cooper, Francis Wang, Roger Krueger, and Ken King, “Destruction of organic wastes with elec-trolytic regeneration of the oxidant,” Proc. Sixth International Conference on Radioactive Waste Man-agement and Environmental Remediation, Singapore, October 12-16 1997. UCRL-JC-121979 rev 2 July 1997.
5. John F. Cooper, G. and Bryan Balazs, “Demonstration of Omnivorous Non-thermal Mixed Waste Treatment: Direct Chemical Oxidation of Organic Solids and Liquids using Peroxydisulfate,” Final Report to Mixed Waste Focus Area, Oct. 1997.
238 G. B. Balazs et al.
6. J. Cooper, F. Wang, B. Balazs, R. Krueger, P. Lewis, T. Shell, J. Farmer, and M. Adamson, “Destruc-tion of organic wastes by ammonium peroxydisulfate,” presented at AIChE Spring National Meeting (March 9-13, 1997), Houston, TX, UCRL-MI-126794.
7. Cooper, J.F., Wang, F., Balazs, G.B., Shell, T., Krueger, R., Lewis, P., and Adamson, M., “Omnivorous Waste Destruction Process Using Uncatalyzed Peroxydisulfate Solutions,” poster presentation at WM ’97 conference, Tucson, Arizona, March 2–6, 1997, UCRL-MI-126764.
8. John F. Cooper, E Wang, J. Farmer, R. Foreman, T. Shell, and K. King, “Direct Chemical Oxidation of Hazardous and Mixed Wastes” (Proc. of the Third Biennial Mixed Waste Symposium, AmericanSociety of Mechanical Engineers; Aug. 1995), Lawrence Livermore National Laboratory Report UCRL-JC-120141 March 28, 1995.
9. John F. Cooper, F. Wang, J. Farmer, M. Adamson, K. King, and R. Krueger, “Direct Chemical Oxi-dation: Peroxydisulfate destruction of organic wastes,” Proc. World Environmental Congress, Interna-tional Conference and Trade Fair, Page 219, London Ontario, Sept. 17-22, 1995.
10. F. Wang, J.F. Cooper, J. Farmer, M. Adamson, and T. Shell, “Destruction of ion exchange resins by wet oxidation and by direct chemical oxidation-a comparison study,” Proc. World Environmental Congress, International Conference and Trade Fair, p. 206; London Ontario, Sept. 17-22, 1995.
11. John F. Cooper, Francis Wang, Roger Krueger, Ken King, Joseph C. Farmer, and Martyn Adamson, “Destruction of organic wastes by ammonium peroxydisulfate with electrolytic regeneration of the oxidant,” LLNL Internal Report, September 1995. UCRL-121979 Rev 1, October 10, 1995.
12. John F. Cooper, Roger Krueger, and Joseph C. Farmer, “Destruction of VX by aqueous-phase oxida-tion using peroxydisulfate: Direct chemical oxidation,” (Proc. Workshop on Advances in AlternativeDemilifarization Technologies, pp. 429–442, Reston VA September 2-7 1995, published by SAIC Aberdeen, MD).
13. John F. Cooper, Francis Wang, Roger Krueger, Ken King, Thomas Shell, Joseph C. Farmer, and Martyn Adamson, “Demonstration of omnivorous non-thermal mixed waste treatment: Direct chemical oxida-tion using peroxydisulfate,” First Quarterly Report to Mixed Waste Focus Group, SF2–3-MW-35 October-December 1995; UCRL-ID-123193, February 1996.
14. John F. Cooper (with Joseph C. Farmer, Francis T. Wang, and Martyn G. Adamson, “Alternatives to Incineration,” (Proc. ASME/EPRI Radwaste Workshop, New Orleans, LA, July 24-26 1996.)
15. John F. Cooper, Francis Wang, Thomas Shell, and Ken King, “Destruction of 2,4,6-trinitrotoluene using ammonium peroxydisulfate,” LLNL Report UCRL-ID-124585, July 1996.
16. W.M. Lattimer, “The oxidation states of the elements and their potentials in aqueous solutions,” Pren-tice Hall, NY.
17. “Peroxides and Peroxy Compounds, Inorganic,” Encyclopedia of Chemical Technology, V. 17, ed. Kirk Othmer.
18. D.A. House, “Kinetics and mechanism of oxidations by peroxydisulfate,” Chem. Rev. 62, 185, (1961). 19. Francesco Minisci, Attillio Citterio, and Claudio Giordano, “Electron-transfer processes: peroxydisul-
fate, a useful and versatile reagent in organic chemistry,” Acc. Chem. Res. v. 16 27 (1983). 20. Gary R. Peyton, “The free-radical chemistry of persulfate-based total organic carbon analyzers,” Marine
Chemistry 41, 91-103 (1993). 21. Robert E. Huie and Carol L. Clifton, “Temperature Dependence of the Rate Constants for Reactions
of the Sulfate Radical, SO4–, with Anions,” J. Phys. Chem., 94 (1990) 8561.22. Neta, P., Huie, R.E., and Ross, A.B., “Rate constants for reaction of inorganic radicals in aqueous solu-
tion,”J. Phys. Chem. Ref. Data, 17:1027–1284, 1988.23. I.M. Kolthoff and I.K. Miller, “The chemistry of persulfate. I. The kinetics and mechanism of the
decomposition of the persulfate ion in aqueous medium,” J. Am. Chem. Soc., p. 3055 July (1951). 24. P.D. Goulden and D.H.J. Anthony, “Kinetics of uncatalyzed peroxydisulfate oxidation of organic mate-
rial in fresh water,” Anal. Chem. 50(7) 953 (1978). 25. Model 700 TOC Total Organic Carbon Users Manual, (O.I. Analytical, Inc.; Graham road at Wellborn
Rd. PO Box 2980; College Station TX 77841-2980).26. Walter C. Schumb, Charles N. Satterfield, and Ralph L. Wentworth, Hydrogen Peroxide, (Reinhold Pub-
lishing, Inc., New York, 1955).27. Wolfgang Thiele and Hermann Matschiner, “Zur elektrosynthese von Wasserstoffperoxid und Perox-
odisulfaten, Teil I. Wasserstoffperoxid und Peroxodischwefelsauer,” Chem. Techn. v. 29(3) p. 148 (1977).28. “Uses of Persulfate,” FMC, Inc. Buffalo Ny; 1951; 1960. 29. T.L. Allen, “The oxidation of Oxalate ion by Peroxydisulfate,” J. Am. Chem. Soc, 73, 3589 (1951). 30. D.I. Ball, M.M. Crutchfield, and J.O. Edwards, “The Mechanism of the Oxidation of 2-Propanol by
Peroxydisulfate Ion,” J. Org Chem., 25, 1599 (1960).
Transition Metal Catalysts for the Ambient Temperature Destruction of Organic Wastes 239
31. A.R. Gallapo and J.O. Edwards, “Kinetics and Mechanisms of the Spontaneous and Metal-ModifiedOxidations of Ethanol by Peroxydisulfate Ion,” J. Org Chem. 36, 4089 (1971).
32. C. Walling and D.M. Camaioni, “Role of Silver (II) in Silver-Catalyzed Oxidations by Peroxydisulfate,”J. Org. Chem., 43, 3266 (1978).
33. M.G. Ram Reddy, B. Sethuram, and T.N. Rao, “Kinetics of Decomposition of Peroxydisulphate in thePresence of Mannitol Catalyzed by Ag+,” Z. Phys. Chem., 256, 875 (1975).
34. V.N. Kislenko, A.A. Berlin, and N.V. Litovchenko, “Kinetics of Oxidation of Organic Substances byPersulfate in the Presence of Variable Valence Metal Ions,” Kinet. Catal. (Trans. of Kinet. Katal.), 37.767(1996).
35. Joseph Farmer, “Electrochemical Treatment of Mixed and Hazardous Wastes,” (Chapter in “Environ-mental Oriented Electrochemistry.” ed. Cesar A.C. Sequeira, Elsevier Science Publishers B.V., Amster-dam, The Netherlands; 1994).
36. Zoher Chiba, Bruce Schumacher, Patricia Lewis, and Laura Murguia, “Mediated electrochemical oxi-dation as an alternative to incineration for mixed wastes” (Proc. Waste Management 95 Symposium,Tucson, Arizona ,March I , 1995).
37. Joseph C. Farmer, Francis T. Wang, Patricia R. Lewis, and Leslie Summers, “Destruction of chlorinatedorganic by cobalt(III)-mediated electrochemical oxidation,” J. Electrochem Soc. v. 139(11) 3025 (1992).
38. “Destruction of Hazardous and Mixed Wastes using Mediated Electrochemical Oxidation in aAg(II)/HNO3 Bench Scale System,” Balazs, B., Chiba, Z., Hsu, P., Lewis, P. Murguia, L., Adamson,Martyn, ICEM ‘97 Proceedings (Singapore, Oct. 12-16, 1997), UCRL-126754.

This page intentionally left blank.
CONTRIBUTORS
Martyn G. AdamsonLawrence Livermore National Laboratory Mail Code L-092Livermore, CA 94550
Fax: 925-423-4897e-mail: [email protected]
D. D. AdrianDepartment of Civil & Environmental Engineering Louisiana State UniversityBaton Rouge, LA 70803
Akram N. AlshawabkehDepartment of Civil & Environmental Engineering Northeastern UniversityBoston, MA
*Thomas AndrewsIn-Situ Oxidative Technologies, Inc.Lawrenceville, New Jersey TN: 609-275-8500 ext. 120Fax: 609-275-9608
G. Bryan Balazs Lawrence Livermore National Laboratory Mail Code L-092Livermore, CA 94550
Fax: 925-423-4897e-mail: [email protected]
J. K. BewtraCivil & Environmental Engineering College of Engineering & ScienceUniversity of WindsorWindsor, Ontario, Canada N9B 3P4
TN: 925-423-5403
TN: 925-423-5403
241
Contributors242
John V. BishopVanTek Corporation Midland, Mi
N. Biswas Civil & Environmental Engineering College of Engineering & ScienceUniversity of WindsorWindsor, Ontario, Canada N9B 3P4
Kevin C. Bower Department of Civil Engineering 210 Auburn Science and Engineering Center University of AkronAkron, OH 44325-3905
Fax: 330-972-6020e-mail: [email protected]
G. BreitenbeckDepartment of AgronomyLuoisiana State University Baton Rouge, LA 70803
Ting-Chien Chen Department of Environmental Engineering and Health Tajen Junior College of PharmacyEn-Pu Hsiang, Pingtung Taiwan
John F. CooperLawrence Livermore National Laboratory Mail Code L-092Livermore, CA 94550
Fax: 925-423-4897e-mail: [email protected]
David Devlin Los Alamos National Laboratory
Los Alamos, NM 87545
Fax: 505-6655-4459e-mail: [email protected]
Stephen Duirk Department of Civil Engineering 210 Auburn Science and Engineering Center
TN: 330-972-5915
TN: 925-423-5403
NMT-11 MS-E505
TN:505-665-7149
Contributors
University of AkronAkron, OH 44325-3905
Fax: 330-972-6020e-mail: [email protected]
R. S. DyerU.S. Environmental Protection Agency Office of International Activities Ronald Reagan Building 1300 Penn Avenue Washington, DC 20004
Stefan Foy In Situ Research Group Department de géologie et de genie géologique, Université Laval, Sainte-FoyQuebec, Canada G1K 7P4
*R. J. Gale Department of ChemistryLouisiana State University Baton Rouge, LA 70803
Fax: 504-388-3458
Pierre J. Gélinas In Situ Research Group Department de géologie et de genie géologique, Université Laval, Sainte-FoyQuebec, Canada G1K 7P4
Richard S. GreenbergIn-Situ Oxidative Technologies, Inc. Lawrenceville, New Jersey TN: 609-275-8500 ext. 120 Fax: 609-275-9608
Alain Hébert In Situ Research Group Department de géologie et de genie géologique, Université Laval, Sainte-FoyQuebec, Canada G1K 7P4
Dallas Hill Los Alamos National Laboratory
Los Alamos, NM 87545
TN: 330-972-5915
TN: 504-388-3361
NMT-11 MS-E505
TN: 505-665-7149
243
Contributors244
Fax: 505-665 5-4459e-mail: [email protected]
*P. K. Andrew Hong Department of Civil & Environmental Engineering University of Utah Salt Lake City, UT 841 12
Fax: 801-585-5477e-mail: [email protected]
*Maria Inman Faraday Technology, Inc. 315 Huls Drive Clayton, OH 45315
Fax: 937-836-9498e-mail: [email protected]
A. Jackson Department of Civil & Environmental Engineering Louisiana State University Baton Rouge, LA 70803
*Chad T. JafvertPurdue University School of Civil Engineering 1284 Civil Engineering Bldg. West Lafayette, IN 47907
Fax: 765-496-1 107 e-mail: [email protected]
Weimin Jiang Department of Civil & Environmental Engineering University of Utah Salt Lake City, UT 841 12
Fax: 801-585-5477e-mail: [email protected]
Prasad K. C. Kakarla In-Situ Oxidative Technologies, Inc. Lawrenceville, New Jersey TN: 609-275-8500 ext. 120 Fax: 609-275-9608
*P. D. KalbDepartment of Advanced Technology
TN: 801-581-7232
TN: 937-836-7749
TN: 765-496-2196
TN: 801-581-7232
Contributors
Environmental & Waste Management GroupBuilding 830, P.O. Box 5000 Upton, NY 11973-5000
Fax: 5 16-344-4486e-mail: kalb@bnl. gov
Sherman Kottle Lake Service Company Lake Jackson, TX
e-mail: [email protected]
René Lefebvre In Situ Research Group INRS-Géoressources2535 boulevard Laurier C.P. 7500 Sainte-Foy, Quebec, Canada G1V 4C7
Fax: 418-654-2615
Patricia R. Lewis Lawrence Livermore National Laboratory Mail Code L-092Livermore, CA 94550
Fax: 925-423-4897e-mail: [email protected]
Chelsea Li Department of Civil & Environmental Engineering University of UtahSalt Lake City, UT 841 12
Fax: 801-585-5477e-mail: [email protected]
Michele E. LindseyDepartment of Chemistry University of New Orleans New Orleans, LA 70148 TN: 504-280-6323Fax: 504-280-6860e-mail: [email protected]
*Krishnanand Maillacheruvu Department of Civil Engineering & Construction
TN: 5 16-344-7644
TN: 409-297-5256
TN: 418-654-2604
TN: 925-423-5403
TN: 801-581-7232
245
Contributors246
Bradley University Peoria, IL
Fax: 309-677-2867e-mail: [email protected]
Abdul Majid Institute for Chemical Process & Environmental Technology National Research Council of Canada Montreal Road Campus Ottawa, Ontario, K1A OR6, Canada
Fax: 613-94 1-1 57 1e-mail: [email protected]
*Richard Martel In Situ Research Group INRS-Géoressources2535 boulevard Laurier C.P.7500Sainte-Foy, Quebec, Canada G1V 4C7
Fax: 418-654-2615
W. R. Michaud U.S. Environmental Protection Agency Office of International Activities Ronald Reagan Building 1300 Pennsylvania Avenue Washington, DC 20004
D. A. Michels Chemistry & BiochemistryCollege of Engineering & ScienceUniversity of WindsorWindsor, Ontario, Canada N9B 3P4 TN: 519-253-3000 ext. 3526 Fax: 519-973-7098e-mail: [email protected]
L. W. Milian Department of Advanced Technology Environmental & Waste Management Group Building 830, P.O. BOX 5000Upton, NY 11973-5000
Fax: 5 16-344-4486e-mail: [email protected]
TN: 309-677-3764
TN: 613-990-1769
TN: 4 18-654-2604
TN: 516-344-7644
Contributors
*Christopher M. Miller Department of Civil Engineering 210 Auburn Science and Engineering Center University of AkronAkron, OH 44325-3905
Fax: 330-972-6020e-mail: [email protected]
H. R. MonsefChemistry & BiochemistryCollege of Engineering & ScienceUniversity of WindsorWindsor, Ontario, Canada N9B 3P4TN: 519-253-3000 ext. 3526 Fax: 519-973-7098e-mail: [email protected]
Debbra L. MyersMitisubishi Silicon America South Campus 3990 Fairview Industrial Drive. SESalem, OR 97302
E. Oszu-AcarElectrokinetics Inc. 11552 Cedar Park Avenue Baton Rouge, LA 70809
Dennis Padilla Los Alamos National Laboratory
Los Alamos, NM 87545
Fax: 505-6655-4459e-mail: [email protected]
J. H. PardueDepartment of Civil & Environmental Engineering Louisiana State University Baton Rouge, LA 70803
Robert W. Peters Energy Systems Division Argonne National Laboratory Argonne, IL 60439-48 15
*Frederick G. PohlandDepartment of Civil & Environmental Engineering
TN: 330-972-5915
NMT-11 MS-E505
TN: 505-665-7149
247

Contributors248
University of PittsburghPittsburgh,PA 15261
Fax: 412-624-0135e-mail: [email protected]
F. Coyne Prenger Los Alamos National Laboratory
Los Alamos, NM 87545
Fax: 505-6655-4459 e-mail: [email protected]
M. F. RabbiDepartment of Civil & Environmental Engineering Louisiana State University Baton Rouge, LA 70803
Liz A. Ramer Department of Civil & Environmental Engineering, 116 ERFUniversity of IowaIowa City, IA 52242
Annie Roy In Situ Research Group INRS-Géoressources2535 boulevard Laurier C.P. 7500 Sainte-Foy, Quebec, Canada G1V 4C7
Fax: 418-654-2615
Nathalie Roy In Situ Research Group INRS-Géoressources2535 boulevard Laurier C.P.7500Sainte-Foy, Quebec, Canada G1V 4C7
Fax: 418-654-2615
Laurent Saumure In Situ Research Group Department de géologie et de genie géologique, Université Laval, Sainte-FoyQuebec, Canada G 1 K 7P4
TN: 412-624-1880
NMT-11 MS-E505
TN: 505-665-7149
TN: 418-654-2604
TN: 4 18-654-2604

Contributors
Jerald L. Schnoor Department of Civil & Environmental Engineering, 116 ERFUniversity of IowaIowa City, IA 52242
R. K. SealsDepartment of Civil & Environmental Engineering Louisiana State University Baton Rouge, LA 70803
*Bryan D. Sparks Institute for Chemical Process & Environmental Technology National Research Council of Canada Montreal Road Campus Ottawa, Ontario, K1A OR6, Canada
Fax: 613-941- 1571e-mail: [email protected]
Robert A. Stowe VanTek Corporation Midland, MI
Timothy J. Strathmann Purdue University School of Civil Engineering 1284 Civil Engineering Bldg. West Lafayette, IN 47907
Fax: 765-496-1 107 e-mail: jafvert@ecn. purdue. edu
*Matthew A. Tarr Department of ChemistryUniversity of New Orleans New Orleans, LA 70148
Fax: 504-280-6860e-mail: [email protected]
E. Jennings Taylor Mitisubishi Silicon America South Campus 3990 Fairview Industrial Drive. SE Salem, OR 97302
*K. E. Taylor Chemistry & BiochemistryCollege of Engineering & Science
TN: 613-990-1769
TN: 765- 496 -2196
TN: 504-280-6323
249

250
University of WindsorWindsor, Ontario, Canada N9B 3P4 TN: 519-253-3000 ext. 3526 Fax: 5 19-973-7098e-mail: [email protected]
*Phillip L. ThompsonDepartment of Civil & Environmental Engineering, Room 524 ENGR Seattle University Seattle, WA 98 122
Fax: 206-296-2 173 e-mail: [email protected]
Radisav D. Vidic Department of Civil & Environmental Engineering University of PittsburghPittsburgh, PA 15261
Fax: 41 2-624-0 135 e-mail: [email protected]
Richard J. WattsDepartment of Civil & Environmental Engineering Washington State University Pullman, Washington
*Laura A. Wori Los Alamos National Laboratory
Los Alamos, NM 87545
Fax: 505-6655-4459e-mail: [email protected]
S. P. YimKorean Atomic Energy Research Institute Nuclear Environment Management Center 150 Dukjin-dongYusong-gu, Taejon 305-600Korea
Pu Yong Department of Civil & Environmental Engineering, 116 ERF University of IowaIowa City, IA 52242
TN: 206-296-5521
TN: 412-624-1880
NMT-1 1 MS-E505
TN: 505-665-7149
Contributors

Contributors
Chengdong ZhouMitisubishi Silicon America South Campus 3990 Fairview Industrial Drive. SESalem, OR 97302
251

This page intentionally left blank.
INDEX
Acid-base equilibria, 11Actinide particles, 5, 193 Actinides, 5, 193, 217Activation. neutron, 207Activity
enzymatic, 144midrobial, 69-78
Advanced oxidation processes (AOP), 4, 167 Agglomeration, 40, 44 Alcohols, 55-60, 94 Ammonium hydroxide. 30Ammonium ion, 31 Anaerobes, 69Analyzer, on-line, 207Anilines, 141, 144, 147 Arochlor 12, 48, 6 I Aromatics, 90Ash, 47
Bacteria. 1, 61 Benzene, 153Benzidines, 141Benzoic acid, 84Biomass, 113Bioremediation, 29, 37, 7 I, 82 Butyl alcohol. 58
Calcium hydroxide, 9Catalysts, transition metal, 229Catechol, 171Cement, sulfur-polymer,187–197Chelation, 9-18
agentsEDTA, 9GCG. 9NTTA. 9recovery, I2selectivity, 11strength, 13TMDTA, 9
Chemical oxidation, 5Chromate, I26Coal, 43Cobalt, 229
Compounds, oxygen releasing, 129Conductivity, electrical, 30Contamination
aquifers, 93inorganic walls, 131oil, 44 organic walls, 13Isubsurface, 73
Copper. 229Cosolvents, 3, 93, 99 Costs
electrokinetic, 37encapsulation, 205treatment walls, 131–133
Coupling. oxidative, 141Critical micelle concentration (cmc), 95Cyclodextrins, 100
Design, treatment wall. 121 Dichloroethylene. 128Dichloropropanol. 229Distillation, 42DNAPL. 55-60. 82, 94
Efficicncies, destruction and removal. 233 Electric current, 3, 69, 76, 77 Electric fields, 69Electric fields, modulated reverse, 21, 23 Electrical conductivity, 45Electrochemical oxidation, 5Electrode plates, 74Electrodes, 21Electroosmosis, 30Encapsulation, 5, 17
nitrate salts, 199sulfur-polymer, 188 vinylmethylpolysiloxane, 199
Energy, thermodynamic, 95Engineered barriers, 1Ethylbenzene, 153Ethylene glycol, 234Extraction zones, 58Extraction. multistage, 48
253
254
Extruder, 180Extrusion processes, 4
Fenton chemistry, 3, 81, 153 Ferric chloride, 9Ferrous salts, 150Ferrous sulfate, 147Filters, microbial, 130Final disposal, 42Final waste forms, 4Fixation. heavy metals, 48-50Flooding
polymer, 61water, 60
Flow paths, 30
Gradient, electrical, 35Groundwater, 3, 93, 109, I19 Gypsum, 43
Heavy metals, 2, 9, 21, 39 Heavy oil contamination, 39HGMS, 217Hydrogen peroxide, 83, 141, 167 Hydrogen, 230Hydrology, 121Hydrophobic compounds, 90Hydroquinone, 171Hydroxyl production, 3Hydroxyl radical, 83, 86-87, 167
Incineration, 42Injection, I53
bacteria, 61electrokinetic, 29
Ion exchange cathodes, 23Ion exchange, 21Iron chemistry, 83Iron walls, 125Iron, 141, 167, 212, 229 ISOTEC, 154
Laccases, 14 1Landfill, 42Leaching, 40, I81, 196, 199, leach rates, I81
cadmium, 204heavy metals, 45, 203 salts, 45, 49-50
Lead. 26-27, 52 Lignin, 47Limonene, 60LNAPL, 93LOMI. 207
Magnet. superconducting, 217Magnetic separation, 5Manganese, 167Mass transfer, 24Mercury, 52
Metabolites, 30Metal
binding, 40chemistry, 10complexation, 11fixation reagent, 44, 46 leaching, 199oxide reactions, 168reduction, zero-valent, 141speciation, 10
Methyl ethyl ketone, 128Methylosinu. trichosporium, 1 30 Micelles, 55, 94, 9S
Microbial activity, 3Microemulsions, 94
middle phase, 97Microencapsulation, 177–1 85 Mobilization
diesel, 65in situ, 63
reverse, 97
Modulated reverse electric fields, 2Modulation, cathodic, 23Molding techniques, I82Monitoring
site, 161treatment wall, 124
Nanoparticles, 2 18 NAPL, 55–60, 93–95 Nickel, dendrite structures, 227Nitrobenzene, 4, 141, 146
stability, 150Nutrients, 1, 29, 73
Organic matter, 81Oxidation
direct chemical, 229electrochemical, 230
Oxidative coupling, enzyme-based, 141Oxygen, dissolved concentrations, 74, 77 Ozonation, 167, 171
Particlesactinide, 217paramagnetic, 217
Peat moss, 43, 47 Pentachlorophenol, 84, 88 Perhydroxyl radical, 168Permeability
electroosmotic, 31hydraulic, 30
Peroxidases, 129, 141 Peroxydisulfate. 229
in acidic sands. 26control, 30, 119 effect, 149, 2I2 front, 22
PH
Index
Index
pH (cont.)neutral, 83, 17 I optima, 153 profile, 22 in soil, 31variation, 69
Phase diagrams, 64 Phenol. 84, 141, 167, 172-173Phosphate rock, 47 Phytoremediation, 1, 3, 109 Plutonium oxide, 223 Polyaromatics, 142Polychlorinated biphenyls, 229 Polyethylene, 4, 177 Poplar trees, 3, 109 Potential difference, 209 Precipitants
cationic, 9 iron salts, 144 metal, 17
Pump-and-treat, 93
Radical, hydroxyl, 81Radioactive waste treatment, 4 Reactions
initiation, 168 redox, 143, 230
batch-fed, 74hot wall, 227
arochlor, 61diesel fuel, 63
Reactor
Recovery
Redox potential, 1 19 Reduction
nitrobenzene, 143-147zero-valent, 143
Regulatory issues, treatment walls, 134–1 35 Remediation
chromate, 126 design. 100 dichloroethylene, 128 full-scale, 161 . groundwater, I 19, 128, 151, 153methyl ethyl ketone, 128 nitroaromatics, 141 in situ, 83 TNT. I12 tree systems, 109 trichloroethane, I27 vinyl chloride, 128
Removal, aniline, 145, 146 Resorcinol, 17 I Response surface, 158
Safety, 207 Sand
columns, 58 muscatine, 167
255
Sand (cont.)phosphogypsum, 190
Saturation, oil, 60 Scavengers, oxygen, 147 Sediments, 60Separation
liquid and solid, 40 magnetic, 217 membrane, 42
Silver, 229 Sludge, scrubber, 47 Sodium sulfite, 147 Soil
agglomeration, 40 contamination, 83 electric fields in, 7 Ielectrokinetic treatment, 2, 2 I excavation, 21extraction, 2.9, 39incineration. 1 treatment, 2 washing 1, 3, 55
Solidification, 177–185, 199 Solids analysis, 5 1Solubility, 64–65, 97, 183 Solvent extraction, 39Strength, compressive, 181, 194, 202 Sulfate ion, 31 Sulfur, 5, 87 Superoxide anion, 168 Surfactants, 3, 55, 93–94 Surveillance. nuclear material, 21 7
Technologyevolution. I in situ, 56
Times Beach. I TNT-contaminated groundwater. 3. 109Toluene, 39, 60, I53 Toxicity characteristics, 40 Transpiration, 114 Transport, sulfate, 35Treatment walls, 119 Tributyl phosphate, 220 Trichloroethane, 127, 130 Trickle bed filters, I
Uranium, 177–178
Vanadous ion, 207 Velocity, injection, 55Vinyl chloride, 128 Vinylmethylpolysiloxanc, I90
Wallsfor inorganic contaminants, 131for organic contaminants, 131 treatment, 119

256
Wash direction, 55 Waste
assay, 5 destruction, organic, 229 forms, 182 loading. optimum, 193 mixed low-level, 199stabilization, 187, 200 surrogate, 200
chemistry, 10 Water
Index
Water (cont. )use, 113
Wells, monitoring. 125 Winsor, Type 1, II, Ill, 57-59, 94–96
Xanthan gum. 59 Xylenes, 153
Yield strength, I83
Zeta potential, electrokinetic, 31