Embed Size (px)
Citation preview

181
23
Emergy Evaluation of the Tidal Power Plant in
Saemanguem, Korea
Laura Hija J. Kim and Suk Mo Lee
ABSTRACT
The region of Saemangeum for this study is influenced by two major rivers, Dongin and Mankyung.
Currently, a 33㎞ long seawall has been constructed for the purpose of reclamation of 283㎢ land
area and fresh water reservoir area of 118㎢ for the major national internal development project,
planned for its completion by 2030. The Saemangeum provides an optimal location for tidal power
generation with 3.93m tide range and existing seawall, which accounts for a large part of the cost
advantage. The study shows that the electricity emergy value is 7.22E+20 seJ/yr, which is equivalent
to 211 billion Em₩/yr in terms of emergy-based currency equivalent value. The EYR is 5.14, which
suggests that the contribution to the economy provided by this alternative energy source is large
enough to be able to compete with other fossil sources. ELR equals to 0.24 indicates a relatively
minimal loading on the local environment. The ESI equals to 21 indicate that the sustainability of the
system is very high. Due to the consistent flow of seawater through the tidal power generation plant,
tidal flat is expected to rehabilitate its system and restore other marine products as well. The result of
this analysis is the recovering productivity of shellfishes, seaweeds and fish production. The total
emergy value for those three items was 4.74E +19 seJ/yr and their ecologic-economic value was
calculated for the amount of 13.8 billion Em₩/yr. Furthermore, a reduction of 563,340 tons of carbon
emission by the tidal power generation is expected, which has a benefit of CDM revenue of 10.2 billion
Em₩/yr. Thus, emergy cost and benefit analysis show high feasibility of the tidal power generation
with 3.66 (B/C ratio), confirmed as a net benefit of 171 billion Em₩/yr.
INTRODUCTION
Many of the advanced countries have set up mid to long-term goals to reduce greenhouse gas
emissions in response to climate change. Amid such policies, industries related to prevention or
mitigation of climate changes, including new and renewable energy sources, are growing fast.
Therefore the emission trading scheme is getting larger and larger providing an impetus for a carbon
market toward spontaneous growth. Korea has 97% of energy resources met by energy imports which raises major concerns. These
concerns must be urgently addressed. Since most of its energy sources depend on imports, Korea must
respond quickly to both climate change and natural resource crisis. According to local statistics on
alternative energy sources in Korea, most of the sources are from waste and hydro power. There are
few clean alternative energy sources available for use currently. Marine energy sources including tides,
tidal current and wind among others have a high transformation efficiency and relatively high energy
concentration which suggests that they can provide low cost energy. The mid-west coastal area of
Korean peninsula is one of 5 best worldwide recognized locations for great potential tidal power
development as an alternative energy resource to fossil fuels which can be developed on a large scale.
Historically, Korea has been through a series of reclamation in the last decades for the purpose of
expansion of the land, securing of industrial and farmlands, and water reservoirs. As a result, 20.4% of
the total tidal flat disappeared during the 1987 to 2005 period (MLTM, 2009), causing tremendous side
effects on the environment, society and economy. These drastic changes require careful analysis.
182
The Saemangeum project is one of the flagship reclamation projects in the country. In 2010,
33km long seawall connecting Gunsan and Buan was completed followed by reclaimed land of
283km2
and a basin of 118 km2 for a national development plan which has to be developed by 2030.
Originally, the project was intended to increase agricultural land and foster better rural community
focusing entirely on agriculture and fishery. After a series of discussions, the national final goal was to
create a city for international businesses, tourism and leisure in 2009 (MLTM, 2009). At the same
time, the Saemangeum project has faced many challenges including transparency of the economic
feasibility on worsening water quality and aggravating ecosystem. The worsening water quality is the
greatest challenge of all. In order to address the effect on the issue, a total of 2,900 billion ₩/yr will be
invested by the government (MKE, 2011).
The total area of 208 km2 lost due to the reclamation is posing tremendous threats such as loss of
habitats and a decrease in the biodiversity (KEI, 2007).
As part of defense, the Saemangeum provides an optimal location for tidal power generation with
tidal range of 3.93m and a constructed seawall which accounts for a large part of the costs for the tidal
power generation. Tidal power generation at the Saemangeum region can best serve the goal of
decreasing the emissions of greenhouse gases or acid rain associated with fossil fuel generated
electricity. The tidal energy is a renewable source; it reduces environmental pollution, develops a new
growth trend and creates jobs for local community. Furthermore, the movement of seawater will
facilitate the rehabilitation of tidal flat.
Existing economic methodologies for the feasibility of the alternative energy sources, however,
have excluded the natural environmental contribution to human and their economic values.
For the purpose of this study, there is the need to quantify the value of natural resources and
human economic value. Therefore, we evaluate with emergy as a common unit to assess natural
resource consumption and economic value, and the feasibility of the Saemangeum tidal power project.
THEORETICAL BACKGROUND
Tidal Power Generation
Most coasts in the world experience two high tides and two low tides each day. Tidal power
converts the difference between high and low tides into electricity. A seawall is built to capture the
energy from masses of water moving in and out of a bay or river due to tidal forces (Kim et al., 2006;
Oh et al., 2007). The greater the tidal difference is, the larger the basin is, and the shorter the seawall
is, the more advantageous to have a tidal power plant (Lee et al., 2009; MKE, 2006).
Once installed, a tidal plant requires relatively low operating costs, with its annual maintenance
cost being only 3.36% of the total investment. In addition, it can be used on a sustainable basis and,
since the amount of seawater moving in and out is generally stable, is predictable over a long period of
time in terms of output. Tidal power is also free from the influence of the weather and clean enough to
cause no greenhouse gas emissions, waste and pollution. The seawall can also serve as a tourist
destination (MKE, 2006).
On the disadvantages, changing tidal flows by damming the bay or estuary could, however, result
in negative impact on aquatic and shoreline ecosystems. Tidal power also requires a great deal of
initial investment, especially in building a seawall, and is less efficient than thermal power or nuclear
power. In addition, it may change coastal ecosystem affecting food chain of birds. All these factors
contribute to the low level of tidal power utilization around the world (Oh, 2007).
Feasibility of Tidal Power Generation in Saemangeum
According to the international energy framework and Ocean Energy System in the extensive
natural resources of ocean energy, the evaluated yearly generation quantity reached up to 93,000TWh,
and exceeded five times over the world's yearly generation amount, nor emit CO2. As such, it could be
able to stabilize the reliable clean and renewable energy source. Furthermore, it could be developed in

183
a large scale as it is a highly concentrated type of energy and advantageous in the coast of space for
energy production. But, available locations are limited as well as sufficient technical support with
accompanied economical demand (KMI, 2010).
The types of available ocean energy are the tidal power, tidal current, wave power, seawater
temperature variation power, seawater salinity variation power and ocean wind power.
The Saemangeum region at an existing seawall would be able to utilize self-supporting energy
development from the tidal power generation. In addition, the tidal flats are expected for recovery from
circulating seawater in and out of basin through the seawall. Furthermore, the tidal flat
conservation/restoration movements around the world are obviously active, thus this study can provide
a case study for rehabilitation of tidal flat.
STUDY AREA
As shown in Figure 1, the Saemangeum area, which accommodates the world’s longest seawall
(33 km) between Gunsan and Buan is located at the estuary of the Mangyeong River and Dongjin River.
The Mangyeong River is 77.4 km long, running slow with a lot of bends. Its basin area is 1,527 km2. The Dongjin
River (46.1 km) is shorter than the Mangkyung River and its basin area is 1,129 km2 (Lee, 2004).
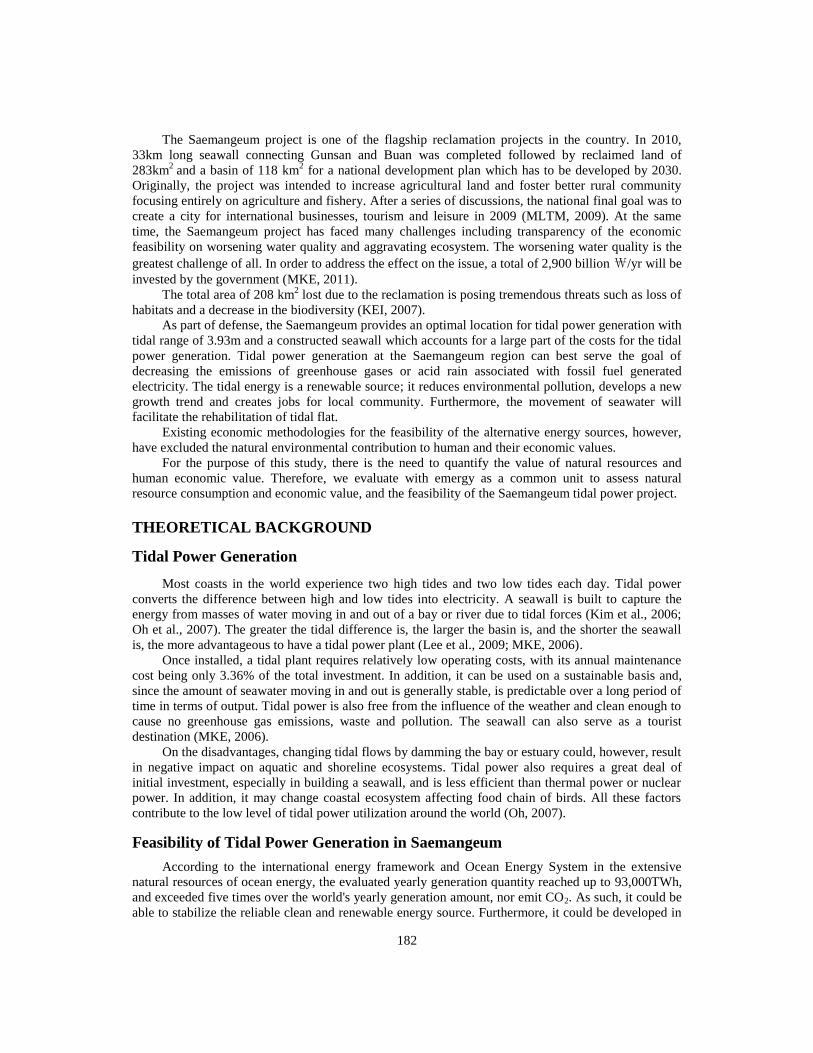
The purpose of Saemangeum reclamation project is to create a ‘globally recognized
Samangeum’, which will serve as a center stage for economic development, tourism prosperity and
well-protected ecosystems. The outer facilities are now complete after construction between 1991 and
2010. A total of 2,800 billion₩ was spent on the project up to year 2009 and another 20,800
billion₩ will be invested for the improvement of water quality. In 1991 the internal development plan
focused on the expansion of Korea’s territorial land, securing of a freshwater source, agricultural land
and improving the welfare of rural areas. The ratio of agricultural and non-agricultural lands changed
from 70:30 in 2007 to 30:70 in 2008. After such series of changes, the objective for the development
of the Saemangeum area was approved to develop a prime commercial and residential zone. This is
shown in Figure 2 (MLTM, 2010; www.isaemangeum.co.kr, 12. 2010).
The average tidal range around the seawall in the region is 3.93m; it is suitable installing a tidal
power plant facility at the existing seawall. The system boundary is 185㎢, the same area as the
interior system boundary of the basin.
Figure 1. Map of Saemangeum area (Lee, 2006).
184
Figure 2. Seamangeum land use planning (www.isaemangeum.co.kr).
Proposed Tidal Power Plant for the Saemangeum Area
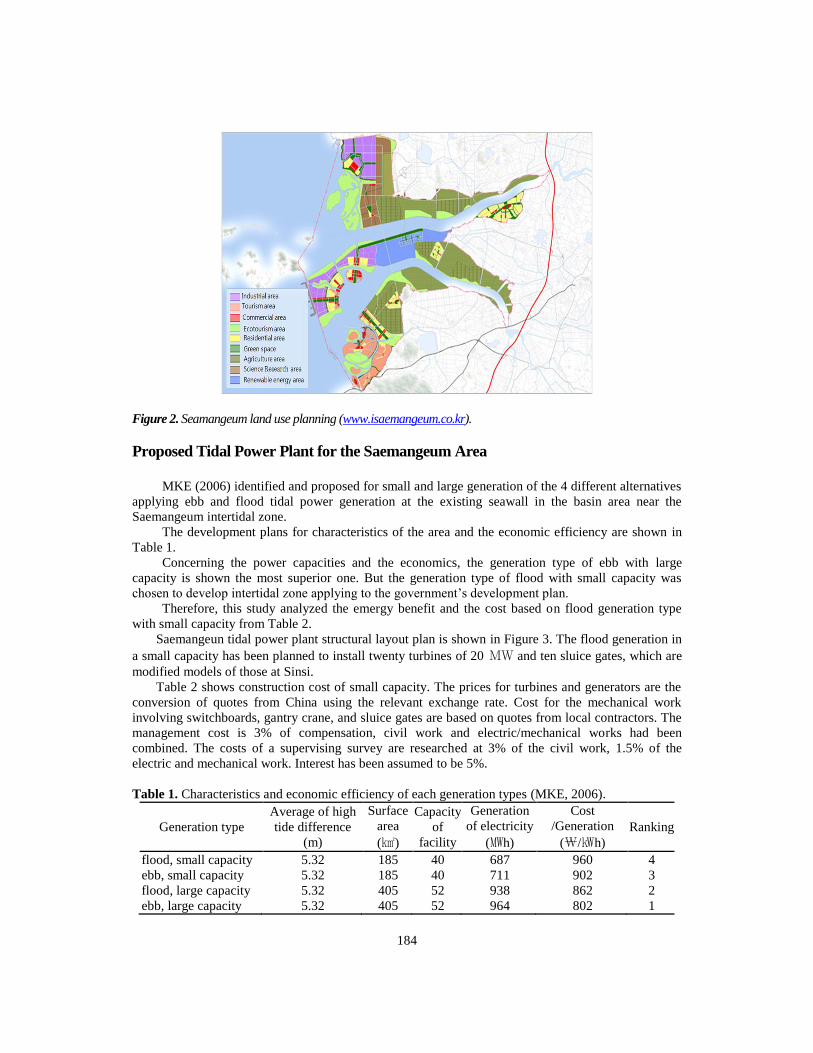
MKE (2006) identified and proposed for small and large generation of the 4 different alternatives
applying ebb and flood tidal power generation at the existing seawall in the basin area near the
Saemangeum intertidal zone.
The development plans for characteristics of the area and the economic efficiency are shown in
Table 1.
Concerning the power capacities and the economics, the generation type of ebb with large
capacity is shown the most superior one. But the generation type of flood with small capacity was
chosen to develop intertidal zone applying to the government’s development plan.
Therefore, this study analyzed the emergy benefit and the cost based on flood generation type
with small capacity from Table 2.
Saemangeun tidal power plant structural layout plan is shown in Figure 3. The flood generation in
a small capacity has been planned to install twenty turbines of 20 MW and ten sluice gates, which are
modified models of those at Sinsi.
Table 2 shows construction cost of small capacity. The prices for turbines and generators are the
conversion of quotes from China using the relevant exchange rate. Cost for the mechanical work
involving switchboards, gantry crane, and sluice gates are based on quotes from local contractors. The
management cost is 3% of compensation, civil work and electric/mechanical works had been
combined. The costs of a supervising survey are researched at 3% of the civil work, 1.5% of the
electric and mechanical work. Interest has been assumed to be 5%.
Table 1. Characteristics and economic efficiency of each generation types (MKE, 2006).
Generation type
Average of high
tide difference
(m)
Surface
area
(㎢)
Capacity
of
facility
Generation
of electricity
(㎿h)
Cost
/Generation
(₩/㎾h)
Ranking
flood, small capacity 5.32 185 40 687 960 4
ebb, small capacity 5.32 185 40 711 902 3
flood, large capacity 5.32 405 52 938 862 2
ebb, large capacity 5.32 405 52 964 802 1

185
Figure 3. Saemangeum tidal power plant structural layout plan (MKE, 2006).
Table 2. Construction cost of flood, small capacity (MKE, 2006).
Unit: million₩
Items Amount Note
(1) Civil work
Temporary work 15,993 Twenty turbines
Power plant structures 149,191 Ten sluice gates
Sluice gates 61,132
Demolition of an existing barrage 45,662
Temporary water blockage 49,861
Central pier 14,043
Road paving 326
Retaining walls 26,703
Sub total 362,911
(2) Electricity/mechanics
Turbine-generator 190,550
Sluice Gates 13,435
Stop-log(power plant) 14,422
Stop-log(sluice gate) 7,739
Lock mechanics 9,588
Gantry Crane etc. 8,392
Switch gear & trans. 31,604
Sub total 296,730
Total (1+2) 659,641
(3) Administration 51,127 (1+2)×3%
(4) Research, design and supervision 22,596 (1)×5%+(2)×1.5%
Total 733,364 (1)+(2)+(3)+(4)
(5)Interest 81,411 5% per annum at compound
Total cost 814,775 (1)+(2)+(3)+(4)+(5)
* Data for table 5

186
Table 3. Comparison of two different carbon inventory methods.
Method Strong Weak
Measurement concentration * flow
amount high accuracy high cost
Calculation activity data * emission
factor convenient method low accuracy
Calculation of Carbon Reduction
There are measurement methods and calculation methods for evaluating the amount of carbon
emissions. Most of carbon emission programs and guidelines follow calculation methods. Items such
as amount of fuel consumed, emission factor and formulas for calculating emission are essentials for
calculating the amount of emission. Formula is as follows:
Emissions = Fuel consumption Emission Factor
Emissions = Amount of emission (㎏ GHG)
Fuel Consumption = Amount of Fuel Used (TJ)
Emission Factor = given default emission factors for each type of fuel used
Emergy Cost-benefit Analysis
This study uses the concept of emergy to quantify the cost and benefit of tidal power generation
in Saemangeum. Cost-benefit analysis uses currency flows, so the emergy values of cost and benefit
are divided by the emergy money ratio (EMR) to be represented in Emvalue (Em₩).
Since the project uses an existing seawall, the costs incorporated only those for materials,
maintenance of facilities for the tidal power plant, and G&S for fisheries. The benefit included
electricity generation, increase in marine productivity and the carbon reduction from Table 4.
RESULTS AND DISCUSSION
Emergy Evaluation of the Tidal Power Plant in the Saemangeum Region
Energy systems diagram
Figure 4 shows a diagram of the tidal power generation in the Saemanguem region. The diagram
represents the internal elements and processes affected and supported by external inputs. The tide
required for tidal power from renewable natural resources into the system, and necessary purchased
inputs from outside such as materials, goods and services for operation and management are included.
The interaction of the tide and the power generator using the existing seawall produces electricity.
Table 4. Cost and benefit item category.
Cost Benefit
1. Facility installation
2. Facility management
3. Fishery G&S
1. Electricity production
2. Shellfishes
3. Seaweed
4. Fishes
5. Carbon reduction

187
Figure 4. Energy systems diagram of tidal power plant using the existing seawall for Seamangeum.
Emergy analysis
The materials purchased from outside for the tidal power plant construction were mostly stone
(4.01E+10g), sand (1.11E+12g), concrete (1.08E+12g) and iron and steel (8.69E+10g). The life span
of the tidal power generator was assumed to be 55 years to calculate annual input (MKE, 2006). Cost
for management was 1.25E+10 ₩/yr and production of electricity was estimated to be 6.87E+08
kWh/yr.
Table 5 shows the result of emergy analysis for electricity generation at the Saemangeum power
plant. The analysis is divided into renewable energy sources, purchased input and internal production.
The tidal emergy from natural environment is 7.49E+20 seJ/yr. Conversion to currency equivalents
based on Korea’s emergy money ratio (EMR=3.42E+09 seJ/₩), the ecologic-economic value of tidal
energy is equivalent to 219 billion Em₩/yr.
The emergy of material inputs used for construction of the tidal power generator was: stone for
1.22E+18 seJ/yr, sand for 4.53E+19 seJ/yr, concrete for 3.55E+19 seJ/yr and, iron and steel for
1.07E+19 seJ/yr . These elements were divided by EMR and resulted in 0.36 billion Em₩/yr, 13.2
billion Em₩/yr, 10.4 billion Em₩/yr and 3.13 billion Em₩/yr, respectively.
The emergy of services required for construction of the tidal power plant was 4.56E+19 seJ/yr,
which is equivalent to 13.3 billion Em₩/yr. Services (32.96%) and sand (32.72%) account for more
than half of the total emergy (65.68%), followed by concrete, with no significant input of iron and
steel.
In addition, the emergy for maintaining tidal power generator was 4.26E+19 seJ/yr, equivalent to
12.5 billion Em₩/yr.
Using the existing seawall by flood, small capacity generation, electricity produced 6.87E+08㎾h
and its unit of energy conversion calculated for 2.47E+15 J/yr. And by multiplying transformity of the
average electricity value of emergy, 7.22E+20 seJ/yr was obtained as the result. Therefore, electricity
emvalue of 211 billion Em₩/yr was reflected as an average ecologic-economic value.
The transformity of electricity generated by the tidal power plant in Saemangeum, without
accounting for the seawall construction, is 3.76E+05 seJ/J. The total emergy supporting this electricity
output is 9.30E+20 seJ/yr, equivalent to an emvalue of 272 billion Em₩/yr that reflects the emergy
cost in value of this resource.

188
Table 5. Emergy table of tidal power plant using the existing seawall in Saemangeum, Korea.
No. Item Raw Data Transformity
(seJ/unit)
Solar Emergy
(seJ/yr)
Emvalue
(Em₩/yr)
Renewable source
1 Tide 1.01E+16 J/yr 7.39E+04 a) 7.49E+20 2.19E+11
Purchased input
2 Power plant construction
a. Materials
Stone 7.29E+08 g/yr 1.68E+09 b)
1.22E+18 3.58E+08
Sand 2.02E+10 g/yr 2.24E+09 b)
4.53E+19 1.32E+10
Concrete 1.96E+10 g/yr 1.81E+09 c) 3.55E+19 1.04E+10
Iron & steel 1.58E+09 g/yr 6.79E+09 e) 1.07E+19 3.14E+08
b. G & S 1.33E+10 ₩/yr 3.42E+09 d)
4.56E+19 1.33E+10
sub total 1.38E+20 4.05E+10
3 Maintenance
G & S 1.25E+10 ₩/yr 3.42E+09 d)
4.26E+19 1.25E+10
Production
4 Electricity 2.47E+15 J/yr 2.92E+05 e) 7.22E+20 2.11E+11
5 Electricity 2.47E+15 J/yr 3.76E+05 f) 9.30E+20 2.72E+11
*Transformity based on total global emergy flow of 15.83E+24 seJ/yr
a) Campbell et al. (2005), b) Campbell and Brandt-Williams (2005), c) Simoncini (2006), d) Im (2010), e) Odum
(1996), f) this study
Figure 5. Emergy signature of each energy source of tidal power in Saemangeum.
The emergy signature from the emergy evaluation Table 5 is shown in Figure 5. The largest
contribution was mostly provided by the tide from the system boundary. Consequently, tidal power in
Saemangeum was entirely affected by the tide from natural environment rather than by purchased
nonrenewable inputs from outside.
Transformity
Table 6 shows transformity of various power facilities. The transformity in this table was
compared to data from Odum (1996) based on entire earth emergy of 15.83E+24 seJ/yr.

189
Some of these plants are much matured technologies, while others are still developing
(photovoltaic, for example). All the cases are different and reflect the local situation, including the
cases in Korea. For example hydro power plant in Korea and Brazil are not the same; each location has
its local emergy resources and opportunities. There are so many different ways of generating
electricity in the world. But all the fossil plants will sooner or later be dismissed for lack of fossil fuels
or for environmental reasons, while the ones running on renewable sources will still be usable.
Transformities of tidal power in case of Sihwa plant, with and without seawall construction were
also included, being respectively 3.38E+05 seJ/J and 3.56E+05 seJ/J (Joo, 2007). Therefore including
construction of seawall compared with tidal power generation at existing seawall decreases the
efficiency, although not too much in the specific case of Sihwa plant.
Literature results shows that the transformity of Garolim power plant2.01E+05 seJ/J., including
seawall, is lower that Saemangeun power plant(3.76E+05 seJ/J). The higher efficiency in Garolim is
due to the greater tidal range (4.72m) as well as the relatively shorter length of the seawall (Garolim
tidal power project, 2008). Based on already calculated transformity, the construction of seawall in
Saemangeum increases the transformity of electricity up to 12.8E+05 seJ/J.
However, if the tidal power plant would be installed at existing seawall in Saemangeum which
was constructed for other purposes, its construction emergy need not be included into the assessment,
thus allowing to accept a transformity equal to 3.76E+05 seJ/J. This means that tidal power generators
would rather be located where a natural basin is already available or a seawall was already constructed
for other reasons (multi-functional use) than where it has to construct a new seawall.
Table 6 indicates that the local conditions affect the result and the final efficiency in many ways
(more products, less construction costs, higher tide power, multi-functional use, etc.). In each case, the
emergy assessment allows to quantify the advantage, based on one unit of measure only, the solar
emergy joule.
Table 6. Solar transformity of electric power facilities.
Power facilities Solar empower
(seJ/yr)
Electric Power
(J/yr)
Solar transformity
(×105seJ/J)
Wood power plant, Thailand 4.07E+14 3.60E+09 1.13 a)
Hydroelectric power, Sweden 3.28E+22 2.43E+17 1.35 a)
Tidal power plant, Garolim, Korea
(with seawall construction) 6.76E+20 3.36E+15 2.01
c)
Lignite power plant, Thailand 9.19E+14 3.60E+09 2.55 a)
Coal power plant 268,800 1 2.69 a)
Hydroelectric, Tucurui, Brazil 2.77E+22 1.00E+17 2.77 a)
Coal power plant, Thailand 1.02E+15 3.60E+09 2.85 a)
Oil power plant, Thailand 1.20E+15 3.60E+09 3.33 a)
Tidal power plant, Sihwa, Korea (using the
existing seawall) 6.73E+20 1.99E+15 3.38
b)
Wood power plant, Jari, Brazil 4.00E+20 1.17E+15 3.42 a)
Lignite power plant, Texas 9.07E+21 2.65E+16 3.42 a)
Tidal power plant, Sihwa, Korea
(with seawall construction) 7.08E+20 1.99E+15 3.56
b)
Tidal power plant, Saemangeum,
Korea (using the existing seawall) 9.30E+20 2.47E+15 3.76
d)
PV system, Austin, Texas 2.33E+15 1.60E+10 1.45 e)
Tidal power plant, Saemangeum,
Korea (with seawall construction) 3.17E+21 2.47E+15 12.8
d)
a) revised from Odum (1996), b) Joo (2006), c) Garolim tidal power project (2008), d) this study, e) Brown et
al. (2012)

190
Table 7. Emergy indices of tidal power plant at existing seawall in Saemangeum.
Name of index Value
Renewable emergy (R, seJ/yr) 7.49E+20 Purchased emergy (F, seJ/yr) 1.81E+20
Total emergy flows (U, seJ/yr) 9.30E+20
Renew % 80.53
EYR = Y/F 5.14
ELR = (N+F)/R 0.24
ESI = EYR/ELR 21.25
Emergy indices Table 7 shows the emergy indices calculated from the emergy evaluation. The total emergy (U) is
9.30E+20 seJ/yr which is the sum of renewable emergy (R), 7.49E+20 seJ/yr, and emergy from
outside, 1.81E+20 seJ/yr. The ratio of renewable emergy to the total emergy is 80.53%, mainly due to
the renewable contribution from the tide. The emergy yield ratio is 5.14, which means that about 5
times more benefits can be obtained compared to the emergy cost. The environmental loading ratio is
0.24, which means that the impact on environment is quite low. The emergy sustainability index is
21.25, much higher than 10, which indicates that this system is highly sustainable. Brown and Ulgiati
(2002) divided energy sources according to the EYR.
They argue that if EYR > 5, the source is a primary energy source; if EYR is between 2 and 5, the
source is a secondary energy source. If EYR < 2, the product of the process is rather a consumer good,
not an energy contribution. The EYR for electricity produced is 5.14, which suggested that electricity
in Saemangeum from the tidal power still can be considered as primary energy.
Table 8 shows the comparison of emergy indices in various power production facilities.
Saemangeum and Sihwa tidal power using existing seawall and constructed seawall are compared in
this Table. ESI on the table 8 are in order of increasing value for the power facilities. They are
showing either very low or intermediate or else very high ESI. Generating tidal power with existing
seawall in Saemangeum, ESI is 0.41indicating system’s sustainability appears to be poor. Coal power
of ESI in Italia was 0.53, reflected that impact on environment is high and also sustainability of the
system is non-persistent. Intermediate ESI for Geothermal was 11.05, Hydro was 16.90, Tidal energy
Saemangeum at existing seawall was 21.25 and Tidal energy Garolim was 65.25. And, with higher ESI
for tidal energy for Sihwa with seawall construction was 188.61 and Tidal energy Sihwa at existing
seawall was 2005.59.Coal power plant and Saemangeum with constructing seawall are very low ESI
due to low EYR and relatively high ELR. Intermediate ESI for Hydro, Geothermal and Saemangeum
without seawall are due to the low ELR. And the rest of other power facilities with high ESI are due to
low ELR coupled to a very high EYR. The reasons of these different behaviors are several factors in
some instants. The seawall maybe short, or the huge polluting emissions from coal, or else, the low
ELR for Hydro and Geothermal are renewable sources versus non-renewables of several other power
facilities.
Table 8. Comparison of emergy indices for power production facilities.
Power production facilities EYR ELR ESI
Tidal energy, Saemangeum with seawall construction (400 MW) 1.31 3.21 0.41 Coal, Italy (1280 MW)
a) 5.48 10.37 0.53
Geothermal, Italy (20 MW) a)
4.81 0.44 11.05
Hydro, Italy 85 MW) a)
7.65 0.45 16.90
Tidal energy, Saemangeum at existing seawall (400 MW) 5.14 0.24 21.25
Tidal energy, Garolim with seawall construction (520 MW) b)
8.59 0.13 65.25
Tidal energy, Sihwa with seawall construction (254 MW) c) 14.24 0.08 188.61
Tidal energy, Sihwa at existing seawall (254 MW) c) 45.29 0.02 2005.59
a) Brown and Ulgiati (2002), b) Garolim tidal power project (2008), c) Joo (2006)

191
Emergy Evaluation of Tidal Flats Rehabilitation in Saemangeum Region
Energy system diagram
Figure 6 depicts the rehabilitation of tidal flat after the operation of generating tidal power. From
the generation of tidal power, seawater would be able to flow consistently. Thus it is highly expected
that this will rehabilitate tidal flats, which were destroyed from the construction of the seawall.
The inflows of natural environmental resources from outside the system (such as sun, wind, rain,
tide, and river), and an input of goods and services for fishery are included in the assessment.
Therefore the damaged tidal flats are expected to rehabilitate through circulating seawater from the
tidal power. In addition, fishing activities may take place and become beneficial to the local economy.
Emergy analysis
Following tidal power generation, the recovery of tidal flat through circulating seawater expected an
increase of marine products and the fishing industry in the region.
Areal boundary of the system is determined for 185㎢ from the small power generation. Therefore,
solar radiation of 4.66E+09 J/㎡/yr was obtained from the meteorological annual report (KMA, 2006).
For the local wind speed and average precipitation data in Saemangeum region, the same statistical
report was used, yielding respectively 2.50 ㎧, 1.17m/yr.
In the case of the inflow of river, data was obtained from the water information system, 2010 for
Mankyung river exported data from Mok stream and, for Dongjin river, exported data from Taein and
Kobu stream.
Data about the purchased goods and services for fishery activities were obtained from the expenses
per fisherman’s family and number of houses of fishermen. Products of fisheries were estimated from
the ratio of rehabilitated area/original area, as shellfish 2.09E+07 kg/yr, seaweed 4.86E+06 kg/yr, and
fishes 3.18E+05 kg/yr.
Tidal flat recovery and its marine productivities may not be the same as exactly as before the
reclamation project and the seawall construction. The basin area was 401㎢ originally before the
seawall was built, but for this study calculated the base of 185㎢ basin for constructing a small flood
type capacity generator at the existing seawall.
There are not many available places exploiting the tidal power in other nations for a reference
studies. Even so, it is rare to find a research about the restoration of marine productivity through tidal
power. Therefore, the recovery of the marine productivity can only be assumed from the basin area of
185 km2, which is an area fraction of 0.46 from the original area of 401km
2.
Figure 6. Energy system diagram of rehabilitation of the tidal flat.

192
Emergy evaluation of the rehabilitation for tidal flat is shown in Table 9. The inflowing solar
emergy from the outside system boundary was 7.75E+17 seJ/yr, the wind emergy was 1.30E+18
seJ/yr, rain chemical 3.27E+19 seJ/yr, tide 7.49E+20 seJ/yr, and river emergy was 6.84E+20 seJ/yr. To
avoid double counting in evaluating the total emergy from natural environment, only the tide and river
emergy were added, yielding a total emergy of 1.43E+21 seJ/yr, which is equivalent to 419 billion
Em₩/yr of ecologic-economic value.
Emergy purchased from outside for fishery is 3.86E+19 seJ/yr, at an assumed cost of 11.3 billion
Em₩/yr.
The emergy of supporting shellfishes calculated for 4.54E+19 seJ/yr, which is equivalent to 13.3
billion Em₩/yr; for seaweeds was 4.55E+16 seJ/yr, which is equivalent to 0.013 billion Em₩/yr; and
for fish was 1.86E+18 seJ/yr, which is equivalent to 0.544 billion Em₩/yr. Therefore, total production
emergy through rehabilitation of tidal flat was 4.74E+19 seJ/yr, which is equivalent to 13.8 billion
Em₩/yr.
Carbon Reduction through Tidal Power Plant
Table 10 shows the amount of domestic power generation and the CO2 emission factors calculated
by KPX (Korea Power Exchange) in 2008. Between 2003 and 2007 average amount of power
generation was 178,060 GWh and the average emission factor was 0.82 ton/MWh.
By constructing the tidal power plant in Saemangeum, electricity produced is 687 GWh/year.
Calculation was based on the KPE emission factor; it revealed a reduction of 563,340 metric tons in
CO2 emissions every year for the period of generating tidal power in Saemangeum. While converting a
price range as per current carbon trading market price was at 18,270₩/ton as of Feb. 2010, and then
multiplied CO2 reduction quantity to obtain the benefit of 10.2 billion through CDM from the tidal
power in Saemangeum (Table 11).
Table 9. Emergy table for rehabilitation of tidal flat.
No. Item Raw Data Transformity
(seJ/unit)
Solar Emergy
(seJ/yr)
Emvalue
(Em₩/yr)
Renewable source 1 Sunlight 7.75E+17 J/yr 1.00E+00
a) 7.75E+17 2.27E+08
2 Wind 5.17E+14 J/yr 2.51E+03 a) 1.30E+18 3.79E+08
3 Rain, chemical 1.07E+15 J/yr 3.05E+04 a) 3.27E+19 9.57E+09
4 Tide 1.01E+16 J/yr 7.39E+04 a) 7.49E+20 2.19E+11
5 River, chemical 8.42E+15 J/yr 8.13E+04 a) 6.84E+20 2.00E+11
sub total 1.43E+21 4.19E+11 Purchased input
6 G & S for fisheries 1.13E+10 ₩/yr 3.42E+09 d)
3.86E+19 1.13E+10
Production
7 Shellfish 3.34E+13 J/yr 1.36E+06 f) 4.54E+19 1.33E+10
8 Seaweeds 2.46E+12 J/yr 1.85E+04 f) 4.55E+16 1.33E+07
9 Fish 6.92E+12 J/yr 2.69E+06 f) 1.86E+18 5.44E+08
sub total 4.74E+19 1.38E+10
Transformity based on total global emergy flow of 15.83E+24 seJ/yr.

193
Table 10. Emission factors for domestic power plant (KPE, 2008).
Generation (GWh) Emission Factors (tCO2e/MWh)
2003 152,482 0.83
2004 170,101 0.81
2005 176,320 0.82
2006 182,949 0.82
2007 208,453 0.80
average 178,061 0.82
Table 11. Summary of carbon reduction through tidal power plant.
Power Emission
Factor Emission Price
Exchange
Rate Price
CERs
Price
GWh/yr ton CO2
/GWh
ton CO2
/yr
₤/ton
(2010.12) ₩/₤ ₩/ton Mill.₩/yr
687 820 563,340 11.81 1,547 18,270 10,292
Emergy Cost-benefit Analysis of Saemangeum Tidal Power Plant
Table 12 shows the result of an emergy cost-benefit analysis of Saemangeum tidal power plant
using existing seawall and expected rehabilitation of the tidal flat. Marine productivity is also expected
to improve from circulating seawater. In addition, while generating electricity from the tidal power, a
reduction of carbon emissions is also expected.
Emergy of electricity at 7.22E+20 seJ/yr, shellfishes at 4.54E+19 seJ/yr, seaweeds at 4.55E+16
seJ/yr, fishes at 1.86E+18 seJ/yr, carbon reduction at 3.52E+19 seJ/yr were calculated. Their emvalues
respectively equivalent to 211 billion Em₩/yr, 13.3 billion Em₩/yr, 0.013 billion Em₩/yr, 0.54
billion Em₩/yr, and 10.3 billion Em₩/yr were calculated. Total emergy 8.04E+20 seJ/yr was
equivalent to 235 billion Em₩/yr accounted in benefit.
The costs for the construction of seawall; include stone 1.22E+18 seJ/yr, sand 4.53E+19 seJ/yr,
concrete 3.55E+19 seJ/yr, iron and steel 1.07E+19 seJ/yr and, goods and services for 4.59E+19 seJ/yr,
were also computed. Maintenance emergy 4.26E+19 seJ/yr and goods and services for fishery
3.86E+19 seJ/yr were calculated as well. Therefore, a total emergy of 2.20E+20 seJ/yr, which is
equivalent to 64.2 billion Em₩/yr was calculated.
For a review of the feasibility of the project, the total net profit and cost/benefit ratio were
calculated. Emvalue of benefit versus cost differences was 171 billion Em₩/yr indicating that a net
profit of 171 billion Em₩/yr could be obtained from using existing seawall for tidal power generation
in Saemangeum. Also a cost/benefit ratio of 3.66 represented over 3 times higher benefit compared to
the cost for tidal power.
CONCLUSION
Development of tidal power in Saemangeum region was analyzed for the ecologic-economic value
points and the feasibility of the project.
And the findings are as follows:
1. The emergy of electricity produced from tidal power generation was 7.22E+20 seJ/yr and the
corresponding ecologic-economic value was 210 billion Em₩/yr.
2. Transformity of tidal power plant Saemangeum with seawall construction was 12.8+05 seJ/J
which is higher than other power facilities. The results indicated that harnessing tidal energy including
seawall construction in Saemangeum region for tidal power would be inefficient.

194
Table 12. Emergy cost-benefit evaluation of tidal power plant using the existing seawall in
Saemangeum.
No. Item Raw Data Solar transformity
(seJ/unit)
Solar Emergy
(seJ/yr)
Emvalue
(Em₩/yr)
Emergy benefits
1 Electricity 2.47E+15 J/yr 2.92E+05 7.22E+20 2.11E+11
2 Shellfishes 3.34E+13 J/yr 1.36E+06 4.54E+19 1.33E+10
3 Seaweeds 2.46E+12 J/yr 1.85E+04 4.55E+16 1.33E+07
4 Fishes 6.92E+12 J/yr 2.69E+06 1.86E+18 5.44E+08
5 Carbon reduction 1.03E+10 ₩yr 3.42E+09 3.52E+19 1.03E+10
Sub total 8.04E+20 2.35E+11
Emergy costs
6 Power plant construction
a. Materials
Stone 7.29E+08 g/yr 1.68E+09 1.22E+18 3.58E+08
Sand 2.02E+10 g/yr 2.24E+09 4.53E+19 1.32E+10
Concrete 1.96E+10 g/yr 1.81E+09 3.55E+19 1.04E+10
Iron & steel 1.58E+08 g/yr 6.79E+09 1.07E+19 3.14E+08
b. G & S 1.33E+10 ₩/yr 3.42E+09 4.56E+19 1.33E+10
7 G&S for Maintenance 1.25E+10 ₩/yr 3.42E+09 4.26E+19 1.25E+10
8 G&S for fisheries 1.13E+10 ₩/yr 3.42E+09 3.86E+19 1.13E+10
Sub total 2.20E+20 6.42E+10
Net benefit 1.71E+11 B/C ratio 3.66
3. However, analyzed emergy indices using the existing seawall, transformity of electricity of
3.76E+05 seJ/J is lower than including seawall construction. The efficiency is similar to fossil fuel
fired power plants compared to other facilities.
EYR indicated the characteristics of the system was 5.14, meaning that it is a primary energy
source as an alternative energy. ELR was 0.24, indicating very low impact on environment. ESI for the
system was 21.25, therefore, the sustainability is very high.
4. From the tidal power generation in Saemangeum, steady water circulation is expected;
consequently tidal marine product could be increasingly restored. Furthermore, analyzing the results of
an estimated total production of shellfish, algae and fish of marine products, its total emergy are
4.74E+19 seJ/yr which is equivalent to 13.8 million Em₩/yr of ecologic-economic value was
accounted for.
5. Carbon reduction from the tidal power generation of 687GWh/yr of electricity in Saemangeum
was estimated approximately 563,340 metric tons of CO2/year which is equivalent to 10.2 billion₩/yr
of CDM revenues.
6. The ratio of benefit to cost was 3.66, the benefit earned close to four times greater than the cost.
So the net benefit for the production was 171 billion Em₩/yr.
Finally, this study reveals that using an existing seawall for tidal power generation in
Saemangeum could secure sustainable natural energy sources as an alternative energy and reduce CO2
as well as providing rehabilitation of the damaged tidal flats through circulating seawater in the basin.
In conclusion, development of new cleaner renewable energy and alternative ways of producing
electricity from tidal energy would be one of reliable solutions for the present energy crisis and truly
meaningful for the rehabilitation of the disturbed tidal flat.

195
REFERENCES
Brown, M.T. and S. Ulgiati, 2002. Emergy evaluation and environmental loading of electricity
production systems, Journal of cleaner Production, 10:321-334
Brown, M.T., S. Ulgiati, 1997. Emergy-based indices and ratios to evaluate sustainability: monitoring
economies and technology toward environmentally sound innovation, Ecological Engineering, 9.
pp.18
Garolim Tidal Power Generation CO., Ltd. 2008. Draft Final Report on the Analysis of Emergy in
connection with the Construction of Tidal Power Plant in the Garolim Bay, 59pp.
Im J.A., 2010. Emergy evaluation of a refuse-derived fuel processing facility in Wonju, Korea,
Master’s thesis, Department of Ecological Engineering, Pukyong National University, 85pp.
Jeong J.H. and Y.G. Kim, 2007. Technologies for tidal power generation and their prospect, Journal by
Korea Society for Solar Energy 6(1):3-8
Ju Y.S., 2006. Evaluation of emergy for the construction of a tidal power plant at Lake Sihwa,
Master’s thesis, Department of Environmental Engineering, Pukyong University, 50pp.
Kang D.S., J.H. Nam and S.M. Lee, 2006. Emergy Valuation of a Tidal Flat Ecosystem in the
Southwestern Coast of Korea and Its Comparison with Valuations Using Economic
Methodologies, Journal of the Environmental Sciences, 15(3):243-252
Kang, D.S. and J.H. Nam, 2003. Valuation of marine resources using the concept of emergy and how
to use it for policy setup, 107pp.
Kang, D.S., 2001, Emergy evaluation of the Kangwha tidal flat, J. Korean Soc. Oceanogr., 36:51-58
KEI(Korea Environmental Institute), 2007. Study on how to improve the environmental evaluation of
tidal flat reclamation, 161pp.
Kim G.H., S.K. Kwon and T.H. Kim, 2006. An overview of technologies for tidal power generation,
Korea Society of Electricity, The World of Electricity 55(8):32-37.
Kim K.M., 2006. Evaluation of achievements for each alternative in connection with the management
of artificial estuaries, Graduate School of Environment, Seoul National University, 138pp.
Kim S.D. and S.H. Na, 2008. How to calculate greenhouse gas emission, Journal of Electronic
Engineering, Issue 35(11):73-83
KMA(Korea Meteorological Administration), 2006. Korean Weather Yearbook, 297pp.
KMI(Korea Marine Institute), 2010. A study on how to support the commercialization of marine
energy, 195 pp
KORDI(Korea Ocean Research & Development Institute), 1981. Garolim tidal power feasibility study
KORDI(Korea Ocean Research & Development Institute), 1986. Garolim tidal power study and
current generation prefeasibility study
KORDI(Korea Ocean Research & Development Institute), 1993. Feasibility of tidal power
development Garorim
KOSIS(Korean Statistical Information Service), 2009. Korean Statistic Yearbook, 1045pp.
Lee J.H., Y.H. No and K.W. Yoo, 2009. A study on the economic feasibility of the tidal energy
development scheme for the west and south coasts, Research on Energy Economy 8(1):1-32
Lee J.S., G.B. Jeong, J.H. Kim, S.G. Yun, W.I. Kim and J.D. Shin, 2004. Water quality evaluation
based on BOD for the River Mangyeong and River Dongjin, Journal by the Korea Society of
Environment and Agriculture, 23(2):81-84
Lee S.M., 2001. Environmental accounting for the Saemangeum reclamation project, Korea Society of
Environmental Engineering, Proceedings for the Spring Gathering, p.1-14
Lee W.G., 2009. A study on the establishment of green growth governance, Social Science Research
33(2):229-252
Lim S.J., 2005. Cost-Benefit analysis theory and application procedure for water resources division,
politics and information systems 8 (1): 98-124
Maeng J.H., G.W. Cho, H.S. Kim, H.N. Park, J.S. Hong, J.W. You and C.G. Lee, 2007. Study on how
to improve the environmental evaluation of the reclamation of tidal flats, 147pp.

196
MIFAFF(Ministry for Food, Agriculture, Forestry and Fisheries), 2002. Saemangeum tideland
reclamation project(I), 975pp.
MKE(Ministry of Knowledge Economy), 2006. Feasibility study on the development of tidal resources
in Korea, pp 432
MKE(Ministry of Knowledge Economy), 2008. Whitepaper on new and renewable Energy 2008, pp
470
MLTM(Ministry of Land, Transport and Maritime Affairs), 2007. Environmental value evaluation
study of Garolim bay.
MLTM(Ministry of Land, Transport and Maritime Affairs), 2008. Sihwa Marine environment
improvement project, 798pp.
MLTM(Ministry of Land, Transport and Maritime Affairs), 2009. A plan to restore tidal flats, 18pp.
MLTM(Ministry of Land, Transport and Maritime Affairs), 2009. International comparative study on
the title flat management polices 311pp.
MLTM(Ministry of Land, Transport and Maritime Affairs), 2010. Conceptualization of Saemangeum
internal development and draft implementation plan, 44pp.
MOE(Ministry of Environment), 2009. Environmental encyclopedia 778pp.
NFRDI(National Fisheries Research and Development Institute), 2003. Tidal flat ecosystem: an
overview and how to utilize it sustainably, 1130pp.
NFRDI(National Fisheries Research and Development Institute), 2005. Title eco system research and
study and sustainable use, 801pp.
Odum, H.T., 1983. Systems ecology, John Wiley & Sons, New York, pp.644.
Odum, H.T., 1988. Energy, environment and public policy, Ecological economics program, Phelps
Lab, University of Florida, p179-186.
Odum, H.T., 1996. Environmental accounting. John Wiley & Sons, New York, pp.370.
Oh M.H., J.S. Park and G.S. Lee, 2007. Conditions to develop tidal energy in Korea. Journal of Korea
Civil Engineering 55(12):135-140
Saemangeum Joint Environmental Impact Survey, 2000. Saemangeum join environmental impact
survey report, 804pp.
Seo G,S., 2009. R&D efforts to restore marine ecosystem, 19pp.
Krystyna M.u., R.W. Nigel and J.E. Peter, 1997, "Why restoration?". in Webb, Nigel R. et al.(des.).
Restoration Ecology and Sustainable Development. Cambridge University Press, Cambridge
WP(Korea Western Power Co., Ltd.), 2007. Garolim tidal power plant construction Environmental
Impact Assessment
Yang W.H., 2006. Understanding of the sea around Korea: tidal flats along the west coast and
sediment, Institute of Science Education, Jeonbuk University, Collection of Science Education
31:1-8
Yoo S.H., and J.S. Lee, 2008. Assessment of Environmental Value of Garorim Gulf, The Korean
Economics Association, 56(3):5-27
Web sites:
Tidal flat information system, http://www.tidalflat.go.kr/
Saemangeum Project Office, http://www.isaemangeum.co.kr/