Embed Size (px)
DESCRIPTION
EMI on Pipes
Citation preview
© Scan Systems Corporation Page 1 of 21
Using Magnetic Flux Density To Identify Anomalies In Pipe Wall Thickness
By William Walters, EE
Scan Systems Corporation
David Steely Scan Systems Corporation
Abstract: In making seamless pipe, there are certain inherent wall thickness anomalies and defects associated with the manufacturing processes. Similarly, both seamless and welded pipe that has been in use for a period of time develop areas of reduced wall thickness during their in-service life. By taking advantage of continued improvement in technology and relying on the basic principles of magnetism, it is now possible to inspect pipe wall variations by monitoring changes in magnetic flux density, rather than magnetic flux leakage, to indicate wall anomalies. Electromagnetic inspection (EMI) of oil country tubular goods (OCTG) and other ferromagnetic tubular goods has been effectively used to search for cracks and flaws on the material’s inside and outside diameter surfaces. EMI induces a magnetic field in the test specimen. Transducers read a signal created when magnetic flux lines bridge an air gap (called magnetic flux leakage) created by a flaw in the specimen. This method is best used in inspection for flaws such as cracks, seams, pits and slugs. To examine the pipe wall for thickness variances and metal loss, non-destructive testing (NDT) equipment designed for these tubular goods has traditionally required the use of additional techniques. One is directing a rotating beam of radioactive gamma ray through the pipe. Gamma ray is encumbered with safety considerations and regulations because of the health hazards associated with it. And it actually inspects less than 100% body wall. Coverage is limited to a “barber pole effect” of examining a narrow, spiraling sample of the pipe length as it is conveyed in a straight line through the orbit of the rotating beam. Another method is rotating pipe under an array of ultrasonic transducers (UT). UT inspection has characteristically required slow throughput speeds to effectively cover 100% of the wall with a specifically designed array of transducers. UT units designed with a series of phased arrays utilize expensive technology, need some type of coupling between the probe and pipe, and require a complicated set-up in order to inspect the pipe as it rotates. Background:
The timely convergence of technologies in measuring the wall thickness makes use of the pipe’s longitudinal magnetic field, Hall effect device and modern digital processing.
© Scan Systems Corporation Page 2 of 21
• 1820 - Hans Christian Oersted discovered that an electric current flowing through a wire generates a magnetic field of flux lines. The field exists in circular form around the wire and the intensity of the field is directly proportional to the amount of current carried by the wire. The strength of the field is strongest close to the wire and diminishes with distance from the conductor until it can no longer be detected.
• 1879 - The Hall effect was discovered by Edwin Hall. His discovery was an excess surface electrical charge on electrically magnetized material. This charge is known as the Hall voltage. The modern Hall effect device is a solid-state transducer that is very stable and has a high sensitivity to flux changes.
• 2005 - Digital processing improves at such a fast rate that products are often one or more generations behind by the time they are offered to the public.
Current computer capabilities offering extremely powerful processing at increasingly affordable pricing has brought on this new opportunity to incorporate these three elements into an effective wall EMI process.
Development:
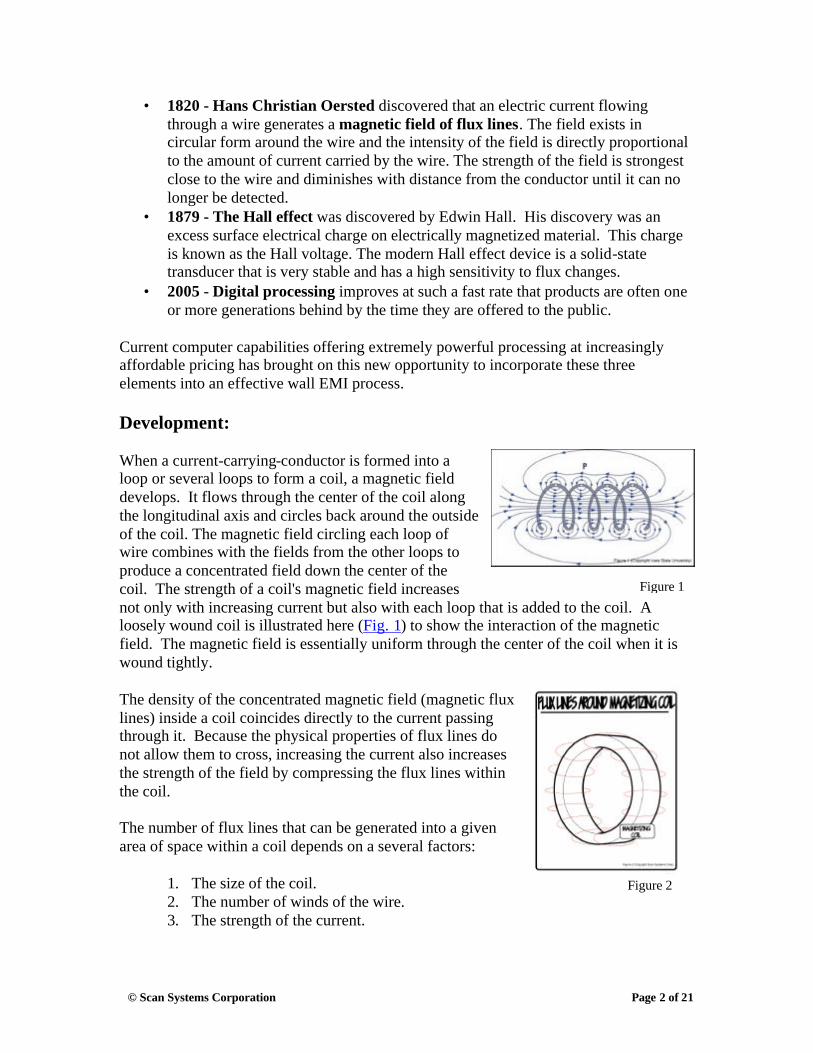
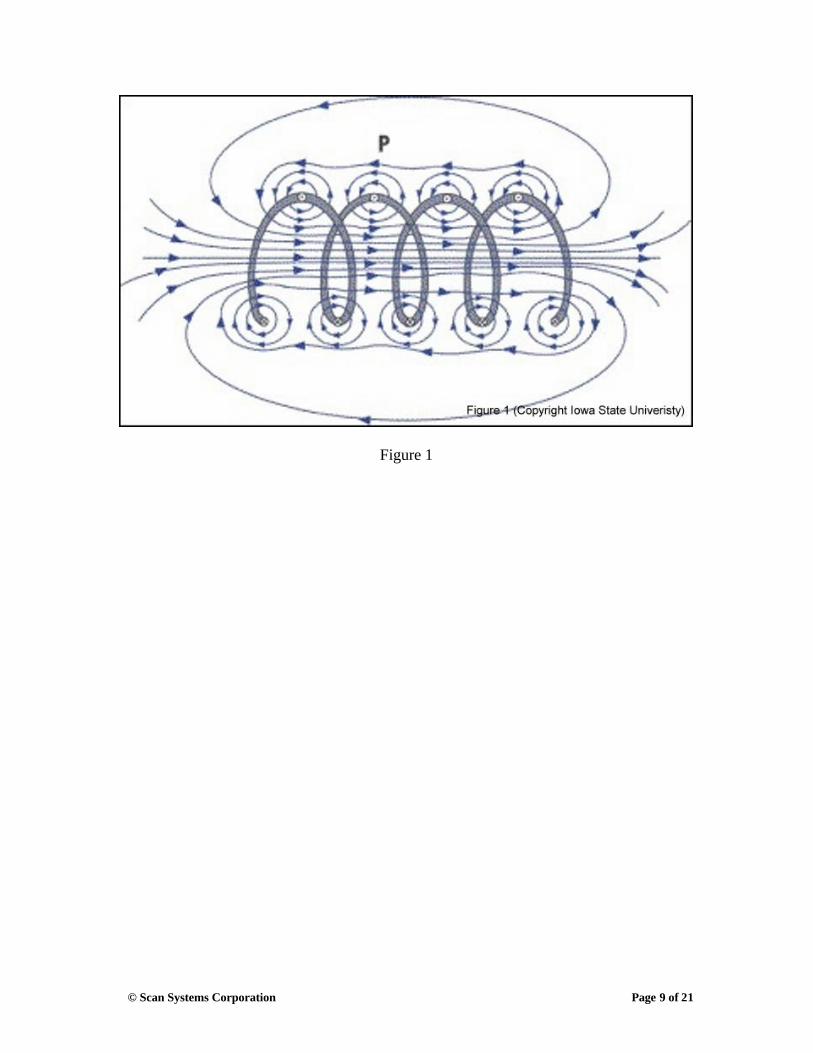
When a current-carrying-conductor is formed into a loop or several loops to form a coil, a magnetic field develops. It flows through the center of the coil along the longitudinal axis and circles back around the outside of the coil. The magnetic field circling each loop of wire combines with the fields from the other loops to produce a concentrated field down the center of the coil. The strength of a coil's magnetic field increases not only with increasing current but also with each loop that is added to the coil. A loosely wound coil is illustrated here (Fig. 1) to show the interaction of the magnetic field. The magnetic field is essentially uniform through the center of the coil when it is wound tightly.
The density of the concentrated magnetic field (magnetic flux lines) inside a coil coincides directly to the current passing through it. Because the physical properties of flux lines do not allow them to cross, increasing the current also increases the strength of the field by compressing the flux lines within the coil.
The number of flux lines that can be generated into a given area of space within a coil depends on a several factors:
1. The size of the coil. 2. The number of winds of the wire. 3. The strength of the current.
Figure 1
Figure 2

© Scan Systems Corporation Page 3 of 21
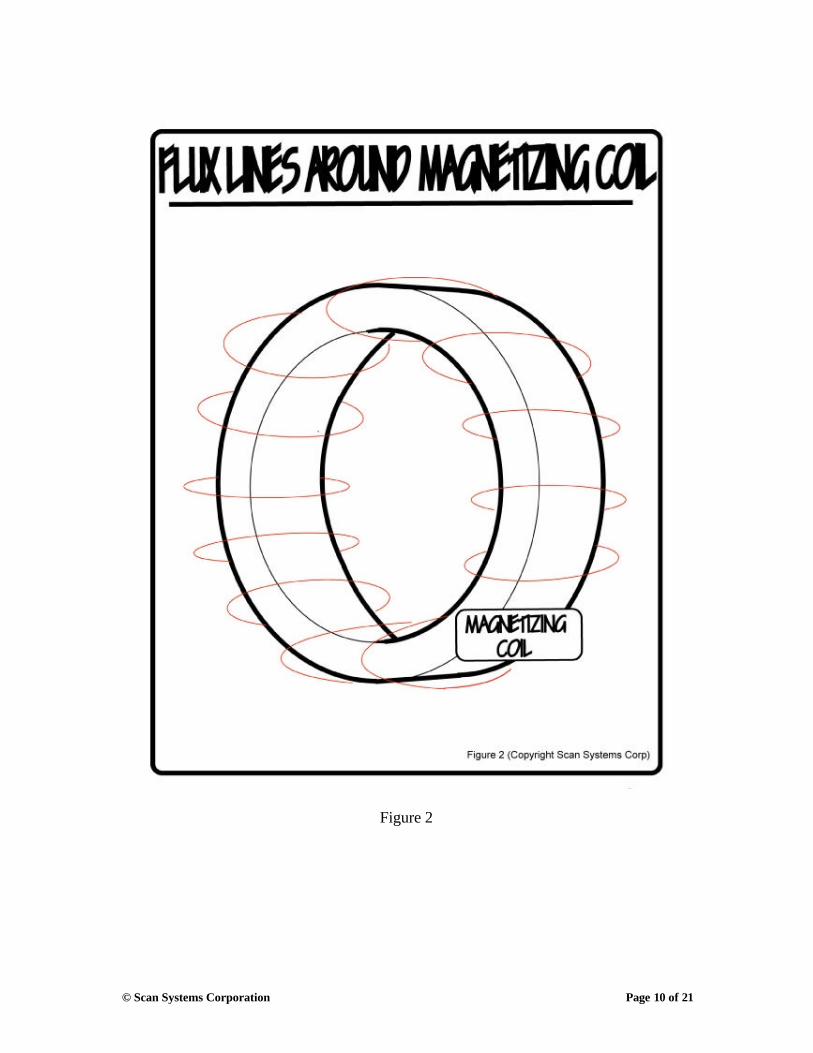
Inspecting pipe by measuring flux density does not actually require the pipe within the coil to be 100% saturated. But it is necessary for the number of flux lines within the coil remain constant.
The flux lines within the magnetizing coil are more densely arranged near the coil surface. This density tends to decrease toward the center of the coils. (Fig. 2)
As the current passes through a wire in a coil, it begins to heat up. This creates changes in the current that also changes the number of flux lines within the coil. To offset this naturally occurring action requires a constant current (CC) power supply that regulates the current being supplied by compensating for load changes.
To inspect pipe, a controlled current applied to the coil brings the flux line density to the optimum level. This magnetic field is identified with Hall elements.
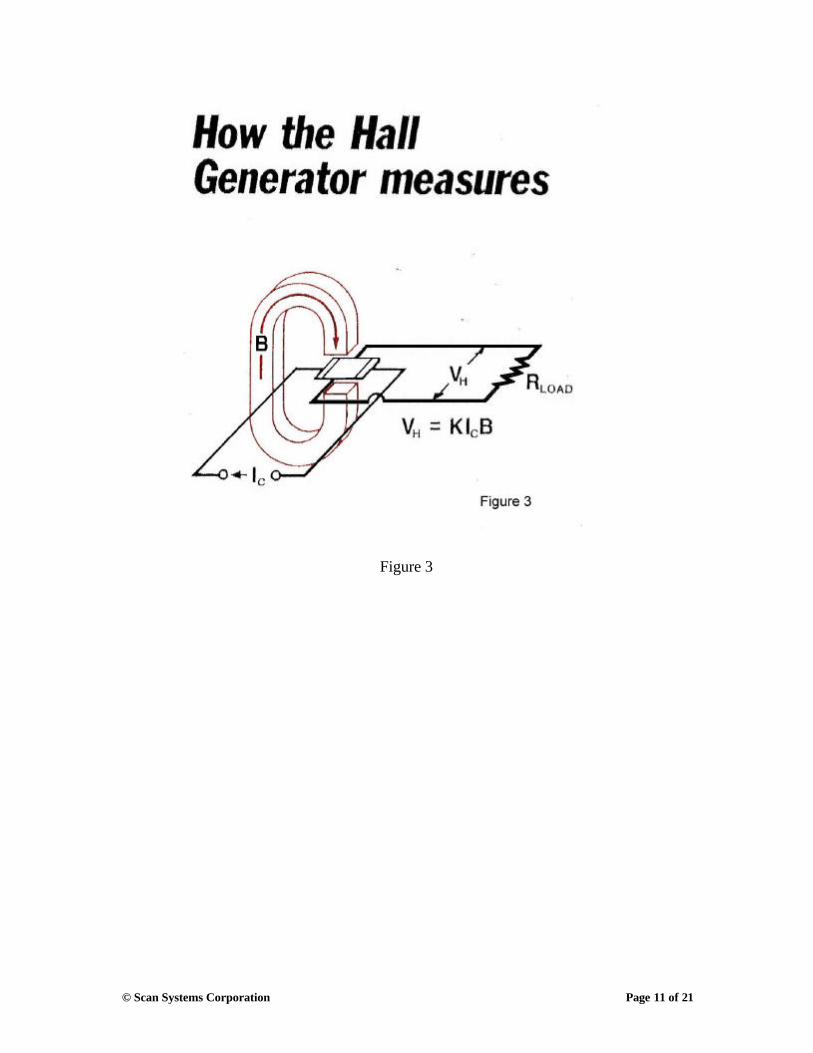
Hall elements (Fig. 3) are devices made from semi-conductive material. When activated by a DC current, they give a voltage out that is proportional to the magnetic field passing through them. The magnetic field exerts a force on moving electrons. As a result, a buildup of charge will occur producing a measurable voltage. The presence of this measurable voltage is called the Hall effect.
Uniform Wall Thickness Verification
During transportation, storage or handling of new and used OCTG, pipe of the same outside diameter but with different wall thicknesses may get mixed together. Quick and simple identification of the mixed material is necessary before the pipe can be put into use. The safest, fastest and least expensive way to inspect wall thickness is with the combination of digital processing changes in the magnetic field detected by Hall
effect devices.
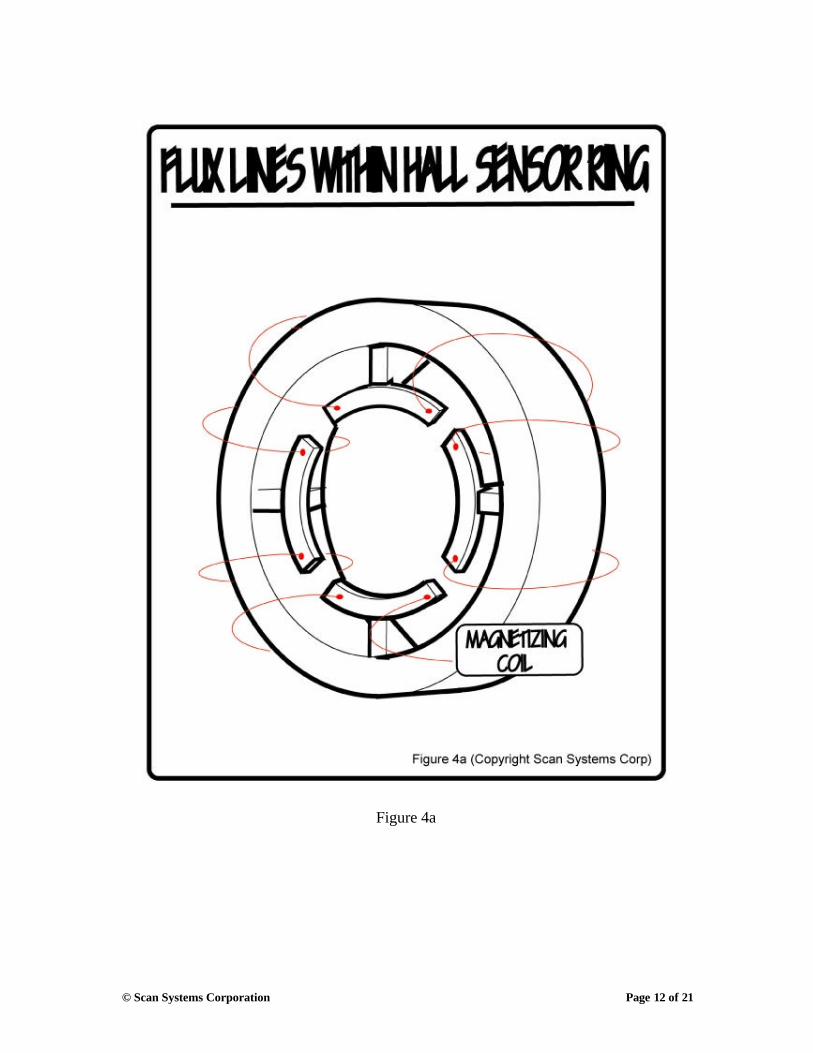
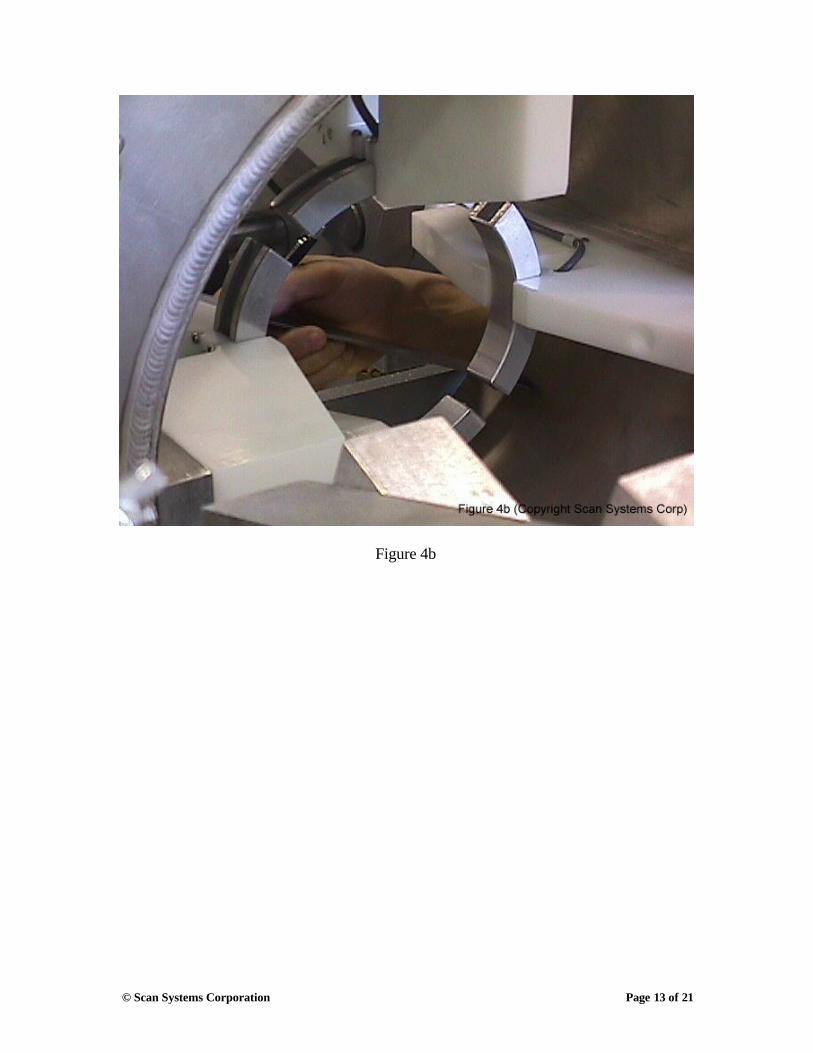
A non-contact inspection ring composed of a series of Hall effect devices is incorporated within the coil to form a Hall sensor ring (Fig. 4a). The electrical output of the Hall sensor is in direct relation to the number of flux lines that are passing through it. The inspection ring is positioned in the magnetic field so that the magnetic flux lines intersect the major dimensions of the sensing element to read the density of the horizontal the flux lines (Fig. 4b).
Figure 3
Figure 4a
Figure 4b
© Scan Systems Corporation Page 4 of 21
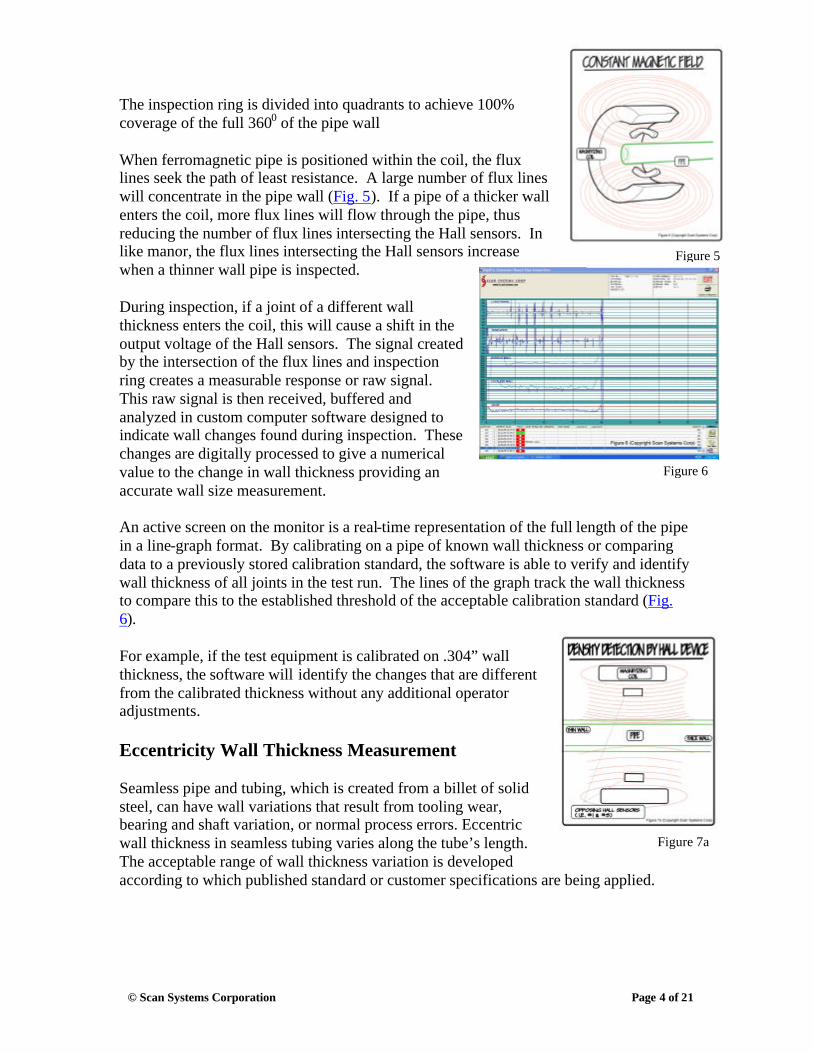
The inspection ring is divided into quadrants to achieve 100% coverage of the full 3600 of the pipe wall
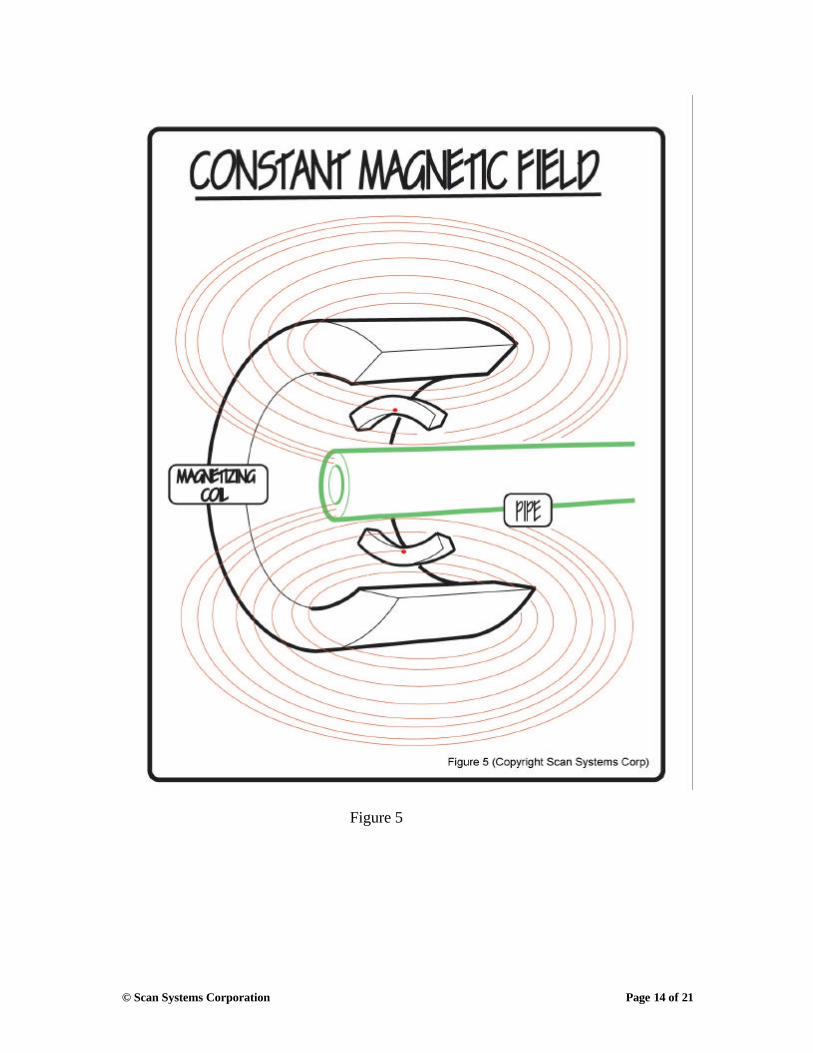
When ferromagnetic pipe is positioned within the coil, the flux lines seek the path of least resistance. A large number of flux lines will concentrate in the pipe wall (Fig. 5). If a pipe of a thicker wall enters the coil, more flux lines will flow through the pipe, thus reducing the number of flux lines intersecting the Hall sensors. In like manor, the flux lines intersecting the Hall sensors increase when a thinner wall pipe is inspected.
During inspection, if a joint of a different wall thickness enters the coil, this will cause a shift in the output voltage of the Hall sensors. The signal created by the intersection of the flux lines and inspection ring creates a measurable response or raw signal. This raw signal is then received, buffered and analyzed in custom computer software designed to indicate wall changes found during inspection. These changes are digitally processed to give a numerical value to the change in wall thickness providing an accurate wall size measurement.
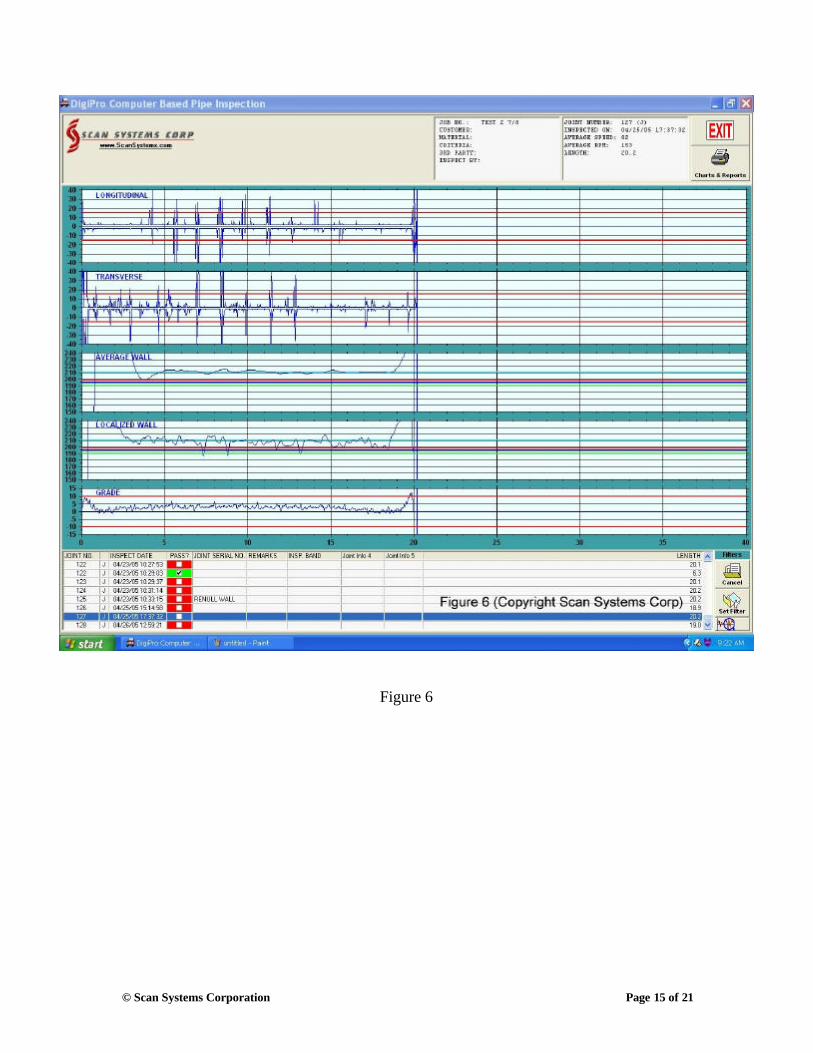
An active screen on the monitor is a real-time representation of the full length of the pipe in a line-graph format. By calibrating on a pipe of known wall thickness or comparing data to a previously stored calibration standard, the software is able to verify and identify wall thickness of all joints in the test run. The lines of the graph track the wall thickness to compare this to the established threshold of the acceptable calibration standard (Fig. 6).
For example, if the test equipment is calibrated on .304” wall thickness, the software will identify the changes that are different from the calibrated thickness without any additional operator adjustments.
Eccentricity Wall Thickness Measurement
Seamless pipe and tubing, which is created from a billet of solid steel, can have wall variations that result from tooling wear, bearing and shaft variation, or normal process errors. Eccentric wall thickness in seamless tubing varies along the tube’s length. The acceptable range of wall thickness variation is developed according to which published standard or customer specifications are being applied.
Figure 5
Figure 6
Figure 7a
© Scan Systems Corporation Page 5 of 21
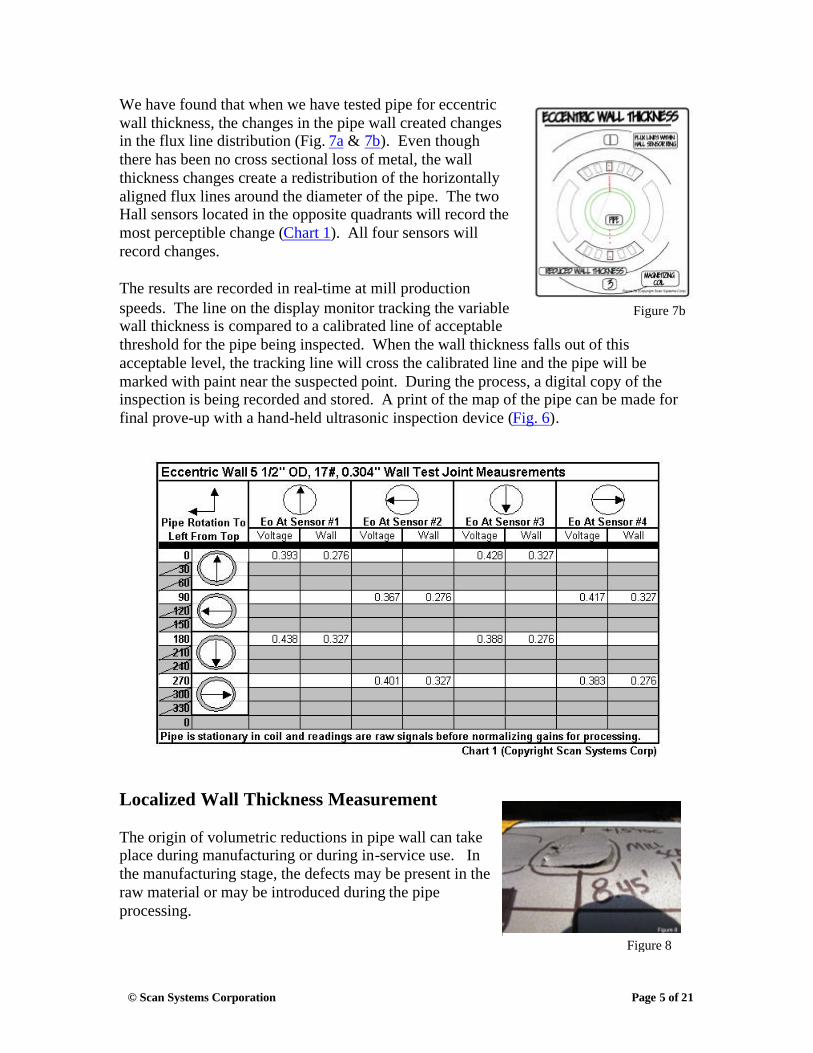
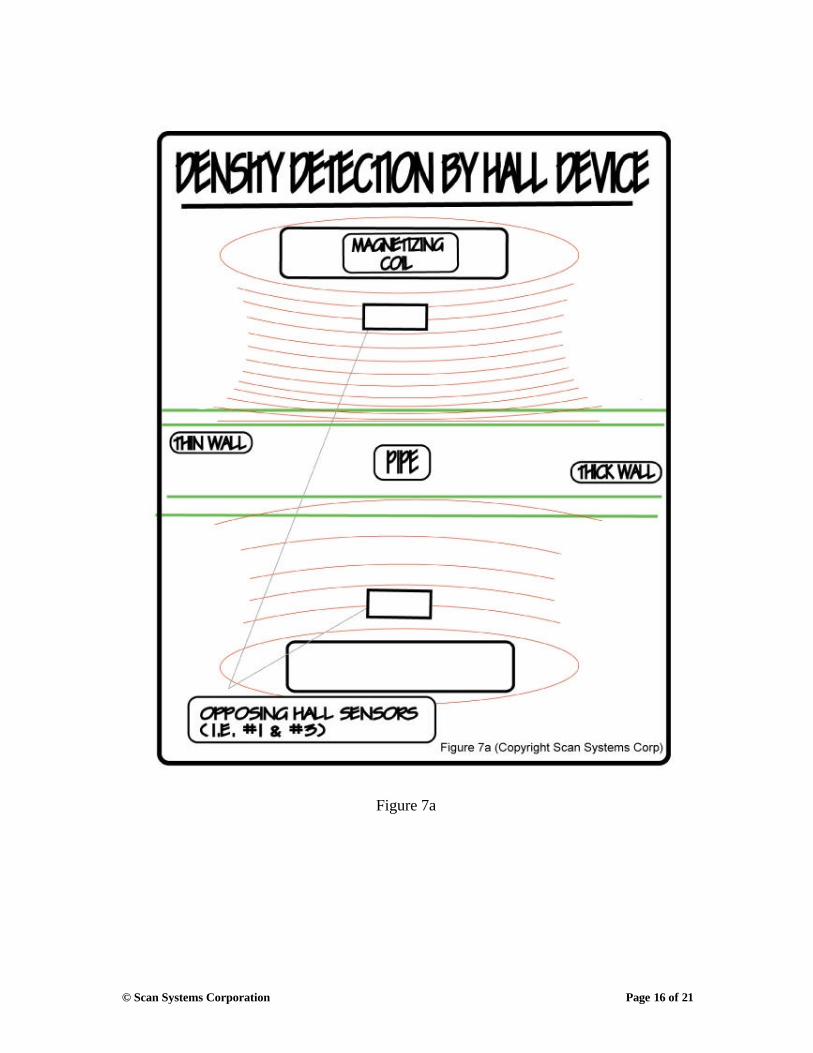
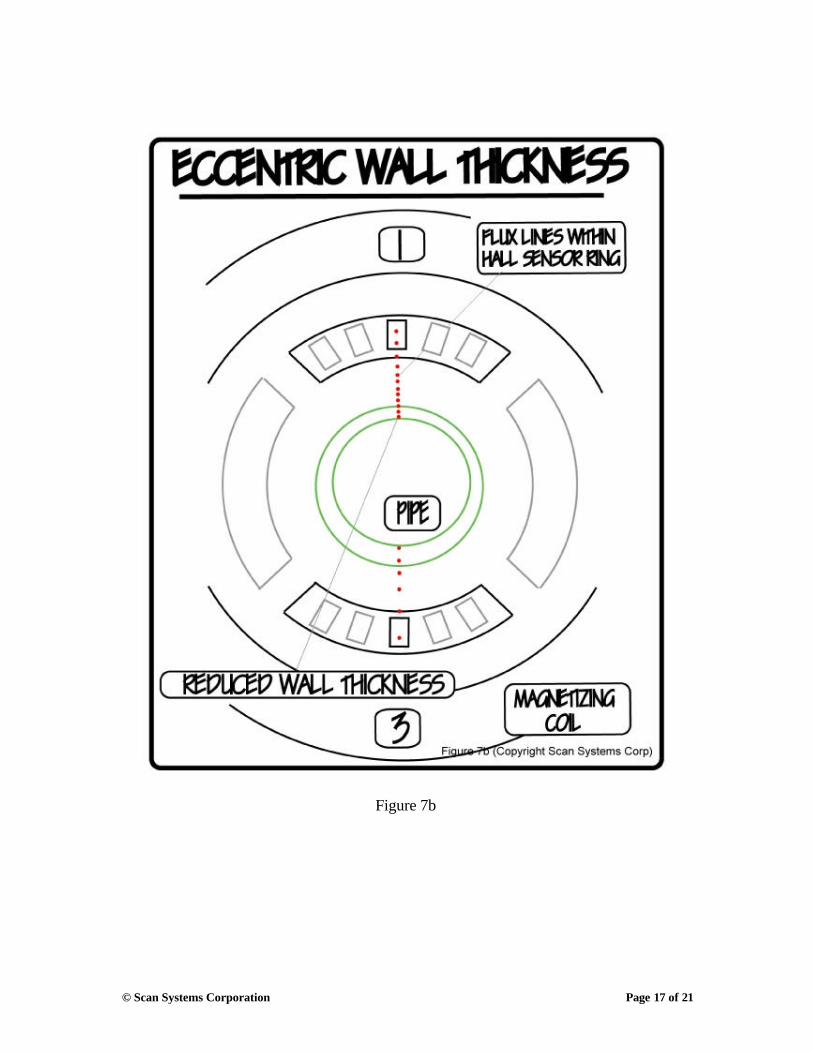
We have found that when we have tested pipe for eccentric wall thickness, the changes in the pipe wall created changes in the flux line distribution (Fig. 7a & 7b). Even though there has been no cross sectional loss of metal, the wall thickness changes create a redistribution of the horizontally aligned flux lines around the diameter of the pipe. The two Hall sensors located in the opposite quadrants will record the most perceptible change (Chart 1). All four sensors will record changes.
The results are recorded in real-time at mill production speeds. The line on the display monitor tracking the variable wall thickness is compared to a calibrated line of acceptable threshold for the pipe being inspected. When the wall thickness falls out of this acceptable level, the tracking line will cross the calibrated line and the pipe will be marked with paint near the suspected point. During the process, a digital copy of the inspection is being recorded and stored. A print of the map of the pipe can be made for final prove-up with a hand-held ultrasonic inspection device (Fig. 6).
Localized Wall Thickness Measurement
The origin of volumetric reductions in pipe wall can take place during manufacturing or during in-service use. In the manufacturing stage, the defects may be present in the raw material or may be introduced during the pipe processing.
Figure 7b
Figure 8
© Scan Systems Corporation Page 6 of 21
In the seamless manufacturing process, for example, an occurrence of volume reduction happens when a mill slug is rolled into the pipe creating an irregular shaped indention (Fig. 8).
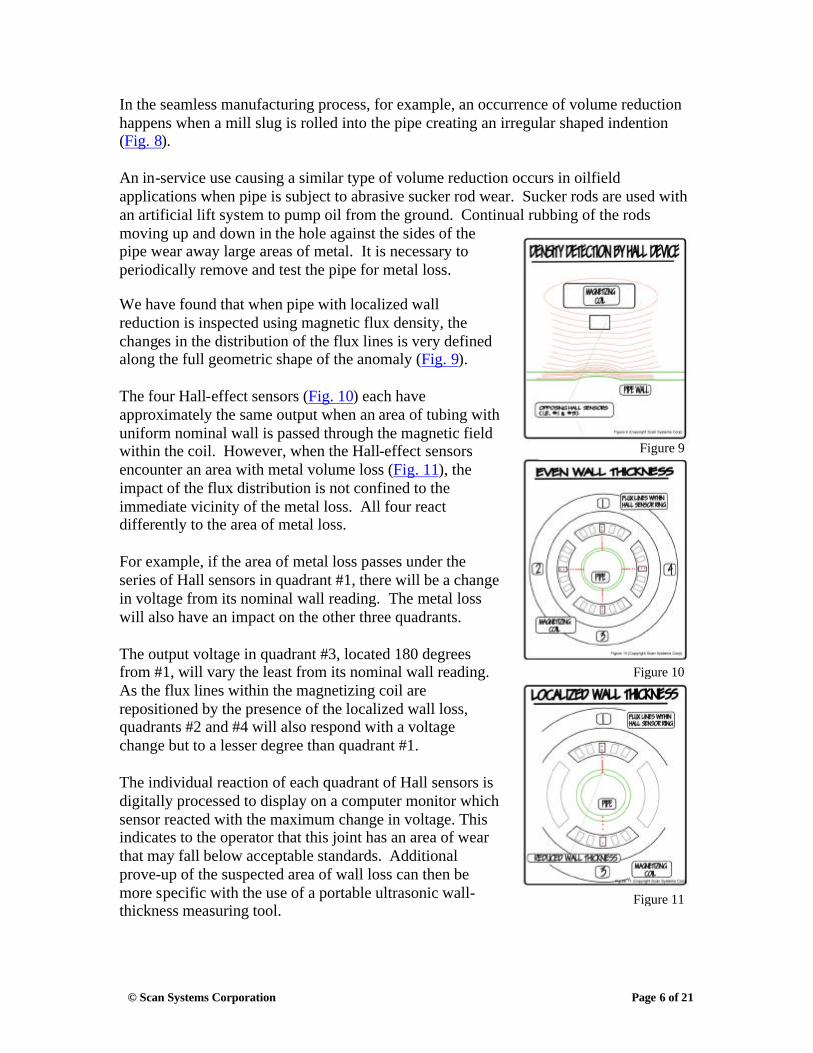
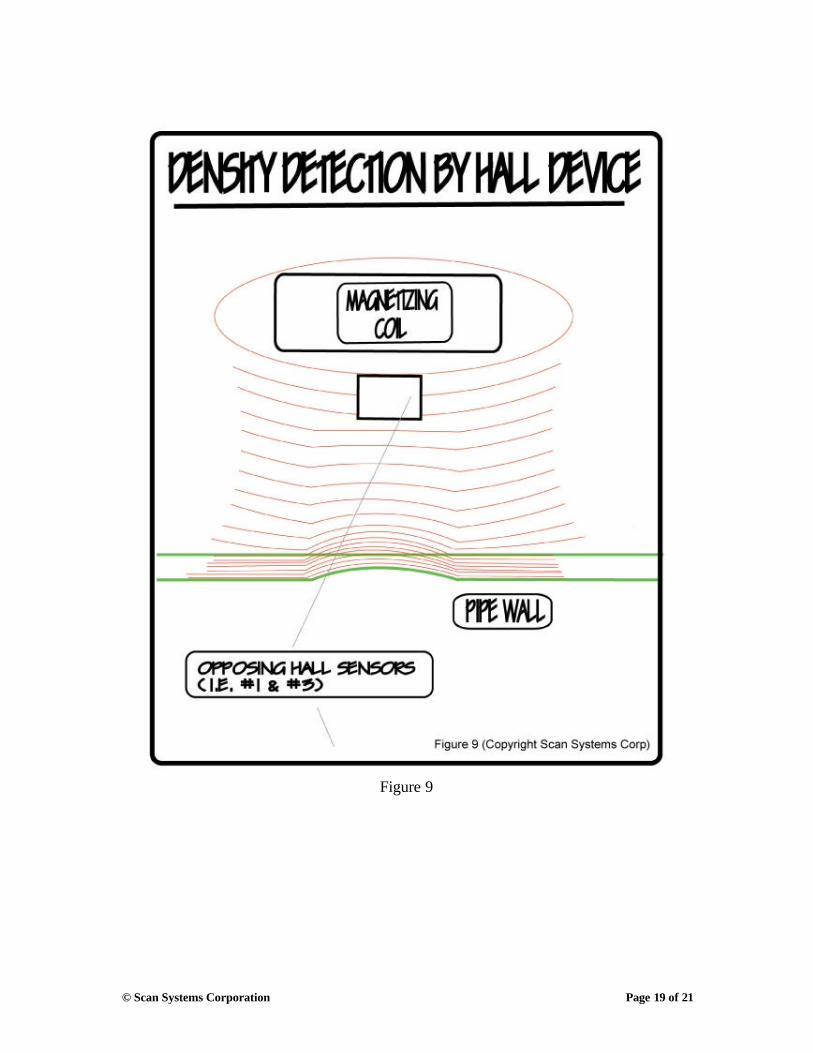
An in-service use causing a similar type of volume reduction occurs in oilfield applications when pipe is subject to abrasive sucker rod wear. Sucker rods are used with an artificial lift system to pump oil from the ground. Continual rubbing of the rods moving up and down in the hole against the sides of the pipe wear away large areas of metal. It is necessary to periodically remove and test the pipe for metal loss. We have found that when pipe with localized wall reduction is inspected using magnetic flux density, the changes in the distribution of the flux lines is very defined along the full geometric shape of the anomaly (Fig. 9).
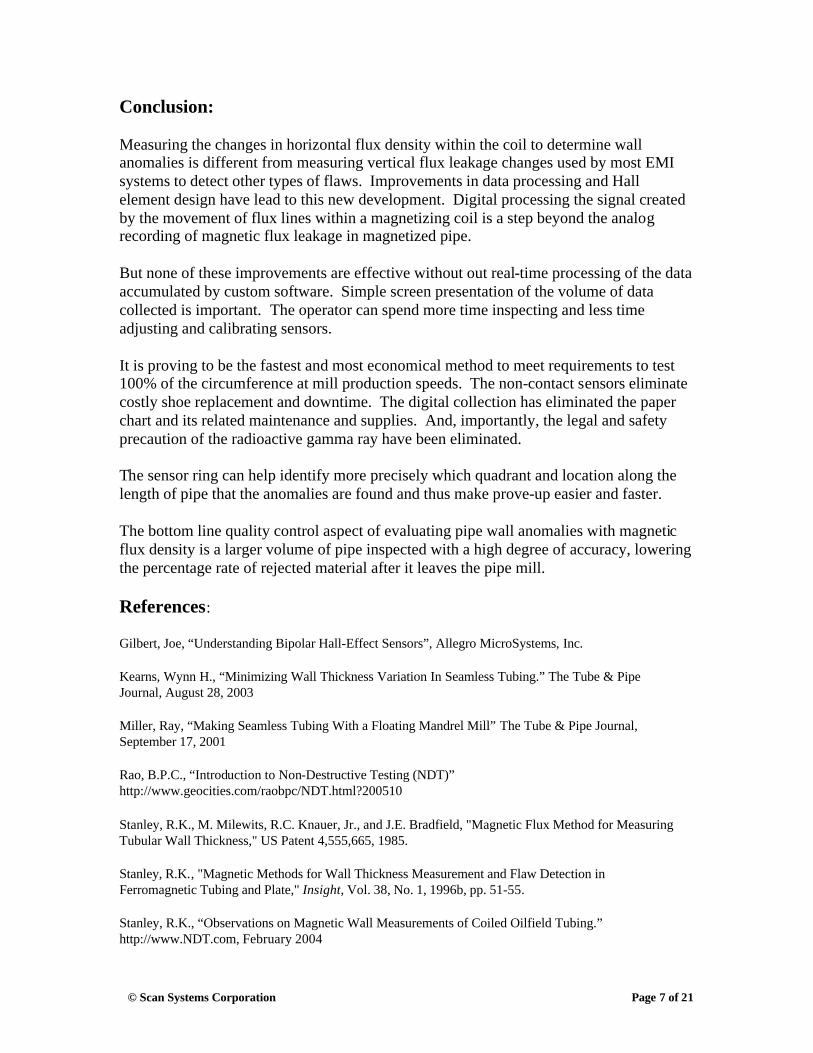
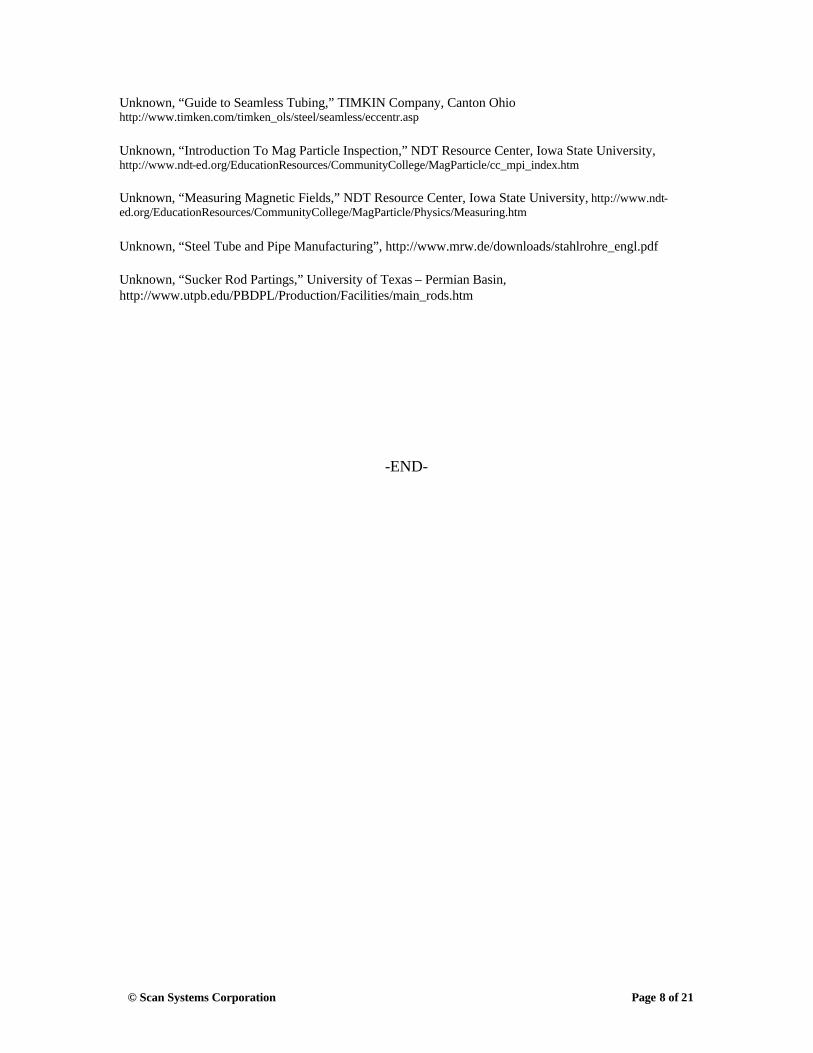
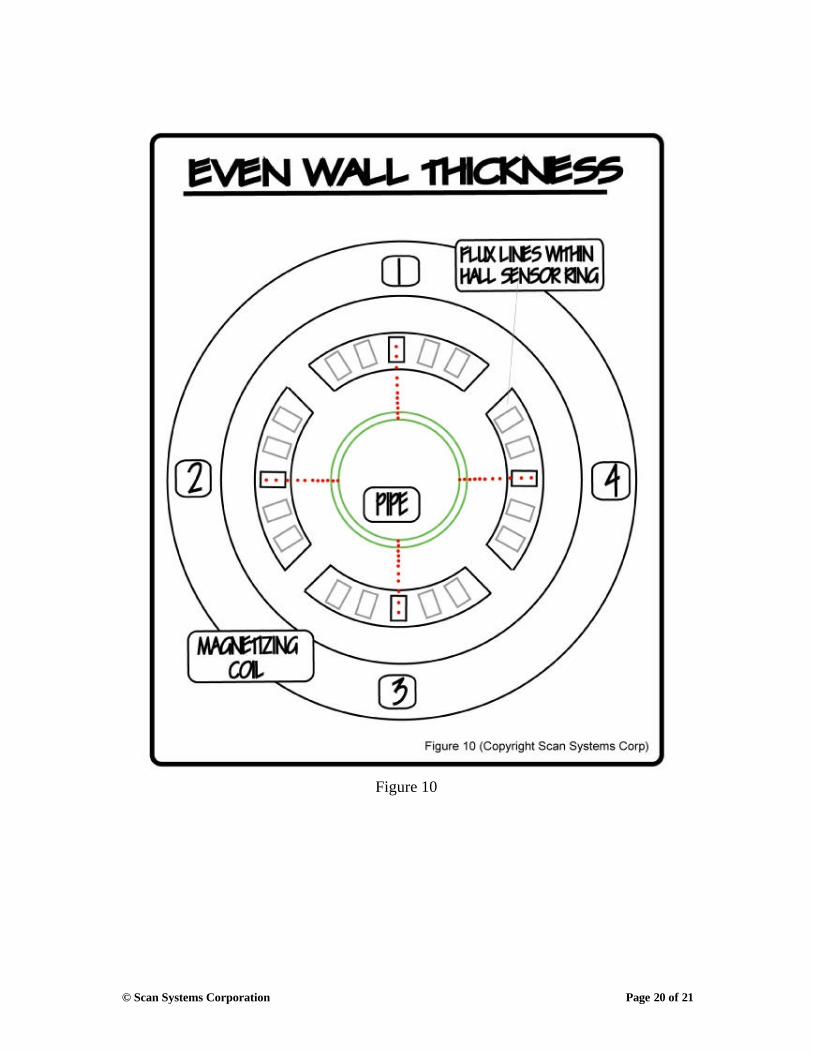
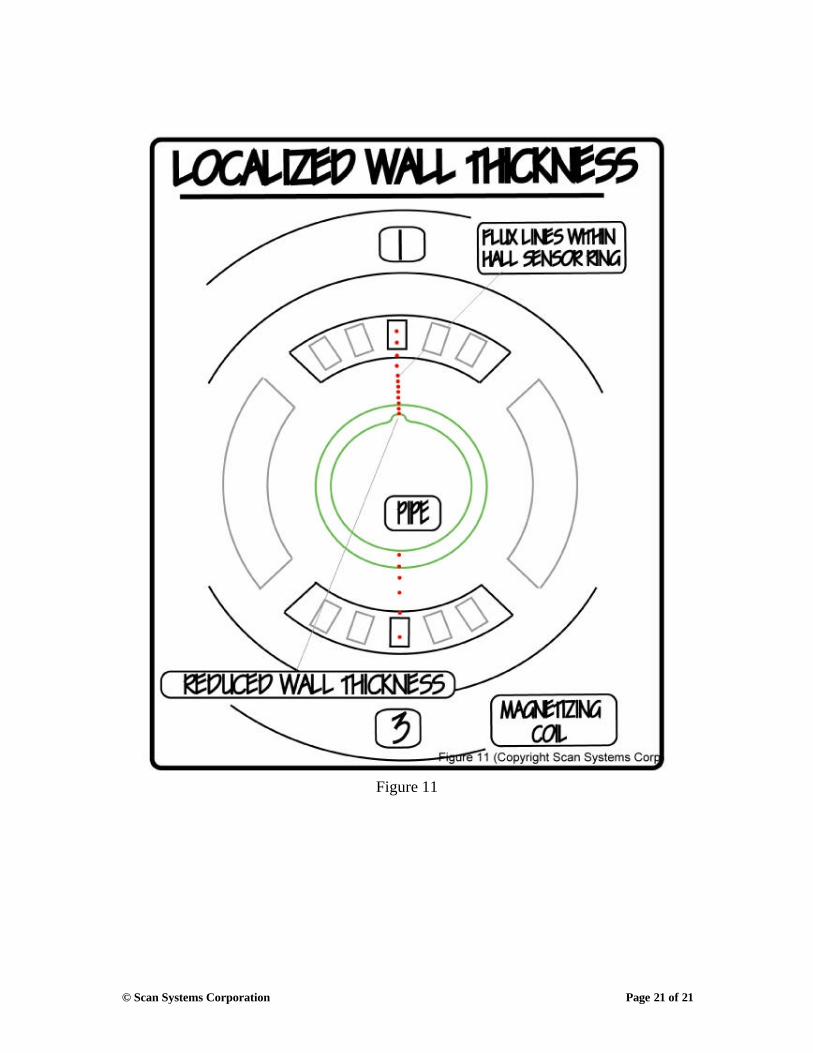
The four Hall-effect sensors (Fig. 10) each have approximately the same output when an area of tubing with uniform nominal wall is passed through the magnetic field within the coil. However, when the Hall-effect sensors encounter an area with metal volume loss (Fig. 11), the impact of the flux distribution is not confined to the immediate vicinity of the metal loss. All four react differently to the area of metal loss.
For example, if the area of metal loss passes under the series of Hall sensors in quadrant #1, there will be a change in voltage from its nominal wall reading. The metal loss will also have an impact on the other three quadrants.
The output voltage in quadrant #3, located 180 degrees from #1, will vary the least from its nominal wall reading. As the flux lines within the magnetizing coil are repositioned by the presence of the localized wall loss, quadrants #2 and #4 will also respond with a voltage change but to a lesser degree than quadrant #1.
The individual reaction of each quadrant of Hall sensors is digitally processed to display on a computer monitor which sensor reacted with the maximum change in voltage. This indicates to the operator that this joint has an area of wear that may fall below acceptable standards. Additional prove-up of the suspected area of wall loss can then be more specific with the use of a portable ultrasonic wall-thickness measuring tool.
Figure 9
Figure 10
Figure 11
© Scan Systems Corporation Page 7 of 21
Conclusion:
Measuring the changes in horizontal flux density within the coil to determine wall anomalies is different from measuring vertical flux leakage changes used by most EMI systems to detect other types of flaws. Improvements in data processing and Hall element design have lead to this new development. Digital processing the signal created by the movement of flux lines within a magnetizing coil is a step beyond the analog recording of magnetic flux leakage in magnetized pipe.
But none of these improvements are effective without out real-time processing of the data accumulated by custom software. Simple screen presentation of the volume of data collected is important. The operator can spend more time inspecting and less time adjusting and calibrating sensors.
It is proving to be the fastest and most economical method to meet requirements to test 100% of the circumference at mill production speeds. The non-contact sensors eliminate costly shoe replacement and downtime. The digital collection has eliminated the paper chart and its related maintenance and supplies. And, importantly, the legal and safety precaution of the radioactive gamma ray have been eliminated.
The sensor ring can help identify more precisely which quadrant and location along the length of pipe that the anomalies are found and thus make prove-up easier and faster.
The bottom line quality control aspect of evaluating pipe wall anomalies with magnetic flux density is a larger volume of pipe inspected with a high degree of accuracy, lowering the percentage rate of rejected material after it leaves the pipe mill.
References:
Gilbert, Joe, “Understanding Bipolar Hall-Effect Sensors”, Allegro MicroSystems, Inc.
Kearns, Wynn H., “Minimizing Wall Thickness Variation In Seamless Tubing.” The Tube & Pipe Journal, August 28, 2003
Miller, Ray, “Making Seamless Tubing With a Floating Mandrel Mill” The Tube & Pipe Journal, September 17, 2001
Rao, B.P.C., “Introduction to Non-Destructive Testing (NDT)” http://www.geocities.com/raobpc/NDT.html?200510
Stanley, R.K., M. Milewits, R.C. Knauer, Jr., and J.E. Bradfield, "Magnetic Flux Method for Measuring Tubular Wall Thickness," US Patent 4,555,665, 1985.
Stanley, R.K., "Magnetic Methods for Wall Thickness Measurement and Flaw Detection in Ferromagnetic Tubing and Plate," Insight, Vol. 38, No. 1, 1996b, pp. 51-55.
Stanley, R.K., “Observations on Magnetic Wall Measurements of Coiled Oilfield Tubing.” http://www.NDT.com, February 2004
© Scan Systems Corporation Page 8 of 21
Unknown, “Guide to Seamless Tubing,” TIMKIN Company, Canton Ohio http://www.timken.com/timken_ols/steel/seamless/eccentr.asp
Unknown, “Introduction To Mag Particle Inspection,” NDT Resource Center, Iowa State University, http://www.ndt-ed.org/EducationResources/CommunityCollege/MagParticle/cc_mpi_index.htm
Unknown, “Measuring Magnetic Fields,” NDT Resource Center, Iowa State University, http://www.ndt-ed.org/EducationResources/CommunityCollege/MagParticle/Physics/Measuring.htm
Unknown, “Steel Tube and Pipe Manufacturing”, http://www.mrw.de/downloads/stahlrohre_engl.pdf
Unknown, “Sucker Rod Partings,” University of Texas – Permian Basin, http://www.utpb.edu/PBDPL/Production/Facilities/main_rods.htm
-END-
© Scan Systems Corporation Page 9 of 21
Figure 1
© Scan Systems Corporation Page 10 of 21
Figure 2
© Scan Systems Corporation Page 11 of 21
Figure 3
© Scan Systems Corporation Page 12 of 21
Figure 4a
© Scan Systems Corporation Page 13 of 21
Figure 4b
© Scan Systems Corporation Page 14 of 21
Figure 5
© Scan Systems Corporation Page 15 of 21
Figure 6
© Scan Systems Corporation Page 16 of 21
Figure 7a
© Scan Systems Corporation Page 17 of 21
Figure 7b

© Scan Systems Corporation Page 18 of 21
Figure 8
© Scan Systems Corporation Page 19 of 21
Figure 9
© Scan Systems Corporation Page 20 of 21
Figure 10
© Scan Systems Corporation Page 21 of 21
Figure 11