Embed Size (px)
Citation preview

at SciVerse ScienceDirect
Atmospheric Environment 76 (2013) 81e93
Contents lists available
Atmospheric Environment
journal homepage: www.elsevier .com/locate/atmosenv
Emission controls and changes in air quality in Guangzhouduring the Asian Games
Huan Liu a, Xuemei Wang b,**, Jinpu Zhang b, Kebin He a,*, Ye Wu a, Jiayu Xu a
a School of Environment, Tsinghua University, Beijing 100084, Chinab School of Environmental Science and Engineering, Sun Yat-Sen University, Guangzhou, China
h i g h l i g h t s
< This paper analyzes the emissions and pollutants concentrations in PRD region.< The new daily concentration standards of NO2 and PM2.5 are difficult to meet.< To reduce PM2.5, the abatement strategy should consider gases and PM pollutants.< PM10 concentration can meet the daily limits, but hard to meet the new annual limit.
a r t i c l e i n f o
Article history:Received 14 February 2012Received in revised form31 July 2012Accepted 1 August 2012
Keywords:Emission controlNew ambient air quality standardsSTEM modelGuangzhou Asian GamesPearl River Delta
* Corresponding author. Tel./fax: þ86 10 62771679** Corresponding author. Tel.: þ86 20 84112293; fax
E-mail addresses: [email protected] (X. W(K. He).
1352-2310/$ e see front matter � 2012 Elsevier Ltd.http://dx.doi.org/10.1016/j.atmosenv.2012.08.004
a b s t r a c t
With the new air quality standards forthcoming in China, the Pearl River Delta region is facing newchallenges to achieve its air quality goal. The success of the emission reduction measures introduced bylocal authorities in the run-up to the Guangzhou Asian Games demonstrated that the Pearl River Delta airquality can be improved by introducing integrated emission reduction measures. This paper combinesobservation data, emission reduction measures, and air quality simulations that were applied during theAsian Games (12e27 November 2010) to analyze the relationship between emissions and concentrationsof pollutants in Guangzhou. The Asian Games abatement strategy totally reduced emissions of 41.1% SO2,41.9% NOx, 26.5% PM10, 25.8% PM2.5 and 39.7% VOC. The concentrations of SO2, NO2, PM10 and PM2.5 werereduced by 66.8%, 51.3%, 21.5% and 17.1%, respectively. In Guangzhou, the main challenge to be overcomewith the new air quality daily requirements is mostly for NO2, PM2.5, and hourly ozone maxima. Ifpollutants maintain the same concentrations before and after the Asian Games, there will be 47.4% and31.6% non-attainment days for NO2 and PM2.5 respectively as a period average. Although PM10 concen-tration can meet the daily limits (150 mg m�3), it is quite difficult to meet the annual limit value (70 mg m�3). One important implication is that the long-term, step-by-step integrated measures of the past sixyears work better than the strict, intensive, short-term measures on SO2, NO2 and VOC control. Dustcontrol by limiting construction sites and watering the roads can further reduce 12.8% of the PM10
concentration. However, to reduce ambient PM2.5, the abatement strategy should be more complex andextensive. On the contrary, ozone pollution was not improved during the Asian Games, indicating thatalleviation strategies should be improved by scientific studies to determine the appropriate control ratioof NO2 and VOC in the Pearl River Delta region.
� 2012 Elsevier Ltd. All rights reserved.
1. Introduction
Air quality in Pearl River Delta (PRD) is topical due to the rapidincrease in industry and vehicle populations as well as pollutants
.: þ86 20 84110692.ang), [email protected]
All rights reserved.
transportation among PRD, Hong Kong and Macau (Wang et al.,2005; So et al., 2007; Louie et al., 2005, Guo et al., 2009). PRD airquality problems were characterized historically by high concen-trations of primary pollutants, e.g. SO2 and NOx (Chan and Yao,2008; Xiao et al., 2006). In recent years e due to poor air qualityand visibilitye the secondary air pollutants, e.g. fine particulates aswell as ozone pollution, have drawn increasing attention (Huanget al., 2012; Cheng et al., 2008; Zheng et al., 2010; Wang et al.,2008; Wang and Zeng, 2011; Zhang et al., 2007; Dufour et al.,2010). Particularly, with the new National Ambient Air Quality

Table 1The eight steps of the abatement strategy for the Guangzhou Asian Games.
Step Period Target and plans
Phase 1 July 2004eDec. 2005 Achieve the level II standards ofNAAQS (old)
Phase 2 Jan. 2006eOct. 2006 Achieve environment model city;the percent of days which APIreaches level I and level II is morethan 91.5%
Phase 3 Nov. 2006eFeb. 2008 The total SO2 emission amountkeep decrease
Phase 4 March 2008eDec. 2008 Start ‘50 measures to improveair quality’
Phase 5 Jan. 2009eNov. 11, 2009 Implement ‘50 measures to improveair quality’ and ‘31 new measuresto improve air quality’
Phase 6 Nov. 12, 2009eOct. 19,2010
Implement ‘air quality security planfor the Asian Games’ and ‘5 accompanyplans’
Phase 7 Oct. 20e Dec. 20, 2010 i) All construction activities wereplaced on hold; ii) Odd/even restrictionsfor personal vehicle; iii) strictly supervisepoint sources in PRD to reduce emissions.Emergency measures were prepared toimplement.
Phase 8 After Dec. 21, 2010 Continue improve air quality
Table 2Scenarios for emission inventory and air quality simulation.
Scenarioa Emission reduction Emissioninventory
Airquality
Concentrationreduction
BAU 0 EIBAU ¼ EI1 þ vLT SBAU 0S1 vLT: Example 1. EI1 S1 DLT ¼ SBAU � S1S2.1 vST ¼ vv þ vD þ vothers EI2.1 ¼ EI1 � vST S2.1 DST ¼ S1 � S2.1S2.2 vV: Example 2.
Vehicle controleffects.
EI2.2 ¼ EI2.1 þ vV S2.2 Dv ¼ S2.2 � S2.1
S2.3 vD: Based on thepercentage of dustabatement area
EI2.3 ¼ EI2.1 þ vD S2.3 DD ¼ S2.3 � S2.1
S3 v3days: Bottom-upapproach for pointsources based ongovernment controlplan
EI3 ¼ EI2.1 � v3days S3 D3days ¼ S2.1 � S3
S1, with long-term emission control only, the real emissions before and after theAsian Games.S2.1, with both long and short-term emission control, emissions during the AsianGames.S2.2, if without vehicle control during the Asian Games.S2.3, if without dust control during the Asian Games.S3, with all controls above, plus strengthened measures for the Opening Ceremony.
a BAU, theoretical-PRD-2010 if there is no control since 2006.
H. Liu et al. / Atmospheric Environment 76 (2013) 81e9382
Standards (NAAQS) forthcoming (published in Feb. 2012, will beimplemented from key regions to nation by four steps from 2012 to2016), the PM10 (particles with a diameter of 10 mmor less) and NO2(nitrogen dioxide) will be more strictly controlled. MeanwhilePM2.5 (particles with a diameter of 2.5 mm or less, with daily andannual threshold values of 75 and 35 mg m�3) and maximum eight-hour average ozone standards (200 mg m�3) were added intoNAAQS for the first time. The annual limit value of PM10 wasreduced from 100 to 70 mg m�3. The daily and annual thresholdvalues of NO2 were changed from 120 to 80 mg m�3, and from 80 to40 mg m�3. We need to understand the gap between the air qualitystatus and the new NAAQS. More important, we need to analyzehow to improve the air quality to achieve the new goals, e.g.: whatkinds of measures should be taken in the future and what are theireffects on alleviating air pollution?
Guangzhou Asian Games provide us with an invaluable oppor-tunity to understand the pollution reduction potential in PRD. Thisevent condensed a comprehensive air quality management planinto a short-term aggressive abatement and reveals the air qualityimprovements potential under comprehensive control. During theAsian Games (12e27 November 2010) and the Asian Para Games(12e19 December 2010), non-game playing days exceeded theNAAQS (Guangzhou Environment Protection Bureau, 2011). Corre-sponding to the same periods in 2007, 2008 and 2009, thepercentage of days exceeding the NAAQS were 23.9%, 15.2% and10.9% respectively. Thus, with this case study our understanding ofthe sources control and dynamics affecting pollutants in the PRDenvironment could be improved. To learn from the success of theevent and to formulate a long-term strategy are critically importantfor further air qualitymanagement, as a benefit not only for PRD butalso for other regions of China. In addition, with the support fromstakeholders such as Guangzhou Environment Protection Bureau,Guangzhou EnvironmentMonitoring Center, etc., data availability isgreatly improved now than it was for previous studies.
Our objective is to identify the likelihood of PRD in meeting thenew NAAQS considering the current emissions and emissionreduction potential. The air quality simulation under differentcontrol scenarios will be compared with the new NAAQS. Since theGuangzhou Asian Games reflected the largest effort on controls, wedevelop several scenarios based on the government actions for theGames to simulate the potential of air quality improvement in thefuture.
2. Emission reduction as a result of different controlstrategies
2.1. Control strategies
In the past six years, Guangzhou has taken several steps toaddress its pollution problem during a time of rapid growth of theeconomy and in energy demands. In total, eight phases of newpolicies were implemented in order to improve environmentalpollution abatement efforts and to reduce energy consumption forthe Asian Games (Table 1).
2.2. Evaluation method
Four types of parameters are used in this study: emissionreduction percentage (v), emission inventory for different scenarios(EI), air quality (S), and air quality change (D). The scenariosdesigned and air quality simulations in this study were summa-rized in Table 2. In this study, the emission abatement strategies areclassified into three types: i) long-term abatement measures from2006 to 2010; ii) temporary abatement measures during the AsianGames; and iii) the strengthened abatement measures for the
Opening Ceremony. The emission reductions are represented by vLT,vST and v3day. There are two additional scenarios generated fromtemporary abatement for vehicle and dust control. As a summary,six scenarios were generated.
A bottom-up approach was adopted in this study for thosecategories where possible, for example, vehicle emission simula-tion and v3day from point sources control. A top-down approachwas used for other categories mainly based on government statisticdata.
Two basic emission inventories (EI) were referenced: PRD-2006and PRD-2010, developed by Zheng et al. (2009). A detailed methodis presented by Zheng et al. (2009), and is only shortly summarizedhere. The domain is divided into 10,825 grid cells with 3 km� 3 kmspatial resolution and covers nine cities located in the PRD region(exclusive of Hong Kong and Macau). The emission sources includesix major categories: power plants, industry, mobile sources, VOCproduct-related sources, and biogenic sources and others.

H. Liu et al. / Atmospheric Environment 76 (2013) 81e93 83
2.3. Business as usual (BAU) scenario
Business as usual (BAU) scenario represents the theoretical PRDcondition 2010 if there is no control since 2006. To ensure the emis-sion inventory of BAU scenario, two approaches were used andcompared to each other. The first method is adding emission reduc-tion of long-term abatement to 2010 real emissions. The long-termabatement evaluation uses the statistical emission reductions,mainly from government inspection reports. All of the 16,860 controlmeasures were evaluated by Guangzhou Environmental ProtectionBureau (Guangzhou Environment Protection Bureau, 2011). Thesecondmethod isusing linearextrapolationbasedonactivitydataandthe capacity of emission control devices. These activity data includegross domestic product (GDP), industry sector GDP, coal consumption(C), electricity generation (E), vehicle population (V), gasolineconsumption (FG), diesel consumption (FD) and construction area(CA), etc. Here, we use sulfur dioxide (SO2) reduction as an example.
EIBAU ¼ E1þvLT;SO2
¼ E1þReported Emission Reduction data Method 1; (1)
EIBAU ¼ fxðEI2004;GDP;C; EÞ Method 2; (2)
Where EI1 is the normal emissions in 2010 for scenario 1.
Table 3Linear extrapolation based on activity data and reduction capacity.a
2004 2005
GDP, billion CNYb 445.1 515.
Industry sector GDP, billion CNY 178.8 204.
Coal consumption, kt 218.2 224.
Electricity generation, billion kwh 33.9 31.4
Desulfurization capacity, kt c 31.0 46.7
Theoretical SO2 emissions, kt 216.0 222.
Real SO2 emissions, kt d 185.0 173.
Desulfurization rate, % 14.4 22.2
a Color represent: black & white, solid statistic
secondary calculation; green, for check purposes
b GDP and coal consumption data is from 2004
Yearbook. (Bureau 2011).
c Desulfurization capacity data is mainly from g
online . (Dong 2006).
d Real SO2 emissions in 2004, 2009 and 2010
(Zheng et al. 2009).
The detailed data with references are listed in Table 3. Firstly,coal consumption amounts in 2009 and 2010 were linear simu-lated based on the 2004e2010 GDP, 2004e2010 industry sectorGDP and 2004e2008 coal consumption (Guangzhou StatisticBureau, 2011). The trend of electricity generation amounts from2004 to 2008 is very similar to the trend of coal consumption,indicating the reliability of coal consumption data. Secondly, thetheoretical SO2 emissions in 2004 and 2009 were calculated byadding the desulfurization capacity on real SO2 emissions. Thedesulfurization capacity data is achieved from government reports(Dong, 2006). The real SO2 emissions in 2004, 2009 and 2010 arereferenced from Zheng et al. (2009). Then, the theoretical SO2emissions in other years could be linear explored by coalconsumption and theoretical SO2 emissions in 2004 and 2009. Tocheck the reliability of the theoretical SO2 emissions, the real SO2emissions in 2005e2008 was calculated by using theoretical valueminus desulfurization capacity. The desulfurization rates in 2004e2010 were calculated based on the real and theoretical emissions.As the desulfurization rates are comparable to China ElectricityCouncil reported data (China Electricity Council, 2010), Method 2is thought to be reliable.
The results from both Method 1 and Method 2 for long-termcontrols are summarized in Table 4. By using both methods, weare able to calculate the theoretical emissions for more sectors in2010. When both methods are used, there is an overlap in three
2006 2007 2008 2009 2010
4 608.2 714.0 828.7 913.8 1064.6
5 244.2 282.6 322.8 340.5 395.1
8 223.8 221.7 211.9 217.1 217.1
31.0 33.1 31.3
67.8 86.2 104.6 123.0 129.9
5 221.5 219.5 209.8 214.9 214.9
1 153.7 133.3 105.2 91.9 85.0
30.6 39.3 49.9 57.2 60.4
al data; orange, direct calculation; purple,
.
–2010 Guangdong & Guangzhou Statistic
overnment reports and is also available
are from Zheng’s emission inventory.

Table 4Comparison of long-term emission reductions calculated by different methods.
EIBAU/EI1 Difference
Method 1 Method 2
SO2, 56 point sources 3.11 4.7 for 13 powerplants & 1.62 forother 43 sources
e
SO2, other point 1.22 e
NOx, 13 power plants 1.62 1.67 3%VOC, industry 1.25 1.27 2%Vehicle emissions e 2.15CO, area source 2.01 e
NOx, area source 2.04 e
PM10, area source 1.38 e
PM2.5, area source 1.69 e
VOC, area source 1.01 e
H. Liu et al. / Atmospheric Environment 76 (2013) 81e9384
fields: SO2 from the 56 point sources; NOx from 13 major powerplants and industry Volatile Organic Compound (VOC) emissions.
2.4. Scenario 1, long-term emission reduction
Scenario S1 is the real condition before and after the AsianGames, with long-term emission control 2006e2010 only. Thisemission inventory is generated based on emission inventorydeveloped by Zheng et al. (2009).
2.5. Scenario 2.1, 2.2 and 2.3, short-term control during the AsianGames
From 1 to 27 November and 5e21 December 2010, mandatoryrestrictions were implemented for personal vehicles, permittingthem on roads only on alternate days depending on license platenumbers (odd-numbered vehicles on odd-numbered days andeven-numbered vehicles on even-numbered days). During theGames, all construction activities were placed on hold during theGames. Point sources in PRD were supervised strictly to reduceemissions.
Scenario 2 includes three sub-scenarios: scenario 2.1, scenario2.2 and scenario 2.3. Scenario S2.1 reflects the emissions during theAsian Games, with both long and short-term emission control.Scenario S2.2 is a hypothetical condition if without vehicle controlduring the Asian Games. Scenario S2.3 represents the condition ifwithout dust control during the Asian Games.
Table 5Hourly VKT and emission changes before and during the Asian Games due to the short-
Hour of the day Hourly VKT, % VRB pattern in Travel model Em
No contl. Contl. No contl. Contl. H
7 4.6 4.0 A5 A5 08 5.9 5.4 A6 A6 09 6.9 6.1 A3 A6 2010 7.1 6.3 A3 A6 2011 6.9 6.3 A3 A6 2012 6.4 5.9 A3 A6 2013 6.3 5.9 A3 A6 2014 6.7 6.3 A3 A3 015 7.0 6.4 A3 A3 016 7.0 6.1 A3 A3 017 7.1 6.0 A3 A6 2018 6.7 5.9 A3 A6 2019 5.6 5.0 A2 A6 1320 5.5 5.6 A2 A2 021 5.5 5.4 A6 A6 022 4.6 4.6 A6 A6 0Day 100.0 91.4 6
i) Example: vehicle emission control
The traffic flow was monitored during the Asian Games. Twovehicle emission models were used to simulate the emissionchanges from the on-road transportation sector. The TRaffic AndVehicle Emission Linkage (TRAVEL) model firstly converts thechanges of traffic volume into vehicle running activity (Liu et al.,2011). This model was established based on data from vehicleactivity studies conducted in China. The traffic volume provides thenumberof vehicles on roadperhour and the vehicle running activityprovides the statistical vehicle speed and acceleration distribution.Then the International Vehicle Emission (IVE) model (Liu et al.,2007) with local emission factors (Huo et al., 2012) was employedto calculate the total emission changes. The average Vehicle Kilo-meters Travelled (VKT)was reduced8.6%by traffic control,while thechanges vary from 0 to 15.9% depending on the time of day. Theaverage speed on arterial roads reaches 43 km h�1 (14.9% higherthan before). Due to reduced traffic, the emission factors of HC, CO,PM and NOx were reduced by 6.4%, 5.6%, 5.7% and 5.1% based on thedaily average. Thus, combining the VKT reduction and lower emis-sion rates, the on-road emissionswere reduced by 17.8% of HC,16.6%of CO, 16.7% of PM and 15.9% of NOx. Hourly variations of the VKT,emission factors and emission amounts are provided in Table 5.
Emission reductions from prohibitions of yellow-label duringthe Asian Games period were obtained from a detailed bottom-upapproach reflecting vehicle fleet changes (Yao et al., in press). Theemission reductions were 22% of HC, 19% of CO, 29% of PM and 23%of NOx. As a combination of both odd/even traffic restrictions andyellow-label vehicle restrictions, we estimate the total reductionsof the mobile source are 35.6% of HC, 44.5% of CO, 24.8% of PM and30.3% of NOx.
2.6. Scenario 3: enhanced control for opening ceremony
Scenario S3 is the strictest control scenario, with all controlsabove, plus strengthened measures for the Opening Ceremony.Strengthened abatement measures were implemented during 10e12 November 2010 to ensure better air quality for the OpeningCeremony. Power plants were required to reduce their emissions by30% from their levels in October when they had already met theemission standards. Since it has been shown that Guangzhou’s airquality problems also have regional effects (Chen et al., 2010),emission controls on large industrial sources were also applied insurrounding cities (e.g. Dongguan, Foshan).
term traffic control (%).
ission factor reductions, % Emission reductions, %
C CO PM NOx HC CO PM NOx
.0 0.0 0.0 0.0 12.7 12.7 12.7 12.7
.0 0.0 0.0 0.0 8.6 8.6 8.6 8.6
.1 17.3 17.7 16.1 29.3 26.9 27.2 25.7
.1 17.3 17.7 16.1 28.4 25.9 26.2 24.8
.1 17.3 17.7 16.1 27.8 25.3 25.6 24.1
.1 17.3 17.7 16.1 26.8 24.2 24.5 23.1
.1 17.3 17.7 16.1 25.2 22.6 22.9 21.4
.0 0.0 0.0 0.0 5.9 5.9 5.9 5.9
.0 0.0 0.0 0.0 8.6 8.6 8.6 8.6
.0 0.0 0.0 0.0 13.2 13.2 13.2 13.2
.1 17.3 17.7 16.1 32.8 30.5 30.7 29.4
.1 17.3 17.7 16.1 28.9 26.4 26.7 25.3
.9 12.0 12.3 10.3 23.1 21.5 21.7 19.9
.0 0.0 0.0 0.0 (2.4) (2.4) (2.4) (2.4)
.0 0.0 0.0 0.0 1.7 1.7 1.7 1.7
.0 0.0 0.0 0.0 0.0 0.0 0.0 0.0
.4 5.6 5.7 5.1 17.8 16.6 16.7 15.9

H. Liu et al. / Atmospheric Environment 76 (2013) 81e93 85
2.7. Summary of emission reductions (v)
Fig. 1 only shortly summarizes the emission reductions fromeach measure (v). The daily emission of SO2, NOx, PM10, PM2.5 andVOC in PRD were reduced by 29.4%, 35.4%, 6.9%, 13.0% and 32.4%since 2006e2010 before the Asian Games (vLT), while the short-term abatement strategy, including traffic abatement, dustcontrol and other measures, further reduced 11.6% SO2, 6.5% NOx,19.5% PM10, 12.8% PM2.5 and 7.3% VOC compared with the non-control BAU scenario. The three days strengthened plan canfurther reduce 3.5% SO2, 3.1% NOx, 2.2% PM10, 2.4% PM2.5 and 1.2%VOC.
For SO2, NOx and VOC, the long-term abatements are dominant,contributing 71.7%, 84.5% and 81.7% of total reduction respectively.For PM10, the dust abatement during the Asian Games contributed73.8% of total reductiondabout 10.6% of PRD total PM10 (S1). Thisresult is quite similar to that of the Beijing Olympics wherebyhalted work at construction sites played an important role incontrolling the PM10 (Wang et al., 2010). The odd/even trafficrestrictions and yellow-label vehicle restrictions in Guangzhoutotally reduced mobile sources NOx, CO, PM and VOC by 30.3%,44.5%, 24.8% and 35.6% respectively or PRD total NOx, CO and VOC(S1) by 3.8%, 9.1% and 4.0%. This result is about 2/3 compared withthe Beijing Olympic traffic control effects (Liu et al., 2011; Zhouet al., 2010). One reason for this is probably due to the depen-dence on public transit before the Asian Games in Guangzhou(59.6%) was much higher than before the Olympics in Beijing(30.2%) (Guangzhou Transportation Commission, 2010). Thus, theVKT reduction in Guangzhou (8.6%) is smaller compared to BeijingOlympic traffic controls (26%e32%) (Liu et al., 2011; Zhou et al.,2010; Cai and Xie, 2011; Wang and Xie, 2009). Besides the long-term and short-term abatements, the strengthened controls forthe Opening Ceremony can further reduce 6.0% SO2, 5.3% NOx, 3.0%PM10, 3.3% PM2.5 and 2.0% VOC respectively compared with S2.1.
3. Air quality modeling
3.1. Methodology and model evaluation
The MM5eSTEM-2k1 modeling system was used in thisresearch. MM5eSTEM-2K1 is an integrated model system whichcombines the STEM-2K1 model and the Penn/NCAR Fifth-
0
500
1000
1500
2000
2500
NOx VOC
Em
issio
n R
ed
uctio
ns, t
/d
SO2 PM10 PM2.5
Fig. 1. Accumulated emission reduction for each control scenario (v3days, vD, vV,vST_others, vLT, from top to bottom respectively. v3day, vD, vV, vLT, vST represent theemission reductions by the strengthened abatement measures for the Opening Cere-mony, by dust control, by vehicle control, by long-term abatement measures from2006 to 2010 and by temporary abatement measures during the Asian Games.).
Generation Mesoscale Meteorological Model (MM5). It includesthe SAPRC99 gaseous mechanism (Carter, 2000) with photolysisrates calculated using the online TUV model (Madronich andFlocke, 1999). The MM5 model was run to produce the meteoro-logical fields to drive the STEM-2K1. Two nested domains wereused for both models, which cover the PRD region with a centerlocated at 23.2� N and 113.6� E. The real meteorology duringNovember 9e27, 19 days in total, was used to simulate air qualityfor BAU, S1, S2.1, S2.2 and S2.3 scenarios. Since the S3 only targets atthe Opening Ceremony, the four days’ meteorology was used(November 9e12). Thus, when comparing the first five scenarios,19days’ simulationwas used while the four days’ simulationwas usedwhen comparing S3 with others (Table 2).
The STEM model was evaluated by comparing predicted dailyconcentrations for November 2010 against observation datameasured by the Guangzhou Environmental Monitoring Center andby the Pearl River Delta Regional Air Quality Monitoring Network.Observations are based on totally seven stations’ measurements(SO2, NO2, CO, TSP, PM10 and O3), whereas model simulations arebased on a volume average over unit grid cells (9 km2). The ambientair quality monitoring network of Guangzhou was strengthenedbefore the Asian Games in order to better service the air qualityreporting (Wang and Zeng, 2011). The distribution of the ambientair quality monitoring stations is presented in Fig. 2. As some of thestations are quite close to each other, this research uses theobservation data from four representative stations which aremarked in red in Fig. 2. Ozone observation data is from Luhu siteand PM2.5 observation data is from Tianhu and Wanqingsha sites.
Fig. 3 shows the comparison of STEM model simulations fordaily SO2, NO2, PM10 and O3 concentrations (mg m�3) againstobservation data. Dots marked in red, green, blue and black repre-sent data from each of the four stations. Note that O3 observation isonly available from Luhu’site and that PM2.5 observation is onlyavailable from Wanqingsha and Tianhu sites. In general, the agree-ment between modeled and observed data was good. The modelslightly under-predicted O3 concentrations (�13.2 mg m�3, �6.0%for 8-h average), which may be due to an under-estimation ofregional emissions but could be a model resolution issue. Theability of the model to simulate day-to-day variations in observa-tions is also proven by comparing the temporal pattern at onestation (the 5th middle school) which is the nearest to the OpeningCeremony stadium (Fig. 4). The biases between model and obser-vation average are �34.5 mg m�3 (�35.1%) for PM10, �13.2 mg m�3
(�11.0%) for SO2 and �14.5 mg m�3 (�18.0%) for NO2. The PM2.5modeling results were compared with observations from anothergovernment site: Wanqingsha station. The result shows the timeseries trend of modeling result is corresponding with observationfor PM2.5. The model estimation, however, failed to reproduce thehigh emission level of PM2.5, which means the estimation is moreconservative in our research.
Statistical parameters are calculated for model evaluation (Wuet al., 2011) of different pollutants (NO2, SO2, PM10, PM2.5 and O3)in Table 6. The Mean Normalized Bias (MNB) of NO2 is between�51and 4%. It is slightly overestimated at the Huadu station whileunderestimated at the other three stations. The MNB of SO2 isoverestimated at the 5th middle school station and underestimatedat the other three stations. The MNB of PM10, PM2.5 and O3 arenegative at all the stations selected, which ranging from �56to �20%, from �52 to �42% and from �31% to �6%, respectively.The Mean Normalized Error (MNE) of different pollutants are 24e54% (NO2), 44e63% (SO2), 28e56% (PM10), 43e58% (PM2.5) and21e32% (O3), respectively. For the parameter FAC2 (fraction ofprediction within a factor of two of the observation), the differentpollutants at all selected stations have values lager than or equalto 37%. For the Normalized Mean Square Error (NMSE), the

Guangzhou
FoshanZhaoqing
Shenzhen
Dongguan
Huizhou
Jiangmen
Zhongshan
Zhuhai
112oE 30'
113oE 30' 114oE
30' 115oE
30'
22oN
30'
23oN
30'
24oN
0
100
200
300
400
500
600
700
Unit:m
Monitoring stations
Regular stations
Evaluation stations
O3 station
PM2.5 station
Fig. 2. The location and surrounding altitude of ambient air quality monitoring stations in Guangzhou. The monitoring data from the four stations (marked as red) was comparedwith the modeling results for SO2, NOx, and PM10. O3 concentrations are compared to data from Luhu site (marked as blue). PM2.5 concentrations are only available from Tianhu andWanqingsha sites (marked as green). (For interpretation of the references to colour in this figure legend, the reader is referred to the web version of this article.)
H. Liu et al. / Atmospheric Environment 76 (2013) 81e9386
range is from 0.059 to 1.081, which shows an order ofPM2.5 > SO2 > PM10 > NO2 > O3, in average.
The performance of MM5 has been evaluated for bothGuangzhou Asian Games (Chen et al., 2010) and other regions inprevious investigations (Streets et al., 2007). Based on the results,the MM5 can provide good simulations for meteorology parame-ters, which are particularly important for chemical transportationmodule.
One of the advantages of the STEM model is the simulation ofOrganic Carbon (OC) and Black Carbon (BC) and OPM (other PM).Thus,wealsodevelopedOCandBC emissions basedon Streets’2000inventory. By comparing the results with the OC/BC observation(Huang et al., 2012), the new estimated OC and BC inventories weredemonstrated to be able to improve the PM simulation. Even so, westill find that the magnitude of PM’s simulation was lower thanobservation in general,whichmaydue to the fact that the secondaryorganic aerosols (SOA) were not taken into consideration as STEM-2k1 does not have a module to deal with such processes.
3.2. Air quality effects
Fig. 5 (top four frames) shows 19 days average BAU simulationsof PM10, O3, SO2 and NO2 concentrations in the 3-km modeldomain, following by S1 simulation (the second row, from top tobottom: SBAU, S1, DLT, DST, DV, DD and D3days, See Table 2 for thedefinition of D). The differences of air quality before and after eachmeasure (shown in the second to bottom frames) can be used toapproximately represent the average contributions of differentcontrol measures alone during the Asian Games period. The third tobottom frames show the air quality difference due to long-term,short-term total, vehicle, dust, and strengthened controls. Thepositive values represent the concentration reduction and thenegative values represent the concentration increase.
In Fig. 5, S1 shows that when there are no further controls onsources, the PM10 and NO2 hot spots are mainly distributed inFoshan, Zhongshan, southern Guangzhou, western Dongguan and
Shenzhen. The extent of the effectiveness of emission reductionsvaries spatially, due to the controlled source distribution and thenon-linear responses of the model predictions toward complicatedatmospheric physical and chemical processes. Long-term controlmeasures contribute a constant reduction of 10 mg m�3 to NO2 andSO2 levels across the PRD. After implementing the long-termstrategy, NO2 level (S1) is >25 mg m�3 over a wide area of theregion, and >50 mg m�3 in some high concentration areas asa period average. Dust control measures contributes a constantreduction of >2.5 mg m�3 to PM10 level in PRD compared to a 40e60 mg m�3 period average concentration before the Games. Thelargest reduction of PM10 concentration happens in west Guangz-hou, near the GuangzhoueFoshan boundary. Short-term andstrengthened measures can further reduce 5e10 mg m�3 NO2 andSO2 in a smaller region, mainly in west PRD.
For O3, concentrations are found to increase in most parts of theregion, implying that the effects of emission abatement policies onO3 are counterproductive, which may due to the less nitration of O3by NOx. This result suggests that ozone alleviation should be basedon scientific research to determine the appropriate control ratio ofNOx and VOC in the region.
Fig. 6 compares the daily average concentrations for observationwith BAU scenario in Guangzhou. As differences between simula-tion and observation always exist, a simple method was introducedhere to adjust the simulation using the observation to show theeffect of certain object scenario in a more reasonable way: Ratios ofdaily concentrations between observation and simulation of base-line scenario is calculated firstly, which will act as coefficients to bemultiplied by the simulation of certain object scenario. And thefinal results will be used for analyses. This method was applied forthe BAU scenario in Fig. 6 (note that the samemethodwas also usedin Fig. 7). Fig. 6 indicates that if no control was taken (BAU), thenon-attainment days will be 13 for NO2 and 1 for SO2 instead of0 during the Asian Games under the current NAAQS. This resultindicated a significant success for the proposed air pollutionabatement policy for the Asian Games guarantee.

Fig. 3. Comparison of model simulations for daily SO2, NOx, PM10, PM2.5, daily maximum 8-h average O3, and hourly O3 (mg m�3) against observations.
H. Liu et al. / Atmospheric Environment 76 (2013) 81e93 87
The reductions of 19 days average NO2, SO2, and PM10 concen-tration in Guangzhou are 58.9 mg m�3 (51.3%), 66.3 mg m�3 (66.8%),and 21.2 mgm�3 (21.4%) respectively compared to BAU scenario. Theair quality improvements are also comparable to the observation.
PM10 concentration has been reduced by 25.0% (from 0.104 mgm�3
in 2007 to 0.078mgm�3 in 2010) by period average. Our simulationalso found a 21.4% reduction by implementing long-term and short-term strategies. For the other criteria pollutants, the relative

Fig. 4. Day-to-day variations in SO2, NOx, and PM10 at the 5th Middle School site in November 2010. Observations are indicated in black. The MM5eSTEM model results using theAsian Games emissions are indicated in blue. (For interpretation of the references to colour in this figure legend, the reader is referred to the web version of this article.)
Table 6Statistical results on model bias for NO2, SO2, PM10, PM2.5 and O3 simulation.
Pollutants Stations OBS SIM MNB MNE FAC2 NMSE
NO2 5th Middle School 65.5 57.6 �8% 24% 100% 0.11786th Middle School 64.4 28.6 �51% 54% 37% 1.025Panyu 52.5 40.4 �18% 34% 84% 0.257Huadu 33.0 30.7 4% 39% 74% 0.259
SO2 5th Middle School 20.0 21.4 29% 56% 84% 0.32386th Middle School 24.0 16.9 �15% 62% 53% 0.831Panyu 39.7 21.4 �17% 63% 37% 1.081Huadu 29.0 15.2 �43% 44% 53% 0.604
PM10 5th Middle School 88.1 66.4 �20% 28% 95% 0.17486th Middle School 91.6 40.5 �53% 53% 37% 0.84Panyu 91.7 37.5 �56% 56% 42% 1.061Huadu 87.3 44.1 �45% 48% 53% 0.677
PM2.5 Wanqingsha 65.1 29.2 �42% 43% 53% 1.296Tianhu 57.0 22.8 �52% 58% 37% 1.533
O3 Luhu 129.2 116.0 �6% 21% 95% 0.089Wanqingsha 168.5 107.7 �31% 32% 79% 0.358Tianhu 140.1 124.7 �7% 21% 100% 0.059
H. Liu et al. / Atmospheric Environment 76 (2013) 81e9388
reductions of observation from 2007 to 2010 of SO2 and NO2
concentration were 50.0% and 37.1% respectively, while the simu-lated reductions are 66.8%, and 51.3%. Thus, despite the rapideconomic growth, air quality has actually been improved since the2006, which is a strong evidence for the effects of aggressiveregulatory efforts.
Analysis of air quality using the MM5eSTEMmodel suggest thatthe long-term control measures since 2006 account for 86%, 73%and 22% of SO2, NO2 and PM10 reduction for the main Asian GamePeriod (12e27 November), respectively.
Similarly, during the period of the 2008 Olympic SummerGames in Beijing, manymitigationmeasures were taken to improvethe air quality. Control measures during the Olympic Gamessignificantly reduced the larger particles (PM10), SO2 and NO2 (33%,32%, and 51%) which is higher than the short-term effects forGuangzhou. Both Beijing and Guangzhou cases found that muchsmaller particles (PM2.5) were not reduced effectively. This indi-cates that long-range transport of atmospheric particles is difficultto control and the established mitigation area may be not bigenough to reduce the fine particles efficiently as well (Okuda et al.,2011; Schleicher et al., 2011, 2012).
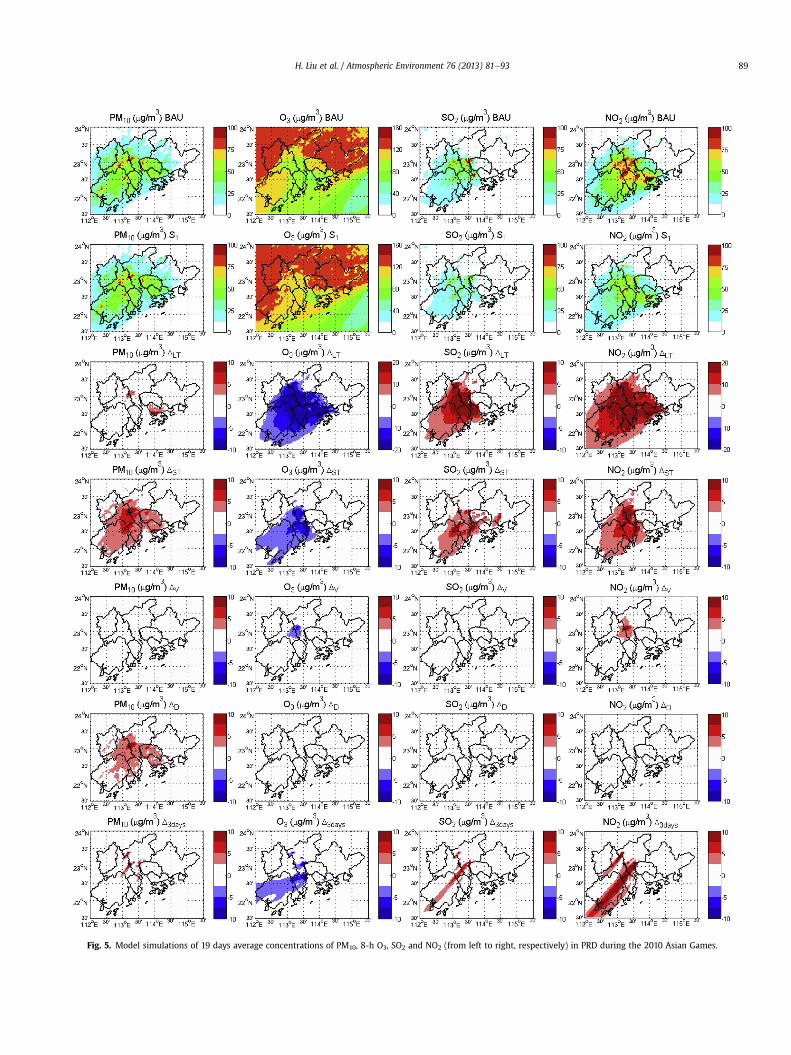
Fig. 5. Model simulations of 19 days average concentrations of PM10, 8-h O3, SO2 and NO2 (from left to right, respectively) in PRD during the 2010 Asian Games.
H. Liu et al. / Atmospheric Environment 76 (2013) 81e93 89

Fig. 6. Comparison of controlled and non-controlled scenarios of daily average concentration of NO2, SO2, PM10 and one hour O3 in Guangzhou for November 2010.
H. Liu et al. / Atmospheric Environment 76 (2013) 81e9390
4. Challenges from the new NAAQS
Fig. 7 compares day-by-day concentrations for differentscenarios with the new proposed NAAQS. The attainment rates are100% for SO2, PM10 daily concentration and O3 eight hour limitsunder the new NAAQS (the SO2 and PM10 daily concentrations staythe same with the old standard NAAQS). There are challenges toconstantly meet the NO2 and PM2.5 standards.
It should be noted, the new NAAQS proposes stricter annualPM10 standard of 70 mg m�3. Although daily PM10 concentrationmeets the NAAQS (150 mg m�3), the period average concentration is70e130 mg m�3 for different scenarios, which is higher than annual
standard. It should be pointed out that the period averageconcentration in this study does not directly reflect the annualaverage. As reported in Pearl River Delta Regional Air QualityMonitoring Reports 2006, 2007, 2008, 2009 and 2010 (Pearl RiverDelta Regional Air Quality Monitoring Network, 2007e2011), thePM10 concentrations in November can vary in a range of 91.0%e139.6% compared with the annual concentration, depending onthe location of sites and the meteorology condition in November.The average ratio of November concentration to annualconcentration in 2006e2010 is 1.154. Thus, even taking themonthly variation into consideration, the annual PM10 concentra-tion estimated is about 61e112 mg m�3.

Fig. 7. New NAAQS limits and STEM model simulations of daily average NO2, PM2.5 and eight hour ozone concentrations under five scenarios in Guangzhou for November 2010.
H. Liu et al. / Atmospheric Environment 76 (2013) 81e93 91
To further analyze the accessibility of the new NAAQS, wecompare emission reduction (v), average ambient concentrationreduction (D) and non-attainment rates under new NAAQS aftereach of the abatement measures (Fig. 8). The percentages ofemission and concentration reductions are compared with scenario
after the Asian Games (S1). The abatement plans reference themeasures during the Asian Games, including vehicle emissioncontrol in Guangzhou (v), dust control (D), point sources control(ST) and strengthened point sources control (Str). The detail ofthese measures could be found in Section 2.1.

31.6%
D, 0%
D+ST, 0%
D+ST+Str
V, 31.6%
V+D, 26.3%
V+D+ST, 26.3%
V+D+ST+Str
0.0%
5.0%
10.0%
15.0%
20.0%
25.0%
0.0% 5.0% 10.0% 15.0% 20.0% 25.0%
Con
cent
rati
on R
educ
tion
Emission Reduction
PM10 PM2.5 non-attainment rate
47.4%
ST
ST+Str
V, 42.1%
V+ST, 10.5%
V+ST+Str
0.0%
5.0%
10.0%
15.0%
20.0%
25.0%
30.0%
35.0%
40.0%
45.0%
0.0% 10.0% 20.0% 30.0%
Con
cent
rati
on R
educ
tion
Emission Reduction
SO2 NO2 non-attainment rate
Fig. 8. Emission reduction (v) versus average ambient concentration reduction (6) for several emission abatement strategies. The labels indicate the measures and non-attainmentrate (based on 19 days simulation) after these measurements were taken. The meaning of V, D, ST, Str (abbreviation for three days strengthen control measures) are defined inTable 2.
H. Liu et al. / Atmospheric Environment 76 (2013) 81e9392
Based on the emission inventory after the Asian Games, the non-attainment rates for NO2 and PM2.5 during the period are 47.4% and31.6% and there is no non-attainment day for SO2 and PM10. Withemission reductions similar to the Asian Games (10.1% and 14.7% ofNOx and PM2.5 before the Asian Games), the NO2 and PM2.5concentrations can be reduced by 22.5% and 8.2%. The non-attainment rates of daily NO2 and PM2.5 ambient concentrationcan be reduced to 10.5% and 26.3%. The more stringent air qualitymanagement plans are also evaluated, e.g. reduce point sources’ by30% from their levels in October. Then the concentration reductionsof NO2 and PM2.5 could reach as high as 40.7% and 10.2% withemissions reduced by 14.8% and 17.5%. For SO2 and PM10, the AsianGames measure can reduce concentrations by 21.9% and 17.0%. Thefurther abatements like for the Opening Ceremony will reduce21.5% SO2 and 23.4% PM10 emissions and contribute 26.1% and20.6% concentration reductions.
Among these abatements, dust control shows the greatestcontribution to PM10 and PM2.5 improvements in Guangzhou. ThePM10 and PM2.5 emission reduction from dust abatement measuresis about 34.1% and 10.6% respectively and the concentrationreduction reaches 11.8% and 5.0% for the period average. Thecontributions to the NO2 concentration variances are mainly frompoint sources controls. In this study, the vehicle restrictionmeasures are only applied to vehicles in Guangzhou. As a result, theemission reduction percentages compared to total emission in PRDis small, which does not reflect the total effect from vehicle emis-sion control.
5. Concluding remarks
The total reduction of daily SO2, NOx, PM10, PM2.5 and VOCemissions in PRD by all controls, including long-term, short-termand strengthened measures, were estimated to be 927.0 t d�1
(44.6%), 1831.2 t d�1 (45.0%), 673.6 t d�1 (28.7%), 335.5 t d�1 (28.2%)and 1996.2 t d�1 (40.9%) compared to non-control BAU scenario.The dust abatement during the Asian Games contributed 73.8% ofPM10 reduction. Controlling fugitive dust could be executable asa routine policy without high cost. The long-term abatements aredominant for SO2, NOx and VOC, contributing 71.7%, 84.5% and81.7% of total reduction respectively. The odd/even traffic restric-tions and yellow-label vehicle restrictions in Guangzhou totallyreduced mobile sources NOx, CO, PM and VOC by 30.3%, 44.5%,24.8% and 35.6% respectively or PRD total NOx, CO and VOC (S1) by3.8%, 9.1% and 4.0%.
The MM5eSTEM model was validated by comparing the simu-lation with observation from seven monitoring stations. Comparedto non-control scenario, the Asian Games abatement plan hasa successful air quality improvement. The reduction of 19 daysaverage NO2, SO2, and PM10 concentration in Guangzhou are58.9 mg m�3 (51.3%), 66.3 mg m�3 (66.8%), and 21.2 mg m�3 (21.4%)respectively.
Compared to the new NAAQS, the challenges are mainly fromdaily NO2 and PM2.5 concentrations and annual PM10 concentra-tions. Although daily PM10 concentration can meet the NAAQS(150 mg m�3), the period average concentration is 70e130 mg m�3
for different scenarios, which is higher than annual standard(70 mg m�3). With emission reductions similar to the Asian Games,the non-attainment rates of daily NO2 and PM2.5 ambient concen-tration can be reduced to 10.5% and 26.3%. After taking the mostaggressive measures, similar to the measures for the OpeningCeremony, the period average PM10 concentration can be probablyreduced to the level of the new NAAQS-PM10 annual standard.
Acknowledgments
This research was supported by the National Natural ScienceFoundation of China (NSFC)Guangdongkeyproject (U0833001) andproject (20921140409), and Guangzhou Environmental ProtectionBureau. The authors thank Professor Junyu Zheng of South ChinaUniversity of Technology for providing PRD emission inventory. Wealso thank Guangzhou Environmental Monitoring Center forproviding meteorology and ambient air quality observation data.Huan Liu is supported by the NSFC (71101078), the special fund ofState Key Joint Laboratory of Environment Simulation and PollutionControl. The work conducted by Sun Yat-sen University was fundedby the Fundamental Research Funds for the Central Universities andwas also partly supported by the high-performance grid computingplatform of Sun Yat-sen University. The contents of this paper aresolely the responsibility of the authors and do not necessarilyrepresent the official views of the sponsors.
References
Cai, H., Xie, S., 2011. Traffic-related air pollution modeling during the 2008 BeijingOlympic Games: the effects of an odd-even day traffic restriction scheme.Science of the Total Environment 409 (10), 1935e1948.
Carter, W., 8 May 2000. Documentation of the SAPRC-99 Chemical Mechanism forVOC Reactivity Assessment. c.n. Final Report to California Air Resources BoardUniversity of California at Riverside.

H. Liu et al. / Atmospheric Environment 76 (2013) 81e93 93
Chan, C.K., Yao, X., 2008. Air pollution in mega cities in China. Atmospheric Envi-ronment 42 (1), 1e42.
Chen, H., Wang, Z., Wu, Q., Wang, W., 2010. Source analysis of Guangzhou airpollutants by numerical simulation in the Asian Games Period. Acta ScientiaeCircumstantiae 30 (11), 2145e2153 (in Chinese).
Cheng, Y.F., Wiedensohler, A., Eichlerb, H., Sua, H., Gnauk, T., Brüggemann, E.,Herrmann, H., Heintzenberg, J., Slaninaa, J., Tuch, T., Hua, M., Zhang, Y.H., 2008.Aerosol optical properties and related chemical apportionment at Xinken inPearl River Delta of China. Atmospheric Environment 42 (25), 6351e6372.
China Electricity Council, 2010. The Annual Report of China Power Industry (2010).Beijing. http://tj.cec.org.cn/tongji/niandushuju/2011-02-23/44236.html(accessed 24.01.10.).
Dong, T., 2006. Brief Introduction of Guangzhou’s SO2 Reduction. GuangzhouEnvironmental Monitoring Center, Guangzhou.
Dufour, G., Eremenko, M., Orphal, J., Flaud, J., 2010. IASI observations of seasonal andday-to-day variations of tropospheric ozone over three highly populated areasof China: Beijing, Shanghai, and Hong Kong. Atmospheric Chemistry andPhysics 10 (8), 3787e3801.
Guangzhou Environment Protection Bureau, 2011. Air quality attainment ratereached 100% during the Guangzhou Asian Games. Guangzhou EnvironmentalScience 26 (2), 21 (in Chinese).
Guangzhou Statistic Bureau, 2011. 2010 Guangzhou Statistic Yearbook. Guangzhou.http://www.gzstats.gov.cn/tjgb/qstjgb/201104/t20110408_24921.htm (accessed24.01.12.).
Guangzhou Transportation Commission, 2010. The Government Plan to MitigateTraffic Congestion in Guangzhou Urban Area. Guangzhou.
Guo, H., Jiang, F., Cheng, H., Simpson, I., Wang, X., Ding, A., Wang, T., Saunders, S.,Wang, T., Lam, S., Blake, D., Zhang, Y., 2009. Concurrent observations of airpollutants at two sites in the Pearl River Delta and the implication of regionaltransport. Atmospheric Chemistry and Physics 9 (19), 7343e7360.
Huang, H., Ho, K., Lee, S., Tsang, P., Ho, S., Zou, C., Zou, S., Cao, J., Xu, H., 2012.Characteristics of carbonaceous aerosol in PM2.5: Pearl Delta River region,China. Atmospheric Research 104-105, 227e236.
Huo, H., Yao, Z., Zhang, Y., Shen, X., Zhang, Q., Ding, Y., He, K., 2012. On-boardmeasurements of emissions from light-duty gasoline vehicles in three mega-cities of China. Atmospheric Environment 49, 371e377.
Liu, H., He, K., Wang, Q., Huo, H., Lents, J., Davis, N., Nikkila, N., Chen, C., Osses, M.,He, C., 2007. Comparison of vehicle activity and emission inventory betweenBeijing and Shanghai. Journal of the Air & Waste Management Association 57(10), 1172e1177.
Liu, H., He, K., Barth, M., 2011. Traffic and emission simulation in China based onstatistical methodology. Atmospheric Environment 45 (5), 1154e1161.
Louie, P., Watson, J., Chow, J., Chen, A., Sin, D., Lau, A., 2005. Seasonal characteristicsand regional transport of PM2.5 in Hong Kong. Atmospheric Environment 39 (9),1695e1710.
Madronich, S., Flocke, S., 1999. The Role of Solar Radiation in Atmospheric Chem-istry, Handbook of Environmental Chemistry. Springer, Heidelberg.
Okuda, T., Matsuura, S., Yamaguchi, D., Umemura, T., Hanada, E., Orihara, H.,Tanaka, S., He, K., Ma, Y., Cheng, Y., Liang, L., 2011. The impact of the pollutioncontrol measures for the 2008 Beijing Olympic Games on the chemicalcomposition of aerosols. Atmospheric Environment 45 (16), 2789e2794.
Pearl River Delta Regional Air Quality Monitoring Network, 2007-2011. Pearl RiverDelta Regional Air Quality Monitoring Network: a Report of Monitoring Resultsin 2006e2009. The Environmental Protection Department of the Hong Kong
Special Administrative Region and Guangdong Provincial EnvironmentalMonitoring Centre.
Schleicher, N., Norra, S., Dietze, V., Yu, Y., Fricker, M., Kaminski, U., Chen, Y., Cen, K.,2011. The effect of mitigation measures on size distributed mass concentrationsof atmospheric particles and black carbon concentrations during the OlympicSummer Games 2008 in Beijing. Science of the Total Environment 412-413,185e193.
Schleicher, N., Norra, S., Chen, Y., Chai, F., Wang, S., 2012. Efficiency of mitigationmeasures to reduce particulate air pollution e a case study during the OlympicSummer Games 2008 in Beijing, China. Science of the Total Environment 427-428, 146e158.
So, K.L., Guo, H., Li, Y., 2007. Long-term variation of PM2.5 levels and composition atrural, urban, and roadside sites in Hong Kong: increasing impact of regional airpollution. Atmospheric Environment 41 (40), 9427e9434.
Streets, D.G., Fu, J., et al., 2007. Air quality during the 2008 Beijing Olympic Games.Atmospheric Environment 41 (3), 480e492.
Wang, T., Xie, S., 2009. Assessment of traffic-related air pollution in the urbanstreets before and during the 2008 Beijing Olympic Games traffic controlperiod. Atmospheric Environment 43 (35), 5682e5690.
Wang, S., Zeng, Y., 2011. Application of the ambient air quality monitoring and EarlyWarning system of Guangzhou in the Asian Games. Guangzhou EnvironmentalScience 26 (3), 1e3 (in Chinese).
Wang, X., Carmichael, G., Chen, D., Tang, Y., Wang, T., 2005. Impacts of differentemission sources on air quality during March 2001 in the Pearl River Delta(PRD) region. Atmospheric Environment 39 (29), 5227e5241.
Wang, J., Wang, C., Lai, C., Chang, C., Zhang, Y., Liu, S., Shao, M., 2008. Character-ization of ozone precursors in the Pearl River Delta by time series observation ofnon-methane hydrocarbons. Atmospheric Environment 42 (25), 6223.
Wang, S., Zhao, M., Xing, J., Wu, Y., Zhou, Y., Lei, Y., He, K., Fu, L., Hao, J., 2010.Quantifying the air pollutants emission reduction during the 2008 OlympicGames in Beijing. Environmental Science & Technology 44 (7), 2490e2496.
Wu, Q., Wang, Z., Chen, H., Zhou, W., Wenig, M., 2011. An evaluation of air qualitymodeling over the Pearl River Delta during November 2006. Meteorology andAtmospheric Physics 116 (3), 113e132.
Xiao, F., Brajer, V., Mead, R., 2006. Blowing in the wind: the impact of China’s PearlRiver Delta on Hong Kong’s air quality. Science of the Total Environment 367(1), 96e111.
Yao, Z., Zhang, Y., Shen, X., Wang, X., Wu, Y., He, K., Impacts of temporary trafficcontrol measures on vehicular emissions during the Asian Games in Guangz-hou, China. Journal of the Air & Waste Management Association, in press.
Zhang, J., Wang, T., Chameides, W., Cardelino, C., Kwok, J., Blake, D., Ding, A., So, K.,2007. Ozone production and hydrocarbon reactivity in Hong Kong, SouthernChina. Atmospheric Chemistry and Physics 7 (2), 557e573.
Zheng, J., Zhang, L., Che, W., Zheng, Z., Yin, S., 2009. A highly resolved temporaland spatial air pollutant emission inventory for the Pearl River Delta region,China and its uncertainty assessment. Atmospheric Environment 43 (32),5112e5122.
Zheng, J., Zhong, L., Wang, T., Louie, P., Li, Z., 2010. Ground-level ozone in the PearlRiver Delta region: analysis of data from a recently established regional airquality monitoring network. Atmospheric Environment 44 (6), 814e823.
Zhou, Y., Wu, Y., Yang, L., Fu, L., He, K., Wang, S., Hao, J., Chen, J., Li, C., 2010. Theimpact of transportation control measures on emission reductions during the2008 Olympic Games in Beijing, China. Atmospheric Environment 44 (3),285e293.