Embed Size (px)
Citation preview

First published in September 1999
Emission EstimationTechnique Manual
for
Iron and SteelProduction

Iron and Steel i
EMISSION ESTIMATION TECHNIQUES
FOR
IRON & STEEL PRODUCTION
TABLE OF CONTENTS
1.0 INTRODUCTION 1
2.0 PROCESS DESCRIPTION 2
3.0 EMISSION SOURCES 4
3.1 Emissions to Air 4
3.2 Emissions to Water 4
3.3 Emissions to Land 4
4.0 DO I NEED TO REPORT? 5
4.1 Category 2a and 2b Substances 5
4.2 Category 1 Substances 6
4.3 Category 1a Substances 7
4.4 Category 3 Substances 7
5.0 EMISSION ESTIMATION TECHNIQUES 8
5.1 Use of Emission Factors 9
5.2 Mass Balance Techniques 9
5.3 Modelling 10
5.4 Applying EETs 10
6.0 MONITORING 16
7.0 MASS BALANCE 18
7.1 Overall Facility Mass Balance 18
7.2 Individual Unit Process Mass Balance 21
8.0 AIR EMISSIONS 22
8.1 Sources 22
8.2 Particulate Speciation 22
8.3 Estimating VOC Emissions 23
8.4 Coke Making 238.4.1 Sources of Emissions 238.4.2 Emission Estimation Techniques 24
8.5 Sinter and Pellet Making 268.5.1 Sources of Emissions 268.5.2 Emission Estimation Techniques 26
8.6 Iron Making 278.6.1 Sources of Emissions 27

Iron and Steel ii
8.6.2 Emission Estimation Techniques 28
8.7 Steel Making 288.7.1 Sources of Emissions 288.7.2 Emission Estimation Techniques 29
8.8 Steel Casting and Steel Rolling Mill Operations 308.8.1 Sources of Emissions 308.8.2 Emission Estimation Techniques 30
8.9 Lime Kilns 318.9.1 Sources of Emissions 318.9.2 Emission Estimation Techniques 31
8.10 Power Generation 318.10.1 Sources of Emissions 318.10.2 Emission Estimation Techniques 32
8.11 Service Shops, Oxygen Plant and Miscellaneous Emissions. 328.11.1 Sources of Emissions 328.11.2 Emission Estimation Techniques 32
9.0 EMISSIONS TO WATER 34
10.0 EMISSIONS TO LAND 37
10.1 Groundwater Monitoring 37
10.2 Spills 38
10.3 On-Site Disposal 39
11.0 GLOSSARY 40
12.0 REFERENCES 42

Iron and Steel iii
EMISSION ESTIMATION TECHNIQUES
FOR
IRON & STEEL PRODUCTION
LIST OF FIGURES, TABLES AND EXAMPLES
Figure 1 - Potential Emission Sources from Iron & Steel Making Operations .... 32 - Mass Balance Process .................................................................................... 19
Table 1 - Category 2a and 2b Substances from Iron and Steel Production Likely toTrigger NPI Reporting Thresholds 5
2 - Category 1 Substances from Iron and Steel Production Likely to TriggerNPI Reporting Thresholds 6
3a - Emission Estimation Techniques for NPI-Listed Substances PotentiallyAssociated with Iron & Steel Production 12
3b -Emission Estimation Techniques for NPI-Listed Substances PotentiallyAssociated with Iron & Steel Production 14
4 - Emission Factors for Coke Ovens Battery Operations 25
5 - Emission Factors for Ore Storage, Preparation and Handling 27
6 - Emission Factors for Sinter and Pellet Plant Operations 27
7 - Emission Factors for Blast Furnace Iron Making Operations 28
8 - Emission Factors for Basic Oxygen Steel Making Operations 29
9 - Emission Factors for EAF Steel Making Operations 29
10 - Emission Factors for Steel Teeming and Casting Operations 30
11 - Emission Factors for Dust Generation Associated with VehicleMovements 33
12 - Measurement Data 36
Example 1 - Do You Trip the Reporting Threshold for Category 1 Substances? . 6
2 - Stack Sampling: Concentration and Flow Rate Measured at the SameConditions .................................................................................................... 17
3 - Stack Sampling: Concentration and Flow Rate Measured at DifferentConditions .................................................................................................... 17
4 - Using Mass Balance.................................................................................... 19
5 - Estimating Emissions from Stream with Constant Daily Flow Rates 35
6 - Estimating Emissions from Streams with Variable Flow Rates andComposition................................................................................................. 35
1.0 Introduction
The purpose of all Emission Estimation Technique (EET) Manuals in this series is to assistAustralian manufacturing, industrial, and service facilities to report emissions of listedsubstances to the National Pollutant Inventory (NPI). This Manual describes theprocedures and recommended approaches for estimating emissions from facilitiesengaged in basic iron and steel production.
This Manual does not cover the manufacture of steel products from raw steel. In addition,this Manual does not cover alternative iron making technologies, such as direct orereduction.
EET MANUAL : Iron & Steel Production
HANDBOOK : Basic Iron & Steel Manufacturing
ANZSIC CODE : 2711
PPK Environment & Infrastructure and Advitech Pty Ltd prepared this Manual on behalfof the NSW Environment Protection Authority. Environment Australia provided fundingfor the project.
This Manual has been developed through a process of national consultation involvingState and Territory environmental authorities. Particular thanks are due to BHP Steel fortheir comments, advice and information.
Iron and Steel 1

2.0 Process Description
Iron & steel production consists of the following main activities:
A: Iron Production
• Cokemaking;• Sinter or pellet making;• Blast furnace iron production; and• Casting and storage.
B: Steel Production
• Raw material handling;• Electric arc or basic oxygen furnace steel making;• Refining and alloying; and• Continuous casting and storage
Figure 1 identifies potential sources of emissions to the environment as a result of iron &steel production.
Iron and Steel 2

Ste e lC as t in g
Pr im ar yRe h e at
Se co n d ar yRe h e at
Pr im ar yRo llin g
Se co n d ar yRo llin g
s lag
s teel
blooms , billets& s labs
pr imary ro lled produc t
hot bedproduc ts
b looms , bille ts& s labs f or ex por t
emis s ion
w as te liquor
s tac k emis s ion
s tac k emis s ion
w as teliquor
emis s ion
emis s ion
w as teliquor
s
ls
Fe rro us Foun drie sM a nua l a ndIron & S te e lM a nufa cturingM a nua l
Ba sic Iron a nd S te e lM a n ufa cturing M a n ua l
Iron and Steel 3
By-p r o d u ctPlan t
Sin te r in g /Pe lle tis in g
C o o lin g /C r u s h in g
Or eBle n d in g
C o k eOve n s
C o alBle n d in g
Blas tFu r n ace
Ste e lM ak in g
L im e Kiln
Oxyg e nPlan t
Se r viceSh o p s
Po w e rGe n e r atio n
ore
c oal
ores inter /pellets
c oal
emis s ion
emis s ion emis s ion s tac k
COG
emis s ion s tac k emis s ion
emis s ion
c oke
s inter /pellets
emis s ion s tac k
lime
iron
w as te liquor
pig iron
emis s ion s tac k
s lag
air
ox y gen
s tac k emis s ion
mis c .f lux es
s c rap
COG
ef f luent
COG
COG
emis s ion
lime
COG
BFG
s tac k emis s ion
as h
s tac k
s olv ents
emis s ion
limeCOG
M in in gM a nu a l
tar ,BTX,naphthaleneammonium s ulf ate Fue l a nd O rga n icL iqu id
S tora g e & Am m oniumS u lph a te M a nuf. M a nua
L im e & Dolo m iteM a nufa cturin g M a nua l
Com bu stion InBoile rs M a n ua l
lump ore
mis c . f lux es
Note: COG ref ers to Coke Ov ens GasBFG ref ers to Blas t Furnac e Gas
Figure 1 - Potential Emission Sources from Iron & Steel Making Operations

3.0 Emission Sources
3.1 Emissions to Air
Air emissions may be categorised as either fugitive emissions or point source emissions.
Fugitive emissions are those not released through a flare, vent or stack. Examples offugitive emissions include volatilisation and vapour emission from open vessels,equipment leaks from valves and flanges, losses from oven and furnace doors and releasesfrom materials handling (eg. stockpiling).
Point source emissions include flares, vents and stacks.
3.2 Emissions to Water
Emissions of substances to water include discharges to:
• Surface waters (eg. lakes, rivers, dams, and estuaries);• Coastal or marine waters; and• Stormwater.
In most cases, the most accurate method of determining emissions to the environment viawastewater is to use direct measurement techniques. However, you may use other EETsfor the purposes of reporting to the NPI.
3.3 Emissions to Land
Emissions of substances to land include solid wastes, slurries, sediments, spills and leaksfrom processing activities and the storage and distribution of raw materials and products.There may also be emissions from the use of chemicals to control various elements of theenvironment (eg. dust) where these emissions contain listed substances. The discharge oflisted substances to a sewer, landfill or tailings dam does not require you to report to theNPI, but emissions from these or other sources are reportable (See Section Three of TheNPI Guide).
It is the responsibility of operators to analyse their own processes and determine which(if any) thresholds of substances on the NPI reporting list are exceeded.
Iron and Steel 4

4.0 Do I Need to Report? The NPI Guide, which accompanies this Manual, provides guidance to help you determine:
• whether you are required to report under the NPI; and• which substances are to be reported.
Section Two of The NPI Guide at the front of this Handbook, details the necessary stepstaken to assess if your facility triggers any of the thresholds for the substances listed underthe NPI. A series of worksheets is provided in The NPI Guide to assist with this.
Sections 4.1 to 4.4 below provide additional guidance on the NPI substances for which ironand steel production facilities will be required to report. It should be noted that thisinformation is provided for guidance only. It is the responsibility of individual facilities todetermine whether or not they are required to report and which substances are required tobe reported. Please check the current edition of the NPI guide for reporting thresholds.
4.1 Category 2a and 2b Substances According to the 1998 edition of the NPI Guide, the reporting threshold for Category 2asubstances would be exceeded if 400 or more tonnes of fuel or waste is burned in areporting period. Or, 1 tonne or more of fuel or waste is burned in any hour of a period.To trigger the reporting thresholds for Category 2b substances, 2000 tonnes or more of fuelmust be burned, 60 000 megawatt hours or more of energy must be consumed, or thefacility must have a maximum power consumption rated at 20 megawatts or more.
In the iron and steel industry, reporting of Category 2a and 2b substances is likely to betriggered by coking and iron making, as well as combustion processes. From ourdiscussions with BHP Steel, we expect that all iron and steel production facilities will berequired to report on emissions of Category 2a and 2b substances. Table 1 lists thesesubstances.
Table 1 - Category 2a and 2b Substances from Iron and Steel Production Likely to Trigger NPI Reporting Thresholds
Substances
Arsenic & compounds Lead & compounds Beryllium & compounds Magnesium oxide fume Cadmium & compounds Mercury & compounds Carbon monoxide (CO); Nickel & compounds Chromium (III) compounds Oxides of nitrogen (NOx) Chromium (VI) compounds PM10
Copper & compounds Polychlorinated dioxins and furans Fluoride compounds Polycyclic Aromatic Hydrocarbons (PAHs) Hydrochloric acid Sulfur dioxide (SO2) Total Volatile Organic Compounds (VOCs)
Source: NSW Environment Protection Authority
Iron and Steel 5

4.2 Category 1 Substances According to the 1998 edition of the NPI Guide, the reporting threshold for Category 1substances is exceeded if the activities of a facility involve the use (eg. handling) of 10tonnes or more of the substance in a reporting period. It is expected that iron and steelproduction facilities will trigger reporting thresholds for the following Category 1Substances listed in Table 2 (note that the Category 2a and 2b Substances listed in Table 1which are also Category 1 substances are not included in the Table 2):
Table 2 - Category 1 Substances from Iron and Steel Production Likelyto Trigger NPI Reporting Thresholds
Substances
Ammonia Manganese & compounds Antimony & compounds Methyl ethyl ketone Benzene Phenol Biphenyl(1,1-biphenyl) Phosphoric acid Boron & compounds Selenium & compounds Cobalt & compounds Sulfuric acid Cumene Toluene Cyanide (inorganic compounds) Xylenes Ethylene glycol Zinc & compounds Hydrogen sulfide
Source: NSW Environment Protection Authority
The total amount of each Category 1 substance ‘used’ must be estimated in order todetermine whether the threshold is exceeded. For all NPI substances, consideration ofwhether or not reporting is triggered depends upon the concentration of each substance inthe feedstock materials.
Example 1 - Do You Trip the Reporting Threshold for Category 1 Substances?
An integrated iron and steel facility processes 2 000 000 tonnes of coal, iron ore andlimestone per annum. What mean concentration of a Category 1 substance (either anelement or compound) in the feedstock materials would trip the current reportingthreshold (10 tonnes per annum) and therefore require reporting?
mean concentration of substance = quantity of substance/quantity processed = 10 (tonnes/year)/2 * 106 (tonnes/year) = 5 * 10-6
= 5 ppm
Therefore, reporting would be required if the mean concentration of the substance in thefeedstock material is equal to or exceeds 5 ppm.
Iron and Steel 6

The usagea of each of the substances listed as Category 1 and 1a under the NPI must beestimated to determine whether the 10 tonnes (or 25 tonnes for VOCs) reporting thresholdis exceeded. If the threshold is exceeded, emissions of these Category 1 and 1a substancesmust be reported for all operations/processes relating to the facility, even if the actualemissions of the substances are very low or zero.aUsage is defined as meaning the handling, manufacture, import, processing, coincidental production orother uses of the substances.
4.3 Category 1a Substances
The only Category 1a substance associated with iron and steel production is VolatileOrganic Compounds (VOCs). The most appropriate method of calculating whether thereporting threshold for Total VOCs is exceeded for a facility is to sum the consumptionand/or production streams containing VOCs.
The NPI threshold will be exceeded if the throughput of total VOCs exceeds25 tonnes/year.
4.4 Category 3 Substances
Category 3 substances are reportable if emissions to water (excluding groundwater)exceed the following scheduled amounts:
• 15 tonnes per year of total nitrogen; and• 3 tonnes per year of total phosphorus.
Iron and Steel 7

5.0 Emission Estimation Techniques
Estimates of emissions of NPI-listed substances to air, water and land should be reportedfor each substance that triggers a threshold. The reporting list and detailed information onthresholds are contained in The NPI Guide at the front of this Handbook.
In general, there are four types of emission estimation techniques (EETs) that may be usedto estimate emissions from your facility. Each of these methods is discussed briefly inSections 5.1 to 5.3 of this Manual. The four types described in the NPI Guide are:
• sampling or direct measurement;• mass balance;• fuel analysis, or other engineering calculations; and• emission factors.
Select the EET (or mix of EETs) that is most appropriate for your purposes. For example,you might choose to use a mass balance to best estimate fugitive losses from pumps andvents, direct measurement for stack and pipe emissions, and emission factors whenestimating losses from storage tanks and stockpiles.
If you estimate your emission by using any of these EETs, your data will be displayed onthe NPI database as being of ‘acceptable reliability’. Similarly, if your relevantenvironmental authority has approved the use of emission estimation techniques that arenot outlined in this Handbook, your data will also be displayed as being of ‘acceptablereliability’.
This Manual seeks to provide the most effective emission estimation techniques for theNPI substances relevant to this industry. However, the absence of an EET for a substancein this Manual does not necessarily imply that an emission should not reported to the NPI.The obligation to report on all relevant emissions remains if reporting thresholds havebeen exceeded.
You are able to use emission estimation techniques that are not outlined in thisdocument. You must, however, seek the consent of your relevant environmentalauthority. For example, if your company has developed site-specific emission factors,you may use these if approved by your relevant environmental authority.
In general, direct measurement is the most accurate method for characterising emissionsand, where available, such data should be used in preference to other EETs presented inthis Manual. However, additional direct measurement is not required under the NPIMeasure. Direct monitoring may be undertaken as an element of other EETs.
You should note that the EETs presented in this Manual relate principally to averageprocess emissions. Emissions resulting from non-routine events are rarely discussed in theliterature, and there is a general lack of EETs for such events. However, it is important torecognise that emissions resulting from significant operating excursions and/or accidentalsituations (eg. spills) will also need to be estimated. Emissions to land, air and water fromspills must be estimated and added to process emissions when calculating total emissions
Iron and Steel 8
for reporting purposes. The emission resulting from a spill is the net emission, ie. thequantity of the NPI reportable substance spilled, less the quantity recovered or consumedduring clean up operations.
In developing an inventory of emissions, it is important to utilise the best informationavailable to develop emission estimates. Ideally, this data is obtained through sourcetesting of emission points, although it is recognised that in many situations sampling datais not available. Examples of how source emission monitoring data can be used forcalculating emissions are shown in Section 6 of this Manual.
5.1 Use of Emission Factors Emission factors are generally developed through the testing of a particular sourcepopulation (eg. various boilers burning a particular fuel type). (The implicit assumptionin using an emission factor is that all members of the source population perform in thesame manner with little variation between members.)
This information is used to relate the quantity of a pollutant emitted to some measure ofactivity rate or throughput. For example, boiler emission factors are typically expressed asemissions per unit quantity of fuel consumed. To determine the emission rate for thatboiler, a measure of the fuel consumption rate is necessary.
The generic formula is:
Equation 1
Emission Rate = Emission Factor * Activity Rate (mass per time) (mass per unit of throughput) (throughput per time)
Appropriate conversion factors for units may need to be applied. For example, if theemission factor has units of ‘kg pollutant/m3 of fuel burned’ then the throughput or activityrate data required would be ‘m3 fuel burned/hr’, thereby generating an emission estimate of‘kg pollutant/hr’.
5.2 Mass Balance Techniques Mass balance involves the quantification of total materials into and out of a process, withthe difference between inputs and outputs being accounted for in terms of releases to theenvironment as part of the facility waste, as an emission or as a transfer. Mass balance isparticularly useful when the input and output streams can be quantified. This is mostoften the case for individual process units and operations. Mass balance techniques can be applied across individual unit operations or across anentire facility. These techniques are best applied to systems prescribed inputs, definedinternal conditions and known outputs. Section 7 of this Manual provides more guidanceas well as a worked example on the application of mass balance techniques. The estimates derived from mass balances are only as reliable as the values used inperforming the calculations. Small errors in data or calculation parameters can result inlarge errors in the final emissions estimates. Additionally, if sampling of input and outputmaterials is conducted, failure to use representative samples will also contribute to theuncertainty of the result.Iron and Steel 9

5.3 Modelling Emission models are available that predict emission rates for fugitive releases, landfills,lagoons, open dumps, waste piles, land treatment operations and other source areas.These can be used either as a “screening” tool or for in-depth investigations, which requiresite-specific data.
A range of other information is typically also required to utilise such software packages(eg. for the chemical and/or physical characterisation of specific substances). Whererelevant in this Manual, the use of such software packages for the purposes ofcharacterising and estimating emissions is discussed.
While software models frequently require an initial investment of time, they can providelong term benefits as they can be used relatively easily and quickly to re-estimateemissions.
5.4 Applying EETs It is important to remember that the NEPM for the NPI defines an emission as an emissionof a substance to the environment whether in pure form or contained in other matter andwhether in solid, liquid or gaseous form. It includes emissions of a substance to theenvironment from landfill, sewage treatment plants and tailings dams but does notinclude:
• deposit of a substance into landfill;• discharge of a substance to a sewer or a tailings dam; or• removal of a substance from a facility for destruction, treatment, recycling,
reprocessing, recovery or purification.
The NPI Guide lists all of the reportable substances and the associated reporting thresholds.This Guide should be consulted to ascertain whether your facility handles, manufactures,or otherwise uses any of the substances presented in the list and determine whether anythresholds are exceeded. If the facility is found to trigger any thresholds then releases toair, water and land must be quantified. Note, however, that although a particularsubstance may be triggered, an emission estimation technique may not be found in thisManual due to lack of emission estimation data.
Estimation methods applicable to particular processes in iron and steel production aredetailed in Table 3a and Table 3b of this Manual. These Tables list the NPI substances ofrelevance or potentially of relevance to iron and steel production. It should be noted thatnot all of the activities and operations listed in the tables are relevant to all facilities. Insuch situations, you should only consider the set of activities that are of relevance to youroperations.
Iron and Steel 10

Iron and Steel 11
The EETs shown in Table 3a and Table 3b have been discussed with the iron and steelindustry and it has been agreed that these methods are the most likely to be used widelyin the industry.
It should be noted that even if emission factors are not available, it is yourresponsibility to report emissions from the facility of any NPI substances that exceedNPI reporting thresholds. Other methods or a combination of existing emission factorsand other methods, (such as direct measurement and engineering calculations) can beused. For example, engineering calculation techniques such as speciation of total particulateemissions could be used to characterise emissions for metals.

Tab with Iron & Steel Productionn Making Steel Making
Pollu Iron
andling
Slag
Handling
BasicOxygen
SteelMaking
ElectricArc Steel
Making
LiquidSteel
Handling
Slag
Handling
Bloom,Billet & SlabCast
Amm Antimcomp
EF EC+DM EC EC EC+DM EC+DM EF+DM
Arsen EF EC+DM EC EC EC+DM EC+DM EF+DM Benz
Berylcomp
EC EC+DM EC EC EC+DM EC+DM EC+DM
Biphebiphe
Boron EC EC+DM EC EC EC+DM EC+DM EC+DM Cadmcomp
EC EC+DM EC EC EC+DM EC+DM EC+DM
Carb EC EC Chrocomp
EC+DM EC EC EC+DM EC+DM
Chrocomp
EC EC EC+DM EC+DM
Coba EC EC+DM EC EC EC+DM EC+DM EC+DM Copp EC EC+DM EC EC EC+DM EC+DM EC+DM Cum Cyancomp
Ethyl EC EC EC+DM Fluor EC+DM EC EC EC+DM Hydr Hydr EC+DM EC+DM Lead EC EC+DM EC EC EC+DM EC+DM EC+DM Magn EF EF Mangcomp
EF EF+DM EF EF EF+DM EF+DM EF+DM
Iron and Steel 12
le 3a - Emission Estimation Techniques for NPI-Listed Substances Potentially Associated Coke Making Sinter and Pellet Making Blast Furnace Iro
tant NPICategory
Coal
Handling
Coke Ovens
By-
Products
Materials Handling
Sintering & Pelletising
Cooling&
Handling
Materials Handling
Furnace
Operations H
onia (total) 1 EC+DM EC+DM EC+DM EF+DMony &
ounds 1 EC EC+DM EC EC+DM EC+DM EC EF+DM
ic & compounds 1, 2b EC EC+DM EC EC+DM EC+DM EC EF+DMene 1 EC+DM EC+EC+
DM EC+DM EF+DM
lium &ounds
1, 2b EC EC+DM EC EC+DM EC+DM EC EC+DM
nyl (1,1 -nyl)
1 EC+DM DM EC+DM EC+DM
& compounds 1 EC EC+DM EC EC+DM EC+DM EC EC+DMium &ounds
1, 2b EC EC+DM EC EC+DM EC+DM EC EC+DM
on Monoxide 1, 2a EC+DM EC+DM EC+DM EC+DMmium (III)ounds
1, 2b EC EC+DM EC+DM EC EC+DM EC+DM EC EC+DM
mium (VI)ounds
1, 2b EC EC+DM EC+DM EC EC+DM EC EC+DM
lt & compounds 1 EC EC+DM EC EC+DM EC+DM EC EC+DMer & compounds 1, 2b EC EC+DM EC EC+DM EC+DM EC EC+DM
ene 1 EC+DM EC+DM ide (inorganic)ounds
1 EC+DM EC+DM EC+DM EC EC+DM
ene glycol 1 DM DM EC+DMide compounds 1, 2a EC EC+DM EC EC+DM EC+DM EC EC+DMochloric acid 1, 2a EC+DM EC+DMogen sulfide 1 EC+DM EC+DM EC+DM EC+DM & compounds 1, 2b EC EC+DM EC EC+DM EC+DM EC EC+DMesium oxide fume 1, 2b EF+DManese &ounds
1 EF EF+DM EF EF+DM EF+DM EF EF+DM

Iron and Steel 13
Table 3a - Emission Estimation Techniques for NPI-Listed Substances Potentially Associated with Iron & Steel Production cont’ Coke Making Sinter and Pellet Making Blast Furnace Iron Making Steel Making
Pollutant NPICategory
Coal
Handling
Coke Ovens
By-
Products
Materials Handling
Sintering&
Pelletising
Cooling&
Handling
Materials Handling
Furnace
Operations
Iron
Handling
Slag
Handling
BasicOxygen
SteelMaking
ElectricArc Steel
Making
LiquidSteel
Handling
Slag
Handling
Bloom,Billet & SlabCast
Mercury & compounds 1, 2b EF EF+DM EF EF+DM EF+DM EF EF+DM EF EF+DM EF EF EF+DM EF+DM EF+DM Methyl ethyl ketone 1 Nickel & compounds 1, 2b EF EF+DM EF EF+DM EF+DM EF EF+DM EF EF+DM EF EF EF+DM EF+DM EF+DM Oxides of nitrogen 2a EF+DM EF+DM EF+DM EF EF Particulate Matter≤10 µm (PM10)
2a EF EF EF EF EF EF EF EF EF+DM EF EF EF EF EF
Phenol 1 EF+DM EF+DM EF+DM Phosphoric acid 1 DM Polychlorinated dioxinsand furans
2b EF
Polycyclic aromatichydrocarbons
2a EF+DM EF+DM EF+DM EF+DM
Selenium & compounds 1 EF EF+DM EF EF+DM EF+DM EF EF+DM EF EF+DM EF EF EF+DM EF+DM EF+DM Sulfur dioxide 1, 2a EF+DM EF+DM EF+DM EF+DM EF EF Sulfuric acid 1 DM EF+DM EF+DM EF EF Toluene 1 EF+DM EF+EC+
DM EF+DM EF+DM
Total Nitrogen 3 DM DM EF+DM Total Phosphorus 3 DM DM EF+DM Total Volatile OrganicCompounds
1, 2a EF+DM EF+DM EF+DM EF+DM
Xylenes (individual ormixed isomers)
1 EF+DM EF+EC+DM
EF+DM EF+DM
Zinc & compounds 1 EF EF+DM EF+DM EF EF+DM EF+DM EF EF+DM EF EF+DM EF EF EF+DM EF+DM EF+DM
EF = Emission Factor DM = Direct Measurement EC = Engineering Calculations MB = Mass Balance
While the NPI does not require facilities to conduct direct monitoring expressly for the purposes of NPI reporting, many facilities will have monitoring data relating tosome of the substances required to be reported under the NPI. Direct monitoring (DM) is presented as an EET for those substances and activities for which monitoring is(or is likely to be) carried out for other purposes (eg. as part of licence conditions). In most situations, the use of monitoring data for the purposes of calculating emissionsof NPI-listed substances is likely to provide a more accurate estimate of emissions than the use of emission factors.
lly Associated with Iron & Steel Production Mills Miscellaneous Operations
Rolling Mill Operations
Lime Kiln Tonnage Oxygen
Plant
Service Shops
Power Generation
EF+DM EF+DM EF+DM DM EF+DM EF+DM
DM EF+DM EF+DM EF+DM EF+DM EF+DM
DM EF+DM EF+DM EF+DM EF+DM EF+DM
DM EF+DM EF+DM DM EF+DM EF+DM
EF+DM EF+DM EF+DM DM EF+DM DM EF+DM
DM EF+DM DM EF+DM
DM EF+DM EF+DM DM EF+DM EF+DM
EF+DM EF+DM EF+DM
DM EF+DM EF+DM EF+DM EF+DM EF+DM EF+DM EF+DM EF+DM
DM EF+DM EF+DM
DM EF+DM EF+DM
Iron and Steel 14
Table 3b - Emission Estimation Techniques for NPI-Listed Substances PotentiaPrimary Rolling Mills Secondary Rolling
Pollutant NPICategory Steel
HandlingReheat
Furnace Rolling Mill Operations
Steel Handling
Reheat Furnace
Ammonia (total) 1 EF EF Antimony &compounds
1 EF EF DM EF EF
Arsenic & compounds 1, 2b EF EF DM EF EF Benzene 1 EF EF Beryllium & compounds 1, 2b EF EF DM EF EF Biphenyl (1,1 - biphenyl) 1 EF EF Boron & compounds 1 EF EF DM EF EF Cadmium & compounds 1, 2b EF EF DM EF EF Carbon Monoxide 1, 2a EF EF Chromium (III)compounds
1, 2b DM
Chromium (VI)compounds
1, 2b DM
Cobalt & compounds 1 EF EF DM EF EF Copper & compounds 1, 2b EF EF DM EF EF Cumene 1 Cyanide (inorganic)compounds
1 EF EF
Ethylene glycol 1 DM Fluoride compounds 1, 2a Hydrochloric acid 1, 2a Hydrogen sulfide 1 EF EF Lead & compounds 1, 2b EF EF DM EF EF Magnesium oxide fume 1, 2b Manganese &compounds
1 EF EF DM EF EF
Iron and Steel 15
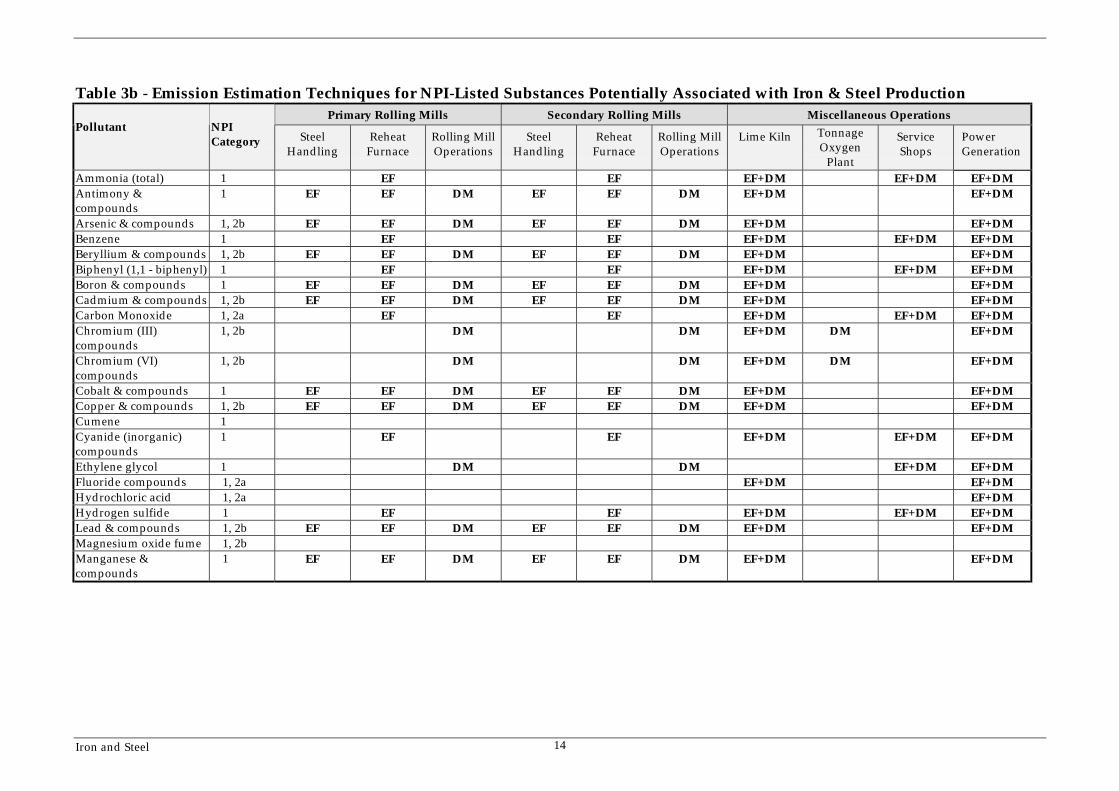
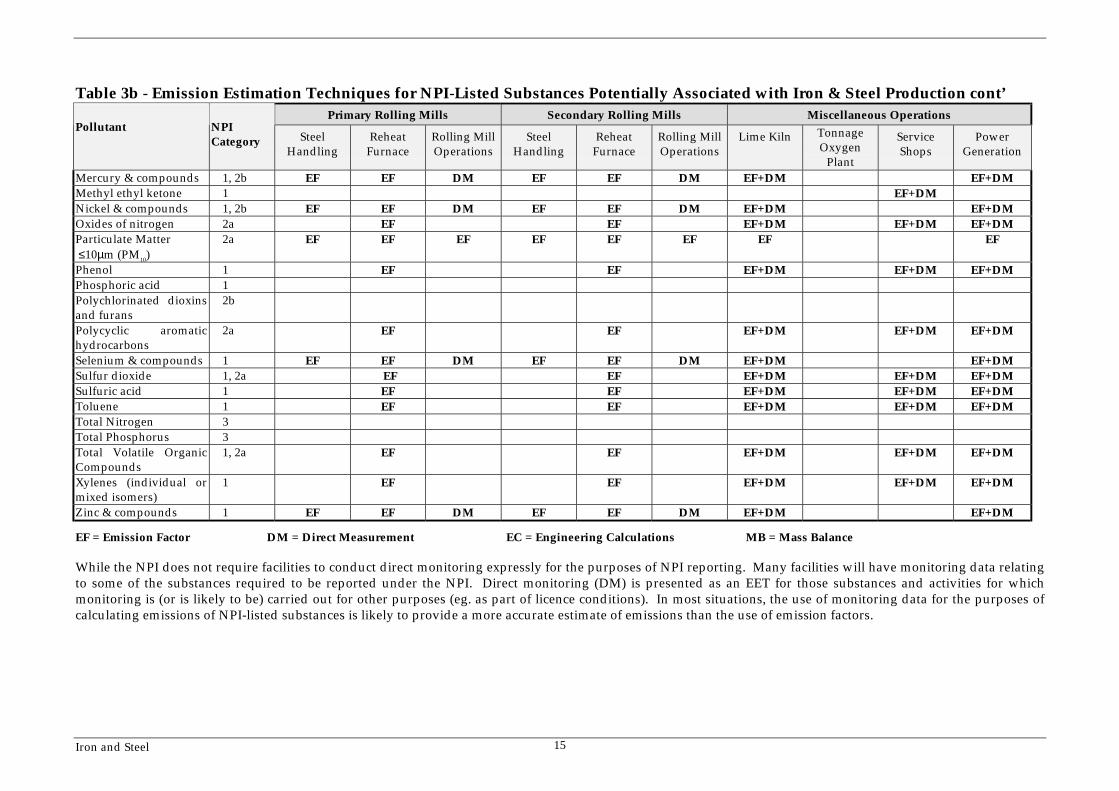
Table 3b - Emission Estimation Techniques for NPI-Listed Substances Potentially Associated with Iron & Steel Production cont’Primary Rolling Mills Secondary Rolling Mills Miscellaneous Operations
Pollutant NPICategory Steel
HandlingReheat
Furnace Rolling Mill Operations
Steel Handling
Reheat Furnace
Rolling Mill Operations
Lime Kiln Tonnage Oxygen
Plant
Service Shops
Power Generation
Mercury & compounds 1, 2b EF EF DM EF EF DM EF+DM EF+DM Methyl ethyl ketone 1 EF+DM Nickel & compounds 1, 2b EF EF DM EF EF DM EF+DM EF+DM Oxides of nitrogen 2a EF EF EF+DM EF+DM EF+DM Particulate Matter ≤10µm (PM10)
2a EF EF EF EF EF EF EF EF
Phenol 1 EF EF EF+DM EF+DM EF+DM Phosphoric acid 1 Polychlorinated dioxinsand furans
2b
Polycyclic aromatichydrocarbons
2a EF EF EF+DM EF+DM EF+DM
Selenium & compounds 1 EF EF DM EF EF DM EF+DM EF+DM Sulfur dioxide 1, 2a EF EF EF+DM EF+DM EF+DM Sulfuric acid 1 EF EF EF+DM EF+DM EF+DM Toluene 1 EF EF EF+DM EF+DM EF+DM Total Nitrogen 3 Total Phosphorus 3 Total Volatile OrganicCompounds
1, 2a EF EF EF+DM EF+DM EF+DM
Xylenes (individual ormixed isomers)
1 EF EF EF+DM EF+DM EF+DM
Zinc & compounds 1 EF EF DM EF EF DM EF+DM EF+DM
EF = Emission Factor DM = Direct Measurement EC = Engineering Calculations MB = Mass Balance While the NPI does not require facilities to conduct direct monitoring expressly for the purposes of NPI reporting. Many facilities will have monitoring data relatingto some of the substances required to be reported under the NPI. Direct monitoring (DM) is presented as an EET for those substances and activities for whichmonitoring is (or is likely to be) carried out for other purposes (eg. as part of licence conditions). In most situations, the use of monitoring data for the purposes ofcalculating emissions of NPI-listed substances is likely to provide a more accurate estimate of emissions than the use of emission factors.

6.0 Monitoring
Many facilities conduct monitoring as part of existing regulatory requirements. Typicallythe monitoring is tied directly to the conditions on an environmental licence and will varyfrom site-to-site.
It is important to recognise that facilities also collect a range of other information, beyondstack or liquid effluent testing, which may be used in characterising emissions for the NPI.Typical data collected includes:
• volumetric flow rates (eg products, wastes, wastewater treatment);• mass flowrates;• stream composition;• product and waste composition; and• production and waste quantities.
In most situations, the use of such data as a basis for calculating emissions will provide themost representative emissions information for a facility and this data should be used,where available, to calculate emissions.
Monitoring data can be expressed in a range of units. The following discussion may be ofassistance when converting monitoring results into annual emission estimates for thepurposes of the NPI. It is important to remember that the calculation of annual emissionsmust also take account of the number of hours per year the source is discharging to theenvironment.
Stack data is typically presented in terms of either actual flow or a ‘normalised’ flow. Thedifference is that normalised data is standardised to a particular temperature andpressure, which are typically 0°C and 1 atm respectively. However, sometimes it may bereferenced to 25°C and 1 atm. The following terms may be used when presenting data:
• acm - actual cubic metre (at actual temperature and pressure);• scm - standard cubic metre (typically at 25°C and 1 atm, although sometimes it
may be at 20°C or even 0°C); and• Nm3 - normal cubic metre (typically at 0°C and 1 atm).
It is essential to ascertain under what conditions the source test data is presented beforedetermining annual emission estimates. However, typically the measured concentrationsand flue gas flows are presented on source test reports at the same conditions(ie. temperature and pressure).
Two examples of the use of sampling data to characterise annual emissions are presentedbelow. Example 2 is where the concentration of the compound is presented at the sameconditions as the measured flow rate while Example 3 is where the concentration and fluegas flows are measured under different conditions.
Iron and Steel 16

Example 2 - Stack Sampling: Concentration and Flow Rate Measured at the Same Conditions
The following example relates to the situation where the concentration of the compound ispresented at the same conditions as the measured flow rate.
The following data is known:• the flue gas flow from a stack is measured at 30 Nm3/sec;• the measured concentration of cadmium in the flue gas is 0.01 mg/Nm3; and• the stack operates 24 hours per day for 300 days per year.
First of all, the number of seconds per year the stack is emitting is determined:
No. seconds/year = (3600 sec/hour) * (24 hours/day) * (300 days/year) = 2.6 * 107 seconds/year
Using this data the emission is derived from the generic formula shown in Equation 1:
Emission = (0.01 mg/Nm3) * (30 Nm3/sec) * (2.6 * 107 sec/year) / 106 mg/kg = 7.8 kg of cadmium per year.
Example 3 - Stack Sampling: Concentration and Flow Rate Measured at Different Conditions
If the concentration and flue gas flows are measured under different conditions thenadditional calculations are required. For example, the following data is known:
• the flue gas flow from a stack is measured at 100 acm/sec;• the measured concentration of cadmium in the flue is 0.01 mg/Nm3;• the stack operates 24 hours per day for 300 days per year; and• the conditions at the stack tip are approximately 150°C and 1 atm.
Using the actual stack data, the ‘actual’ flue gas flow can be converted to a normalisedflow using a ratio of temperatures. Note however that the temperatures must bepresented using the absolute temperature scale of Kelvin (ie. 0°C = 273 K). The conversionis then performed as follows (noting that the actual stack conditions are 150 + 273 = 423 K):
Flue gas (Nm3/sec) = 100 acm/sec * (273/423) = 64.5 Nm3/sec
The emission rate is then derived using the same methodology as outlined in Example 2 asfollows:
Emission = (0.01 mg/Nm3) * (64.5 Nm3/sec) * (2.6 * 107 sec/year)/106 mg/kg = 16.8 kg of cadmium per year.
Iron and Steel 17

7.0 Mass Balance Mass balance EETs involve examining a process to determine whether emissions can becharacterised based on an analysis of operating parameters, material composition andtotal material usage. Mass balance involves the quantification of total materials into andout of a process with the difference between inputs and outputs being accounted for as arelease to the environment (to air, water, land) or as part of the facility’s waste.
Mass balance is particularly useful when the input and output streams can be readilycharacterised; this most often is the case for small processes and operations. It can beapplied across an entire facility or across individual unit operations. Mass balancetechniques and engineering estimates are best used where there is a system withprescribed inputs, defined internal conditions, and known outputs.
It is essential to recognise that the emission values produced when using mass balance areonly as good as the values used in performing the calculations. For example, small errorsin data or calculation parameters (eg. pressure, temperature, stream concentration, flow,and control efficiency) can result in potentially large errors in the final estimates. Inaddition, when sampling of input and/or output materials is conducted, the failure to userepresentative samples will also contribute to uncertainty. In some cases, the combineduncertainty is quantifiable and this is useful in determining if the values are suitable fortheir intended use.
7.1 Overall Facility Mass Balance Mass balances can be used to characterise emissions from a facility providing thatsufficient data is available pertaining to the process and relevant input and outputstreams. Mass balances can be applied to an entire facility (see Example 4 below). Thisinvolves consideration of material inputs to the facility (purchases) and materials exportedfrom the facility in products and wastes, where the remainder is considered as a ‘loss’ (or arelease to the environment). The mass balance calculation can be summarised by:
Equation 2 Total mass into process = Total mass out of process
In the context of the NPI, this equation could be written as:
Equation 3 Inputs = Products + Transfers + Emissions
where:
Inputs: All incoming material used in the process. Emissions: Releases to air, water and land (as defined under the NPI). Emissions
include both routine and accidental releases as well as spills. Transfers: As defined under the NPI NEPM, transfers include substances discharged
to sewer, substances deposited into landfill and substances removed from afacility for destruction, treatment, recycling, reprocessing, recovery orpurification.
Products: Products and materials exported from the facility.
Iron and Steel 18

Applying this to an individual NPI substance (substance ‘i’), the equation may be writtenas:
Equation 4
Input of substance ‘i’ = Amount of substance ‘i’ in product + amount of substance ‘i’ inwaste + amount of substance ‘i’ transformed/consumed inprocess + emissions of substance ‘i’
The mass balance approach can be used for each NPI-listed substance for which the facilityis responsible for reporting. Emissions can then be allocated to air, water and land. Asimple example of the application of mass balance is presented below.
Example 4 - Using Mass Balance
A process uses 10 000 tonnes of raw material A, 5000 tonnes of raw material B and 20 000tonnes of water to produce 22 000 tonnes of product and 4000 tonnes of by-productannually, where A and B are NPI-listed substances. (Note: You are required to quantifyNPI-listed substances only). This process is shown schematically in Figure 2. What is thetotal amount of waste emitted from the process? How much of this should be reportedunder the NPI?
Figure 2 - Mass Balance Process
B5000t/yr
By-product4000 t/yr
Waste9000 t/yr
Water20 000 t/yr
PROCESS
Product22 000 t/yr
A10 000
t/yr
Iron and Steel 19

Iron and Steel 20
Example 4 - Using Mass Balance cont’
The general calculation process is presented as a series of steps:
Step 1: Calculate Total Inputs to Process
Total inputs: = mass of A + mass of B + mass of water = 10 000 + 5000 + 20 000 = 35 000 tonnes
Step 2: Calculate Total Outputs from Process
Total outputs: = mass of product + mass of by-product = 22 000 + 4000 = 26 000 tonnes
Step 3: Calculate Total Amount of Waste Produced
Total quantity of waste produced: = mass of inputs - mass of outputs = 35 000 - 26 000 = 9000 tonnes per annum.
Step 4: Identify Transfers and Spills
The facility will need to identify those wastes that are classed as transfers under the NPI.For example, of the 9000 tonnes per annum of waste produced, 2800 tonnes may becollected and sent for off-site disposal (ie. reporting not required), while approximately6000 tonnes may be sent to an on-site water treatment facility prior to discharge to sewer(ie. reporting not required).
This would then indicate that 200 tonnes of waste has been released into the environment(in the present example, the release is to atmosphere but could also be, for example, arelease direct to a water body). If the approximate proportions of substances A and B inthe waste stream are known, the quantity of A and B released to the atmosphere may bedetermined.
It is important to note that account must be taken of any pertinent emission controls(eg. the waste may be routed through an incinerator which destroys most or all ofsubstances A and B before they are released to the atmosphere).

7.2 Individual Unit Process Mass Balance The general mass balance approach described above can also be applied to individual unitprocesses. This requires that information is available on the inputs (ie flow rates,concentrations, densities) and outputs of the unit process.
The following general Equation 5 can be used (note that scm is an abbreviation forstandard cubic metres - refer to Section 6 - Monitoring).
Equation 5
Ei = ΣQaWa,iρa - ΣQoWo,iρo
where: Ei = emission rate of component i (kg/hr)
Qa = volumetric flow rate of inlet stream a (scm/hr) Qo = volumetric flow rate of outlet stream o (scm/hr) Wa,i = weight fraction of component i in inlet stream a Wo,i = weight fraction of component i in outlet stream o ρa, ρo = density of streams a and o respectively (kg/scm)
Information on process stream input and output concentrations is generally known as thisinformation is required for process control. The loss Ei will be determined throughanalysis of the process. It should be noted that it is then necessary to identify theenvironmental medium (or media) to which releases occur.
Iron and Steel 21

8.0 Air Emissions 8.1 Sources Emissions to the atmosphere from an integrated iron and steel production facility arisefrom a range of sources and activities. These include:
• Coke making (see Section 8.4);• Sinter and pellet making (see Section 8.5);• Iron making (see Section 8.6);• Steel making (see Section 8.7);• Steel casting and steel rolling mill operations (see Section 8.8);• Lime kilns (see Section 8.9);• Power generation (see Section 8.10);• Service shops (see Section 8.11);• Oxygen plant (see Section 8.11); and• Miscellaneous sources (see Section 8.11).
Many of the potential sources of emission within an integrated iron and steel facility areextremely difficult to measure directly and emissions must be estimated using othertechniques. Emissions such as those from coke battery charging and pushing operations,blast furnace charging and steel making operations in particular will be heavily dependentupon the emission reduction technology employed and the age and condition of theequipment. Consequently, emission factors are provided in this Manual for differentcontrol technologies. The emission factors chosen should be those which correspond mostclosely to the technology in place.
Section 8.3 describes how to estimate emissions of volatile organic compounds (VOCs, ona facility-wide basis). Sections 8.4 to 8.11 describe the emissions to air from each of theabove-mentioned activities, and the techniques that are applicable for estimating each typeof airborne emission.
8.2 Particulate Speciation Metals can be speciated based on trace analysis data or Material Safety Data Sheets(MSDS) provided by the vendor. This data can be combined with particulate emissionsdata (ie. collected as source test results and/or calculated by other estimation techniques)using the Equation 6 below. Equation 6
Ekpy,i = (m)(ci) where:
Ekpy,i = mass emission of component i (kg/yr) m = mass emission rate of total particulate (kg/yr) ci = mass fraction of component i (dimensionless, eg. kg/kg)
This methodology is most applicable to emissions from low temperature sources, such asstockpiles. This is because it intrinsically assumes that the released particulate mattercontains all metals. While this may be a reasonable assumption for metals with very lowvapour pressures, more volatile metals such as mercury are likely to be partially present in
Iron and Steel 22

vapour form. However, insufficient information is currently available to produce betterestimates other than through source testing.
8.3 Estimating VOC Emissions VOCs are generated during the coking process and can be extracted from coke oven gas ascommercial by-products. BTX (nominal cut of benzene, toluene and xylene) is such aproduct stream. VOCs produced (not necessarily emitted) in coking operations are estimated by dividingthe annual light oil make (light oil production, LORG) by the recovery efficiency (expressedas a decimal fraction). Recovery efficiency is calculated by the following equation: Equation 7Recovery Efficiency = (LORG - LOS)/LORG
where: LORG = light oil content of raw coke ovens gas LOS = light oil slip (ie losses of light oil)
VOCs emitted from coking operations come from various sources. Gas losses, combustionprocesses, organic liquid storage etc all contribute to total VOC emission.
VOCs emitted from gas losses in the gas processing plant can be estimated using standardloss factors for flanges and fittings, published in the Emission Estimation Technique Manualsfor Organic Chemical Processing Industries or for Fugitive Emissions.
VOCs emitted from combustion processes can be estimated by applying standardemission factors for fuels per the Emission Estimation Technique Manual for Combustion inBoilers.
The other major source of VOC emissions from any iron and steel production facility willbe from the handling and storage of organic liquids. EETs for VOC emissions from thesesources are provided in the Emission Estimation Technique Manual for Fuel and OrganicLiquid Storage.
8.4 Coke Making8.4.1 Sources of Emissions
The air emissions from a typical coke making operation would generally include:
• coal dust at discharge;• coal dust windage from stock piles;• coal dust losses at transfer points;• coke oven gas emission from charging, pushing, door leakage, wall and flue leakage
and oven top operations;• coke dust from pushing and quenching;• coke dust from transfer and screening operations;• combustion products from the main stack and interworks coke ovens gas consumers;• fume and vapours from quenching operations;• fugitive emissions in the by-products plant; and• vapours from by-products plant operations.
Iron and Steel 23

8.4.2 Emission Estimation Techniques
Applicable emission estimation techniques for coke making and associated activities aresummarised in Table 3a. Direct measurement would be possible for wall and flue leakage,combustion products from the main stack and coke dust emission from quenchingoperations.
Coal Handling
EETs for coal storage, preparation and handling are provided in the Emission EstimationTechnique Manual For Mining.
Coke Ovens
Table 4 provides emission factors for PM10 (particulate matter with an equivalentaerodynamic diameter of 10 micrometres or less ie. ≤10µm), carbon monoxide, sulfurdioxide, total VOCs and oxides of nitrogen, for coke ovens operations. In addition, otherNPI substances are likely to be emitted, for which no emissions factors may be available.
Iron and Steel 24

Ir
T
O issionctorting
NOx
(kg/tcoke)
EmissionFactor Rating
Ammonia (kg/t coke) Emission
Factor Rating
C
u D 0.015 D 0.01 DO
u D 0.005 D 0.03 DP
u D 0.05 D v D
b D
Q
u
u
b
b
M
u
u
egligible.
on and Steel 25
able 4 - Emission Factors for Coke Ovens Battery Operations
peration PM10
(kg/tcoke)
EmissionFactor Rating
CarbonMonoxide (kg/t coke)
EmissionFactor Rating
SO2
(kg/tcoke)
EmissionFactor Rating
VOCs (kg/tcoke)
EmFa Ra
harging
ncontrolled 0.12 D 0.3 D 0.01 D 1.25ven Doors
ncontrolled 0.27 D 0.3 D 0.75ushing
ncontrolled 0.25 B 0.035 D 0.1enturiscrubber
0.08 D 0.035 D 0.1
aghouse 0.045 D 0.035 D 0.1uenching
ncontrolleddirty water
0.6 D
ncontrolledclean water
0.17 D
affled dirtywater
0.21 B
affled cleanwater
0.03 B
ain Stack
ncontrolledraw COGa
0.22 A 2.0 D
ncontrolledBF gasb
0.085 A 0.54 D
Source: USEPA 1995. Where a factor is not included in the table, it is either not applicable or considered naCOG: coke ovens gas. bBF gas: blast furnace gas.

Coke Ovens By-product Plant
Emissions from chemical plant which strips out benzene, toluene and other volatile NPIsubstances from the by-products section of the coke ovens can be estimated by techniquespublished in the Emission Estimation Technique Manual For Organic Chemical ProcessingIndustries. Emission Estimation Technique Manual For Fuel and Organic Liquid Storage,Emission Estimation Technique Manual For Ammonium Sulfate Manufacturing and the NPIIndustry Handbook for Fertiliser Manufacturing.
Interworks Coke Oven Gas Combustion
The simplest way of estimating emissions resulting from coke oven gas combustion is toderive emission factors from typical waste gas composition for a particular plant andapply these factors to the entire coke oven gas make (ie. production). An engineeringcalculation technique that uses source monitoring data, such as the particulate speciationmethod described in Section 8.2, could be used to do this.
8.5 Sinter and Pellet Making
8.5.1 Sources of Emissions
Emissions to air from a typical iron ore sintering or pelletising operation generally include:
• material dusts at discharge (ore, fluxes and coke breeze);• material storage yard wind losses;• ore, flux and coke breeze losses at transfer points;• loss of sintering or pelletising plant feed from strand or hearth grate;• combustion products from the main stack;• combustion product fines lost in forced or convection coolers;• uncaptured product fines generated by screening of sinter or pellets; and• transfer point losses associated with handling of sinter or pellets.
8.5.2 Emission Estimation Techniques
Applicable emission estimation techniques for sinter and pellet making are summarised inTable 3a of this Manual. Direct measurement would be possible for unrecovered feedlosses through the strand or hearth grate and combustion products discharging throughthe main stack.
Materials Handling
Table 5 provides emission factors for PM10, for ore storage, preparation and handlingactivities. In addition, other NPI substances are likely to be emitted, for which noemissions factors may be available.
Iron and Steel 26

Table 5 - Emission Factors for Ore Storage, Preparation and Handling Operation PM10
(kg/t ore) Transfer Point inc Stacker Ore 0.00055 Transfer Point inc Stacker Lump 0.000075
Source: USEPA 1995
Sintering and Pelletising
Table 6 provides emission factors for PM10 and carbon monoxide, for sintering andpelletising plants. In addition, other NPI substances are likely to be emitted, for which noemissions factors may be available.
Table 6 - Emission Factors for Sinter and Pellet Plant Operations Operation PM10
(kg/t sinter) carbon monoxide
(kg/t sinter) Windbox
cyclones 0.37 22.0 venturi scrubber 0.226 22.0 wet ESPa
0.05 22.0 baghouse 0.104 22.0
Discharge
baghouse 0.016
Transfer Points
each 0.0065 Source: USEPA 1995 Where a factor is not included in the table, it is either not applicable or considered negligible.a ESP: electrostatic precipitator
8.6 Iron Making
8.6.1 Sources of Emissions
Emissions to air from a typical blast furnace iron making operation would include:
• sinter, pellet, ore, flux and coke breeze losses from material stock houses and transferpoints;
• loss of blast furnace gas from furnace top;• combustion products from stove heating and interworks blast furnace gas consumers;• dust losses when clearing dust catchers;• uncaptured emissions from cast house operations;• emissions associated with rock slag quenching and/or handling operations;• emissions associated with slag granulation; and• kish and fume generated from molten iron transfer and handling.
Iron and Steel 27

8.6.2 Emission Estimation Techniques
Applicable emission estimation techniques for iron making are summarised in Table 3a.Direct measurement would be possible for combustion products from stove heating anduncaptured emissions from material stock houses and cast house operations.
Furnace Operations, Iron Handling and Slag Handling
Table 7 provides emission factors for PM10, for blast furnace iron making operations. Inaddition, other NPI substances are likely to be emitted, for which no emissions factors maybe available.
Table 7 - Emission Factors for Blast Furnace Iron Making OperationsOperation PM10
(kg/t metal or slip)Blast Furnaceslips 39.5cast house - uncontrolled 0.15furnace 0.16taphole and trough 0.15Hot Metal Desulfurisationuncontrolled 0.1baghouse 0.0033
Source: USEPA 1995Note: Blast furnace PM10 emissions would be calculated as follows:1. Sum the cast house, furnace and taphole and trough emission factors and multiply
by the annual hot metal make.2. Determine the number of stack slips that occurred in all furnaces through the year
and multiply by the per slip PM10 emission factor in the table.
Interworks Blast Furnace Gas Combustion
The simplest way of estimating emissions resulting from blast furnace gas combustion isto apply a typical waste gas composition to the entire blast furnace gas make. Anengineering calculation technique that uses source-monitoring data, such as the particulatespeciation method described in Section 8.2 could be used to do this.
8.7 Steel Making
8.7.1 Sources of Emissions
The emissions to air from a typical basic oxygen steel making or electric arc furnaceoperation would generally include:
• ore, flux and coke breeze losses at transfer points;• emission (kish and fume) from molten iron transfer (BOF only);• combustion products and emission from hot metal desulfurisation plant;• dust generated when charging scrap;• uncaptured emissions from baghouses or electrostatic precipitators cleaning furnace
off gases;• combustion products in furnace off gases;• emissions associated with tapping of steel and slag;
Iron and Steel 28
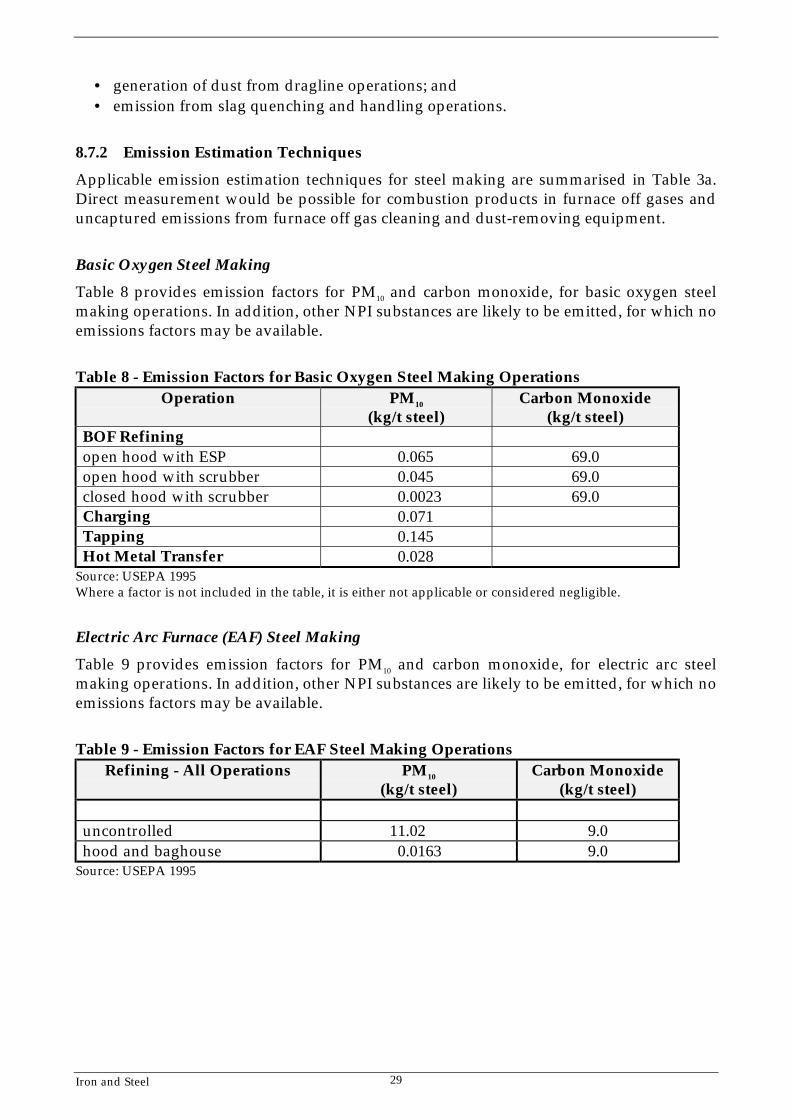
• generation of dust from dragline operations; and• emission from slag quenching and handling operations.
8.7.2 Emission Estimation Techniques
Applicable emission estimation techniques for steel making are summarised in Table 3a.Direct measurement would be possible for combustion products in furnace off gases anduncaptured emissions from furnace off gas cleaning and dust-removing equipment.
Basic Oxygen Steel Making
Table 8 provides emission factors for PM10 and carbon monoxide, for basic oxygen steelmaking operations. In addition, other NPI substances are likely to be emitted, for which noemissions factors may be available.
Table 8 - Emission Factors for Basic Oxygen Steel Making Operations Operation PM10
(kg/t steel) Carbon Monoxide
(kg/t steel) BOF Refining
open hood with ESP 0.065 69.0 open hood with scrubber 0.045 69.0 closed hood with scrubber 0.0023 69.0 Charging 0.071
Tapping 0.145
Hot Metal Transfer 0.028 Source: USEPA 1995 Where a factor is not included in the table, it is either not applicable or considered negligible.
Electric Arc Furnace (EAF) Steel Making
Table 9 provides emission factors for PM10 and carbon monoxide, for electric arc steelmaking operations. In addition, other NPI substances are likely to be emitted, for which noemissions factors may be available.
Table 9 - Emission Factors for EAF Steel Making Operations Refining - All Operations PM10
(kg/t steel) Carbon Monoxide
(kg/t steel)
uncontrolled 11.02 9.0 hood and baghouse 0.0163 9.0
Source: USEPA 1995
Iron and Steel 29

8.8 Steel Casting and Steel Rolling Mill Operations
8.8.1 Sources of Emissions
The air emissions produced by a typical steel casting or steel rolling mill operationinclude: • emissions from molten steel transfer, pouring or teeming;• combustion products and fume from oxy steel cutters;• combustion products from gas fired reheat furnaces; and• dust from miscellaneous sources.
8.8.2 Emission Estimation Techniques
Emission estimation techniques for steel casting and steel rolling mill operations aresummarised in Table 3a and Table 3b respectively. Direct measurement would be possiblefor combustion products from reheat furnaces.
Steel Teeming and Casting
Table 10 provides emission factors for PM10 for teeming and casting of steel. In addition,other NPI substances are likely to be emitted, for which no emissions factors may beavailable.
Table 10 - Emission Factors for Steel Teeming and Casting Operations
Operation PM10
(kg/t steel) Teeming
leaded steel uncontrolled 0.405 unleaded steel uncontrolled 0.035 Casting
hot metal transfer uncontrolled 0.028 machine scarfing and cutting 0.05
Source: USEPA 1995
Iron and Steel 30
Teeming
Where the teeming of ingots is undertaken prior to primary rolling operations, steel makemust be subdivided into leaded and unleaded and the total emissions calculated bysumming the emissions produced for their respective tonnages (from the emission factorsshown in Table 8).
Casting, Cutting and Scarfing
In general, casting involves a single hot metal transfer operation followed by a cuttingand/or scarfing operation. For each casting operation, the cast steel tonnage is multipliedby the relevant emission factor to estimate total emissions. Emissions from the casting operation itself are calculated by multiplying the emissionfactor shown in Table 10 by the steel throughput.

To calculate emissions from cutting and scarfing operations, it is necessary to determinethe proportion of time that the cutters are operating relative to the scarfing torches andmultiply this time fraction by the scarfing emission factor Thus, the overall PM10 emissions from casting, cutting and scarfing are calculated by: Equation 8
Emissions of PM10 = 0.028 * tonnes cast + (1 + CT) * 0.05 * tonnes cast where: CT = the proportion of time the oxy cutters are in operation relative to the
scarfing torches
Primary and Secondary Rolling
The major source of emissions to air from primary and secondary rolling operations arethe stack emissions from each reheat furnace. Where these furnaces are fired on cokeovens gas or blast furnace gas, the pollutant contribution has already been calculated (seeSection 8.4) and does not need to be estimated separately. Where a reheat furnace utilisesa fuel other than these gases, emissions can be calculated using the Emission EstimationTechnique Manual for Combustion in Boilers.
8.9 Lime Kilns8.9.1 Sources of Emissions
The emissions to air relevant to lime kiln operations generally include: • material dusts at discharge (lime, dolomite);• material storage yard wind losses;• lime/dolomite losses at transfer points;• combustion products from gas fired kilns; and• generation of dust from miscellaneous sources.
8.9.2 Emission Estimation Techniques
Applicable emission estimation techniques for limekilns are summarised in Table 3b.Direct measurement would be possible for combustion products from the rotary kiln. Where a kiln is fired on coke ovens gas or blast furnace gas, the pollutant contribution hasalready been calculated (see Section 8.4) and does not need to be estimated separately.EETs for kilns fired on other fuels are provided in the NPI Industry Handbook for Cementand Lime Manufacturing which includes the Emission Estimation Technique Manual for Limeand Dolomite Manufacturing. 8.10 Power Generation
8.10.1 Sources of Emissions
Within an iron and steel plant, steam raising capacity can be used for power generation,general interworks use, separation processes within the coke ovens by-products area andfor supplying turbines driving centrifugal and positive displacement pumps, blowers andfans. For the purpose of this Manual, these steam users are grouped under PowerGeneration.
Iron and Steel 31

8.10.2 Emission Estimation Techniques
Where a boiler is fired on coke ovens gas or blast furnace gas, the pollutant contributionhas already been calculated (See Sections 8.4 and 8.6) and does not need to be estimatedseparately. Emissions from boilers using other fuels can be calculated from EETs providedin the Emission Estimation Technique Manual for Combustion in Boilers. 8.11 Service Shops, Oxygen Plant and Miscellaneous Emissions.
8.11.1 Sources of Emissions
Emissions to air from service shop operations, tonnage oxygen plant operations andmiscellaneous sources generally include:
• combustion processes in service shop furnaces;• evaporation of organic solvents;• evaporation of specialty solvents used in the oxygen plant;• emissions from petrol and diesel road vehiclesa;• dust generated by road traffica; and• emissions from diesel powered locomotivesa. aon-site only, non-registered vehicles.
8.11.2 Emission Estimation Techniques
Applicable emission estimation techniques for the above-mentioned activities aresummarised in Table 3b.
Service Shop Furnaces
Where a service shop furnace is fired on coke oven gas or blast furnace gas, the pollutantemissions have already been calculated (See Sections 8.4 and 8.7). Only the contribution toemissions from fuel sources other than coke ovens gas and blast furnace gas should beestimated for Service Shop Furnaces. These emissions can be estimated using EETsprovided in the Emission Estimation Technique Manual for Combustion in Boilers.
Solvent Evaporation
It can be assumed that all solvents purchased eventually end up as emissions to the air.While this is a conservative approach, it provides a quick way to calculate emissions fromsolvent handling, for VOCs and individual NPI substances for which reporting isrequired.
Emissions from Diesel Fuelled Vehicles and Locomotives
EETs for vehicle emissions, resulting from the combustion of fuels, are provided in theEmission Estimation Technique Manual for Combustion Engines. Factors for estimating dustgeneration associated with vehicle movement, are provided in Table 11 below. Moredetailed EETs for estimating dust generation associated with vehicle movement areprovided in the Emission Estimation Technique Manual for Mining.
Iron and Steel 32
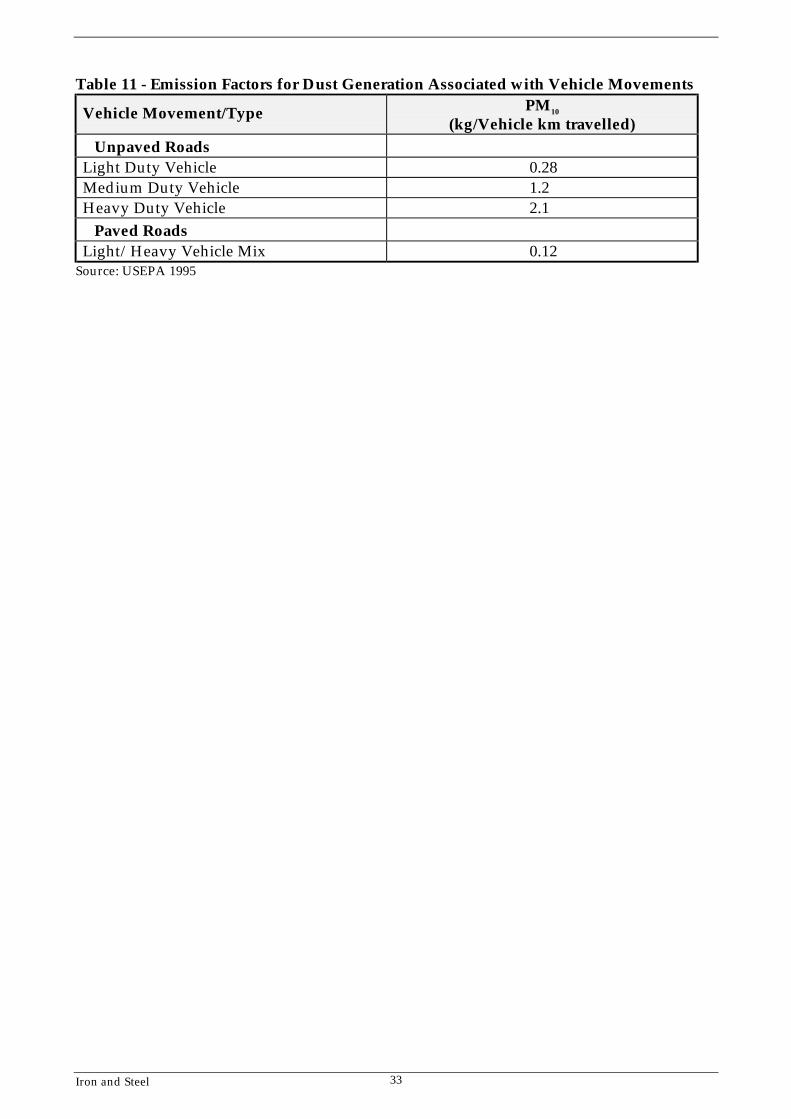
Table 11 - Emission Factors for Dust Generation Associated with Vehicle Movements
Vehicle Movement/Type PM10
(kg/Vehicle km travelled)Unpaved Roads
Light Duty Vehicle 0.28 Medium Duty Vehicle 1.2 Heavy Duty Vehicle 2.1
Paved Roads
Light/Heavy Vehicle Mix 0.12 Source: USEPA 1995
Iron and Steel 33

9.0 Emissions to Water
The first stage in characterising emissions to water is to identify those emissions that areclassed as transfers under the NPI. You are not required to report these emissions to theNPI. Other emissions (eg. discharges to surface water bodies such as streams and rivers)are required to be reported.
Integrated iron and steel plants may have a number of drains, each containing dischargesfrom a number of sources. The smaller facilities may have only one drain.
For all facilities, only those drains discharging directly to the environment (includingstormwater) need be reported under the NPI. Drains to sewer, trade waste, off-site or on-site treatment facilities and to storage facilities are classified as transfers and reporting isnot required.
As discharges to water are highly process- and site-specific, most facilities perform somemonitoring to characterise these emissions. While the NPI does not require facilities toconduct additional monitoring to characterise emissions, it is likely that most facilitieswhich discharge to water will have at least some monitoring data which can be used toassist in the characterisation of emissions. Examples on the application of monitoring datato the calculation of emissions are provided below.
Where no monitoring information is available, guidance on the characterisation of processwastewater emissions is provided in the Emission Estimation Technique Manual for Sewageand Wastewater Treatment.
In general, estimation of emissions to water is best undertaken by aggregating theannualised contribution of a ll drain discharges, uncontained spills and uncollectedemissions from on-site storage, to the environment.
The quantities of each reportable substance emitted from each drain would be estimatedas follows:
Equation 9
Quantity Emitted = Annualised Flow * Concentration/1000 (kg) (l) (mg/l) (mg/kg)
The quantities emitted from all drains would then need to be added together to give thetotal figure.
Examples
The following two examples will show how emissions can be estimated from point sourcedischarges. The first example is relevant for wastewater streams that have a relativelyconstant daily flow rate and the measured concentration of the relevant compound in thestream does not vary greatly. The second example is relevant for streams that have morevariable flow rates and composition (eg. stormwater).
Iron and Steel 34

Example 5 - Estimating Emissions from Stream with Constant Daily Flow Rates The following information is known regarding the wastewater stream:
• the wastewater stream contains an average cadmium concentration of 500 mg/L;• the stream is sent to an on-site wastewater treatment plant at a rate of 5 L/minute;• after treatment, the stream leaving the plant contains 25 milligrams/L (and is
discharged to a local water body); and• the plant operates 24 hours per day for 330 days per year. Using the data above, determine the quantity of cadmium emitted from the wastewatertreatment plant. STEP 1: Determine the annual quantity of wastewater discharged
Volume = (5 L/min) * (60 min/hour) * (24 hour/day) * (330 days/year) = 2.4 * 106 L/year
STEP 2: Determine the quantity of cadmium exiting the plant, using Equation 9
Quantity emitted Ekpy,Cd = (2.4 * 106 L/year) * (25 mg/L) / 1 * 106 mg/kg = 60 kg/year
Therefore, based on the calculations above, 60 kg/year of cadmium is discharged from theplant annually (and you are required to report this under the NPI as the discharge is to awater body).
Example 6 - Estimating Emissions from Streams with Variable Flow Rates and
Composition This example is a little more complex than the previous in that it requires the analysis ofall monitoring data collated in a year from which an average can be derived. In thisexample, samples are taken fortnightly to measure the discharge flow from a site, as wellas cadmium levels in the discharge. The data collected over a single year is presented inTable 12.
The daily emission is derived by multiplying the daily flow rate, by the measured level ofcadmium. The annual emissions can be determined by combining the average dailyemission shown in the table above by the number of days the wastewater treatment plantdischarges per year.
For this example the plant is assumed to be operational for 300 days per year. Therefore,the annual emission estimate is derived as follows:
Annual release = (1.17 kg/day) * (300 days/year) = 351 kg.
Thus it is estimated that 351 kg of cadmium is emitted from the site annually
Iron and Steel 35
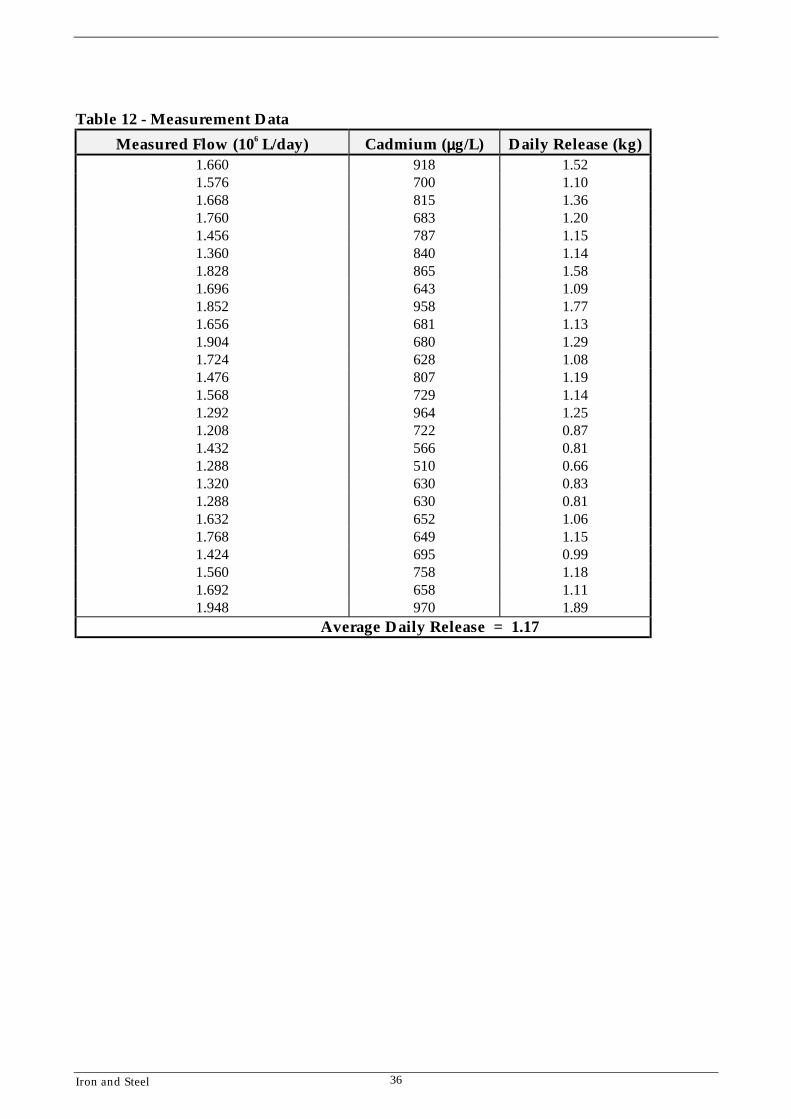
Table 12 - Measurement Data
Measured Flow (106 L/day) Cadmium (µµµµg/L) Daily Release (kg) 1.660 918 1.52 1.576 700 1.10 1.668 815 1.36 1.760 683 1.20 1.456 787 1.15 1.360 840 1.14 1.828 865 1.58 1.696 643 1.09 1.852 958 1.77 1.656 681 1.13 1.904 680 1.29 1.724 628 1.08 1.476 807 1.19 1.568 729 1.14 1.292 964 1.25 1.208 722 0.87 1.432 566 0.81 1.288 510 0.66 1.320 630 0.83 1.288 630 0.81 1.632 652 1.06 1.768 649 1.15 1.424 695 0.99 1.560 758 1.18 1.692 658 1.11 1.948 970 1.89
Average Daily Release = 1.17
Iron and Steel 36

10.0 Emissions to Land
Under the NPI facilities are required to report on their emissions to land. The NPIImplementation Working Group has defined emissions to land as:
All emissions of listed substances, except those which are directed to, and contained by, purposebuilt facilities are to be reported to the NPI. This applies irrespective of whether the substances’ fateis within or outside a reporting facility boundary. With respect to receipt of NPI substances, suchreceiving facilities are to be operating in accordance with any applicable State or Territorygovernment requirements.
Emissions to receiving facilities such as secure landfills, sewers and tailings dams do notneed to be reported. Similarly you are not required to report removal of a substance fortransfer to another facility for destruction, treatment, recycling, reprocessing, recovery orpurification. This means, for instance, that if an accidental emission of a water-bornepollutant is directed to a temporary bund or into a watercourse then it must be reported,regardless of whether the emission is detectable at the boundary of the facility. If the emission is directed to and stored in a purpose built facility, for instance a rubberlined dam, then it does not need to be reported. However, all other emissions of NPI-listedsubstances except those that are directed to, and contained by, purpose-built receivingfacilities are to be reported under the NPI, irrespective of whether the substance’s fate iswithin or outside the reporting facility’s boundary. To characterise emissions to land, three general EETs are discussed here:
• groundwater monitoring;• spills; and• on-site disposal.
10.1 Groundwater Monitoring
Some facilities conduct monitoring of groundwater to characterise emissions from thefacility. Where available, this monitoring data may be used to assist in the characterisationof emissions. This involves determining upstream and downstream concentrations andusing this information, in conjunction with groundwater flow information, to determinethe contribution of the facility to pollutant levels in the groundwater.
In terms of meeting NPI reporting requirements, this approach is reasonable in situationswhere there is no loss of substances (eg. due to evaporation) prior to the substanceentering the groundwater and where the time between the emission occurring and thesubstance entering the groundwater is minimal. Therefore, for those facilities wheregroundwater monitoring captures all emissions to land, such monitoring can be used as areasonable measure of emissions to the environment.
If this is not the case, (eg. where the rate of transmission through the soil/clay is low, orwhere there are other routes whereby substances to land are carried off-site,(eg. evaporation or surface run-off)), it will be necessary to characterise such emissionsusing the other EETs presented in this Manual.
Iron and Steel 37

10.2 SpillsFor many facilities the primary source of releases will be through spills (this may alsoinclude intentional spillage due to vessel washdown). Accidental spills can contribute toreleases to land (directly), to water (through run-off) and to air.
Unless spilled material is routed to a secure containment facility, the quantity of materialspilled less any material that is collected must be reported under the NPI. In practicalterms, a log of spillages could be maintained, detailing the quantities spilled and thecomposition of the spill (in particular, the quantities of NPI substances spilled). This logcould then form the basic information required to meet NPI reporting requirements.
If any spilled material enters a stream or dam, it must be reported as an emission to water.Note that if the spill is a volatile liquid, it may be suitable to assume that the entire lightend fraction is volatilised and the remaining liquid is emitted into the ground or water.However, if the liquid is not volatile and no material is collected, it may be reasonable toassume that all material is emitted to the land or water. The time, quantity of spill,temperature and porosity of the soil all play an important part in the estimation ofemissions.
Once losses to the atmosphere have been quantified, releases to land can be estimatedusing the following equation:
Equation 10
EFi = 1.2 * 10-10 (MWi (po
i)/T) U0.78 * X 0.89 * Y
where:
EFi = evaporation rate (Emission factor) ofpollutant ‘i’ (g/s)
U = wind speed over the surface of the spill (cm/s)X = downwind dimension (cm)Y = crosswind dimension (cm)MWi = molecular weight of ‘i’ (can be obtained from
Perry & Green (1997) or other standardchemical engineering reference texts)
poi = vapour pressure of substance ‘i’ at spill
temperature T (dyne/cm2 = 0.0001 kPa)T = temperature (K)
Total emission to air = time * EFi (g/event)
Once losses to the atmosphere have been quantified, releases to land can be estimatedusing the following equation:
Iron and Steel 38
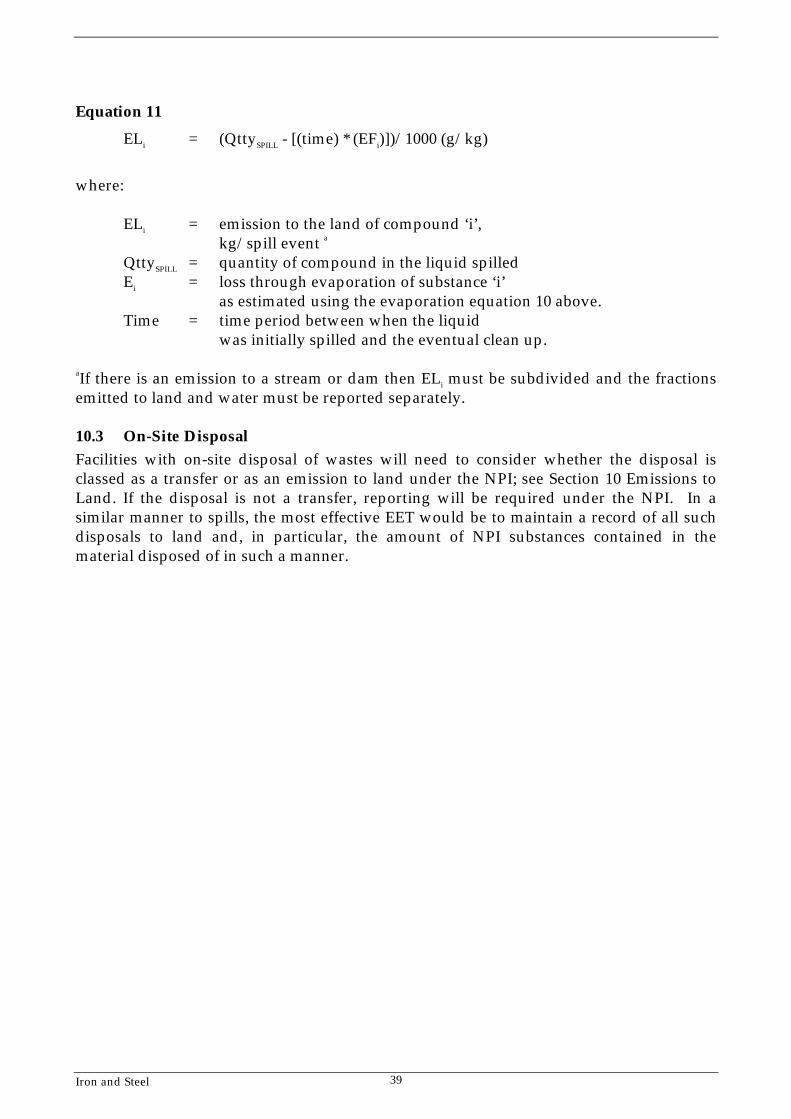
Equation 11
ELi = (QttySPILL - [(time) * (EFi)])/1000 (g/kg)
where:
ELi = emission to the land of compound ‘i’,kg/spill event a
QttySPILL = quantity of compound in the liquid spilledEi = loss through evaporation of substance ‘i’
as estimated using the evaporation equation 10 above.Time = time period between when the liquid
was initially spilled and the eventual clean up.
aIf there is an emission to a stream or dam then ELi must be subdivided and the fractionsemitted to land and water must be reported separately.
10.3 On-Site DisposalFacilities with on-site disposal of wastes will need to consider whether the disposal isclassed as a transfer or as an emission to land under the NPI; see Section 10 Emissions toLand. If the disposal is not a transfer, reporting will be required under the NPI. In asimilar manner to spills, the most effective EET would be to maintain a record of all suchdisposals to land and, in particular, the amount of NPI substances contained in thematerial disposed of in such a manner.
Iron and Steel 39

11.0 GlossaryReference should be made to the National Pollutant Inventory and the NPI Guide fordefinitions of terms used within the NPI system.
Baghouse Gas cleaning device where filter bags are used to effectparticulate removal from a gas stream.
BF gas Blast Furnace gas.Blooms Intermediate rolled or cast steel square/rectangular section.
Cross sectional area is intermediate between that of an ingotand a billet ie. 150 mm to 300 mm in dimension.
BOF Basic Oxygen steel making Furnace.BTX Nominal cut of benzene, toluene and xylene.Cast House Building where ingots are cast.Charging Loading of raw materials into a process.COG Coke Oven Gas.Coke Battery A series of coke ovens operated togetherCoke Breeze Size fraction of coke. Typically < 3 mm, it is used as a fuel in
sintering and pelletising operations in particularCyclone Gas cleaning device utilising centrifugal forces to remove
particulate matter.EAF Electric Arc steel making Furnace.EET Emission Estimation Technique.Emission Any release of substances to the environment whether in a
pure form or contained in other matter. Emissions may besolid, liquid or gaseous.
Emission Factor (EF) A number that can be multiplied by an activity rate orthroughput data from a facility to estimate emissions fromthat facility without the need for sampling or analysis. Thetechnique is most often used to estimate gaseous emissions tothe environment.
ESP Electrostatic Precipitator used for removal of particles from agas stream by inducing electrostatic charge.
Flare Equipment for combustion of surplus gas via stackkish Fine graphite flake produced when iron saturated with
carbon is cooledslip With reference to discussion regarding blast furnaces, it is an
irregular burden stock movement within the furnace.With reference to discussion regarding coke ovens, it is theuncaptured quantity of a vapour species downstream of itscorresponding removal process. (Typically light oil orammonia).
Mass Balance Technique Estimation of emissions to the environment throughaccounting of inputs, accumulations and outputs for aparticular process or facility.
make production.
Iron and Steel 40

Iron and Steel 41
MSDS Material Safety Data Sheets.Nominal Cut With reference to discussion regarding coke ovens by-
products, it is a term referring to the organic compound(s)within a particular boiling point range or molecular weightrange distilled from a mixture of organic compounds.
PM10 Particulate matter with an equivalent aerodynamic diameterof 10 micrometres or less ie. ≤10µm).
Pushing Coke ovens operation where coke is removed from the cokingoven using a hydraulic ram mounted on a “Ram Car”.
Scarfing Removal of surface impurities and imperfections using hightemperature oxygen enriched flames.
Stock houses Building for the housing of blended process feed material.Typically a stock house is employed to avoid wind lossesfrom stockpiles or where the material or its properties arewater sensitive.
Strand Mobile continuous hearth on a sintering plant.Teeming Pouring of molten steel into moulds for solidification.Venturi Scrubber Gas cleaning device where an accelerated air stream
containing particulate matter is violently and intimatelycontacted with a liquid (usually water). The violent contactwets the particles facilitating removal from the gas.
VOCs Volatile Organic Compounds (will be defined on the NPIWebPages).
Windbox A steel chute forming a close fit with a mobile grate or hearth.Connected to the suction side of a fan by the windmain, theclose fit of the windbox to the hearth creates a suctiondrawing a flamefront down through the material bed above.
Windage Material emission resulting from wind action on the surfaceof exposed stockpiles.

12.0 References
ANZSIC: Australian and New Zealand Standard Industrial ClassificationAustralian Bureau of Statistics & NZ Dept of Statistics 1993ABS Catalogue No 1292.0
Green, Don W (ed) (1997) Perry’s Chemical Engineers’ Handbook, 7th edn. New York,McGraw-Hill
USEPA (1995) Compilation of Air Pollutant Emission Factors AP-42, Volume I: StationarySources, Fifth Edition, 1995, Office of Air Planning and Standards, Office of Air QualityPlanning and Standards, US EPA, Research Triangle Park, 1995 (AirChief CD-ROM, 1997,Version 5.0)http://www.epa.gov/ttn/chief/ap42.html
The following Emission Estimation Technique Manuals referred to in this Manual areavailable at the NPI Homepage (www.npi.gov.au), and from your localEnvironmental Protection Authority:
• Emission Estimation Technique Manual for Organic Chemical Processing Industries;• Emission Estimation Technique Manual for Fuel and Organic Liquid Storage;• Emission Estimation Technique Manual for Mining;• Emission Estimation Technique Manual for Combustion Engines;• Emission Estimation Technique Manual for Combustion in Boilers;• Emission Estimation Technique Manual for Sewage and Wastewater Treatment;• National Industry Handbook for Cement and Lime Manufacturing;• Emission Estimation Technique Manual for Surface Coating;• National Industry Handbook for Fertiliser Manufacturing, including Emission
Estimation Technique Manual for Ammonium Sulfate Manufacturing;• Emission Estimation Technique Manual for Fugitive Emissions; and• Emission Estimation Technique Manual for Ferrous Foundries.
Iron and Steel 42