Embed Size (px)
Citation preview
1
Climate Council of Australia
Emission Reduction Targets: What you need to know
As pressure mounts on the Australian Government to increase its 2030 emission reduction target and commit to net zero emissions, it’s important for us all to understand what defines a good target. This Explainer delves into the factors that matter most and will help you work out a good emission reduction target from a poor one.
Key Criteria
A good target must:
• Align with the science (for example, by basing it on an appropriate carbon budget);
• Deliver steep reductions early, with interim targets that guide the emissions curve down, fast;
• Aim for “real zero” and not just “net zero”;
• Apply economy-wide without any sector or industry exclusions;
• Include all gases and aerosols;
• Consider equity (I.e. What resources are at our disposal? What is our “fair share”?);
• Aim high by doing the most possible, not the bare minimum.
EXPLAINER
30 August 2021
2
1. Approaches to determining emission reduction targets.
The ultimate goal of any emission reduction target is to help limit global average temperature rise. This is enshrined in the global agreement that all countries signed up in Paris in 2015, which states:
“Holding the increase in global average temperature to well below 2°C above pre-industrial levels and pursuing efforts to limit the temperature increase to 1.5°C above pre-industrial levels, recognizing that this would significantly reduce the risks and impacts of climate change.”
Paris Agreement, Article 2, 1a
When considering a temperature threshold or limit, such as 1.5°C, there are two common approaches for estimating the required emission reductions and appropriate ‘zero date’.
1.1 The targets and timetables approach
This approach is often adopted at the national level (for example, by specific countries), and typically names a date by which net-zero emissions will be achieved. ‘Net zero’ means that any leftover emissions still being emitted at the desired date are balanced out by the drawdown of carbon from the atmosphere. More than 100 countries have now set targets of reaching net zero emissions by 2050, with China choosing 2060 as its target date. Australia is yet to commit to reaching net zero emissions by any date.
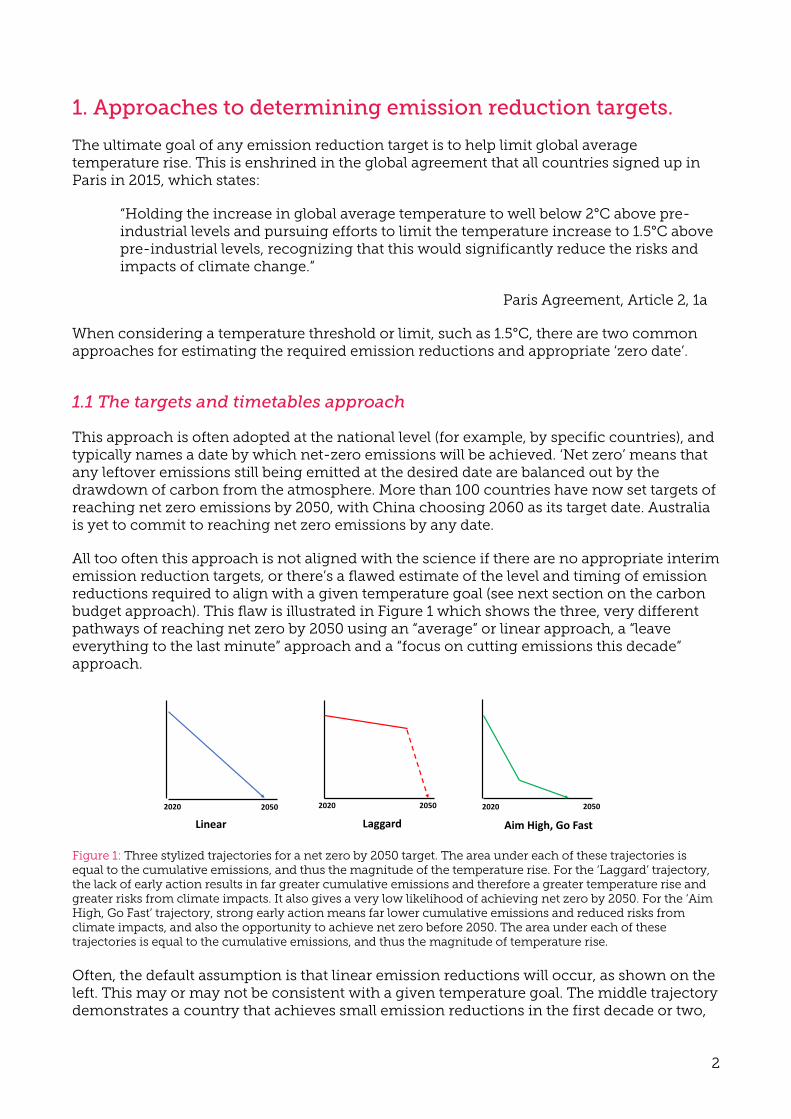
All too often this approach is not aligned with the science if there are no appropriate interim emission reduction targets, or there’s a flawed estimate of the level and timing of emission reductions required to align with a given temperature goal (see next section on the carbon budget approach). This flaw is illustrated in Figure 1 which shows the three, very different pathways of reaching net zero by 2050 using an “average” or linear approach, a “leave everything to the last minute” approach and a “focus on cutting emissions this decade” approach.
Figure 1: Three stylized trajectories for a net zero by 2050 target. The area under each of these trajectories is equal to the cumulative emissions, and thus the magnitude of the temperature rise. For the ‘Laggard’ trajectory, the lack of early action results in far greater cumulative emissions and therefore a greater temperature rise and greater risks from climate impacts. It also gives a very low likelihood of achieving net zero by 2050. For the ‘Aim High, Go Fast’ trajectory, strong early action means far lower cumulative emissions and reduced risks from climate impacts, and also the opportunity to achieve net zero before 2050. The area under each of these trajectories is equal to the cumulative emissions, and thus the magnitude of temperature rise. Often, the default assumption is that linear emission reductions will occur, as shown on the left. This may or may not be consistent with a given temperature goal. The middle trajectory demonstrates a country that achieves small emission reductions in the first decade or two,
2020 2020 20202050 2050 2050
Linear Laggard Aim High, Go Fast
Fig. 1. Three stylized trajectories for a net-zero-by-2050 target. For the ‘Laggard’ trajectory, the lack ofearly action gives a very low likelihood of achieving net zero by 2050. For the ‘Aim High, Go Fast’trajectory, strong early action creates the opportunity to achieve net zero before 2050. The area undereach of these trajectories is equal to the cumulative emissions, and thus to the magnitude ofemperature rise.
3
followed by a steep reduction at the end of the time period. The right-hand trajectory starts with deep and rapid emission reductions in the first decade, followed by a long tail of lower emissions until net zero is achieved by 2050. Intuitively, it is obvious that these three trajectories will achieve different temperature outcomes, as the cumulative amount of emissions (the area under the emission reduction line) is vastly different between these scenarios. One way to deal with this flaw is to set interim targets that force the trajectory of emission reductions onto the desired pathway towards a longer-term temperature goal. The Paris Agreement aims to achieve this by requiring countries to set a target for 2025 or 2030, and then successive interim targets every five years. The Agreement also includes a process by which these targets are reviewed and, ideally, increased. A further complication is that any interim target requires a baseline date against which the reduction is measured. For example, Australia’s 2030 target is a 26-28% emission reduction on a 2005 baseline. If the baseline is chosen based on previous year of particularly high emissions then the reduction becomes easier to achieve and the resulting cuts to emissions are lower. This is the case for Australia. Our annual emissions in 2005 were 615 Mt CO2-e1 while emissions in 2015, at the time of the Paris Conference of the Parties (COP 21), were 549 Mt CO2-e. A 26% reduction on 2005 levels means cutting 160 Mt, which would lead to emissions in 2030 of 455 Mt CO2-e. If we had set the baseline year as 2015, then this equates to a 17% reduction. We can also think about this in terms of a household budget. If we wanted to cut our spending by a certain amount, say 30%, then we would choose a year in which we spent the most money, say $1,000, rather than a year in which we spent less money, say $700. A 30% cut on $1,000 means we still get to spend $700, whereas a 30% cut on $700 would mean our spending is reduced to $490.
1.2 The carbon budget approach The carbon budget approach is a conceptually simple, yet scientifically robust, approach to estimating the level of greenhouse gas emission reductions required to meet a desired temperature goal, such as that specified in the Paris Agreement (Allen et al. 2009; Meinshausen et al. 2009). The approach is based on the approximately linear relationship between (i) the cumulative amount of CO2 emitted from all human sources since the beginning of industrialisation (often taken as 1870, consistent with the 1850-1900 average temperature baseline); and (ii) the increase in global average surface temperature (Figure 2; Collins et al. 2013; IPCC 2018). The carbon budget refers to the maximum total amount of carbon dioxide emissions that can be produced, or emitted, for a given probability of achieving a specific temperature goal. Once the carbon budget has been ‘spent’ (emitted), then any emissions being produced need to be net zero2 to avoid exceeding the corresponding temperature goal.
1 Mt = Million tonnes. CO2 -e refers to carbon dioxide equivalent, which accounts for the warming effect of other greenhouse gases such as methane and nitrous oxide. 2 “Net zero emissions” means the amount of CO2 emissions to the atmosphere is matched by the amount of CO2
removal from the atmosphere by, for example, natural processes as well as carbon capture and storage (CCS) technologies, sometimes called “Negative Emission Technologies”. At present, these technologies are in the early development stage, and none are technologically or commercially viable yet at the scale needed to significantly influence the carbon budget.
4
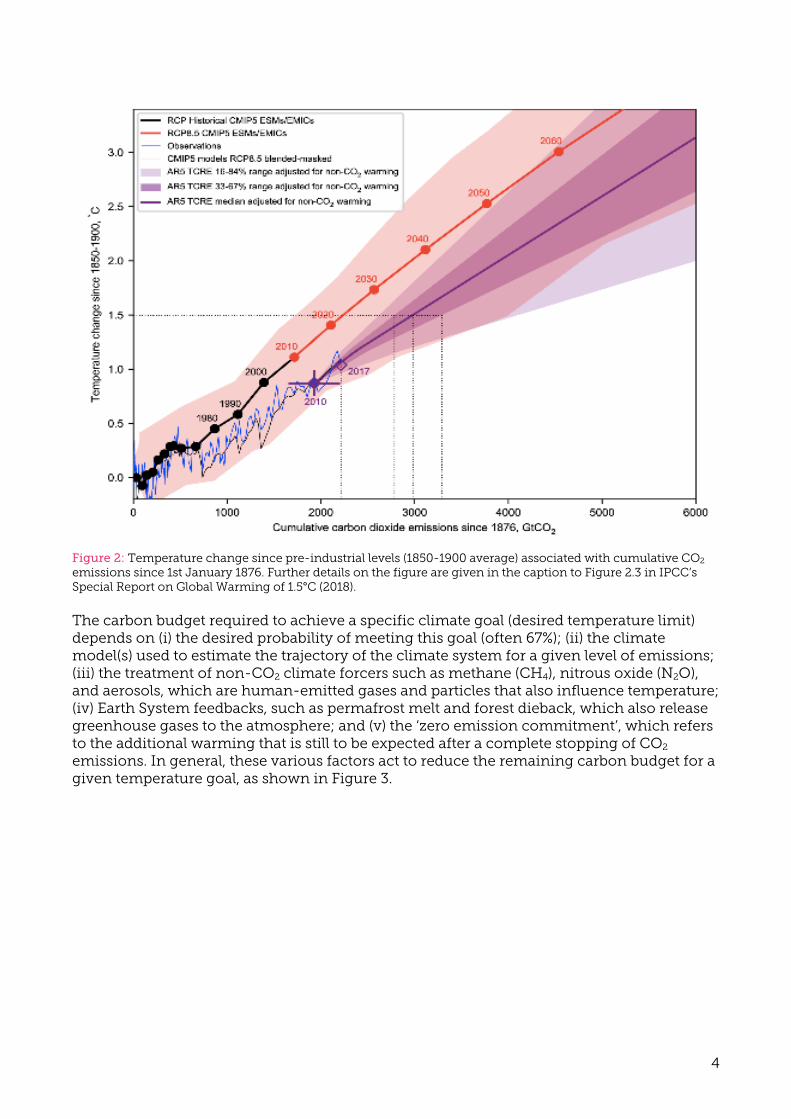
Figure 2: Temperature change since pre-industrial levels (1850-1900 average) associated with cumulative CO2 emissions since 1st January 1876. Further details on the figure are given in the caption to Figure 2.3 in IPCC’s Special Report on Global Warming of 1.5°C (2018).
The carbon budget required to achieve a specific climate goal (desired temperature limit) depends on (i) the desired probability of meeting this goal (often 67%); (ii) the climate model(s) used to estimate the trajectory of the climate system for a given level of emissions; (iii) the treatment of non-CO2 climate forcers such as methane (CH4), nitrous oxide (N2O), and aerosols, which are human-emitted gases and particles that also influence temperature; (iv) Earth System feedbacks, such as permafrost melt and forest dieback, which also release greenhouse gases to the atmosphere; and (v) the ‘zero emission commitment’, which refers to the additional warming that is still to be expected after a complete stopping of CO2 emissions. In general, these various factors act to reduce the remaining carbon budget for a given temperature goal, as shown in Figure 3.
5
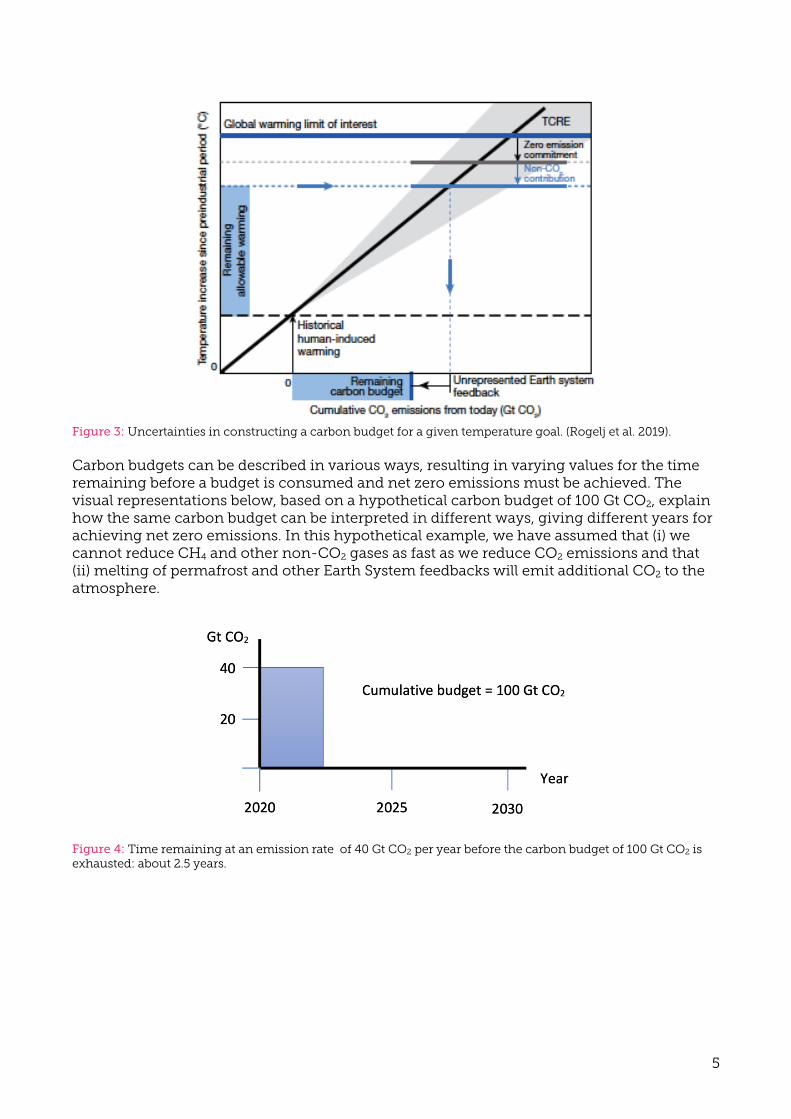
Figure 3: Uncertainties in constructing a carbon budget for a given temperature goal. (Rogelj et al. 2019).
Carbon budgets can be described in various ways, resulting in varying values for the time remaining before a budget is consumed and net zero emissions must be achieved. The visual representations below, based on a hypothetical carbon budget of 100 Gt CO2, explain how the same carbon budget can be interpreted in different ways, giving different years for achieving net zero emissions. In this hypothetical example, we have assumed that (i) we cannot reduce CH4 and other non-CO2 gases as fast as we reduce CO2 emissions and that (ii) melting of permafrost and other Earth System feedbacks will emit additional CO2 to the atmosphere.
Figure 4: Time remaining at an emission rate of 40 Gt CO2 per year before the carbon budget of 100 Gt CO2 is exhausted: about 2.5 years.
6
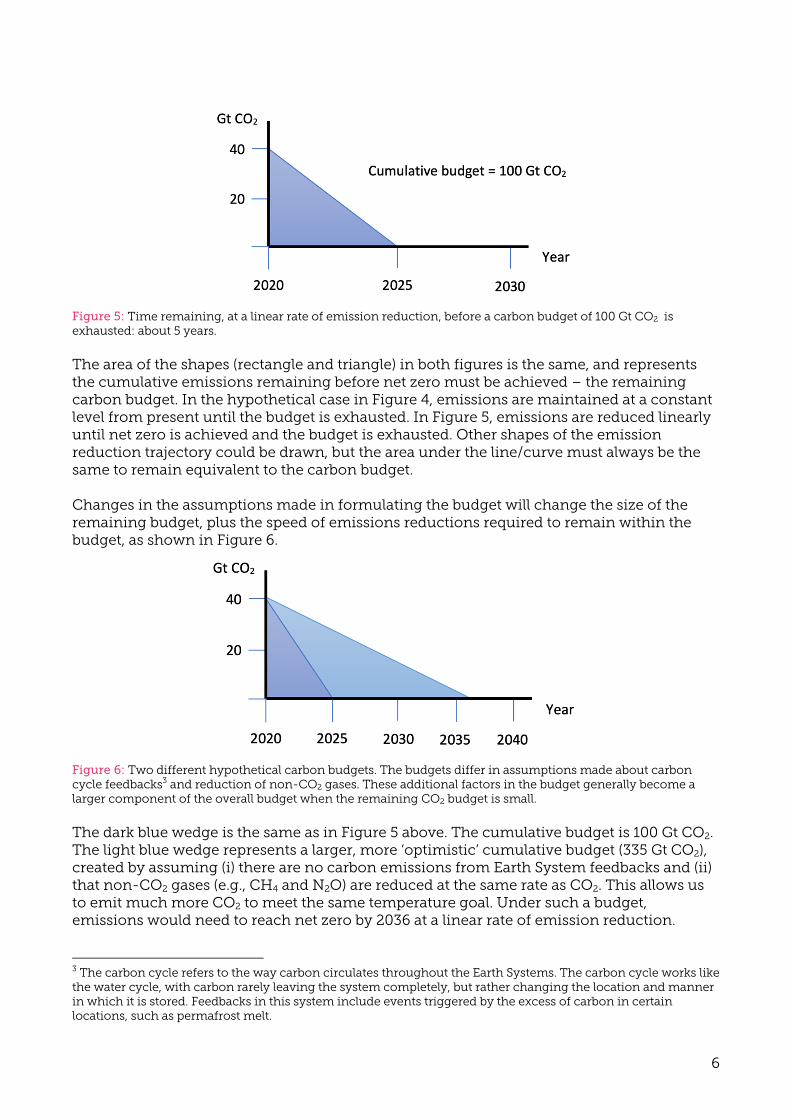
Figure 5: Time remaining, at a linear rate of emission reduction, before a carbon budget of 100 Gt CO2 is exhausted: about 5 years.
The area of the shapes (rectangle and triangle) in both figures is the same, and represents the cumulative emissions remaining before net zero must be achieved – the remaining carbon budget. In the hypothetical case in Figure 4, emissions are maintained at a constant level from present until the budget is exhausted. In Figure 5, emissions are reduced linearly until net zero is achieved and the budget is exhausted. Other shapes of the emission reduction trajectory could be drawn, but the area under the line/curve must always be the same to remain equivalent to the carbon budget. Changes in the assumptions made in formulating the budget will change the size of the remaining budget, plus the speed of emissions reductions required to remain within the budget, as shown in Figure 6.
Figure 6: Two different hypothetical carbon budgets. The budgets differ in assumptions made about carbon cycle feedbacks3 and reduction of non-CO2 gases. These additional factors in the budget generally become a larger component of the overall budget when the remaining CO2 budget is small.
The dark blue wedge is the same as in Figure 5 above. The cumulative budget is 100 Gt CO2. The light blue wedge represents a larger, more ‘optimistic’ cumulative budget (335 Gt CO2), created by assuming (i) there are no carbon emissions from Earth System feedbacks and (ii) that non-CO2 gases (e.g., CH4 and N2O) are reduced at the same rate as CO2. This allows us to emit much more CO2 to meet the same temperature goal. Under such a budget, emissions would need to reach net zero by 2036 at a linear rate of emission reduction.
3 The carbon cycle refers to the way carbon circulates throughout the Earth Systems. The carbon cycle works like the water cycle, with carbon rarely leaving the system completely, but rather changing the location and manner in which it is stored. Feedbacks in this system include events triggered by the excess of carbon in certain locations, such as permafrost melt.

7
In summary, the carbon budget approach is more scientifically robust than a target and timetable approach. However, the latter can be made compatible with a carbon budget by adopting multiple interim targets. These help to constrain the cumulative emissions over the whole of the trajectory, so that cumulative emissions match those required for a given carbon budget. This is why interim targets are a critical component of any credible target and timetable approach.
8
2. Critical concepts
There are a number of concepts that are critical to the scientific integrity of any proposed emission reduction targets and trajectories.
2.1 Why early action is critical (the speed of emission reduction matters!)
Figure 1 shows three examples of different emission reduction trajectories, all aimed at meeting the same net zero emissions target. However, as the figure shows, the year-to-year trajectory is more important than the date at which net zero is reached. In short, early and deep emission reductions are essential in meeting an overall temperature goal. Moving fast on emission reduction in sectors where technologies are advanced (for example, converting electricity generation to renewables) allows more time to deal with sectors that are harder to decarbonise, whilst still meeting the ultimate temperature goal.
Using a carbon budget framework, achieving rapid and deep emission reductions early conserves more of the budget for decarbonising the more challenging sectors of the economy later. Conversely, blowing most of the carbon budget by early inaction makes it extremely challenging – and quickly impossible – to meet the desired emission reduction target (the ‘Laggard’ trajectory).
Case study 3.1 below, the Australian Capital Territory’s legislated emission reduction trajectory, is a good example of an ‘Aim High, Go Fast’ emission reduction trajectory that is being successfully implemented.
2.2 What does ‘net zero emissions’ mean and why is it risky?
Nearly all long-term emission reduction targets adopted by countries refer to achieving ‘net zero’ emissions by a given date. ‘Net zero’, as opposed to ‘zero’ emissions, assumes that a country will continue to emit a certain level of greenhouse gases, particularly from certain industrial processes from which it is very hard to eliminate emissions entirely. These must then be matched by the removal of an equivalent amount of CO2 from the atmosphere. For example, food systems will likely generate residual emissions of greenhouse gases, primarily CH4 and N2O, which are very difficult to eliminate entirely. These are estimated to be about 5 Gt CO2-e per year (Willett et al. 2019). This means, to achieve net zero emissions globally, we must remove 5 Gt CO2 per year from the atmosphere just to account for residual emissions produced by food systems.
Removal of carbon from the atmosphere to balance an equivalent amount of emissions to the atmosphere is often called “offsetting”. The most common approach to offsetting is to remove carbon from the atmosphere by planting forests, which absorb CO2 from the atmosphere as the trees grow. However, there are some nuances to offsetting that make it a risky approach that is not scientifically valid in most cases. The fundamental problem is that CO2 emitted to the atmosphere by the burning of fossil fuels (coal, oil, gas) is adding new carbon to the Earth’s active carbon cycle – carbon that has been locked away from the atmosphere for millions of years. This new carbon cannot be “offset” by shifting carbon from one component of the active carbon cycle – the atmosphere – to another active component – the biosphere (for example, forests). The problem is that biological carbon, such as that stored in forests, is vulnerable to rapid return to the atmosphere from disturbances such as fires and insect attacks, both of which are increasing as the climate
9
continues to warm. For more information on the risks of offsetting, see Mackey et al. (2013) and the Climate Council’s report ‘Land Carbon: No Substitute for Action on Fossil Fuels’ (2016).
Another approach to removing carbon from the atmosphere is “draw down” which includes an industrial method usually described as ‘carbon capture and storage’, or CCS for short. This approach is to capture CO2 at its point of emission to the atmosphere, liquify it by low temperature and high pressure, and transport it via pipelines to a secure geological storage site, where it is stored for thousands of years. An example of a storage site is a disused oil well, which could be capped after having been injected with liquified CO2. Although CCS has been explored for several decades now, it remains only in an experimental phase and has yet to be proven to be technologically and economically viable, or free from unacceptable environmental risks (Climate Council 2021).
A final point about offsetting is that ‘one tonne in’ doesn’t equal ‘one tonne out’. That is, removal of one tonne of carbon from the atmosphere does not have an equivalent effect on the atmospheric temperature as the emission, or contribution, of one tonne of carbon to the atmosphere. The problem is that emissions of carbon have a direct and immediate impact on the temperature by trapping additional outgoing infrared radiation (the greenhouse effect) and thus raising the atmosphere’s temperature. Whereas, removing the equivalent amount of carbon from the atmosphere does not reduce the atmosphere’s temperature by the same amount. As climate model simulations show, when human emissions reach net zero, the atmospheric concentration of CO2 begins to decline as it is drawn down by the ocean and the land biosphere. However, the atmospheric temperature does not decrease as the cooling effect of reducing atmospheric CO2 is counterbalanced by a transfer of heat from the ocean to the atmosphere (MacDougall et al. 2020).
The bottom line is that there are considerable risks attached to ‘net zero’ approaches to emission reduction targets.
A true ‘zero’ approach is much more scientifically robust, and thus has a higher potential for success.
2.3 National-level targets: dealing with equity issues and exported emissions
How a global emission reduction target is allocated to individual countries is a complex issue. A simple per capita approach ignores both large inequalities amongst countries in their current and historical emissions, and their capacity to reduce emissions. In general, wealthy countries - which comprises member countries of the Organisation for Economic Co-operation and Development (OECD) including Australia - have much higher per capita emissions than developing countries. Further, they also have better resourcing and capacity to reduce emissions whilst maintaining a high standard of living for their citizens. In contrast, developing countries argue that they need to increase their emissions in order to raise their citizens’ standard of living and to account for historical inequalities. Wealthy countries are also responsible for far more cumulative emissions and hence have a greater historical responsibility for the climate crisis.
One solution to this challenge is the so-called ‘contract-and-converge’ approach to emission reduction targets and trajectories. This approach begins with the current inequalities in emissions, whilst aiming for equal per capita emissions when net zero emissions are achieved. In this approach, per capita emissions decrease over time for wealthy counties, while per capita emissions rise for developing countries and, at ‘zero
10
dates' such as 2050, they converge so that per capita emissions are then identical for all countries.
Australia’s Climate Change Authority (2014) used a modified contract-and-converge approach to estimate Australia’s emission reduction targets for 2050; to do our fair share in limiting global warming to 2°C. Their approach allocated Australia 0.97% of the global emissions from 2013 to 2050, while our population is about 0.33% of the global total. Using this same methodology, the Climate Targets Panel in 2021 estimated that to meet the Paris Agreement goal of limiting warming to well below 2°C, Australia must reduce its emissions by 50% by 2030 and achieve net-zero emissions by 2045.
Australia’s emissions from our exported fossil fuels are about 2.5 times greater than our domestic emissions.
A second thorny issue in setting emission reduction targets is dealing with emissions from exported fossil fuels. The accepted accounting process for assigning emissions to a country is based on domestic emissions – that is, emissions that were generated within the territory of the country, regardless of whether the fossil fuels originated from within the country or were imported. For most OECD countries, this issue does not arise because their domestic emissions are much higher than the emissions arising from their exported fossil fuels. However, Australia’s situation is significantly different, as the emissions from our exported fossil fuels are about 2.5 times greater than our domestic emissions (Climate Analytics 2019).
If the normal accounting procedure for allocating emissions is used then Australia’s annual emissions rank as the 14th worst in the world. However, if our exported emissions are also included (and thus our imported emissions excluded), Australia becomes the world’s 5th or 6th largest emitter, with only China, the United States, Russia and India worse than us.
Although the accounting protocols distinguish between emissions generated within national boundaries and exported emissions, recent court cases in Australia, such as the Rocky Hill Coal Mine case and Sharma v. Minister for Environment, have ruled that Australia does have a legal and moral responsibility for the emissions generated from fossil fuels that are extracted from Australian territory, exported and burned elsewhere.
2.4 Emission reduction accounting and reporting
Several factors need to be considered when national greenhouse gas emissions are reported and emission reduction trajectories are proposed.
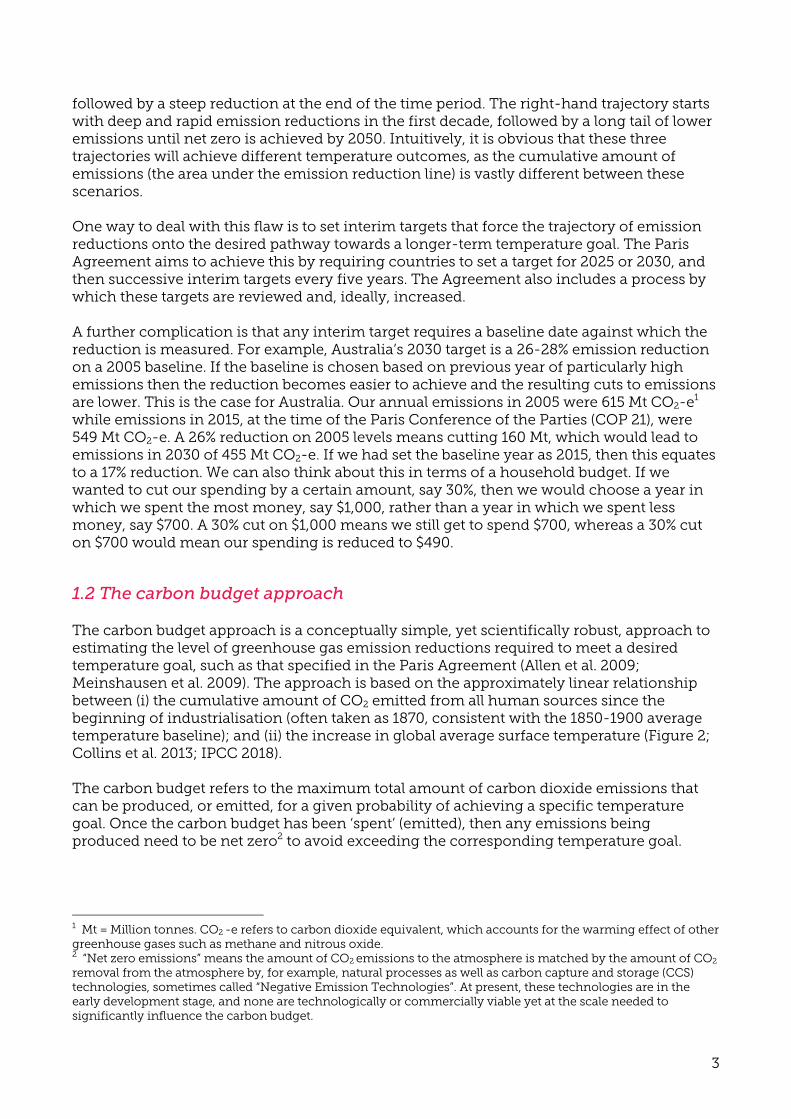
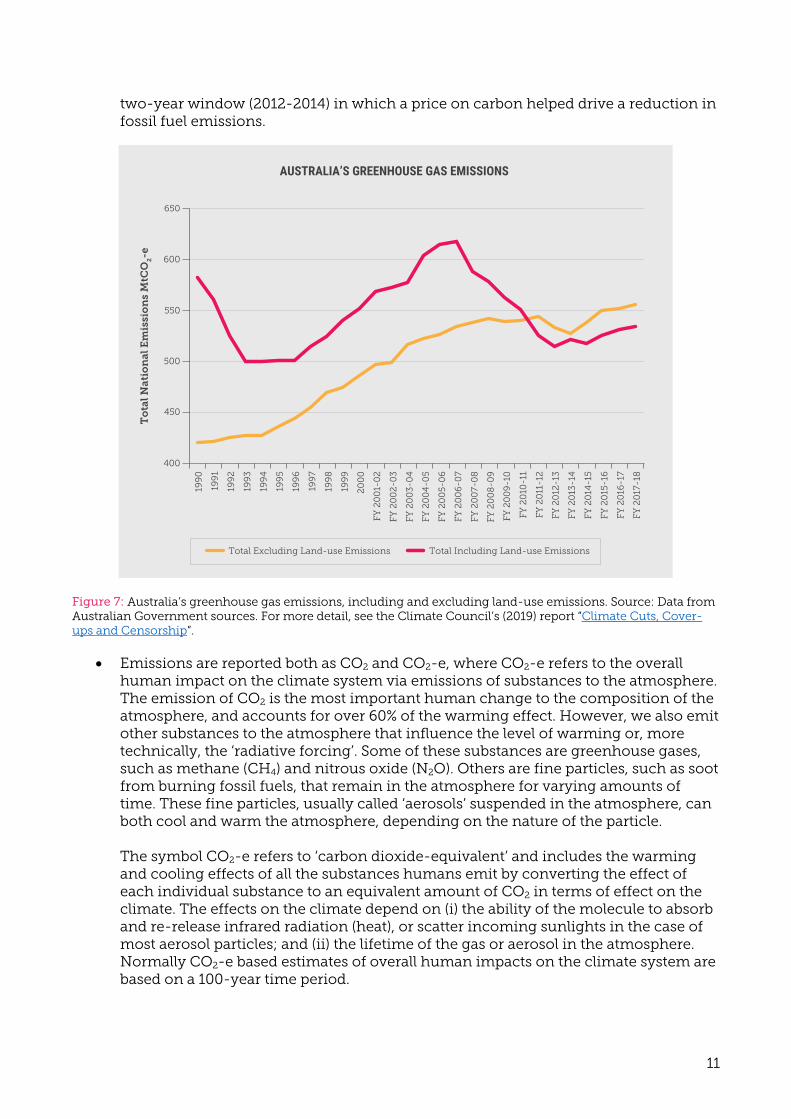
• Fossil fuel emissions and emissions from land-use change (including disturbances): about 90% of global human emissions of greenhouse gases originate from fossil fuel combustion and cement production, with about 10% coming from land-use change (primarily deforestation). For developed countries, the fraction of emissions originating from fossil fuels and cement is even larger. Australia is an exception, however. Emissions from land-use change have a larger share of our overall emissions than other developed countries, so care must be taken when interpreting overall emission statistics for Australia, as shown in Figure 7 below. From about 2006, our overall emissions dropped steadily for nearly a decade before beginning to creep upwards again. This trend was due almost entirely to changes in land use; our fossil fuel emissions continued to rise through this period, apart from a
11
two-year window (2012-2014) in which a price on carbon helped drive a reduction in fossil fuel emissions.
Figure 7: Australia’s greenhouse gas emissions, including and excluding land-use emissions. Source: Data from Australian Government sources. For more detail, see the Climate Council’s (2019) report “Climate Cuts, Cover-ups and Censorship”.
• Emissions are reported both as CO2 and CO2-e, where CO2-e refers to the overall human impact on the climate system via emissions of substances to the atmosphere. The emission of CO2 is the most important human change to the composition of the atmosphere, and accounts for over 60% of the warming effect. However, we also emit other substances to the atmosphere that influence the level of warming or, more technically, the ‘radiative forcing’. Some of these substances are greenhouse gases, such as methane (CH4) and nitrous oxide (N2O). Others are fine particles, such as soot from burning fossil fuels, that remain in the atmosphere for varying amounts of time. These fine particles, usually called ‘aerosols’ suspended in the atmosphere, can both cool and warm the atmosphere, depending on the nature of the particle. The symbol CO2-e refers to ‘carbon dioxide-equivalent’ and includes the warming and cooling effects of all the substances humans emit by converting the effect of each individual substance to an equivalent amount of CO2 in terms of effect on the climate. The effects on the climate depend on (i) the ability of the molecule to absorb and re-release infrared radiation (heat), or scatter incoming sunlights in the case of most aerosol particles; and (ii) the lifetime of the gas or aerosol in the atmosphere. Normally CO2-e based estimates of overall human impacts on the climate system are based on a 100-year time period.
199
0
199
1
199
2
199
3
199
4
199
5
199
6
199
7
199
8
199
9
200
0
FY 2
00
1-0
2
FY 2
00
2-0
3
FY 2
00
3-0
4
FY 2
00
4-0
5
FY 2
00
5-0
6
FY 2
00
6-0
7
FY 2
00
7-0
8
FY 2
00
8-0
9
FY 2
00
9-1
0
FY 2
010
-11
FY 2
011
-12
FY 2
012
-13
FY 2
013
-14
FY 2
014
-15
FY 2
015
-16
FY 2
016
-17
FY 2
017
-18
To
tal N
atio
nal
Em
issi
on
s M
tCO
2-e
650
600
550
500
450
400
Total Excluding Land-use Emissions Total Including Land-use Emissions
AUSTRALIA’S GREENHOUSE GAS EMISSIONS
Figure 10: Australia’s greenhouse gas emissions (including and excluding land-use emissions). Source: Data for 1990-2000 from Australian Government 2019b; 2001-2018 from Australian Government 2018d.
Reporting of land-use change data has masked the actual changes in Australia’s greenhouse gas profile. Transparency is of fundamental importance, and yet this has been lacking in Federal Government reporting.
Reducing fossil fuel emissions is the only way to tackle climate change e!ectively.
The challenge for climate policy is to respect this fundamental di!erence between fossil and land carbon by building a firewall between policies to reduce fossil fuel emissions and policies to increase carbon uptake on land. This means there should be no o!setting of fossil fuel emissions by increasing land carbon.
25 CLIMATE CUTS, COVER-UPS AND CENSORSHIP
12
• Kyoto period “carryover credits”: Australia is the only country in the world that considered using so-called “credits” from previous commitments (under the Kyoto Protocol) in meeting goals under set under the Paris Agreement. So-called carryover credits occur when a country reduces emissions by a greater amount than originally agreed during a commitment period. In Australia’s case, this refers to the fact that Australia did slightly better than expected after it had set itself enormously generous targets for limiting emissions under the Kyoto Protocol. Effectively, Australia was allowed to increase its emissions by 8% compared to 1990 levels during the first commitment period (2008-2012), and then to reduce its emissions by a pathetic 0.5% during the second commitment period (2013-20) In short, Australia set a bar for itself that was so low it was easy to step over it. Then, it tried to use the fact it had stepped over this bar to argue for doing less, yet again. After copping widespread criticism from around the world for this approach, Australia has backed away from attempting to use credits although it has not formally extinguished them.
13
3. Case Studies
3.1 The Australian Capital Territory
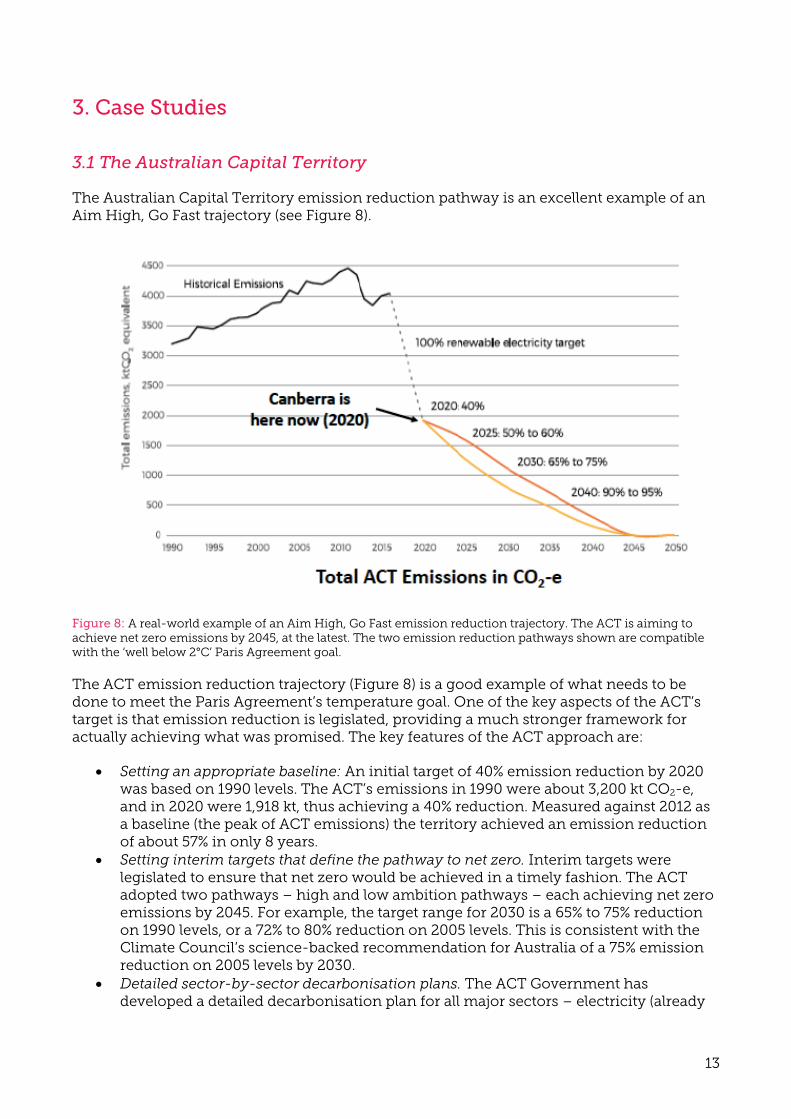
The Australian Capital Territory emission reduction pathway is an excellent example of an Aim High, Go Fast trajectory (see Figure 8).
Figure 8: A real-world example of an Aim High, Go Fast emission reduction trajectory. The ACT is aiming to achieve net zero emissions by 2045, at the latest. The two emission reduction pathways shown are compatible with the ‘well below 2°C’ Paris Agreement goal.
The ACT emission reduction trajectory (Figure 8) is a good example of what needs to be done to meet the Paris Agreement’s temperature goal. One of the key aspects of the ACT’s target is that emission reduction is legislated, providing a much stronger framework for actually achieving what was promised. The key features of the ACT approach are:
• Setting an appropriate baseline: An initial target of 40% emission reduction by 2020 was based on 1990 levels. The ACT’s emissions in 1990 were about 3,200 kt CO2-e, and in 2020 were 1,918 kt, thus achieving a 40% reduction. Measured against 2012 as a baseline (the peak of ACT emissions) the territory achieved an emission reduction of about 57% in only 8 years.
• Setting interim targets that define the pathway to net zero. Interim targets were legislated to ensure that net zero would be achieved in a timely fashion. The ACT adopted two pathways – high and low ambition pathways – each achieving net zero emissions by 2045. For example, the target range for 2030 is a 65% to 75% reduction on 1990 levels, or a 72% to 80% reduction on 2005 levels. This is consistent with the Climate Council’s science-backed recommendation for Australia of a 75% emission reduction on 2005 levels by 2030.
• Detailed sector-by-sector decarbonisation plans. The ACT Government has developed a detailed decarbonisation plan for all major sectors – electricity (already
14
achieved), transport, public health, built infrastructure, heating and cooling, and waste – that includes specific policies that are built on incentives, regulation and purchasing choices. Monitoring and evaluation are important components of the overall decarbonisation process.
• Carbon budget analysis. The cumulative emissions of the trajectories in Figure 8 are consistent with achieving a 2°C compatible budget, assuming an equal share of the global carbon budget for each human on earth. If we use the more common ‘contract-and-converge’ approach, the ACT trajectory would be equivalent to a ‘well below 2°C’ global goal.
3.2 The Australian Government’s first Nationally Determined Contribution (NDC) under the Paris Agreement
The Australian Government's emission reduction target for 2030 is an example of a very poor and negligent approach to meeting the Paris Agreement’s goals. In fact, the approach adopted by the Australian Government has earned us the label of ‘global laggard’ on climate change in the international community. The analysis below shows why.
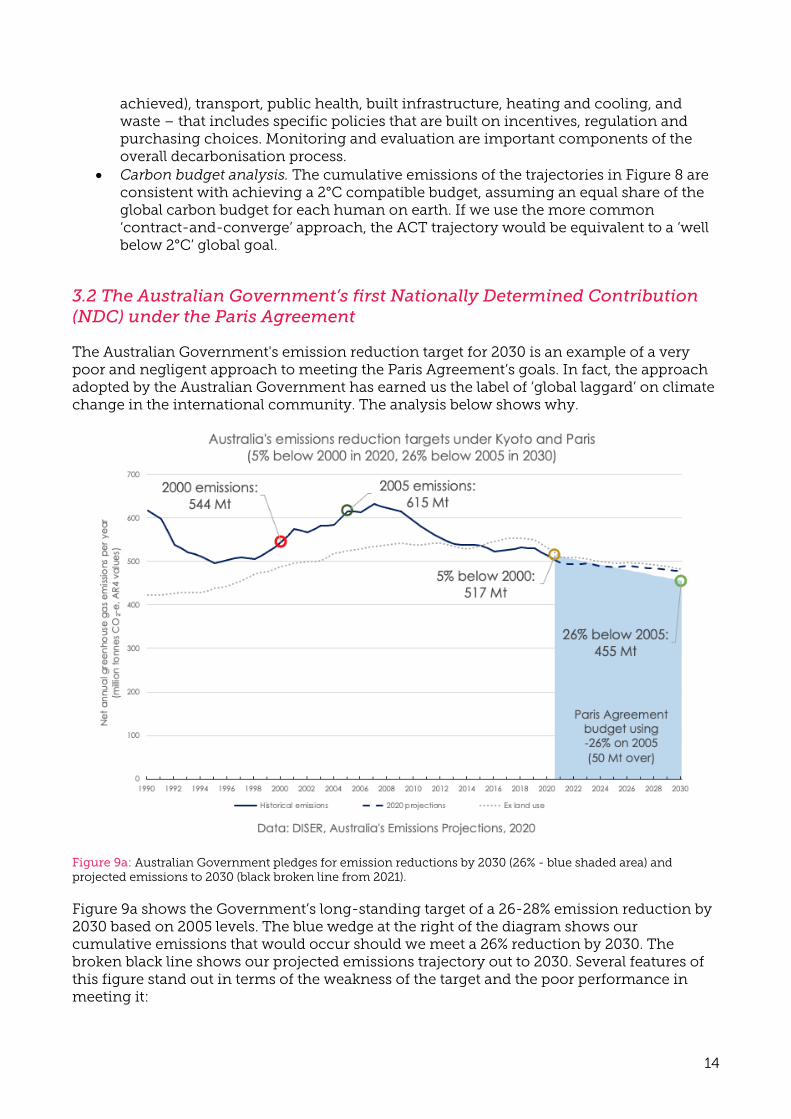
Figure 9a: Australian Government pledges for emission reductions by 2030 (26% - blue shaded area) and projected emissions to 2030 (black broken line from 2021).
Figure 9a shows the Government’s long-standing target of a 26-28% emission reduction by 2030 based on 2005 levels. The blue wedge at the right of the diagram shows our cumulative emissions that would occur should we meet a 26% reduction by 2030. The broken black line shows our projected emissions trajectory out to 2030. Several features of this figure stand out in terms of the weakness of the target and the poor performance in meeting it:
15
• The shaded area is the cumulative emissions that would occur between now and 2030 should we meet our first commitment under the Paris. This amounts to 4,850 Mt CO2-e. This would completely eliminate Australia’s carbon budget for a 1.5°C temperature goal and leave only 1,311 Mt CO2-e of emissions for a 2°C temperature goal. See Climate Targets Panel Report (2021), for details on Australia’s remaining carbon budgets for these targets.
• With emissions remaining high at 455 Mt CO2-e in 2030, it would leave a difficult task for the next generation to meet a net zero by 2050 target, let alone net zero by 2040.
• The analysis reinforces the urgency to reduce emissions now. See Climate Council’s 2021 ‘Aim High, Go Fast’ report.
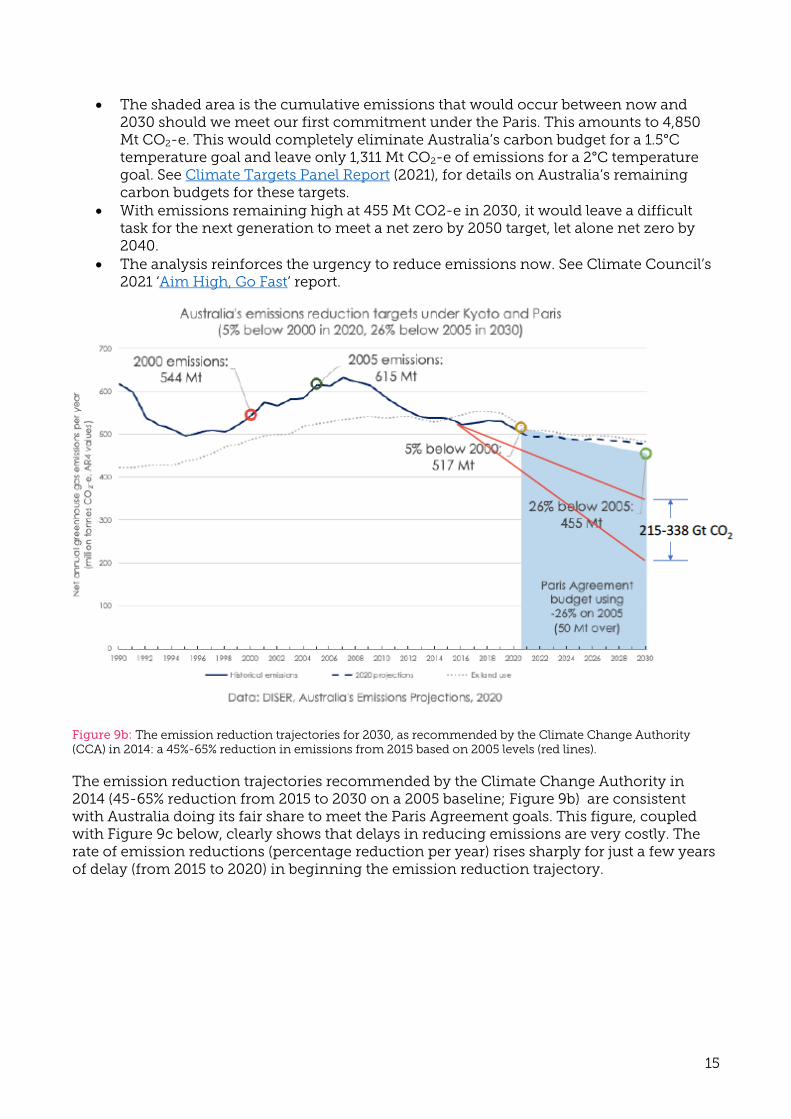
Figure 9b: The emission reduction trajectories for 2030, as recommended by the Climate Change Authority (CCA) in 2014: a 45%-65% reduction in emissions from 2015 based on 2005 levels (red lines).
The emission reduction trajectories recommended by the Climate Change Authority in 2014 (45-65% reduction from 2015 to 2030 on a 2005 baseline; Figure 9b) are consistent with Australia doing its fair share to meet the Paris Agreement goals. This figure, coupled with Figure 9c below, clearly shows that delays in reducing emissions are very costly. The rate of emission reductions (percentage reduction per year) rises sharply for just a few years of delay (from 2015 to 2020) in beginning the emission reduction trajectory.
16
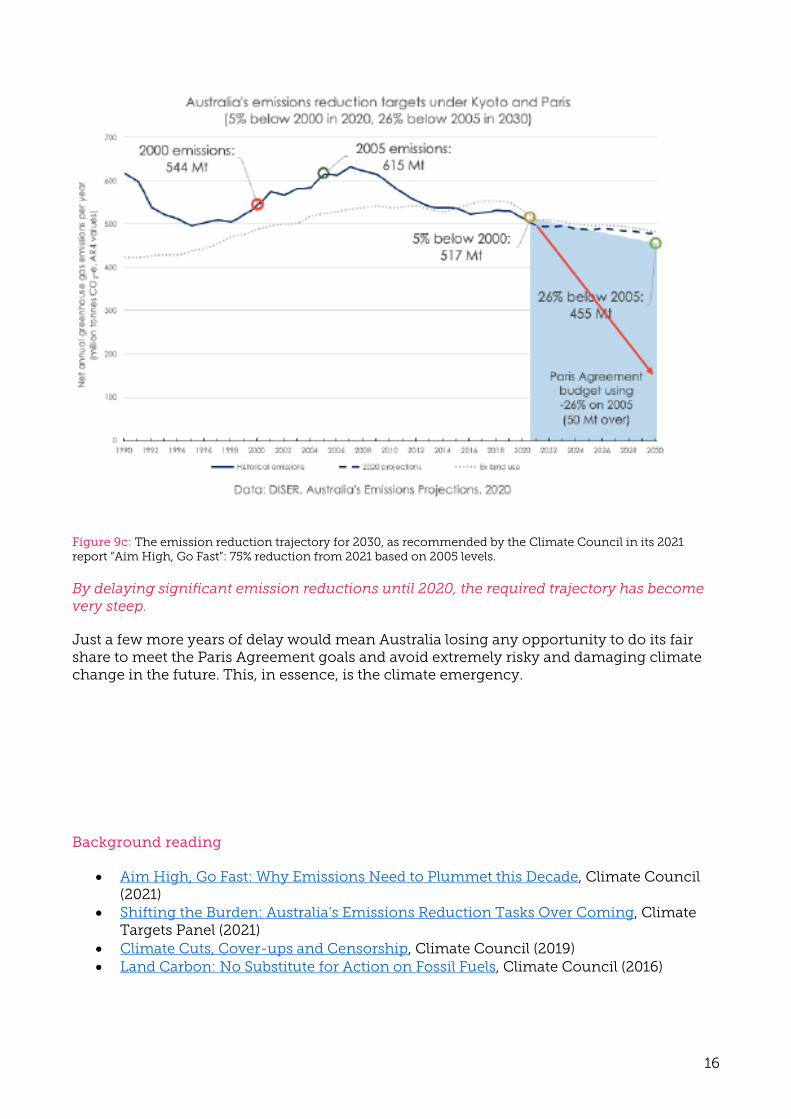
Figure 9c: The emission reduction trajectory for 2030, as recommended by the Climate Council in its 2021 report “Aim High, Go Fast”: 75% reduction from 2021 based on 2005 levels.
By delaying significant emission reductions until 2020, the required trajectory has become very steep.
Just a few more years of delay would mean Australia losing any opportunity to do its fair share to meet the Paris Agreement goals and avoid extremely risky and damaging climate change in the future. This, in essence, is the climate emergency.
Background reading
• Aim High, Go Fast: Why Emissions Need to Plummet this Decade, Climate Council (2021)
• Shifting the Burden: Australia’s Emissions Reduction Tasks Over Coming, Climate Targets Panel (2021)
• Climate Cuts, Cover-ups and Censorship, Climate Council (2019) • Land Carbon: No Substitute for Action on Fossil Fuels, Climate Council (2016)
17
References Allen, M.R. et al., 2009. Warming caused by cumulative carbon emissions towards the trillionth tonne. Nature, 458: 1163-1166. https://www.nature.com/articles/nature08019 Australia’s Climate Change Authority, 2014. Reducing Australia’s Greenhouse Gas Emissions - Targets and Process Review Final Report. https://www.climatechangeauthority.gov.au/sites/default/files/2020-06/Target-Progress-Review/Targets%20and%20Progress%20Review%20Final%20Report.pdf Climate Analytics, 2021. Evaluating the significance of Australia’s global fossil fuel carbon footprint. https://climateanalytics.org/media/australia_carbon_footprint_report_july2019.pdf Climate Council, 2016. Land Carbon: No substitute for action on fossil fuels by Professor Will Steffen, Jacqui Fenwick and Dr Martin Rice. https://www.climatecouncil.org.au/uploads/aadc6ea123523a46102e2be45bfcedc8.pdf Climate Council, 2021. What is carbon capture and storage? https://www.climatecouncil.org.au/resources/what-is-carbon-capture-and-storage/ Collins, M. et al., 2013. Long-term climate change: Projections, commitments and irreversibility. Climate Change 2013: The Physical Science Basis. https://doi.org/10.1017/CBO9781107415324.024 IPCC, 2018. Global Warming of 1.5°C. An IPCC Special Report on the impacts of global warming of 1.5°C above pre-industrial levels and related global greenhouse gas emission pathways, in the context of strengthening the global response to the threat of climate change, sustainable development, and efforts to eradicate poverty. Masson-Delmotte, V., P. Zhai, H.-O. Pörtner, D. Roberts, J. Skea, P.R. Shukla, A. Pirani, W. Moufouma-Okia, C. Péan, R. Pidcock, S. Connors, J.B.R. Matthews, Y. Chen, X. Zhou, M.I. Gomis, E. Lonnoy, T. Maycock, M. Tignor, and T. Waterfield (eds.) https://www.ipcc.ch/sr15/ Macdougall, A. et al., 2020. Is there warming in the Pipeline? A multi-model analysis of the Zero Emissions Commitment from CO2. Biogeosciences, 17: 2987–3016. https://doi.org/10.5194/bg-17-2987-2020 Mackey, B., Prentice, I.C., Steffen, W., House, J, Lindenmayer, D. Keith, H. and Berry, S., 2013. Untangling the confusion around land carbon science and climate change mitigation. Nature, 3: 552-557. https://www.nature.com/articles/nclimate1804 Meinshausen, M. et al., 2009. Greenhouse-gas emission targets for limiting global warming to 2°C. Nature, 458: 1158-1162. https://www.nature.com/articles/nature08017 Rogelj, J., Forster, P., Kriegler, E., Smith, C.J. and Séférian, R., 2019. Estimating and tracking the remaining carbon budget for stringent climate targets. Nature, 571: 335-342. https://www.nature.com/articles/s41586-019-1368-z Willett, W. et al., 2019. Food in the Anthropocene: the EAT-Lancet Commission on healthy diets from sustainable food systems. Lancet, 393: 447-492. https://www.thelancet.com/journals/lancet/article/PIIS0140-6736(18)31788-4/fulltext
About the Climate Council
The Climate Council is an independent non-profit organisation funded by donations by the public. Our mission is to provide authoritative, expert advice to the Australian public on climate change.
To find out more about the Climate Council’s work, visit www.climatecouncil.org.au.