Embed Size (px)
Citation preview

NTIA Report 15-512
Emission Spectrum Measurements of a 3.5 GHz LTE Hotspot
Geoffrey A. Sanders John E. Carroll
Frank H. Sanders Robert L. Sole
Robert J. Achatz
U.S. DEPARTMENT OF COMMERCE • National Telecommunications and Information Administration
report series
NTIA Report 15-512
Emission Spectrum Measurements of a 3.5 GHz LTE Hotspot
Geoffrey A. Sanders John E. Carroll
Frank H. Sanders Robert L. Sole
Robert J. Achatz
U.S. DEPARTMENT OF COMMERCE
February 2015

DISCLAIMER
Certain commercial equipment and materials are identified in this report to specify adequately the technical aspects of the reported results. In no case does such identification imply recommendation or endorsement by the National Telecommunications and Information Administration, nor does it imply that the material or equipment identified is the best available for this purpose.
iii


CONTENTS
Figures............................................................................................................................................ vi
Tables ............................................................................................................................................ vii
Abbreviations and Symbols ......................................................................................................... viii
Executive Summary ....................................................................................................................... xi
1. Introduction ..................................................................................................................................1
2. 3.5 GHz LTE Hotspot Emission Spectrum Measurements .........................................................3 2.1 Stepped-Frequency Emission Spectrum Measurement Technique .......................................3 2.2 LTE Hotspot Emission Spectrum Measurement System .......................................................4 2.3 LTE Hotspot Emission Spectrum Measurement Results .......................................................6 2.4 Comparison of Measurement Results with Proposed FCC Emission Limits ......................12
3. Summary and Conclusions ........................................................................................................14 3.1 Summary of Work and Results ............................................................................................14 3.2 Conclusions ..........................................................................................................................15 3.3 Recommendations for Future Work ....................................................................................15
4. Acknowledgments......................................................................................................................16
5. References ..................................................................................................................................17
v

FIGURES
Figure 1. Block diagram of the RF front end needed for wide dynamic range spectrum measurements. The LTE measurements described in this report were hardline-coupled into a similar measurement system front end. .................................................................................3
Figure 2. Block diagram of the NTIA 3.5 GHz LTE (TDD) spectrum measurement system. .............................................................................................................................................6
Figure 3. Fine structure of the 3.5 GHz LTE hotspot signal across central 9 MHz of spectrum (resolution bandwidth (RBW) = 10 kHz, sample points = 1001, and sweep time = 100 ms). ........................................................................................................................................7
Figure 4. Comparison of LTE peak-detected and RMS center-frequency emissions. .....................8
Figure 5. Comparison of LTE peak-detected and RMS (computed from 1001 samples) spectra across 2.7–4.2 GHz. .............................................................................................................9
Figure 6. Fundamental-frequency LTE emissions in two measurement bandwidths. These data show a 10log(Bmeas) rate of variation with receiver bandwidth. ..............................................9
Figure 7. Wideband (2.7-4.2 GHz) LTE emissions in two measurement bandwidths. The 10log(Bmeas) rate of variation is constant across this frequency range. ..........................................10
Figure 8. LTE hotspot emission spectra at center-tuned (f0) frequencies across LTE Band 42....................................................................................................................................................10
Figure 9. Central 200 MHz of LTE emission spectrum with 50 RBs. ...........................................11
Figure 10. Central 100 MHz of LTE hotspot spectrum with 50, 15, and 10 RBs running. Apparent images of the fundamental develop at ±40 MHz from the fundamental. ......................11
Figure 11. Proposed -13 dBm/MHz emission limit in the CBS band versus measured LTE hotspot emission spectrum. Proposed 30 MHz-wide transitions to -50 dBm/MHz are plotted as if the same LTE spectrum were tuned to the uppermost or lowermost edges of the 3.5 GHz CBS band; the spectrum clearance is 10 dB or more at all points. ...........................12
Figure 12. Proposed emission limits (-13 dBm/MHz in-band, 30 MHz-wide OOB transition, and -40 or -50 dBm/MHz spurious levels) across 3.1-4.1 GHz versus measured LTE hotspot emission spectrum. The -50 dBm/MHz limit clears the measured LTE spectrum by more than 20 dB at all points across this frequency range. .......................................13
vi

TABLES
Table 1. Operating parameters of 3.5 GHz LTE hotspot during spectrum measurements. .............5
Table 2. Measurement parameters used to obtain the data presented in Figures 4–10. ...................7
Table 3. Average P/A over various frequency ranges of the emission spectra shown in Figures 4 and 5. The values in this table have been reduced by 3 dB from what is observed in Figures 4 and 5 to account for the 50% duty cycle of the LTE TDD signal. ...............8
vii

ABBREVIATIONS AND SYMBOLS
APD amplitude probability distribution
CBS Citizens Broadband Service
EMC electromagnetic compatibility
eNodeB evolved node B
EPRE energy per resource element
FCC Federal Communications Commission
FDR frequency dependent rejection
FNPRM Further Notice of Proposed Rulemaking
ITS Institute for Telecommunication Sciences
LNA low noise amplifier
LTE Long Term Evolution
NPRM Notice of Proposed Rulemaking
NSWC Naval Surface Warfare Center
NTIA National Telecommunications and Information Administration
OFDM orthogonal frequency-division multiplexing
OOB out of band
OSM Office of Spectrum Management
P/A peak-to-average ratio
PUSCH physical uplink shared channel
QPSK quadrature phase shift keying
RB resource block
RBW resolution bandwidth
RF radiofrequency
RMS root mean square
viii

RRC radio resource control
SAS spectrum access system
TBSI transfer block size index
TDD time domain duplexing
WAP wireless access point
WLAN wireless local area network
ix


EXECUTIVE SUMMARY
In December of 2012, the Federal Communications Commission (FCC) issued a Notice of Proposed Rulemaking (NPRM) in FCC Docket 12-354 [1], regarding possible future spectrum sharing between radar and non-radar systems in the band 3550–3650 MHz (called here the 3.5 GHz band). A Further NPRM (FNPRM, GN Docket 12-354 [2]) followed in April of 2014. The NPRM documents call for tests and measurements to investigate the compatibility between broadband communications systems and incumbent federal radars operating in that band. As part of ongoing spectrum sharing studies for this band, NTIA’s Office of Spectrum Management (OSM) has studied the electromagnetic characteristics of both the incumbent and yet-to-be-developed government systems in the 3.5 GHz band in the NTIA Fast Track Report [3]. NTIA has further issued four reports addressing measurement results for radar-to-LTE interference ([4] and [5]), LTE-to-radar interference [6], and emission spectrum characteristics of selected incumbent radars [7].
This report extends existing knowledge by presenting detailed emission spectrum measurements of a 3.5 GHz wireless local area network (WLAN) wireless access point (WAP), or hotspot. The hotspot was packaged for indoor use but similar systems could be packaged for outdoor operation. The transmitter’s emission spectrum was measured through a joint effort between NTIA and the U.S. Navy, the measurements having been performed at the Naval Surface Warfare Center (NSWC) at Dahlgren, Virginia.
The spectrum measurement results reported here have been obtained with 110 dB of dynamic range across a frequency range of 1.5 GHz. The emission spectrum of the device is characterized by a fast roll-off down to -85 dBc at 45 MHz from the channel edges, and then a slowly decreasing emission plateau extending 700 MHz above and below the center frequency to the ultimate suppression level of -110 dBc.
Comparison of hotspot spectra measured in resolution bandwidths of 30 kHz to 300 kHz shows that the power coupled into receivers varies as 10log of the receiver bandwidth for both the intentional and unintentional LTE emissions. This information determines the power that such hotspots will couple into receivers having any given bandwidth (e.g., 1 MHz). Emission spectra were also measured as a function of the tuned frequency of the hotspot (ranging from 3400 MHz to 3600 MHz, which is the full range of LTE Band 42) and as a function of the number of LTE resource blocks (RBs) used by the data link (ranging from as few as 10 to as many as 50 RBs).
The measured out-of-band (OOB) and spurious emissions of the hotspot are compared to proposed [2] emission limits across 1.5 GHz of spectrum. The hotspot emissions are shown to meet the proposed limits by 10 dB or more at all points.
The data presented in this report may be used to advance 3.5 GHz spectrum sharing studies by providing the emission characteristics of a 3.5 GHz LTE hotspot across a wide frequency range and wide dynamic range under conditions of a variety of possible incumbent (e.g., radar) receiver bandwidths, tuned LTE frequencies, and number of utilized LTE RBs.
xi
EMISSION SPECTRUM MEASUREMENTS OF A 3.5 GHZ LTE HOTSPOT
Geoffrey A. Sanders1, John E. Carroll1, Frank H. Sanders1, Robert L. Sole2, Robert J. Achatz1
In response to proposals to introduce new Long Term Evolution (LTE) radio systems into the 3550–3650 MHz (called 3.5 GHz) portion of radio spectrum in the United States, a joint team of National Telecommunications and Information Administration (NTIA) and U.S. Navy electronics engineers performed emission spectrum measurements on a 3.5 GHz (LTE Band 42) wireless access point (WAP), or hotspot. The hotspot was packaged for indoor use but similar systems could be deployed outdoors. The authors measured the hotspot emission spectrum with 110 dB of dynamic range across 1.5 GHz of spectrum (from 2.7 to 4.2 GHz). Other data outputs include: spectra measured with the device tuned to its lowest, highest, and middle available operational frequencies; comparative peak-to-average spectra; and spectra measured when the hotspot was operated with 10, 15, and 50 resource blocks. The emission spectrum is plotted against proposed in-band, out-of-band (OOB) and spurious emission limits; the spectrum meets those limits by at least 10 dB at all points. The results presented here may be used in electromagnetic compatibility analyses for future 3.5 GHz spectrum sharing between LTE-based transmitters and incumbent systems such as radar receivers.
Keywords: 3.5 GHz band; LTE Band 42; band sharing; electromagnetic compatibility (EMC); Long Term Evolution (LTE); emission limits; NTIA Fast Track Report; out-of-band (OOB) emissions; radar; resource blocks (RBs); spectrum measurement; spectrum sharing; spurious emissions; wireless access point (WAP); wireless local area network (WLAN)
1. INTRODUCTION
In December of 2012, the Federal Communications Commission (FCC) issued a Notice of Proposed Rulemaking (NPRM) in FCC Docket 12-354 [1], regarding possible future spectrum sharing between radar and non-radar systems in the band 3550–3650 MHz (called here the 3.5 GHz band). A Further NPRM (FNPRM, GN Docket 12-354 [2]) followed in April of 2014. The FCC documents call for tests and measurements to investigate the compatibility of broadband communications systems and incumbent federal radars in that band. The new 3.5 GHz communication systems envisioned for the 3.5 GHz band will be Long Term Evolution (LTE) microcells deployed at terrestrial locations.
1 These authors are with the Institute for Telecommunication Sciences, National Telecommunications and Information Administration, U.S. Dept. of Commerce, 325 Broadway, Boulder, CO 80305. 2 The author is with the Office of Spectrum Management, National Telecommunications and Information Administration, U.S. Dept. of Commerce, 1401 Constitution Ave., NW, Washington, DC, 20021.

As part of ongoing spectrum sharing studies for this band, NTIA’s Office of Spectrum Management (OSM) has studied electromagnetic compatibility (EMC) characteristics of both incumbent and yet-to-be-developed government systems in the 3.5 GHz band [3]. Government systems in the band include, but are not limited to, radars. As a follow-on to [3], NTIA has published four recent reports addressing measurement results for radar-to-LTE interference [4], [5], LTE-to-radar interference [6], and incumbent radar emission characteristics [7]. This report extends this body of work by examining in detail the emission characteristics of a 3.5 GHz LTE wireless local area network (WLAN) wireless access point (WAP), or hotspot.3 The measurements have been performed in adherence to the best-practices criteria provided in [8].4 A description of the LTE physical layer and TDD can be found in [9]. These data are intended to advance spectrum-sharing studies for the 3.5 GHz band.
Spectrum sharing studies require EMC analyses that are based on detailed, wide dynamic range measurements of emissions from individual transmitter types that are to share spectrum with each other. Such measurements show the rate of roll-off of transmitted emissions as a function of off-tuning from transmitter center frequencies, e.g., that a transmitter’s emission levels might be reduced by 85 dB relative to the power at the fundamental when a receiver is off-tuned from the fundamental by, say, 50 MHz.
It is sometimes suggested that emission measurements are not needed because it can be assumed that transmitters will operate at emission mask limits. This assumption is frequently false. As demonstrated in [10], for example, radar out-of-band (OOB) and spurious emissions are usually substantially lower than emission mask limits, often by tens of decibels. Previous measurements of broadband communication transmitters have shown this is true for them as well, in regards to FCC emission limits [11]. In the authors’ experience, this holds true for non-radar transmitters as well. EMC studies that assume that transmitter emissions are as high as emission mask limits will overestimate the power levels of most transmitters’ OOB and spurious emissions and thus may also overestimate required frequency and distance separations needed for compatible operations between systems.
The only way to accurately ascertain the OOB and spurious emission levels of transmitters for EMC analyses is to actually measure those emissions. The authors performed such a set of radiated measurements in November 2014 on emissions of a 3.5 GHz LTE hotspot at the Naval Surface Warfare Center (NSWC) at Dahlgren, Virginia. The results of those spectrum measurements are presented here.
3 This device was not FCC type-accepted, as rules permitting its operation in the 3550-3650 MHz band are not final. It is not available for retail sale to the public, broadband service providers in the United States do not offer service for it, and it would be illegal to operate within the United States. It was purchased by Virginia Polytechnic Institute and State University (Virginia Tech) for research purposes and was loaned to the U.S. Navy for these measurements. It was operated indoors under a short-term FCC experimental license and its operation was coordinated with the Navy. 4 Adapted from a radar emission measurement procedure to an LTE emission measurement procedure, as described further below.
2

2. 3.5 GHZ LTE HOTSPOT EMISSION SPECTRUM MEASUREMENTS
2.1 Stepped-Frequency Emission Spectrum Measurement Technique
EMC analyses often require emission spectrum measurements with a dynamic range of 100 dB or more. Available measurement instrumentation often does not achieve such wide dynamic ranges. This includes swept-frequency and high-speed time-domain sampling systems. To overcome this limitation and achieve dynamic ranges of as much as 120 dB in radar emission measurements, a measurement system with the characteristics described in [8] needs to be used.
As described in [8] and shown in Figure 1, the measurement system requires a radio frequency (RF) front end with three major components: a variable RF attenuator, a tunable bandpass filter, and a low-noise amplifier (LNA). The RF attenuator extends the dynamic range of the measurement system, the bandpass filter rejects high-power radar power when the measurement system is off-tuned from the radar fundamental frequency, and the LNA provides a low measurement system noise figure (high sensitivity to weak signals) in low-power portions of the radar emission spectrum.
Figure 1. Block diagram of the RF front end needed for wide dynamic range spectrum measurements. The LTE measurements described in this report were hardline-coupled into a
similar measurement system front end.
3
The key to operation of the measurement system is to step across the emission spectrum one frequency at a time. Stepping means tuning the measurement system to a single frequency and then waiting long enough at that frequency for the transmitter (in this case an LTE system) to provide a statistically representative number of samples from which a root mean square (RMS) average power on that frequency may be computed. For LTE transmitters this interval has been found empirically to be 0.5 seconds or longer. When a measurement has been completed at a tuned frequency, the measurement system is tuned (stepped) to the next frequency to be measured. The frequency interval between tuning steps is usually equal to the resolution bandwidth of the measurement system.
The stepped-frequency measurement process is described in detail in [8] for radars. For LTE measurements, the radar process is adapted as follows. Instead of running the spectrum analyzer in peak detection mode, the measurement system is operated in a sample-detection mode. In sampling mode, power levels are sampled randomly and recorded for the entire step interval at a single frequency. At the end of the step interval, the RMS power level of those samples is computed, and the RMS power level is plotted as a single data point in the resulting measured spectra at the measured frequency. This RMS measurement process is repeated at each frequency step in the spectrum, as described in [8]. For these LTE measurements, the bulk of measured spectra were collected as RMS only; the RMS spectrum points were measured as the average of 1001 sample-detected points collected over an interval of 0.5 seconds at each measured frequency step. For comparison (Figure 4), one measurement was performed using the standard peak detection method described in [8].
Because stepped-frequency emission spectra are measured a single frequency at a time, the amount of attenuation invoked at the RF front end can be gradually adjusted as the measurement frequency steps progress across the spectrum. Zero attenuation is used in the lowest-power parts of the spectrum, maximum attenuation is used at the transmitter’s center frequency, and intermediate amounts of attenuation are used at points in-between. If a measurement system has 60 dB of instantaneous dynamic range and a 70 dB step attenuator is built into the RF front end (Figures 1 and 2), the total measurement dynamic range can be as much as (60 dB + 70 dB) = 130 dB. In practice, it is rare to achieve more than 120 dB due to the lack of available power from even the highest-power transmitters. In this measurement series, the authors achieved 110 dB of dynamic range, again limited only by lack of power (+20.5 dBm) from the transmitter.
2.2 LTE Hotspot Emission Spectrum Measurement System
The authors performed the 3.5 GHz LTE hotspot emission spectrum measurement with a suitcase NTIA system; a block diagram of the measurement system is shown in Figure 2. The hotspot was time domain duplexed (TDD) and thus operated co-channel with its evolved Node B (eNodeB).5 The hotspot parameters during the measurement are shown in Table 1.
To separate the hotspot signal from the co-channel eNodeB signal for the spectrum measurement, we inserted a pair of directional RF circulators between the hotspot and the eNodeB as shown in Figure 2. The hotspot and eNodeB signals were thus forced to run in a loop
5 A Rohde and Schwartz CMW-500 operating in its eNodeB mode.
4

between the two LTE units, with the hotspot signal on one side of the loop and the eNodeB signal on the loop’s other side. The measurement system took the hotspot signal from an RF splitter in the hotspot side of the loop. The splitter had 4 dB of insertion loss; a 4 dB attenuator was inserted between the circulators to ensure balanced RF path loss on both sides of the circulator loop. The measurement system noise figure from the input to the RF front end (Figure 2) was approximately 8 dB. The gain of the measurement system was approximately 24 dB.
Table 1. Operating parameters of 3.5 GHz LTE hotspot during spectrum measurements.
Hotspot Parameter Parameter Value
Duplexing time division (TDD) with 50% duty cycle
RF Modulation quadrature phase shift keying (QPSK)
Operating Radio Band LTE Band 42 (3400-3600 MHz tuning range)
Commanded Full Cell Bandwidth 10.0 MHz (with 9 MHz actually occupied when 50 RBs were running)
Measured Total Output Power at Antenna Port +20.5 dBm (measured with an external power meter across full LTE bandwidth of 9 MHz)
Resource Block (RB) energy per resource element (EPRE) -100.0 dBm/15 kHz (indicated by eNodeB)
Full Cell Power -72.2 dBm (indicated by eNodeB)
Physical Uplink Shared Channel (PUSCH) open loop +23.0 dBm (indicated by eNodeB)
PUSCH closed loop +30.0 dBm (indicated by eNodeB)
Switching packet
State Radio resource control (RRC)
Transfer block size index (TBSI) (downlink) 9
TBSI (uplink) 6
Start Resource Block 0
Downlink Throughput (50 RBs) 4.795 Mbit/sec
Uplink Throughput (50 RBs) 2.064 Mbit/sec
Protocol Internet Protocol version 4
Antenna Gain Antenna not used during measurements
5

Figure 2. Block diagram of the NTIA 3.5 GHz LTE (TDD) spectrum measurement system.
2.3 LTE Hotspot Emission Spectrum Measurement Results
The 3.5 GHz LTE hotspot emission spectrum measurement results are shown in Figures 3–10. Figure 3 shows fine structure in the center frequency portion of the hotspot spectrum, as measured in a 10 kHz resolution bandwidth (RBW) with peak detection and a 100 ms sweep time. Table 2 provides measurement parameters used to obtain the spectra in Figures 4–10.
Figures 4 and 5 show the peak-to-average (P/A) ratio of the LTE signal. Table 3 gives the mean P/A for different regions of the spectra. The values in Table 3 have been lowered by 3 dB from what is observed in Figures 4 and 5 to account for the 50% duty cycle of the LTE TDD signal.
Figures 6 and 7 show the variation in measured LTE power as a function of measurement (or receiver) bandwidth. This ratio is 10log(Bmeas), where Bmeas is measurement bandwidth. In other words, measured LTE power levels are directly proportional to measurement (or receiver) bandwidths across the on-tuned, out-of-band (OOB) and spurious spectrum regions.
Figure 8 shows the LTE spectrum as a function of center-tuned frequencies across LTE Band 42 (from 3400 to 3600 MHz). The plateau that extends more than 700 MHz on either side of the center frequencies does not change even when the operational frequencies are shifted.
Figure 9 shows the central 200 MHz of the hotspot spectrum when 50 resource blocks (RB) are running. A single resource block is composed of 12 consecutive 15 kHz-wide orthogonal frequency-division multiplexed (OFDM) sub-carriers, resulting in a 180 kHz-wide OFDM
6

carrier lasting 0.5 milliseconds. This graph shows that the -85 dB roll-off to the wideband spectrum plateau occurs within ±50 MHz of the LTE hotspot center frequency. Figure 10 shows changes that occur in the central 100 MHz of the hotspot spectrum as the number of RBs decreases to 15 and 10 from a full 50. Apparent images of the fundamental develop at ±40 MHz from the fundamental as the RBs decrease.
Figure 3. Fine structure of the 3.5 GHz LTE hotspot signal across central 9 MHz of spectrum (resolution bandwidth (RBW) = 10 kHz, sample points = 1001, and sweep time = 100 ms).
Table 2. Measurement parameters used to obtain the data presented in Figures 4–10.
Figure(s) Data Line
RBW (kHz)
Dwell time per point (ms)
Points to calculate
RMS Detector
Noise Floor (dBm)
Video Bandwidth
(VBW) (kHz)
4 and 5 Peak 300 500 N/A Peak -101 1000 RMS 300 500 1001 Sample -111 1000
6 and 7 30 kHz 30 500 1001 Sample -121 1000 300 kHz 300 500 1001 Sample -111 1000
8 All 300 500 1001 Sample -111 1000 9 All 300 500 1001 Sample -111 1000 10 All 300 500 1001 Sample -111 1000
7

Table 3. Average P/A over various frequency ranges of the emission spectra shown in Figures 4 and 5. The values in this table have been reduced by 3 dB from what is observed in Figures 4 and
5 to account for the 50% duty cycle of the LTE TDD signal.
Frequency Range (GHz) Average P/A (dB) Notes 2.7–3.36 and 3.64–4.2 12.17 Level part of spectrum 85 dB below center
3.36–3.45 and 3.55–3.64 15.88 Hump at base of roll-off 3.45–3.495 and 3.505–3.55 16.49 Steep roll-off region
3.495–3.505 10.87 Necessary bandwidth
Figure 4. Comparison of LTE peak-detected and RMS center-frequency emissions.
8
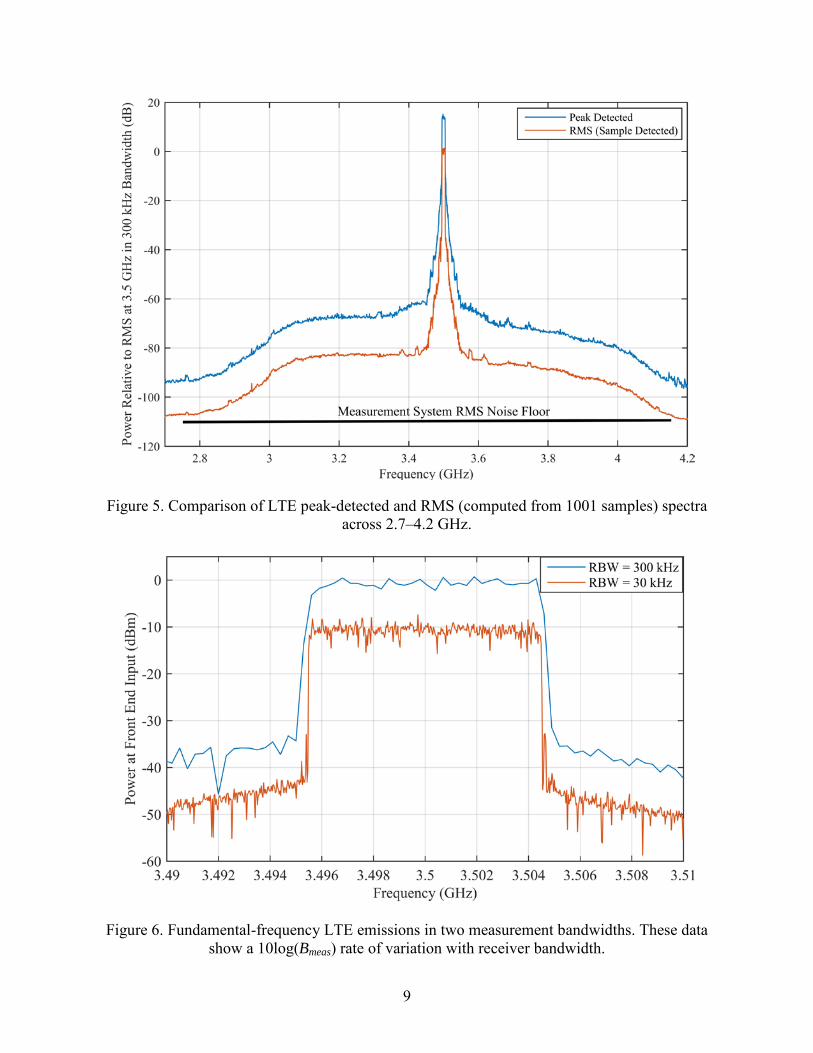
Figure 5. Comparison of LTE peak-detected and RMS (computed from 1001 samples) spectra across 2.7–4.2 GHz.
Figure 6. Fundamental-frequency LTE emissions in two measurement bandwidths. These data show a 10log(Bmeas) rate of variation with receiver bandwidth.
9
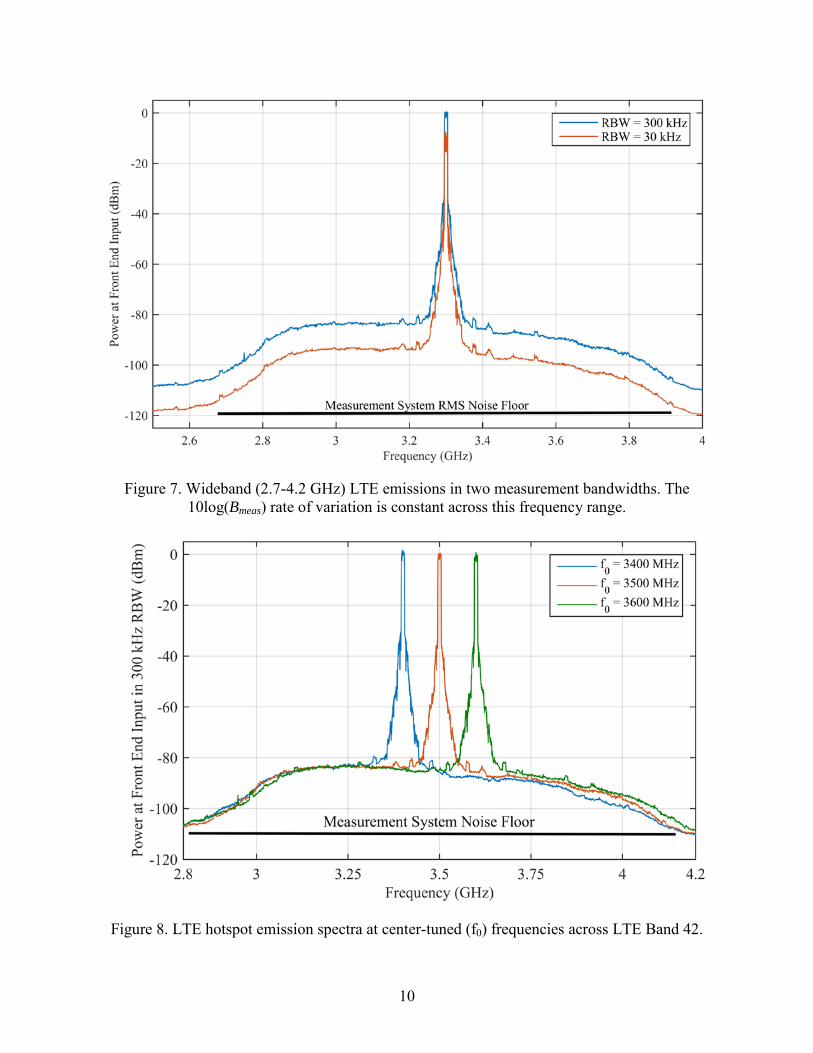
Figure 7. Wideband (2.7-4.2 GHz) LTE emissions in two measurement bandwidths. The 10log(Bmeas) rate of variation is constant across this frequency range.
Figure 8. LTE hotspot emission spectra at center-tuned (f0) frequencies across LTE Band 42.
10

Figure 9. Central 200 MHz of LTE emission spectrum with 50 RBs.
Figure 10. Central 100 MHz of LTE hotspot spectrum with 50, 15, and 10 RBs running. Apparent images of the fundamental develop at ±40 MHz from the fundamental.
11

2.4 Comparison of Measurement Results with Proposed FCC Emission Limits
The FCC has proposed possible OOB and spurious-region emission limits for new 3.5 GHz systems [2]. The proposal is for a limit of -13 dBm/MHz running from the channel edges to lower and upper Citizens Broadband Service (CBS) band edges, respectively, at 3550 MHz and 3650 MHz. Two transition regions of 30 MHz are proposed for 3520–3550 MHz and 3650–3680 MHz, to an ultimate suppression level of either -40 or -50 dBm/MHz below and above 3520 and 3680 MHz, respectively.
Figure 11 shows the -13 dBm/MHz limit in a close-up view near the LTE channel edges when the hotspot was tuned to 3600 MHz. Figure 12 shows a larger-scale view that includes the transition regions and the proposed ultimate suppression levels across 1 GHz of spectrum (3.1–4.1 GHz) when the hotspot was tuned to 3600 MHz at the center of the proposed CBS 3.5 GHz band.
In Figure 11 the proposed 30 MHz wide transitions are plotted against the measured spectrum as if the LTE hotspot had been tuned to either the uppermost or lowermost edges of the proposed 3.5 GHz CBS band, along with the proposed -50 dBm/MHz ultimate spurious emission limit. The proposed band-edge limit is always 10 dB or more above the measured emission power.
Figure 11. Proposed -13 dBm/MHz emission limit in the CBS band versus measured LTE hotspot emission spectrum. Proposed 30 MHz-wide transitions to -50 dBm/MHz are plotted as if
the same LTE spectrum were tuned to the uppermost or lowermost edges of the 3.5 GHz CBS band; the spectrum clearance is 10 dB or more at all points.
12

Figure 12. Proposed emission limits (-13 dBm/MHz in-band, 30 MHz-wide OOB transition, and -40 or -50 dBm/MHz spurious levels) across 3.1-4.1 GHz versus measured LTE hotspot
emission spectrum. The -50 dBm/MHz limit clears the measured LTE spectrum by more than 20 dB at all points across this frequency range.
In Figure 12, the proposed ultimate suppression limit of -50 dBm/MHz is always 20 dB or more above the measured 3.5 GHz LTE hotspot emission power at all points between 3100–3520 MHz and 3680–4100 MHz. Taken together with the data in Figure 11, where the band-edge transitions are plotted against the spectrum as if the hotspot were tuned to the uppermost or lowermost edges of the proposed 3.5 GHz CBS band, the most stringent proposed limits in [2] would be met by this hotspot device at all spectrum points, no matter where the hotspot might be tuned in the CBS band, with a clearance between the measured spectrum and the proposed mask limits of 10 dB or more at all points.
13

3. SUMMARY AND CONCLUSIONS
3.1 Summary of Work and Results
NTIA, working with the U.S. Navy Naval Surface Warfare Center (NSWC), has measured the emissions of an LTE (TDD) 3.5 GHz wireless access point (WAP), or hotspot as a function of tuned center frequency, resolution (receiver) bandwidth, detection type (peak vs. RMS), and number of RBs. These measured spectra may be used to develop frequency dependent rejection (FDR) curves for future EMC analyses. They may also be used in the development of spectrum sharing criteria and rules in a future Spectrum Access System (SAS) for the 3.5 GHz band.
Our findings are as follows:
• Table 3 provides the P/As measured with the spectrum analyzer peak detector and the RMS average of 1001 samples. The P/As are approximately 10 dB in the 10 MHz channel (3495–3505 MHz) and greater than 10 dB outside the 10 MHz channel. When the peak and average are both measured with a very large sample size (≈1,000,000 samples), the P/A of Gaussian noise is approximately 10 dB. Consequently it would appear that the emissions in the 10 MHz channel are similar to Gaussian noise and those outside it are non-Gaussian.6
• The measured variation in measured LTE power as a function of measurement (or receiver) bandwidth is 10log(Bmeas), where Bmeas is the measurement bandwidth. In other words, measured (or received) LTE power levels are directly proportional to measurement (or receiver) bandwidths. This relationship holds for the on-tuned, OOB and spurious regions of the LTE spectrum. This result allows the data in this report to be extrapolated to received power in any given receiver bandwidth (e.g., 1 MHz).
• The central 100 MHz of the 3.5 GHz LTE hotspot spectrum is characterized by a fast 85 dBc roll-off from the full power level in the intentional emission (channel) bandwidth of 10 MHz, reaching that point within ±50 MHz of the tuned center frequency. That is, the initial -85 dBc roll-off occurs within ±45 MHz of the channel edges.
• Outside its central 100 MHz, where it reaches a level of -85 dBc, the LTE hotspot emission spectrum is characterized by a broad plateau that slowly decreases across ±700 MHz above and below the -85 dBc roll-off points, to a level of about -110 dBc at ±750 MHz from the tuned center frequency.
• The central 100 MHz of the hotspot spectrum varies as a function of the number of RBs that are utilized. Bumps that appear to be images of the fundamental develop in the spectrum as the number of RBs decreases below 50; the apparent images become more pronounced with
6 If both the peak and average are calculated from the 1001 samples collected for the RMS statistic, as opposed to using the peak detector data for the peak, different P/As are computed from those presented in Table 3. The P/A in the 10 MHz channel becomes 6.5 dB, which is significantly less than the expected 8.5 dB P/A for Gaussian noise computed from 1001 points. Outside the 10 MHz channel the P/A was what would be expected from 1001 samples of Gaussian noise. This demonstrates the inadequacy of the P/A statistics in determining whether a signal has Gaussian noise characteristics. A better way is to use the entire amplitude probability distribution (APD) as was done in, [6], where the APDs were found to closely resemble those of Gaussian noise within the 10 MHz channel and outside it.
14

decreasing numbers of RBs; they are spaced ±40 MHz from the fundamental. These apparent images do not occur at power levels that would exceed the emission limits proposed by the FCC for the 3.5 GHz band.
3.2 Conclusions
Our results for this 3.5 GHz hotspot are consistent with other measurement results that NTIA has obtained on FCC-approved LTE and WiMAX transmitters that operate in the band 2550–2685 MHz. This includes the feature of a fast drop-off at channel edges of 60 to 85 dB, followed by wide, nearly flat emissions plateaus beyond the initial fast roll-off points.
The data presented in this report, and similar data to be collected in the future on other 3.5 GHz transmitters (see below) may be used to determine the amount of off-tuning required to reduce emissions from LTE transmitters to given protection levels required for incumbent (e.g., radar) receivers in the 3.5 GHz band. This information might, for example, be programmed into spectrum-sharing protocols in an FCC-proposed ([1] and [2]) 3.5 GHz SAS. Such protocols, based on these emission spectrum measurements, would include minimum off-tuning requirements in cases in which co-channel operations between LTE transmitters and incumbent receivers might not be possible.
3.3 Recommendations for Future Work
NTIA would like to perform additional work in this area, including:
• Investigate emission APDs as in [6] to determine how closely they resemble those of Gaussian noise. Results of this investigation are important for interference modeling purposes.
• Measure the emissions of macro and small-cell LTE base stations (i.e., eNodeB units) that will or can operate in the 3.5 GHz band.
• Measure the emissions of point-to-point transmitters that will or can operate in the 3.5 GHz band.
• Measure the emissions of more consumer grade hotspot and portable transmitters that will or can operate in the 3.5 GHz band.
• Measure the susceptibility of the LTE receivers to saturation and overload effects from high-powered pulsed emitters that operate in the 3.5 GHz band and adjacent bands as well.
• Publish the results of the measurements for public release.
It is difficult to obtain these devices for the further work described above, as the FCC rules are not final and manufacturers are not able to market or sell them within the United States. However, NTIA is willing to work with manufacturers as they develop their 3.5 GHz products, and will perform measurements on their emission characteristics as they move towards FCC approval if access can be arranged.
15
4. ACKNOWLEDGMENTS
We gratefully acknowledge the assistance and support of the following personnel and organizations; their support made this report’s work possible. Virginia Tech loaned the 3.5 GHz LTE hotspot to the Navy for our emission spectrum measurements. The Naval Surface Warfare Center (NSWC) at Dahlgren, Virginia, provided lab space for the measurements and coordinated the availability of the hotspot and support personnel from the Rohde & Schwartz Company for the measurements. We especially recognize the contributions of Bruce Naley and Mike Mearns of NSWC in organizing and supporting this work, both administratively and technically. Rohde & Schwartz provided personnel, Bill Bock and Dan Togni, who were highly knowledgeable in the operation of the Rohde & Schwartz CMW-500 that was operated as the hotspot’s eNodeB during the measurements. Bill Bock also pointed out the desirability of observing the LTE emission spectrum as a function of the number of resource blocks in use.
16

5. REFERENCES
[1] Federal Communications Commission, “Proposal to Create a Citizen’s Broadband Service in the 3550-3650 MHz Band,” FCC Docket No. 12-354, 12 Dec. 2012. http://www.fcc.gov/document/enabling-innovative-small-cell-use-35-ghz-band-nprm-order
[2] Federal Communications Commission, “Amendment to the Commission’s Rules with Regard to Commercial Operations in the Band 3550-3650 MHz,” FCC Gaussian noise Docket No. 12-354, 23 Apr. 2014. http://apps.fcc.gov/ecfs/document/view?id=7521099242
[3] U.S. Dept. of Commerce, National Telecommunications and Information Administration, “An Assessment of the Near-Term Viability of Accommodating Wireless Broadband Systems in the 1675-1710 MHz, 1755-1780 MHz, 3500-3650 MHz, 4200-4220 MHz and 4380-4400 MHz Bands (President's Spectrum Plan Report),”Oct. 2010. http://www.ntia.doc.gov/files/ntia/publications/fasttrackevaluation_11152010.pdf
[4] Sanders, F. H., J. E. Carroll, G. A. Sanders and R. L. Sole, “Effects of Radar Interference on LTE Base Station Receiver Performance”, NTIA Technical Report TR-14-499, U.S. Dept. of Commerce, Dec. 2013. http://www.its.bldrdoc.gov/publications/2742.aspx
[5] Sanders, G. A., J. E. Carroll, G. A. Sanders and R. L. Sole, “Effects of Radar Interference on LTE (FDD) eNodeB and UE Receiver Performance in the 3.5 GHz Band”, NTIA Technical Report TR-14-506, U.S. Dept. of Commerce, Jul. 2014. http://www.its.bldrdoc.gov/publications/2759.aspx
[6] Sanders, F. H., J. E. Carroll, G. A. Sanders, R. L. Sole, R. J. Achatz and L. S. Cohen, “EMC Measurements for Spectrum Sharing Between LTE Signals and Radar Receivers”, NTIA Technical Report TR-14-507, U.S. Dept. of Commerce, Jul. 2014. http://www.its.bldrdoc.gov/publications/2760.aspx
[7] Sanders, F. H., J. E. Carroll, G. A. Sanders and L. S. Cohen, “Measurements of Selected
Naval Radar Emissions for Electromagnetic Compatibility Analyses”, NTIA Technical Report TR-15-510, U.S. Dept. of Commerce, Oct. 2014. http://www.its.bldrdoc.gov/publications/2781.aspx
[8] Sanders, F. H., R. L. Hinkle and B. J. Ramsey, “Measurement Procedures for the Radar
Spectrum Engineering Criteria (RSEC)”, NTIA Technical Report TR-05-420, U.S. Dept. of Commerce, Mar. 2005. http://www.its.bldrdoc.gov/publications/2450.aspx
[9] Toskala and T. Luntilla, “Introduction to OFDMA and SC-FDMA and to MIMO in LTE”, Chapter 4 in LTE for UMTS: Evolution to LTE-Advanced, Second Edition, John Wiley and Sons Ltd., West Sussex, United Kingdom, 2011.
[10] Matheson, R. J., J. D. Smilley, G. D. Falcon and V. S. Lawrence, “Output Tube Emission Characteristics of Operational Radars”, NTIA Technical Report TR-82-92, U.S. Dept. of Commerce, Jan. 1982. http://www.its.bldrdoc.gov/publications/2081.aspx
17

[11] Sanders, F. H., R. L. Sole, J. E. Carroll, G. S. Secrest and T. L. Allmon, “Analysis and Resolution of RF interference to Radars Operating in the Band 2700–2900 MHz from Broadband Communication Transitters”, NTIA Technical Report TR-13-490, U.S. Dept. of Commerce, Jan. 1982. http://www.its.bldrdoc.gov/publications/2684.aspx
18

NTIA FORM 29 U.S. DEPARTMENT OF COMMERCE (4-80) NATIONAL TELECOMMUNICATIONS AND INFORMATION ADMINISTRATION
BIBLIOGRAPHIC DATA SHEET
1. PUBLICATION NO.
2. Government Accession No.
3. Recipient’s Accession No.
4. TITLE AND SUBTITLE Emission Spectrum Measurements of a 3.5 GHz LTE Hotspot
5. Publication Date 6. Performing Organization Code NTIA ITS.T/NTIA OSM
7. AUTHOR(S) Geoffrey A. Sanders, John E. Carroll, Frank H. Sanders, Robert L. Sole
9. Project/Task/Work Unit No. 6469000-200 8. PERFORMING ORGANIZATION NAME AND ADDRESS
Institute for Telecommunication Sciences National Telecommunications & Information Administration U.S. Department of Commerce 325 Broadway Boulder, CO 80305
10. Contract/Grant Number.
11. Sponsoring Organization Name and Address National Telecommunications & Information Administration Herbert C. Hoover Building 14th & Constitution Ave., NW Washington, DC 20230
12. Type of Report and Period Covered
14. SUPPLEMENTARY NOTES 15. ABSTRACT (A 200-word or less factual summary of most significant information. If document includes a significant bibliography or literature survey, mention it here.) In response to proposals to introduce new Long Term Evolution (LTE) radio systems into the 3550–3650 MHz (called 3.5 GHz) portion of radio spectrum in the United States, a joint team of National Telecommunications and Information Administration (NTIA) and U.S. Navy electronics engineers performed emission spectrum measurements on a 3.5 GHz (Band 42) wireless access point (WAP), or hotspot. The hotspot was packaged for indoor use but similar systems could be deployed outdoors. The authors measured the hotspot emission spectrum with 110 dB of dynamic range across 1.5 GHz of spectrum (from 2.7 to 4.2 GHz). Other data outputs include: spectra measured with the device tuned to its lowest, highest and middle available operational frequencies; comparative peak-to-average spectra; and spectra measured when the hotspot was operated with 10, 15 and 50 resource blocks. The emission spectrum is plotted against proposed in-band, out-of-band (OOB) and spurious emission limits; the spectrum meets those limits by at least 10 dB at all points. The results presented here may be used in electromagnetic compatibility analyses for future 3.5 GHz spectrum sharing between LTE-based transmitters and incumbent systems such as radar receivers. 16. Key Words (Alphabetical order, separated by semicolons) 3.5 GHz band; Band 42; band sharing; electromagnetic compatibility (EMC); Long Term Evolution (LTE); emission limits; NTIA Fast Track Report; out-of-band (OOB) emissions; radar; resource blocks (RBs); spectrum measurement; spectrum sharing; spurious emissions; wireless access point (WAP); wireless local area network (WLAN) 17. AVAILABILITY STATEMENT UNLIMITED. FOR OFFICIAL DISTRIBUTION.
18. Security Class. (This report)
Unclassified
20. Number of pages 35
19. Security Class. (This page)
Unclassified
21. Price: n/a
NTIA FORMAL PUBLICATION SERIES NTIA MONOGRAPH (MG)
A scholarly, professionally oriented publication dealing with state-of-the-art research or an authoritative treatment of a broad area. Expected to have long-lasting value.
NTIA SPECIAL PUBLICATION (SP)
Conference proceedings, bibliographies, selected speeches, course and instructional materials, directories, and major studies mandated by Congress.
NTIA REPORT (TR)
Important contributions to existing knowledge of less breadth than a monograph, such as results of completed projects and major activities.
JOINT NTIA/OTHER-AGENCY REPORT (JR)
This report receives both local NTIA and other agency review. Both agencies’ logos and report series numbering appear on the cover.
NTIA SOFTWARE & DATA PRODUCTS (SD)
Software such as programs, test data, and sound/video files. This series can be used to transfer technology to U.S. industry.
NTIA HANDBOOK (HB)
Information pertaining to technical procedures, reference and data guides, and formal user's manuals that are expected to be pertinent for a long time.
NTIA TECHNICAL MEMORANDUM (TM)
Technical information typically of less breadth than an NTIA Report. The series includes data, preliminary project results, and information for a specific, limited audience.
For information about NTIA publications, contact the NTIA/ITS Technical Publications Office at 325 Broadway, Boulder, CO, 80305 Tel. (303) 497-3572 or e-mail [email protected].