Embed Size (px)
Citation preview
AP42Section:
Background Chapter
Reference:
Title:
11.25
4
4
Emission Test Repot?: Plant A, Confidential Business Information files, Document No. C-3-1, ESD Project No. 81/08, U. S. Environmental Protection Agency, Research Triangle Park, NC, October, 1983.
I Section 4 Reference 4
AP-42 Reference - -
pF06;:
pwr DD‘/. CP
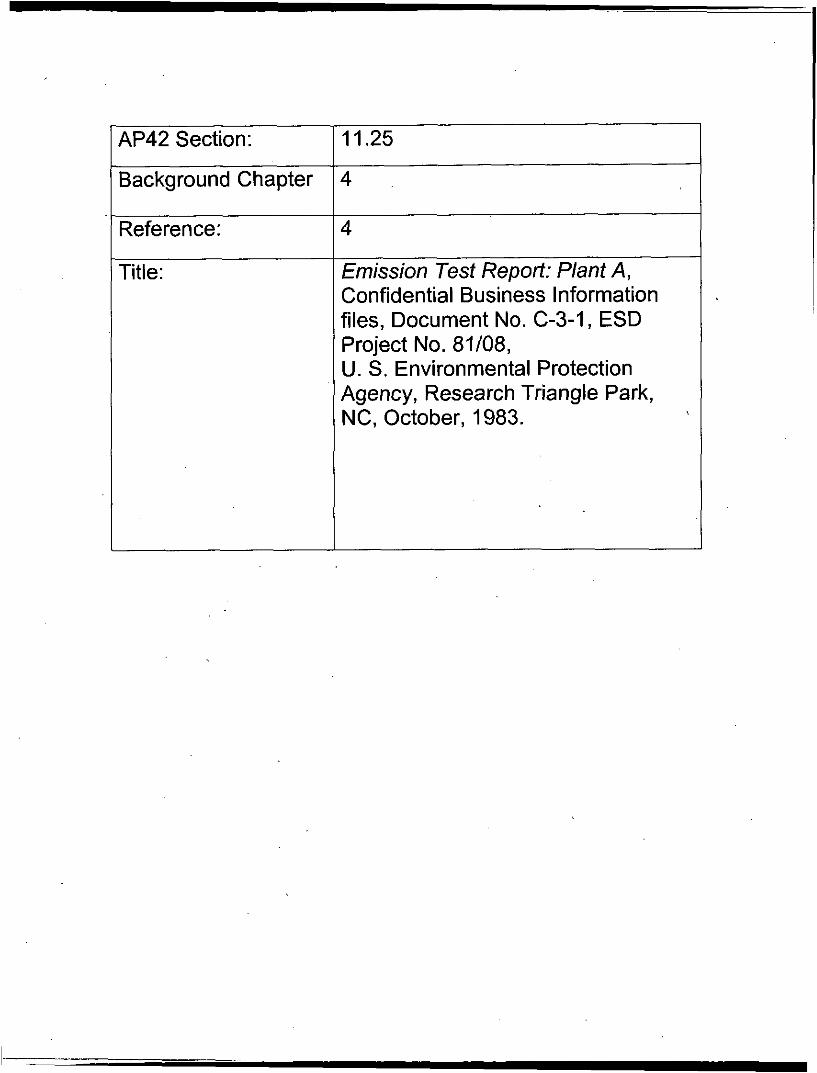
Emission Test Report Review Checklist--Short Form
Reviewer: & O K r/l raqQ r Review Date: 4/% 6/93 J
51 I r J
A. Backaround Information PA&@
1.
2. 3.
4. 5. 6.
7 .
8 .
Facility n Location: Source cat Test date: Test sponsor: Testing contractor: & ms;neWir,
Purpose of test:
Pollutants measured (include test method and indicate
flSP3 & &I %~MZG and 3 f q o r s
if valid): pm - f P R Me.-% e64 5 farhCle S:Z+
Process overview: block diagram. Identify processes tested with letters from the beginning o f the alphabet (A, B, C, etc. ..) and APC systems with letters from the end of the alphabet (V, W, X, etc...). Also identify test locations with Arabic numerals (1,2,3, ... ) . Using the ID symbols from the diagram, complete the table below.
Attach a process description and a
B. process Information
1. Provide a brief narrative description of the process and attach process flow diagram. (Note: If the process description provided in the test report is adequate, attach a copy here.)
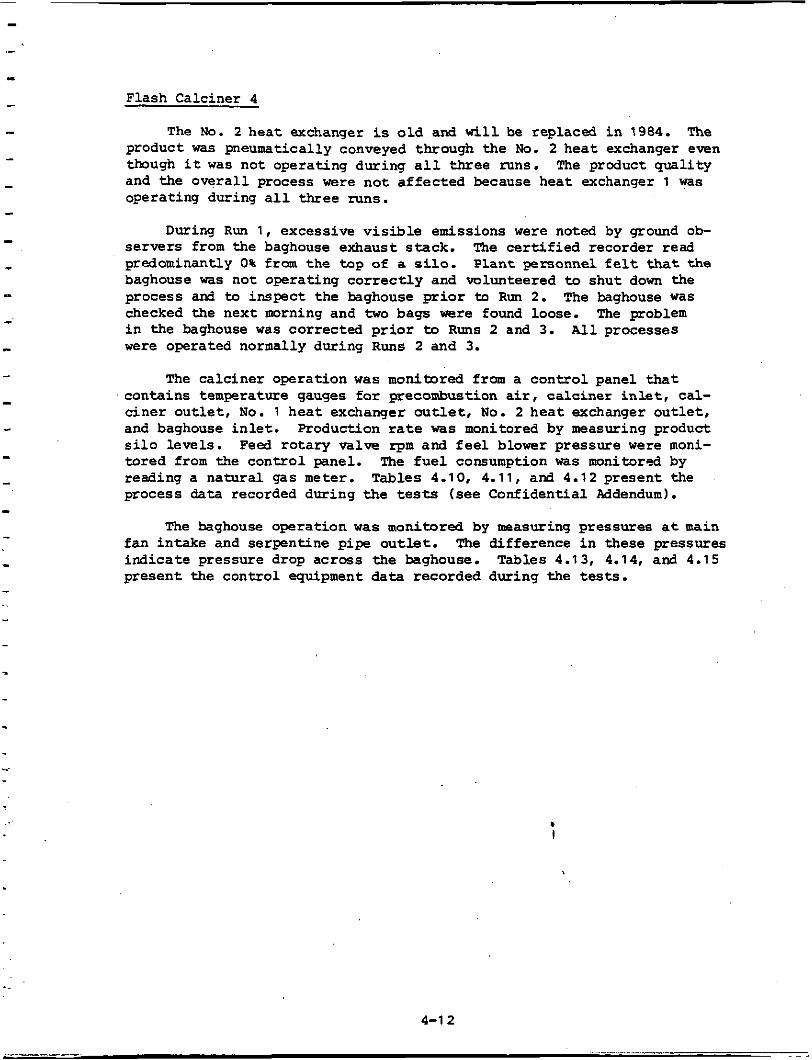
0 PM concentrations, PM mass emission rates, and p a r t i c l e s i ze de- terminations were performed a t the bagouse i n l e t and o u t l e t on the Flash Calciner.
o VE observations were taken a t the cooler (serpent ine pipe) i n l e t and the baghouse exhaust stack.
o Grab samples of the feed mater ia l were collected f o r p a r t i c l e s i z e s ieve and moisture analysis . Grab samples of the product material (a mixture of mater ia l collected by cyclones and a bag- house) were a l so co l lec ted fo r particle s i z e s ieve and moisture analysis.
T a b l e 4.1 presents the tests conducted a t t h i s plant.
PROCESS DESCRIPTION
This p l an t operates continuously except f o r breakdowns, 24 hours per
There a r e four separa te process l i n e s which produce calcined day and 7 days per week. A simplif ied process schematic is presented i n Figure 4.1. kaolin. Lines 1 and 2 use multiple hearth (Herreschoff) furnaces, while l i n e s 3 and 4 use Flash Calciners. Raw material is withdrawn from feed s i l o s and pneumatically conveyed t o feed tanks. Kaolin i s conveyed from the feed tanks and used as feed mater ia l f a r each of the four processing l ines .
Herreschiff Furnace 2
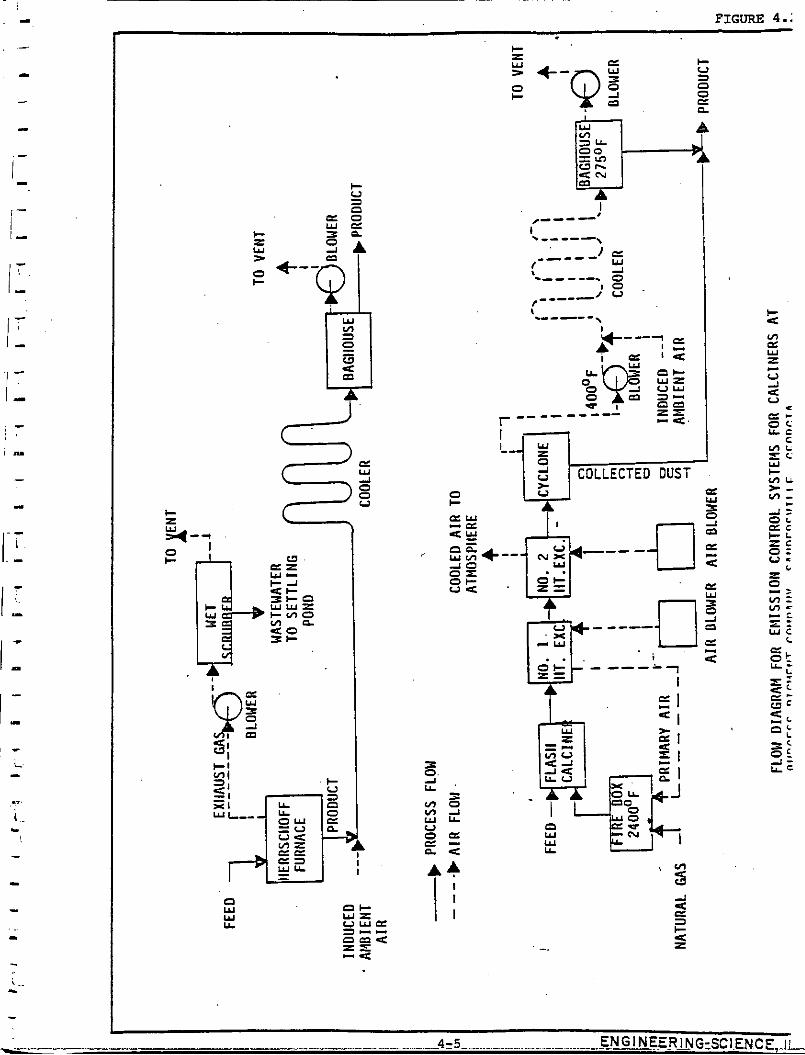
A simplified flow diagram t h a t shows the emission control systems fo r the Herreschoff Furnace l i nes is shown i n Figure 4.2. The feed ma- terial is discharged to the top of the Herreschoff by an enclosed screw conveyor. The exhaust gas from the Herreschoff is control led by a ven- t u r i scrubber. The cleaned gas stream leaving t h e scrubber passes through a fan to a vent stack. Calcined kaolin is discharged a t the bottom of the furnace in to a meumatic conveying l i n e (serpent ine cooler) t h a t cools the material. This conveying stream leads through a baghouse and a fan to a stack. All of the calcined product is col lected i n t h i s baghouse. From the baghouse the calcined kaolin i s conveyed t o f in i sh ing operation (see Figure 4.11, which include screening, s ize reduction, bulk loading, bag- ging, and bag loading.
Herreschoff Furnace 2 w a s manufactured by Nichols. T h i s ca lc iner is, f i r e d on natural gas, and t h e m a x i m u m ca lc in ing temperature i s 1093OC (20OOOF). The ca lc iner has a re ten t ion t i m e of about 30 minutes. The kaolin processed contains less than 1% sur face moisture before calcining. The, ca lc iner removes the small amount of surface moisture and approxi- mately 14% chemically bound water i n t h e material. Tab le 4.2 presents the design and operating parameters f o r Herreschoff Furnace 2. Table 4.3 presents the design and operat ing parameters fo r the venturi scrub- ber and the baghouse.
4-2 \
;L ~
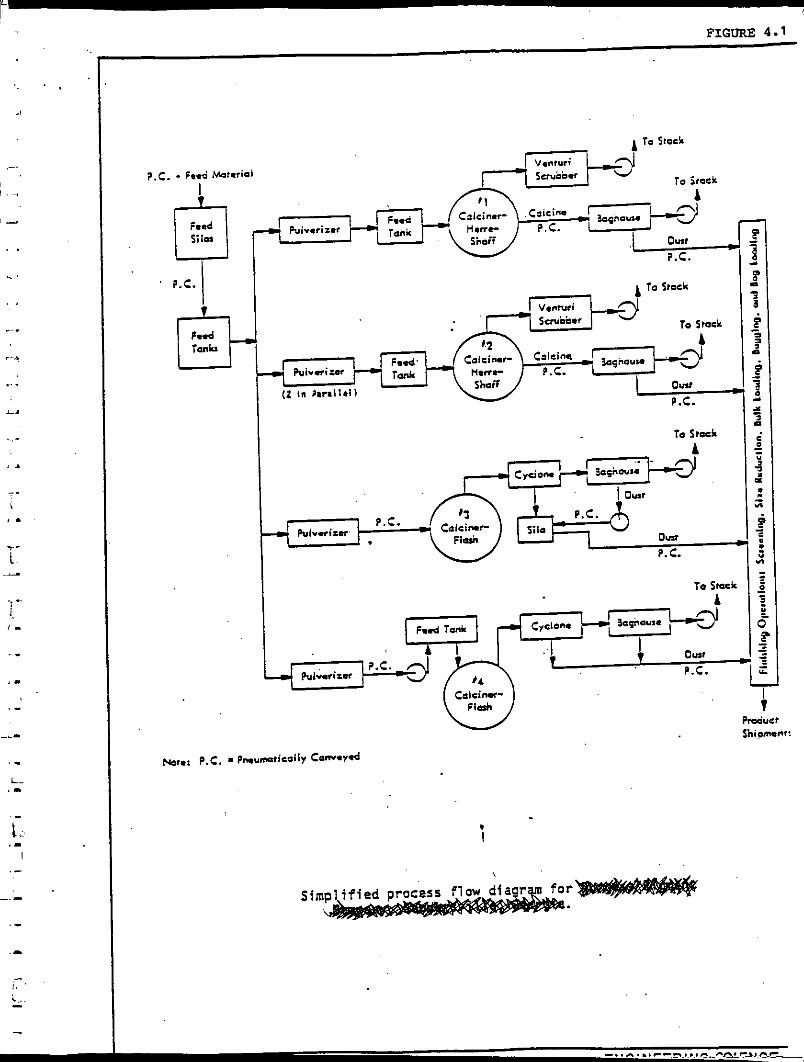
FIGURE 4.1
I To Stock
I ' P.C. To Stock
\ fi& 1 W
S i
c r c
V a 0 n
n s P
c
c V a n a o
W C T c r W > 0 c
? A
“--Q
CT W -I 0 0 u c c z
O C W Z V W C T 3--
r x - 4
0 w W U
n a u
0 c
@-- I
. .----- I
a I -
v w a- nn 0 U I z 5. r ---------
I .I
i-1 3 1- C O L L E C T E D D U S T
-- a
Flash Calciner 4
- , I -_
I :- T- I .1
..- I..
.r
...
1.-
A simplified flow diagram t h a t shows the emission control systems fo r the Flash Calciner l i nes is shown i n Figure 4.2. The feed material is Feumatical ly conveyed to the ca lc iner . Exhaust gas from the calci- ner i s passed through two heat exchangers (gas-to-gas) to a cylcone t h a t removes a portion of the product. Heat exchanger 2 w a s not operating during the tests. Following the cyclone, the gas stream passes through a Feumatic conveying l i n e (serpent ine cooler) to a baghouse and an in- duced d r a f t fan and is then vented through a discharge stack. Calcined product, collected i n both the cyclone and the baghouse, i s then con- veyed t o f in i sh ing operations.
The normal feed r a t e for Flash C a l c i n e r 4 is 3.6 Mg ( 4 tons) per hour. The ca lc iner is f i r e d on na tu ra l gas and t h e m a x i m u m calcining temperature i s 1371 OC (25OOoF). The ca l c ine r has a re ten t ion t i m e of 0.5 t o 2 seconds. The kaolin processed contains about 1% surface mois- ture before calcining. The ca l c ince r removes the s m a l l amount of sur- face moisture and about 14% of the chemically bound moisture i n the material. Tables 4.2 and 4.3 present the design and operating param- eters fo r the Flash Calciner and i ts baghouse, respect ively.
PROCESS CONDITIONS DURING TESTING
Note: Tables 4.4, 4.5, and 4.6 and Tables 4.10, 4.11, and 4.12, process data fo r the Iierreschoff Furnace 2 and Flash Calciner 4, respec-
ted from this repor t f o r conf ident ia l i ty purposes, equest, and w i l l be s tored under lock and key pend- minis t ra tor as t o the legit imacy of Burgess' claim
on confident ia l i ty .
Herreschoff Furnace 2
All process conditions were normal during t h e t e s t ing , except the Herreschoff was shut down fo r a period of 8 minutes during Run 2 due t o problems with the product screw conveyor. Testing was discontinued f o r t h i s period. Temperatures a t various hearths i n the Berreschoff were monitored from a cont ro l panel. The f u e l consumption w a s monitored by reading a natural gas meter. The feed rate was measured several t i m e s during each test by manually co l l ec t ing the feed i n a bag f o r 10 seconds and then weighing the co l lec ted feed. Tables 4.4, 4.5, and 4.6 present the process da t a recorded during t h e tests (see Confidential Addendum). A shown i n these tables, the process parameters were f a i l y uniform dur- ing the tests, and therefore process cor4i t ions w e r e normal. rate and temperatures were c lose to design.
The feed
The ventur i scrubber operation w a s monitored by reading the pressure drop across the ventur i , the pump i n l e t vacuum, the pump o u t l e t pressure, and the pump power consumption. 27, 1983, to monitor scrubber water flow rate during Runs 2 and 3. The baghouse operation w a s monitored by reading pressure drop across the bag- house and observing pressure columns t h a t reflect cleaning mechanisms of individual compartments. Tables 4.7, 4.8 and 4.9 present the cont ro l equipment data recorded during the test.
4-8
A f l o w meter w a s i n s t a l l e d on September
Flash Calciner 4
The No. 2 hea t exchanger is o l d and w i l l be replaced i n 1984. The product was pneumatically conveyed through the No. 2 hea t exchanger even though it w a s not operating during a l l th ree runs. The product qua l i ty and the ove ra l l process were not a f fec ted because heat exchanger 1 was operating during a l l three runs.
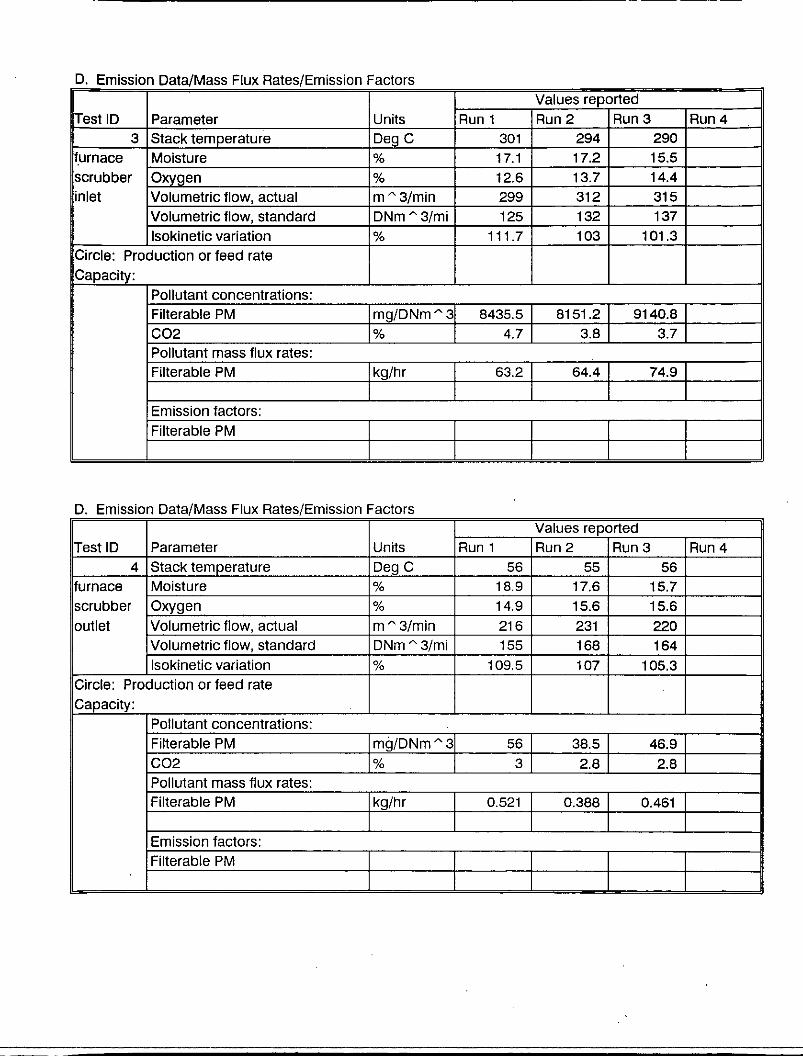
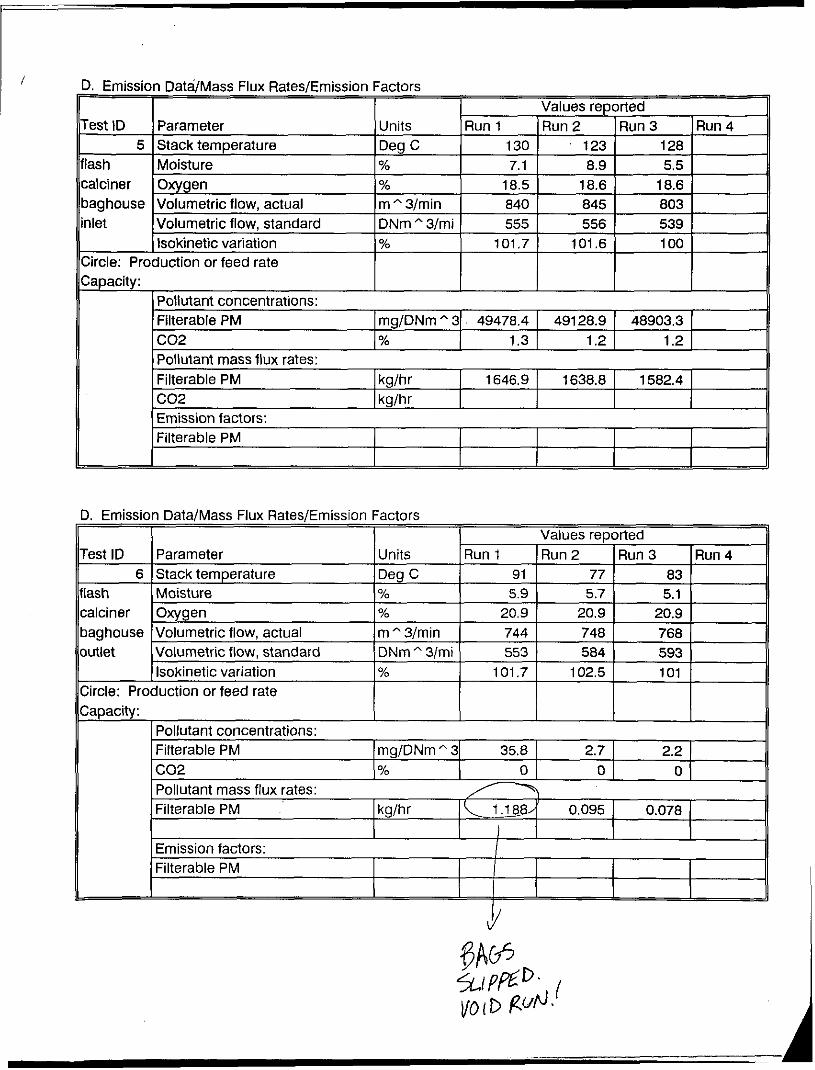
During Run 1, excessive v i s i b l e emissions were noted by ground ob-
P lan t personnel f e l t that the servers from the baghouse exhaust s tack. The c e r t i f i e d recorder read predominantly 0% from the top of a si lo . baghouse was not operating co r rec t ly and volunteered to shut down the process and t o inspect the baghouse prior to Run 2. The baghouse was checked the next morning and two bags were found loose. i n the baghouse was corrected p r i o r to Runs 2 and 3. were operated normally during Runs 2 and 3.
The problem A l l processes
The calcines operation w a s monitored from a cont ro l panel t h a t contains temperature gauges f o r precombustion air , ca lc iner i n l e t , cal- c ine r ou t l e t , No. l hea t exchanger o u t l e t , No. 2 hea t exchanger o u t l e t , and baghouse i n l e t . Production rate was monitored by measuring product silo levels . Feed ro ta ry valve r p m and f e e l blower pressure were moni- tored from the cont ro l panel. The f u e l consumption was monitored by reading a natural gas meter. Tab le s 4.10, 4.11, and 4.12 present the process data recorded during the tests (see Confidential Addendum).
The baghouse operation w a s monitored by measuring pressures at main fan intake and serpentine pipe ou t l e t . ind ica te pressure drop across the baghouse. Tables 4.13, 4.14, and 4.15 present the control equipment da ta recorded during the tests.
The difference i n these pressures
.
. I
4-1 2
D. Emission Data/Mass Flux Rates/Emission Factors
D. Emission Data/Mass Flux Rates/Emission Factors
M 3 A ; n x
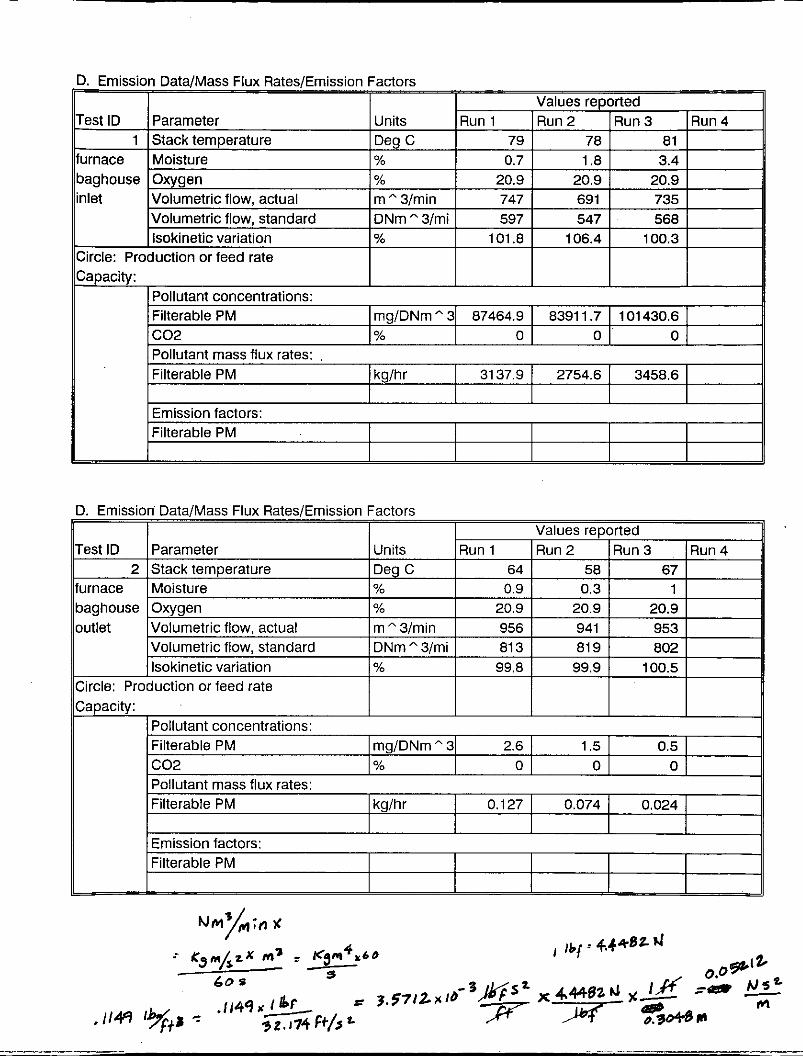
D. Emission Data/Mass Flux Rates/Emission Factors
Emission factors:
Test ID 4
Values reported Parameter Units Run 1 I Run 2 ]Run 3 I Run 4 Stack temperature Deg C 56 I 55 I 56 I
furnace scrubber outlet
Moisture % 18.9 17.6 15.7 Oxygen % 14.9 15.6 15.6 Volumetric flow. actual m A 3lmin 21 6 231 220 Volumetric flow, standard lsokinetic variation
Circle: Production or feed rate Capacity:
DNm 3/mi 155 168 164 % 109.5 107 105.3
Emission factors: Filterable PM
c02 1 % 3 1 2.8 I 2.8 I Pollutant mass flux rates: Filterable PM I kalhr I 0.521 I 0.388 I 0.461 I I
Test ID 5
Values reported Parameter Units Run 1 1 Run 2 ]Run 3 ]Run 4 Stack temperature Deg C 130 1 123 I 128 I
flash calciner baghouse inlet
D. Emission Data/Mass Flux RatesIEmission Factors
Moisture % 7.1 8.9 5.5 Oxygen % 18.5 18.6 18.6 Volumetric flow, actual m A 3lmin a40 845 803 Volumetric flow, standard DNm A 3lmi 555 556 539 lsokinetic variation % 101 '7 101.6 1 00
flash calciner baghouse inlet
Moisture % 7.1 8.9 5.5 Oxygen % 18.5 18.6 18.6 Volumetric flow, actual m A 3lmin a40 845 803 Volumetric flow, standard DNm A 3lmi 555 556 539 lsokinetic variation % 101 '7 101.6 1 00
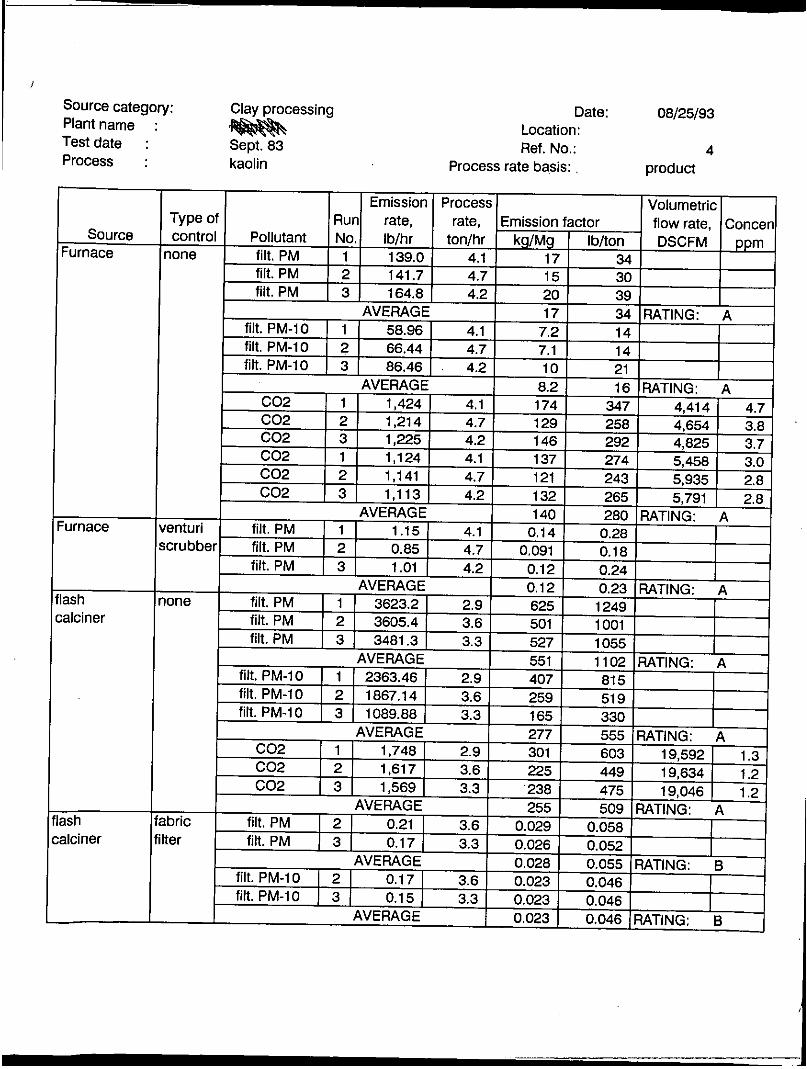
Source category: Clay processing Plant name : Test date : Process :
calciner
Sept. 83 kaolin
Emission Type of Run rate.
Date: 08/25/93 Location: Ref. No.: 4
Process rate basis: , product
Process 1 I Volumetric I I