Embed Size (px)
Citation preview

Emissions Inventory for Cities: Building and Strengthening Eco-Cities
through Improved Air Quality ManagementEngr. Sheila Flor Dominguez-Javier
National Center for Transportation Studies
University of the Philippines
Diliman, Quezon City
Clean Air Asia

Outline
•Introduction
•Air Quality Management?
•Emissions Inventory (EI)?
•Clean Air for Smaller Cities
•Strategies, Challenges and Opportunities in EI

Pollution is a reality in Hangzhou City, China
Source: http://www.morehangzhou.com/cover-story/clearing-the-air:-the-skinny-on-air-pollution-in-hangzhou.html

Source: http://www.morehangzhou.com/cover-story/clearing-the-air:-the-skinny-on-air-pollution-in-hangzhou.html
Are we ready for this?

More than one-half of the population of the world are living in cities (54.5 % as of 2016)

World's cities only cover approximately 2-3 percent of global land cover.

Cities Contribution to GHG Emissions
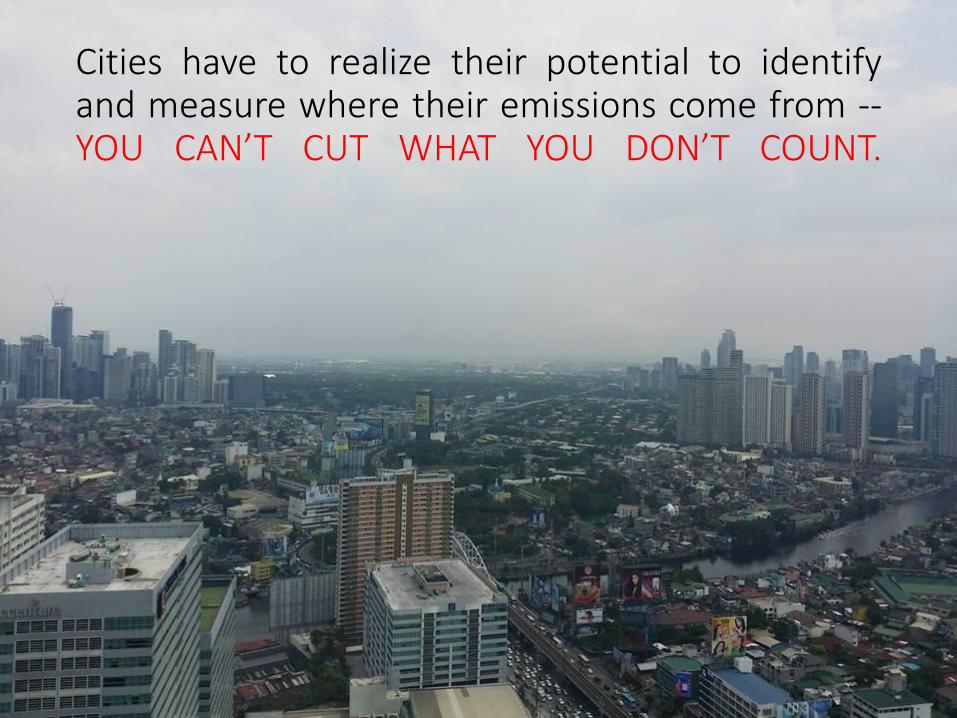
Cities have to realize their potential to identifyand measure where their emissions come from --YOU CAN’T CUT WHAT YOU DON’T COUNT.

What is Air Quality Management?
AQM - all activities that are aimed at
creating and maintaining clean air to protect
human health and provide protection for
ecosystems.
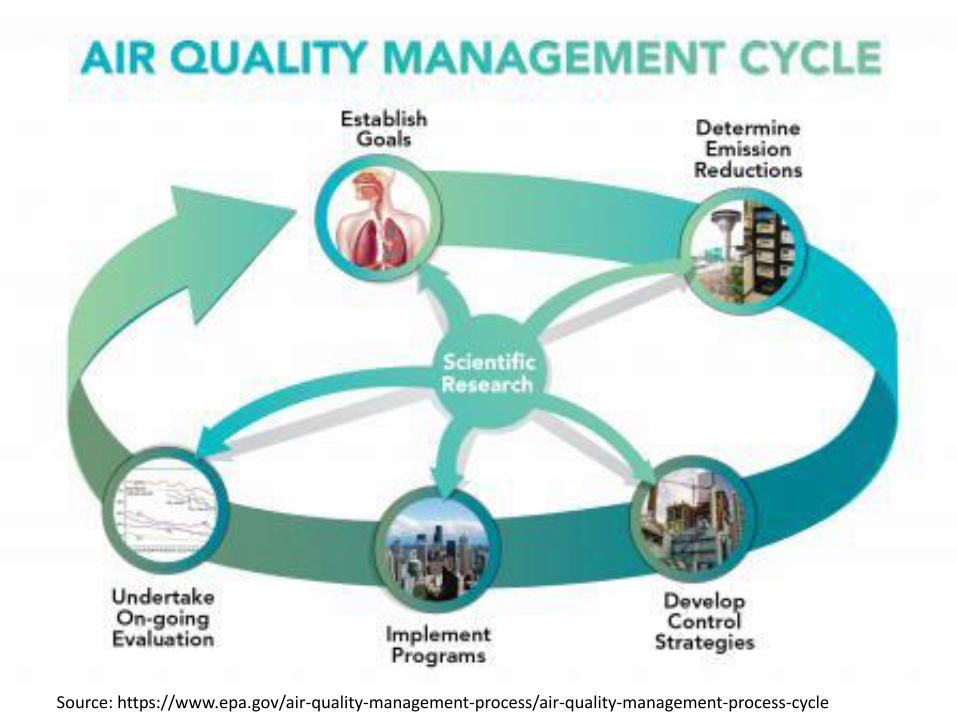
Source: https://www.epa.gov/air-quality-management-process/air-quality-management-process-cycle

Source: NAQSR 2012-2013
The development of a complete emission inventory isan important step in an air quality management process

What is Emissions Inventory (EI)?
•Emissions Inventory (EI) is a comprehensive listing of
pollutants from all sources in a geographical area
during a period of time.
•EI can be given for a single year, but inventories for
more years (time-series) are needed for most
applications

What is Emissions Inventory (EI)?
•Emissions inventories should, therefore, beannually compiled and updated
•To conduct an EI: activity data and emissionfactors are required
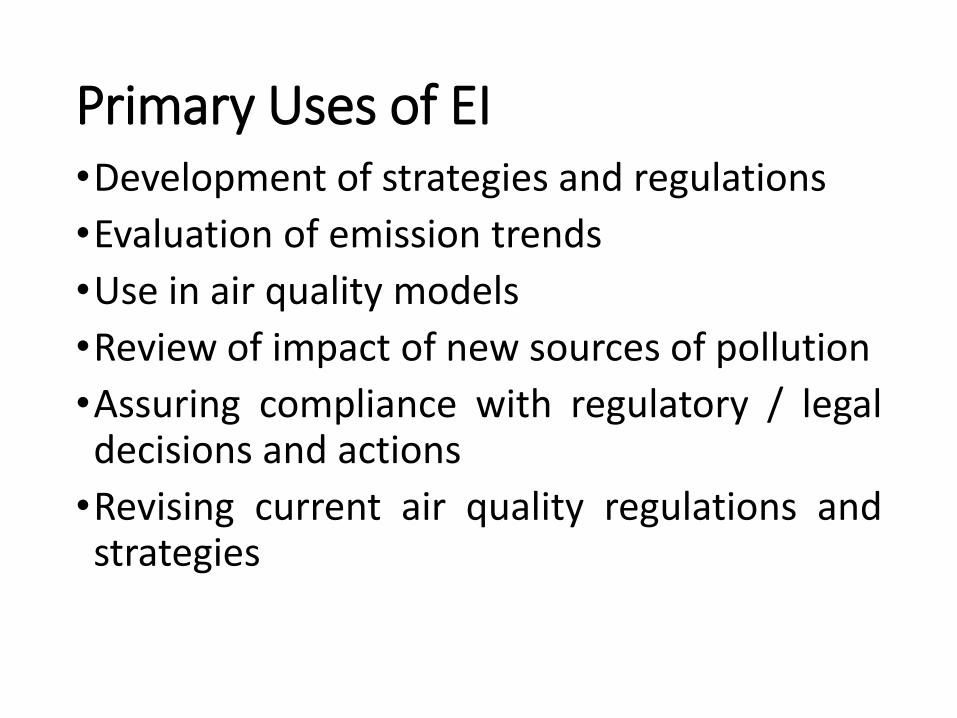
Primary Uses of EI•Development of strategies and regulations
•Evaluation of emission trends
•Use in air quality models
•Review of impact of new sources of pollution
•Assuring compliance with regulatory / legaldecisions and actions
•Revising current air quality regulations andstrategies
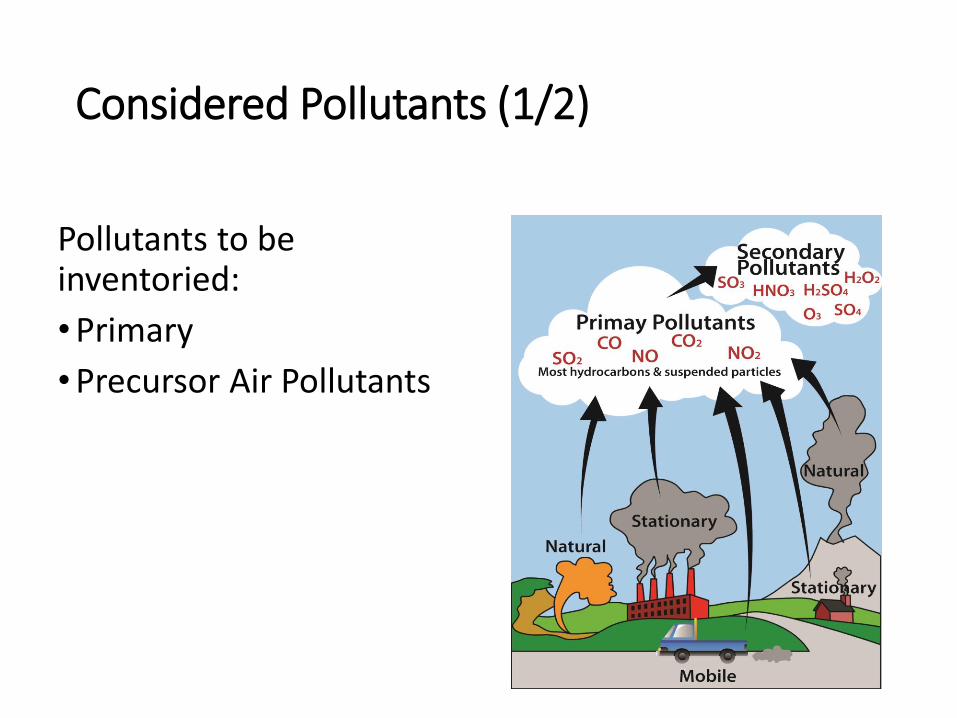
Considered Pollutants (1/2)
Pollutants to be inventoried:
•Primary
•Precursor Air Pollutants

Considered Pollutants (2/2)
•CO – Carbon Monoxide
•NOx - nitrogen oxides
•SO2 – sulfur dioxide
•Pb - lead
•PM (TSP, PM10 and PM2.5)
•O3 - ozone
•VOCs – volatile organic compounds

General planning and management considerations (1/6)
•It is good practice to ensure the overallprocess is managed by an appointed‘Coordinator and/or Inventory Manager’,who can be an individual or a committee.

General planning and management considerations (2/6)
Responsibility of inventory manager:- establish and lead an emissions inventory team- work planning & timeline- management of resources
- data acquisition, supervision of collection- internal and external communication- reporting- administrative issues

General planning and management considerations (3/6)
Inventory Compiler
Raw
data
Raw
data
Compilation
estimate
emissionsEmissionsEmissions
Clean
Air
Action
Plan
Report
Inventory Manager
Data
Providers:e.g.
•DIW
•PCD
•Factories
•Municipality
•Transport
Dep.
•….
Requestdata
Deliverdata

General planning and management considerations (4/6)
• The ‘Inventory Compiler’ decides which data have to be collected and how they are processed to obtain emissions of each source.
Note: inventory manager and inventory compiler have different functions that may or may not be performed by the same institute or individual.

General planning and management considerations (5/6)
Step 1:
• Name an Inventory Manager and Inventory Compiler
• Establish a project team
• Identify competent officers from national offices and scientists from universities and agree on cooperation
EI Development Approaches (1/4)
• “Top-down” approach: typically used when localdata are not available, the cost to gather localinformation is prohibitive. Regional or nationalestimates use extrapolated data on population,land use, fuel used etc.
• “Bottom-up” approach: when source specificactivity or emission data are available. This methodproduce more accurate estimates than a top-downapproach.
EI Development Approaches (2/4)
Emission Factor is an estimate of the rate atwhich a pollutant is released to theatmosphere per unit of the activity level froman emission source.
Usually expressed as a weight of thepollutant divided by a unit weight, volume,distance, or duration of activity emitting thepollutant (e.g. kg particles per kg fuelburned)

EI Development Approaches (3/4)
Activity data or activity rate consists ofinformation on the consumption ofspecific quantities of fossil fuel, biomassdensity, solid waste production, etc.(e.g. amount of fuel burned, amount ofraw materials processed, or the numberof product units produced)
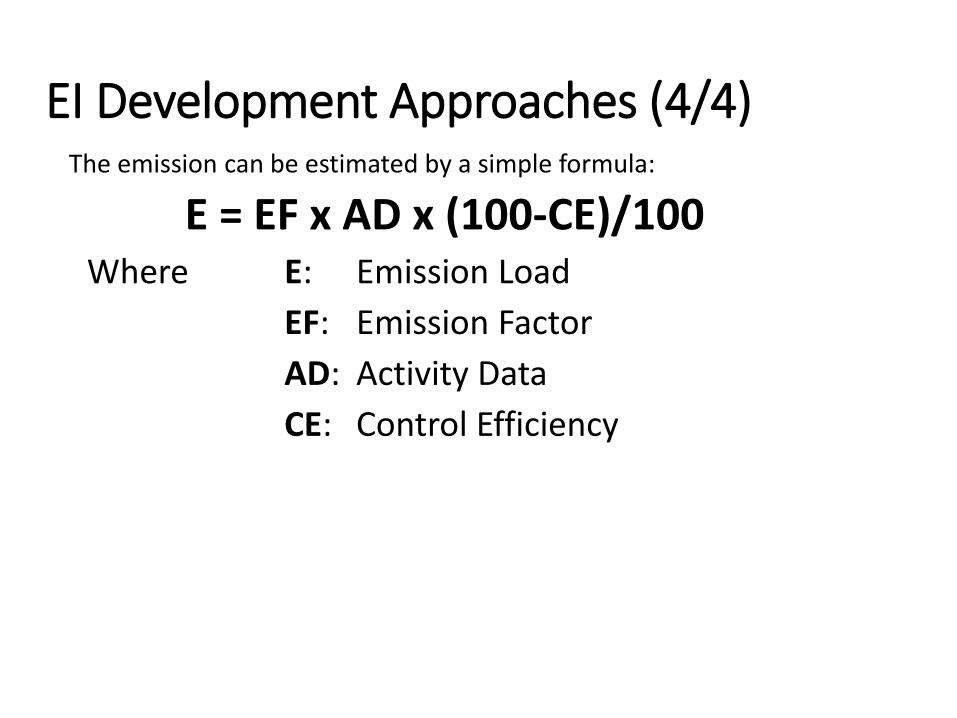
EI Development Approaches (4/4)The emission can be estimated by a simple formula:
E = EF x AD x (100-CE)/100 Where E: Emission Load
EF: Emission Factor
AD: Activity Data
CE: Control Efficiency
Clean Air for Smaller Cities
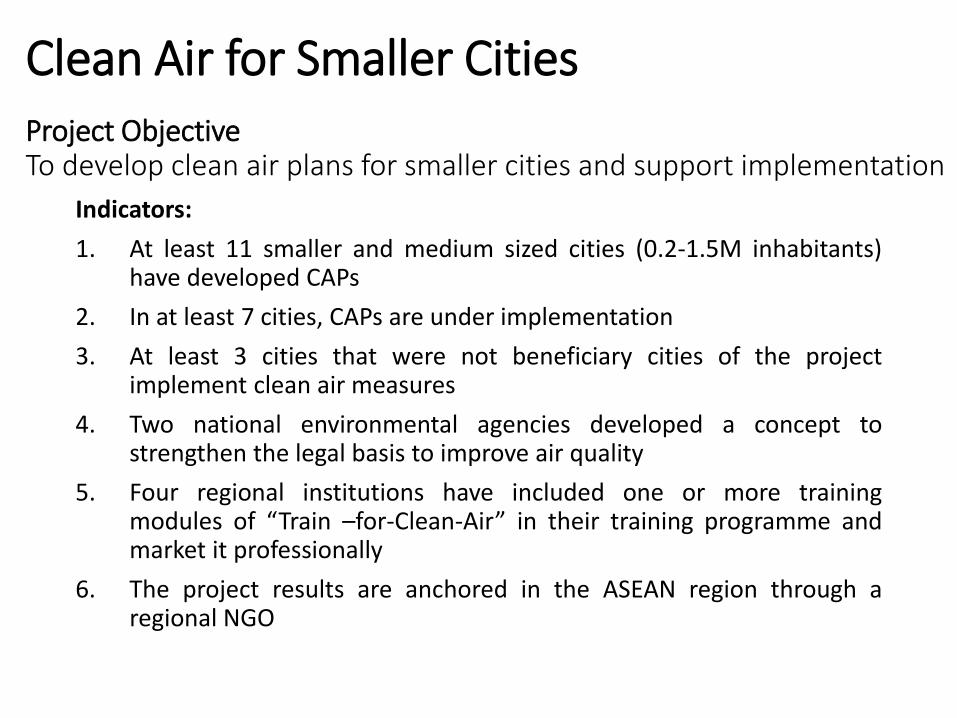
Clean Air for Smaller CitiesProject ObjectiveTo develop clean air plans for smaller cities and support implementation
Indicators:
1. At least 11 smaller and medium sized cities (0.2-1.5M inhabitants)have developed CAPs
2. In at least 7 cities, CAPs are under implementation
3. At least 3 cities that were not beneficiary cities of the projectimplement clean air measures
4. Two national environmental agencies developed a concept tostrengthen the legal basis to improve air quality
5. Four regional institutions have included one or more trainingmodules of “Train –for-Clean-Air” in their training programme andmarket it professionally
6. The project results are anchored in the ASEAN region through aregional NGO
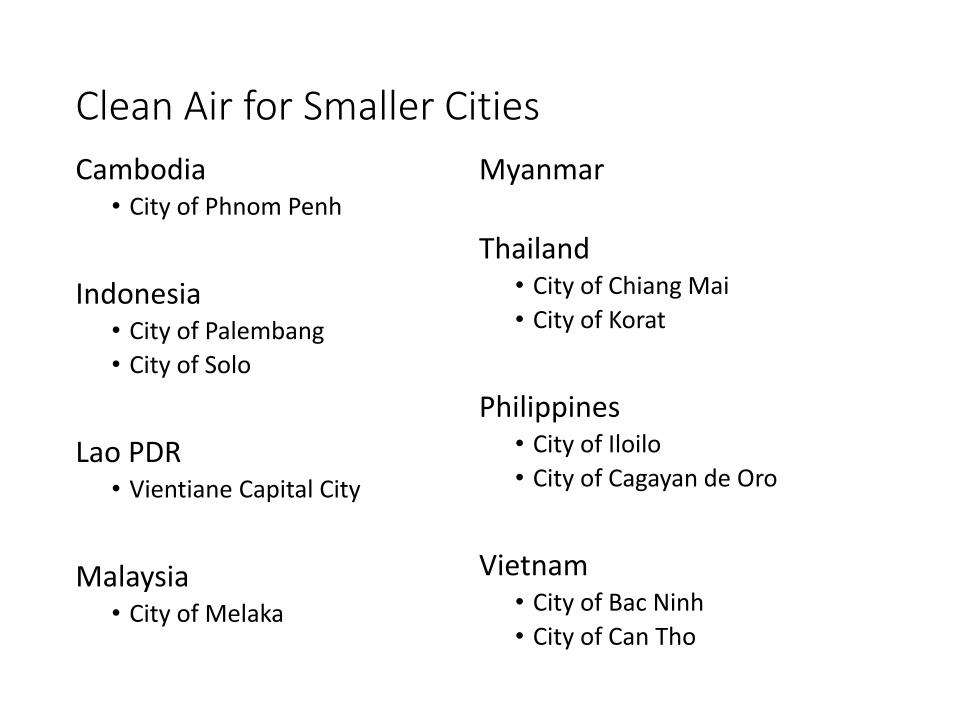
Clean Air for Smaller Cities
Cambodia• City of Phnom Penh
Indonesia• City of Palembang
• City of Solo
Lao PDR• Vientiane Capital City
Malaysia• City of Melaka
Myanmar
Thailand• City of Chiang Mai
• City of Korat
Philippines• City of Iloilo
• City of Cagayan de Oro
Vietnam• City of Bac Ninh
• City of Can Tho

Train for Clean Air (T4CA) Training CoursesTop 6 Priority Courses Target Population Duration
T4CA1 General AQ management for decision makers of smaller cities
Mayor, Chief AdministrativeOfficer
0.5 – 1 day
T4CA2 Air Quality Management for smaller cities
Technical Officer 3 days
T4CA3 Emission Inventory for Smaller Cities
4 days
T4CA4 General AQM for NGOs in smaller cities
Influencers (e.g. NGOs, Media, Civil Society)
2 days
T4CA5 Effective Communication for NGOs on Air Quality Management
2 days
T4CA6 Developing Strategies to Curb Emissions based on Fleet Profiles of Motorized 2&3-Wheelers in Smaller Cities
Technical Officer 3 days
Emission Inventory for Smaller Cities
Goal:
•To develop, continuously refine and regularlyupdate emission inventory
Target Population:
•City technical officers (environment, transport,health, urban planning, industry, energy,agriculture, forestry, waste management,sanitation)

Example EI (Mobile Source) in Cagayan de Oro City
Methodology:1. Traffic Survey: volume count, vehicle
classification and spot speed2. Vehicle types: Public and Private3. Survey Time: Peak and Non-Peak Time4. Survey Sites: 28 Roads 3 in-facility (residential,
airport, industrial sites) 1 construction firm
Source: http://cleanairasia.org/

Example EI in Cagayan de Oro City
Challenges in EI Data Gathering
•Data Collection and Processing
•Consolidation of Interim Reports
•Continuing collaboration with LGUs

Lesson Learned
•Quality Feedback
•Information Transparency
•Strong Cooperation
•Continuing Capacity Building

The Case of Iloilo City•Emission Inventory providedimportant insights that became thecentral basis of the city’s
Clean Air Plan
http://cleanairasia.org/ccap/wp-content/themes/CCAP-2015/pdf/05%20Norlito%20Bautista_Emissions%20Inventories%20rev3.pdf

Benefits of the Emission Inventory •Emission Inventory helped the City develop its first ever Clean Air Plan
•Basis to determine strategic initiatives : a) Social Marketing Information and Education
Campaign b) Roadside Air Quality Monitoring c) Number Scheme for Jeepneys and Private Cars d) Pilot Mass Transit in Select Areas of the City e) Anti-smoke Belching Program f) Massive SMIEC (Awareness) in all the barangays g) On-shore Power Sourcing
http://cleanairasia.org/ccap/wp-content/themes/CCAP-2015/pdf/05%20Norlito%20Bautista_Emissions%20Inventories%20rev3.pdf

After the Emission Inventory The Emission Inventory inspired stakeholders toinitiate related studies :
a) Rapid Assessment on the Impacts of Air Pollutionon Traffic Policemen - confirmed health impacts ofroadside air pollution
b) Baseline Pulmonary Profile of the City’s TrafficEnforcer - baseline data for validation in 2015 tostudy impacts of roadside air pollution on city’straffic aide
c) Jeepney Study - a comparative study onperformance of old diesel engine (Isuzu &Mitsubishi - Circa 1960s, 1970s) and latest diesel(Euro IV)
http://cleanairasia.org/ccap/wp-content/themes/CCAP-2015/pdf/05%20Norlito%20Bautista_Emissions%20Inventories%20rev3.pdf
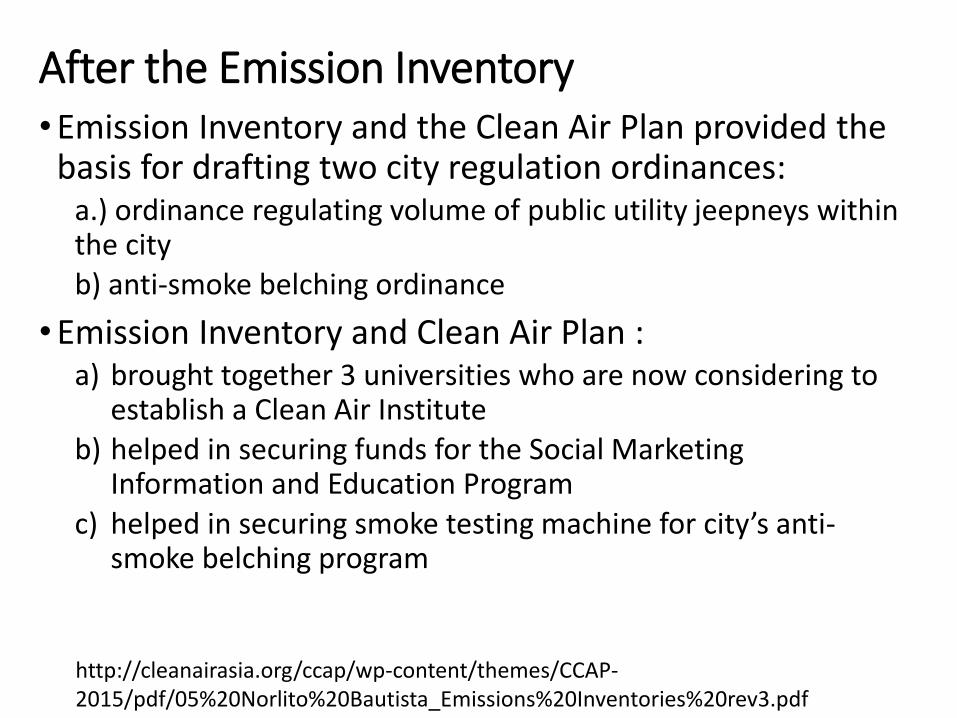
After the Emission Inventory •Emission Inventory and the Clean Air Plan provided the
basis for drafting two city regulation ordinances: a.) ordinance regulating volume of public utility jeepneys within the city b) anti-smoke belching ordinance
•Emission Inventory and Clean Air Plan : a) brought together 3 universities who are now considering to
establish a Clean Air Institute b) helped in securing funds for the Social Marketing
Information and Education Program c) helped in securing smoke testing machine for city’s anti-
smoke belching program
http://cleanairasia.org/ccap/wp-content/themes/CCAP-2015/pdf/05%20Norlito%20Bautista_Emissions%20Inventories%20rev3.pdf

Success Factors of Emission Inventory in Philippine Cities
•Effective dissemination activities
•Strong leadership of the environmentmanagement offices of the cities
•Support of the mayor and the localgovernment
•Good relationship with regional EMB andlinkages with the airshed.
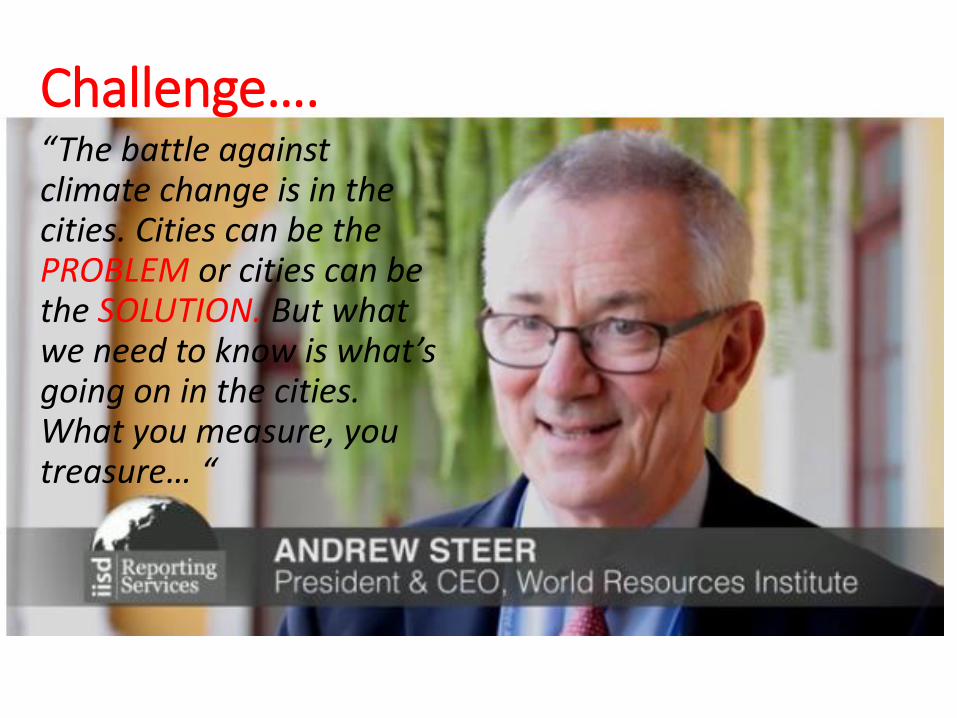
Challenge….“The battle against climate change is in the cities. Cities can be the PROBLEM or cities can be the SOLUTION. But what we need to know is what’s going on in the cities. What you measure, you treasure… “

Thank you very much…
What do you want to be? Problem or Solution?