Embed Size (px)
Citation preview
Emissions Leakage: Evidence from the U.S. Multi-plantFirms
Jingbo Cui Yongjie Ji
Wuhan University Iowa State Universityand CARD
[email protected] [email protected]
Selected Paper prepared for presentation at the 2016 Agricultural & AppliedEconomics Association Annual Meeting, Boston, Massachusetts, July 31 - August 2
Copyright 2016 by Jingbo Cui and Yongjie Ji. All rights reserved. Readers may make verbatimcopies of this document for non-commercial purposes by any means, provided that this copyrightnotice appears on all such copies.
1
Emissions Leakage: Evidence from the U.S. Multi-plantFirms
Jingbo Cui and Yongjie Ji∗
Version May 25, 2016Incomplete, please do not cite
Abstract
This paper seeks to examine the role of multi-plant’s network to determine their af-filiated plants’ emissions in response to tightened environmental regulations. Pollutingplants, which are located across the nation and are exposed to regional environmen-tal pressures, form a network through their affiliated parent company. We investigatewhether or not these multi-plant firms, to avoid local environmental compliance, shiftpollution emissions from their affiliated plants in regulated counties to those in un-regulated ones, thereby leading to emissions leakage. We compile a unique detailedplant-level dataset that pertains to the U.S. manufacturing industry over the period1990-2008. Taking advantage of the spatial and temporal variations of designated non-attaintment status at county level, we seek to identify the effects of multi-plant firms’network on annual changes in emissions of affiliated plants residing in regulated areasas compared with those in unregulated areas.
Keywords: Clean Air Act Amendments, Air Pollution, Emissions Leakage, Multi-PlantsFirm,
JEL Classification: F18, Q56
∗Jingbo Cui ([email protected]) is Assistant Professor at the Institute for Advanced Study andDepartment of Mathematical Economics and Finance at the Economics and Management School, WuhanUniversity, China. Yongjie Ji ([email protected]) is Assistant Scientist in the Center of Agriculturaland Rural Development at Iowa State University, Ames, Iowa, U.S.A. Any remaining errors are on our own.
2
1 Introduction
Polluting plants scattering across counties are subject to regional environmental pressures.
In response to a stringent local regulatory control, multi-plant firms may shift production
(and associated emissions) from affiliated plants located in regulated areas to those siblings
in unregulated areas to avoid environmental compliance costs. As a consequence, emissions
leakage arise via an unveiled channel, that is, the network of multi-plant firms. While much
of existing work has focused on the effects of regulatory control in emissions reductions
(Henderson, 1996; Becker and Henderson, 2000; Greenstone, 2004), the literature remains
silent about the role of the multi-plant firms’ network in the potential emissions leakage due
to a lack of detailed data on plants’ firm structure.
This paper seeks to examine the role of multi-plant firms’ network in affecting their
affiliated plants’ emissions annual growth rate in response to tightened local environmental
regulations. To this end, we compile a detailed plant-level dataset that pertains to the US
manufacturing industry over the period 1990-2008. The data cover toxic releases of polluting
plants recorded in the Toxic Release Inventory (TRI) of the US Environmental Protection
Agency (EPA). We further find other sibling plants affiliated with these dirty emitters from
the National Establishment Time Series (NETS) database. To measure plants’ exposure to
environmental regulation, we further augment the data with county non-attainment designa-
tions under the Clean Air Act Amendments (CAAA) legislation of 1990. Taking advantage
of the spatial and temporal variations in county-level non-attainment status, we seek to
identify the effects of multi-plant firms’ network on changes in emissions of affiliated plants
located in regulated area as compared with those residing in unregulated areas.
An empirical methodology from Greenstone (2003) is employed and further extended by
allowing local regulatory indicator to interact with the multi-plant firm dummy. Specifically,
we first investigate whether dirty plants associated with multi-plant firms have lower annual
emission growth rates than those affiliated with single-plant firms in response to tightened
local environmental controls. Secondly, we construct a measure of the neighborhood head-
3
quarters network by summing up the number of affiliated plants in the same industry and
located in neighboring counties, which are free from environmental regulations. We then
explore how this neighborhood headquarters network in unregulated areas affects annual
growth rates of emissions released by dirty polluters affiliated with multi-plant firms. Lastly,
we are interested to revisit the hypothesis on the potential unintended consequences of air
regulation on pollution in other media (i.e., water), and to unveil the channel of the head-
quarters regional network in this potential regulation-induced substitution.
The model results generally show that counties with the nonattainment status for a
particular pollution category is associated with reduced air emission from plants located
there relative to their counterparts in attainment counties when other factors, such as age,
industry effects and so on, are controlled. The pressure from air pollution regulation are only
found to induce cross media pollution (air-to-water) substitution on Lead-related pollutants.
In terms of intra-firm leakage effect, we did not find any strong evidence that a plant within
a multi-plant firm located in nonattainment counties have significantly lower total on-site
emission relative to a single plant. While, some evidence suggests the local multi-plant
network effects may exist, i.e., plants with sibling plants in neighboring attainment counties
tend to have lower air-released total on-site TSP-related emission.
This paper contributes to the growing empirical literature that estimates the impact of
environmental regulations on firms’ site choices within a country or across nations (Hender-
son, 1996; Becker and Henderson, 2000; Jeppesen et al., 2002; Brunnermeier and Levinson,
2004; List et al., 2003b,a). A closely related work is Hanna (2010), which investigates whether
the environmental regulation induces firms to flee the country. She documents robust findings
suggesting that the CAAA legislation causes the U.S. based multinational firms in regulated
areas to increase their foreign assets and foreign outputs.
This paper is closely related to a line of existing studies that seek to estimate the
regulation-induced substitution. Using the TRI data over the period 1987-1997, Greenstone
(2003) examines the effects of the county nonattainment designations under the CAAA
4
legislation on annual growth rates of pollution emissions of the iron and steel industry into
all media (i.e., air, water, and other). He finds little evidence supporting the unintended
consequences of the CAAA on pollution releases into water and ground. A recent study
by Gibson (2014) revisits the regulation-induced substitution using the same TRI data over
1987-2010. His paper focuses on the changes in the ratio of water emissions relative to air
emissions rather than the levels used in Greenstone (2003). He finds that regulated plants are
associated with increases in their ratio of water to air emissions by 44 percent. Moreover,
his work also examines the potential spatial leakage through the multi-plan channel, and
finds that regulation of an average plant increases air emissions at unregulated plants owned
by the same firm by 17 percent. Our results could not support the general conclusion that
multi-plant firms reallocated resources from regulated plants to unregulated plants except
for TSP-related pollutants. Considering Gibson (2014) checks the leakage effect from the
“receiver” side on all emission, if both findings are reliable, it implies that multi-plants firms
are allocating “new” production to unregulated plants instead of moving “old” production
out from regulated plants in general.
The remaining of this paper is organized as follows: in section 2, we discuss how we con-
struct the variables and present the summary of data set. Estimation results and discussion
from a series of modeling strategies are presented in section 3. We conclude in section 4.
2 Data
In this section we summarize data sources, the evolution of TRI emission, and construction
of variables.
2.1 Data Source
The data pertain to the US manufacturing industry over the period of 1990-2008. We as-
semble the data from a variety of sources. The plant-level emission data are from the TRI
5
reported by the US EPA. The information about affiliated plants that share the same head-
quarters with dirty facilities are obtained from the NETS. The county-level environmental
regulation is obtained from the EPA.
The TRI data provide an establishment level record of toxic pollution emission collected
by the EPA. Manufacturing establishments that release more than a threshold level of any
of approximately 500 toxic chemicals listed by the EPA must report details about how these
chemicals are disposed. Specifically, for each toxic chemical, establishments must report
the quantity and disposal media (e.g., air, water, landfill, etc.). Most empirical research
on emissions rely on pounds of toxic emissions as reported in the Toxic Release Inventory
available on the EPA website. Through the efforts made by Greenstone (2003), many of
toxic chemicals listed in the TRI can be classified as either lead, TSPs, or VOC, which are
three of the six air pollutants regulated by the CAAA.1 For each of these three pollutants
(i.e., lead, TSPs and VOC), we sum up the total releases of all toxic chemicals that are
assigned in the pollutant-specific category by each media (i.e., water, air, and ground).
To search affiliated plants sharing the same headquarters with plants recorded in the
TRI, we first link the TRI with the NETS. The Dun and Bradstreet by Walls and Associates
develops the NETS database through a joint venture. This truly establishment database
covers over 300 fields and 40 million unique business establishments on a national basis for
every year since 1990. To keep track of each plant, the NETS assigns the Data Universal
Numbering System (DUNS) number as a unique identifier. More importantly, for each plant,
one could also find its headquarters information from the NETS database. This information
provides us headquarters’ name, DUNS number, and geographic location. Using the DUNS
number recorded in both TRI and NETS databases, we match these recorded polluting
plants with those collected in the NETS database. For each matched plant, we then find its
related plants within the NETS database through the parent company over the entire study
period. We further restrict our search on those in the manufacturing industry.1We thank Michael Greenstone for sharing the data that reports the categorization of toxic chemicals
into the lead, TSPs, and VOC.
6
Furthermore, we merge the plant-level data with pollutant-specific county nonattainment
designations under the CAAA legislation. The Green Book Nonattainment Areas for Criteria
Pollutants from the EPA indicates whether only part of a county or the whole county is in
nonattainment for each criteria air pollutant.2 For each of three criteria pollutants, i.e., lead,
O3, and TSPs, we assign a county to the nonattainment category, if the whole county or
part of the county is designated as nonattainment status.3
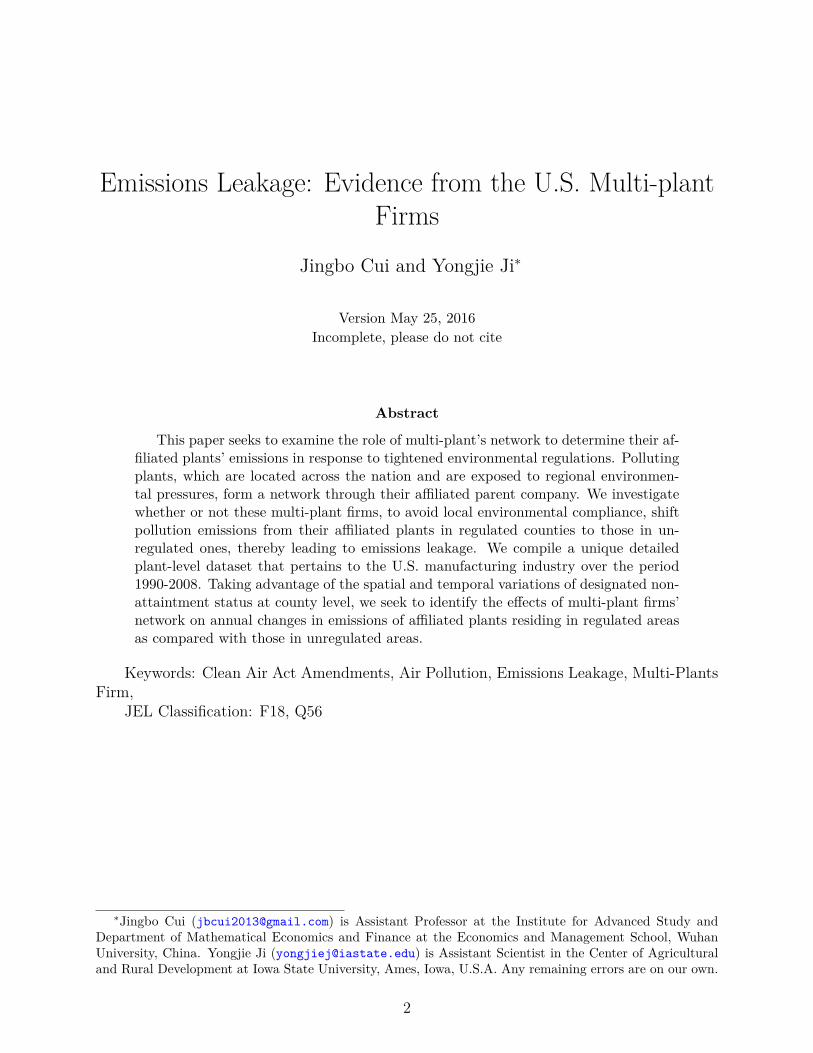
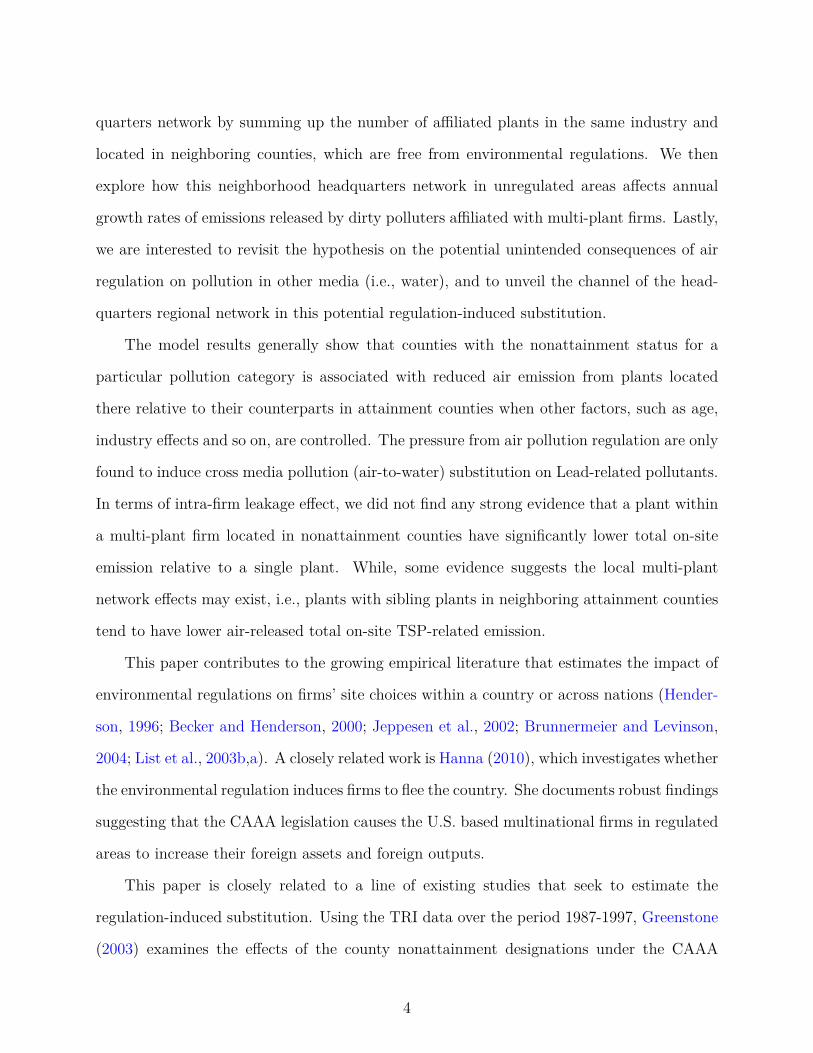
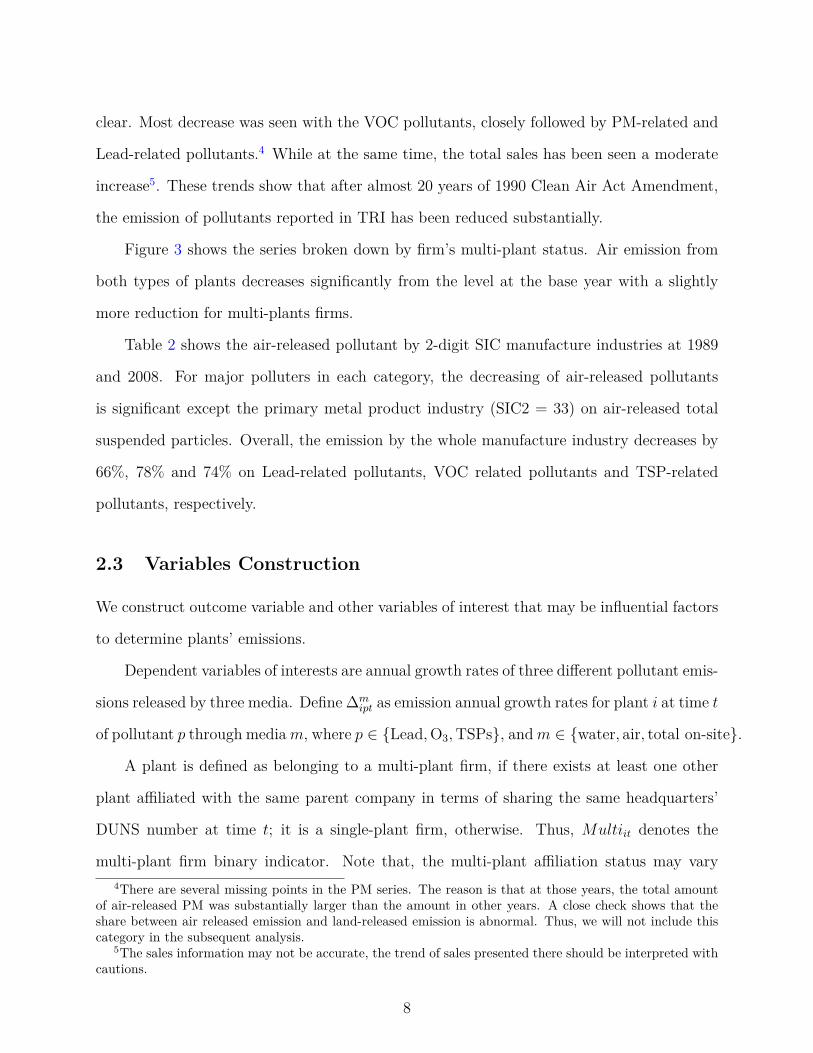
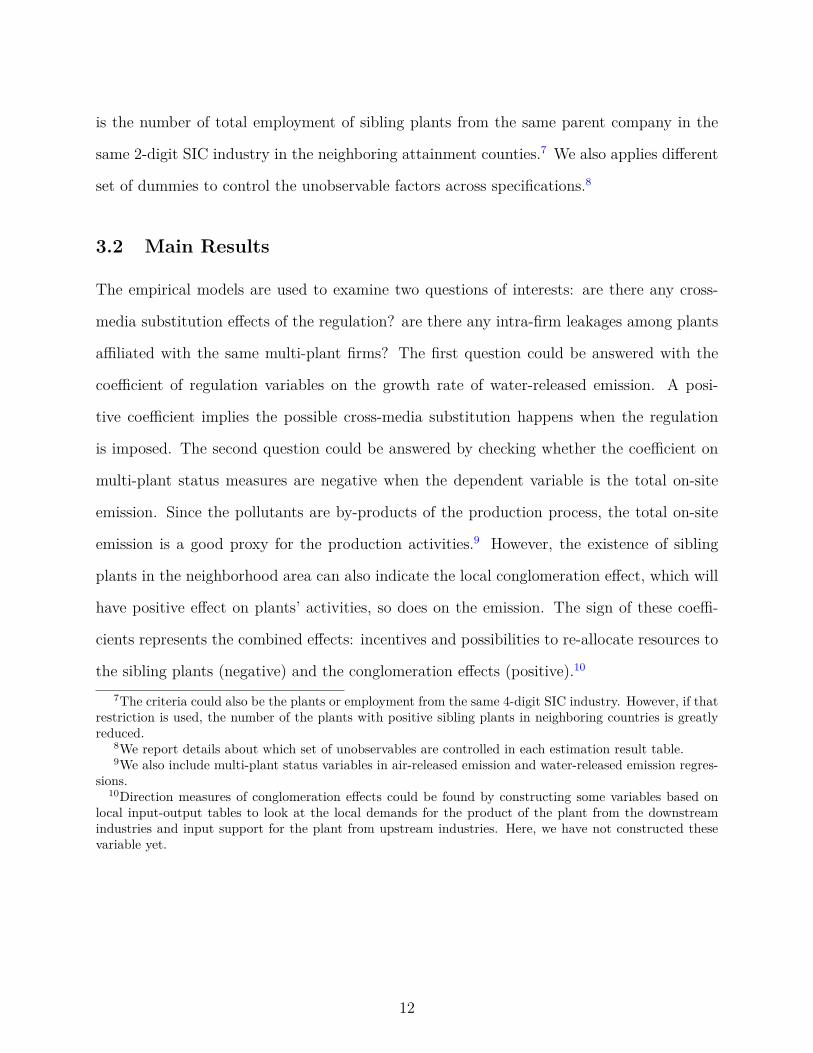
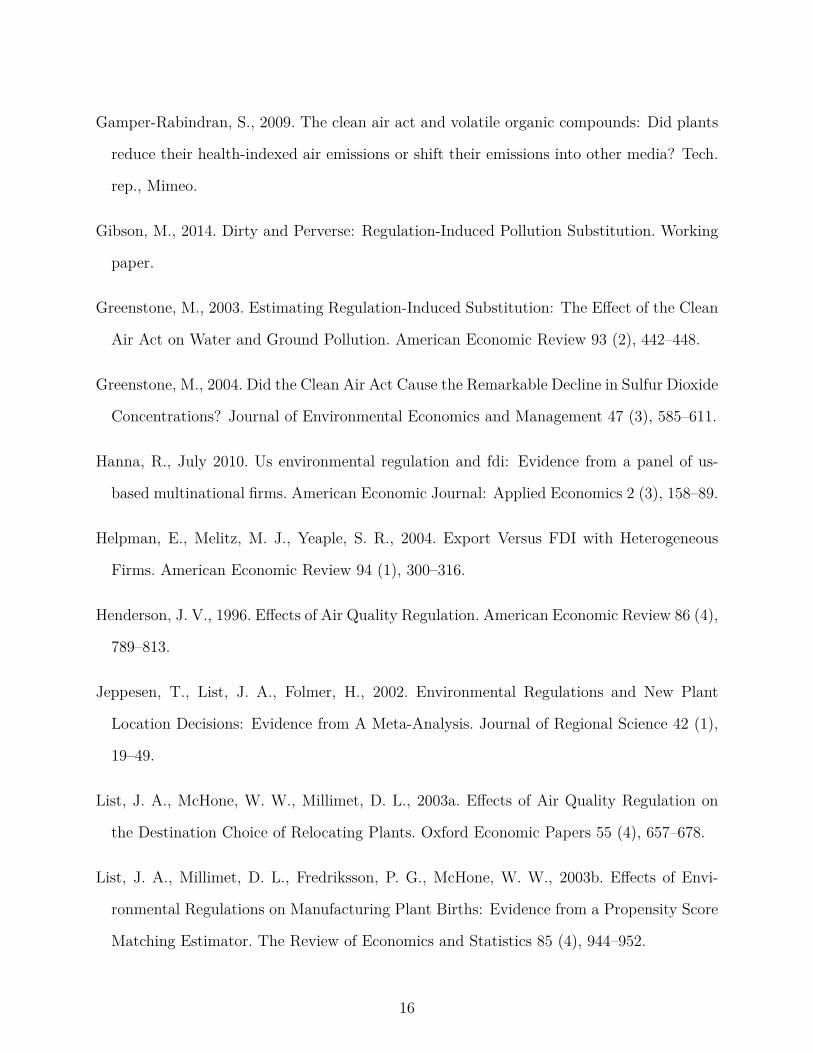
Figure 1 plots the number of pollutant-specific nonattainment status and the number
of counties with changed pollutant-specific nonattainment designations. The data are calcu-
lated from the US EPA Green Book. There is a small number of counties that fall into lead
nonattainment designations during the study period. For O3 and TSPs, significant variations
in nonattainment designations mainly occur in the post-period of CAAA (i.e., 1990-1996)
and the late sample period (i.e., 2002-2008). The latter is due to the new implementation
of strict standards associated with these two pollutants. Moreover, during the sample study
period of 1990 - 2008 in this paper, there exist substantial variations in county-level nonat-
tainment/attainment designations in both earlier and late sample period, allowing us to
identify the causal effects of county-level environmental controls on plant closure decisions.
2.2 Emission Evolution in TRI
Table 1 shows total on-site released pollutants at the industry level. Judged by the total
emission, the manufacturing industry, i.e. 2-digit SIC codes from 20 to 39, is the biggest
emitter. Thus in this study, we will focus on manufacture firms.
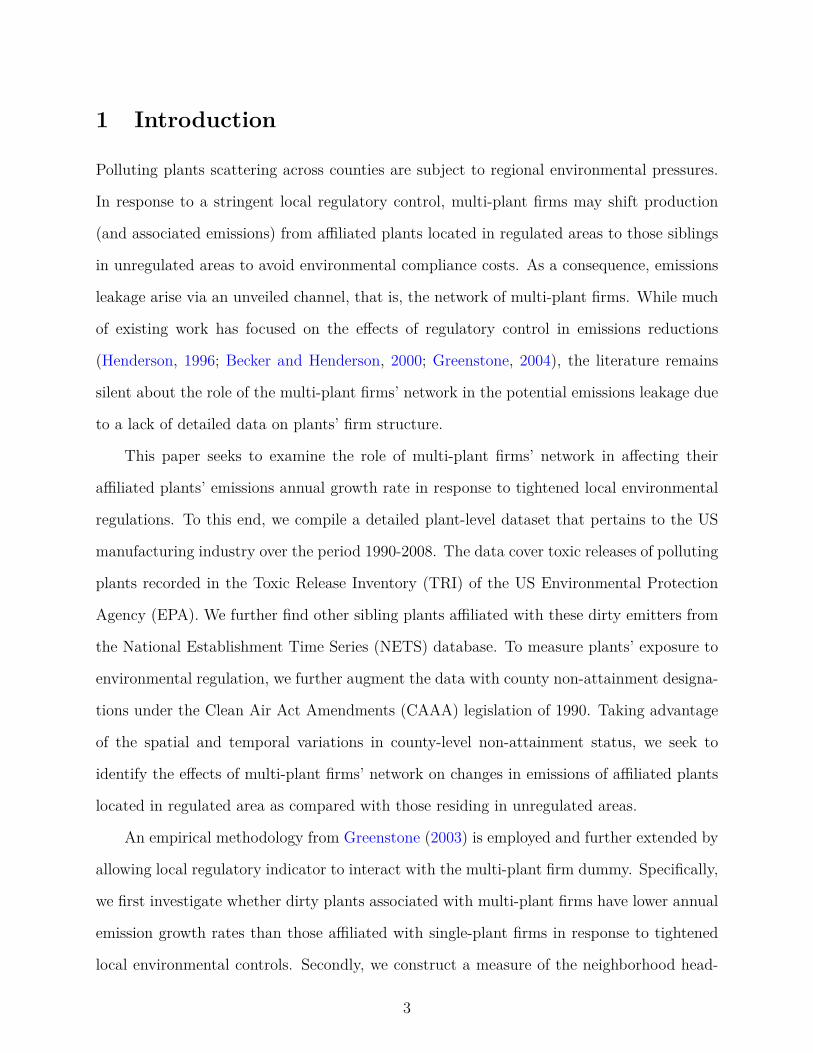
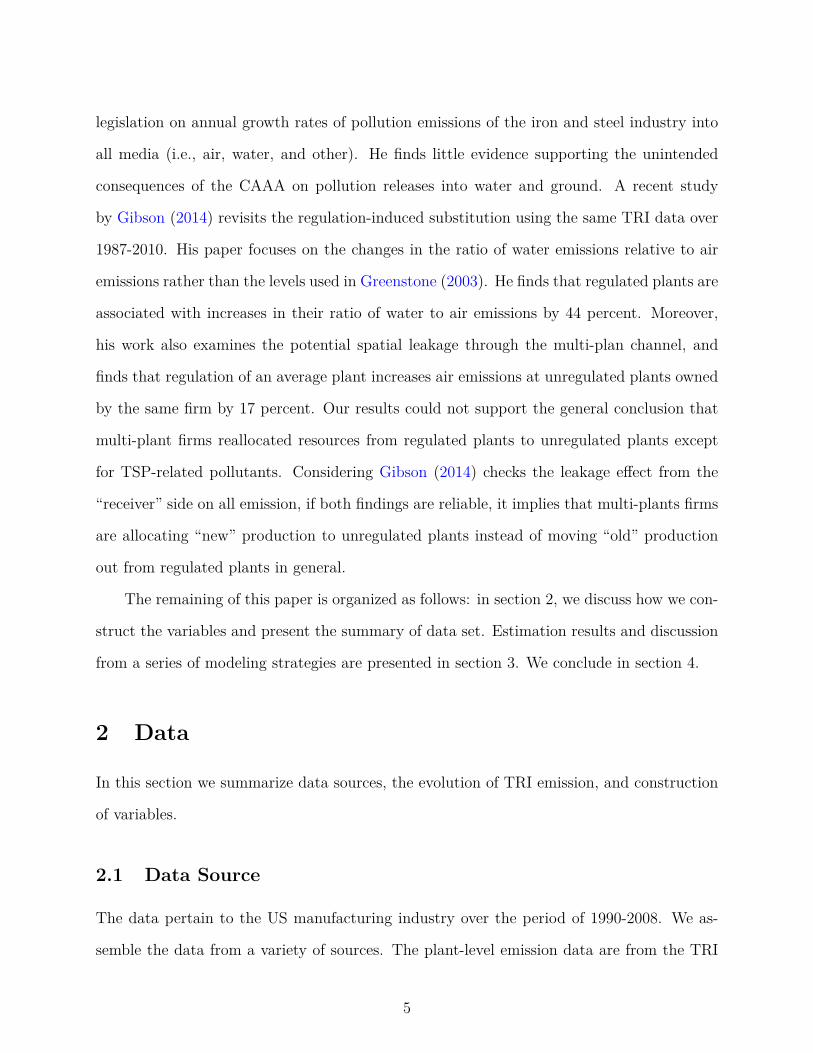
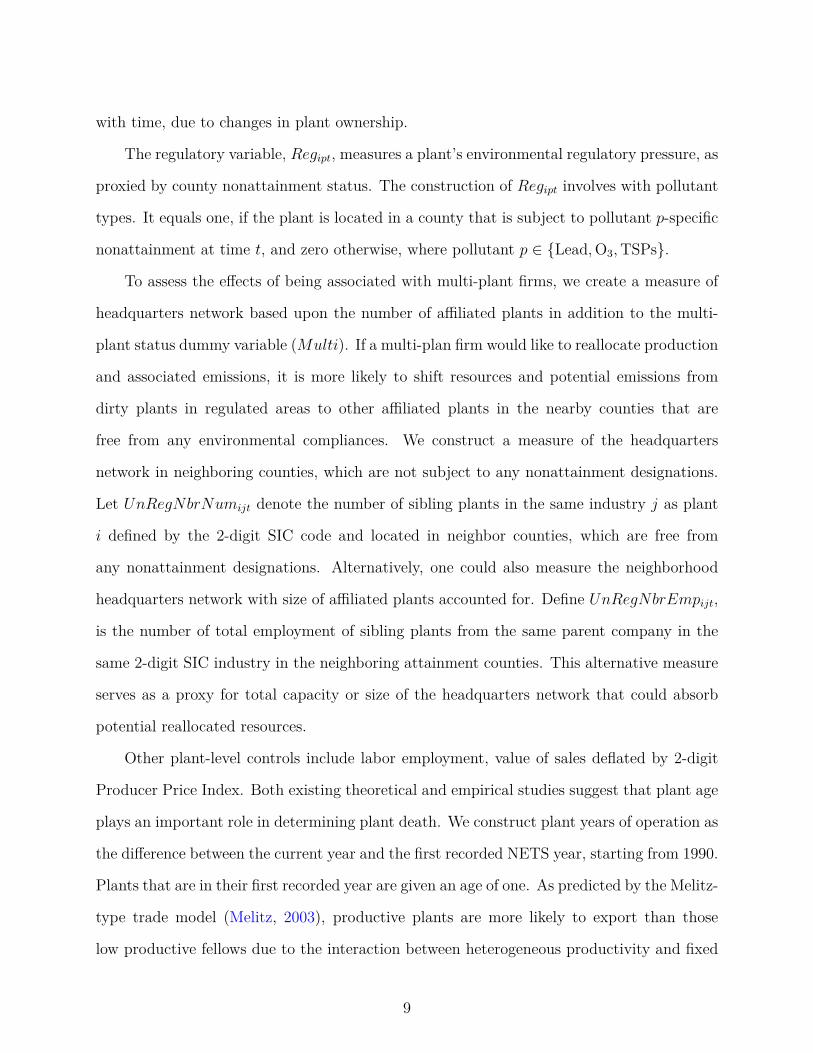
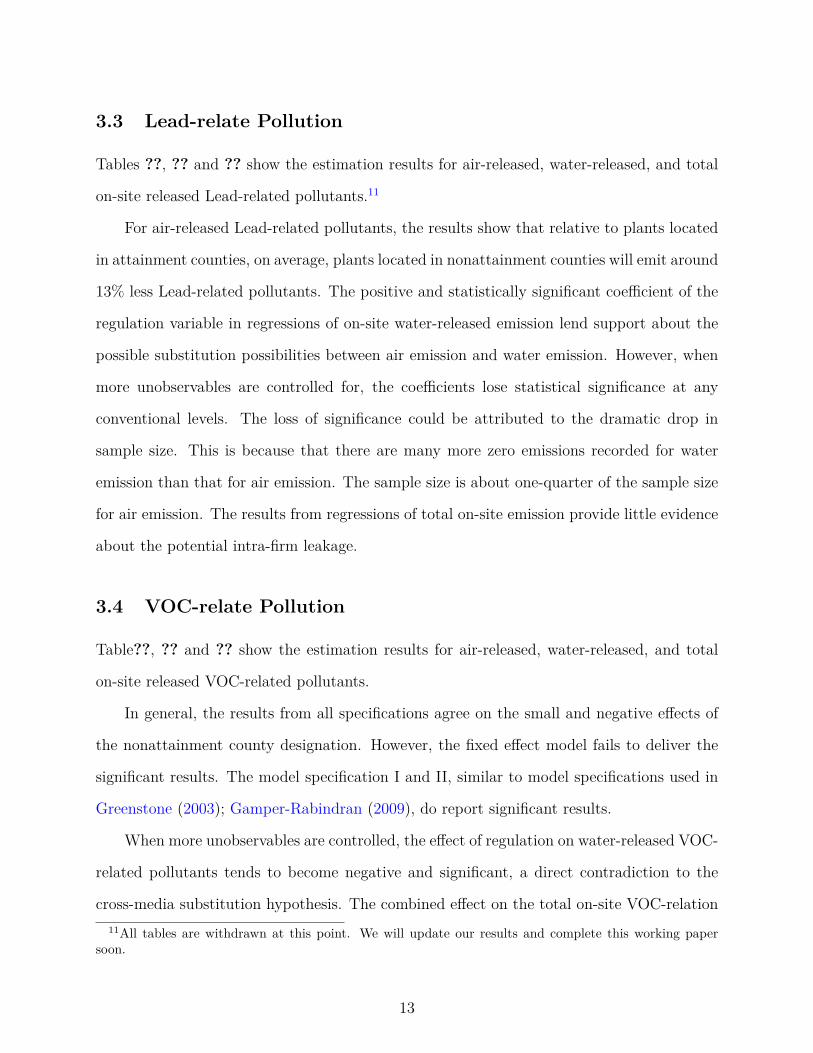
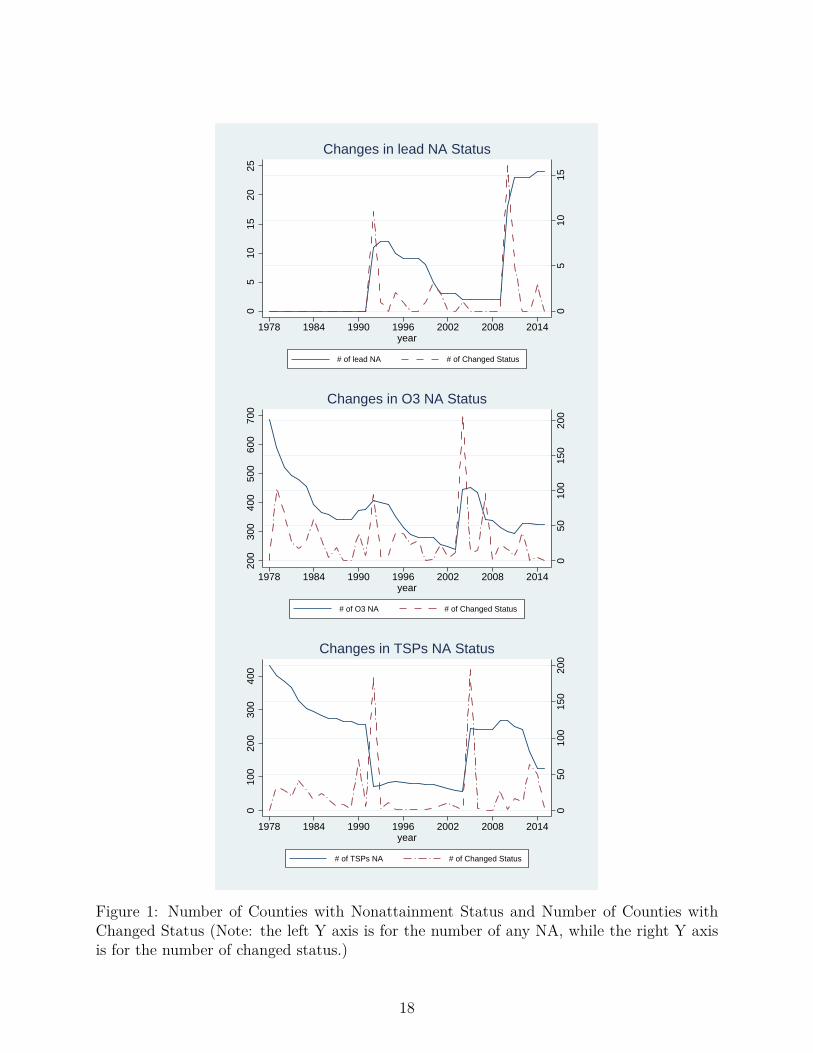
Figure 2 shows the trend of total on-site released pollutants during the sample period
from the manufacture industry. Each series is normalized by its 1989 value. Although there
are some variations in each pollutant category, the overall decreasing trend in each category is2See http://www.epa.gov/air/oaqps/greenbk/index.html.3The formation of ground-level O3 is a complicated chemical process that involves Volatile Organic
Compounds (VOCs) and Oxide of Nitrogen (NOx) when these two react in the presence of sunlight. Weclassify a county as nonattainment for O3 if it is in nonattainment for NOx and/or O3, including both 1-hourand 8-hour standards. In the case of TSPs, a county is defined as TSPs-specific nonattainment when it is innonattainment for PM10 and/or PM2.5.
7
clear. Most decrease was seen with the VOC pollutants, closely followed by PM-related and
Lead-related pollutants.4 While at the same time, the total sales has been seen a moderate
increase5. These trends show that after almost 20 years of 1990 Clean Air Act Amendment,
the emission of pollutants reported in TRI has been reduced substantially.
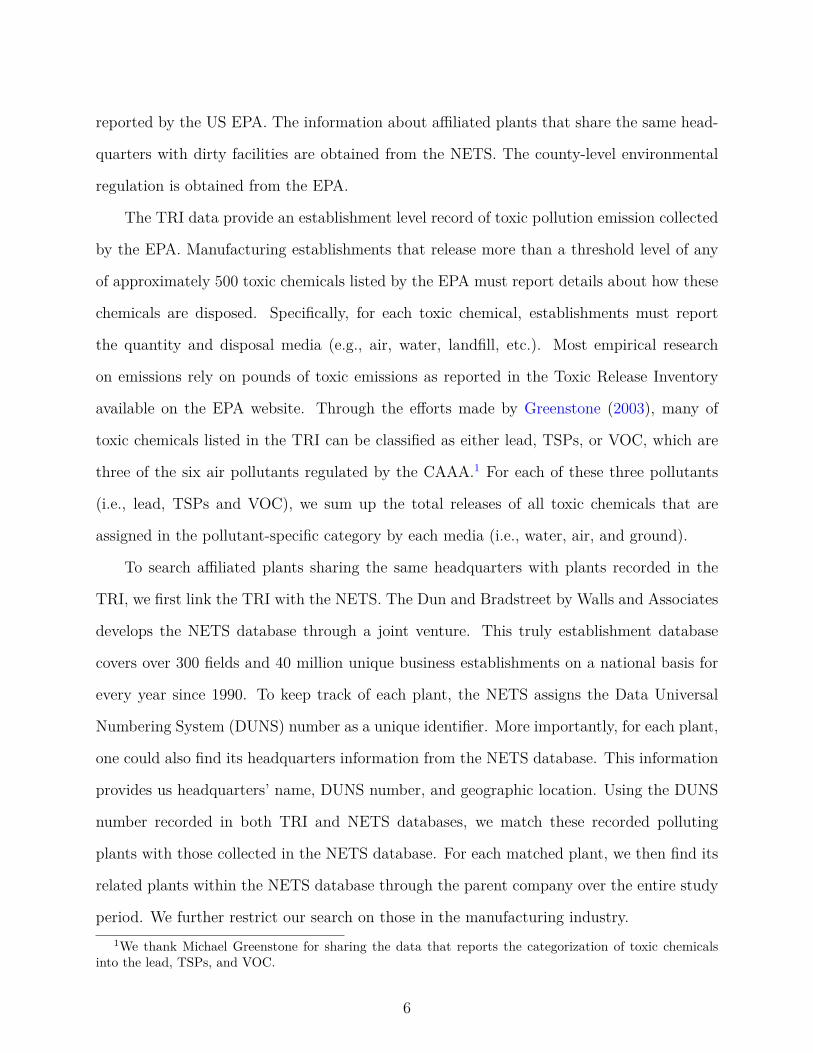
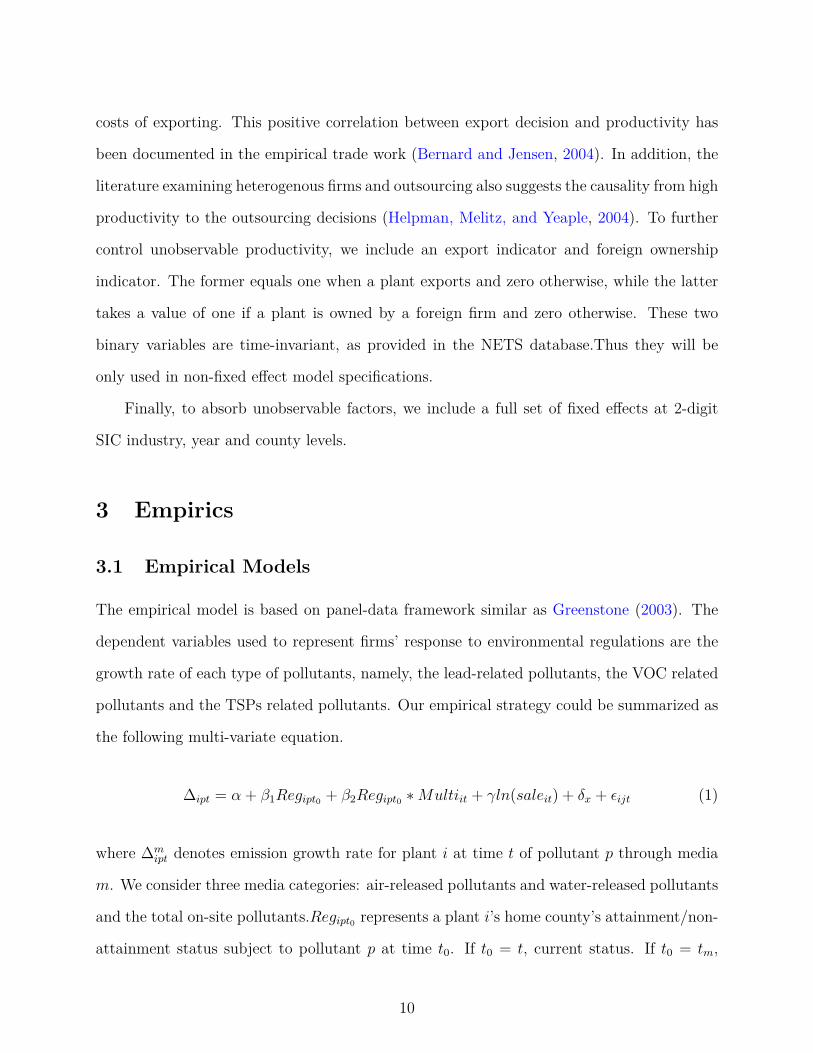
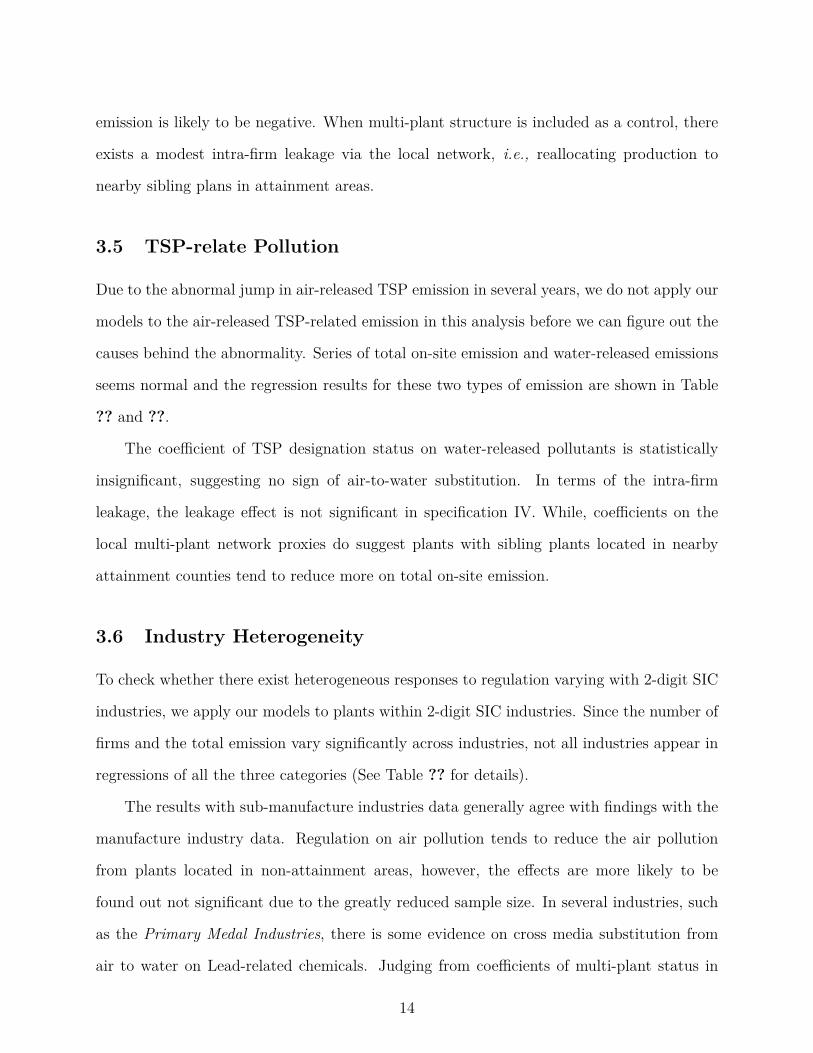
Figure 3 shows the series broken down by firm’s multi-plant status. Air emission from
both types of plants decreases significantly from the level at the base year with a slightly
more reduction for multi-plants firms.
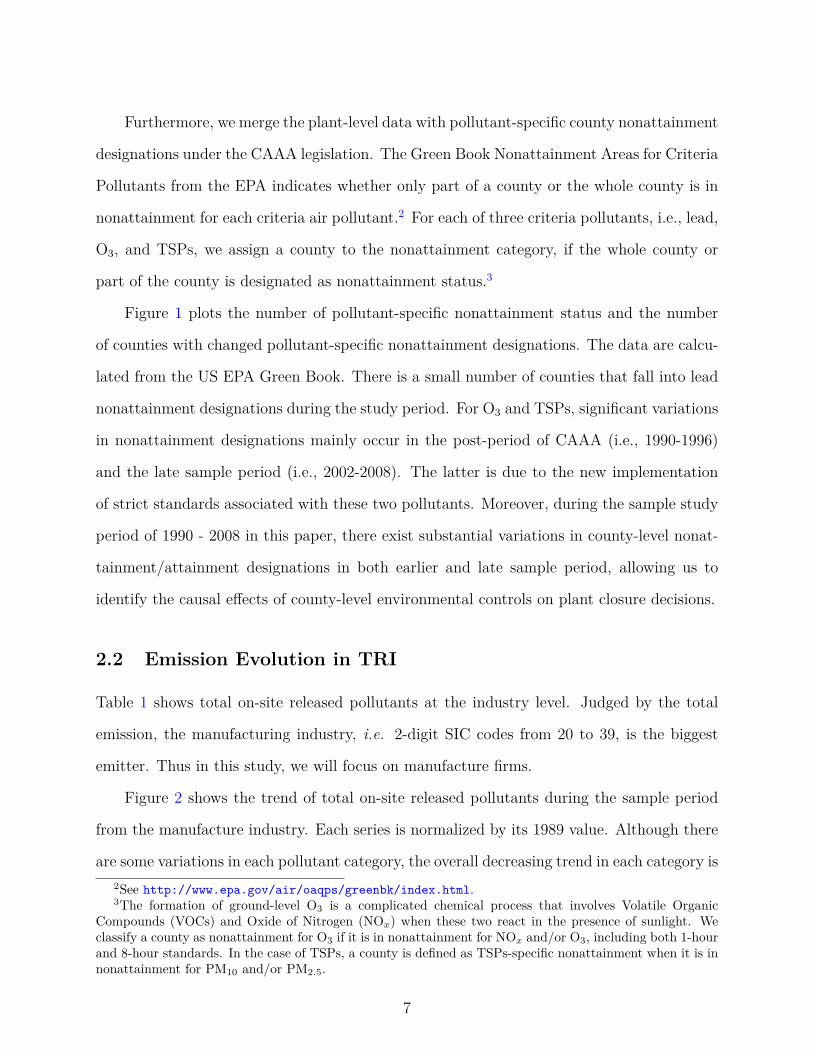
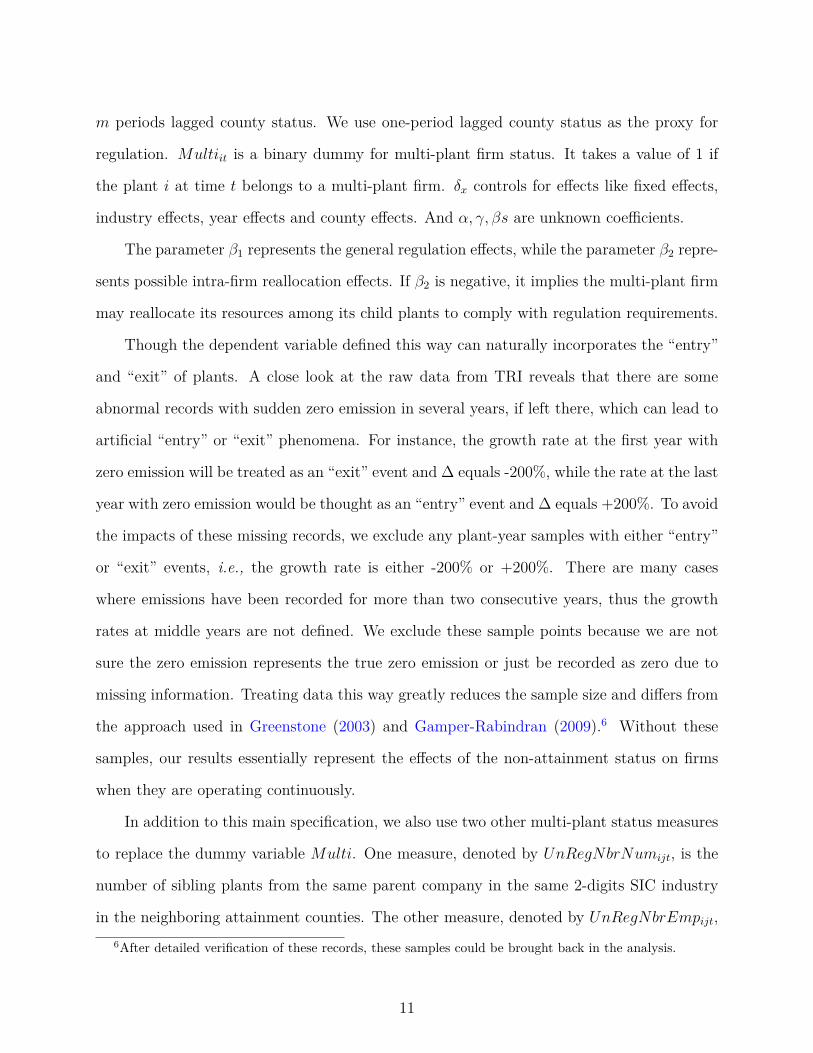
Table 2 shows the air-released pollutant by 2-digit SIC manufacture industries at 1989
and 2008. For major polluters in each category, the decreasing of air-released pollutants
is significant except the primary metal product industry (SIC2 = 33) on air-released total
suspended particles. Overall, the emission by the whole manufacture industry decreases by
66%, 78% and 74% on Lead-related pollutants, VOC related pollutants and TSP-related
pollutants, respectively.
2.3 Variables Construction
We construct outcome variable and other variables of interest that may be influential factors
to determine plants’ emissions.
Dependent variables of interests are annual growth rates of three different pollutant emis-
sions released by three media. Define ∆mipt as emission annual growth rates for plant i at time t
of pollutant p through mediam, where p ∈ {Lead,O3,TSPs}, andm ∈ {water, air, total on-site}.
A plant is defined as belonging to a multi-plant firm, if there exists at least one other
plant affiliated with the same parent company in terms of sharing the same headquarters’
DUNS number at time t; it is a single-plant firm, otherwise. Thus, Multiit denotes the
multi-plant firm binary indicator. Note that, the multi-plant affiliation status may vary4There are several missing points in the PM series. The reason is that at those years, the total amount
of air-released PM was substantially larger than the amount in other years. A close check shows that theshare between air released emission and land-released emission is abnormal. Thus, we will not include thiscategory in the subsequent analysis.
5The sales information may not be accurate, the trend of sales presented there should be interpreted withcautions.
8
with time, due to changes in plant ownership.
The regulatory variable, Regipt, measures a plant’s environmental regulatory pressure, as
proxied by county nonattainment status. The construction of Regipt involves with pollutant
types. It equals one, if the plant is located in a county that is subject to pollutant p-specific
nonattainment at time t, and zero otherwise, where pollutant p ∈ {Lead,O3,TSPs}.
To assess the effects of being associated with multi-plant firms, we create a measure of
headquarters network based upon the number of affiliated plants in addition to the multi-
plant status dummy variable (Multi). If a multi-plan firm would like to reallocate production
and associated emissions, it is more likely to shift resources and potential emissions from
dirty plants in regulated areas to other affiliated plants in the nearby counties that are
free from any environmental compliances. We construct a measure of the headquarters
network in neighboring counties, which are not subject to any nonattainment designations.
Let UnRegNbrNumijt denote the number of sibling plants in the same industry j as plant
i defined by the 2-digit SIC code and located in neighbor counties, which are free from
any nonattainment designations. Alternatively, one could also measure the neighborhood
headquarters network with size of affiliated plants accounted for. Define UnRegNbrEmpijt,
is the number of total employment of sibling plants from the same parent company in the
same 2-digit SIC industry in the neighboring attainment counties. This alternative measure
serves as a proxy for total capacity or size of the headquarters network that could absorb
potential reallocated resources.
Other plant-level controls include labor employment, value of sales deflated by 2-digit
Producer Price Index. Both existing theoretical and empirical studies suggest that plant age
plays an important role in determining plant death. We construct plant years of operation as
the difference between the current year and the first recorded NETS year, starting from 1990.
Plants that are in their first recorded year are given an age of one. As predicted by the Melitz-
type trade model (Melitz, 2003), productive plants are more likely to export than those
low productive fellows due to the interaction between heterogeneous productivity and fixed
9
costs of exporting. This positive correlation between export decision and productivity has
been documented in the empirical trade work (Bernard and Jensen, 2004). In addition, the
literature examining heterogenous firms and outsourcing also suggests the causality from high
productivity to the outsourcing decisions (Helpman, Melitz, and Yeaple, 2004). To further
control unobservable productivity, we include an export indicator and foreign ownership
indicator. The former equals one when a plant exports and zero otherwise, while the latter
takes a value of one if a plant is owned by a foreign firm and zero otherwise. These two
binary variables are time-invariant, as provided in the NETS database.Thus they will be
only used in non-fixed effect model specifications.
Finally, to absorb unobservable factors, we include a full set of fixed effects at 2-digit
SIC industry, year and county levels.
3 Empirics
3.1 Empirical Models
The empirical model is based on panel-data framework similar as Greenstone (2003). The
dependent variables used to represent firms’ response to environmental regulations are the
growth rate of each type of pollutants, namely, the lead-related pollutants, the VOC related
pollutants and the TSPs related pollutants. Our empirical strategy could be summarized as
the following multi-variate equation.
∆ipt = α + β1Regipt0 + β2Regipt0 ∗Multiit + γln(saleit) + δx + εijt (1)
where ∆mipt denotes emission growth rate for plant i at time t of pollutant p through media
m. We consider three media categories: air-released pollutants and water-released pollutants
and the total on-site pollutants.Regipt0 represents a plant i’s home county’s attainment/non-
attainment status subject to pollutant p at time t0. If t0 = t, current status. If t0 = tm,
10
m periods lagged county status. We use one-period lagged county status as the proxy for
regulation. Multiit is a binary dummy for multi-plant firm status. It takes a value of 1 if
the plant i at time t belongs to a multi-plant firm. δx controls for effects like fixed effects,
industry effects, year effects and county effects. And α, γ, βs are unknown coefficients.
The parameter β1 represents the general regulation effects, while the parameter β2 repre-
sents possible intra-firm reallocation effects. If β2 is negative, it implies the multi-plant firm
may reallocate its resources among its child plants to comply with regulation requirements.
Though the dependent variable defined this way can naturally incorporates the “entry”
and “exit” of plants. A close look at the raw data from TRI reveals that there are some
abnormal records with sudden zero emission in several years, if left there, which can lead to
artificial “entry” or “exit” phenomena. For instance, the growth rate at the first year with
zero emission will be treated as an “exit” event and ∆ equals -200%, while the rate at the last
year with zero emission would be thought as an “entry” event and ∆ equals +200%. To avoid
the impacts of these missing records, we exclude any plant-year samples with either “entry”
or “exit” events, i.e., the growth rate is either -200% or +200%. There are many cases
where emissions have been recorded for more than two consecutive years, thus the growth
rates at middle years are not defined. We exclude these sample points because we are not
sure the zero emission represents the true zero emission or just be recorded as zero due to
missing information. Treating data this way greatly reduces the sample size and differs from
the approach used in Greenstone (2003) and Gamper-Rabindran (2009).6 Without these
samples, our results essentially represent the effects of the non-attainment status on firms
when they are operating continuously.
In addition to this main specification, we also use two other multi-plant status measures
to replace the dummy variable Multi. One measure, denoted by UnRegNbrNumijt, is the
number of sibling plants from the same parent company in the same 2-digits SIC industry
in the neighboring attainment counties. The other measure, denoted by UnRegNbrEmpijt,6After detailed verification of these records, these samples could be brought back in the analysis.
11
is the number of total employment of sibling plants from the same parent company in the
same 2-digit SIC industry in the neighboring attainment counties.7 We also applies different
set of dummies to control the unobservable factors across specifications.8
3.2 Main Results
The empirical models are used to examine two questions of interests: are there any cross-
media substitution effects of the regulation? are there any intra-firm leakages among plants
affiliated with the same multi-plant firms? The first question could be answered with the
coefficient of regulation variables on the growth rate of water-released emission. A posi-
tive coefficient implies the possible cross-media substitution happens when the regulation
is imposed. The second question could be answered by checking whether the coefficient on
multi-plant status measures are negative when the dependent variable is the total on-site
emission. Since the pollutants are by-products of the production process, the total on-site
emission is a good proxy for the production activities.9 However, the existence of sibling
plants in the neighborhood area can also indicate the local conglomeration effect, which will
have positive effect on plants’ activities, so does on the emission. The sign of these coeffi-
cients represents the combined effects: incentives and possibilities to re-allocate resources to
the sibling plants (negative) and the conglomeration effects (positive).10
7The criteria could also be the plants or employment from the same 4-digit SIC industry. However, if thatrestriction is used, the number of the plants with positive sibling plants in neighboring countries is greatlyreduced.
8We report details about which set of unobservables are controlled in each estimation result table.9We also include multi-plant status variables in air-released emission and water-released emission regres-
sions.10Direction measures of conglomeration effects could be found by constructing some variables based on
local input-output tables to look at the local demands for the product of the plant from the downstreamindustries and input support for the plant from upstream industries. Here, we have not constructed thesevariable yet.
12
3.3 Lead-relate Pollution
Tables ??, ?? and ?? show the estimation results for air-released, water-released, and total
on-site released Lead-related pollutants.11
For air-released Lead-related pollutants, the results show that relative to plants located
in attainment counties, on average, plants located in nonattainment counties will emit around
13% less Lead-related pollutants. The positive and statistically significant coefficient of the
regulation variable in regressions of on-site water-released emission lend support about the
possible substitution possibilities between air emission and water emission. However, when
more unobservables are controlled for, the coefficients lose statistical significance at any
conventional levels. The loss of significance could be attributed to the dramatic drop in
sample size. This is because that there are many more zero emissions recorded for water
emission than that for air emission. The sample size is about one-quarter of the sample size
for air emission. The results from regressions of total on-site emission provide little evidence
about the potential intra-firm leakage.
3.4 VOC-relate Pollution
Table??, ?? and ?? show the estimation results for air-released, water-released, and total
on-site released VOC-related pollutants.
In general, the results from all specifications agree on the small and negative effects of
the nonattainment county designation. However, the fixed effect model fails to deliver the
significant results. The model specification I and II, similar to model specifications used in
Greenstone (2003); Gamper-Rabindran (2009), do report significant results.
When more unobservables are controlled, the effect of regulation on water-released VOC-
related pollutants tends to become negative and significant, a direct contradiction to the
cross-media substitution hypothesis. The combined effect on the total on-site VOC-relation11All tables are withdrawn at this point. We will update our results and complete this working paper
soon.
13
emission is likely to be negative. When multi-plant structure is included as a control, there
exists a modest intra-firm leakage via the local network, i.e., reallocating production to
nearby sibling plans in attainment areas.
3.5 TSP-relate Pollution
Due to the abnormal jump in air-released TSP emission in several years, we do not apply our
models to the air-released TSP-related emission in this analysis before we can figure out the
causes behind the abnormality. Series of total on-site emission and water-released emissions
seems normal and the regression results for these two types of emission are shown in Table
?? and ??.
The coefficient of TSP designation status on water-released pollutants is statistically
insignificant, suggesting no sign of air-to-water substitution. In terms of the intra-firm
leakage, the leakage effect is not significant in specification IV. While, coefficients on the
local multi-plant network proxies do suggest plants with sibling plants located in nearby
attainment counties tend to reduce more on total on-site emission.
3.6 Industry Heterogeneity
To check whether there exist heterogeneous responses to regulation varying with 2-digit SIC
industries, we apply our models to plants within 2-digit SIC industries. Since the number of
firms and the total emission vary significantly across industries, not all industries appear in
regressions of all the three categories (See Table ?? for details).
The results with sub-manufacture industries data generally agree with findings with the
manufacture industry data. Regulation on air pollution tends to reduce the air pollution
from plants located in non-attainment areas, however, the effects are more likely to be
found out not significant due to the greatly reduced sample size. In several industries, such
as the Primary Medal Industries, there is some evidence on cross media substitution from
air to water on Lead-related chemicals. Judging from coefficients of multi-plant status in
14
regressions, there are still no strong evidence to support the existence of intra-firm pollution
leakage in general.
4 Conclusion
Using the plant-level emission data from TRI database together with the multi-plant firms
structure obtained from the NETS database, we attempt to answer three questions in this
paper. Do the CAAA regulation by assigning attainment/nonattainment status to counties
have intended impact on plant-level air emission? Are there any cross pollution media
substitution such as from air pollution to water pollution? Are there any intra-firm emission
leakage effects for multi-plant firms?
The results from our empirical models deliver mixed answers to these questions. Gen-
erally, we find intended effects on air pollution reduction, although in some specifications
the effect is in the right direction, but is not statistically significant. Secondly, we only find
some evidence on the air-to-water substitution for Lead-related emission. We could not find
any significant evidence on the intra-firm leakage in general for all the three types of pollu-
tants. However, there may exist the negative effect of local multi-plant network on emission,
lending support on the indirect evidence of the possible intra-firm production allocation.
References
Becker, R., Henderson, V., 2000. Effects of Air Quality Regulations on Polluting Industries.
Journal of Political Economy 108 (2), 379–421.
Bernard, A. B., Jensen, J. B., 2004. Why Some Firms Export. The Review of Economics
and Statistics 86 (2), 561–569.
Brunnermeier, S. B., Levinson, A., 2004. Examining the Evidence on Environmental Regu-
lations and Industry Location. The Journal of Environment & Development 13 (1), 6–41.
15
Gamper-Rabindran, S., 2009. The clean air act and volatile organic compounds: Did plants
reduce their health-indexed air emissions or shift their emissions into other media? Tech.
rep., Mimeo.
Gibson, M., 2014. Dirty and Perverse: Regulation-Induced Pollution Substitution. Working
paper.
Greenstone, M., 2003. Estimating Regulation-Induced Substitution: The Effect of the Clean
Air Act on Water and Ground Pollution. American Economic Review 93 (2), 442–448.
Greenstone, M., 2004. Did the Clean Air Act Cause the Remarkable Decline in Sulfur Dioxide
Concentrations? Journal of Environmental Economics and Management 47 (3), 585–611.
Hanna, R., July 2010. Us environmental regulation and fdi: Evidence from a panel of us-
based multinational firms. American Economic Journal: Applied Economics 2 (3), 158–89.
Helpman, E., Melitz, M. J., Yeaple, S. R., 2004. Export Versus FDI with Heterogeneous
Firms. American Economic Review 94 (1), 300–316.
Henderson, J. V., 1996. Effects of Air Quality Regulation. American Economic Review 86 (4),
789–813.
Jeppesen, T., List, J. A., Folmer, H., 2002. Environmental Regulations and New Plant
Location Decisions: Evidence from A Meta-Analysis. Journal of Regional Science 42 (1),
19–49.
List, J. A., McHone, W. W., Millimet, D. L., 2003a. Effects of Air Quality Regulation on
the Destination Choice of Relocating Plants. Oxford Economic Papers 55 (4), 657–678.
List, J. A., Millimet, D. L., Fredriksson, P. G., McHone, W. W., 2003b. Effects of Envi-
ronmental Regulations on Manufacturing Plant Births: Evidence from a Propensity Score
Matching Estimator. The Review of Economics and Statistics 85 (4), 944–952.
16

Melitz, M., 2003. The Impact of Trade on Intra-Industry Reallocations and Aggregate In-
dustry Productivity. Econometrica 71 (6), 1695–1725.
17
05
1015
05
1015
2025
1978 1984 1990 1996 2002 2008 2014year
# of lead NA # of Changed Status
Changes in lead NA Status
050
100
150
200
200
300
400
500
600
700
1978 1984 1990 1996 2002 2008 2014year
# of O3 NA # of Changed Status
Changes in O3 NA Status
050
100
150
200
010
020
030
040
0
1978 1984 1990 1996 2002 2008 2014year
# of TSPs NA # of Changed Status
Changes in TSPs NA Status
Figure 1: Number of Counties with Nonattainment Status and Number of Counties withChanged Status (Note: the left Y axis is for the number of any NA, while the right Y axisis for the number of changed status.)
18
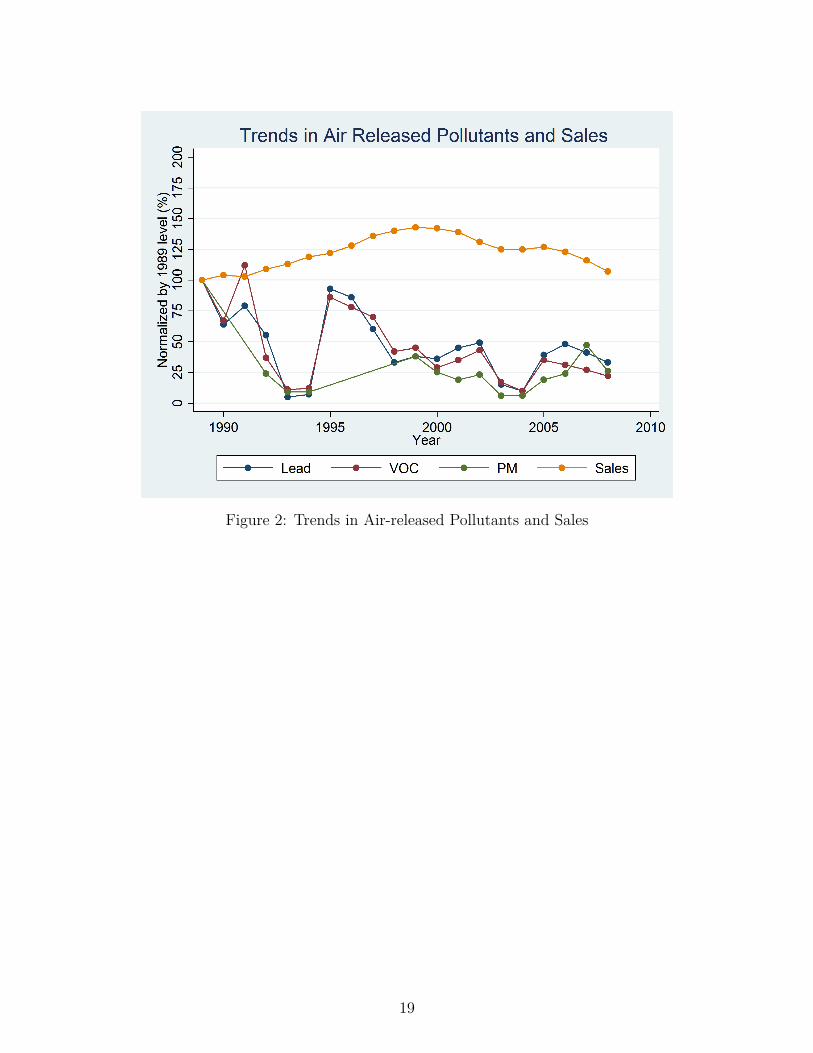
Figure 2: Trends in Air-released Pollutants and Sales
19
Figure 3: Trends in Air-released Pollutants and Sales by Multi-plant Status
20
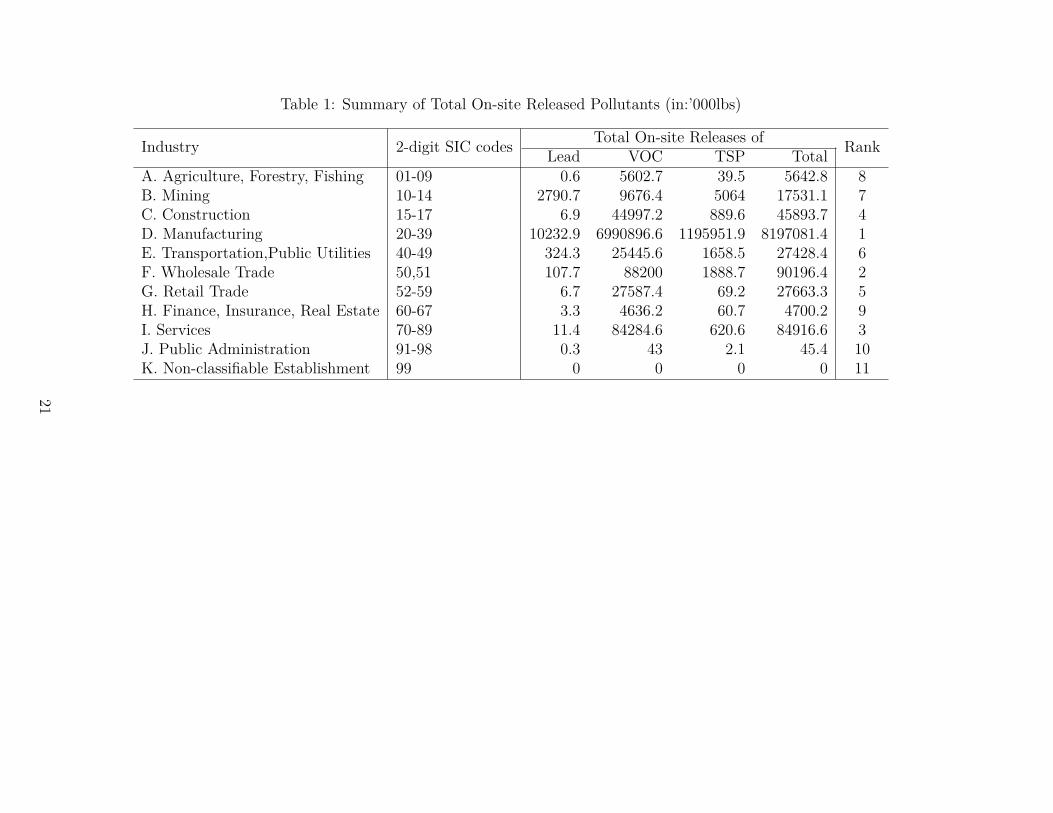
Table 1: Summary of Total On-site Released Pollutants (in:’000lbs)
Industry 2-digit SIC codes Total On-site Releases of RankLead VOC TSP TotalA. Agriculture, Forestry, Fishing 01-09 0.6 5602.7 39.5 5642.8 8B. Mining 10-14 2790.7 9676.4 5064 17531.1 7C. Construction 15-17 6.9 44997.2 889.6 45893.7 4D. Manufacturing 20-39 10232.9 6990896.6 1195951.9 8197081.4 1E. Transportation,Public Utilities 40-49 324.3 25445.6 1658.5 27428.4 6F. Wholesale Trade 50,51 107.7 88200 1888.7 90196.4 2G. Retail Trade 52-59 6.7 27587.4 69.2 27663.3 5H. Finance, Insurance, Real Estate 60-67 3.3 4636.2 60.7 4700.2 9I. Services 70-89 11.4 84284.6 620.6 84916.6 3J. Public Administration 91-98 0.3 43 2.1 45.4 10K. Non-classifiable Establishment 99 0 0 0 0 11
21
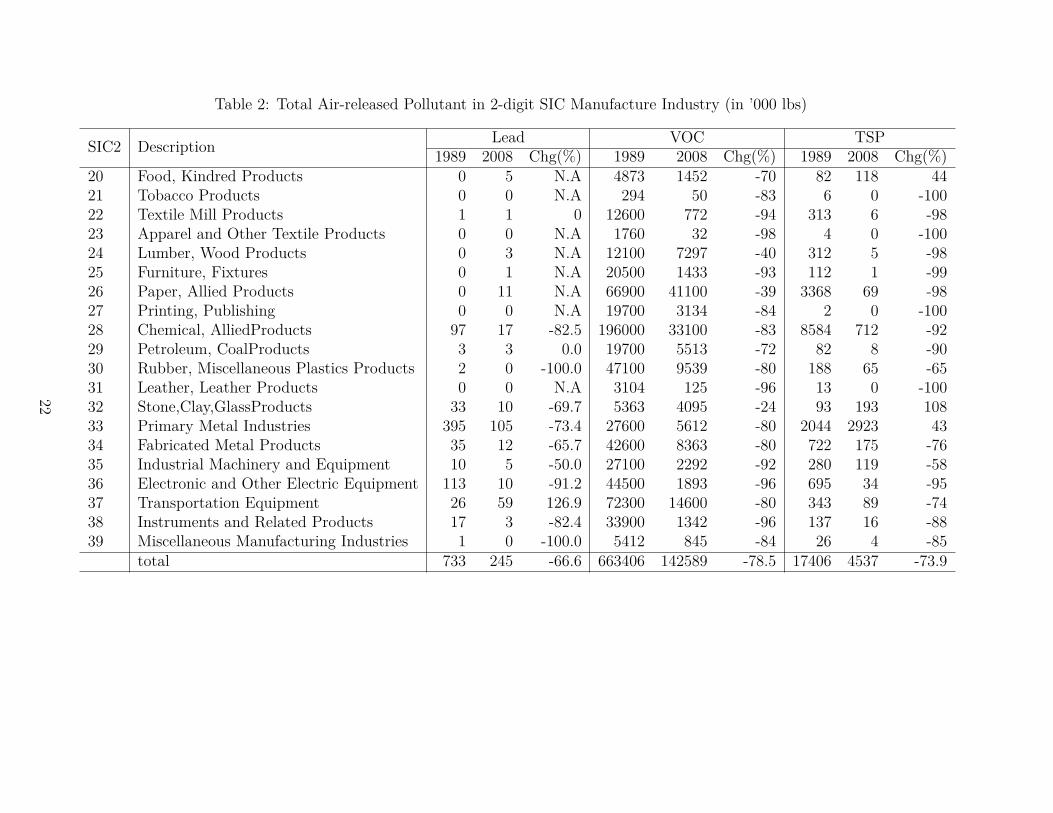
Table 2: Total Air-released Pollutant in 2-digit SIC Manufacture Industry (in ’000 lbs)
SIC2 Description Lead VOC TSP1989 2008 Chg(%) 1989 2008 Chg(%) 1989 2008 Chg(%)
20 Food, Kindred Products 0 5 N.A 4873 1452 -70 82 118 4421 Tobacco Products 0 0 N.A 294 50 -83 6 0 -10022 Textile Mill Products 1 1 0 12600 772 -94 313 6 -9823 Apparel and Other Textile Products 0 0 N.A 1760 32 -98 4 0 -10024 Lumber, Wood Products 0 3 N.A 12100 7297 -40 312 5 -9825 Furniture, Fixtures 0 1 N.A 20500 1433 -93 112 1 -9926 Paper, Allied Products 0 11 N.A 66900 41100 -39 3368 69 -9827 Printing, Publishing 0 0 N.A 19700 3134 -84 2 0 -10028 Chemical, AlliedProducts 97 17 -82.5 196000 33100 -83 8584 712 -9229 Petroleum, CoalProducts 3 3 0.0 19700 5513 -72 82 8 -9030 Rubber, Miscellaneous Plastics Products 2 0 -100.0 47100 9539 -80 188 65 -6531 Leather, Leather Products 0 0 N.A 3104 125 -96 13 0 -10032 Stone,Clay,GlassProducts 33 10 -69.7 5363 4095 -24 93 193 10833 Primary Metal Industries 395 105 -73.4 27600 5612 -80 2044 2923 4334 Fabricated Metal Products 35 12 -65.7 42600 8363 -80 722 175 -7635 Industrial Machinery and Equipment 10 5 -50.0 27100 2292 -92 280 119 -5836 Electronic and Other Electric Equipment 113 10 -91.2 44500 1893 -96 695 34 -9537 Transportation Equipment 26 59 126.9 72300 14600 -80 343 89 -7438 Instruments and Related Products 17 3 -82.4 33900 1342 -96 137 16 -8839 Miscellaneous Manufacturing Industries 1 0 -100.0 5412 845 -84 26 4 -85
total 733 245 -66.6 663406 142589 -78.5 17406 4537 -73.9
22

All estimation results are very preliminary, we choose not to report Tables and Figuresinvolving these results. Interested readers could contact author for further information.
23