Embed Size (px)
Citation preview

The views expressed in this report do not necessarily reflect the views or policy of the International Energy Agency (IEA) Secretariat or of its individual member countries. The paper does not constitute advice on any specific issue or situation. The IEA makes no representation or warranty, express or implied, in respect of the paper’s content (including its completeness or accuracy) and shall not be responsible for any use of, or reliance on, the paper. Comments are welcome, directed to [email protected].
© OECD/IEA, 2014
Emissions Trading in the People’s Republic of China: A Simulation for the Power Sector
Christopher Guelff and Liwayway Adkins

INTERNATIONAL ENERGY AGENCY
The International Energy Agency (IEA), an autonomous agency, was established in November 1974. Its primary mandate was – and is – two-fold: to promote energy security amongst its member
countries through collective response to physical disruptions in oil supply, and provide authoritative research and analysis on ways to ensure reliable, affordable and clean energy for its 29 member countries and beyond. The IEA carries out a comprehensive programme of energy co-operation among its member countries, each of which is obliged to hold oil stocks equivalent to 90 days of its net imports. The Agency’s aims include the following objectives:
n Secure member countries’ access to reliable and ample supplies of all forms of energy; in particular, through maintaining effective emergency response capabilities in case of oil supply disruptions.
n Promote sustainable energy policies that spur economic growth and environmental protection in a global context – particularly in terms of reducing greenhouse-gas emissions that contribute to climate change.
n Improve transparency of international markets through collection and analysis of energy data.
n Support global collaboration on energy technology to secure future energy supplies and mitigate their environmental impact, including through improved energy
efficiency and development and deployment of low-carbon technologies.
n Find solutions to global energy challenges through engagement and dialogue with non-member countries, industry, international
organisations and other stakeholders.IEA member countries:
Australia Austria
Belgium Canada
Czech RepublicDenmark
EstoniaFinland
FranceGermany
GreeceHungary
Ireland Italy
JapanKorea (Republic of)LuxembourgNetherlandsNew Zealand NorwayPolandPortugalSlovak RepublicSpainSweden
SwitzerlandTurkey
United KingdomUnited States
The European Commission also participates in
the work of the IEA.
© OECD/IEA, 2014International Energy Agency
9 rue de la Fédération 75739 Paris Cedex 15, France
www.iea.org
Please note that this publication is subject to specific restrictions that limit its use and distribution.
The terms and conditions are available online at http://www.iea.org/termsandconditionsuseandcopyright/

© OECD/IEA 2014 Emissions Trading in the People’s Republic of China
Page | 1
Table of contents Acknowledgements ................................................................................................................................. 4 1. Executive summary ......................................................................................................................... 5
Overview.............................................................................................................................................. 5 Why run a simulation? ........................................................................................................................ 5 China’s power sector and emissions challenge ................................................................................... 5 Structure of the ETS simulation ........................................................................................................... 6 Simulation outcomes in brief .............................................................................................................. 6 Insights ................................................................................................................................................ 7 Implications for design of a national Chinese ETS ............................................................................... 7
2. Introduction .................................................................................................................................... 9 3. Context .......................................................................................................................................... 10
China’s steps towards an ETS ............................................................................................................ 10 China’s power sector ......................................................................................................................... 10
Chinese power demand ................................................................................................................ 11 Chinese generation mix and company composition ..................................................................... 11 Chinese power regulation, prices and allocation .......................................................................... 12
4. Why run a simulation, and high-level design choices ................................................................... 13 What simulations can achieve ........................................................................................................... 13 Simulation objectives and overall scope ........................................................................................... 13 Other macro-level design choices ..................................................................................................... 13
5. Building this simulation ................................................................................................................. 15 Gathering participants, building a simulation world and setting objectives .................................... 15 Building new power stations ............................................................................................................. 16 Using scenarios to test different policies and rules .......................................................................... 16 Running the simulation ..................................................................................................................... 18 Operating tools and trading .............................................................................................................. 18 Trading platform and rules ................................................................................................................ 18 Offsets – acquisition and trading ...................................................................................................... 19 Winners ............................................................................................................................................. 19
6. Simulation results ......................................................................................................................... 21 VPC performance .............................................................................................................................. 21
Basic observations ........................................................................................................................ 21 Building new power stations......................................................................................................... 21 Emissions ....................................................................................................................................... 21
Carbon market outcomes .................................................................................................................. 22 Carbon prices rose as the simulation got harder .......................................................................... 22 Greater trade volumes in Robust trade scenarios ........................................................................ 23 Compliance more expensive when trading opportunities more limited ...................................... 24
Simulation-driven outcomes ............................................................................................................. 24 Having separate buy and sell markets apparently inefficient ...................................................... 24 VPC trading behaviour .................................................................................................................. 24 Preference for offsets over allowances ........................................................................................ 25
Limitations ......................................................................................................................................... 25 Conclusions ........................................................................................................................................ 26
7. Implications for designing a national Chinese ETS ........................................................................ 27 Annex A: Methodology ......................................................................................................................... 29
The increasing generation requirement ............................................................................................ 29 Capacity versus output and intermittent renewables ...................................................................... 29 The spreadsheet tool and dispatch ................................................................................................... 29

Emissions Trading in the People’s Republic of China © OECD/IEA 2014
Page | 2
Annex B: VPC configurations ................................................................................................................. 31 Identical and buyer VPCs ................................................................................................................... 32 Seller VPCs ......................................................................................................................................... 32
Annex C: Selected parameters: power stations, tariffs and “switching values” ................................... 33 1. Power plants .................................................................................................................................. 33 2. Tariff structure (fuel-based) .......................................................................................................... 34 3. Plant comparison by operating, carbon content and “levellised cost” ......................................... 35
Annex D: Trading mechanics, offset market ......................................................................................... 36 Basic structure ................................................................................................................................... 36 Trading ............................................................................................................................................... 36 Completion session ........................................................................................................................... 37 Offset market .................................................................................................................................... 37 Regulation ......................................................................................................................................... 37
Annex E: Scenario results ...................................................................................................................... 38 Scenario 1 (Robust trading, buyer-seller VPCs) ................................................................................. 38 Scenario 2 (Limited trading, buyer-seller VPCs) ................................................................................ 40 Scenario 3 (Robust trading, identical VPCs) ...................................................................................... 42 Scenario 4 (Limited trading, identical VPCs) ..................................................................................... 44
Annex F: Observations for developing a refined future simulation ..................................................... 46 Acronyms, abbreviations and units of measure ................................................................................... 47 References ............................................................................................................................................ 48
List of tables
Table 1 • Electricity generation capacity (GW) ..................................................................................... 11 Table 2 • Electricity generation output (TWh) ..................................................................................... 11 Table 3 • Scenario design and rules ..................................................................................................... 18 Table 4 • Fuel mix of a VPC ................................................................................................................... 31 Table 5 • Identical and buyer VPC power station configuration .......................................................... 32 Table 6 • Seller VPC power station configuration ................................................................................ 32 Table 7 • Power station parameters .................................................................................................... 33 Table 8 • Power station build times (years) ......................................................................................... 34 Table 9 • Power station capital costs ................................................................................................... 34 Table 10 • Tariff received by generation fuel used .............................................................................. 35 Table 11 • Power station rankings by different cost metrics ............................................................... 35 Table 12 • Offset market size by scenario ............................................................................................ 37 Table 13 • Scenario 1 trading summary ............................................................................................... 38 Table 14 • Scenario 2 trading summary ............................................................................................... 40 Table 15 • Scenario 3 trading summary ............................................................................................... 42 Table 16 • Scenario 4 trading summary ............................................................................................... 44

© OECD/IEA 2014 Emissions Trading in the People’s Republic of China
Page | 3
List of figures
Figure 1 • Chinese carbon emissions .................................................................................................... 10 Figure 2 • Chinese total gross electricity production (TWh) ................................................................ 11 Figure 3 • Flowchart of VPC actions year to year ................................................................................. 16 Figure 4 • CBEEX trading portal ............................................................................................................ 19 Figure 5 • New capacity built by all VPCs, by scenario ......................................................................... 21 Figure 6 • Total VPC emissions by scenario .......................................................................................... 22 Figure 7 • VPC emissions by output...................................................................................................... 22 Figure 8 • Average carbon prices through simulation by scenario ...................................................... 23 Figure 9 • Combined allowance and offset trade volumes by scenario ............................................... 23 Figure 10 • Combined allowance and offset trade prices by scenario ................................................. 24 Figure 11 • Trade prices in buy and sell markets ................................................................................. 24 Figure 12 • Plot of VPCs by trade volume and final rank ..................................................................... 25 Figure 13 • Illustration of VPC spreadsheet trading tool...................................................................... 30 Figure 17 • Illustration of trading pattern in a simulation week .......................................................... 36 Figure 18 • Scenario 1 new build by fuel and year ............................................................................... 38 Figure 19 • Scenario 1 allowance and offset trade volumes ................................................................ 38 Figure 20 • Scenario 1 weighted average CO2 trade price ................................................................... 39 Figure 21 • Scenario 1 CO2 trade price buy trade initiation (buy-sell) ................................................. 39 Figure 22 • Scenario 1 CO2 trade price through time ........................................................................... 39 Figure 23 • Scenario 2 new build by fuel and year ............................................................................... 40 Figure 24 • Scenario 2 allowance and offset trade volumes ................................................................ 40 Figure 25 • Scenario 2 weighted average CO2 trade price ................................................................... 41 Figure 26 • Scenario 2 CO2 trade price buy trade initiation (buy-sell) ................................................. 41 Figure 27 • Scenario 2 CO2 trade price through time ........................................................................... 41 Figure 28 • Scenario 3 new build by fuel and year ............................................................................... 42 Figure 29 • Scenario 3 allowance and offset trade volumes ................................................................ 42 Figure 30 • Scenario 3 weighted average CO2 trade price ................................................................... 43 Figure 31 • Scenario 3 CO2 trade price buy trade initiation (buy-sell) ................................................. 43 Figure 32 • Scenario 3 CO2 trade price through time ........................................................................... 43 Figure 33 • Scenario 4 new build by fuel and year ............................................................................... 44 Figure 34 • Scenario 4 allowance and offset trade volumes ................................................................ 44 Figure 35 • Scenario 4 weighted average CO2 trade price ................................................................... 45 Figure 36 • Scenario 4 CO2 trade price buy trade initiation (buy-sell) ................................................. 45 Figure 37 • Scenario 4 CO2 trade price through time ........................................................................... 45

Emissions Trading in the People’s Republic of China © OECD/IEA 2014
Page | 4
Acknowledgements This report was prepared by Christopher Guelff and Liwayway Adkins with the support of Christina Hood. Marco Baroni, Simon Mueller, Manuel Baritaud, Julie Jiang, Dennis Best, Philippe Benoit and Carlos Fernandez Alvarez made valuable inputs on simulation design and testing. Richard Baron, now Principal Advisor for the Round Table on Sustainable Development at the OECD, was instrumental in the project’s creation and provided invaluable support throughout. Overall supervision and guidance was provided by Didier Houssin, Director of Sustainable Energy Policy and Technology, Philippe Benoit, Head of Energy Efficiency and Environment Division, and Takashi Hattori, Head of the Environment and Climate Change Unit.
This project was delivered in partnership with the China Electricity Council (CEC), China Beijing Environment Exchange (CBEEX) and Environmental Defense Fund (EDF). CEC, CBEEX, and EDF played significant roles in setting up and co-ordinating the overall project, building and maintaining the trading platform, facilitating the simulated trading, collaborating with China’s power sector, and ensuring the successful completion of the simulation and this report. We would like to thank in particular Li Chongyi, Zou Yi and Li Cong of CBEEX, Shi Lina and Yang Fan of CEC, and EDF’s Wang Hao and Josh Margolis. We appreciate the guidance offered by Pan Li of CEC, Du Shaozhong of CBEEX, and Zhang Jianyu and Daniel Dudek of EDF.
The IEA gratefully acknowledges that the simulation was funded by the Children's Investment Fund Foundation and thanks Kate Hampton, Executive Director for Climate Change, and Shirley Rodrigues, Manager Climate Change, for their advice and support.

© OECD/IEA 2014 Emissions Trading in the People’s Republic of China
Page | 5
1. Executive summary
Overview
The People’s Republic of China’s 12th Five-Year Plan (2011-15) lays out plans to “gradually develop a carbon trading market” (NDRC, 2012). In preparation, five cities and two provinces in China have been directed to independently develop and implement pilot emissions trading schemes (ETSs). Five of these markets were launched in 2013 and another in April 2014, together regulating more than 1 billion tonnes of carbon dioxide (CO2). The seventh market is expected to launch soon.
To help inform the design of China’s national ETS and supplement the learning process initiated with the pilot ETSs, the International Energy Agency (IEA), China Electricity Council (CEC), China Beijing Environment Exchange (CBEEX), and Environmental Defense Fund (EDF), developed and ran a simulated ETS for the Chinese power sector.
Though limited in scope, the results of this simulation bode well for a national Chinese ETS covering the power sector. When faced with a simulation that included a fixed carbon cap, an ETS with tradable allowances and offsets, penalties for non-compliance, and an increasing power generation obligation, Chinese generators met their generation, carbon compliance and profit mandates. Consistent with expectations, the simulation also showed that ETS market design has a direct impact on company-specific and market-wide efficiencies.
Why run a simulation?
Market simulation exercises can serve as a useful bridge between a policy idea and its implementation. Real-world markets are full of complexities and uncertainties. While theory can be a guide, it is difficult to predict how market participants will react to new policy. Simulating market operation under modified rules, such as those in an ETS, creates a “laboratory” in which an analyst can control market conditions, give participants certain attributes and mimic real-world incentives through various instruments. In this way, a simulation can help policy designers to gather insights on structural options for the ETS.
This simulation in particular had several objectives:
1. To explore how an ETS for the power sector might function in practice. 2. To give staff from Chinese power generators experience of ETS mechanics, increasing their
familiarity with, and understanding of, these instruments. 3. To see the effect of various ETS design options on participant performance. 4. To determine how participants would meet power production, carbon management and profit
generation objectives when faced with a growing electricity generation obligation and an ETS that features an absolute emissions cap, tradable allowances, offsets and non-compliance penalties.
5. To understand the potential implications of these findings for market design of an ETS for China. 6. To define areas for further exploration.
China’s power sector and emissions challenge
China is experiencing rapid and sustained economic growth, and with it some environmental challenges. In the last decade Gross Domestic Product (GDP) has doubled, while demand for electricity has roughly tripled. Fossil fuels, and particularly coal, represent around three-quarters of generation by capacity, and will remain an important part of the generation mix for the foreseeable future. Renewables and nuclear provide important and growing low-carbon alternatives.

Emissions Trading in the People’s Republic of China © OECD/IEA 2014
Page | 6
China’s energy-related CO2 emissions grew 50% between 1990 and 2000 and doubled over the following decade. China’s annual power sector emissions have grown to approximately 4 gigatonnes of CO2 per year, representing about half of the country’s total energy-related emissions (IEA, 2014a). At the 15th Conference of the Parties (COP 15) in Copenhagen in 2009, COP 17 in Durban in 2011, and since (China.org.cn, 2013), China pledged to reduce CO2 emissions per unit of GDP by between 40% and 45% of 2005 levels by 2020. To that end, China’s 12th Five-Year Plan (2011-15) lays out plans to “gradually develop a carbon trading market”, part of a commitment to “massive reductions in energy consumption intensity and carbon dioxide emissions [which] should be regarded as binding targets” (NDRC, 2012).
Structure of the ETS simulation
The simulation sought to evaluate the key elements for designing an active trading market in China, focusing on three key issues. First, how would China’s generators adapt to the imposition of a new carbon constraint? Second, how would carbon market size and trading flexibility affect trading and operations? Third, how would different participant starting positions affect trading?
To test different options, four scenarios were built, varying along two dimensions. The first dimension concerned the liquidity and size of the trading market. “Robust” and “Limited” scenarios were made by varying both offset limitations and market size (through the surrogate of imposing different geographic trading restrictions). Across this was a second dimension, with scenarios in which participants had identical carbon allowances versus scenarios where participants had different allowances.
The four scenarios were structured to reflect the current Chinese electricity sector, notably the overall mix of different power plant types, the corresponding tariffs that vary by fuel type (whereby cleaner sources receive higher tariffs), and the relative cost of different plant types. The simulation saw 32 participants drawn from electricity generators across China; each received a fleet of power stations to manage in a virtual power company (VPC). Each of the four scenarios had eight participants/VPCs.
Each VPC was obliged to meet an increasingly stringent carbon requirement, created by having to reconcile a rising power generation obligation with a free but fixed annual carbon allowance. Participants were given a spreadsheet model to help them plan, operate and build generating stations, as well as trade carbon allowances and offsets to optimise the profitability of their generation portfolios.
The simulations were structured so that all VPCs could profitably meet their generation obligation within their carbon limit, and the winner was the VPC that generated the greatest profit relative to its competitors. The two “differentiated” VPC portfolio simulations each had equal-sized cohorts of VPCs whose setup inclined them to be carbon buyers and sellers respectively, whereas the two “identical” simulations had homogeneous VPCs. There were six winners, one from each group of VPCs with the same starting position.
Simulation outcomes in brief
The principal outcomes of the simulation follow. An in-depth discussion of the results is provided in the main body of the report, with detailed results in the annexes.
VPC performance Over 90% of VPCs met their generation and carbon obligations profitably. Competition was close: half of the VPCs reported earnings within 10% of their cohort winner’s.

© OECD/IEA 2014 Emissions Trading in the People’s Republic of China
Page | 7
Increased trading activity was associated with better financial performance. In general, the more a VPC traded, the more likely it was to outperform the other VPCs in its cohort in terms of profitability.
In only two instances did a VPC acquire insufficient carbon rights (allowances and/or offsets) to cover the emissions from its power production and faced the correspondingly stiff penalties: CNY 1 500 (equivalent to EUR 176 or USD 240) per tonne of CO2.
Carbon market outcomes
The Robust trading scenarios saw more than double the trade volume of the Limited trading scenarios.
Carbon prices rose as the compliance obligations became harder (and more expensive) to meet, and more so in the Limited trading scenarios (which were characterised by more restricted trading opportunities and access to fewer offsets).
Offsets (bought from non-participants) comprised 88% of trades by volume. Participants attributed this to offsets being more reliably available than trading allowances from other participants and, to a lesser extent, the ability to acquire carbon without trading with a competing VPC.
Several attempts were made to influence the price for allowances to increase the value of carbon holdings. For example, a participant said that at the end of year five in one scenario, they bought a small number of allowances at an unusually high price to inflate the value of their other carbon allowances (so as to increase the profitability of the VPC’s operations).
Insights
The simulation results strongly suggest the following:
• China’s generators adapted to the new carbon constraint on their power production mandates.
• Generators chose the optimum solution when faced with a carbon constraint, an increasing power generation mandate, and the opportunity to manage a fleet of generating units (new and existing), each with its own distinct carbon footprint, cost structure and allowance requirements.
• ETS market design decisions have a direct impact on the manner in which the overall market functions, individual companies operate within it, and overall and company-specific efficiencies.
• Broad, integrated markets with flexible rules to facilitate trading provide the best opportunity to lower the cost of meeting carbon constraints, on both a source-specific and market-wide basis.
• Generally, the most profitable companies were those who most actively traded in the market.
• The availability of offsets (provided here by a non-participant) gave participants an important additional source of carbon capacity, in particular versus allowances which could only be acquired from trading with other participants (i.e. competitors).
Implications for design of a national Chinese ETS
This simulation suggests implications for both policy and simulation design.
Overall, the simulation results tend to reinforce the importance of broad and flexible trading markets in providing a least-cost path to compliance, with the two Robust trading scenarios accounting for two-thirds of the transactions across all scenarios.
• Policy implication: Dividing VPCs into regions reduced trade volumes. Larger and inter-connected markets boost liquidity and efficiency.

Emissions Trading in the People’s Republic of China © OECD/IEA 2014
Page | 8
Offset transactions vastly exceeded those of allowances, accounting for over 80% of transactions across all four scenarios. Participant feedback suggested that VPCs preferred offsets because they were predictably available (whereas a suitable allowance trade might not be at a given moment), and, to a much lesser extent, because it did not involve a transaction with a VPC competitor who might benefit more.
• Policy implication: China’s vast potential for offset projects is clear. A system with access to a broad offset market can facilitate cost-effective compliance. The offset market will also require oversight, scrutiny and review to ensure the quality of offset credits (i.e. whether they are real and truly additional).
• Potential simulation refinement: Consider development and application of a more sophisticated offset supply curve, more directly applicable to the quantity, price and availability of offsets in Chinese markets.
As noted, there were only two instances where a VPC did not cover its emissions in a year, arguably the result of the severe penalties provided for in the simulation.
• Policy implication: Compliance can be encouraged through a significant non-compliance penalty, which would potentially be the worst option for a participant under the ETS. However this simulation did not test sensitivity to a penalty or its size.
The simulation transaction auction process influenced trading behaviour. The institutions governing trade in emission permit markets will have a significant effect on their efficiency.
• Policy implication: Regulations that create distinct buyer and seller markets and do not provide continuous matching of orders reduce the number of potential trades, effect the clearing price, and have a negative knock-on effect on the overall market efficiency (although in some instances they might serve other sound economic objectives).
• Potential simulation refinement: Consider the development of a separate simulation platform that allows for the optimum matching of buy and sell orders.
Switching dispatch between a generator’s different power plants is central to achieving the most efficient response. Allowing for the trading of generation requirements between companies can further increase flexibility and efficiency.
• Policy implication: Consider making generation requirements tradable, which could allow even more efficient use of the whole market’s resources, because different fleets will be better positioned to meet certain demand levels with certain emissions
Participant companies in the ETS simulation traded allowances against the cost of their least-cost available alternative sources of emission reduction, including the construction of cleaner generation. In this simulation, nuclear power played a dominant role in the new-build capacity decisions made by participants, despite its significant construction and maintenance costs.
• Potential simulation refinement: Consider application of a working capital budget, which would provide a more realistic constraint on new investment decisions made by participants.

© OECD/IEA 2014 Emissions Trading in the People’s Republic of China
Page | 9
2. Introduction The People’s Republic of China is experiencing rapid and sustained economic growth, and with it some environmental challenges. Its 12th Five-Year Plan (2011-15) lays out plans to “gradually develop a carbon trading market”. In preparation, five cities and two provinces in China have been directed to develop and implement pilot ETSs.
To help inform the design of China’s national ETS, and supplement the learning process initiated with the pilot ETSs, the IEA, CEC, CBEEX and EDF developed and ran a simulated ETS for the Chinese power sector in August 2013.
This paper begins by providing the context of China’s power sector and the country’s steps towards a national ETS. Chapter 4 describes how simulations can help policy development and explains the high-level design choices in this simulation. Chapter 5 covers in detail the methods used, Chapter 6 the subsequent results and Chapter 7 the implications of this research for a national Chinese ETS.

Emissions Trading in the People’s Republic of China © OECD/IEA 2014
Page | 10
3. Context
China’s steps towards an ETS
China’s economic development continues apace, driving rising energy consumption and carbon emissions. On an aggregate basis, China has been the world’s largest emitter of CO2 from fuel combustion since 2006 (IEA, 2014a). China’s energy‐related CO2 emissions grew by 50% between 1990 and 2000, and doubled in the following decade to reach 8 billion tonnes in 2011 (Figure 1 • Chinese carbon emissions) (IEA, 2014a).
Figure 1 • Chinese carbon emissions
Note: MtCO2 = million tonnes of CO2.
Source: IEA (2014a), CO2 Emissions from Fossil Fuel Combustion, OECD/IEA, Paris.
At COP 15 in Copenhagen, COP 17 in Durban and since (China.org.cn, 2013), China confirmed a pledge to reduce its CO2 intensity per unit of GDP by between 40% and 45% of 2005 levels by 2020. To that end, China’s 12th Five-Year Plan (2011-15) lays out plans to “gradually develop a carbon trading market”.
The government is in testing mode and has designated five cities (Beijing, Shanghai, Tianjin, Chongqing and Shenzhen) and two provinces (Guangdong and Hubei) to pilot emissions trading for a national ETS post-2016. The Guangdong market alone will be second in size only to the EU ETS (Reuters, 2013). The seven ETSs could eventually regulate over 1 billion tonnes of CO2.
In 2012, the Energy Research Institute and IEA explored ETS options to control carbon from electricity generation, which culminated in the report Policy Options for Low-Carbon Power Generation in China (IEA, 2012a). This project follows that report, demonstrates how trading behaviour might work in a Chinese context, and explores options for adjustments and policies for an ETS to be effective.
China’s power sector
Designing a power sector ETS must begin by understanding how that sector operates. This includes current and expected future demand for power, existing and expected future generation mix, generators’ composition, how demand is assigned to generators and relevant regulations (notably on tariffs and fuel prices).
0
1 000
2 000
3 000
4 000
5 000
6 000
7 000
8 000
9 000
1990 1992 1994 1996 1998 2000 2002 2004 2006 2008 2010
MtCO
2
Total
Electricity and heat production

© OECD/IEA 2014 Emissions Trading in the People’s Republic of China
Page | 11
Chinese power demand Chinese power demand has roughly tripled in the last decade (Figure 2 • Chinese total gross electricity production (TWh)). Although economic growth has slowed, according to the 12th Five-Year Plan the growth rate will be 7.5% annually (NDRC, 2013). During the 12th Five-Year Plan, power consumption in China is projected to grow annually by 8.8% (CEC, 2012). This will require the construction of substantial new capacity.
Figure 2 • Chinese total gross electricity production
Note: TWh = terawatt hour.
Source: IEA (2014b), Electricity Output, OECD/IEA, Paris.
Chinese generation mix and company composition Chinese generation includes a mix of coal, hydro, gas, nuclear and wind (Table 1 • Electricity generation capacity (GW)). In 2012, coal-fuelled power stations provided almost three-quarters of China’s electricity (Table 2 • Electricity generation output (TWh)).
Table 1 • Electricity generation capacity (GW) Fuel Capacity Share
Coal 754 66%
Oil 3 0%
Gas 37 3%
Nuclear 13 1%
Hydro 249 22%
Bioenergy 5 0%
Wind 61 5%
Solar PV 3 0%
Other 22 2%
TOTAL 1,147 100%
Note: GW = gigawatt Source: CEC (2014) Monthly Statistics of China Power Industry
February 2014, Beijing, http://english.cec.org.cn/No.110.1535.htm.
Table 2 • Electricity generation output (TWh)
Fuel Output Share
Coal 3,710 74%
Oil 5 0%
Gas 109 2%
Nuclear 98 2%
Hydro 856 17%
Bioenergy 20 0%
Wind 103 2%
Solar PV 4 0%
Other 81 2%
TOTAL 4,986 100%
Note: TWh = terawatt hour. Source: CEC (2014) Monthly Statistics of China Power Industry
February 2014, Beijing, http://english.cec.org.cn/No.110.1535.htm.
0
500
1 000
1 500
2 000
2 500
3 000
3 500
4 000
4 500
5 000
1990 1992 1994 1996 1998 2000 2002 2004 2006 2008 2010
TWh
Total grossproduction

Emissions Trading in the People’s Republic of China © OECD/IEA 2014
Page | 12
Fossil fuels, and particularly coal, are likely to remain an important part of the generation mix, with an increasing role for gas. Renewables and nuclear provide expanding low-carbon alternatives. This provides an opportunity for an ETS to influence both dispatch and new build.
At the end of 2012, five state-owned enterprises – Huaneng, Datang, Guodian, Huadian and China Power Investment Corporation – had an aggregate installed capacity of 551 GW, 48% of national capacity (CEC, 2014).
Chinese power regulation, prices and allocation
While companies compete to establish new capacity in China, the sector is tightly regulated with electricity prices strictly set by the National Development and Reform Commission (NDRC). Each new power plant must obtain authorisation and final approval from the government, with an associated electricity price for the power it will deliver to the grid. The grid essentially operates a quota system by setting an annual plan with a minimum number of hours it will draw from each plant.
The price is set by the NDRC pricing department. Similar coal plants usually receive similar prices, but some regional variation exists depending on local circumstances. Further variation can occur where smaller generators owned by local governments provide subsidised pricing for favoured local power consumers. As a rule, however, different tariffs apply to different fuel sources, with lower-carbon sources receiving relatively higher tariffs. Differentiated generation tariffs (the price a generator receives for generation) create substantial incentives for cleaner generation, which can receive triple that paid for the same output from certain coal plant.1
1 Differentiated tariffs will affect the ETS, which encourages the same movement towards these lower carbon fuels. For example, it could mean that relatively higher carbon prices are necessary to create an incentive beyond that created by the advantageous tariff. Or it could mean that an ETS could lessen the need for high tariffs for low-carbon generation.

© OECD/IEA 2014 Emissions Trading in the People’s Republic of China
Page | 13
4. Why run a simulation, and high-level design choices
What simulations can achieve
Simulations can be a useful bridge between a policy idea and the reality of its implementation. They demonstrate how concepts can work, uncover issues, provide lessons and suggest refinements that can only be found through practice and experience. They are a low-cost way of refining policy before implementation. While the Chinese pilots are covering all sectors in a geographical area, this project sought to explore how an ETS might work across one sector – power generation – nationally. To that end the IEA, CEC, CBEEX and EDF built a simulated Chinese power sector and ETS for participants from generators across China.
This simulation tried to explore how generators would respond to a newly carbon-constrained world, and how different rules might shape their response. Analysing this gives insight into generator decisions and how an ETS can influence and alter them. This is interesting in the context of state-owned power companies, which typically respond to influences and objectives other than seeking maximum return on equity for their government shareholder.
Such a deeper understanding of individual and group dynamics is vital to understanding whether and how an ETS can work, providing answers to questions such as: What is the major corporate motivator for generators? How much liquidity should an emissions market have? Should there be a mechanism to help send price signals? Is there a role for offsets/credits? How many participants will there be? What are the rules/prospects for new entrants? What trade rules and regulations should govern ETS participants?
Simulation objectives and overall scope
This simulation was designed to explore how generators would respond to an ETS, principally the imposition of a carbon constraint, both in the dispatch from existing plants and the construction of new capacity. The simulation was also designed to explore the possible impacts of different ETS configurations. The simulation therefore created a virtual world, representing a simplified version of the Chinese electricity system, drawing on real data from China’s power sector. The project had several aims:
• To learn how Chinese generators operate in a virtual ETS (including, but not limited to, how generators adjust their businesses to meet generation mandates with the imposition of a carbon constraint on their activities).
• To understand how they face the challenges of rising demand – what new plant choices they make and how they trade carbon to meet generation and carbon obligations.
• To use different scenarios to see how different policies and rules affect participant choices.
• To give generators ETS experience to help them contribute to the design of a future national ETS.
These aims shaped preparation of the simulation. CEC found 32 participants, both to provide broad representation and diversity, and to make it viable to run more scenarios to explore further design options. The simulation ran for six weeks.
Other macro-level design choices
Designing the simulation involved a number of other decisions and assumptions, the most significant being the following.

Emissions Trading in the People’s Republic of China © OECD/IEA 2014
Page | 14
Sources of carbon: allowances and offsets. Participants received allowances, which they could trade with other VPCs. Participants could also buy offsets from a market provided by a non-participant with a pre-determined price-supply curve.
Carbon allowance distribution. Allowances can typically be given once or annually, for free, at a fixed-price or auctioned. For simplicity and to help moderate compliance costs, a fixed free annual allowance was chosen. Operators did not lose allowance if they did not run a plant, and there was no special allowance for new plant.
Banking unused carbon. To improve flexibility and help manage compliance costs while limiting complexity, allowances not used in a particular year could be “banked” for use in later years. However, the trading of future years’ carbon allowances was not permitted. This was also in keeping with Chinese rules for environmental exchanges.
Ease and frequency of trading. These depend on the ETS and trading platform rules. As described below, different rules were chosen and tested under different scenarios. In practice, trade opportunities (frequency within trading sessions) were limited by the trading platform’s structure (the distinct buy and sell markets) and related reconciliation process (see later), as well as the participants’ availability to commit time to the simulation while continuing their normal work.
Metric for evaluating “winners”. Various metrics could be chosen to determine winners, such as ability to maximise production or reduce carbon emissions. Profit maximisation was chosen, in part to encourage participants to explore opportunities to sell allowances to other participants, thereby increasing liquidity in the overall market.
Ability to meet generation requirements and carbon constraints. The simulation was set up so that all participants could meet their power obligations and carbon constraints profitably. This was because the primary aim was to test whether, fundamentally, trading could work in a context where all operators could “survive” under the ETS, rather than exploring one in which the ETS would weed out certain competitors.

© OECD/IEA 2014 Emissions Trading in the People’s Republic of China
Page | 15
5. Building this simulation The simulation aimed to strike a balance between similarity to the real China context (to make the simulation world-relevant and intuitive to the participants), simplicity and flexibility (to enable VPCs to select and adapt tactics as the ETS simulation evolved). The annexes provide further detail on the assumptions made.
Gathering participants, building a simulation world and setting objectives
CEC gathered 32 participants from 9 power generation companies, including 4 of the 5 major state-owned power generation enterprises. Each played the role of a VPC. The individuals came from a variety of disciplines, including engineering, policy and trading.
In reality, Chinese generators tend to specialise and have mostly thermal, renewable or nuclear plant. But to promote flexibility and breadth of experience, each VPC started with an assigned fleet of ten different plant types (such as nuclear, sub-critical coal, gas and others) that matched China’s overall installed capacity mix.
Each VPC was given a power generation mandate and sufficient capacity to satisfy this production capacity, with some spare. The production mandate rose annually (by about 9%). Each VPC was given a free but fixed annual carbon allowance, equivalent to a predetermined baseline output, sufficient to permit VPCs to choose from a wide array of plant dispatch combinations in the first year. Generally, and over time, the fixed amount of allowances provided each year required generators to shift increasingly to cleaner fuel sources, as they tried to meet their increasing electricity production mandates. Participants could trade allowances.
Participants could also acquire offsets, sold by CBEEX as an independent non-participant. At the end of each virtual year, each VPC had to have enough allowances and/or offsets (up to a certain ratio) to cover its generation emissions. VPCs could trade their allowances and resell offsets. Any carbon (allowance or offset) surplus at the end of the year could be carried forward. Any VPC that had insufficient allowances and offsets to cover its generation emissions incurred a financial penalty and the carbon deficit deducted from the coming year’s allowance. Figure 3 • Flowchart of VPC actions year to year summarises this overall process.

Emissions Trading in the People’s Republic of China © OECD/IEA 2014
Page | 16
Figure 3 • Flowchart of VPC actions year to year
Note: tCO2 = tonne of carbon dioxide.
Building new power stations
The simulation was structured so that each VPC would need to build new power stations to meet its increasing generation requirements. They could choose from several different types, but to limit complexity the parameters (capacity, efficiency etc.) for each fuel type were fixed and uniform, so VPCs had the same “off-the-shelf” choices. The cost of a new power station was annualised, i.e. turned into a recurring annual cost, similar to financial liabilities the VPC would face assuming it debt financed the plant. There was also a corresponding annual maintenance cost, regardless of use once built.
New plants take time to build, so VPCs had to consider their future generation requirements and begin construction in time for new plants to be ready when needed. Given the limited simulation time (five years), construction time was accelerated so VPCs could select from the full range of fuels, including nuclear and hydropower. Nonetheless the simulation endeavoured to maintain realistic relative construction speeds (see Annex C on power station parameters for details).
To limit how far VPCs could build their way out of the challenge, construction costs and the load needed for a plant to break even were realistically high. For realism, and to discourage “just-in-case” building, VPCs had to pay fixed costs for all stations, including idle ones.
Using scenarios to test different policies and rules
The 32 participants were divided into 4 groups, each assigned to an independent scenario and comprising 8 participants. Each participant received a VPC with an identical fleet of power stations.
Baseline Year 0(Week 1)
Year 1(Week 2)
Year 2(Week 3)
Electricity fleet• Output/dispatch• Fuel• CO2 emissions
New build with construction
costsYear 1-5
AnnualCO2 allocation
VPCs buy/trade credits and trade
allowances
Power requirement met?
• Yes• No, barred from
winning
CO2 emissions covered by balance + allocation + trades?• Yes• No, penalty fine per
tCO2
CO2 balance
Electricity fleet• Output/dispatch• Fuel• CO2 emissions
CO2 balance
Electricity fleet• Output/dispatch• Fuel• CO2 emissions
Power requirement met?
• Yes• No, barred from
winning
CO2 emissions covered by balance + allocation + trades?• Yes• No, penalty fine per
tCO2
AnnualCO2 allocation
AnnualCO2 allocation
New build with construction
costsYear 2-5
VPCs buy/trade credits and trade
allowances

© OECD/IEA 2014 Emissions Trading in the People’s Republic of China
Page | 17
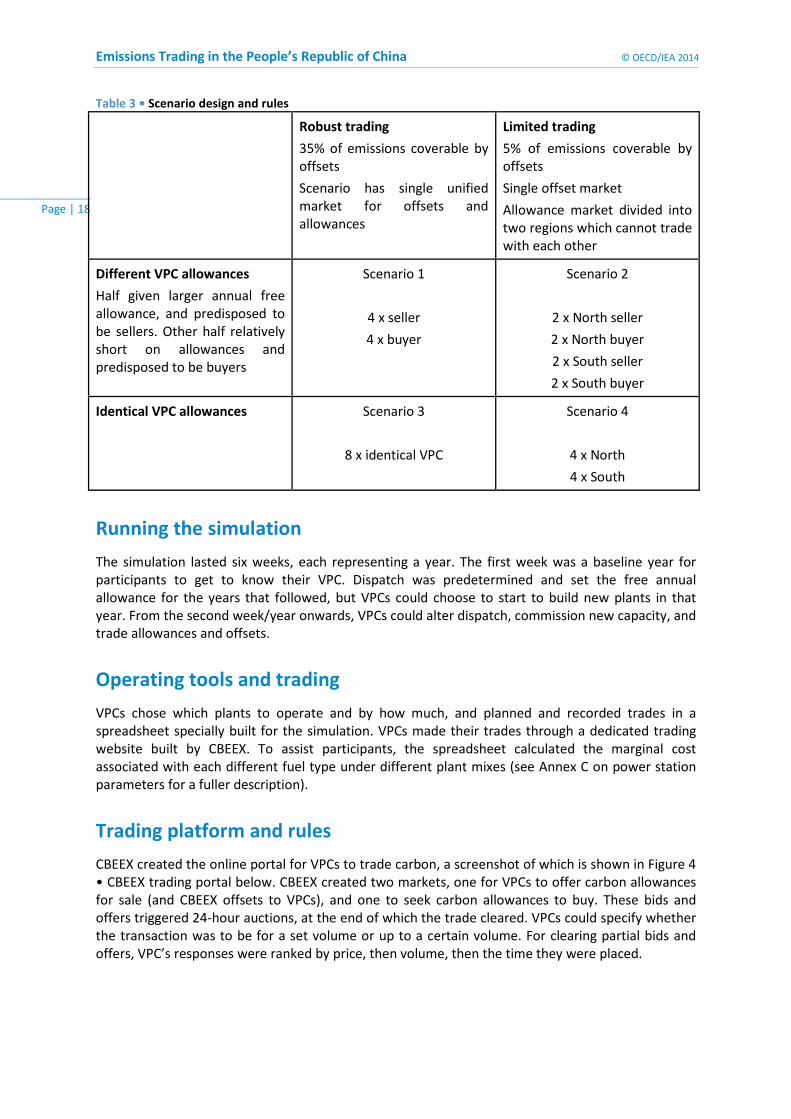
The different scenarios were constructed to explore several ETS design features, and are described in Table 3 • Scenario design and rules below.
Trading rules: One division was designed to explore the behaviour of the VPCs under different trading environments. One scenario pair (Scenarios 1 and 3, Robust trading) had larger markets and greater access to offsets. A second pair (Scenarios 2 and 4, Limited trading) had smaller markets (two regions rather than a single integrated one) and access to fewer offsets.2
Carbon allowances: Cutting across this pair was a second distinction. One scenario pair (Scenarios 3 and 4) had VPCs with the same allowances (in addition to the identical starting fleets, as mentioned above), while the other (Scenarios 1 and 2), had VPCs with different allowances. In this second pair, half the VPCs were likely to have excess allowances (and so be predisposed to be allowance sellers), while the other VPCs faced an impending shortage (and so were predisposed to buy).3 No VPC was told of this structural difference. This distinction was designed to explore whether identical VPCs with identical allowances would exhibit different preferences for trading or other strategic choices, and whether structural differences in the VPCs’ starting positions made a significant difference in trading levels and patterns across the market as a whole.
2 In the Robust trading pair of scenarios (1 and 3), VPCs operated in one relatively larger market and could cover up to 35% of their emissions with offsets; this potentially provided a larger, more liquid market. In the Limited trading pair, VPCs could only cover 5% of their emissions with offsets, which they could buy in one “national” market. However they were divided into a North and South region for the purposes of allowances, and could not trade allowances with the other region. 3 In Scenarios 3 and 4, the VPCs had identical outputs in their baseline years and therefore identical annual carbon allowances. In Scenarios 1 and 2, they had the same stations, but half had different running hours and thus baseline emissions and thus annual allowances, so half would be relatively long and the other half short of carbon.
Emissions Trading in the People’s Republic of China © OECD/IEA 2014
Page | 18
Table 3 • Scenario design and rules
Robust trading
35% of emissions coverable by offsets
Scenario has single unified market for offsets and allowances
Limited trading
5% of emissions coverable by offsets
Single offset market
Allowance market divided into two regions which cannot trade with each other
Different VPC allowances
Half given larger annual free allowance, and predisposed to be sellers. Other half relatively short on allowances and predisposed to be buyers
Scenario 1
4 x seller
4 x buyer
Scenario 2
2 x North seller
2 x North buyer
2 x South seller
2 x South buyer
Identical VPC allowances Scenario 3
8 x identical VPC
Scenario 4
4 x North
4 x South
Running the simulation
The simulation lasted six weeks, each representing a year. The first week was a baseline year for participants to get to know their VPC. Dispatch was predetermined and set the free annual allowance for the years that followed, but VPCs could choose to start to build new plants in that year. From the second week/year onwards, VPCs could alter dispatch, commission new capacity, and trade allowances and offsets.
Operating tools and trading
VPCs chose which plants to operate and by how much, and planned and recorded trades in a spreadsheet specially built for the simulation. VPCs made their trades through a dedicated trading website built by CBEEX. To assist participants, the spreadsheet calculated the marginal cost associated with each different fuel type under different plant mixes (see Annex C on power station parameters for a fuller description).
Trading platform and rules
CBEEX created the online portal for VPCs to trade carbon, a screenshot of which is shown in Figure 4 • CBEEX trading portal below. CBEEX created two markets, one for VPCs to offer carbon allowances for sale (and CBEEX offsets to VPCs), and one to seek carbon allowances to buy. These bids and offers triggered 24-hour auctions, at the end of which the trade cleared. VPCs could specify whether the transaction was to be for a set volume or up to a certain volume. For clearing partial bids and offers, VPC’s responses were ranked by price, then volume, then the time they were placed.

© OECD/IEA 2014 Emissions Trading in the People’s Republic of China
Page | 19
Figure 4 • CBEEX trading portal
The buy and sell markets were independent of each other, so a different price for carbon could develop in each. The initial VPC order (be it an offer to sell or bid to buy) could be withdrawn until a bid or offer was registered in response. On the contrary, a responsive VPC, whose bid was no longer leading, could kill their order at any time. This encouraged VPCs to follow rather than lead the market.
Offsets – acquisition and trading
Offsets were offered in all scenarios in the carbon sale market on the CBEEX trading portal, alongside allowances. If a VPC bid to buy them (at the offer price), that triggered a 24-hour auction like that for an allowance trade. Reflecting the substantial potential for credit projects in China, all scenarios had a large supply of offsets: enough credits came into the market each year such that all VPCs could buy the maximum amount they could use. The starting price was CNY 15, slightly above the expected trading price. In each subsequent year the starting price rose by the higher of CNY 15 or the trading price for allowances. The rationale for this was twofold:
• As credits were used, the cost of supply increased consistent with an upward sloping supply curve and reflecting the assumption that suppliers would develop increasingly expensive carbon opportunities.
• Offset suppliers would look to the allowance market in setting their prices, even if their actual supply cost was cheaper than the prevailing price of allowances.
Any credits unsold at the end of the year were still available in the next year at their original (i.e. previous year) starting price.
Winners
The simulations were structured so that all VPCs could profitably meet their generation obligations in compliance with the carbon constraint. The winner was the VPC that generated the greatest profits (which provided a uniform metric, as well as an incentive in some cases to sell excess

Emissions Trading in the People’s Republic of China © OECD/IEA 2014
Page | 20
allowances into the market rather than to hoard them). Profit was the accumulated profit from generation (income less running, maintenance and construction costs) and the gain/loss from trading. Leftover allowances and offsets were then added to the balance sheet of the VPC at a value equal to the scenario’s average price for both across the entire simulation period (i.e. the six years).
As noted above, not all VPCs operated under the same trading regimes or with the same allowances, but rather were separated into cohorts, within which each VPC was identical. A winning VPC (based on profitability) was determined within each cohort. That meant two winners from each of Scenarios 1 and 2 (best “buyer” and best “seller” in each) and one winner each from Scenarios 3 and 4 (with homogeneous VPCs). So at the end of the simulation there were six winners.

© OECD/IEA 2014 Emissions Trading in the People’s Republic of China
Page | 21
6. Simulation results
VPC performance
Basic observations
The great majority of VPCs (91%) met their generation and carbon obligations profitably. Competition was close: half of all VPCs finished within 10% of their cohort winner.
All VPCs played the full six weeks and virtually all adjusted their dispatch and built new plants so they could comply with their generation obligation and remain profitable. VPCs traded in all scenarios and the CBEEX platform worked reliably.
Building new power stations
Despite high construction and maintenance costs, 44% of new capacity built was nuclear. The next most popular fuels were ultra-supercritical coal (20%), gas (18%) and wind (11%). This distribution was fairly consistent, bar the buyer-seller stifled trading scenario (Scenario 2), where 93% of new capacity was nuclear and 7% coal. Most of the winners built just nuclear and then modified dispatch and traded to optimise their position and profits. The distribution of new build by fuel and scenario is shown in Figure 5 • New capacity built by all VPCs, by scenario.
Figure 5 • New capacity built by all VPCs, by scenario
Coal with carbon capture and storage was an option, but as an emergent technology in the simulation’s relatively short time horizon, it was very expensive, so no participants chose it.
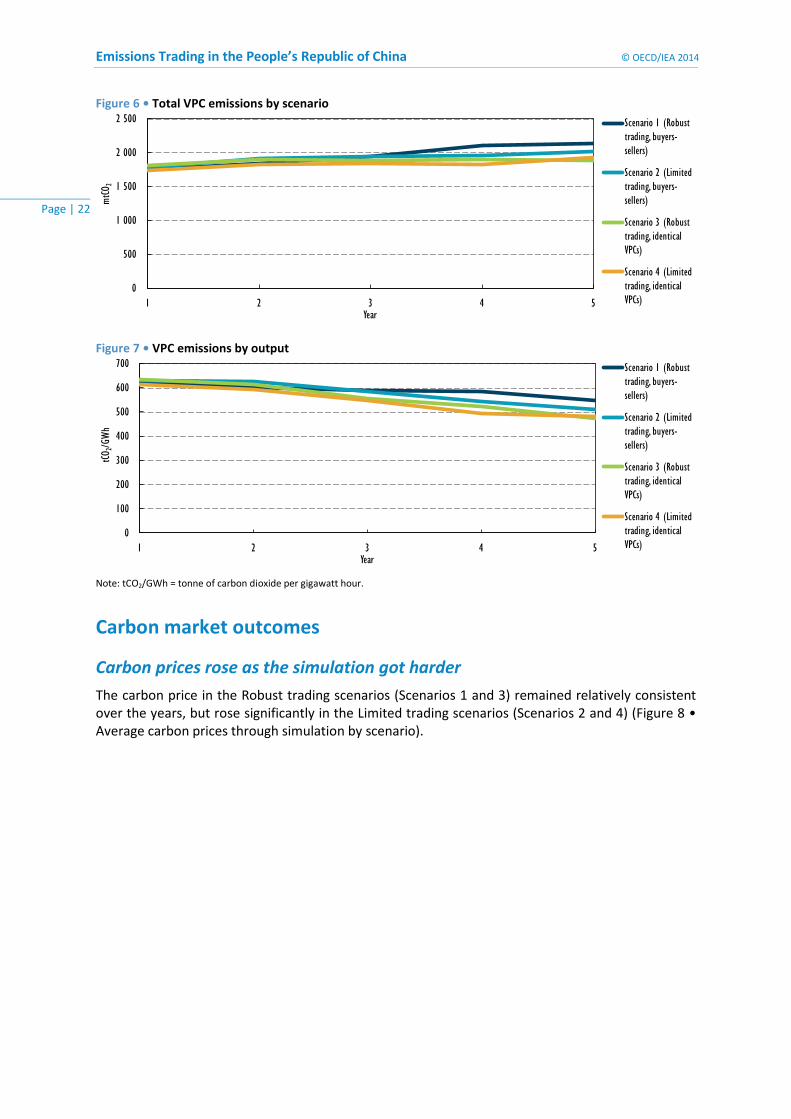
Emissions Carbon emissions remained generally constant across the various scenarios (Figure 6 • Total VPC emissions by scenario), notwithstanding the increasing generation requirement, although access to offsets did permit some increase. This was the result of the way the game was structured. However, it is worth to reiterating that each VPC was producing significantly more electricity by year 6; as a result, emissions per kilowatt hour fell significantly over the life of the simulation (Figure 7 • VPC emissions by output).
0
50 000
100 000
150 000
200 000
250 000
Scenario 1Robust tradingbuyers-sellers
Scenario 2Limited tradingbuyers-sellers
Scenario 3Robust tradingidentical VPCs
Scenario 4Limited tradingidentical VPCs
New
capa
city (
GW)
Renewables
Nuclear
Gas
Coal
Emissions Trading in the People’s Republic of China © OECD/IEA 2014
Page | 22
Figure 6 • Total VPC emissions by scenario
Figure 7 • VPC emissions by output
Note: tCO2/GWh = tonne of carbon dioxide per gigawatt hour.
Carbon market outcomes
Carbon prices rose as the simulation got harder The carbon price in the Robust trading scenarios (Scenarios 1 and 3) remained relatively consistent over the years, but rose significantly in the Limited trading scenarios (Scenarios 2 and 4) (Figure 8 • Average carbon prices through simulation by scenario).
0
500
1 000
1 500
2 000
2 500
1 2 3 4 5
mtCO
2
Year
Scenario 1 (Robust trading, buyers-sellers)
Scenario 2 (Limited trading, buyers-sellers)
Scenario 3 (Robust trading, identical VPCs)
Scenario 4 (Limited trading, identical VPCs)
0
100
200
300
400
500
600
700
1 2 3 4 5
tCO2/G
Wh
Year
Scenario 1 (Robust trading, buyers-sellers)
Scenario 2 (Limited trading, buyers-sellers)
Scenario 3 (Robust trading, identical VPCs)
Scenario 4 (Limited trading, identical VPCs)

© OECD/IEA 2014 Emissions Trading in the People’s Republic of China
Page | 23
Figure 8 • Average carbon prices through simulation by scenario
In Scenarios 2 and 4, a few VPCs tried to influence the price for allowances to increase the value of carbon holdings, as opposed to simply using the carbon market to maximise profits from electricity generation. For example, at the end of year 5 in one scenario, there was a purchase of allowances at an unusually high price in an attempt to inflate the value of other carbon allowances retained by the VPC (so as to increase the profitability of the VPC’s operations). This was not prohibited in the rules and did not significantly affect the final rankings.
Greater trade volumes in Robust trade scenarios Both Robust trade scenarios (Scenarios 1 and 3) had more than double the trade volume of the corresponding Limited trading scenario (Scenarios 2 and 4 respectively), which suggests their rule differences had a substantial impact.
Figure 9 • Combined allowance and offset trade volumes by scenario
0
20
40
60
80
100
120
1 2 3 4 5
CNY/tCO
2
Year
Scenario 1 (Robust trading, buyers-sellers)
Scenario 2 (Limited trading, buyers-sellers)
Scenario 3 (Robust trading, identical VPCs)
0
100
200
300
400
500
600
700
1 2 3 4 5
MtCO
2
Year
Trade volumes for buyer-seller VPCs under Robustand Limited trade environments (Scenarios 1 and 2)
Robust trade Limited trade
0
100
200
300
400
500
600
700
1 2 3 4 5
MtCO
2
Year
Trade volumes for identical VPCs under Robustand Limited trade environments (Scenarios 3 and 4)

Emissions Trading in the People’s Republic of China © OECD/IEA 2014
Page | 24
Compliance more expensive when trading opportunities more limited Both Robust trade scenarios (Scenarios 1 and 3) had lower carbon prices, and thus carbon compliance costs, than the corresponding Limited trading scenario (Scenarios 2 and 4 respectively). With more trading, those in need of carbon did not need to pay as much to secure it.
Figure 10 • Combined allowance and offset trade prices by scenario
Simulation-driven outcomes
Having separate buy and sell markets apparently inefficient There were no buy-initiated trades in Scenario 4 and almost none in Scenario 2 (the restricted/stifled trading scenarios). In Scenarios 1 and 3, there was a significant difference in the carbon price (Figure 11), which suggests the party responding to the bid/offer in each market could have achieved a better price had they initiated a trade in the other market. This indicates some inefficiency in having a separate buy and sell markets.
Figure 11 • Trade prices in buy and sell markets
VPC trading behaviour Although several factors affected profitability, if a VPC traded more than the other VPCs in its cohort, it was more likely to outperform them. This is reflected in Scenarios 3 and 4, shown in Figure
0
20
40
60
80
100
120
1 2 3 4 5
CNY
Year
Carbon prices for buyer-seller VPCs under Robustand Limited trade environments (Scenarios 1 and 2)
Robust trade Limited trade
0
20
40
60
80
100
120
1 2 3 4 5CN
YYear
Carbon prices for identical VPCs under Robust and Limited trade environments (Scenarios 3 and 4)
02468
10121416
1 2 3 4 5
CNY
Year
Scenario 1Robust trading, buyer-seller VPCs
Buy Sell
0
10
20
30
40
50
60
70
1 2 3 4 5
CNY
Year
Scenario 3Robust trading, identical VPCs

© OECD/IEA 2014 Emissions Trading in the People’s Republic of China
Page | 25
12 • Plot of VPCs by trade volume and final rank, which plots VPCs by their trading and profit ranking.4
Figure 12 • Plot of VPCs by trade volume and final rank
Preference for offsets over allowances By volume, 88% of all trades were offsets. Participants said offsets were more reliably available than allowances when needed; another influencing factor cited by a few VPCs is that offsets were a means of acquiring carbon rights without giving revenue to a competing VPC. These two reasons may explain why: (a) in two scenarios offsets traded at a higher price than allowances (despite the restrictions on offset use); and (b) eight VPCs did not buy carbon from another VPC. In their feedback, two VPCs noted that the initial offer price for offsets rose each year and so bought some in the hope that the end-of-simulation carbon valuation would use end prices (in fact it did not). This tactic may have been used more widely and inflated offset trade volumes.
Of all allowance trades (by volume), 82% started as offers to sell rather than bids to buy. This may be partially explained by participants who stated that they were more apt to make “no regret” offers (e.g. selling low volumes at high unit prices) than to place bids which, if hit, they might regret. In addition, most VPCs appeared cautious and built and dispatched their plants to have spare carbon that they could sell according to their appetite for risk.
Limitations Simulations require simplification and compromises, some of which are known from the outset and some of which are revealed in the outcomes. This simulation had a number of key limitations:
• The allocation of generation did not take into account peak loading or seasons. Also, VPCs could assume that their plants and fuel supplies were totally reliable.
• For simplicity, VPCs were not given a cash balance. The simulation just tracked cash flow and accumulated profit. This meant that VPCs were not asset-constrained, that is they could make investments of any size whenever they wished (such as building very large volumes of capacity in one year), which would not be possible in reality.
• Fuel availability was not limited. VPCs could build many of a particular plant without affecting the availability or price of that plant’s fuel.
• Planning permission was not part of the simulation. Such permissions are non-trivial, especially for large infrastructure, and in particular for hydro and nuclear power.
4 The buyer-seller cohorts of VPCs (Scenarios 1 and 2) were too small to draw conclusions.
1
2
3
4
5
6
7
8
12345678
Rank
by p
rofit
Scenario 3, robust trading, identical VPCs
Rank by trade volume Rank by trade volume
1
2
3
4
5
6
7
8
12345678
Rank
by p
rofit
Scenario 4, limited trading, identical VPCs

Emissions Trading in the People’s Republic of China © OECD/IEA 2014
Page | 26
• Demand reduction through energy efficiency will be a key part of lowering emissions. This simulation focused on generators’ response to a certain demand, so demand reduction was not included, though it should be in broader energy policy.
Annex F provides further detail on how one might develop a refined future simulation.
Conclusions
The simulation results strongly suggest the following:
• China’s generators could adapt to the imposition of a carbon constraint on their power production mandates.
• Generators were adept at selecting the optimum solution when faced with a carbon constraint, an increasing power generation mandate, and the opportunity to manage a fleet of generating units (new and existing), each with a distinct carbon footprint, cost structure and allowance requirement.
• ETS market design decisions have a direct impact on the manner in which the overall market functions, individual companies operate within it, and overall and company-specific efficiencies.
• Broad, integrated markets with flexible rules to facilitate trading provide the best opportunity to lower the cost of meeting carbon constraints, on both a source-specific and market-wide basis.
• Generally, the most profitable companies were those who most actively traded in the market.
• The availability of offsets (which under the simulation were provided by non-participants) gave participants an important source of carbon capacity, in particular versus allowances which could only be acquired from trading with other participants (i.e. competitors).

© OECD/IEA 2014 Emissions Trading in the People’s Republic of China
Page | 27
7. Implications for designing a national Chinese ETS Although the simulation had many simplifications and could be refined, it nonetheless revealed a number of dynamics which would potentially be of interest to designers of future ETSs in China.
Overall, the simulation results tend to reinforce the importance of broad and flexible trading markets in providing a least-cost path to compliance, with the two Robust trading scenarios accounting for fully two-thirds of the transactions across all scenarios.
• Policy implication: Dividing VPCs into regions reduced trade volumes. Larger and inter-connected markets boost liquidity and efficiency, recognising that integrating large markets with varying resource, loads, plants, interconnection and so on is not trivial.
Offset transactions vastly exceeded those of allowances, accounting for over 80% of transactions across all four scenarios. The fact that offsets were predictably available could also have contributed to their popularity, as well as the fact that they did not involve commercial transactions with VPC competitors.
• Policy implication: China’s vast potential for offset projects is clear. A future system with robust credit eligibility can facilitate cost-effective compliance; the offset market will also require oversight, scrutiny and review to ensure the quality of offset credits (i.e. whether they are real and truly additional).
As noted, there were only two instances where a VPC did not cover its emissions in a year, arguably the result of the severe penalties provided for in the simulation.
• Policy implication: Although sensitivity to a penalty was not tested, compliance can be encouraged through a significant non-compliance penalty, which would potentially be the worst option for a participant under the ETS.
The simulation transaction auction process influenced trading behaviour. The institutions governing trade in emission permit markets will have a significant effect on their efficiency.
• Policy implication: Regulations that create distinct buyer and seller markets and do not provide continuous matching of orders reduce the number of potential trades, affect the clearing price, and reduce overall market efficiency (although in some instances they might serve other sound economic objectives).
The scenario with the highest trading volume saw carbon allowance transaction prices closest to the coal-gas “switching price”.5 This suggests it was the most efficient market. Switching dispatch between a generator’s different power plants is central to achieving the most efficient response. Allowing for the trading of generation requirements between companies can further increase flexibility and efficiency.
• Policy implication: Consider making generation requirements tradable, which could allow even more efficient use of the whole market’s resources, because different fleets will be better positioned to meet certain demand levels with certain emissions.
Design choices, such as whether allowances are auctioned or given for free, the treatment of new entrants and generators who leave the market, and whether to have a futures trading mechanism, will all have an impact on the cost of compliance and other aspects of operations under an ETS.
• Policy implication: Officials will need to consider these options and whether they can provide additional flexibility/options for participants within the goals of the policy.
5 The switching price is the point where the carbon value more than makes up for revenue lost by switching to a less-emitting fuel that generates lower revenues.

Emissions Trading in the People’s Republic of China © OECD/IEA 2014
Page | 28
Introducing a carbon price – whether through an ETS or a carbon tax – raises questions about integration with existing energy policy (such as emissions standards, fuel pricing and so on). The ETS will affect and alter the manner in which generators provide electricity, which is also influenced by other electricity sector policies serving other objectives, such as the allocation of generation mandates and pricing systems.
• Policy implication: When introducing an ETS that affects the power system, policy makers should consider the policy objectives of those other energy sector policies and the carbon objectives of the ETS. They should analyse their interaction and respective objectives to enhance their mutual support and, similarly, avoid situations where they may inadvertently undermine the others’ progress.
Though limited in scope, the results of this simulation bode well for a national Chinese ETS covering the power sector. When faced with a simulation that included a fixed carbon cap, an ETS with tradable allowances and offsets, penalties for non-compliance, and an increasing power generation obligation, Chinese power generators were able to meet their power generation, carbon compliance, and profit generation mandates. Consistent with expectations, the simulation also showed that ETS market design has a direct impact on company-specific and market-wide efficiencies. This merits further discussion to explore the implications of this simulation for policy and market design.
© OECD/IEA 2014 Emissions Trading in the People’s Republic of China
Page | 29
Annex A: Methodology
The increasing generation requirement
To make the simulation challenging and reflect economic projections, the simulation assumed electricity demand would grow in line with GDP. The International Monetary Fund 2012 to 2017 forecast of annual growth of 8.7% was used, which compounds into a total increase of one-half over the five years (IMF, 2012).
Capacity versus output and intermittent renewables
The simulation assumed that each plant could produce a certain fraction of its maximum capacity to reflect efficiency, downtime for maintenance and unforeseen problems. Intermittent renewables (i.e. wind and solar) had relatively lower maximum load factors to reflect that they are not always available to meet demand when needed.
For this reason, generators in the real world need a mixture of plants to ensure they can always meet demand. This is subject to many factors, but for simplicity in the simulation, VPCs could have no more than one-third of their stations powered by wind or solar.
The spreadsheet tool and dispatch
To help VPCs identify the best tactics for a given carbon price, or suggest a price to trade carbon for, the spreadsheet calculated the marginal cost (in the form of profit change) of changing emissions by 1 tCO2. It did this by finding the most profitable dispatch for a given generation requirement, then the most profitable dispatch emitting 1 tCO2 less until it reached the cleanest possible dispatch. This served two functions: (a) to help VPCs identify the most profitable dispatch combinations in their fleet, varied by carbon emissions so they could react to the prevailing carbon market price; and (b) to suggest trade prices and volumes. A simplified version of the spreadsheet is presented in Figure 13 • Illustration of VPC spreadsheet trading tool below, showing the iterative steps from most profitable to cleanest dispatch from left to right, with the associated trade suggestions below.

Emissions Trading in the People’s Republic of China © OECD/IEA 2014
Page | 30
Figure 13 • Illustration of VPC spreadsheet trading tool

© OECD/IEA 2014 Emissions Trading in the People’s Republic of China
Page | 31
Annex B: VPC configurations To manage complexity, all VPCs started with the same number of power stations for each fuel. The simulation relied on a variety of sources, including the modelling of installed capacity and output from both Policy Options for Low Carbon Power Generation in China (IEA, 2012a) and the 2012 World Energy Outlook (IEA, 2012b), to obtain a detailed fuel mix for China.
Table 4 • Fuel mix of a VPC
Fuel
Mix by installed
capacity of real Chinese power sector
Average real generator
size (MW)
Implied VPC generation
(MW)
Installed capacity of
plant in simulation
(MW)
VPC number of plants (rounded)
Coal (small) 6.9%
65 000
4 468 50 89
Coal (sub-critical) 5.4% 3 526 50 71
Coal (supercritical) 29.1% 18 918 600 32
Coal (ultra-supercritical) 21.0% 13 656 600 23
Coal (CCS) 0.0% 0 600 0
Gas (combined cycle) 5.1% 3 300 100 33
Nuclear 2.3% 1 513 800 2
Hydro 20.1% 13 064 50 261
Wind (onshore) 8.7% 5 638 50 113
Solar 1.4% 917 50 18
TOTAL 100%
Notes: CCS = combined capture and storage; MW = megawatt. Sources: internal IEA approximation based on IEA (2012a), Policy Options for Low-Carbon Power Generation in China, OECD/IEA, Paris,
www.iea.org/publications/insights/Insight_PolicyOptions_LowCarbon_China.pdf; IEA (2012b), World Energy Outlook, OECD/IEA, Paris, www.worldenergyoutlook.org/publications/weo-2012/.
To predispose some VPCs to be carbon sellers in two of the scenarios (Scenarios 1 and 2), their baseline output and thus emissions and thus free annual allowance were adjusted. The “identical” and “buyer” VPCs could meet their generation obligation within the carbon constraint during year one by altering dispatch, while “sellers” could cope independently without building or trading until year two.

Emissions Trading in the People’s Republic of China © OECD/IEA 2014
Page | 32
Identical and buyer VPCs
Table 5 • Identical and buyer VPC power station configuration
Fuel
Installed capacity
(MW) Lifespan (years)
Annual capital
cost (CNY/MW capacity)
Tariff received
(CNY/ MWh)
Fuel cost (CNY/MWh
output) Max. load
factor
Min. load to break
even
Coal (small) 50 89 90% 35 084 63% 24 559 31
Coal (sub-critical) 50 71 90% 27 988 63% 19 592 22
Coal (supercritical) 600 32 90% 151 373 63% 105 961 99
Coal (ultra-supercritical) 600 23 90% 108 799 63% 76 159 63
Coal (CCS) 600 0 90% 0 63% 0 0
Gas (combined cycle) 100 66 90% 52 034 63% 36 424 13
Nuclear 800 2 90% 12 614 63% 8 830 0
Hydro 50 261 60% 68 591 42% 48 014 0
Wind (onshore) 50 113 23% 11 300 16% 7 910 0
Solar 50 18 17% 1 350 12% 945 0
TOTAL 469 134 328 394 227
Notes: Max. = maximum; Min. = minimum; MWh = megawatt hour.
Source: internal IEA approximation.
Seller VPCs
Table 6 • Seller VPC power station configuration
Fuel
Installed capacity
(MW) Lifespan (years)
Annual capital
cost (CNY/MW capacity)
Tariff received
(CNY/ MWh)
Fuel cost (CNY/MWh
output) Max. load
factor
Min. load to break
even
Coal (small) 50 89 90% 35 084 80% 31 186 39 Coal (sub-critical) 50 71 90% 27 988 80% 24 878 28 Coal (supercritical) 600 32 90% 151 373 80% 134 554 125 Coal (ultra-supercritical) 600 23 90% 108 799 65% 78 577 65 Coal (CCS) 600 0 90% 0 0% 0 0 Gas (combined cycle) 100 66 90% 52 034 0% 0 0 Nuclear 800 2 90% 12 614 60% 8 410 0 Hydro 50 261 60% 68 591 30% 34 295 0 Wind (onshore) 50 113 23% 11 300 10% 4 960 0 Solar 50 18 17% 1 350 13% 1 025 0 TOTAL 469 134 317 885 257
Source: internal IEA approximation.

© OECD/IEA 2014 Emissions Trading in the People’s Republic of China
Page | 33
Annex C: Selected parameters: power stations, tariffs and “switching values”
1. Power plants
a. Plant configurations
The simulation contained eleven different types of power station. Every VPC in the whole simulation started with the same fleet of stations and could build from the same selection of “standard issue” stations (Table 7 • Power station parameters).
Table 7 • Power station parameters
Fuel
Installed capacity
(MW) Lifespan (years)
Annual capital cost
(CNY/MW capacity)
Tariff received
(CNY/ MWh)
Fuel cost (CNY/MWh
output) Max. load
factor
Min load to break
even
Profit per MW capacity at max.
load tCO2/ MWh
Coal (small) 50 40 477 003 400 310 90% 61% 231 538 1.264
Coal (subcritical) 50 40 477 003 400 271 90% 42% 537 170 1.106
Coal (supercritical) 600 40 453 735 390 229 90% 32% 819 403 0.931
Coal (ultra-supercritical)
600 40 442 101 380 202 90% 28% 961 688 0.823
Coal (CCS) 600 40 1 105 252 380 241 90% 91% -11 044 0.098
Gas (combined cycle) 50 25 255 953 450 521 90% -41% -816 734 0.612
Nuclear 800 60 1 908 792 420 62 90% 61% 917 007 0
Hydro 50 80 1 628 792 340 0 60% 55% 158 248 0
Wind (onshore) 50 25 1 047 081 570 0 23% 21% 92 919 0
Solar 50 25 1 745 134 1 150 0 17% 17% -20 134 0
Notes: the maximum load factor accounts for maintenance and unplanned outages; no open cycle gas is included because it is not significant in China and unlikely to become so; CCS is loss-making because it is an emerging technology; if the simulation had run further into the future, technological improvement could have been factored in.
Source: internal IEA approximation.
b. Plant construction times
Plant construction in China can be very fast, but to include more power station technologies in the limited simulation time, planning time was excluded and construction time accelerated. The alternative would have been to maintain realistic construction times, but run the simulation longer, which would have required too much time from the participants. A simplified “real-world best-case” build time was developed and adjusted to match the simulation’s limited timeframe (Table 8 • Power station build times (years)).

Emissions Trading in the People’s Republic of China © OECD/IEA 2014
Page | 34
Table 8 • Power station build times (years)
Fuel “Real-world”
build time Acceleration
factor New build
time Last year in
simulation to build
Coal (small) 3 1.5 2 3
Coal (sub-critical) 3 1.5 2 3
Coal (supercritical) 3 1.5 2 3
Coal (ultra-supercritical) 3 1.5 2 3
Coal (CCS) 3 1.5 2 3
Gas (combined cycle) 3 1.5 2 3
Nuclear 3 1.5 2 3
Hydro 3 1.5 2 3
Wind (onshore) 3 1.5 2 3
Solar 3 1.5 2 3
c. Plant capital, finance, operating and maintenance costs
Plant capital costs are estimates built from World Energy Outlook assumptions, adjusted in consultation with the IEA China desk. It was then assumed that plants would be built with finance, at 5% on a 15-year loan, and that payment would not be due until the plant was completed and operational. IEA added a further 2% of capital costs (4% for nuclear) for operating and maintenance costs. These costs were payable yearly regardless of dispatch.
Table 9 • Power station capital costs
Fuel Undiscounted capital costs
(CNY/MW) Annual capital cost (CNY/MW capacity)
Coal (small) 4 100 000 477 003
Coal (sub-critical) 4 100 000 477 003
Coal (supercritical) 3 900 000 453 735
Coal (ultra-supercritical) 3 800 000 442 101
Coal (CCS) 9 500 000 1 105 252
Gas (combined cycle) 3 200 000 372 295
Nuclear 14 000 000 1 908 792
Hydro 14 000 000 1 628 792
Wind (onshore) 9 000 000 1 047 081
Solar 15 000 000 1 745 134
2. Tariff structure (fuel-based)
China’s tariffs vary according to fuel source. Drawing from Policy Options for Low-Carbon Power Generation in China modelling (IEA, 2012a), and reconfirmed by CEC and CBEEX, a set tariff structure was used in the simulation (which represents a simplified version of China’s existing varied tariffs, but reflects the important differences between different fuel sources) (Table 10 • Tariff received by generation fuel used).

© OECD/IEA 2014 Emissions Trading in the People’s Republic of China
Page | 35
Table 10 • Tariff received by generation fuel used Fuel CNY/MWh
Coal (small) 400
Coal (sub-critical) 400
Coal (supercritical) 390
Coal (ultra-supercritical) 380
Coal (CCS) 380
Gas (combined cycle) 450
Nuclear 420
Hydro 340
Wind (onshore) 570
Solar 1 150
This differential pricing incentivises cleaner generation without a carbon price, which made building new clean generation such a popular strategy and raises questions about the role and extent of such policy after an ETS is introduced.
3. Plant comparison by operating, carbon content and “levellised cost”
The best power station for a VPC to build depends on its position and how that new build fits with its existing fleet. A VPC might need more profitable or cleaner capacity. Table 11 • Power station rankings by different cost metrics ranks the different power stations a VPC could build. The first column is ranked by carbon (and profitability to distinguish the renewables). The second column by operating profit per unit of output, i.e. tariff less running costs. The last column includes construction cost and assumes the plant runs at full capacity, which represents the best profit it can create.
Table 11 • Power station rankings by different cost metrics
Rank by low carbon Rank by operating
profit
Rank by profit over levellised cost (assuming
maximum load)
Hydro (=1) Solar Coal (ultra-supercritical)
Wind (=1) Wind (onshore) Nuclear
Solar (=1) Nuclear Coal (supercritical)
Nuclear Hydro Gas (combined cycle)
Coal (CCS) Coal (ultra-supercritical) Coal (sub-critical)
Gas (combined cycle) Coal (supercritical) Small coal
Coal (ultra-supercritical) Coal (CCS) Hydro
Coal (supercritical) Gas (combined cycle) Wind (onshore)
Coal (sub-critical) Coal (sub-critical) Coal (CCS)
Small coal Small coal Solar

Emissions Trading in the People’s Republic of China © OECD/IEA 2014
Page | 36
Annex D: Trading mechanics, offset market
Basic structure
• Have an allowance buying and selling market for allowances and offsets.
• Have a two-hour trading session each morning and afternoon of each working day of the week (ten sessions in total).
• The morning session is 0930 to 1130 and the afternoon 1400 to 1600.
• Offers can be made at any point during the morning or afternoon session, but trades from both are not executed until the completion session the next day at 1000:
Figure 14 • Illustration of trading pattern in a simulation week Year 1>> Year 2>> Monday Tuesday Wednesday Thursday Friday Monday 0930 AM trading start AM trading start AM trading start AM trading start AM trading start AM trading start 1000 Monday
completion session
Tuesday completion session
Wednesday completion session
Thursday completion session
Friday completion session
1000 + seconds
Monday trades confirmed to VPCs
Tuesday trades confirmed to VPCs
Wednesday trades confirmed to VPCs
Thursday trades confirmed to VPCs
Friday trades confirmed to VPCs
1130 AM trading end AM trading end AM trading end AM trading end AM trading end AM trading end 1400 PM trading start PM trading start PM trading start PM trading start PM trading start PM trading start 1600 PM trading end PM trading end PM trading end PM trading end PM trading end PM trading end 1700 Submit year 1
spreadsheet
Trading
• During the normal trading sessions, VPCs may post orders to buy (bids) and sell (offers).
• Each order comprises:
• quantity of allowance sought/offered;
• price – the minimum price a seller will accept/maximum price a buyer will pay;
• whether the bid/offer can be partially filled or is for the full volume only.
• During the normal sessions:
• any VPC can place an order at any time. All orders and any responses can be seen by all VPCs. VPCs are identified only by their trade account number;
• VPCs respond by offering a price and, for partial trades, volume for that specific order;
• for full quantity orders, responses are displayed ranked by price, and then time submitted;
• for partial fill orders, responses are ranked by price, volume (largest first) and time of submission;
• VPCs who submit an order (buy/sell) can withdraw an order at any time until a VPC responds;
• VPCs who respond can withdraw that response at any time until 0950 the next day.
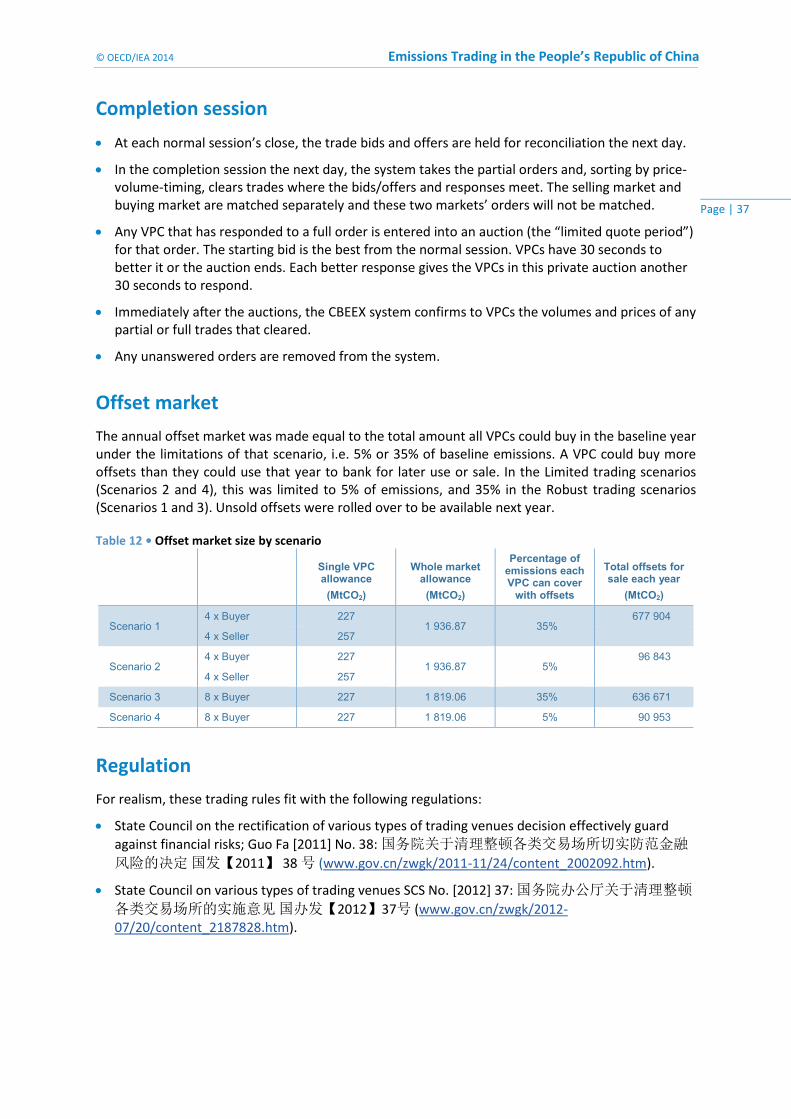
© OECD/IEA 2014 Emissions Trading in the People’s Republic of China
Page | 37
Completion session
• At each normal session’s close, the trade bids and offers are held for reconciliation the next day.
• In the completion session the next day, the system takes the partial orders and, sorting by price-volume-timing, clears trades where the bids/offers and responses meet. The selling market and buying market are matched separately and these two markets’ orders will not be matched.
• Any VPC that has responded to a full order is entered into an auction (the “limited quote period”) for that order. The starting bid is the best from the normal session. VPCs have 30 seconds to better it or the auction ends. Each better response gives the VPCs in this private auction another 30 seconds to respond.
• Immediately after the auctions, the CBEEX system confirms to VPCs the volumes and prices of any partial or full trades that cleared.
• Any unanswered orders are removed from the system.
Offset market
The annual offset market was made equal to the total amount all VPCs could buy in the baseline year under the limitations of that scenario, i.e. 5% or 35% of baseline emissions. A VPC could buy more offsets than they could use that year to bank for later use or sale. In the Limited trading scenarios (Scenarios 2 and 4), this was limited to 5% of emissions, and 35% in the Robust trading scenarios (Scenarios 1 and 3). Unsold offsets were rolled over to be available next year.
Table 12 • Offset market size by scenario
Single VPC allowance (MtCO2)
Whole market allowance (MtCO2)
Percentage of emissions each VPC can cover
with offsets
Total offsets for sale each year
(MtCO2)
Scenario 1 4 x Buyer 227
1 936.87 35% 677 904
4 x Seller 257
Scenario 2 4 x Buyer 227
1 936.87 5% 96 843
4 x Seller 257
Scenario 3 8 x Buyer 227 1 819.06 35% 636 671
Scenario 4 8 x Buyer 227 1 819.06 5% 90 953
Regulation
For realism, these trading rules fit with the following regulations:
• State Council on the rectification of various types of trading venues decision effectively guard against financial risks; Guo Fa [2011] No. 38: 国务院关于清理整顿各类交易场所切实防范金融
风险的决定 国发【2011】 38 号 (www.gov.cn/zwgk/2011-11/24/content_2002092.htm).
• State Council on various types of trading venues SCS No. [2012] 37: 国务院办公厅关于清理整顿
各类交易场所的实施意见 国办发【2012】37号 (www.gov.cn/zwgk/2012-07/20/content_2187828.htm).

Emissions Trading in the People’s Republic of China © OECD/IEA 2014
Page | 38
Annex E: Scenario results
Scenario 1 (Robust trading, buyer-seller VPCs)
Figure 15 • Scenario 1 new build by fuel and year
Table 13 • Scenario 1 trading summary
Allowances
(tCO2) Offsets (tCO2)
Volume (tCO2)
Expenditure (CNY)
Weighted price (CNY/tCO2)
Year 1 - - - -
Year 2 638 142 524 032 1 162 174 12 965 616 11
Year 3 26 600 000 76 000 000 102 600 000 1 406 750 000 14
Year 4 - 601 380 383 601 380 383 9 020 705 745 15
Year 5 102 000 000 1 000 000 103 000 000 1 043 850 000 10
Total 129 238 142 678 904 415 808 142 557 11 484 271 361 14
Figure 16 • Scenario 1 allowance and offset trade volumes
0
5 000
10 000
15 000
20 000
25 000
30 000
35 000
40 000
45 000
0 1 2 3 4
New
capa
city (
GW)
Year
Renewables
Nuclear
Gas
Coal
0
100
200
300
400
500
600
700
1 2 3 4 5
MtCO
2
Year
Offset
Allowance

© OECD/IEA 2014 Emissions Trading in the People’s Republic of China
Page | 39
Figure 17 • Scenario 1 weighted average CO2 trade price
Figure 18 • Scenario 1 CO2 trade price buy trade initiation (buy-sell)
Figure 19 • Scenario 1 CO2 trade price through time
0102030405060708090
100
1 2 3 4 5
CNY/tCO
2
Year
Scenario 1 (Robust trading, buyers-sellers)
0
2
4
6
8
10
12
14
16
1 2 3 4 5
CNY/tCO
2
Year
Buy
Sell
0
10
20
30
40
50
60
70
80
0
100
200
300
400
500
600
700
1 2 3 4 5 6 7 8 9 10 11 12 13 14
Year 2 Year 3 Year 4 Year 5
Price
/CNY
Trade
volu
me/m
tCO2
Trade volume
Trade price

Emissions Trading in the People’s Republic of China © OECD/IEA 2014
Page | 40
Scenario 2 (Limited trading, buyer-seller VPCs)
Figure 20 • Scenario 2 new build by fuel and year
Table 14 • Scenario 2 trading summary
Allowances
(tCO2) Offsets (tCO2)
Volume (tCO2)
Expenditure (CNY)
Weighted price (CNY/tCO2)
Year 1 21 700 000 96 843 488 118 543 488 1 924 048 450 16
Year 2 12 500 000 - 12 500 000 331 200 000 27
Year 3 30 006 893 33 369 132 63 376 025 1 814 224 145 29
Year 4 5 000 000 123 841 184 128 841 184 4 865 772 203 38
Year 5 - 36 853 373 36 853 373 3 684 447 650 100
Total 69 206 893 290 907 177 360 114 070 12 619 692 448 35
Figure 21 • Scenario 2 allowance and offset trade volumes
0
5 000
10 000
15 000
20 000
25 000
30 000
35 000
40 000
45 000
0 1 2 3 4
New
capa
city (
GW)
Year
Nuclear
Coal
0
20
40
60
80
100
120
140
1 2 3 4 5
MtCO
2
Year
Offset
Allowance
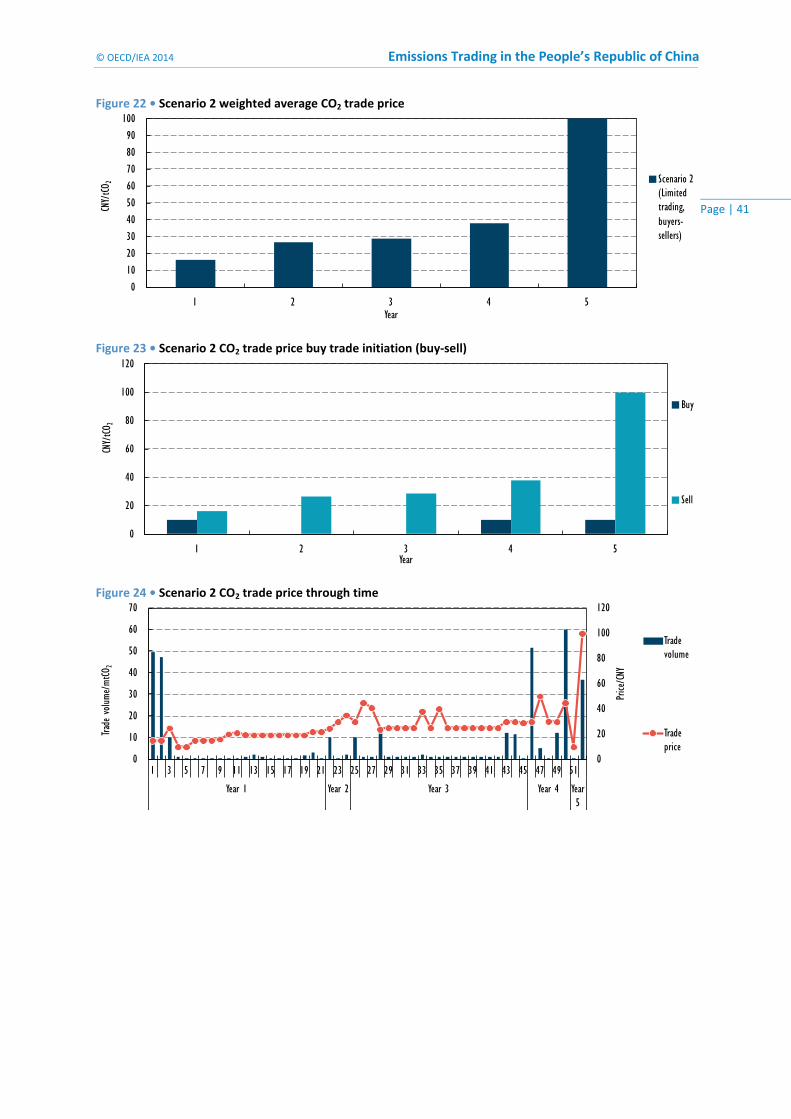
© OECD/IEA 2014 Emissions Trading in the People’s Republic of China
Page | 41
Figure 22 • Scenario 2 weighted average CO2 trade price
Figure 23 • Scenario 2 CO2 trade price buy trade initiation (buy-sell)
Figure 24 • Scenario 2 CO2 trade price through time
0102030405060708090
100
1 2 3 4 5
CNY/tCO
2
Year
Scenario 2 (Limited trading, buyers-sellers)
0
20
40
60
80
100
120
1 2 3 4 5
CNY/tCO
2
Year
Buy
Sell
0
20
40
60
80
100
120
0
10
20
30
40
50
60
70
1 3 5 7 9 11 13 15 17 19 21 23 25 27 29 31 33 35 37 39 41 43 45 47 49 51
Year 1 Year 2 Year 3 Year 4 Year 5
Price
/CNY
Trade
volu
me/m
tCO2
Trade volume
Trade price
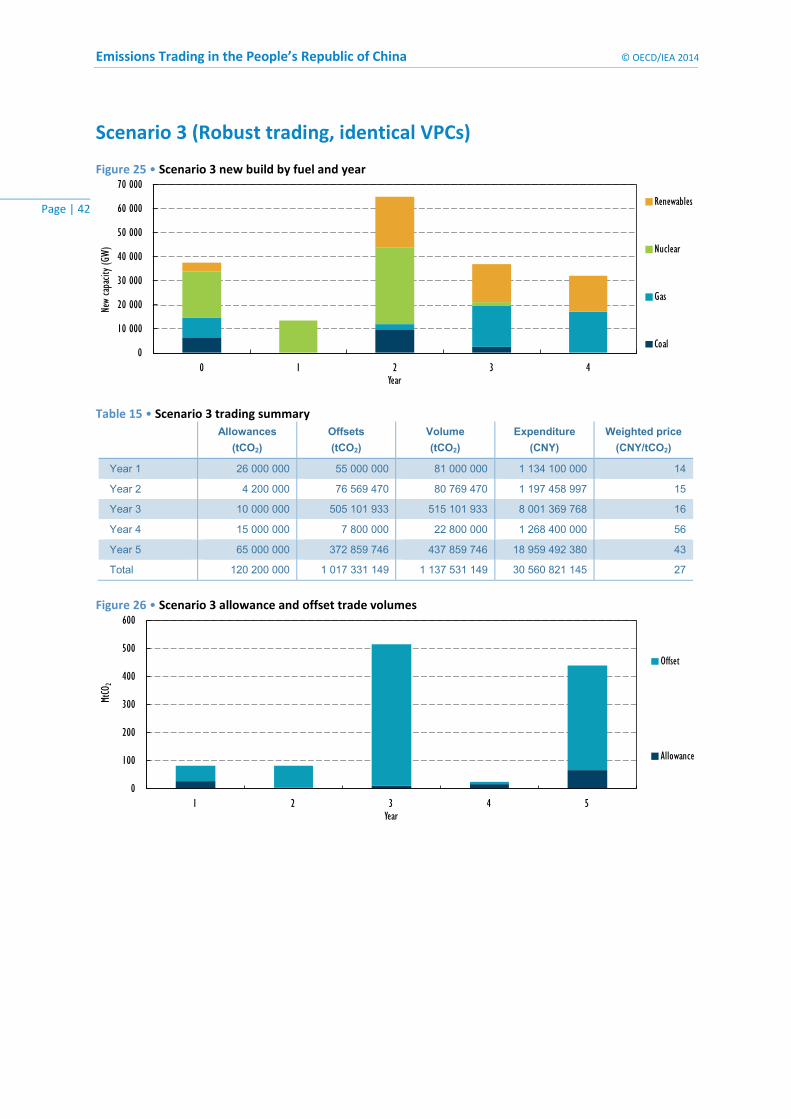
Emissions Trading in the People’s Republic of China © OECD/IEA 2014
Page | 42
Scenario 3 (Robust trading, identical VPCs)
Figure 25 • Scenario 3 new build by fuel and year
Table 15 • Scenario 3 trading summary
Allowances
(tCO2) Offsets (tCO2)
Volume (tCO2)
Expenditure (CNY)
Weighted price (CNY/tCO2)
Year 1 26 000 000 55 000 000 81 000 000 1 134 100 000 14
Year 2 4 200 000 76 569 470 80 769 470 1 197 458 997 15
Year 3 10 000 000 505 101 933 515 101 933 8 001 369 768 16
Year 4 15 000 000 7 800 000 22 800 000 1 268 400 000 56
Year 5 65 000 000 372 859 746 437 859 746 18 959 492 380 43
Total 120 200 000 1 017 331 149 1 137 531 149 30 560 821 145 27
Figure 26 • Scenario 3 allowance and offset trade volumes
0
10 000
20 000
30 000
40 000
50 000
60 000
70 000
0 1 2 3 4
New
capa
city (
GW)
Year
Renewables
Nuclear
Gas
Coal
0
100
200
300
400
500
600
1 2 3 4 5
MtCO
2
Year
Offset
Allowance
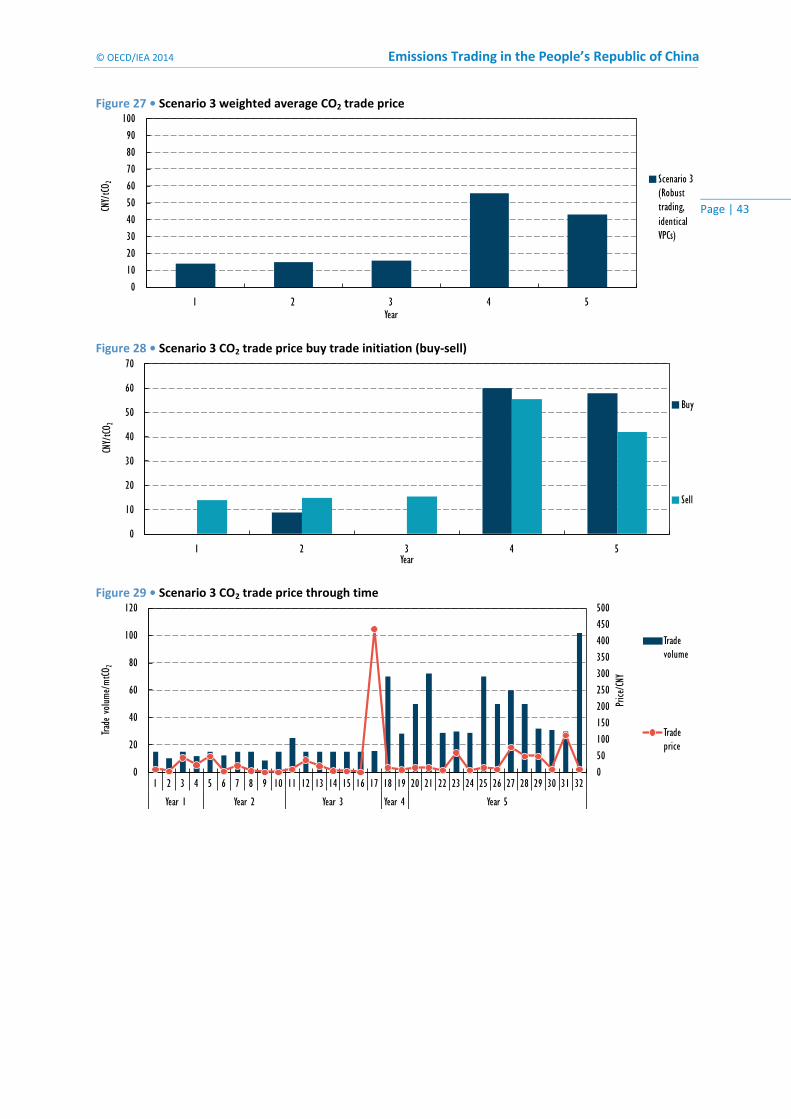
© OECD/IEA 2014 Emissions Trading in the People’s Republic of China
Page | 43
Figure 27 • Scenario 3 weighted average CO2 trade price
Figure 28 • Scenario 3 CO2 trade price buy trade initiation (buy-sell)
Figure 29 • Scenario 3 CO2 trade price through time
0102030405060708090
100
1 2 3 4 5
CNY/tCO
2
Year
Scenario 3 (Robust trading, identical VPCs)
0
10
20
30
40
50
60
70
1 2 3 4 5
CNY/tCO
2
Year
Buy
Sell
050100150200250300350400450500
0
20
40
60
80
100
120
1 2 3 4 5 6 7 8 9 10 11 12 13 14 15 16 17 18 19 20 21 22 23 24 25 26 27 28 29 30 31 32
Year 1 Year 2 Year 3 Year 4 Year 5
Price
/CNY
Trade
volu
me/m
tCO2
Trade volume
Trade price

Emissions Trading in the People’s Republic of China © OECD/IEA 2014
Page | 44
Scenario 4 (Limited trading, identical VPCs)
Figure 30 • Scenario 4 new build by fuel and year
Table 16 • Scenario 4 trading summary
Allowances
(tCO2) Offsets (tCO2)
Volume (tCO2)
Expenditure (CNY)
Weighted price (CNY/tCO2)
Year 1 - 90 953 058 90 953 058 1 364 695 870 15
Year 2 - 37 369 000 37 369 000 1 084 225 000 29
Year 3 - 132 053 191 132 053 191 5 012 371 343 38
Year 4 5 000 000 163 698 719 168 698 719 9 379 784 472 56
Year 5 9 500 000 101 038 778 110 538 778 9 870 201 350 89
Total 14 500 000 525 112 746 539 612 746 26 711 278 035 50
Figure 31 • Scenario 4 allowance and offset trade volumes
0
10 000
20 000
30 000
40 000
50 000
60 000
70 000
80 000
0 1 2 3 4
New
capa
city (
GW)
Year
Renewables
Nuclear
Gas
Coal
0
20
40
60
80
100
120
140
160
180
1 2 3 4 5
MtCO
2
Year
Offset
Allowance

© OECD/IEA 2014 Emissions Trading in the People’s Republic of China
Page | 45
Figure 32 • Scenario 4 weighted average CO2 trade price
Figure 33 • Scenario 4 CO2 trade price buy trade initiation (buy-sell)
Figure 34 • Scenario 4 CO2 trade price through time
0102030405060708090
100
1 2 3 4 5
CNY/tCO
2
Year
Scenario 4 (Limited trading, identical VPCs)
0102030405060708090
100
1 2 3 4 5
CNY/tCO
2
Year
Sell
0102030405060708090100
0
20
40
60
80
100
120
140
160
1 2 3 4 5 6 7 8 9 10 11 12 13 14 15 16 17 18 19 20 21 22 23 24 25 26 27 28 29 30 31 32 33 34
Year 1 Year 2 Year 3 Year 4 Year 5
Price
/CNY
Trade
volu
me/m
tCO2
Trade volume
Trade price

Emissions Trading in the People’s Republic of China © OECD/IEA 2014
Page | 46
Annex F: Observations for developing a refined future simulation Participant feedback was that the simulation provided a useful introduction to emissions trading, in spite of the format’s inherent limitations. From this and an internal review, a number of observations and refinements have emerged that could enhance the simulation if run again.
Introduce uncertainty
• Inject market disturbances to which participants would need to respond. • Vary annual generation requirements and fuel prices. (The stability of these two factors gave
VPCs an unrealistically stable outlook and reduced the need to adapt plans.) • Including demand, fuel price and/or other shocks would provide a more realistic test for
participants, and enable all stakeholders to better explore how the ETS markets react. • In China seasons have a large impact on energy demand. It would be useful to see how these
factors affect trading behaviour and market activity.
Finite cash flow with profit measuring
• Giving VPCs a finite amount of capital would be more realistic and force them to think about the timing of their new build and limiting their ability to “build their way out of the problem”.
• Several participants commented that the simulation could have given VPCs a cash balance and that might have resulted in more allowance trading.
Run the simulation with more players
• There was a broad feeling that more players would be an improvement, in particular for the scenarios with sub-markets (Scenarios 2 and 4). A further simulation could experiment with different size markets, but with at least six players in its smallest market.
Run the simulation for longer
• A longer simulation period would be beneficial. The five-year simulation limited time for participants to try and adapt new building strategies. It also encouraged short-term thinking around carbon prices and trading.
Refine availability of new nuclear
• Each VPC could freely build nuclear power plants, which may not reflect reality (e.g. there may be limits on the total number of plants that can be built across the country). Limiting the access to new nuclear plants – to reflect fuel, planning or other constraints – might be appropriate.
Introduce load dispatch
• The new-build decision is simpler without a distinction between peaking and non-peaking plant. Winners’ feedback confirmed that including different plants’ dispatch speed (e.g. “fast on” thermal plants, such as gas) would provide a closer representation of the operating decisions they face.
Introduce an electricity market
• Some participants suggested it would be interesting to explore tradable power obligations, where VPCs could sell or acquire the obligation to generate while trading carbon.
• This would provide VPCs with more options and, by extension, a more complex and dynamic process of matching production to emissions allowances.

© OECD/IEA 2014 Emissions Trading in the People’s Republic of China
Page | 47
Acronyms, abbreviations and units of measure
Acronyms and abbreviations
CBEEX China Beijing Environment Exchange CCS carbon capture and storage CEC China Electricity Council CO2 carbon dioxide COP Conference of the Parties to the United Nations Framework Convention on Climate Change EDF Environmental Defense Fund ETS emissions trading scheme GDP gross domestic product VPC virtual power company
Units of measure GW gigawatt tCO2/GWh tonne of carbon dioxide per gigawatt hour KWh kilowatt hour MW megawatt MWh megawatt hour MtCO2 million tonnes of carbon dioxide tCO2 tonne of carbon dioxide TWh terawatt hour

Emissions Trading in the People’s Republic of China © OECD/IEA 2014
Page | 48
References CEC (China Electricity Council) (2014) Monthly Statistics of China Power Industry February 2014,
Beijing, http://english.cec.org.cn/No.110.1535.htm.
CEC (2012), Power Consumption in China, www.eeo.com.cn/2012/0227/221479.shtml.
China.org.cn (authorised government portal) (2013), China will notably cut CO2 emissions by 2020, http://china.org.cn/environment/warsaw_climate_talks/2013-11/21/content_30663021.htm.
IEA (International Energy Agency) (2014a), CO2 Emissions from Fossil Fuel Combustion, OECD/IEA, Paris.
IEA (2014b), Electricity Output, OECD/IEA, Paris.
IEA (2012a), Policy Options for Low-Carbon Power Generation in China, OECD/IEA, Paris, www.iea.org/publications/insights/Insight_PolicyOptions_LowCarbon_China.pdf.
IEA (2012b), World Energy Outlook, OECD/IEA, Paris, www.worldenergyoutlook.org/publications/weo-2012/.
IMF (International Monetary Fund) (2012), World Economic Outlook 2012, October dataset, www.imf.org/external/pubs/ft/weo/2012/02/weodata/index.aspx.
NDRC (National Development and Reform Commission China) (2013), Market Readiness Proposal: Establishing a National Emissions Trading Scheme in China, www.thepmr.org/system/files/documents/China_MRP_final_19-02-2013rev_0.pdf.
NDRC (2012), The Five Year Plan, Part IV Chapter 21, the EU delegation has provided an English translation at: http://eeas.europa.eu/delegations/china/index_en.htm.
Reuters (2013), China's Guangdong carbon market, world's second biggest, to start in December, www.reuters.com/article/2013/11/27/us-china-carbon-guangdong-idUSBRE9AQ05G20131127.
This document and any map included herein are without prejudice to the status of or sovereignty over any territory, to the delimitation of international frontiers and boundaries and to the name of
any territory, city or area.
IEA Publications 9, rue de la Fédération, 75739 Paris cedex 15
Printed in France by IEA, July 2014

www.iea.org/books
PDF versions at 20% discount
nlinebookshop
Tel: +33 (0)1 40 57 66 90
E-mail: [email protected]
International Energy Agency9 rue de la Fédération
75739 Paris Cedex 15, France
Secure Sustainable Together