Embed Size (px)
Citation preview
University of Nebraska - Lincoln University of Nebraska - Lincoln
DigitalCommons@University of Nebraska - Lincoln DigitalCommons@University of Nebraska - Lincoln
Hendricks Symposium--Department of Political Science Political Science, Department of
October 2006
Empathy and Collective Action in the Prisoner's Dilemma Empathy and Collective Action in the Prisoner's Dilemma
John A. Sautter University of Vermont
Follow this and additional works at: https://digitalcommons.unl.edu/politicalsciencehendricks
Part of the Political Science Commons
Sautter, John A., "Empathy and Collective Action in the Prisoner's Dilemma" (2006). Hendricks Symposium--Department of Political Science. 14. https://digitalcommons.unl.edu/politicalsciencehendricks/14
This Article is brought to you for free and open access by the Political Science, Department of at DigitalCommons@University of Nebraska - Lincoln. It has been accepted for inclusion in Hendricks Symposium--Department of Political Science by an authorized administrator of DigitalCommons@University of Nebraska - Lincoln.
Empathy and Collective Action in the Prisoner’s Dilemma
By John A. Sautter1
Economists guided by evolutionary psychology have theorized that in an iterated Prisoner’s Dilemma reciprocal behavior is a product of evolutionary design, where individuals are guided by an innate sense of fairness for equal outcomes. Empathy as a pro-social emotion could be a key to understanding the psychological underpinnings of why and who tends to cooperate in a collective act. In short, why are some individuals more prone to participate in collective-action? The hypothesis that a pro-social psychological disposition stemming from self-reported empathy will lead to group-oriented behavior in an iterated Prisoner’s Dilemma game is tested. Results suggest that an empathetic disposition does not lead to a higher rate of cooperation, but interacts with environmental conditioning to produce either a highly cooperative or highly uncooperative personality type.
Introduction Most conceptions of the classic collective action problem imply that individuals
have strong incentives to not cooperate in the face of a Prisoner’s Dilemma like policy
situation (Axelrod, 1984; Ostrom, 1998). The free-rider problem in this view applies to
all people in society because each has an advantage to not cooperate, but to advance their
own interests. Consequently, groups and institutions merely form on the basis of how
well they serve the interests and goals of their members (Olson, 1965). In contrast to this
rational-essentialist view it has been shown that individuals do “irrationally” cooperate in
both a Prisoner’s Dilemma game and in real life scenarios that are parallel to it (Axelrod,
1984; Ridley, 1996; Field, 2004).
One of the main problems with the rational-essentialist viewpoint is that it makes
no room for the inherent differences that are found amongst ordinary people. Some
individuals tend to be more other-oriented, while some individuals are more oriented
1 John A. Sautter graduated cum laude from New York University, received his M.A. in History from the University of Nebraska at Omaha and his Ph.D. in political science from the University of Nebraska at Lincoln. He currently attends Vermont Law School in South Royalton, VT and is a Lieutenant in the United States Marine Corps.
toward their own self-interest (Fehr and Schmidt, 1999; Hibbing and Alford, 2004).
These differences should not be overlooked. Most models of political decision-making,
whether rational choice or behavioralist, essentially prescribe to the “black box” notion of
political cognition, where stimuli are applied to an individual and certain actions are
produced (Green and Shapiro, 1996; Alford and Hibbing, 2004; Smith, 2005). However,
these basic arguments overlook the neurological structures of the brain and essentially
suggest that they are unimportant, or in the least are merely novel bits of trivia that are
not conducive to understanding the macro-level phenomenon that political scientists are
accustomed to studying. This sort of assertion is wrong on many levels. First,
understanding the complex motivations that lay behind the formation of preferences may
help democratic theorists devise better institutional arrangements. Emotions are intuitive
value judgments that emanate from the subconscious part of the cerebral system
(Damasio, 1994). The investigation of the interaction of emotional or psychological
dispositions with more accepted notions of cognition may lead to a better understanding
of political preference formation and of the very human nature of collective action.
This study investigates the effects of an empathetic emotional disposition in
decision-making by utilizing the Prisoner’s Dilemma framework. It is theorized that an
empathetic disposition is an important guide to an individual’s decision-making process
when faced with a collective action problem. Evolutionary theory posits that group level
selection has endowed humans with a propensity for cooperative behavior in the absence
of selective incentives by equipping the human mind with pro-social emotions (Bowles
and Gintis, 2003). In short, individuals “do their part in society” because it makes them
feel good. However, some people get more satisfaction than others out of political
participation or paying attention to civic issues. This is likely due to differences in
behavioral traits that are genetically innate and socially conditioned (Alford and Hibbing,
2004). It is hypothesized here that a higher level of self reported empathy will lead to a
more explicit demonstration of group-oriented egalitarian behavior in the iterated
Prisoner’s Dilemma.
Evolution and Empathy Research in behavioral psychology and neuroscience suggests an alternative
conception of the collective action problem in human interactions to the rationalist
model. Instead of envisioning each individual as a rational being with merely different
preferences from others, innate genetic and socialized personality differences are
understood to be an ultimate cause of preferences for cooperative behavior. In other
words, the Olsonian free rider is not just a theoretical concept but is a personality type
with distinct characteristics (Hibbing and Alford, 2004). Evolution has cultivated a
multitude of personality traits that vary amongst humans. This phenotypic variation
allows for selective advantages on the group level (Wilson, 2002). Whether an individual
is more of a rational calculator or an empathetic altruist, both would have played an
important role in collective success in humans’ distant past.
Geneticists and neuroscience researchers have given most of their attention to the
sorts of personality traits and neurological conditions that result in the abnegation of
cooperative behavior at the cost of overlooking the sorts of pro-social behavioral traits
that positively lead to a cooperative psychological disposition (Davis, Luce and Kraus,
1994). Studies of autism, violent behavior and other asocial disorders indicate that
genetic inheritance, as well as environmental conditioning, is an important determinant of
patterns of behavior (Ebstein, Benjamin, and Belmaker, 2003; Pericak-Vance, 2003).
Most important amongst pro-social personality traits is empathy. Empathy can be
defined and interpreted under the auspices of three main sub-characteristics: concern for
others, perspective taking (also called theory of mind empathy) and personal distress, or
the ability to have emotional reactions to others in need. A study of 800 twin-pairs that
compared monozygotic to dizygotic dyads estimated the combined inheritance of these
three components of empathy to be estimated at 32% (Davis et al., 1994). In light of this
sort of finding and those concerning anti-social behavior, it is likely that genetic
inheritance of behavioral traits affects the preferences that individuals form for
cooperative social behavior.
The study of the manner in which individuals attempt to understand and place
themselves emotionally in the place of another is of great importance in contemplating
how social groups and networks are motivated to carry out pro-social behavior. Thoits
(1989: 328) states that “empathetic role-taking emotions, or vicarious emotions, result
from mentally placing oneself in another’s position and feeling what the other might feel
in that situation.” Empathy is arguably one of the most important socioemotional
experiences because it provides the impetus and mental processes involved in “the effort
to understand the internal mental and emotional events of other human beings”
(Rosenberg, 1990:8). Indeed, this sort of emotional capacity has been important to
researchers looking at what motivates moral and pro-social actions, finding that higher
levels of empathy tend to make individuals more likely to be morally outraged or to take
action to prevent unjust acts (Davis, 1996; Smith-Lovin, 1995). A heightened sense of
morality or an active vigilance in regards to justice are exactly the sorts of behavioral
tendencies that evolutionary theory would suggest should be present in those individuals
with an inclination for group-orientated outcomes.
There are three main evolutionary arguments for the development of empathy.
First, is the well known theory of kin selection (Hamilton, 1964). This theory posits that
there is a selective advantage in cooperating with those who share the same genetic code,
or at least part of it. The empathetic bonds that are tightly woven between mother and
child or, to a lesser degree, the general pattern of cooperation among extended families
are both examples of how the empathetic disposition of the human species promotes kin
advantage. The second evolutionary theory focuses more on the interaction with those
who are not genetically related. Reciprocal altruism hypothesizes that the empathetic
bonds that develop in friendships or working relationships evolved out of an iterated
sequence of encounters where conspecifics mutually benefited from cooperation
(Axelrod, 1984). The proverbial “I’ll scratch your back if you scratch mine” line of
reasoning summarily defines the manifestation of this sort of empathetic bond. Finally,
the group-selection model of human evolution posits that inter-group conflict promoted
the adoption of empathetic characteristics because natural selection would have rewarded
those groups that worked together well over groups that would not have contained the
frequency of individuals with cooperative dispositions (Sober and Wilson, 1998). It is
probable that a combination of all three evolutionary modes contributed to the
development of ubiquitous empathetic disposition in humans.
The Prisoner’s Dilemma as Collective Action
The Prisoner’s Dilemma has been invoked time and again in explanation of the
evolutionary origins of human behavior. It represents in a simplified manner the
continual problem of reciprocity, trust and collective action (Rapoport and Chammah,
1965; Axelrod, 1984; Ridley, 1996; Fehr and Schmidt, 1999) that is ever-present in
iterated interactions between human beings. This makes the Prisoner’s Dilemma
framework ideal for a test of pro-social emotional disposition in an incentive based game
because it is simple enough for those first exposed to it in an experimental setting to
comprehend, yet theoretically sophisticated so as to allow a rich interpretation of the
results.2
Many in political science have drawn upon this simple game as the basis for
theory. In contrast to Olson’s more traditional economic view of collective action,
Hardin (1982) frames the free-rider problem as really an N-person Prisoner’s Dilemma
(PD) game. Much in line with the way that evolutionary theorists suggest that reciprocal
behavioral situations may have evolved in humans some theorists, including Palfrey and
Rosenthal (1983) as well as Axlerod (1984), suggest that if certain conditions are met
cooperative behavior is a predictable outcome of the PD.
First, individuals need to have a low rate of time-preference, or in other words
they should not discount the future too much. The second condition is that the game
theoretic scenario needs to be repeated several times. This mitigates the standard one-
shot strategy of defection. Similarly, the third condition requires there to be uncertainty
among the players about when the game will end. Under rational choice assumptions
players will always defect in the final round if information is available on when the game
2 Originally designed by the Rand Corporation in the 1950’s to test cold war nuclear exchange strategies, the incentive structure is such that mutual defection, or non-cooperation, is the rational choice, but cooperation is the mutually beneficial response for both participants (Poundstone, 1992).
will end. The final condition involves punishment. If each player is capable of punishing
other players that defect over the course of the game then an incentive structure is created
that discourages defection. Theoretically, these conditions work best when there is no
central authority and agents are left to their own to decide whether to defect or cooperate.
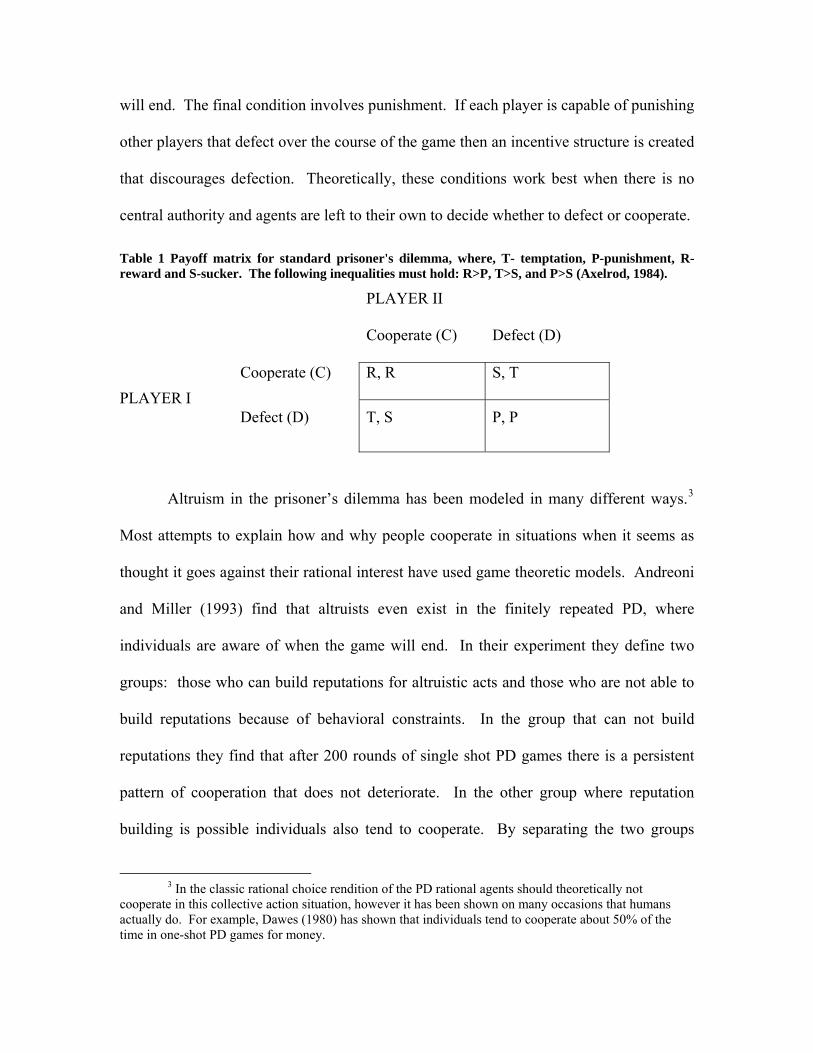
Table 1 Payoff matrix for standard prisoner's dilemma, where, T- temptation, P-punishment, R-reward and S-sucker. The following inequalities must hold: R>P, T>S, and P>S (Axelrod, 1984).
PLAYER II
Cooperate (C) Defect (D)
Cooperate (C) R, R S, T PLAYER I
Defect (D) T, S P, P
Altruism in the prisoner’s dilemma has been modeled in many different ways.3
Most attempts to explain how and why people cooperate in situations when it seems as
thought it goes against their rational interest have used game theoretic models. Andreoni
and Miller (1993) find that altruists even exist in the finitely repeated PD, where
individuals are aware of when the game will end. In their experiment they define two
groups: those who can build reputations for altruistic acts and those who are not able to
build reputations because of behavioral constraints. In the group that can not build
reputations they find that after 200 rounds of single shot PD games there is a persistent
pattern of cooperation that does not deteriorate. In the other group where reputation
building is possible individuals also tend to cooperate. By separating the two groups
3 In the classic rational choice rendition of the PD rational agents should theoretically not
cooperate in this collective action situation, however it has been shown on many occasions that humans actually do. For example, Dawes (1980) has shown that individuals tend to cooperate about 50% of the time in one-shot PD games for money.
Andreoni and Miller are able to show that reputation is not as important to altruistic
behavior as it might be thought. Indeed, their findings suggest that people probably have
what they refer to as “homemade” altruistic preferences, or in other words, people tend to
have individual dispositions making them more likely to cooperate.
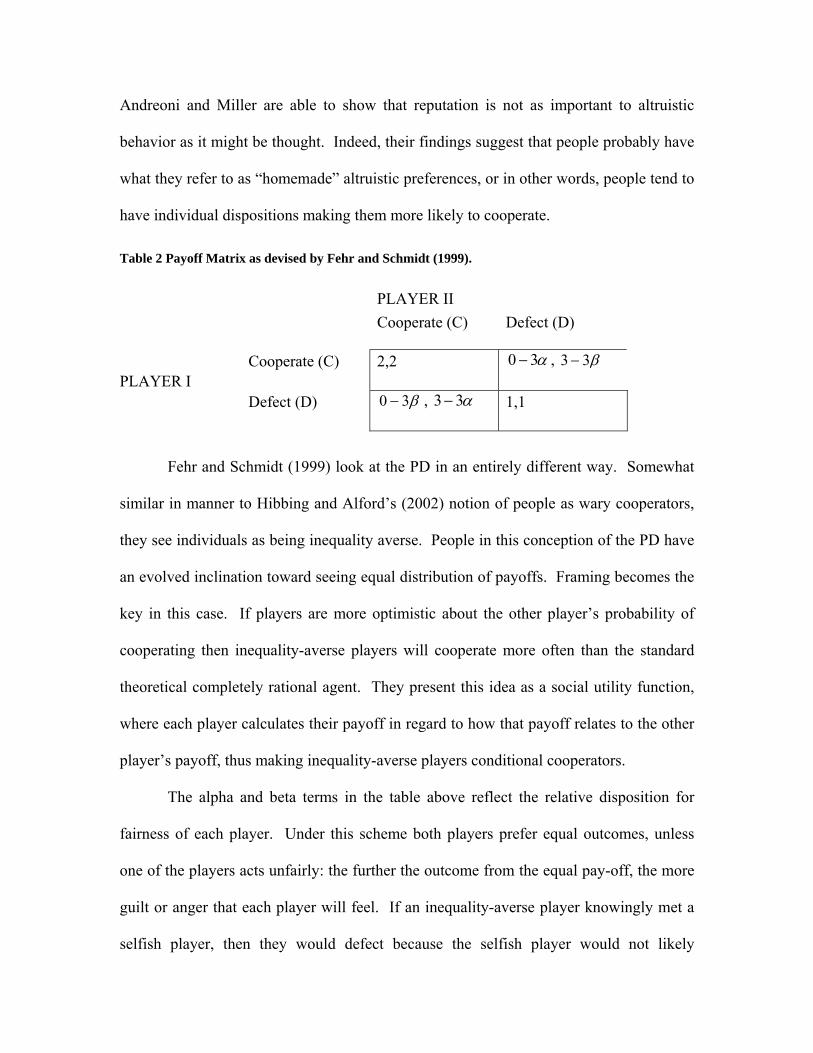
Table 2 Payoff Matrix as devised by Fehr and Schmidt (1999).
PLAYER II Cooperate (C) Defect (D)
Cooperate (C) 2,2 α30 − , β33− PLAYER I
Defect (D) β30 − , α33− 1,1
Fehr and Schmidt (1999) look at the PD in an entirely different way. Somewhat
similar in manner to Hibbing and Alford’s (2002) notion of people as wary cooperators,
they see individuals as being inequality averse. People in this conception of the PD have
an evolved inclination toward seeing equal distribution of payoffs. Framing becomes the
key in this case. If players are more optimistic about the other player’s probability of
cooperating then inequality-averse players will cooperate more often than the standard
theoretical completely rational agent. They present this idea as a social utility function,
where each player calculates their payoff in regard to how that payoff relates to the other
player’s payoff, thus making inequality-averse players conditional cooperators.
The alpha and beta terms in the table above reflect the relative disposition for
fairness of each player. Under this scheme both players prefer equal outcomes, unless
one of the players acts unfairly: the further the outcome from the equal pay-off, the more
guilt or anger that each player will feel. If an inequality-averse player knowingly met a
selfish player, then they would defect because the selfish player would not likely
reciprocate their cooperation. Therefore, the most equal payoff for both parties, in the
eyes of the inequality averse player, would be the Nash equilibrium outcome (P,P). The
inequality-averse player is not altruistic, but egalitarian.
Emotion and Cooperation
This notion of egalitarianism coincides with the way that evolutionary psychology
theorizes that individuals have innate preferences for fairness. Absolute outcomes are not
as important as relative outcomes. The process of how the game is played in relation to
the other player becomes the most important aspect. Both evolutionary theories of multi-
level selection and reciprocal altruism reflect this focus on relative outcomes. In the case
of collective action, individuals should be disposed toward equal and fair outcomes that
reflect an innate desire to achieve what is implicitly best for the group, not for the
individual (Fehr and Gachter, 2000). This is in line with Hibbing and Alford’s (2002)
notion that people are wary cooperators, who want to be neither suckers nor leeches in
their relations to others. Indeed, the very emotions that Fehr and Schmidt suggest are
elicited (anger and guilt) when an individual receives or dictates what they perceive to be
an unequal payoff are theorized to have evolved from a sort of reciprocal necessity over
millions of years of proto-human existence. Evolutionary pressure equipped humans
with emotions in order to guide their decision making in the group context (Bowles and
Gintis, 2003). From this perspective it is not rationality per se that a researcher should be
investigating, but the emotions that lead to intra-group rationality that are designed to
deal with conflict and compromise.
Empathy becomes an important element in attempting to understand this innate
and evolved group-related behavior. Most mammals, and certainly non-mammalian
species, do not have the scope or breadth of complexity in emotion that humans
demonstrate in their everyday interaction. At the base of this emotional temperament is a
pro-social empathetic disposition that varies from individual to individual. As Sober and
Wilson (1998) imply throughout their polemic, empathy is the veritable context with in
which all choices are made.4 Indeed, McCabe et al. (2001) found that different parts of
the brain are used when a player is competing against a computer versus another human.
When playing against another human a large part of the pre-frontal cortex becomes
activated, while in contrast when playing a computer only a small area in the rear of the
brain that is used in mental calculation, like arithmetic, becomes activated. This suggests
that the empathetic context of another human actually provokes a completely different
sort of “rationality” than when making decisions concerning non-human subjects.
These findings, along with the aforementioned studies on empathy and past
experimental work using the Prisoner’s Dilemma posed two hypotheses:
Hypothesis I: A more robust empathetic psychological disposition will lead to higher rates of “punishment” or mutual defection in the face of an initial defection by another player.
Hypothesis II: Empathy will predict more forgiving behavior in a player during a period when the opposing player attempts to re-establish mutual cooperation. In short, it is hypothesized that more empathy will lead to a more explicit display of
group-oriented egalitarian behavior. Empathy should heighten an individual’s awareness
of being the Hibbian/Alfordian leech or sucker.
4 See chapter three especially.
The Experiment A twofold experiment was undertaken to test the hypotheses suggested above.
The first part of the experiment involved replicating a PD situation where defection and
cooperation are hypothesized to occur. The second part of the experiment involved
gathering psychological information using a battery of self-reported empathy questions in
order to measure each respondent’s empathetic disposition.
Using 133 undergraduate students (57 females and 76 males) as participants, a
fifteen round, three-stage game was utilized to test the hypothetical relationship between
group-oriented behavior and empathy. Two separate groups of undergraduates
participated. One group consisted of 81 students from a finance class and the other
consisted of 52 College of Arts and Sciences students taken from a psychology and a
political science class. The experiment incorporated the four conditions discussed that
should make the game conducive to cooperation. Students made their decisions
simultaneously with their opponent. They were given the impression that they were
playing another person when in reality they were playing a computer programmed to
either cooperate or defect. The first stage of mixed cooperation and defection by the
computer was followed by a second stage of complete defection, which in turn was then
followed by a final stage of complete cooperation. The experiment allowed the
investigator to analyze how participants reacted to the complete defection in the second
stage, as well as complete cooperation in the third stage.
Table 3 Payoff regime for proposed prisoner's dilemma experiment. Numbers indicate ‘hypothetical dollars’.
Cooperate (C) Defect (D)
Cooperate (C) 2,2 0,3
Defect (D) 3,0 1,1
Participants with a higher level of empathy should defect at higher rates when the
computer defects and restore cooperation with their computer opponent to a higher
degree than those with lower levels. Students were not informed when the game would
end, but were told that it would end randomly at some unknown round. Participants
played for extra credit. At the beginning of the game students were told that the winner
of the game would receive the full amount of extra credit, while the loser would only
receive half of the amount of extra credit promised. At the end of the game students were
debriefed and told that no matter the outcome all students would receive the full amount
of extra credit promised.5 The payoff regime followed the ordering presented in Table 3,
where there is a collective benefit of 4 points, divided by both players equally to
cooperate, but an individual incentive of 3 to defect.
Stage 1
Round 1 2 3 4 5 Computer C D C C C
In stage one the computer was programmed to cooperate except for a single
second round defection. The second round defection was felt necessary in order to
imbibe into students a sense of randomness and uncertainty that should accompany player
another human being. Complete cooperation followed by complete defection in the 5 The instructions, rules and game protocol are presented in a Game Appendix at the end of this paper.
second stage of the experiment it was felt might induce a feeling in the participant that
they were playing with an artificial opponent, which would of course pollute the results.
Stage 2
Round 6 7 8 9 10Computer D D D D C
In stage two of the experiment the computer was programmed to defect for four
rounds, beginning in round six and ending in round nine. It was during this stage that it
was expected that a strong majority of participants would begin to consistently defect on
their computer opponent. However, the hypothesis for this experiment is that those with
a higher level of empathy will defect at a higher rate than those with lower levels because
of their group-oriented leanings. The final cooperation in round 10 was necessary in
order to allow a full five rounds of informed decision making by the participant during
the next and final stage. Cooperation in the tenth round should hypothetically begin to
sway a participant toward mutual cooperation in the eleventh round.
Stage 3
Round 11 12 13 14 15Computer C C C C C
The third stage in the experiment is the most interesting part. According to
Hibbing and Alford’s (2002) theory of humans as wary cooperators that want to be
neither leeches (take advantage of others) nor suckers (to be taken advantage of), when
the computer begins cooperating individuals should feel as though they are being leeches
on a cooperative person. If indeed empathy is motivating human participants’ guilt (as
Fehr and Schmidt might suggest) or motivation in cooperation, then individuals with
higher levels of empathy, should begin to establish mutual cooperation to a higher degree
during the final stage of the experiment.
Dependent Variables
Four dependent variables were created for regression analysis. Respondents’
decisions during each round were recorded as either: 1 = cooperation, or 0 = defection.
In each case the number of times a participant cooperated during one of the three stages
of the game was summed. In the first stage dependent variable, rounds 3 through 6 were
included. Rounds 1 and 2 were not included in this dependent variable because in this
first stage it was felt most important to gauge responses to the second round defection,
which would begin in round 3. The round 6 decision was included because it was a
decision based on the computer’s cooperative play in round five. The second stage
dependent variable included participants’ decisions in rounds 7 through 10, with these
rounds being included because each corresponds to a previous round of defection by the
computer. As with the previous dependent variable the second stage variable summed
participants’ decisions. The third stage dependent variable included the summation of
each participant’s decisions during rounds 11 through 15. Finally, a dependent variable
was created that summed up responses for the entire game so that a more general picture
of how empathy and cooperation may have interacted on a larger level.
Independent Variables.
Independent variables used in regression analysis included age, gender, income,
population of hometown, race and grade point average. It was felt necessary to control
for these differences in socioeconomic status in order to isolate the effects of empathy.
As Schieman and Van Gundy (2000) show, empathy is a context specific phenomenon
that is particular to one’s socioeconomic status.6 By documenting the relationship
between education, age, income and gender over an entire community, they are able to
demonstrate that empathy levels are relative to one’s social position. For instance,
Shieman and Van Gundy present evidence that empathy tends to decrease with age, but
that increases in higher education, income and by being female can mitigate this general
trend. If these factors were not taken into account it would lead to a misguided analysis of
the role that a particular individual’s relative level of empathy plays in their decision-
making process. Therefore, controlling for these differences allows for a statistical
analysis that looks for relative rates of empathy for an individual in their socioeconomic
group. Factor analysis was used to create a factor score of empathy for each participant
from the eight empathy questions that were asked in the post-experiment questionnaire.
These are presented in Table 4 with their respective factor loadings.7 Empathy questions
were recorded on a seven point Likert scale. Items were coded in a manner such that
higher scores reflect more empathy.
Respondents’ round one decision to cooperate or defect was also used as an
independent predictor. Because this decision was made in the absence of information on
the other player, it was taken as an indication of each participant’s general willingness to
cooperate.8 The round one decision was also used to create an interaction term with
6 The empathy questions used by Shieman and Van Gunday bear a strong resemblance to the questions used in this analysis. 7 A reliability analysis was conducted on the responses to the empathy questions with a Cronbach’s alpha score of α = .853. 8 Out of the 133 undergraduate students who participated, 79.7% cooperated on the first round and 20.3% defected.
empathy. It was felt that this interaction term would help shed light on the effects of
empathy within the group of individuals that had a more cooperative disposition (as
distinguished by a round one decision to cooperate) from the very beginning of the
experiment.
Results
The experimental results are presented below in a statistical appendix. Two types
of regression analysis were used in examining the data. The first consisted of a standard
ordinary least squares regression. The second type used was a tobit regression model.
Tobit (0,X) estimation models were used because of the truncated nature of each of the
dependent variables. This statistical methodology can control for the two different types
of theoretical participants in the experiment: those that defect all of the time (or, 0
cooperation) and those that cooperate to varying degrees (or, X cooperation).
The statistical analysis proceeded in three main parts. First, an analysis of each
dependent variable with both regression methods was used to look at empathy when
controlling for socioeconomic status and a participant’s round one decision. Next, an
examination of each dependent variable with both types of regressions was completed
with the empathy-round one interaction term in each model. Finally, significance of
difference in means tests were used to investigate how mean differences of empathy
varied in each round in regards to those who cooperated and those who defected.
The statistical analysis of the first stage in regards to empathy is presented in
Tables 5 and 6. The dependent variable in this case is the summation of cooperation
from rounds 3 through 6, or just after the first defection by the computer. Both show
similar results. In the ordinary least squares (OLS) regression the first thing one should
notice is that the F - statistic, or model fit test, is not significant, meaning that little to
none of the variance present in the dependent variable is being explained by the
independent predictors. What variance is explained is being predicted by the round one
variable, which is significant at p < .01 level. The tobit model is not much different with
the round one variable being the only significant predictor with significance at the p < .01
level. Though a tobit does not report a model fit test, it does report an adjusted R-square
measure that is equal to .01 in this regression, meaning that with this model as well there
is little to no variance being explained. However, when one compares the unstandardized
beta coefficient for the round one variable of the OLS regression to the tobit, it is
important to note that the coefficient is larger in the tobit model. This suggests that the
theoretical difference between non-cooperators and partial cooperators, which is taken
into account in the tobit because of the (0,X) treatment of the dependent variable, is
manifest in the results. At the lower left hand corner of Table 6, as well with all other
tobit estimation tables, the number of complete non-cooperators is presented as “Left
censored observations,” showing here that 26 participants did not cooperate once during
this period.
The second stage results are presented in Tables 7 and 8. The dependent variable
in both estimations is the summation of cooperative decisions between rounds 7 through
10 therefore each individual has a score between zero and 4. In both cases the empathy
factor variable is significant at the p ≤ .10 level with a negative coefficient. This
indicates that as empathy increased participants were more likely to defect when the
computer was defecting. Similar to the empathy variable, grade point average is also
significant at the p < .10 level with a negative coefficient. The gender variable is
positively correlated and significant at the p < .05 level, showing that as the computer
began consistently defecting women were more likely to cooperate than men. Again as
in the stage one analysis the round one variable is very significant and positively
correlated with cooperation. The tobit model once again shows stronger results in that
the unstandardized coefficients on each significant variable are larger and the p-values
are lower, most likely reflecting the differences between complete and partial non-
cooperation.
Stage III results are present in Tables 9 and 10. The OLS estimation only has the
round one predictor as a significant variable at the p < .0001 level. The tobit model
renders only a slightly different picture with the addition of income as a significant
predictor at the p < .10 level with a negative coefficient indicating that as participant’s
family income increased they were less likely to cooperate in the final rounds. Empathy
is not significant in either of the estimations.
The final two tables, 11 and 12, in this first part of the statistical analysis uses a
summation of all cooperative decisions over the entire experiment as a dependent
variable. Not surprisingly, the round one predictor is a very strong indication that
participants would cooperate during the entire experiment. However, in these regressions
no other independent predictors, including empathy, were significant.
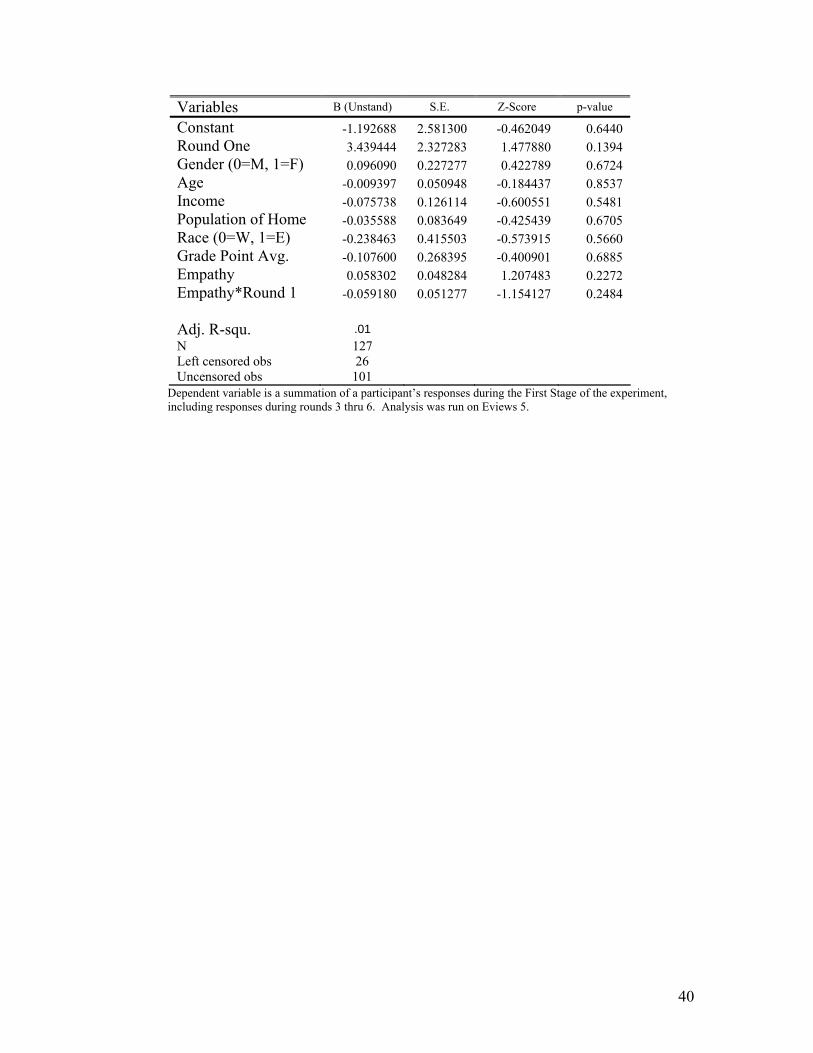
The next part of the statistical analysis involved creating an interaction term
between empathy and round one. As discussed earlier, it was important to test the
significance of empathy within the group of individuals that cooperated on the first
round. These results appear in Tables 13 through 20. These results can be generalized by
saying that no relationship exists between cooperation in the various stages and the
interaction of empathy with a round one cooperative decision. Indeed, as one will notice
by perusing the estimations in this second part, the F – statistics on the OLS regressions
and the R-square on the tobits are very low and not significant, indicating that the
addition of the round one/empathy interaction is actually decreasing the ability of the
model to predict the variance in each dependent variable.
Finally, Table 21 contains the significance of difference in means between those
who cooperated and those who defected in each round. In each case Group 1 is
composed of those that defected while Group 2 consists of those that cooperated in each
round. Looking at the far right side of the table the numbers in the Group 1 Total
(defectors) and Group 2 Total (cooperators) columns are the amount of participants that
defected or cooperated in each round, respectively. There is a general pattern that
follows the hypothesized reactions to the computer’s decisions. In rounds 1 and 2 Group
2 is larger than Group 1, with more individuals cooperating with the computer in each
round. However, notice that after the computer defects in round 2 there is a move toward
greater defection during rounds 3 through 6 (Stage I). This defection becomes
heightened during rounds 7 through 10 (Stage II) when the computer opponent is
consistently defecting on the human player. In the final rounds 11 through 15 (Stage III)
there is a tendency to move toward cooperation with the Group 2 Total being greater than
the Group 1 Total once again.
The results are relatively mixed. The first hypothesis presented was that empathy
would be a significant predictor of participants’ defection in the second stage of the
experiment. In both the OLS and tobit estimations a participant’s empathetic disposition
was a significant predictor of defection in retaliation to the opposing player’s second
stage defections. For these two analyses, the null hypothesis can be rejected. Empathy
was a factor.
The second hypothesis that an empathetic disposition would lead to higher rates
of re-cooperation in the final stage of the experiment was flat out wrong. A null result
occurred. Indeed, in looking closely at each of the third stage regression results one
should note that the empathy factor variable carries a negative coefficient. Though not
significant in any of the regressions, it indicates that even marginal levels of empathy led
to more defection in the final rounds of the experiment. Truly, empathy was not a
facilitator of restoring cooperation after reciprocal trust had been broken.
Empathy and the J-curve of Cooperation
Initially it was thought that because trust was broken during the second stage
defections those with higher levels of empathy might have been more likely to feel as
though they were playing with an unfair opponent who did not deserve to be cooperated
with in the final stages, thus the null result for the second hypothesis. In this case it
seemed that the preference for relative versus absolute outcomes when dealing with
others likely promulgated more defection in the final stage of the experiment because
“empathists,” those with higher levels of empathy, were probably still upset about the
consistent defection during the second stage. However, on closer examination of the
entire experiment a completely different picture emerges on the role that empathy played
as a facilitator of cooperation and defection.
In Figure 1 the number of individuals is compared with the number of times they
cooperated during the entire experiment. The normal distribution of cooperative
decisions over the course of the game is near ideal. Participants could have cooperated
anywhere from 0 to 15 times (giving a total of sixteen possible sums) during the course of
the experiment and the mean of this distribution is 7.78, or nearly 8 which would be the
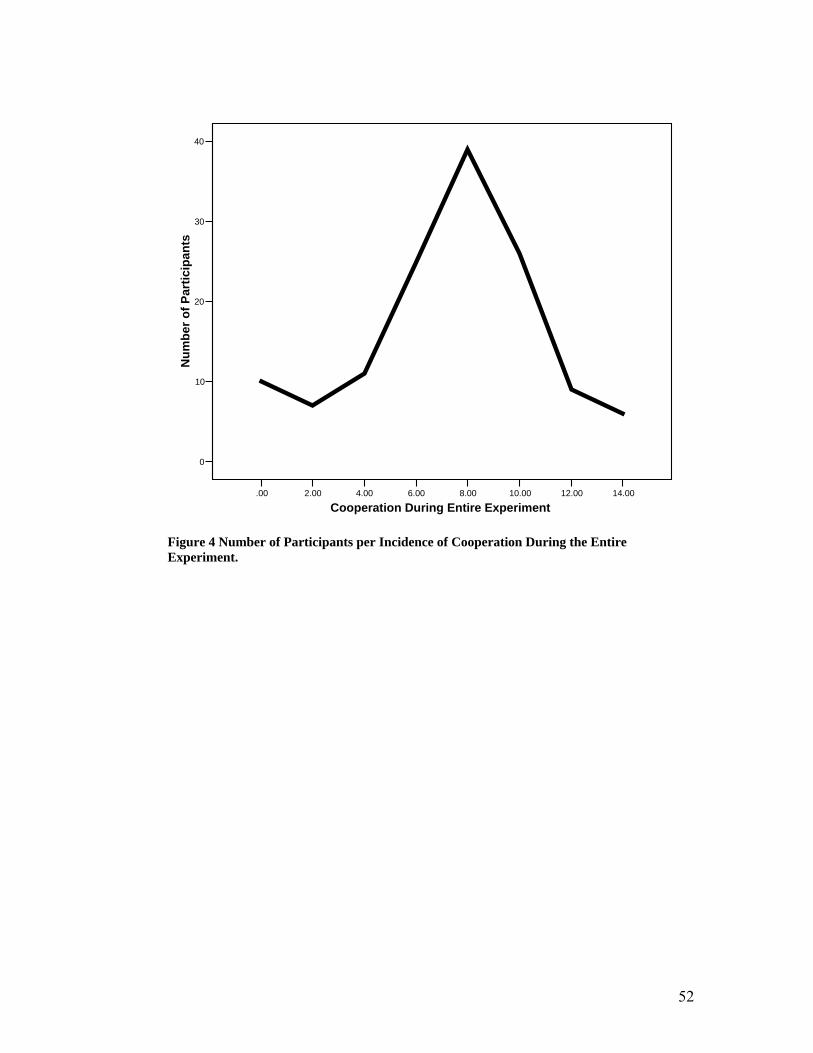
mean of a perfectly normal distribution across this sample of students. Indeed, in Figure
4 a line graph is shown with a single distinctive peak reflecting the normal distribution of
the sample.
What is intriguing is the display of the mean factor score of empathy across this
same sample shown in Figure 2. There is a bimodal distribution (two peaks) across the
sample in regards to the mean factor score of empathy per incidences of cooperation
during the experiment. Those individuals at the extremes of the distribution have on
average very low empathy scores. Those in the middle of the distribution tended have
higher scores than those in the tails, but on average were far lower than the individuals
present in either peak, where the empathy scores were the highest. This indicates that
there is a possible “J-curve” to empathy, or that high levels of empathy can produce
either more defection or more cooperation depending on the individual, but that
participants with a median level of empathy will converge toward cooperating about 50
percent of the time.9
In order to test this new J-curve hypothesis two significance of the difference in
means tests were used in order to confirm what seemed evident in the graphs. The first
9 The J-curve concept is aptly illustrated by a study regarding testosterone and depression. It has been found that testosterone levels conform to a J-curve in regards to depression in men (Booth, Johnson and Granger, 1999) where extremely high and low levels of testosterone correlate with depression while median levels of testosterone (which encompasses a majority of males) correlates with lower rates of depression.
test was aimed at investigating whether the individuals in the extreme tails of the
distribution were in fact much lower on average than the rest of the sample. In most
respects it would make intuitive sense that participants that cooperated either all of the
time (15 cooperative decisions) or nearly all of the time (14 cooperative decisions) and
those that defected all of the time (0 cooperative decisions) or nearly all of the time (1
cooperative decision) would have lower mean empathy scores because they were not
actually engaging their opponent and did not care what the other player did. Whether
their opponent defected or cooperated these individuals were indifferent. In this respect
these participants can be seen as having adopted a strategy to use throughout the entire
game and were not concerned about their opponent’s fair or unfair actions, or in other
words: egalitarian outcomes and behavior were not a factor in their decision making.
Table 21 contains the results from a comparison of the mean score of empathy between
these outliers and the rest of the sample. The “All Round-Tails” variable was coded to
create two groups of participants out of the total distribution of cooperative decisions,
with Group 1 being those in the tails of the distribution and Group 2 being every other
participant. The difference in means was significant at the p < .05 level, indicating that
those participants who cooperated or defected to the extreme actually had significantly
lower levels of empathy.
The next test examined whether the mean level of empathy in participants in the
empathy peaks of the distribution of cooperation did in fact have a statistically significant
higher mean level of empathy than other players in the sample. Table 21 presents the
results of this analysis under the variable name “All Round Bimodal,” where individuals
in the peaks were coded different than other participants. The test reveals that the mean
empathy levels are significant at the p < .05 level, showing that the J-curve interpretation
of cooperation during the experiment is supported.
In order to further investigate this relationship a binary probit regression was used
to estimate the difference in empathy between the two groups when controlling for each
independent variable used in previous regression models, where Group 1 = 0 (those
present in the tails and in the center of the distribution) and Group 2 = 1 (those present in
either of the bimodal peaks). The results appear in Table 22. The empathy factor
variable is significant at the p < .05 level and positive. The probit estimation eliminates
the possibility that another socioeconomic factor (like gender, age or race) that correlates
with empathy could be causing the unique distribution of individuals with higher rates of
empathy.
There were 36 participants that inhabited the bimodal high empathy peaks, with
18 participants in the less cooperative peak and 18 individuals in the more cooperative
peak of the bimodal distribution, see Figures 5. In other words, 50% of those with high
empathy levels that did not converge toward the median range of cooperation tended to
be the highest defectors. Furthermore, recall that each decision was made in anonymity,
where the identity of participants was unknown and a fear of personal reputation effects
should not have affected their decisions.
Finally, an analysis of the possible differences between individuals with high
levels of empathy residing in the more cooperative empathy peak and the less cooperative
empathy peak was conducted. All possible variables that were gathered from the survey
after the experiment were investigated. The size of a participant’s home town and the
level of their family income were found to be statistically significant predictors. Figures
7 and 8 show the results of the difference of means test for each variable. Essentially,
those individuals with high levels of empathy present in the “more cooperative peak”
tended to have been raised in smaller towns and come from families with a relatively
lower level of income. In contrast, individuals present in the “less cooperative peak”
were raised in a large city environment and came from families with a relatively higher
level of income.
The results of this experiment suggest social conditioning could be very important
to the manner in which an empathetic disposition manifests itself in social decision
making. Being from a larger urban area during an individual’s childhood would likely
diminish the reputation effects of continued social interaction. In a large city it is less
likely that an individual would cross paths with the same person again and again in an
iterative manner where one’s reputation would affect social interaction. On the other
hand, growing up in a small town diminishes anonymity. Individuals would place a
stronger emphasis on initial interactions because the likelihood of encountering the same
person repeatedly is much greater due to a lower population density. Thus, these two
opposite social environments may interact with high levels of empathy to create different
other-regarding tendencies.
Conclusion
Higher rates of empathy tended to have two contrary effects by either making an
individual more likely to defect or more likely to cooperate, but not to converge toward
the median level of cooperation as the majority of participants in this experiment. The
line graph presented in Figure 5 demonstrates the J-curve phenomenon with empathy and

cooperation over the entire experiment. Then, in Figure 6 the outliers (those who either
always cooperated or defected) have been removed in order to isolate the J-curve.
Indeed, these outliers present an interesting finding in that their low levels of empathy
and lack of concern as to the decisions being made by others suggests that a shallow
empathetic disposition leads to an absence of concern for outcomes relative to the other
individual. However, the bipolar nature of cooperation that a high level of empathy leads
to indicates a more complex, non-linear relationship between empathy and cooperation.
Contrary to the hypotheses originally being tested, it is not that empathy has a simple
positive linear relationship with a desire for egalitarian outcomes. Rather, an empathetic
emotional disposition likely cultivates a sensitivity to social decisions, which depending
on an individual’s social conditioning, leads to a more intense display of cooperation and
defection.

References
Alford, John R. and John R. Hibbing. 2004. “The Origin of Politics: An Evolutionary Theory of Political Behavior.” Perspectives on Politics 2: 707-723. Andreoni, James and John H. Miller. 1993. “Rational Cooperation in the Finitely
Repeated Prisoner’s Dilemma: Experimental Evidence.” The Economic Journal 103: 570-585.
Axelrod, Robert. 1984. The Evolution of Co-operation. New York: Basic Books. Bowles, Samuel and Herbert Gintis. 2003. “Origins of Human Cooperation.” In Genetic
and Cultural Evolution of Cooperation, ed. by P. Hammerstein. Cambridge: MIT Press.
Damasio, Antonio R. 1994. Descartes Error: Emotion, Reason and the Human Brain. New York: Putnam. Davis, Mark, Carol Luce and Stephen J. Kraus. 1994. “The Heritability of
Characteristics Associated with Dispositional Empathy.” Journal of Personality 62: 371-391.
Fehr, Ernst and Klaus M. Schmidt. 1999. “A Theory of Fairness, Competition and
Cooperation.” Quarterly Journal of Economics 114: 817-868. Field, Alexander J. 2004. Altruistically Inclined? Ann Arbor: University of Michigan
Press. Frank, R. H. 2004. What Price The Moral High Ground. Princeton University Press. Goldberg, L.R. 1999. “A Broad-Bandwidth, Public-Domain, Personality Inventory
Measuring the Lower-Level Facets of Several Five-Factor Models.” University of Oregon and Oregon Research Institute, 1999. In Mervielde, I. Deary, I., De Fruyt, F. & Ostendorf, F. (Eds.), Pers. Psychology in Europe 7: 7-28. Tilburg, The Netherlands: Tilburg University Press.
Green, Donald and Ian Shapiro. 1996. Pathologies of Rational Choice Theory. New Haven: Yale University Press. Hamilton, W.D. 1964. “The Genetical Evolution of Social Behavior, I and II.” Journal
of Theoretical Biology 7: 1-52. Hardin, Russell. 1971. “Collective Action as an Agreeable N-Prisoner’s Dilemma.”
Behavioral Science. 16: 472-81.
Hibbing, John R. and John R. Alford. 2004. “Accepting Authoritative Decisions: Humans as Wary Cooperators.” American Journal of Political Science 48:62-76.
Kohlberg, Lawrence. 1984. The Psychology of Moral Development. San Francisco: Harper and Row Publishing. Olson, Mancur. 1965. The Logic of Collective Action: Public Goods and the Theory of
Groups. Cambridge, Massachusetts: Harvard University Press.
Ostrom, Elinor. 1998. “A Behavioral Approach to the Rational Choice Theory of Collective Action.” American Political Science Review 92: 1-22.
Patfrey, Thomas, and Howard Rosenthal. 1983. “A Strategic Calculus of Voting.”
Public Choice 41: 7-53. Ridley, Matt. 1996. The Origin of Virtue. New York: Penguin Books. Rosenberg, Morris. 1990. “Reflexivity and Emotions.” Social Psychology Quarterly 53: 3-12. Sober, Eliot and David Sloan Wilson. 1998. Unto Others. Cambridge: Harvard
University Press. Smith, Kevin. 2005. “Darwin’s Bureaucrat.” Unpublished paper presented at the
Midwest Political Science Association Conference. Chicago, April 2005. Smith-Lovin, Lynn. 1995. “The Sociology of Affect and Emotion.” In Sociological Perspectives on Social Psychology, eds. Karen S. Cook, Gary A. Fine, and James S. House. Boston: Allyn and Bacon. Thoits, Peggy A. 1989. “The Sociology of Emotion.” In Annual Review of Sociology, eds. W.R. Scott and J. Blake. Palo Alto: Annual Reviews. Wilson, David S. 2002. Darwin’s Cathedral: Evolution, Religion and the Nature of
Society. Chicago: The University of Chicago Press.
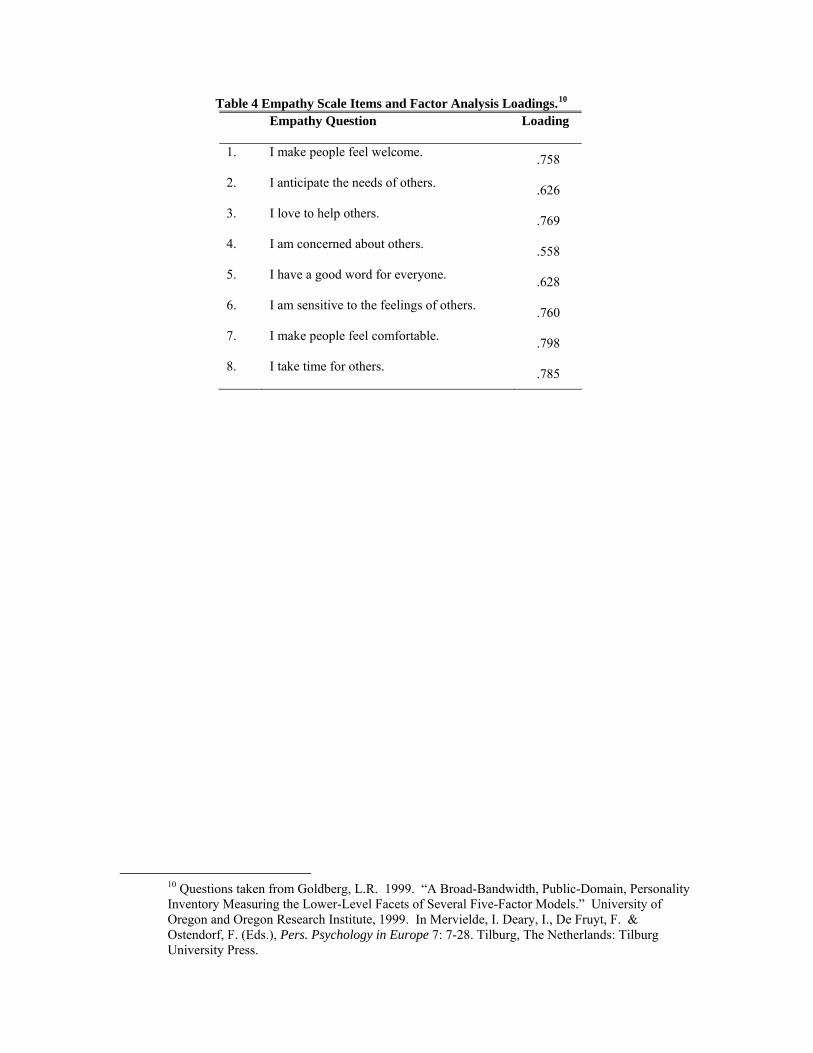
Table 4 Empathy Scale Items and Factor Analysis Loadings.10 Empathy Question Loading
1. I make people feel welcome. .758
2. I anticipate the needs of others. .626
3. I love to help others. .769
4. I am concerned about others. .558
5. I have a good word for everyone. .628
6. I am sensitive to the feelings of others. .760
7. I make people feel comfortable. .798
8. I take time for others. .785
10 Questions taken from Goldberg, L.R. 1999. “A Broad-Bandwidth, Public-Domain, Personality Inventory Measuring the Lower-Level Facets of Several Five-Factor Models.” University of Oregon and Oregon Research Institute, 1999. In Mervielde, I. Deary, I., De Fruyt, F. & Ostendorf, F. (Eds.), Pers. Psychology in Europe 7: 7-28. Tilburg, The Netherlands: Tilburg University Press.
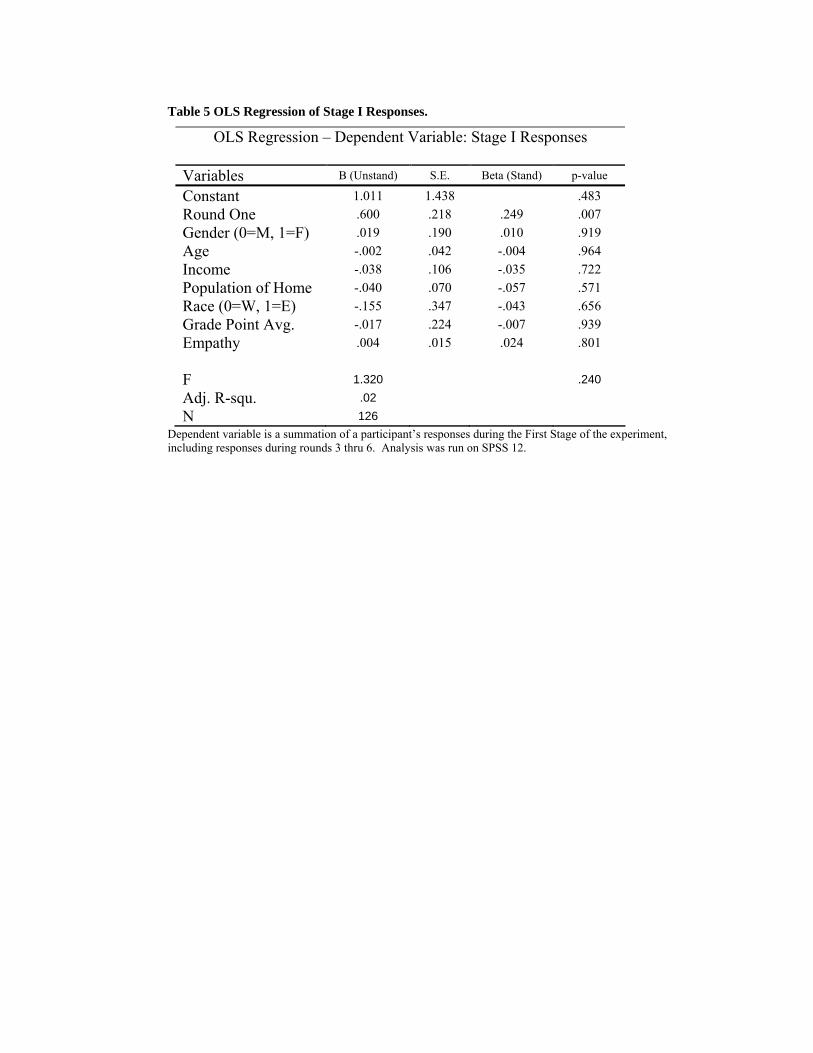
Table 5 OLS Regression of Stage I Responses.
OLS Regression – Dependent Variable: Stage I Responses
Variables B (Unstand) S.E. Beta (Stand) p-value
Constant 1.011 1.438 .483 Round One .600 .218 .249 .007 Gender (0=M, 1=F) .019 .190 .010 .919 Age -.002 .042 -.004 .964 Income -.038 .106 -.035 .722 Population of Home -.040 .070 -.057 .571 Race (0=W, 1=E) -.155 .347 -.043 .656 Grade Point Avg. -.017 .224 -.007 .939 Empathy .004 .015 .024 .801 F 1.320 .240 Adj. R-squ. .02 N 126
Dependent variable is a summation of a participant’s responses during the First Stage of the experiment, including responses during rounds 3 thru 6. Analysis was run on SPSS 12.
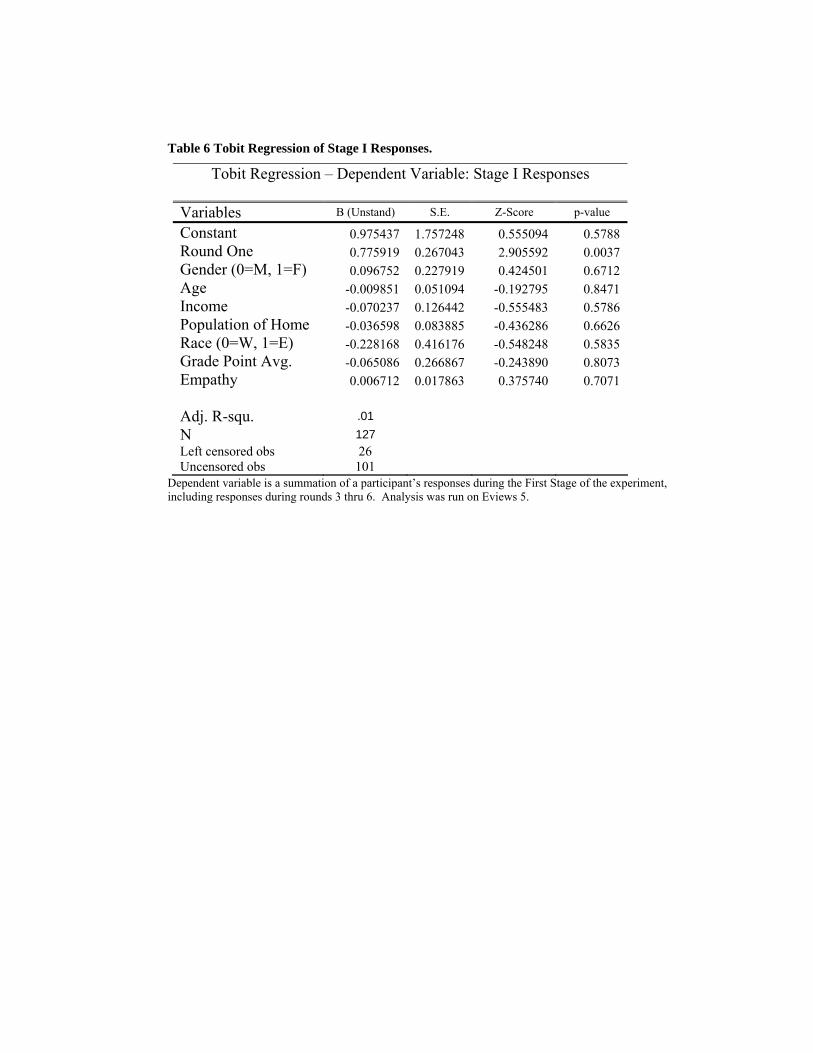
Table 6 Tobit Regression of Stage I Responses.
Tobit Regression – Dependent Variable: Stage I Responses
Variables B (Unstand) S.E. Z-Score p-value
Constant 0.975437 1.757248 0.555094 0.5788 Round One 0.775919 0.267043 2.905592 0.0037 Gender (0=M, 1=F) 0.096752 0.227919 0.424501 0.6712 Age -0.009851 0.051094 -0.192795 0.8471 Income -0.070237 0.126442 -0.555483 0.5786 Population of Home -0.036598 0.083885 -0.436286 0.6626 Race (0=W, 1=E) -0.228168 0.416176 -0.548248 0.5835 Grade Point Avg. -0.065086 0.266867 -0.243890 0.8073 Empathy 0.006712 0.017863 0.375740 0.7071 Adj. R-squ. .01 N 127 Left censored obs 26 Uncensored obs 101
Dependent variable is a summation of a participant’s responses during the First Stage of the experiment, including responses during rounds 3 thru 6. Analysis was run on Eviews 5.
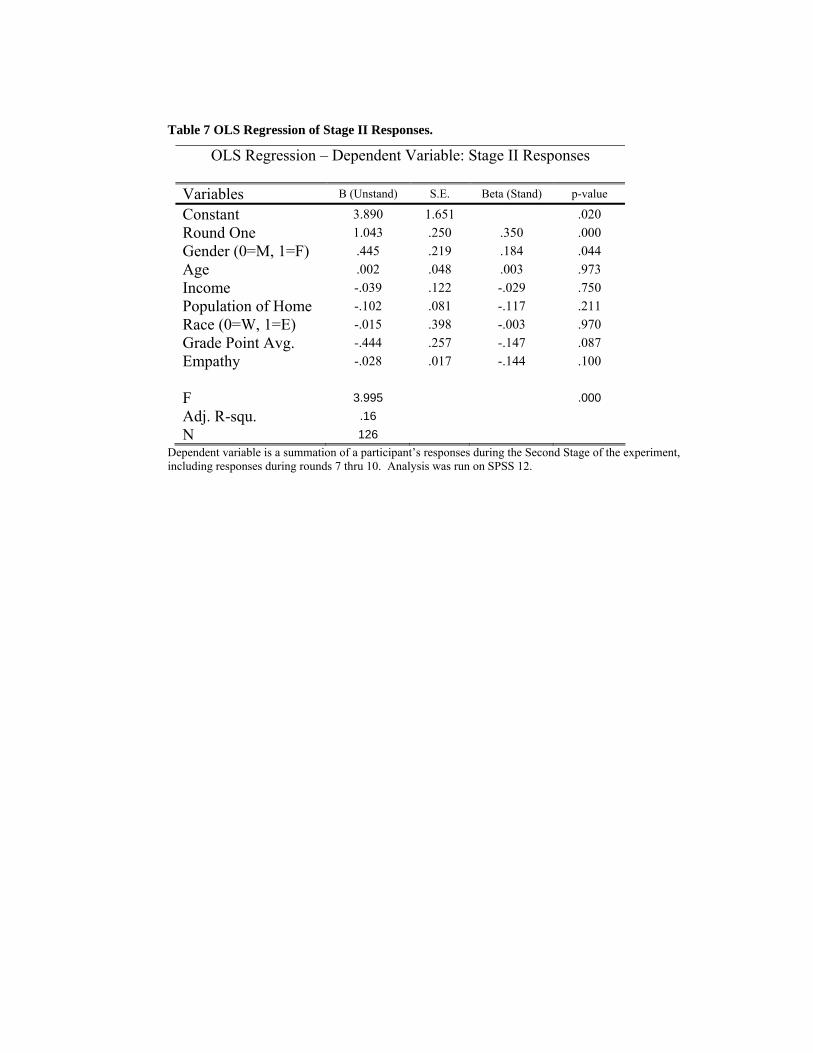
Table 7 OLS Regression of Stage II Responses.
OLS Regression – Dependent Variable: Stage II Responses
Variables B (Unstand) S.E. Beta (Stand) p-value
Constant 3.890 1.651 .020 Round One 1.043 .250 .350 .000 Gender (0=M, 1=F) .445 .219 .184 .044 Age .002 .048 .003 .973 Income -.039 .122 -.029 .750 Population of Home -.102 .081 -.117 .211 Race (0=W, 1=E) -.015 .398 -.003 .970 Grade Point Avg. -.444 .257 -.147 .087 Empathy -.028 .017 -.144 .100 F 3.995 .000 Adj. R-squ. .16 N 126
Dependent variable is a summation of a participant’s responses during the Second Stage of the experiment, including responses during rounds 7 thru 10. Analysis was run on SPSS 12.
Table 8 Tobit Regression of Stage II Responses.
Tobit Regression – Dependent Variable: Stage II Responses
Variables B (Unstand) S.E. Z-Score p-value
Constant 4.119769 1.937391 2.126452 0.0335 Round One 1.385977 0.309427 4.479168 0.0000 Gender (0=M, 1=F) 0.582697 0.258025 2.258293 0.0239 Age 0.001580 0.055782 0.028324 0.9774 Income -0.043706 0.143861 -0.303811 0.7613 Population of Home -0.127309 0.094398 -1.348640 0.1775 Race (0=W, 1=E) 0.100366 0.461998 0.217244 0.8280 Grade Point Avg. -0.522350 0.304390 -1.716055 0.0862 Empathy -0.036118 0.020234 -1.785069 0.0743 Adj. R-squ. .15 N 127 Left censored obs 25 Uncensored obs 102
Dependent variable is a summation of a participant’s responses during the First Stage of the experiment, including responses during rounds 7 thru 10. Analysis was run on Eviews 5.
Table 9 OLS Regression of Stage III Responses.
OLS Regression – Dependent Variable: Stage III Responses
Variables B (Unstand) S.E. Beta (Stand) p-value
Constant 2.037 2.345 .387 Round One 1.425 .355 .351 .000 Gender (0=M, 1=F) .078 .310 .024 .802 Age .002 .068 .002 .979 Income -.267 .173 -.147 .126 Population of Home .112 .115 .095 .332 Race (0=W, 1=E) .072 .565 .012 .899 Grade Point Avg. .278 .365 .068 .447 Empathy -.024 .024 -.089 .328 F 2.505 .015 Adj. R-squ. .087 N 126
Dependent variable is a summation of a participant’s responses during the Third Stage of the experiment, including responses during rounds 11 thru 15. Analysis was run on SPSS 12.
Table 10 Tobit Regression of Stage III Responses.
Tobit Regression – Dependent Variable: Stage III Responses
Variables B (Unstand) S.E. Z-Score p-value
Constant 1.548432 2.572608 0.601892 0.5472 Round One 1.698831 0.397330 4.275619 0.0000 Gender (0=M, 1=F) 0.120276 0.339581 0.354190 0.7232 Age 0.013140 0.074392 0.176636 0.8598 Income -0.318235 0.190232 -1.672879 0.0944 Population of Home 0.118166 0.124831 0.946609 0.3438 Race (0=W, 1=E) 0.087511 0.618233 0.141550 0.8874 Grade Point Avg. 0.332231 0.399217 0.832207 0.4053 Empathy -0.028035 0.026623 -1.053036 0.2923 Adj. R-squ. .08 N 127 Left censored obs 16 Uncensored obs 111
Dependent variable is a summation of a participant’s responses during the First Stage of the experiment, including responses during rounds 11 thru 15. Analysis was run on Eviews 5.
Table 11 OLS Regression of All Responses.
OLS Regression – Dependent Variable: All Responses
Variables B (Unstand) S.E. Beta (Stand) p-value
Constant 7.291 4.218 .087 Round One 4.763 .639 .567 .000 Gender (0=M, 1=F) .459 .558 .067 .412 Age -.009 .123 -.006 .942 Income -.491 .311 -.130 .118 Population of Home .043 .206 .018 .836 Race (0=W, 1=E) .220 1.017 .018 .829 Grade Point Avg. -.053 .657 -.006 .935 Empathy -.046 .044 -.083 .291 F 8.016 .000 Adj. R-squ. .308 N 126
Dependent variable is a summation of a participant’s responses during every round of the experiment, including responses during rounds 1 thru 15. Analysis was run on SPSS 12.

Table 12 Tobit Regression of All Responses.
Tobit Regression – Dependent Variable: All Responses
Variables B (Unstand) S.E. Z-Score p-value
Constant 7.253665 4.161975 1.742842 0.0814 Round One 4.909473 0.632493 7.762095 0.0000 Gender (0=M, 1=F) 0.509352 0.549863 0.926325 0.3543 Age -0.007821 0.120775 -0.064754 0.9484 Income -0.498216 0.306760 -1.624123 0.1043 Population of Home 0.043881 0.203092 0.216067 0.8289 Race (0=W, 1=E) 0.245790 0.999937 0.245806 0.8058 Grade Point Avg. -0.094287 0.647523 -0.145611 0.8842 Empathy -0.046667 0.043264 -1.078648 0.2807 Adj. R-squ. .30 N 127 Left censored obs 3 Uncensored obs 124
Dependent variable is a summation of a participant’s responses during every round of the experiment, including responses during rounds 1 thru 15. Analysis was run on Eviews 5.
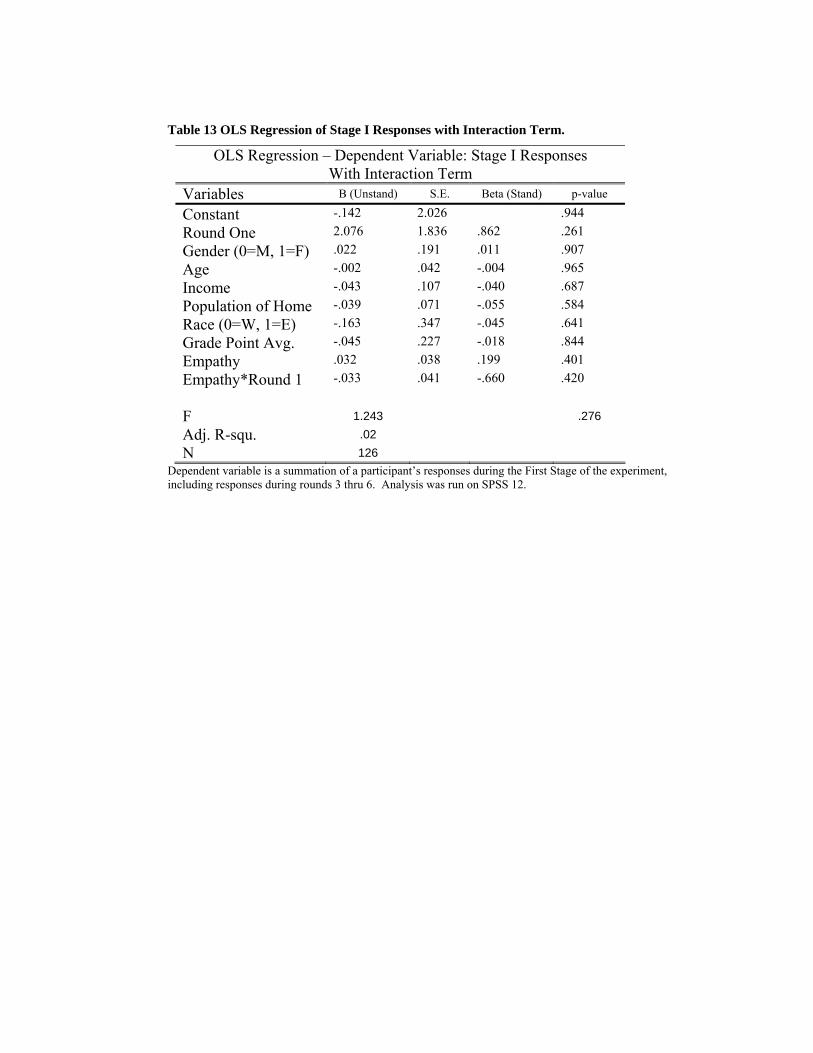
Table 13 OLS Regression of Stage I Responses with Interaction Term.
OLS Regression – Dependent Variable: Stage I Responses With Interaction Term
Variables B (Unstand) S.E. Beta (Stand) p-value
Constant -.142 2.026 .944 Round One 2.076 1.836 .862 .261 Gender (0=M, 1=F) .022 .191 .011 .907 Age -.002 .042 -.004 .965 Income -.043 .107 -.040 .687 Population of Home -.039 .071 -.055 .584 Race (0=W, 1=E) -.163 .347 -.045 .641 Grade Point Avg. -.045 .227 -.018 .844 Empathy .032 .038 .199 .401 Empathy*Round 1 -.033 .041 -.660 .420 F 1.243 .276 Adj. R-squ. .02 N 126
Dependent variable is a summation of a participant’s responses during the First Stage of the experiment, including responses during rounds 3 thru 6. Analysis was run on SPSS 12.

Table 14 Tobit Regression of Stage I Responses with Interaction Term.
Tobit Regression – Dependent Variable: Stage I Responses With Interaction Term
Variables B (Unstand) S.E. Z-Score p-value
Constant -1.192688 2.581300 -0.462049 0.6440 Round One 3.439444 2.327283 1.477880 0.1394 Gender (0=M, 1=F) 0.096090 0.227277 0.422789 0.6724 Age -0.009397 0.050948 -0.184437 0.8537 Income -0.075738 0.126114 -0.600551 0.5481 Population of Home -0.035588 0.083649 -0.425439 0.6705 Race (0=W, 1=E) -0.238463 0.415503 -0.573915 0.5660 Grade Point Avg. -0.107600 0.268395 -0.400901 0.6885 Empathy 0.058302 0.048284 1.207483 0.2272 Empathy*Round 1 -0.059180 0.051277 -1.154127 0.2484 Adj. R-squ. .01 N 127 Left censored obs 26 Uncensored obs 101
Dependent variable is a summation of a participant’s responses during the First Stage of the experiment, including responses during rounds 3 thru 6. Analysis was run on Eviews 5.
40
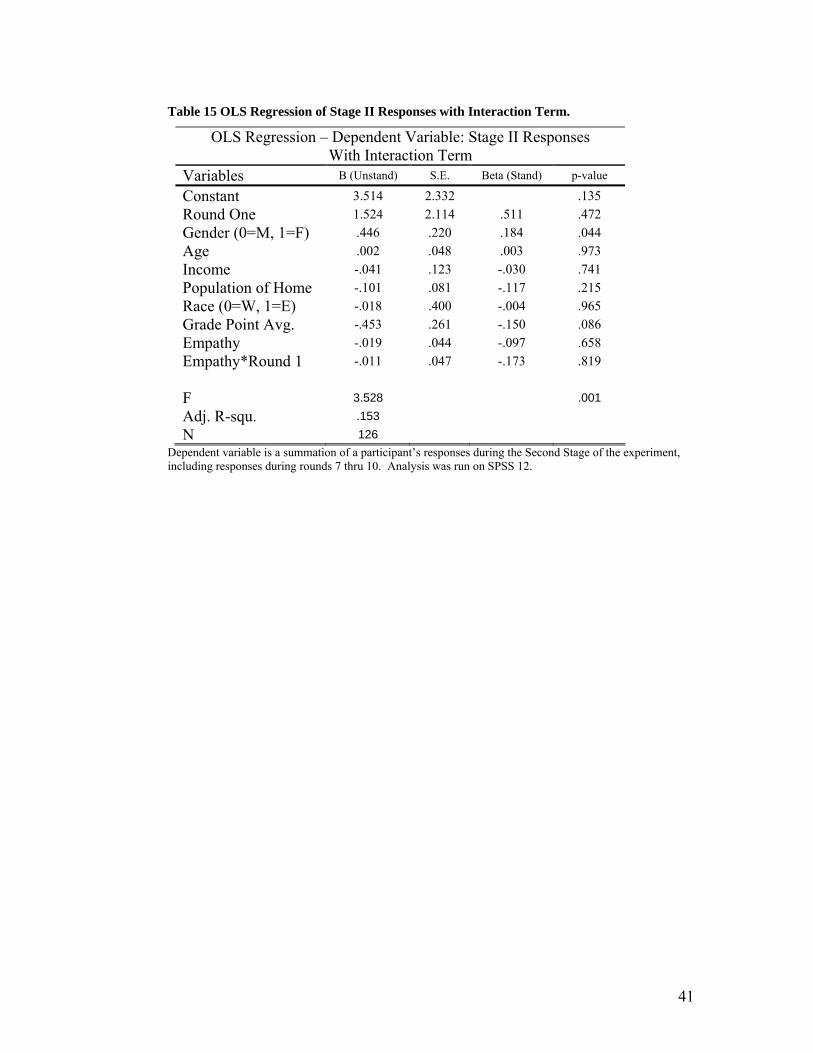
Table 15 OLS Regression of Stage II Responses with Interaction Term.
OLS Regression – Dependent Variable: Stage II Responses With Interaction Term
Variables B (Unstand) S.E. Beta (Stand) p-value
Constant 3.514 2.332 .135 Round One 1.524 2.114 .511 .472 Gender (0=M, 1=F) .446 .220 .184 .044 Age .002 .048 .003 .973 Income -.041 .123 -.030 .741 Population of Home -.101 .081 -.117 .215 Race (0=W, 1=E) -.018 .400 -.004 .965 Grade Point Avg. -.453 .261 -.150 .086 Empathy -.019 .044 -.097 .658 Empathy*Round 1 -.011 .047 -.173 .819 F 3.528 .001 Adj. R-squ. .153 N 126
Dependent variable is a summation of a participant’s responses during the Second Stage of the experiment, including responses during rounds 7 thru 10. Analysis was run on SPSS 12.
41
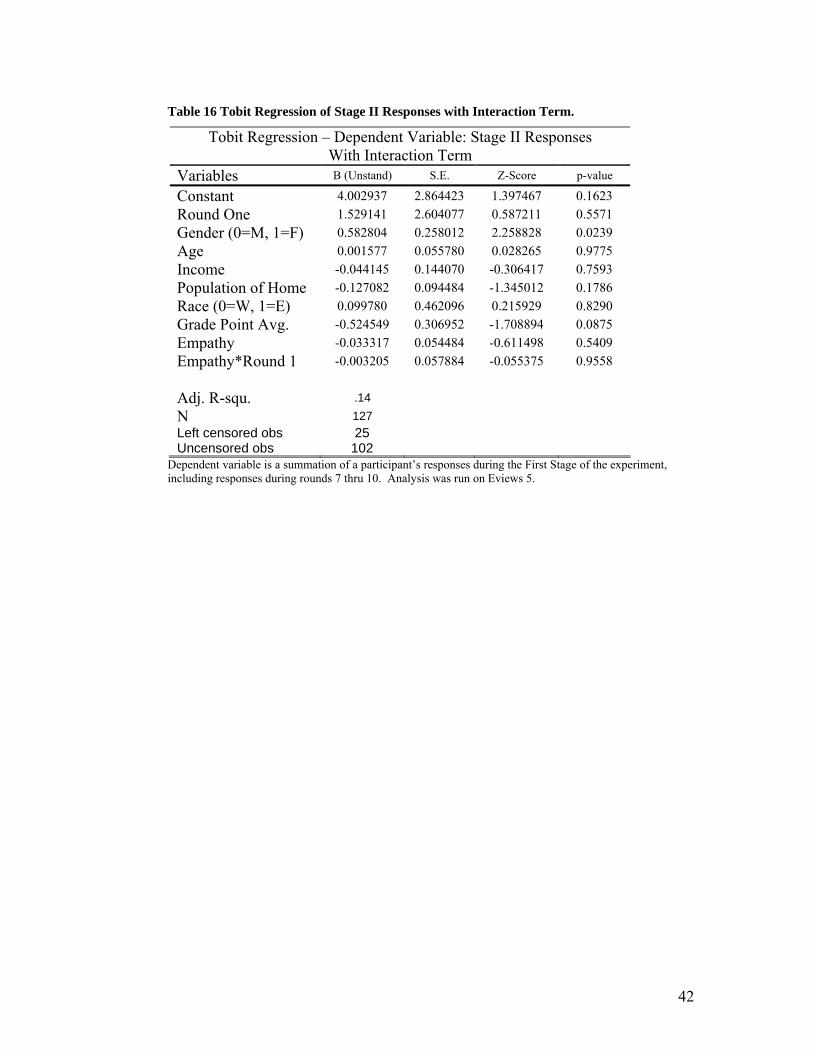
Table 16 Tobit Regression of Stage II Responses with Interaction Term.
Tobit Regression – Dependent Variable: Stage II Responses With Interaction Term
Variables B (Unstand) S.E. Z-Score p-value
Constant 4.002937 2.864423 1.397467 0.1623 Round One 1.529141 2.604077 0.587211 0.5571 Gender (0=M, 1=F) 0.582804 0.258012 2.258828 0.0239 Age 0.001577 0.055780 0.028265 0.9775 Income -0.044145 0.144070 -0.306417 0.7593 Population of Home -0.127082 0.094484 -1.345012 0.1786 Race (0=W, 1=E) 0.099780 0.462096 0.215929 0.8290 Grade Point Avg. -0.524549 0.306952 -1.708894 0.0875 Empathy -0.033317 0.054484 -0.611498 0.5409 Empathy*Round 1 -0.003205 0.057884 -0.055375 0.9558 Adj. R-squ. .14 N 127 Left censored obs 25 Uncensored obs 102
Dependent variable is a summation of a participant’s responses during the First Stage of the experiment, including responses during rounds 7 thru 10. Analysis was run on Eviews 5.
42
Table 17 OLS Regression of Stage III Responses with Interaction Term.
OLS Regression – Dependent Variable: Stage III Responses With Interaction Term
Variables B (Unstand) S.E. Beta (Stand) p-value
Constant 3.459 3.307 .298 Round One -.395 2.997 -.097 .895 Gender (0=M, 1=F) .074 .311 .022 .812 Age .002 .068 .002 .980 Income -.261 .174 -.143 .136 Population of Home .110 .115 .093 .340 Race (0=W, 1=E) .081 .567 .013 .886 Grade Point Avg. .313 .370 .076 .400 Empathy -.059 .062 -.217 .344 Empathy*Round 1 .041 .066 .482 .542 F 2.256 .023 Adj. R-squ. .082 N 126
Dependent variable is a summation of a participant’s responses during the Third Stage of the experiment, including responses during rounds 11 thru 15. Analysis was run on SPSS 12.
43
Table 18 Tobit Regression of Stage III Responses with Interaction Term.
Tobit Regression – Dependent Variable: Stage III Responses With Interaction Term
Variables B (Unstand) S.E. Z-Score p-value
Constant 3.107997 3.670148 0.846832 0.3971 Round One -0.256082 3.313475 -0.077285 0.9384 Gender (0=M, 1=F) 0.118041 0.339052 0.348149 0.7277 Age 0.013197 0.074269 0.177695 0.8590 Income -0.312923 0.190114 -1.645975 0.0998 Population of Home 0.116654 0.124645 0.935885 0.3493 Race (0=W, 1=E) 0.095651 0.617211 0.154973 0.8768 Grade Point Avg. 0.364442 0.402315 0.905862 0.3650 Empathy -0.065647 0.068681 -0.955821 0.3392 Empathy*Round 1 0.043653 0.073497 0.593940 0.5526 Adj. R-squ. .01 N 127 Left censored obs 16 Uncensored obs 111
Dependent variable is a summation of a participant’s responses during the First Stage of the experiment, including responses during rounds 11 thru 15. Analysis was run on Eviews 5.
44
Table 19 OLS Regression of All Responses with Interaction Term.
OLS Regression – Dependent Variable: All Responses With Interaction Term
Variables B (Unstand) S.E. Beta (Stand) p-value
Constant 6.476 5.957 .279 Round One 5.806 5.399 .691 .284 Gender (0=M, 1=F) .461 .561 .068 .412 Age -.009 .123 -.006 .942 Income -.494 .313 -.131 .117 Population of Home .044 .207 .018 .833 Race (0=W, 1=E) .215 1.021 .017 .834 Grade Point Avg. -.073 .667 -.009 .913 Empathy -.027 .111 -.048 .811 Empathy*Round 1 -.023 .120 -.134 .846 F 7.072 .000 Adj. R-squ. .303 N 126
Dependent variable is a summation of a participant’s responses during every round of the experiment, including responses during rounds 1 thru 15. Analysis was run on SPSS 12.
45

Table 20 Tobit Regression of All Responses with Interaction Term.
Tobit Regression – Dependent Variable: All Responses With Interaction Term
Variables B (Unstand) S.E. Z-Score p-value
Constant 6.154972 5.935778 1.036928 0.2998 Round One 6.294812 5.373439 1.171468 0.2414 Gender (0=M, 1=F) 0.511410 0.549817 0.930146 0.3523 Age -0.007721 0.120757 -0.063941 0.9490 Income -0.502217 0.307091 -1.635402 0.1020 Population of Home 0.044868 0.203099 0.220915 0.8252 Race (0=W, 1=E) 0.239887 1.000063 0.239872 0.8104 Grade Point Avg. -0.118483 0.654079 -0.181144 0.8563 Empathy -0.020123 0.111019 -0.181256 0.8562 Empathy*Round 1 -0.030913 0.119061 -0.259640 0.7951 Adj. R-squ. .01 N 127 Left censored obs 3 Uncensored obs 124
Dependent variable is a summation of a participant’s responses during every round of the experiment, including responses during rounds 1 thru 15. Analysis was run on Eviews 5.
46
Table 21 Independence of Means Tests on Empathy Factor Score and Decision Making.
Independence of Means Tests on Empathy Factor Score and Decision Making
Group 1
Mean Group 2 Mean
P – Value Group 1 Total
Group 2 Total
Round 1 -.2006 .0511 .134 27 106 Round 2 -.0845 .0509 .435 50 83 Round 3 .0285 -.0273 .748 65 68 Round 4 -.0293 .0403 .705 77 56 Round 5 -.0613 .0793 .423 75 58 Round 6 -.0577 .0642 .257 70 63 Round 7 .0333 -.0370 .688 70 63 Round 8 .0433 -.0939 .459 91 42 Round 9 -.0746 .1280 .261 84 49 Round 10 .0530 -.0538 .541 67 66 Round 11 .0725 -.0736 .402 67 66 Round 12 -.0744 .0575 .444 58 75 Round 13 -.0253 .0152 .818 50 83 Round 14 .0682 -.0451 .419 53 80 Round 15 .0450 -.0317 .659 55 78 All Round-Tails -.4956 .0677 .034 16 117 All Round Bimodal
.3233 -.1341 .021 36 98
Each round is presented above, with Group 1 = 0, or defection, and Group 2 = 1, or cooperation in PD game. Group Means are the mean level of Empathy Factor scores for each group. “All Round-Tails” represents difference in mean level of empathy between those in the extreme tails of cooperation (Group 1) during all rounds and all other participants (Group 2). “All Round Bimodal” represents difference in mean level of empathy between those with rates of cooperation in either peak (Group 1) of the bi-modal empathy distribution and all other participants (Group 2). In all cases Group 1 and Group 2 summed together total 133 participants. Analysis was run on SPSS 12.
47
Table 22 Binary Probit Regression of All Round Bimodal.
Binary Probit Regression – Dependent Variable: All Round Bimodal
Variables B (Unstand) S.E. Z-Score p-value
Constant 0.395278 1.802669 0.219274 0.8264 Round One -0.522978 0.301229 -1.736147 0.0825 Gender (0=M, 1=F) 0.169787 0.268907 0.631398 0.5278 Age 0.015265 0.058234 0.262126 0.7932 Income -0.014955 0.148860 -0.100461 0.9200 Population of Home -0.029947 0.102471 -0.292251 0.7701 Race (0=W, 1=E) -0.002640 0.470379 -0.005613 0.9955 Grade Point Avg. -0.256563 0.320598 -0.800263 0.4236 Empathy 0.305954 0.138090 2.215611 0.0267 McFadden R-squ. .07 N 127 Obs with Dep=0 92 Obs with Dep=1 35
Dependent variable is a binary (0,1) variable. Participants with incidences of cooperation throughout the entire experiment that numbered: 2, 3, 4, 5; as well as: 11, 12, 13; were coded as “1”. All other participants were coded as “0”. Analysis was run on Eviews 5.
48
0 3 6 9 12 15
Number of Times Participants Cooperated During Experiment
0
5
10
15
20
25N
umbe
r of P
artic
ipan
ts
Mean = 7.7895Std. Dev. = 3.43567N = 133
Number of Participants Per Incidences of Cooperation
Figure 1 Number of Participants per Incidences of Cooperation.
49
Figure 2 Mean Score of Empathy Factor per Incidences of Cooperation During Experiment.
50
.00 1.00 2.00 3.00 4.00 5.00 6.00 7.00 8.00 9.00 10.00 11.00 12.00 13.00 14.00 15.00
Number of Times Participants Participated During Experiment
0
5
10
15
20
25
Figure 3 Number of Participants per Incidences of Cooperation with bimodal areas of high empathy darkened. Y-axis is number of participants.
51
.00 2.00 4.00 6.00 8.00 10.00 12.00 14.00
Cooperation During Entire Experiment
0
10
20
30
40
Num
ber o
f Par
ticip
ants
Figure 4 Number of Participants per Incidence of Cooperation During the Entire Experiment.
52
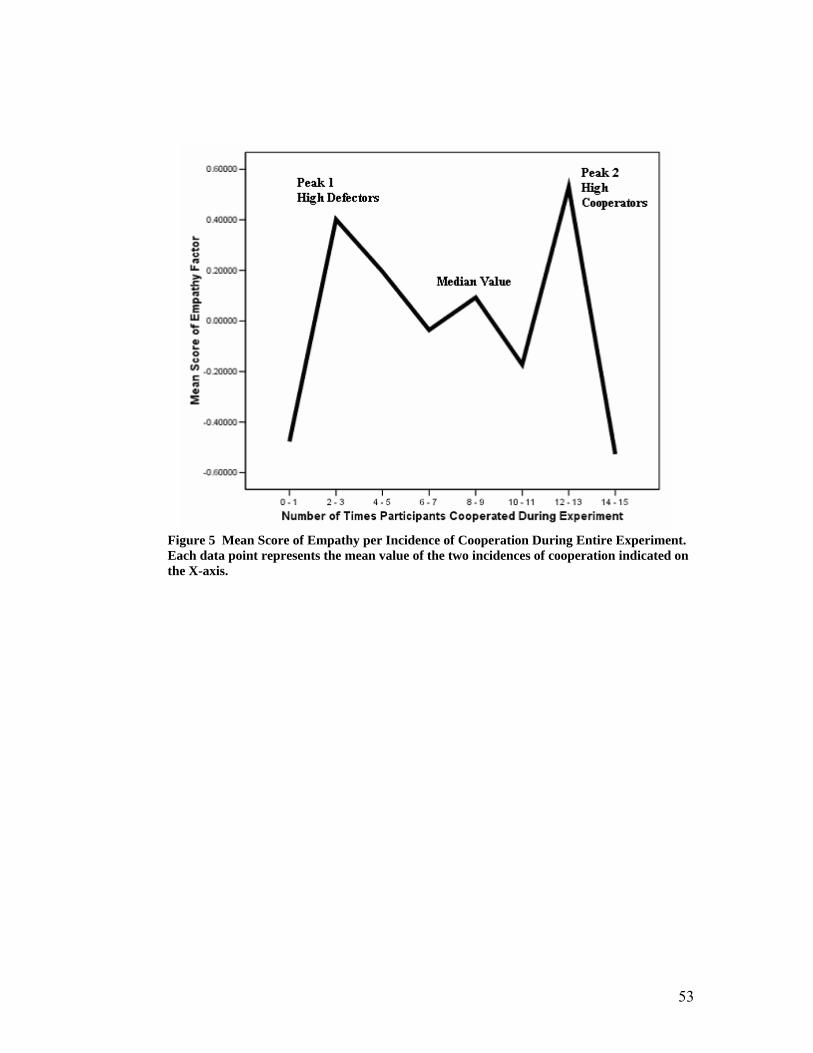
Figure 5 Mean Score of Empathy per Incidence of Cooperation During Entire Experiment. Each data point represents the mean value of the two incidences of cooperation indicated on the X-axis.
53
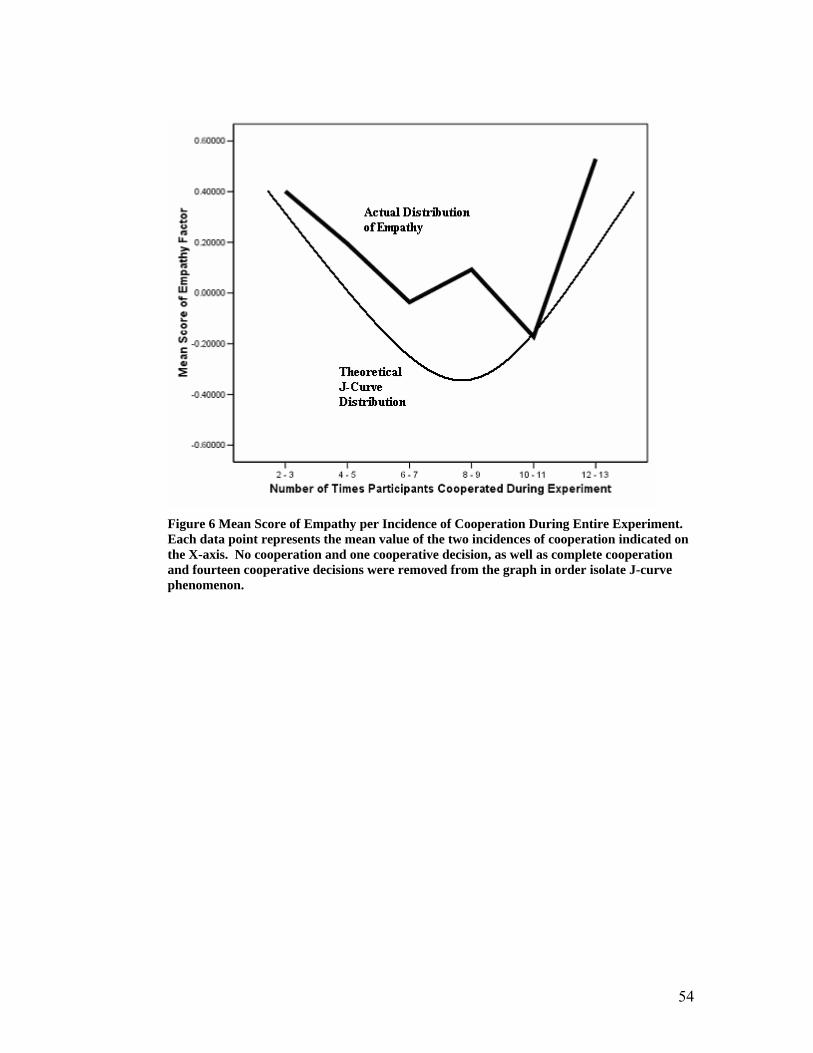
Figure 6 Mean Score of Empathy per Incidence of Cooperation During Entire Experiment. Each data point represents the mean value of the two incidences of cooperation indicated on the X-axis. No cooperation and one cooperative decision, as well as complete cooperation and fourteen cooperative decisions were removed from the graph in order isolate J-curve phenomenon.
54
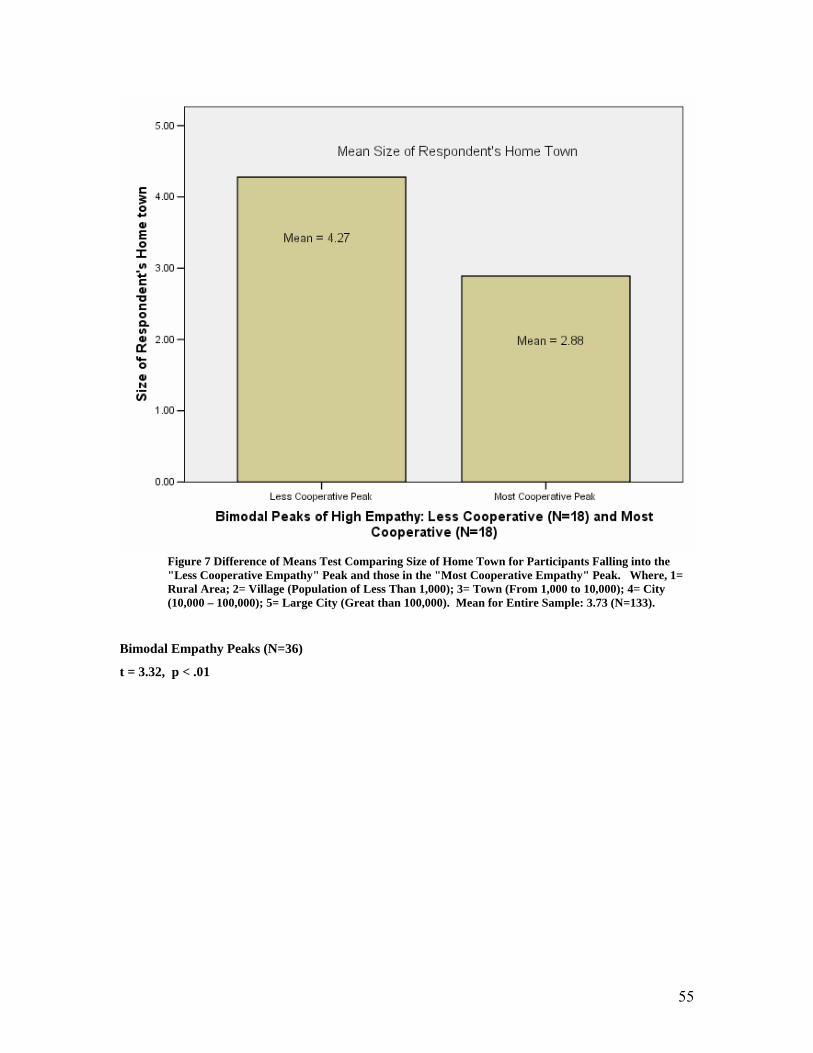
Figure 7 Difference of Means Test Comparing Size of Home Town for Participants Falling into the "Less Cooperative Empathy" Peak and those in the "Most Cooperative Empathy" Peak. Where, 1= Rural Area; 2= Village (Population of Less Than 1,000); 3= Town (From 1,000 to 10,000); 4= City (10,000 – 100,000); 5= Large City (Great than 100,000). Mean for Entire Sample: 3.73 (N=133).
Bimodal Empathy Peaks (N=36)
t = 3.32, p < .01
55
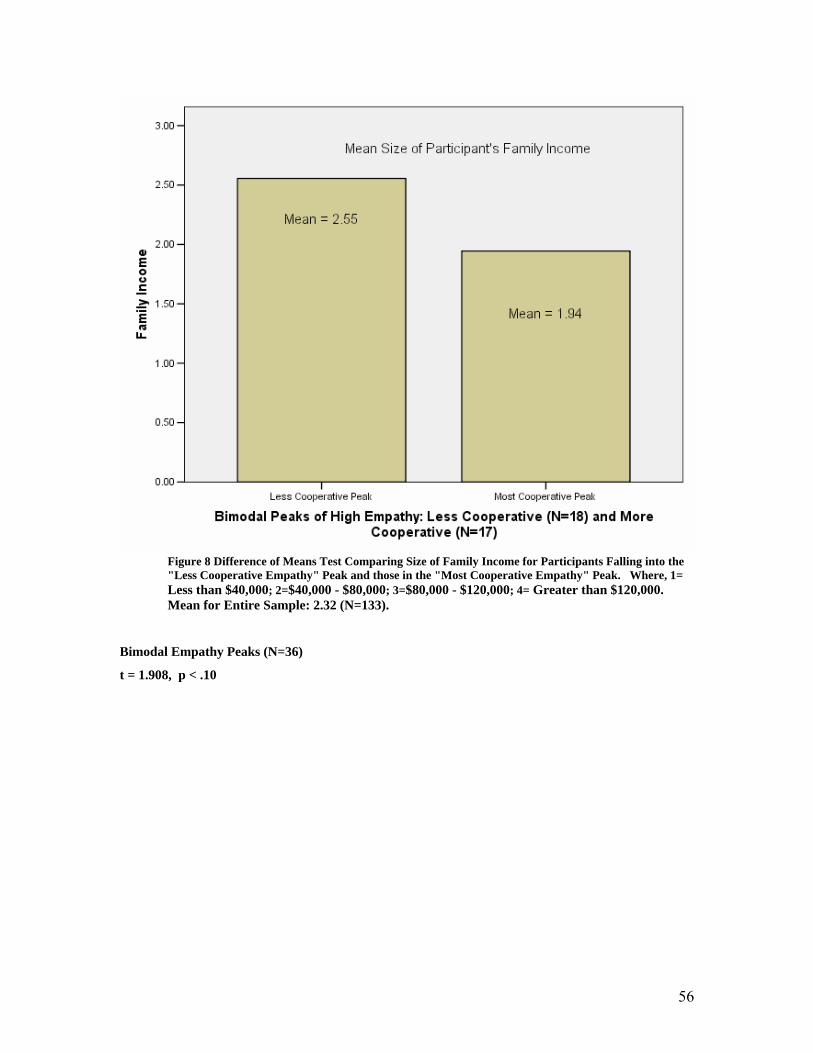
Figure 8 Difference of Means Test Comparing Size of Family Income for Participants Falling into the "Less Cooperative Empathy" Peak and those in the "Most Cooperative Empathy" Peak. Where, 1= Less than $40,000; 2=$40,000 - $80,000; 3=$80,000 - $120,000; 4= Greater than $120,000. Mean for Entire Sample: 2.32 (N=133).
Bimodal Empathy Peaks (N=36)
t = 1.908, p < .10
56
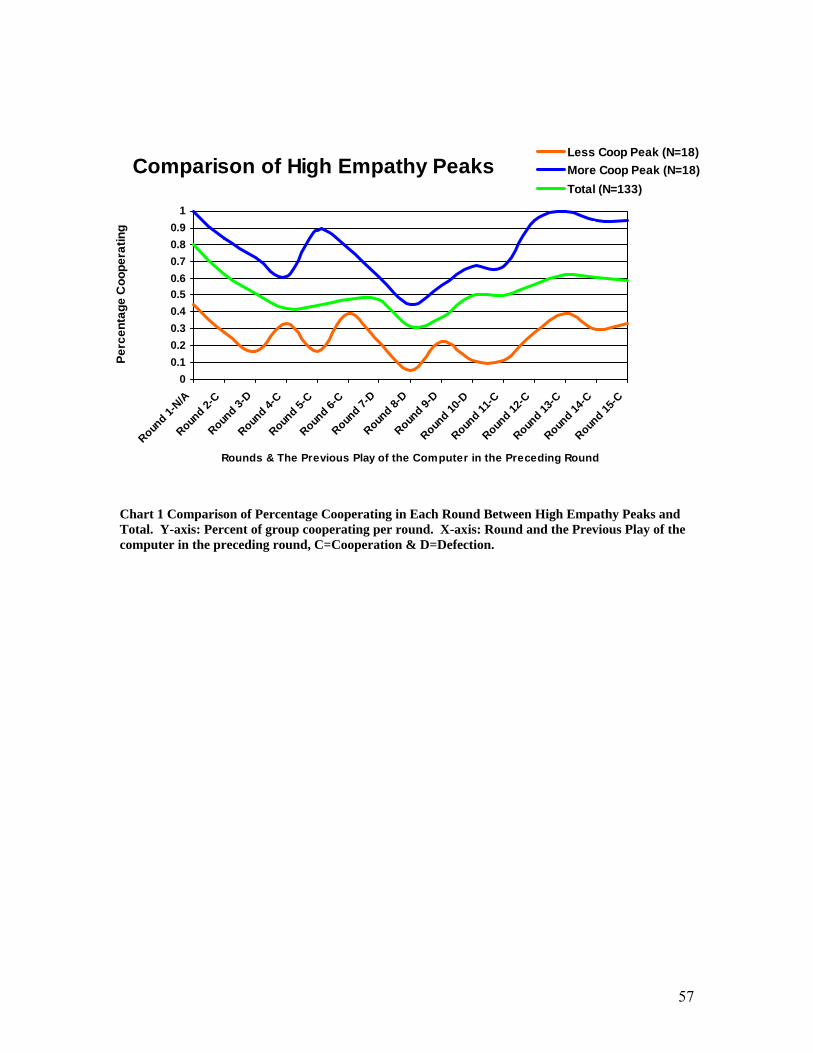
Comparison of High Empathy Peaks
00.10.20.30.40.50.60.70.80.9
1
Round 1-
N/A
Round 2-
C
Round 3-
D
Round 4-
C
Round 5-
C
Round 6-
C
Round 7-
D
Round 8-
D
Round 9-
D
Round 10
-D
Round 11
-C
Round 12
-C
Round 13
-C
Round 14
-C
Round 15
-C
Rounds & The Previous Play of the Computer in the Preceding Round
Perc
enta
ge C
oope
ratin
g
Less Coop Peak (N=18)More Coop Peak (N=18)Total (N=133)
Chart 1 Comparison of Percentage Cooperating in Each Round Between High Empathy Peaks and Total. Y-axis: Percent of group cooperating per round. X-axis: Round and the Previous Play of the computer in the preceding round, C=Cooperation & D=Defection.
57