Embed Size (px)
Citation preview
Emphasizing Numeracy as an Essential Skill @ Issue Paper No. 19 September 25, 2014 Nicholas Dion Higher Education Quality Council of Ontario

Published by
The Higher Education Quality Council of Ontario
1 Yonge Street, Suite 2402 Toronto, ON Canada, M5E 1E5 Phone: (416) 212-3893 Fax: (416) 212-3899 Web: www.heqco.ca E-mail: [email protected]
Cite this publication in the following format: Dion, N. (2014). Emphasizing Numeracy as an Essential Skill. Toronto: Higher Education Quality Council of Ontario.
The opinions expressed in this research document are those of the authors and do not necessarily represent the views or official policies of the Higher Education Quality Council of Ontario or other agencies or organizations that may have provided support, financial or otherwise, for this project. © Queens Printer for Ontario, 2014

Emphasizing Numeracy as an Essential Skill
Higher Education Quality Council of Ontario 2
Table of Contents Executive Summary ............................................................................................................................................. 4
Introduction........................................................................................................................................................... 6
Defining Numeracy ............................................................................................................................................... 7
Numeracy and the Labour Market ....................................................................................................................... 8
Choosing STEM ............................................................................................................................................9
Measuring Numeracy Skills in Canada and Abroad .......................................................................................... 10
International Adult Literacy and Skills Survey (IALSS), 2003 .................................................................... 10
Programme for the International Assessment of Adult Competencies (PIAAC), 2012 ............................. 12
Numeracy in Ontario’s High Schools ................................................................................................................. 14
Trends in International Mathematics and Science Study (TIMSS) ............................................................ 14
Education Quality and Accountability Office (EQAO) Grade 9 Assessment of Mathematics .................... 15
Programme for International Student Assessment (PISA) ........................................................................ 16
Numeracy Skills and Postsecondary Education ................................................................................................ 19
Numeracy in Ontario’s Colleges ........................................................................................................................ 20
Numeracy in Ontario’s Universities .................................................................................................................... 25
Conclusions ........................................................................................................................................................ 26
References ......................................................................................................................................................... 29

Emphasizing Numeracy as an Essential Skill
Higher Education Quality Council of Ontario 3
List of Tables Table 1: Descriptions of Levels of Difficulty, IALSS 2003 ................................................................................. 10
Table 2: Numeracy Scores by Proficiency Level, Canada and Ontario, IALSS 2003 ...................................... 11
Table 3: Numeracy Proficiency by Educational Attainment, Canada, IALSS 2003 .......................................... 12
Table 4: Numeracy Scores by Proficiency Level, Canada, Ontario and OECD, PIAAC 2012 ......................... 12
Table 5: Numeracy Scores by Proficiency Level, Canada, IALSS 2003 vs. PIAAC 2012 ................................ 13
Table 6: Numeracy Proficiency by Educational Attainment, Canada, PIAAC 2012 ......................................... 13
Table 7: Numeracy Scores by Proficiency Level, Canada and Ontario, PISA 2003 ........................................ 17
Table 8: Numeracy Scores by Proficiency Level, Canada and Ontario, PISA 2012 vs. PISA 2003 ................ 18
List of Figures Figure 1: Percentage of Students at or above the Provincial Standard, EQAO Grade 9 Assessment of
Mathematics, Academic vs. Applied, 2008-2014 .............................................................................. 16
Figure 2: Math Achievement Overall and by Program Type at six Colleges, CMP 2007 ................................. 21
Figure 3: Math Achievement Overall and by Program Type, 24 Ontario Colleges, CMP 2008-2010 .............. 23

Emphasizing Numeracy as an Essential Skill
Higher Education Quality Council of Ontario 4
Executive Summary While there is broad consensus that literacy skills are essential for work and life in general, there is less consensus about numeracy, even though both are defined as essential skills by a number of sources, including provincial and national governments and international agencies. As a part of HEQCO’s continuing examination of learning outcomes in Ontario’s postsecondary sector, this report reviews the available data on numeracy skills and revisits the postsecondary sector’s understanding and treatment of numeracy as an essential skill. Current data present a mixed assessment of Canadians’ numeracy skills overall. The OECD’s Programme for the International Assessment of Adult Competencies shows a slight deterioration in numeracy skills since 2003, with fewer university graduates achieving the upper levels of proficiency and more attaining standard levels or below over the last decade. Similar international assessments of high school students, in grade 8 through the Trends in Mathematics and Science Study and in grade 9 through the OECD’s Programme for International Student Assessment, suggest relative stability in numeracy skills over the last decade. But if Ontario students’ scores have not changed significantly over time, an increasing number of other jurisdictions are outperforming the province. Additionally, data from Ontario’s Education Quality and Accountability Office, which tests grade 9 students on their attainment of math curriculum goals, highlight the considerable discrepancy in skill level between students taking academic-stream math courses (over three-quarters reach the provincial standard) and those taking applied-stream math courses (under half reach the provincial standard). Despite a general lack of data to evaluate student preparedness for college- and university-level math classes, the College Math Project’s findings show that roughly one-third of students who take a math class in their first year of college earn grades of D or less, putting them at risk of not completing their programs. Incoming university students are not assessed, making it impossible to provide corresponding values, though a number of informal studies by faculty members point to similar conclusions. In summary, numeracy must be considered as an essential skill, especially in non-STEM fields. While literacy is spread throughout the curriculum both in high school and in postsecondary institutions, numeracy is too often segregated in particular courses, leaving students in non-STEM fields with very limited opportunities to develop their numeracy skills. Like literacy, numeracy should be broadly incorporated into curricula. Furthermore, colleges and universities collect very little information about the skills that students bring to higher education, making it difficult to ensure that students have the skills required to succeed in a math-intensive course of study and that the required supports are available to them. Finally, while OECD findings demonstrate that individuals with completed postsecondary credentials, especially university-level credentials, tend to have stronger numeracy skills, a variety of factors makes it impossible to attribute this gain to the postsecondary education itself. This suggests a data gap that could be filled if institutions were to begin collecting data on students’ skill levels at the time of graduation. In light of the above conclusions, this report closes with the following recommendations:
1) Numeracy should be treated as an essential skill on par with literacy. It should be integrated throughout postsecondary courses of study in Ontario’s colleges and universities, rather than isolated in math classes, ensuring that all students are exposed to content that further develops and enhances their numeracy skills, regardless of their major. Numeracy should be integrated in ways that are relevant to the course material and that aim for a level of skill development that corresponds in non-STEM fields to the OECD’s minimum proficiency level and in STEM fields to another, higher standard appropriate to the area of study.

Emphasizing Numeracy as an Essential Skill
Higher Education Quality Council of Ontario 5
2) It is difficult to evaluate the direct effect of a postsecondary education on essential and discipline-
specific skills given the information currently being gathered on students’ skill levels at admission and graduation. Postsecondary institutions should begin assessing the numeracy skills of incoming and outgoing students to fill this data gap. Incoming information could also be used to ensure that the appropriate supports are available to students as they begin their course of study, while outgoing assessments will provide new data to assess the value added of a postsecondary education on numeracy skills. Such assessment could be done in a variety of ways, from formal assessments such as exams to informal assessments using in-class assignments or portfolios.

Emphasizing Numeracy as an Essential Skill
Higher Education Quality Council of Ontario 6
Introduction1 Over the course of the last year, Canadians’ numeracy skills have (re)surfaced as a topic of discussion in popular media. The release of results from the latest round of Ontario’s Education Quality and Accountability Office (EQAO) data in August 2014, from the Organisation for Economic Co-operation and Development’s (OECD) Programme for the International Assessment of Adult Competencies (PIAAC) in October 2013, and from the OECD’s Programme for International Student Assessment (PISA) in December 2013 has provided constant fodder for a spirited public debate on Canadians’ level of comfort with numbers and mathematics. The tone of this debate has often been negative and the perception that of a budding crisis. TD Bank, for example, has suggested that “Canada has an essential skills problem,” one that could hamstring the economy in the coming years if drastic action is not taken to correct the situation (Alexander & Bendiner, 2013, p. 7). At the same time, the essential skills debate seems to be perennial in nature, waxing and waning with the release of relevant data. Even in 2007 the Canadian Council on Learning could point to “Canada’s learning paradox,” the fact that this country has one of the highest postsecondary education (PSE) attainment rates in the world, yet a substantial portion of its population still lacks the literacy and numeracy skills required to thrive in a modern economy (CCL, 2007, p. 2). When compared to literacy, the content of the discussion surrounding numeracy is markedly different. While there is broad consensus that the ability to read and write effectively – “literacy” – is essential for everyone in the modern world and that those with strong literacy skills benefit both on the labour market and in life in general2, this agreement often seems to be lacking with respect to numeracy. As a result, the literature surrounding the ability to manipulate and interpret numbers – “numeracy” – is much more insistent in its definition of numeracy as an essential skill whose importance is on par with that of literacy. For example, some have highlighted that the ever-increasing complexity of the demands of modern life in turn requires increasingly sophisticated literacy and numeracy skills (Orpwood, Schmidt & Jun, 2012), that numeracy skills are, in a sense, more important now than they ever have been. Similarly, an expert panel on student success in mathematics struck by the Ontario Ministry of Education begins its report by emphasizing that “[m]athematical literacy is as important as proficiency in reading and writing” (Government of Ontario, 2004, p. 9). This insistence opposes a cultural tradition that would minimize the importance of numeracy skills. Adults who do not feel that they are good at math – an attitude that often dates back to their own experiences in school – may normalize poor numeracy skills and pass low expectations on to their children, perpetuating a culture in which strong numeracy skills are not valued. The expert panel on student success mentioned above reacts against this trend in decrying that “[t]oo often, society has accepted the stereotype that mathematics is for the few, not the many” (Government of Ontario, 2004, p. 9; cf. Parsons & Bynner, 1997; Brown, 2012; Brown & Rushowy, 2013). Orpwood echoes these comments, contrasting attitudes toward numeracy with the emphasis on literacy skills:
If you’re illiterate, it’s a matter of shame. But if you can’t do math, you brag about it – ‘I can’t do math and my kids can’t either’ …. We need to change this perception. We don’t believe there is a ‘math gene.’ Anyone can do math and everyone needs it. Math matters, that’s what the message needs to be. (Brown, 2012)
1 The author wishes to thank the many reviewers, both internal and external, who provided feedback on earlier drafts of this report. 2 See, for example, the literature reviewed in Dion & Maldonado, 2013.

Emphasizing Numeracy as an Essential Skill
Higher Education Quality Council of Ontario 7
When we attempt to identify the reflection of these cultural attitudes in hard data, we find a variety of assessments that point to weak numeracy skills in certain segments of Canada’s population. We will survey this literature in detail below. But when we focus on questions relevant to postsecondary transitions – on the level of numerical proficiency that students bring with them from high school into PSE, for example, or on the “value added” of a postsecondary education on recent graduates’ numeracy skills – we find a striking shortage of information. The impressions of faculty members as reported in popular media hardly paint a glowing portrait. Brenda Smith-Chant, a psychology professor at Trent University, discusses students’ difficulties with basic arithmetic – “we’re talking about adding three two-digit numbers” – in an article on numeracy in University Affairs, while Gordon Robinson, a biology professor at the University of Manitoba, describes being “aghast” at students’ math skills (Kershaw, 2010). Yet despite this common refrain from faculty in STEM3 disciplines, solid data, especially institutional data, on students’ numeracy skills are difficult to find. The cause for the perceived weakness in numeracy skills has been identified in everything from the massification of postsecondary education, to teacher candidates with humanities backgrounds, to a lack of math-oriented professional development opportunities for practicing teachers (Alphonso & Morrow, 2013; Brown & Rushowy, 2013). Different parties have in turn suggested various solutions to the “numeracy crisis,” proposing longer math periods, compulsory high school math classes through grade 12, a mandatory exit exam in math similar to the Ontario Secondary School Literacy Test, and more support for teachers (Brown & Rushowy, 2013; Brown, 2012; Friesen, 2003; Government of Ontario, 2004). For its part, the provincial government has addressed concerns over numeracy skills most notably with the creation of the Literacy and Numeracy Secretariat in 2004, whose work was reviewed positively in a 2009 impact study (Audet et al., 2009). More recently, the government announced new measures to shore up students’ numeracy skills in light of recent data, including new opportunities for teachers to upgrade their math skills, measures to increase the numbers of teachers with math qualifications, and the creation of new resources for parents to help their children with math (Government of Ontario, 2014). What are the implications of recent numeracy data for students entering PSE and for the institutions receiving them? As a part of HEQCO’s continuing examination of learning outcomes in Ontario’s postsecondary sector, and the teaching and learning that takes place within our colleges and universities, this paper examines the numeracy skills of the province’s population. A companion piece to an earlier HEQCO project studying literacy skills (Dion & Maldonado, 2013), this report pursues a similar line of inquiry to review the available data on numeracy skills and revisit the postsecondary sector’s understanding and treatment of numeracy as an essential skill.
Defining Numeracy Numeracy, like literacy, is defined in terms of the types and levels of skill required to thrive in the modern world. This level of “real-world knowledge” must be carefully distinguished from trigonometry, calculus, statistics and other kinds of advanced math less commonly used outside STEM postsecondary programs or careers requiring such expertise (HRSDC & Statistics Canada, 2005). It is important to understand where the bar is being set here. On the one hand, the EQAO assesses students based on their knowledge of concepts and operations covered in the curriculum to determine whether curriculum goals are being met. At the early stages of education considered here, these curriculum goals overlap considerably with the skills needed to succeed in life. On the other hand, however, the OECD’s assessments of adult numeracy skills would be
3 Science, technology, engineering and mathematics.

Emphasizing Numeracy as an Essential Skill
Higher Education Quality Council of Ontario 8
unlikely to include a question grounded in differential calculus or advanced statistics as being reflective of the demands of everyday life. This distinction between mathematical knowledge and numeracy is a slippery albeit an important one if we are to understand the standard against which Canadians’ numeracy skills are being measured. With that said, definitions of “numeracy” vary somewhat, but all seek to give some specificity to the vague “skills required to thrive in the modern world.” Numeracy involves the deployment of the basic math skills learned in formal schooling in a flexible and goal-oriented way to respond to the needs of a situation. This can involve anything from performing basic operations like addition and subtraction to estimation, measurement, proportions, ratios and statistical literacy (HRSDC & Statistics Canada, 2005).4 According to the Ontario Ministry of Education’s expert panel on student success, a mathematically literate (or, in other words, numerate) person should be able to estimate, to interpret data, to solve day-to-day problems, to reason in numerical, graphical and geometric situations, and to communicate using mathematics (Government of Ontario, 2004). Essential Skills Ontario echoes many of these abilities, dividing numeracy into five dimensions that reflect everyday use: 1) money math, or the ability to make financial transactions such as paying bills; 2) scheduling, budgeting and accounting, or planning for the best use of money and time; 3) measuring and calculating quantities, areas, volumes and distances; 4) data analysis; and 5) numerical estimation (Essential Skills Ontario, 2012). To give these concepts form, one HRSDC5 report describes some of the tasks included in international assessments to measure numeracy skills. An easier task, for example, asked adults to look at a photograph containing two cases of cola and state the number of bottles contained in total. Another, more difficult task asked adults to look at the results of a three-person election, reported in percentages, and determine the total number of votes cast for each candidate given the total number of voters. Finally, a task of high difficulty asked participants to determine the amount that would result if a certain sum of money were invested at a fixed rate of interest for a given period of time (HRSDC & Statistics Canada, 2005). None of these questions requires the use of advanced mathematical skills, such as calculus or statistics, but draws instead on foundational levels of mathematical knowledge that would be more likely to be required in everyday situations.
Numeracy and the Labour Market The numeracy debate has implications for the labour market, both in terms of the basic numeracy skills required of any job and the advanced math skills that can become drivers of economic innovation (Orpwood, Schmidt & Jun, 2012; CCL, 2006). For while every sector has its part to play (cf. CCL, 2006, p. 34), STEM fields, including engineering, the natural and physical sciences and other math-intensive disciplines, have often been identified as having major roles to play in economic innovation, due in part to the amount of money they spend on research, development and other knowledge-generating activities (Hango, 2013a; CCL, 2006). As a testament to both the importance and the rarity of advanced mathematical skills, individuals in STEM fields also tend to experience better labour market outcomes and higher personal earnings (Hango, 2013a). As a result of this emphasis on STEM, math skills make a more prominent appearance in the labour market discussion than do numeracy skills in general, which tend instead to be taken for granted. Findings from Borwein’s (2014) study of 316 job advertisements for entry-level positions also highlight the role that the
4 Operating in a policy context, this report treats the definitions from HRSDC/ESDC and Essential Skills Ontario as particularly relevant. A more detailed genealogy of the academic literature defining numeracy can be found in Orpwood et al. (2012), p. 65ff. 5 Human Resources and Skills Development Canada, recently renamed Employment and Social Development Canada (ESDC).

Emphasizing Numeracy as an Essential Skill
Higher Education Quality Council of Ontario 9
vague distinction between general numeracy and advanced math skills may play in clouding the issue here. On the one hand, only 19% of the job advertisements studied listed numeracy skills as essential to the position, a total that made numeracy the third least requested skill in the sample and fell far behind other skills such as oral communication and the ability to work with others. On the other hand, positions in STEM fields made up 26% of the study sample, suggesting that the advertisements for many STEM positions may have left their numeracy and math-related requirements unlisted. Despite this blurry line between numeracy and math, the benefits on the labour market of strong numeracy skills are clear. Those who are employed tend to have higher literacy and numeracy scores on international assessments than those who are unemployed or not in the labour force (HRSDC & Statistics Canada, 2005), while those with lower numeracy skill levels are twice as likely to experience unemployment for six months or more in a given year than they are to be employed all year (CCL, 2006). One Canadian study even suggests that the benefits of strong numeracy skills extend to all those who completed high school, whether or not they went on to PSE (Finnie & Meng, 2006). Choosing STEM While no one would suggest that every student should pursue a STEM field in college or university, it is clear that these disciplines hold a place of particular prominence in Canadian economic discourse. Some have concluded that Canada faces a growing shortage of workers with PSE credentials in STEM areas, those same fields in which Economic and Social Development Canada (ESDC, formerly HRSDC) expects to see the highest number of job openings in coming years (Orpwood, Schmidt & Jun, 2012). Others have observed students’ weak numeracy skills affecting their course and career choices, as students are driven away from math-intensive fields of study in college and university due to their math requirements (Kershaw, 2010). One survey of Canadians aged 16 to 18 revealed that only 37% of high school students were interested in taking at least one science course in PSE, demonstrating a lack of interest and/or confidence in STEM disciplines even in high school (Orpwood, Schmidt & Jun, 2012). Two other surveys also conducted in 2010 similarly showed that students’ interest in science declines with age and that the majority of senior high school students do not see studying science as relevant to their future careers, leading to education choices at a young age that make it difficult to re-engage with STEM disciplines in PSE (Let’s Talk Science, 2013). Another important consideration here is the influence of gender on STEM engagement. While women accounted for 66% of university graduates in non-STEM fields in 2011, they made up only 39% of graduates in STEM fields. Although percentages were higher in science and technology fields (59%), only 23% of engineering graduates and 30% of math and computer science graduates were female (Hango, 2013a).6 Analysis from Statistics Canada found that women were less likely to choose a STEM field regardless of their mathematical abilities at age 15, with only 23% of women in the three highest PISA proficiency levels choosing STEM in PSE compared to 39% of men in the three lowest PISA levels (Hango, 2013a; 2013b). As the report puts it, this strongly implies that “something other than pure ability is affecting young women’s likelihood of entering STEM programs in university” (Hango, 2013b, p. 5). The same study found STEM labour market outcomes to be conditioned by gender, as men in STEM fields had lower unemployment than those in non-STEM (4.7% vs. 5.5%), while the opposite was true for women (7.0% vs. 5.7%). The same trend held for salaries, where the difference between salaries in STEM and non-STEM fields was much greater for men than for women, due in large part to the low concentration of women in engineering occupations, where salaries tend to be particularly higher (Hango, 2013a).
6 Based on data from the 2011 National Household Survey.

Emphasizing Numeracy as an Essential Skill
Higher Education Quality Council of Ontario 10
Measuring Numeracy Skills in Canada and Abroad To obtain data on the ways in which Canadians’ numeracy skills have evolved over the last two decades and on how these skills compare internationally, we can turn to a number of assessments run by the OECD in collaboration with Statistics Canada. Those same international assessments surveyed in HEQCO’s literacy report (Dion & Maldonado, 2013) generally also include a measure of numeracy, often treated as a dimension of literacy itself and defined as numerical or quantitative literacy, the ability to interpret and use numerical data. This section of the current report will review data from these international assessments as they relate to numeracy, with a particular focus on Ontario’s results, though Canadian data will also be presented to provide context. While much of the data will assess the skills of the general population, particular attention will be paid to the effects of PSE on numerical proficiency itself. International Adult Literacy and Skills Survey (IALSS), 2003 The IALSS evaluated the literacy and numeracy skills of 23,000 Canadians aged 16 to 65 in the 10 provinces and three territories in 2003. It was designed to track the evolution of Canadians’ skills since the last assessment in 1994.7 Numeracy was defined broadly as “the knowledge and skills required to effectively manage the mathematical demands of diverse situations” (HRSDC & Statistics Canada, 2005). Tasks blended both numeracy and literacy and involved working through text-based problems and completing mathematical operations based on numbers provided in those texts. Questions were divided into five levels of difficulty, described below (Table 1). Table 1: Descriptions of Levels of Difficulty, IALSS 2003
Level 1 Tasks in this level require the respondent to show an understanding of basic numerical ideas by completing simple tasks in concrete, familiar contexts where the mathematical content is explicit with little text. Tasks consist of simple, one-step operations such as counting, sorting dates, performing simple arithmetic operations or understanding common and simple percents such as 50%.
Level 2 Tasks in this level are fairly simple and relate to identifying and understanding basic mathematical concepts embedded in a range of familiar contexts where the mathematical content is quite explicit and visual with few distracters. Tasks tend to include one-step or two-step processes and estimations involving whole numbers, benchmark percents and fractions, interpreting simple graphical or spatial representations, and performing simple measurements.
Level 3 Tasks in this level require the respondent to demonstrate understanding of mathematical information represented in a range of different forms, such as in numbers, symbols, maps, graphs, texts, and drawings. Skills required involve number and spatial sense, knowledge of mathematical patterns and relationships and the ability to interpret proportions, data and statistics embedded in relatively simple texts where there may be distracters. Tasks commonly involve undertaking a number of processes to solve problems.
7 While the IALSS found no real change in literacy scores since the IALS in 1994, numeracy scores were not compared since the definition and conception of numeracy assessed had changed in the interim (HRSDC & Statistics Canada, 2005, p. 33).

Emphasizing Numeracy as an Essential Skill
Higher Education Quality Council of Ontario 11
Level 4 Tasks at this level require respondents to understand a broad range of mathematical
information of a more abstract nature represented in diverse ways, including in texts of increasing complexity or in unfamiliar contexts. These tasks involve undertaking multiple steps to find solutions to problems and require more complex reasoning and interpretation skills, including comprehending and working with proportions and formulas or offering explanations for answers.
Level 5 Tasks in this level require respondents to understand complex representations and abstract and formal mathematical and statistical ideas, possibly embedded in complex texts. Respondents may have to integrate multiple types of mathematical information, draw inferences, or generate mathematical justification for answers.
Source: HRSDC & Statistics Canada, 2005, p. 16 Canadians scored 263 out of a possible 500 on the IALSS, with Ontarians at 261. Of the Ontario population, 55% scored below level 3, the minimum level of proficiency required to meets the demands of life in today’s society (Table 2)(HRSDC & Statistics Canada, 2005). As can be observed below, the distribution of scores across proficiency levels aligns closely for Ontario and Canada. Table 2: Numeracy Scores by Proficiency Level, Canada and Ontario, IALSS 2003
Canada Ontario
Level 1 25.5% 27.0%
Level 2 29.6% 28.8%
Level 3 30.1% 29.3%
Levels 4/5 14.7% 14.8%
Source: HRSDC & Statistics Canada, 2005, p. 113 IALSS results also showed gender to be an important factor influencing numeracy scores, with males outperforming females by a statistically significant margin of 8 points on average. Higher levels of education were also associated with higher numeracy scores. 73.3% of individuals with a completed university credential scored at level 3 or above, compared to 56.2% of those with a non-university PSE credential, 43.3% of those with a trade or vocational credential, and 43.6% of those with a high school diploma (Table 3)(HRSDC & Statistics Canada, 2005).

Emphasizing Numeracy as an Essential Skill
Higher Education Quality Council of Ontario 12
Table 3: Numeracy Proficiency by Educational Attainment, Canada, IALSS 2003
Level 1 Level 2 Level 3 Level 4/5
High school not completed 53.8% 28.6% 14.1% 3.6%
High school 21.9% 34.4% 32.7% 10.9%
Trade-vocational 19.2% 37.5% 32.9% 10.4%
Non-university PSE 14.1% 29.7% 38.5% 17.7%
University 6.3% 20.4% 39.7% 33.6%
Source: HRSDC & Statistics Canada, 2005, p. 127 The largest gains in numeracy skills were associated, first, with the completion of high school and, second, with that of a university degree, with fewer individuals scoring at levels 1 and 2 and more at levels 4 and 5 in each case. 33.6% of those with a university credential scored at the top level of numeracy, compared to 17.7% of those with a non-university PSE credential and 11% of those with a high school diploma. Finally, IALSS results also emphasized the labour market benefits of solid numeracy skills. Higher levels of numeracy were associated with lower unemployment and higher earnings (OECD & Statistics Canada, 2011). Programme for the International Assessment of Adult Competencies (PIAAC), 2012 The OECD conducted PIAAC in 2012 to follow up on results from IALSS, which were then almost 10 years old. Participants included 27,285 Canadians aged 16 to 65 from all provinces and territories (Statistics Canada, ESDC & CMEC, 2013). In this case, Canada ranked below the OECD average on numeracy (265 vs. 269), with Ontarians scoring at the Canadian average (266). The proportion of Canadians scoring at level 1 and below on the numeracy scale was also greater than the OECD average (23% vs. 19%), with only 13% of Canadians scoring at the top level of the numeracy scale (Table 4). Table 4: Numeracy Scores by Proficiency Level, Canada, Ontario and OECD, PIAAC 2012
Canada Ontario OECD average
Below level 1 6% 6% 5%
Level 1 17% 16% 14%
Level 2 32% 31% 33%
Level 3 33% 33% 35%
Level 4/5 13% 14% 13%
Source: Statistics Canada, ESDC & CMEC, 2013, p. 21

Emphasizing Numeracy as an Essential Skill
Higher Education Quality Council of Ontario 13
Table 5: Numeracy Scores by Proficiency Level, Canada, IALSS 2003 vs. PIAAC 2012
IALSS 2003 PIAAC 2012
Average 272 266
Below level 1 5% 6%
Level 1 13% 17%
Level 2 31% 32%
Level 3 37% 33%
Level 4/5 14% 13%
Source: Statistics Canada, ESDC & CMEC, 2013, p. 55 Numeracy scores were found to be highest in Canada for those aged 25 to 34 (277) and lowest for those aged 55 to 65 (251). Men again scored higher than women in all age groups and the difference between the two sexes increased with age. Table 6: Numeracy Proficiency by Educational Attainment, Canada, PIAAC 2012
Average Level 1 and below
Level 2 Level 3 Level 4/5
Less than high school 222.2 50.7% 31.4% 15.4% 2.5%
High school 256.6 26.0% 37.0% 29.5% 7.5%
PSE – below bachelor’s
268.5 18.6% 35.5% 35.5% 10.5%
PSE – bachelor’s or higher
295.1 8.3% 23.4% 41.8% 26.5%
Source: Statistics Canada, ESDC & CMEC, 2013, p. 87 Higher educational attainment, especially the completion of a bachelor’s degree or higher, was associated with higher numeracy skills (Statistics Canada, ESDC & CMEC, 2013). These results improve when one examines only bachelor’s graduates from Canadian universities, filtering out those with foreign university-level credentials.8 In this case, Canada moves above the OECD average in numeracy (Charbonneau, 2014; Munro, 2014; CMEC, 2013). Analysis by the Conference Board of Canada also suggests that the proportion of Canadians with a bachelor’s, master’s or doctoral degree scoring at the highest numeracy levels was significantly higher than the proportion of Canadians with a college-level credential such as a diploma or a certificate scoring at those levels, pointing to the relative strength of university graduates’ numeracy skills compared to those of college graduates (Munro, 2014).
8 39% of bachelor’s graduates who responded to PIAAC in Canada were immigrants and over half of them had been educated abroad (Munro, 2014).

Emphasizing Numeracy as an Essential Skill
Higher Education Quality Council of Ontario 14
Canada’s PIAAC results make it difficult to ignore the deterioration – albeit slight, in some cases – in numeracy skills since 2003. Most relevant for our purposes is the drop in numeracy skills by educational attainment. While 33.6% of IALSS 2003 participants who had completed a university degree scored at levels 4 and 5, this value dropped to 26.5% in PIAAC 2012, which in turn saw a rise in bachelor’s graduates scoring at levels 2 and 3. Overall, slightly more bachelor’s graduates scored at level 3 in 2012 (41.8% vs. 39.7%), although this increase came at the expense of the top performers in levels 4 and 5 rather than the weaker performers in levels 1 and 2. While 73.3% of individuals with a university credential scored at level 3 or above in 2003, this value dropped to 68.3% in 2012. Given that the definitions of the college-type categories changed from 2003 to 2012, it is difficult to draw corresponding conclusions about performance in the college sector.
Numeracy in Ontario’s High Schools We now turn to numeracy data that come from Ontario’s school system, with a particular focus on the skills that students bring with them into PSE. To preserve this focus, we exclude certain provincial assessments, such as the EQAO math assessments in grades 3 and 6, which deal with a younger student population, while including others, such as the Trends in International Mathematics and Science Study (TIMSS) in grade 8, PISA (age 15) and the EQAO Grade 9 Assessment of Mathematics, which evaluate students at an age where their skills are more likely to reflect their proficiency heading into PSE. To obtain their Ontario Secondary School Diploma (OSSD), students must complete three compulsory math credits, at least one of which must be at the grade 11 or 12 level (Government of Ontario, 2004). As a result, many students do not take math every year during high school. Math courses can be drawn from any of the available academic- or applied-stream options, as well as a host of locally developed courses.9 All Ontario students entering PSE today have studied under the new mathematics curriculum, which places less of an emphasis on procedure and rote memorization and focuses instead on real-life, word-based problems and applied mathematical concepts (Ontario Ministry of Education, 2005; 2007). Trends in International Mathematics and Science Study (TIMSS) Organized by the International Association for the Evaluation of Educational Achievement, the TIMSS is administered to grade 4 and grade 8 students in Ontario to evaluate their skills in math and science. The TIMSS has been conducted every four years since 1995, with the next iteration planned for 2015. For the purposes of this report, we focus on the grade 8 version of the assessment. Furthermore, we exclude data from 1995 and 1999, since a change in the conception of numeracy meant that these results could not be compared to those gathered in subsequent years. Ontario and Quebec were the only two Canadian jurisdictions to participate in the TIMSS in 2003. The content of the exam was set internationally and the overlap between this content and the Ontario curriculum was carefully evaluated. In this case, 90% of questions were found to be appropriate for students given the
9 “Academic courses develop students’ knowledge and skills through the study of theory and abstract problems. These courses focus on the essential concepts of a subject and explore related concepts as well. They incorporate practical applications as appropriate.” “Applied courses focus on the essential concepts of a subject, and develop students’ knowledge and skills through practical applications and concrete examples. Familiar situations are used to illustrate ideas, and students are given more opportunities to experience hands-on application of the concepts and theories they study” (Ontario Ministry of Education, 2005, p. 6).
Emphasizing Numeracy as an Essential Skill
Higher Education Quality Council of Ontario 15
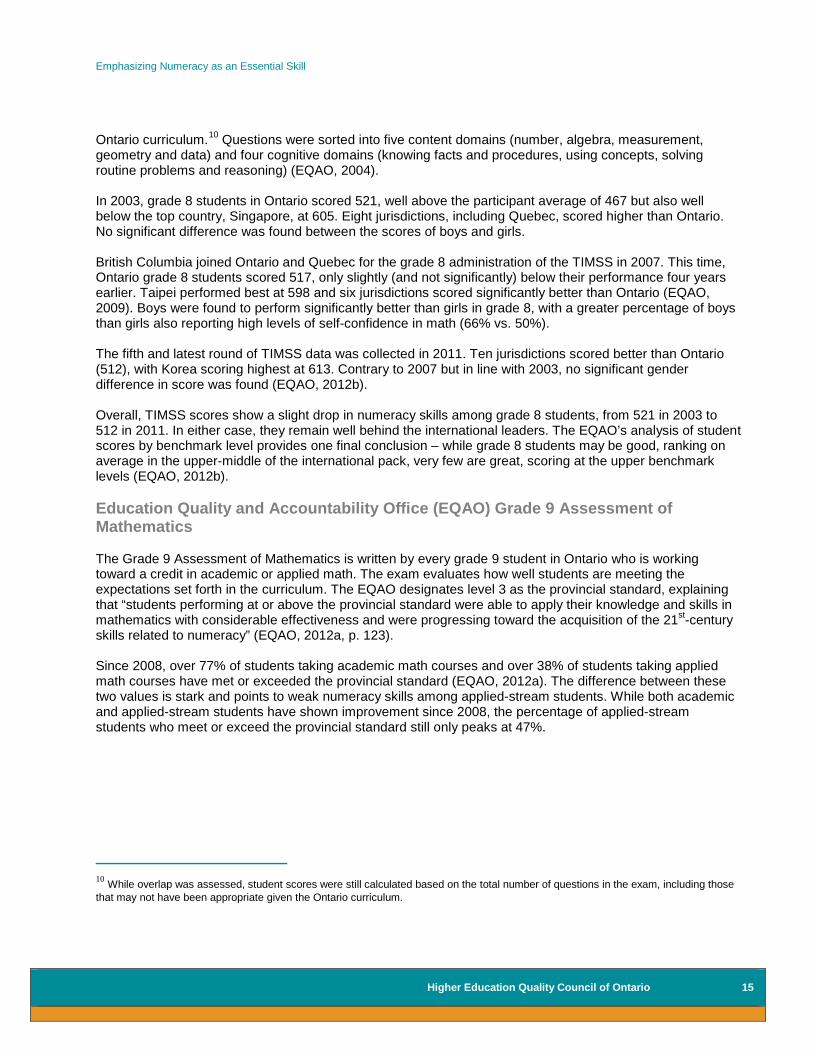
Ontario curriculum.10 Questions were sorted into five content domains (number, algebra, measurement, geometry and data) and four cognitive domains (knowing facts and procedures, using concepts, solving routine problems and reasoning) (EQAO, 2004). In 2003, grade 8 students in Ontario scored 521, well above the participant average of 467 but also well below the top country, Singapore, at 605. Eight jurisdictions, including Quebec, scored higher than Ontario. No significant difference was found between the scores of boys and girls. British Columbia joined Ontario and Quebec for the grade 8 administration of the TIMSS in 2007. This time, Ontario grade 8 students scored 517, only slightly (and not significantly) below their performance four years earlier. Taipei performed best at 598 and six jurisdictions scored significantly better than Ontario (EQAO, 2009). Boys were found to perform significantly better than girls in grade 8, with a greater percentage of boys than girls also reporting high levels of self-confidence in math (66% vs. 50%). The fifth and latest round of TIMSS data was collected in 2011. Ten jurisdictions scored better than Ontario (512), with Korea scoring highest at 613. Contrary to 2007 but in line with 2003, no significant gender difference in score was found (EQAO, 2012b). Overall, TIMSS scores show a slight drop in numeracy skills among grade 8 students, from 521 in 2003 to 512 in 2011. In either case, they remain well behind the international leaders. The EQAO’s analysis of student scores by benchmark level provides one final conclusion – while grade 8 students may be good, ranking on average in the upper-middle of the international pack, very few are great, scoring at the upper benchmark levels (EQAO, 2012b). Education Quality and Accountability Office (EQAO) Grade 9 Assessment of Mathematics The Grade 9 Assessment of Mathematics is written by every grade 9 student in Ontario who is working toward a credit in academic or applied math. The exam evaluates how well students are meeting the expectations set forth in the curriculum. The EQAO designates level 3 as the provincial standard, explaining that “students performing at or above the provincial standard were able to apply their knowledge and skills in mathematics with considerable effectiveness and were progressing toward the acquisition of the 21st-century skills related to numeracy” (EQAO, 2012a, p. 123). Since 2008, over 77% of students taking academic math courses and over 38% of students taking applied math courses have met or exceeded the provincial standard (EQAO, 2012a). The difference between these two values is stark and points to weak numeracy skills among applied-stream students. While both academic and applied-stream students have shown improvement since 2008, the percentage of applied-stream students who meet or exceed the provincial standard still only peaks at 47%.
10 While overlap was assessed, student scores were still calculated based on the total number of questions in the exam, including those that may not have been appropriate given the Ontario curriculum.

Emphasizing Numeracy as an Essential Skill
Higher Education Quality Council of Ontario 16
Figure 1: Percentage of Students at or above the Provincial Standard, EQAO Grade 9 Assessment of Mathematics, Academic vs. Applied, EQAO, 2008-2014
Source: EQAO, 2014
In terms of gender, EQAO results show that male and female results have both been improving but that a higher percentage of males than females perform at or above the provincial standard (EQAO, 2013a). This gap is greater in the applied stream than in the academic stream. Programme for International Student Assessment (PISA) Contrary to the TIMSS and EQAO assessments, PISA provides an internationally set rather than a curriculum-based evaluation of students’ math skills. Administered by the OECD, PISA is conducted every three years and measures 15-year-old students’ skills in literacy, numeracy and science. Each iteration of the assessment contains a major domain – an area of focus in which extra questions are added to allow for in-depth analysis of the data. Numeracy was the major domain in 2003 and 2012. PISA defines mathematical literacy or numeracy as “[t]he capacity to identify, to understand, and to engage in mathematics and make well-founded judgements about the role that mathematics plays, as needed for individuals’ current and future private life, occupational life, social life with peers and relatives and as a constructive, concerned and reflective citizen” (Bussière et al., 2001). The first administration of PISA took place in 2000. Canadian students scored 533, ranking sixth out of 31 participating countries, lower than their ranking in literacy (second) and science (fifth). Students in Ontario performed at the Canadian average with a score of 524. Boys tended to perform better than girls on the numeracy measure, with average scores of 539 for boys and 529 for girls (Bussière et al., 2001). The establishment of numeracy as the major domain in 2003 provided added opportunities for data analysis. Here, performance was broken down according to four mathematical domains: space and shape, which involved tasks grounded in geometry; change and relationships, which dealt with algebra; quantity, which dealt with patterns and other relationships; and uncertainty, which involved probability and basic statistics (Bussière et al., 2004).
77 82 83 84 84 85
38 44 42 44 44 47
0102030405060708090
100
Perc
enta
ge L
evel
3 o
r Abo
ve
Academic
Applied

Emphasizing Numeracy as an Essential Skill
Higher Education Quality Council of Ontario 17
Only two countries scored significantly better than Canada on the overall numeracy score, though Canadian students were particularly weak in the space and shape domain. Ontario performed at the Canadian average, with only Alberta scoring significantly above it. Ontario was also at the Canadian average for each of the four task domains and the distribution of Ontario students by proficiency level closely paralleled that for Canada as a whole (Table 7). 28.4% of students scored below level 3 in Ontario, with 18% scoring at level 5 and above (Bussière et al., 2004). Table 7: Numeracy Scores by Proficiency Level, Canada and Ontario, PISA 2003
Canada Ontario
Below level 1 2.4% 2.0%
Level 1 7.7% 7.7%
Level 2 18.3% 19.1%
Level 3 26.2% 27.7%
Level 4 25.1% 25.1%
Level 5 14.8% 13.8%
Level 6 5.5% 4.6%
Source: Bussière et al., 2004, p. 75 Boys performed better than girls by an average of 11 points, a margin that is statistically significant but still relatively small. This was true in both Ontario and Canada. While gender differences were significant across all four task domains, they were most pronounced in the space and shape (geometry) domain and less so in the quantity (patterns) domain. The difference in attitudes towards math was also stark:
After controlling for mathematical performance, girls reported lower levels of confidence in their ability to solve specific mathematical problems, lower levels of their perceived ability to learn mathematics, and higher levels of anxiety in dealing with mathematics. Girls were also less likely to believe that mathematics will be useful to their future employment and education, and were more likely to report lower levels of interest and enjoyment in mathematics. (Bussière et al., 2004, p. 49)
Due to certain changes made to the exam, the overall PISA numeracy scores from 2000 and 2003 cannot be compared reliably (Bussière et al., 2004). PISA numeracy scores in 2006 were generally in line with those from three years earlier for both Ontario and Canada. Canada scored above the OECD average (498) at 527, with Ontario scoring 526. Two countries scored significantly better than Canada. Boys again scored significantly better than girls, this time by a slightly greater margin (Bussière et al., 2007). PISA 2009 numeracy scores provided more of the same. Canada scored 527, above the OECD average of 497. Ontario performed at the Canadian average, with four countries scoring significantly better. Canadian males continued to outperform females. As Knighton et al. (2010) note, these results are at once both comforting and worrisome. On the one hand, Canadian students’ scores have not changed significantly over time, moving from 523 in 2003 to 527 in both 2006 and 2009. This points to stability in students’ skill levels. On the other hand, however, the number of

Emphasizing Numeracy as an Essential Skill
Higher Education Quality Council of Ontario 18
countries that perform significantly better than Canada increased from 2006 to 2009 despite this stability, which may suggest that “stability” is better interpreted as stagnation in the face of international improvement. Math was again the major domain in PISA 2012, allowing for comparisons with the more detailed data collected in 2003. The four task domains, now renamed “content knowledge areas,” remained essentially the same (change and relationships; space and shape; quantity; uncertainty and data) and were joined by three process areas, which designated modes of mathematical thought and ability: formulating situations mathematically; employing mathematical concepts, facts, procedures, and reasoning; and interpreting, applying, and evaluating mathematical outcomes (Brochu et al., 2013). Scores dropped slightly in 2012 when compared to 2009, with Canada scoring 518 and Ontario 514 compared to an OECD average of 494. This time, seven countries performed better than Canada. When examining the four different content knowledge areas, Canadians performed lowest in space and shape (510), followed by quantity (515), uncertainty (516) and change and relationships (525). Space and shape was also found to generate the lowest scores on average among participating countries. Boys again scored significantly better than girls in both Canada and Ontario. The distribution of Ontario students by proficiency level in 2012 closely paralleled that for Canada as a whole but showed a marked deterioration compared to 2003. 14% of students in both Ontario and Canada scored at level 1 or below in 2012, compared to only 10% in 2003. The percentage of Ontario students scoring below level 3 also rose from 28.8 to 36.4%. The percentage of students performing at the upper end of the scale dropped, with 15% of Ontario students scoring at level 5 or above in 2012 (compared to 18% in 2003) and 16% of Canadian students doing the same (compared to 20% in 2003) (Bussière et al., 2004). Table 8: Numeracy Scores by Proficiency Level, Canada and Ontario, PISA 2012 vs. PISA 2003
Canada Ontario
2012 2003 2012 2003
Below level 1 3.6% 2.4% 3.8% 2.0%
Level 1 10.2% 7.7% 10.0% 7.7%
Level 2 21.0% 18.3% 22.6% 19.1%
Level 3 26.4% 26.2% 27.3% 27.7%
Level 4 22.4% 25.1% 21.3% 25.1%
Level 5 12.1% 14.8% 11.0% 13.8%
Level 6 4.3% 5.5% 4.0% 4.6%
Source: Brochu et al., 2013, p. 62; Bussière et al., 2004, p. 75 Examining further the trends in student performance from 2003 to 2012, Brochu et al. describe the results as mixed. On the one hand, they claim that “PISA demonstrates that Canadian youths are well equipped with the foundational skills that are essential for participation in modern society” (2013, p. 47): “Canada remains in a small group of top-performing countries, and achieves its standing with mostly equitable outcomes” (2013, p. 48). On the other hand, however, they also acknowledge that, while remaining strong, math scores have slipped over time, from both a relative and an absolute perspective. As a result, Canadian ministers of education have agreed that numeracy needs to be a priority going forward: “This trend is perhaps a strong signal for ministries and departments of education, as well as for education partners, to work together in

Emphasizing Numeracy as an Essential Skill
Higher Education Quality Council of Ontario 19
validating current education policies… as well as allocating resources to ensure that they continue meeting the needs of our society” (2013, p. 48).
Numeracy Skills and Postsecondary Education Grade 8 students’ performance on the TIMSS points to consistently good – though not great – math skills. While scores declined slightly between 2003 and 2011, the most striking finding here is the relatively low number of students ranking at the upper proficiency levels, with scores clustering instead around the middle ranges. Results from the EQAO Grade 9 Assessment of Mathematics highlight the discrepancy in skill level that exists between students taking academic-stream and applied-stream math courses. Based on this, there is good reason to believe that universities are receiving a greater share of students with strong math skills than are colleges. Finally, PISA results are best described as mixed. While Ontario students’ scores have not changed significantly over time, the number of jurisdictions whose students perform significantly better than Ontario has increased. In addition, the percentage of students scoring at proficiency level 5 dropped from 18% in 2003 to 15% in 2012, while the percentage of students scoring below level 3 rose from 28.8 to 36.4%. With these data in mind, what can we determine about the numeracy skills that students bring with them into PSE? First, it is important to note that the numeracy standard PSE institutions use for admission is far from clear. While an assessment like PISA measures numeracy as defined by the OECD, the TIMSS and EQAO emphasize student knowledge of the high school math curriculum, which may overlap with but is also distinct from the OECD’s definition. High school grades, the measure of math skill most commonly employed by postsecondary institutions, also come closer to measuring knowledge of high school math than numeracy. We must recognize the existence of two different standards of reference here. The mathematical knowledge required to succeed in a typical first-year undergraduate math course like introductory statistics or advanced calculus goes well beyond the everyday mathematical literacy requirements assessed by the OECD. We should therefore give some thought to the level and type of numeracy skills to be expected of students entering PSE. Disciplines that require entering students to have a minimum grade in a senior high school-level math class, for example, are setting a clear standard, one upon which they hope to build in order to develop more advanced math skills. But this level of math knowledge, typically required of STEM majors, also goes beyond the general level of proficiency that would be expected of all graduates. The discussion concerning numeracy skills cannot simply be a STEM discussion, relevant only to those students who choose to take math courses. If numeracy is to be labelled an essential skill – an ability that is required of everyone, regardless of their studies and employment – we must take this designation seriously and ask how postsecondary institutions are building the numeracy skills of those students who have no interest in STEM and may choose to study history, religion or art. This becomes a discussion about whether the teaching of basic cognitive skills in general or numeracy in particular is a desired learning outcome for all postsecondary students, regardless of their field of study. This issue is more difficult to resolve for the university sector than for the college sector. College programs are mandated by the Ministry of Training, Colleges and Universities (MTCU) to include the development of both “the vocational outcomes relevant to the particular industry, field of study, or profession” as well as “the applicable outcomes for essential employability skills and general education” (Ontario MTCU, 2005). A strong argument could be made that these essential employability skills should include numeracy skills. Indeed, MTCU’s own definition of essential employability skills includes numeracy, defined as the ability “to execute mathematical operations accurately” (2009a).

Emphasizing Numeracy as an Essential Skill
Higher Education Quality Council of Ontario 20
Government guidelines in the university sector, however, are more general. The Ontario Qualifications Framework (OQF) contains discipline-specific criteria at the bachelor’s level, such as the ability to analyze and interpret information typical of a field of study (Ontario MTCU, 2009b). The relativism of the statement means that many students in non-quantitative areas could meet the guideline without developing numeracy skills, potentially graduating without having ever seen a number. It is interesting to contrast this situation with that of literacy (cf. Dion & Maldonado, 2013). The OQF dedicates a whole category to communication skills, making it easier to argue that some level of literacy skills would be developed in any postsecondary course of study. Numeracy, however, is embedded within other categories, such as those that deal with the development of discipline-specific research or data analysis skills, making it possible for students to meet these criteria in non-quantitative ways. With this in mind, the remaining sections of this report will ask what we know about the numeracy and math skills that students bring with them into Ontario’s colleges and universities. We begin with the college sector.
Numeracy in Ontario’s Colleges Many colleges in Ontario assess the math skills of incoming students admitted to certain courses of study. These data are often used within the institution to stream students into particular courses based on their level of proficiency. Serving primarily an institutional purpose, these data are not generally published or released publicly. The College Mathematics Project’s (CMP) access to and analysis of data concerning students’ performance in first-year college math courses therefore makes its work of particular interest. An initiative of the York-Seneca Institute for Mathematics, Science and Technology Education, the CMP began reporting annually in 2007. Its goals are to analyze the math achievement of first-year college students, especially in relation to their high school background. In 2007, the CMP examined the records of all students who entered a college diploma (and some certificate) program11 in the fall of 2006 at one of six participating Ontario colleges and who took a first-semester college math course (Schollen et al., 2008). The six participating colleges offered a total of 470 programs, 247 (53%) of which listed a first-semester math course. While only 6% of students in the applied arts took a first-semester math course, 73% of those in business programs, 87% of those in general education programs and 78% of those in technology programs did so, reflecting a need for strong math skills for graduates in these disciplines (Schollen et al., 2008). The CMP analyzes student achievement by categorizing math performance as either ‘good’ (grades of A, B, C, or ‘Pass’) or ‘at risk’ (grades of D or ‘Fail’). Data from 2007 showed that more students in applied arts programs (77%) had good grades, while fewer did in general education programs (59%) (Figure 2). Overall, two-thirds of students had good math grades in their first semester math courses, which means that the remaining third of students were at risk. It is interesting to note that these values are generally in line with those reported earlier for literacy based on data collected from a large college (Dion & Maldonado, 2013).12 It
11 “The CMP Data Collection Protocol called for the records of all students in postsecondary programs including Ontario College Diploma, Ontario College Advanced Diploma and Ontario College Certificate programs. The study did not include students enrolled in applied degree, Ontario graduate certificate or apprenticeship programs (as these programs have different admission and curriculum standards)” (Schollen et al., 2009, p. 15). 12 See also Schollen et al., 2009, p. 23: “From this analysis, we can see that 10.7% of all students received an A grade in both Mathematics and English and 12.3% failed both, and that a relationship appears to exist between achievement in the two subject areas.” “Overall, the CMP found that, when withdrawals are also included, 53.2% of all students received “good grades” in both Mathematics and English while 20.7% were “at risk” in both. There is evidently a significant group of students whose mathematics achievement was high and English achievement low – some immigrant communities might be represented here for example.”

Emphasizing Numeracy as an Essential Skill
Higher Education Quality Council of Ontario 21
is also worth noting that results varied considerably between participating colleges, with the percentage of students at risk in math ranging from 21 to 39% (Schollen et al., 2008). The CMP’s main finding from this analysis, not surprisingly, is that the “achievement of students in college mathematics courses is unacceptably low” (Schollen et al., 2008, p. 59). Figure 2: Math Achievement Overall and by Program Type at six Colleges, CMP 2007
Source: Schollen et al., 2008, p. 34
The CMP digs deeper into the data to make a number of other noteworthy observations. Over 30% of incoming students take preparatory or foundational mathematics courses, which are designed to strengthen the skills of students who do not perform at the college level upon admission. Recent graduates from Ontario high schools13 (ROGs) filled a disproportionate number of the seats in these classes. ROGs also achieved a lower proportion of A grades than did non-ROG students. CMP results also document the great variety of high school math backgrounds that students bring with them to college and the impact that the choice of high-school-level math courses can have on college-level performance. Beginning in grade 9, Ontario high school students are required to choose courses from either the applied or academic stream. The Ontario secondary school math curriculum includes 16 different math courses – three in each of grades 9 and 10, four in grade 11 and six in grade 12 – an “unusually large number” according to the CMP (Schollen et al., 2009, p. 44). Students are required to take three credits in math to earn their OSSD, and many postsecondary programs require four credits or more. This allows for a great variety in mathematical preparation from grade 9 to graduation (Schollen et al., 2009). Given this, the CMP is particularly interested in the correlation between math pathways through high school and college math achievement. For example, data from 2007 suggest that 71.7% of students with grade 9 or
13 Defined as students under the age of 23 who had completed high school in Ontario.
All programs Applied arts Business General TechnologyGood grades 66 77 66 59 66At risk 34 23 34 41 34
0
10
20
30
40
50
60
70
80
90
100
Perc
enta
ge
Good grades
At risk

Emphasizing Numeracy as an Essential Skill
Higher Education Quality Council of Ontario 22
grade 10 academic math got good grades in college, while less than 48.7% of those with grade 9 or grade 10 applied math did so. Close to 50% of the students who took no math in grade 12 still managed to achieve good grades in college math. Overall, 2007 data suggest that while many students take lower-level courses in high school and do less well in college, a smaller number of students take more challenging high school math courses and reap the benefits in college, achieving greater math success (Schollen et al., 2008). The CMP’s findings are perhaps most remarkable in their consistency over time. While the project began with participation from a relatively small number of colleges, results changed little as the sample grew to include 11 institutions in 2008 and all 24 colleges in each year thereafter. With each iteration of data collection, the CMP team developed new areas of investigation and new research foci, opening up different perspectives on college student math achievement with each annual report. In 2008, data were gathered from incoming students who had taken a math course in their first semester in the fall of 2007 at 11 participating colleges. Mirroring results from 2007, 65% of students were found to be getting good grades in college math, while 35% were at risk. Non-ROGs once again performed better, with 71% getting good grades compared to 62% for ROGs. While male enrolment in programs containing math was much higher than female enrolment, women generally performed better than men in both the ROG and non-ROG groups. CMP data from 2008 also corroborate some of the 2007 findings concerning pathways through high school math, as students with academic math in grades 9 and 10 did considerably better than students with applied math. Discussion of the pathways results at the CMP’s annual forum generated complaints that “students often choose courses in which they believe they will score high marks in order to achieve a high overall GPA,” rather than courses that may challenge them and better prepare them for their postsecondary course of study (Schollen et al., 2009, p. 30). Also mentioned was the fact that high school teachers and college instructors rarely if ever talk to each other, keeping students’ level of math preparation a mystery to the latter and the specific requirements of the college curriculum unknown to the former. 2009 marked the first year in which all of Ontario’s colleges participated in the CMP. Despite this, findings remained in line with the previous year. Some 67% of students received good grades in first-semester math in college, while 33% were at risk. An analysis of the evolution in student performance among the six colleges that had participated in the CMP since the first round in 2007 also showed only a very small change in grades. While males outnumbered females in math-intensive programs, females earned better grades, and this was found to be true for all age groups. Non-ROGs again had better grades on average than ROGs. A new category was created to capture the performance of “very recent Ontario graduates” (VROGs), students who had taken a grade 12 math course in fall 2007 or later and therefore would have experienced the revised mathematics curriculum for grades 9 to 12. These were treated as a subset of the ROG population and made up quite a large portion of that group, having chosen math-intensive college programs at a higher rate than their predecessors (Orpwood et al., 2010). Another analysis of the existence of preparatory or foundations courses in college math found them to be concentrated largely in the Greater Toronto Area (GTA), with other colleges opting for alternative strategies to support students, such as remedial modules, peer tutoring and additional tutorial classes (Orpwood et al., 2010). Also noted was the increasing existence of foundations programs, year-long certificate programs for students who lack the required preparation for their desired course of study or who wish to determine their suitability for a particular field. By 2010, over 94,000 students in 2,559 programs at all 24 colleges were participating in the CMP (Orpwood et al., 2011). 68.6% of students were found to be receiving good grades in first-year college math courses, representing an increase from 67% in 2009 and 64.6% in 2008. Males, largely due to their higher enrolment in

Emphasizing Numeracy as an Essential Skill
Higher Education Quality Council of Ontario 23
technology programs, made up the majority of students in first-year math programs, though females continued to outperform them. Non-ROGs, this time including Second Career students, also outperformed ROGs. The latest round of CMP data was published in 2012 and collected in 2011 from students who began college in 2010 (Orpwood et al., 2012). 67.6% of students got good grades (Figure 3), a slight decline over the previous year that drew the CMP’s attention:
Considering the efforts that have been made over the past three years by both secondary schools and colleges to enhance student success, this apparent lack of improvement is somewhat disappointing. It suggests that either we have not yet identified those factors that most influence mathematics achievement in college programs or that these contributing factors are very resistant to change. At the very least, it suggests that the ultimate goals of the CMP – to improve college mathematics achievement significantly – have yet to be reached. (Orpwood et al., 2012, p. 21)
Figure 3: Math Achievement Overall and by Program Type, 24 Ontario Colleges, CMP 2008-2010
Source: Orpwood et al., 2012, p. 21
Past years’ findings about gender and age again held true, with women outperforming men and older students, especially those in their 30s and 40s, outperforming younger students. In addition to documenting the generally low level of skill that students bring with them into college-level math courses, with roughly one-third of students performing poorly, the CMP’s pathways analysis can also help us to better understand the development of these skills. For example, in studying the alignment between the high school curriculum and the expectations of college instructors, it was determined that many of the at-risk
All programs Applied arts Business General TechnologyFall 2008 67.0 74.8 64.8 65.2 67.8Fall 2009 68.6 77.1 67.2 64.7 69.5Fall 2010 67.6 78.1 64.2 65.7 68.0
0.0
10.0
20.0
30.0
40.0
50.0
60.0
70.0
80.0
90.0
Perc
enta
ge R
ecei
ving
Goo
d G
rade
s
Fall 2008 Fall 2009 Fall 2010

Emphasizing Numeracy as an Essential Skill
Higher Education Quality Council of Ontario 24
students observed by the CMP “have inadequate understanding of concepts that were first taught in elementary school – key concepts such as fractions, ratio and proportion, and percentages, among others” (Orpwood et al., 2010, p. 7; see also Orpwood et al., 2012, p. 50 (Table 22)), suggesting the possibility of a broader systemic issue with math instruction. The CMP expands on this using the example of fractions:
The concept of fractions is introduced and developed gradually in Grades 1 through 3, with a major emphasis on the nature of fractions in Grade 4. Following consolidation and elaboration of this in Grades 5 and 6, operations on and with fractions (such as addition, subtraction, multiplication, and division) are taught in Grades 7 and 8. The secondary mathematics curriculum only refers to fractions three times in Grades 9 and 10, all in the context of solving problems and equations involving their use, and not at all in Grades 11 and 12. Clearly, there are two grades (7 and 8) during which the key operations using fractions are expected to be learned. (Orpwood et al., 2012, p. 54)
A student who does not sufficiently assimilate the concept in grades 7 and 8, however, may carry this deficit through to PSE. While college admission requirements for math are usually framed in terms of grade 11 or grade 12 credits, the CMP also notes the importance of grade 9 and 10 courses, highlighting that they too need to be considered as fundamental to the development of students’ skills and reflective of the abilities they bring to PSE (Orpwood et al., 2012). Furthermore, the CMP has identified “a much more intensive emphasis on mathematical skills in college courses than is the case at the secondary school level” (Orpwood et al., 2011, p. 6), further strengthening the need for students to develop highly proficient skills for success at the college level. In addition to simply absorbing course material, the CMP also emphasizes repeatedly the importance of teaching students learning skills – the ability to study, learn and integrate knowledge more effectively – for success in the intensive PSE environment. It may be the strength of these skills, seasoned over time and strengthened on the labour market, that allows both older students in general and Second Career students in particular to outperform younger students in first-semester mathematics courses (Orpwood et al., 2010). The CMP’s various conclusions over the years have also led to a series of recommendations, including the following:
1. High school students should select math courses that are appropriate to their PSE goals rather than those in which they expect a high mark.
2. High schools and high school teachers should place equal value on colleges as they do on universities as PSE destinations.
3. Colleges should design a common mathematics assessment tool to evaluate incoming students and facilitate student support (Schollen et al., 2008; Orpwood et al., 2011).
4. Parents and teachers should stress the importance of learning skills and support students in their development (Schollen et al., 2009; Orpwood et al., 2010).
5. The province of Ontario requires a comprehensive numeracy strategy, one that could include the implementation of a grade 10 numeracy assessment similar to the Ontario Secondary School Literacy Test and the use of a numeracy test for teacher candidates (Orpwood et al., 2012).
Finally, and critical to this discussion, the CMP’s findings remind us of the critical distinction between math and numeracy. It is helpful here to view numeracy much like literacy, rather than like the “math” that we traditionally know. Numeracy skills, like literacy skills, cannot be learned in high school and shelved

Emphasizing Numeracy as an Essential Skill
Higher Education Quality Council of Ontario 25
indefinitely; they must be exercised regularly to remain strong (Orpwood et al., 2012). In this same way, it is not helpful to continue viewing numeracy as a discrete part of a curriculum. Like literacy, numeracy “is a context-based rather than a discipline-based set of abilities” which “can be developed in the context of music, art and drama, through history and geography, even sometimes in the study of literature as well as through mathematics and science subjects” (Orpwood et al., 2012, p. 66). While teaching math, especially in its advanced forms, is appropriately limited to STEM fields, numeracy is an essential skill whose integration is required in all disciplines. An English major hired to work in communications, for example, still requires the ability to understand and discuss the economic implications of the policy being communicated, even if he or she is not responsible for deriving them in detail. Yet the CMP data also tell us that even in the college sector, whose mandate is built around the development of essential employability skills such as numeracy, many students are still not required to take math classes as part of their programs of study. While this is not in itself problematic, keeping in mind the distinction between numeracy and math, it should lead us to reflect more carefully on how the development of numeracy skills is built into non-mathematical areas of study.
Numeracy in Ontario’s Universities While many colleges collect data internally on incoming students’ math skills, the strength of these skills at the time of graduation is still in doubt. There is no exit testing to pair with the entrance testing that exists in many college programs. How many of the one-third of college students who are at risk in their first-year college courses complete their credential and meet the expected math standard? We have no clear data with which to answer this question. This lack of data is even more acute in the university sector. In the case of literacy, we could point to a few exemplary institutions that were assessing the skills of incoming students or that were requiring students to pass a proficiency exam before graduation, thereby certifying some degree of competency in all graduates (Dion & Maldonado, 2013). With numeracy, however, no such wide-ranging assessments seem to exist in Ontario’s universities, giving institutions little idea of the skills students possess upon arrival beyond those indicated by high school transcripts. This information may be even more problematic given the wide array of pathways that students can take through the high school math curriculum. Furthermore, as discussed earlier, the place of numeracy in university curriculum guidelines is hardly clear. While the OQF gives communication skills their own category, numeracy is only referenced in the context of discipline-specific analyses, and the Ontario Council of Academic Vice-Presidents’ (OCAV) University Degree Level Expectations (UDLEs) mention “the ability to review, present and critically evaluate qualitative and quantitative information” to a variety of different ends (OCAV, 2007). This makes clear the central role of strong math skills in math-intensive disciplines such as STEM but says little about the importance of numeracy skills for those in other fields of study. Given the lack of public institutional sources, concerns about declining numeracy skills among the population of students entering Ontario’s universities can only be corroborated by isolated groups of data, many of which deal with the math skills of students entering math-intensive disciplines rather than with the abilities of the student population as a whole. Some studies performed at British universities have tracked the declining math skills of incoming psychology undergraduates over a 10-year period, but these students are products of a very different school system (Mulhern & Wylie, 2004; 2005). The Canadian Council on Learning cites the results of one math exam used to assess the preparedness of incoming students in the Faculty of Engineering at the University of Waterloo that ran from 1991 to 1996. It tested 4,000 first-year students and found a slight decline

Emphasizing Numeracy as an Essential Skill
Higher Education Quality Council of Ontario 26
in performance over time (CCL, 2005). Many faculty members in math-intensive departments also keep their own data on student performance, but these are rarely published or made public. Perhaps the best indication of an issue with incoming students’ skills is the existence of strategies that universities have adopted to address the problem and ensure that students have the math skills they need to succeed. To prepare students for a new curriculum that will stress writing and math skills in all disciplines and programs, Simon Fraser University in British Columbia requires new applicants to have a minimum grade of either 70 or 80% in grade 12 math, depending on the faculty to which they are applying. As in Ontario’s college sector, students who do not meet these criteria may be required to take a foundations course (Tamburri, 2005). The University of Toronto, for its part, runs math camps for students over the March and summer breaks and has created a math outreach department that offers free monthly workshops to math teachers on teaching math effectively. It has also added material to first-year math courses to review key high school math topics and has created a catch-up course for incoming students (Brown & Rushowy, 2013). McMaster University has done much of the same, offering two fall courses that review grade 12 math, even using grade 12 textbooks, to prepare students for university-level calculus (Brown & Rushowy, 2013). Again comparing to literacy, the most interesting element that emerges is not the general lack of data, which was also the case for literacy skills, but rather its different source. Those few institutions that assessed incoming literacy skills did so on a large scale, above the departmental level. With math, however, data collection is taking place on a smaller scale, instead involving departments or even faculty members who experience the challenge posed by students’ skill levels firsthand. This may change in the coming years with the expected launch of a University Math Project to mirror the work of the College Math Project in the university sector.
Conclusions The first conclusion that flows from this investigation concerns the need to take numeracy seriously as an essential skill, especially in non-STEM fields. Here, the parallel with literacy is particularly revealing, as it becomes clear that the two skills are treated quite differently. While literacy is spread throughout the curriculum, both in high school and in PSE, numeracy is too often reduced to “math” and segregated in particular courses. While college and university students can be expected to develop their literacy skills regardless of their area of study, students in non-STEM fields often have very limited interactions with numeracy skills in the pursuit of their postsecondary credential. Yet both numeracy and literacy are defined as essential skills by ESDC, by the Government of Ontario and by the OECD. Students’ skills would benefit from seeing numeracy incorporated into curricula as broadly as literacy has been. It is important here to keep in mind the distinction that has been made between numeracy and math skills and the different standards that accompany each. We do not mean to suggest that an everyday standard of numeracy requires individuals to be comfortable with postsecondary-level math. One might argue that these advanced skills are quite rightly reserved for those students who would pursue STEM careers. However, the option for non-STEM students to disengage entirely from numeracy during PSE can allow their skills to atrophy. Ultimately, the standard to be pursued here is the OECD’s and is set at the level of skill required to complete everyday tasks. The second conclusion is more particular to math skills and concerns the lack of data that institutions collect on the skills that students bring with them to PSE, which makes it difficult to verify faculty complaints regarding students’ abilities. EQAO results suggest a considerable disparity in math skills between those students who take applied-stream math courses in high school and those who take academic-stream math

Emphasizing Numeracy as an Essential Skill
Higher Education Quality Council of Ontario 27
courses. While many applied-stream students will choose to attend college and many academic-stream students will choose to attend university, both types of institutions receive students from each category, resulting in a range of skill levels upon admission. Finally, PISA results similarly point to declining math proficiency at age 15, with fewer students scoring at the top levels and a greater number of students failing to meet the level 3 standard. If this trend bears itself out into the last years of high school, it could point to declining skill levels in students applying to PSE as well. In this regard, the College Math Project sets itself apart as the most telling source of data concerning incoming college students’ math abilities. The CMP documents the many pathways that students can take through the high school math curriculum, resulting in even greater variety of skill levels upon PSE admission. Overall, roughly one-third of students who take a first-year math course in college are “at risk,” obtaining grades of D or less. CMP findings also confirm that, in the college sector at least, students who have taken academic math in grades 9 or 10 perform better in college-level math, with 71.7% of students with academic math getting good math grades in college and only 48.7% of students with applied math doing the same. Taken together, these data highlight the wide range of math skills that students bring with them to Ontario’s colleges and universities. When contrasted with the lack of information that institutions collect on incoming students’ math skills, this variety makes it difficult to ensure that students have the skills required to succeed in a math-intensive course of study and that the required supports are available to them. The third and final conclusion considers the benefits of a postsecondary education to students’ numeracy skills. Results from the OECD’s IALSS in 2003 and PIAAC in 2012 demonstrate that individuals with completed postsecondary credentials, especially university-level credentials, tend to have stronger numeracy skills. Among those who scored in the top numeracy proficiency levels in 2003, 33.6% had a university credential, compared to 17.7% with a non-university PSE credential and 11% with a high school diploma. While Canadians performed less well in the PIAAC numeracy assessment, with fewer scoring at level 5 and a greater number scoring at level 1, the link between strong numeracy skills and educational attainment remained. However, the percentage of respondents with a university credential who scored at levels 4 and 5 dropped from 33.6% in 2003 to 26.5% in 2012. The reason for this drop is not clear, nor is the nature of the link between educational attainment and numeracy skills. One might imagine a filter effect, for example, in which many of those students with the strongest math skills in high school are attracted to STEM fields in PSE, developing highly advanced mathematical proficiency and in turn performing very well on international assessments, while the numeracy skills of those in non-STEM fields might remain relatively stagnant. In this scenario, the change in numeracy performance could simply be explained by a drop in the number of students choosing STEM in PSE. Other analyses suggest that respondents with foreign university credentials contribute to this shift and that the performance of PIAAC respondents with university degrees improves greatly when those with foreign credentials are removed from the population. The fact remains that PIAAC captures respondents at any point in the life cycle, when their skills have already been influenced by other factors such as work and further training. PIAAC results do not present us with a pure measure of the value added of a postsecondary education. Also worthy of mention are the areas that have been bracketed or set aside for the purposes of this investigation. Much has been written, for example, about the influence of gender on the development of numeracy and math skills. While data to this effect have been presented throughout the report, they have not been analyzed or discussed to their fullest extent. Similarly, this report has not touched on the role of student choice in selecting STEM programs of study in PSE. Though clearly an issue with considerable economic repercussions, we have chosen to focus on the integration of numeracy skills throughout PSE rather than the development of specialized math skills typical to STEM. Finally, given HEQCO’s mandate in the area of

Emphasizing Numeracy as an Essential Skill
Higher Education Quality Council of Ontario 28
postsecondary education, this report has bracketed many important questions dealing with numeracy and math in high school. We would refer readers interested in these issues to the College Math Project’s series of reports, where pathways through high school math and other topics relevant to K-12 education are discussed in considerable detail. In light of the above conclusions, this report closes by making the following recommendations:
1) Numeracy should be treated like an essential skill on par with literacy. As a result, it should be integrated throughout postsecondary courses of study in Ontario’s colleges and universities, rather than isolated in math classes. In this manner, all students would be exposed to content that would further develop and enhance their numeracy skills, and this regardless of their major. Care should be taken to integrate numeracy in ways that are relevant to the course material and that aim for a level of skill development that corresponds to level 3 on the OECD’s scale for students in non-STEM fields and for another, higher standard for students in STEM fields.
2) Postsecondary institutions are tasked with teaching basic cognitive skills like numeracy and literacy in addition to discipline-specific skills. However, it is difficult to evaluate the direct effect of a postsecondary education on said skills given the information currently being gathered concerning students’ skill levels upon admission and graduation. This report recommends that postsecondary institutions begin assessing the numeracy skills of incoming and outgoing students to fill this data gap. While incoming information could also be used to ensure that the appropriate supports and provided for students as they begin their course of study, outgoing assessments will provide new information by which institutions might be held accountable to government and to the public on their performance in building graduates’ essential skills. Such assessment could be done in a variety of ways, from formal assessments such as exams to informal assessments using in-class assignments or portfolios.
Emphasizing Numeracy as an Essential Skill
Higher Education Quality Council of Ontario 29
References Alexander, C., & Bendiner, J. (2013). Canada’s Literacy and Numeracy Challenge Worsens. TD Economics
Special Report. Retrieved from http://www.td.com/document/PDF/economics/special/CanadaLiteracyAndNumeracyChallengeWorsens.pdf
Alphonso, C., & Morrow, A. (2013, August 8). Ontario teachers need better math training, minister says. The Globe and Mail. Retrieved from http://www.theglobeandmail.com/news/national/education/ontario-testing-shows-dip-in-student-math-skills-for-fifth-year-in-a-row/article13996303/
Audet, W., Barnes, M., Clegg, M., Heggie, L., Jamieson, D. G., Klinger, D. A., Levine, M. E., Martinussen, R., & Wade-Woolley, L. (2009). The Impact of the Literacy and Numeracy Secretariat: Changes in Ontario’s Education System. Canadian Language and Literacy Research Network. Retrieved from http://www.edu.gov.on.ca/eng/document/reports/ome_report09_en.pdf
Borwein, S. (2014). The Great Skills Divide. Toronto: HEQCO. Brochu, P., Deussing, M.-A., Houme, K., & Chuy, M. (2013). Measuring up: Canadian Results of the OECD
PISA Study, The Performance of Canada’s Youth in Mathematics, Reading and Science, 2012 First Results for Canadians Aged 15. Toronto: CMEC. Retrieved from http://cmec.ca/Publications/Lists/Publications/Attachments/318/PISA2012_CanadianReport_EN_Web.pdf
Brown, L. (2012, May 19). Growing number of Ontario college students need help in grade school math, study finds. Toronto Star. Retrieved from http://www.thestar.com/life/parent/2012/05/19/growing_number_of_ontario_college_students_need_help_in_grade_school_math_study_finds.html
Brown, L., & Rushowy, R. (2013, December 2). The math problem: How educators want to improve skills of students, teachers. Toronto Star. Retrieved from http://www.thestar.com/yourtoronto/education/2013/12/02/the_math_problem_how_educators_want_to_improve_skills_of_students_teachers.html
Bussière, P., Cartwright, F., & Knighton, T. (2004). Measuring up: Canadian Results of the OECD PISA Study, The Performance of Canada’s Youth in Mathematics, Reading, Science and Problem Solving, 2003 First Findings for Canadians Aged 15. Ottawa: Statistics Canada. Catalogue no. 81-590-XPE. Retrieved from http://www.statcan.gc.ca/pub/81-590-x/81-590-x2004001-eng.pdf
Bussière, P., Cartwright, F., Crocker, R., Ma, X., Oderkirk, J., & Zhang, Y. (2001). Measuring up: The Performance of Canada’s Youth in Reading, Mathematics and Science. Ottawa: Statistics Canada. Catalogue no. 81-590-XPE. Retrieved from http://www.statcan.gc.ca/pub/81-590-x/81-590-x2000001-eng.pdf
Bussière, P., Knighton, T., & Pennock, D. (2007). Measuring up: Canadian Results of the OECD PISA Study, The Performance of Canada’s Youth in Science, Reading and Mathematics, 2006 First Results for Canadians aged 15. Ottawa: Statistics Canada. Catalogue no. 81-590-XPE, no. 3. Retrieved from http://www.pisa.gc.ca/eng/pdf/81-590-E.pdf
Canadian Chamber of Commerce (2012). Canada’s Skills Crisis: What We Heard. Ottawa: Author. Retrieved from http://bibliotheque.copian.ca/ajout/10854
Canadian Council on Learning (2005). Lessons in Learning: Do students entering university have the basic writing and math skills they need? Ottawa: CCL. Retrieved from http://www.ccl-cca.ca/pdfs/LessonsInLearning/Oct-28-05-Do-students-entering-university.pdf
Canadian Council on Learning (2006). Canadian Post-Secondary Education: A Positive Record – An Uncertain Future. Ottawa: CCL. Retrieved from http://www.ccl-cca.ca/pdfs/PSE/2006/PSEReport2006EN.pdf
Canadian Council on Learning (2007). State of Learning in Canada: No Time for Complacency. Ottawa: CCL. Retrieved from http://www.ccl-cca.ca/pdfs/SOLR/2007/NewSOLR_Report.pdf

Emphasizing Numeracy as an Essential Skill
Higher Education Quality Council of Ontario 30
Charbonneau, L. (2014). A second look at Canada’s adult literacy and numeracy skills. University Affairs. Retrieved from http://www.universityaffairs.ca/margin-notes/a-second-look-at-canadas-adult-literacy-and-numeracy-skills?utm_source=newsletterfeb2614&utm_medium=email&utm_content=mn_literacy&utm_campaign=ataglanceEN
Conference Board of Canada (2013). The Need to Make Skills Work: The Cost of Ontario’s Skills Gap. Ottawa: Author. Retrieved from http://www.conferenceboard.ca/temp/251f67d4-a2fa-4d32-81c5-77b1dbec11f1/14-032_skillsgap_rpt.pdf
Council of Ministers of Education, Canada (2013). International Report Shows Canadians are Adapting to the Digital Skills Era. Press release. Retrieved from http://cmec.ca/278/Press-Releases/Press-Releases-Detail/International-Report-Shows-Canadians-are-Adapting-to-the-Digital-Skills-Era.html?id_article=758
Dion, N., & Maldonado, M. (2013). Making the Grade? Troubling Trends in Postsecondary Student Literacy. Toronto: Higher Education Quality Council of Ontario. Retrieved from http://www.heqco.ca/SiteCollectionDocuments/HEQCO%20Literacy%20ENG.pdf
Education Quality and Accountability Office (2004). Trends in International Mathematics and Science Study, 2003 Ontario Report. Toronto: Queen’s Printer. Retrieved from http://www.eqao.com/pdf_e/04/04p044e.pdf
Education Quality and Accountability Office (2009). Trends in International Mathematics and Science Study (TIMSS), 2007, Ontario Results Report. Toronto: Queen’s Printer. Retrieved from http://www.eqao.com/pdf_e/08/TIMSS_Ontario_Report_2007.pdf
Education Quality and Accountability Office (2012a). 21st Century Skills. Toronto: Queen’s Printer. Retrieved from http://www.eqao.com/ProvincialReport/.%5CFiles%5C12%5CPDF/EQAO_PR_910e_21_CenturySkills_0912_Web.pdf
Education Quality and Accountability Office (2012b). Trends in International Mathematics and Science Study (TIMSS) 2011, Ontario Report. Toronto: Queen’s Printer. Retrieved from http://www.eqao.com/pdf_e/12/TIMSS_Ontario_Report_2011.pdf
Education Quality and Accountability Office (2013a). EQAO’s Provincial Secondary School Report: Results of the Grade 9 Assessment of Mathematics and the Ontario Secondary School Literacy Test, 2012-2013. Toronto: Queen’s Printer. Retrieved from http://www.eqao.com/ProvincialReport/Files/13/PDF/ProvincialReport_Secondary_en_2013.pdf
Education Quality and Accountability Office (2013b). Grade 9 Assessment of Mathematics: Results at a Glance. Retrieved from http://www.eqao.com/ProvincialReport/.%5CFiles%5C13%5CPDF/EQAO_PR_9e_ResultsGlance_0913_Web.pdf
Education Quality and Accountability Office (2014). Highlights of the Provincial Results, Grade 9 Assessment of Mathematics and Ontario Secondary School Literacy Test (OSSLT), English-Language Students, 2013-2014. Retrieved from http://www.eqao.com/pdf_e/14/provincial-report-highlights-secondary-2014.pdf
Essential Skills Ontario (2012). Literacy and Essential Skills in Ontario. Toronto: Author. Retrieved from http://www.essentialskillsontario.ca/sites/www.essentialskillsontario.ca/files/Literacy%20and%20Essential%20Skills%20in%20Ontario_Final2_0.pdf
Finnie, R., & Meng, R. (2006). The Importance of Functional Literacy: Reading and Math Skills and Labour Market Outcomes of High School Drop-outs. Ottawa: Statistics Canada. Catalogue no. 11F0019MIE, no. 275.
Friesen, S. (2003). Numeracy and Beyond: Developing a Mathematical Habit of Mind in K-12. Calgary: Galileo Educational Network. Retrieved from http://www.galileo.org/research/publications/beyond_numeracy.pdf

Emphasizing Numeracy as an Essential Skill
Higher Education Quality Council of Ontario 31
Government of Ontario (2004). Leading Math Success: Mathematical Literacy, Grades 7-12. The Report of the Expert Panel on Student Success in Ontario. Toronto: Queen’s Printer. Retrieved from http://www.edu.gov.on.ca/eng/document/reports/numeracy/numeracyreport.pdf
Government of Ontario (2014, January 8). New Math Supports and Resources for the Classroom. Press release. Retrieved from http://news.ontario.ca/edu/en/2014/01/new-math-supports-and-resources-for-the-classroom.html
Hango, D. (2013a). Gender Differences in Science, Technology, Engineering, Mathematics and Computer Science Programs at University. Ottawa: Statistics Canada. Catalogue no. 75-006-X. Retrieved from http://www.statcan.gc.ca/pub/75-006-x/2013001/article/11874-eng.pdf
Hango, D. (2013b). Ability in Mathematics and Science at Age 15 and Program Choice in University: Differences by gender. Ottawa: Statistics Canada. Catalogue no. 81-595-M, no. 100. Retrieved from http://www.statcan.gc.ca/pub/81-595-m/81-595-m2013100-eng.pdf
Human Resources and Skills Development Canada & Statistics Canada (2005). Building on our Competencies: Canadian Results of the International Adult Literacy and Skills Survey, 2003. Ottawa: Statistics Canada. Catalogue no. 89-617-XIE. Retrieved from http://www.statcan.gc.ca/pub/89-617-x/89-617-x2005001-eng.pdf
Kershaw, A. (2010, September 13). Big drop in math skills on entering students. University Affairs. Retrieved from http://www.universityaffairs.ca/big-drop-in-math-skills-of-entering-students.aspx
Knighton, T., Brochu, P., & Gluszynski, T. (2010). Measuring up: Canadian Results of the OECD PISA Study, The Performance of Canada’s Youth in Science, Reading and Mathematics, 2009 First Results for Canadians aged 15. Ottawa: Statistics Canada. Catalogue no. 81-590-XPE, no. 4. Retrieved from http://www.statcan.gc.ca/pub/81-590-x/81-590-x2010001-eng.pdf
Let’s Talk Science (2013). Spotlight on Science Learning: The high cost of dropping math and science. Streetsville, ON: Amgen Canada. Retrieved from http://www.letstalkscience.ca/images/SpotlightOnScienceLearning-2013.pdf
Manley, J. (2013, November 28). Jobs, skills and opportunities: Strengthening Canada’s human capital advantage. Speech delivered to the Canadian Club of Toronto. Retrieved from http://www.ceocouncil.ca/wp-content/uploads/2013/12/John-Manley-Remarks-to-the-Canadian-Club-of-Toronto-Nov-28-2013-UPDATED-6DEC2013.pdf
Mulhern, G., & Wylie, J. (2004). Changing levels of numeracy and other core mathematical skills among psychology undergraduates between 1992 and 2002. British Journal of Psychology, 95, 355-370.
Mulhern, G., & Wylie, J. (2005). Mathematical prerequisites for learning statistics in psychology: Assessing core skills of numeracy and mathematical reasoning among undergraduates. Psychology Teaching and Learning, 5(2), 119-132.
Munro, D. (2014). We have the credentials, but do we have the skills? Ottawa: Conference Board of Canada. Retrieved from http://www.conferenceboard.ca/topics/education/commentaries/14-02-24/we_have_the_credentials_but_do_we_have_the_skills.aspx
OECD (2013). OECD Skills Outlook: First Results from the Survey of Adult Skills. Paris: Author. Retrieved from http://www.oecd-ilibrary.org/education/oecd-skills-outlook-2013_9789264204256-en
OECD & Statistics Canada (2011). Literacy for Life: Further Results from the Adult Literacy and Life Skills Survey. Ottawa: Statistics Canada. Catalogue no. 89-604-XWE-2011001. Retrieved from http://www.statcan.gc.ca/pub/89-604-x/89-604-x2011001-eng.pdf
Ontario Council of Academic Vice-Presidents (2007). Guidelines for University Degree Level Expectations. Toronto: Council of Ontario Universities. Retrieved from http://www.cou.on.ca/publications/reports/pdfs/university-undergraduate-degree-level-expectations
Ontario Ministry of Education (2005). The Ontario Curriculum, Grades 9 and 10: Mathematics. Toronto: Queen’s Printer. Retrieved from http://www.edu.gov.on.ca/eng/curriculum/secondary/math910curr.pdf
Ontario Ministry of Education (2007). The Ontario Curriculum, Grades 11 and 12: Mathematics. Toronto: Queen’s Printer. Retrieved from http://www.edu.gov.on.ca/eng/curriculum/secondary/math1112curr.pdf

Emphasizing Numeracy as an Essential Skill
Higher Education Quality Council of Ontario 32
Ontario Ministry of Training, Colleges and Universities (2005). Framework for Programs of Instruction. Retrieved from http://www.accc.ca/ftp/es-ce/MTCUCollegeFramework.pdf
Ontario Ministry of Training, Colleges and Universities (2009a). Essential employability skills. Retrieved from http://www.tcu.gov.on.ca/pepg/audiences/colleges/progstan/essential.html
Ontario Ministry of Training, Colleges and Universities (2009b). Ontario Qualifications Framework. Retrieved from http://www.tcu.gov.on.ca/pepg/programs/oqf/
Orpwood, G., Schmidt, B., & Jun, H. (2012). Competing in the 21st Century Skills Race. Toronto: Canadian Council of Chief Executives. Retrieved from http://www.ceocouncil.ca/wp-content/uploads/2012/07/Competing-in-the-21st-Century-Skills-Race-Orpwood-Schmidt-Hu-July-2012-FINAL.pdf
Orpwood, G., Schollen, L., Leek, G., Marinelli-Henriques, P., & Assiri, H. (2011). College Mathematics Project 2010: Final Report. Toronto: Seneca College of Applied Arts and Technology. Retrieved from http://collegemathproject.senecac.on.ca/cmp/en/pdf/FinalReport/2010/CMP%202010%20Final%20Report%20-%20English.pdf
Orpwood, G., Schollen, L., Leek, G., Marinelli-Henriques, P., & Assiri, H. (2012). College Mathematics Project 2011: Final Report. Toronto: Seneca College of Applied Arts and Technology. Retrieved from http://collegemathproject.senecac.on.ca/cmp/en/pdf/FinalReport/2011/CMP_2011_Final_Report%20-%2002Apr12%20pmh.pdf
Orpwood, G., Schollen, L., Marinelli-Henriques, P., & Assiri, H. (2010). College Mathematics Project 2009: Final Report. Toronto: Seneca College of Applied Arts and Technology. Retrieved from http://collegemathproject.senecac.on.ca/cmp/en/pdf/FinalReport/2009/CMP_2009_Annual_Report_Final%20-%2009Mar10%20pmh.pdf
Parsons, S., & Bynner, J. (1997). Numeracy and employment. Education + Training, 39(2), 43-51. Simon, B. (2013). Skills development in Canada: So much noise, so little action. Ottawa: Canadian Council of
Chief Executives. Retrieved from http://www.ceocouncil.ca/wp-content/uploads/2013/12/Bernard-Simon-December-2013.pdf
Schollen, L., Orpwood, G., Byers, P., Sinclair, M., & Assiri, H. (2008). College Mathematics Project 2007: Final Report. Toronto: Seneca College of Applied Arts and Technology. Retrieved from http://collegemathproject.senecac.on.ca/cmp/en/pdf/CMP2007_Final_Report_19Feb08.pdf
Schollen, L., Orpwood, G., Sinclair, M., & Assiri, H. (2009). College Mathematics Project 2008: Final Report. Toronto: Seneca College of Applied Arts and Technology. Retrieved from http://collegemathproject.senecac.on.ca/cmp/en/pdf/CMP2008_Final_Report_for_Release_16Mar09.pdf
Statistics Canada, ESDC & CMEC (2013). Skills in Canada: First Results from the Programme for the International Assessment of Adult Competencies (PIAAC). Ottawa: Statistics Canada. Catalogue no. 89-555-X2013001. Retrieved from http://www.statcan.gc.ca/pub/89-555-x/89-555-x2013001-eng.pdf
Tamburri, R. (2005, November 7). Some universities tighten admission standards. University Affairs. Retrieved from http://www.universityaffairs.ca/some-universities-tighten-admission-standards.aspx