Embed Size (px)
Citation preview

Empirical Analysis of Determinants of Stock Market Capitalisation 221Asian-African Journal of Economics and Econometrics, Vol. 16, No. 2, 2016: 221-240
EMPIRICAL ANALYSIS OF DETERMINANTS OF STOCKMARKET CAPITALISATION: THE CASE OF BOTSWANA
STOCK EXCHANGE 2005-2012
Amantle Baleseng*, James S. Juana** and Gladys Gamariel***
Abstract: This study explores the interactions between macroeconomic and financial determinantsof stock market capitalization for the Botswana Stock Exchange using monthly data over theperiod January 2005 to December 2012. The study employs the VECM approach to investigatethe short run relationships among the variables, cointegration tests to establish any existence oflong run relationship between the variables, and further examines the dynamic interactionsamong the variables using variance decomposition and the impulse response function. Theresults suggest that interest rates, and money supply contribute positively and significantly tostock market capitalization. Contractual savings adjust in the short run to push stock marketcapitalization to equilibrium in the long run, while the interest rates adjust in the short run topush stock market capitalization into further disequilibrium in the long run. Granger Causalityanalysis suggests existence of one way causality from market capitalization to contractual savingsand industrial production index; real exchange rate indices to market capitalization, contractualsavings, and industrial production index. Furthermore, a bi-directional causality exists betweenmarket capitalization and industrial production index, as well as between contractual savingsand industrial production index. Finally, simulation results from variance decomposition andimpulse response show that stock market capitalization has stronger dynamic interactions withreal exchange rate indices, money supply, and industrial production index. This study recommendsthat monetary authorities maintain short term interest rates at levels supportive of monetarypolicy, and pursue policies that encourage contractual savings to be channelled to the BotswanaStock Exchange so as to increase the supply of investment funds by institutional investors.
Key words: Market capitalisation, Vector Error Correction Model, Causality Tests, VarianceDecomposition, Impulse Response, Botswana Stock Exchange
INTRODUCTION
Since the 1990s, research on the extent to which stock market development impacts on economicgrowth has generated a considerable amount of debate amongst development economists, albeitwith little consensus. Several studies, for instance, Akinlo and Akinlo (2009), Adjasi and Biekpe
* Department of Economics, University of Botswana, P/Bag UB00705, Gaborone, Botswana** Corresponding author: Department of Business, Management & Entrepreneurship, Botswana International
University of Science and Technology (BIUST), P/Bag 16 Palapye, Botswana, E-mail:[email protected] / [email protected]
*** Department of Business, Management & Entrepreneurship, Botswana International University of Scienceand Technology (BIUST), P/Bag 16, Palapye, Botswana

222 Amantle Baleseng, James S. Juana and Gladys Gamariel
(2006), Bekaert et al. (2005), Bodie et al., (2004), as well as Levine and Zervos (1998), havefound a positive relationship between different measures of capital market development andeconomic growth. Such findings are important in addressing policy concerns in developingeconomies, characterised by non-existent or comparatively underdeveloped stock markets, likeBotswana. While considerable attention has been given to the question of whether stock marketspromote growth in academic and policy discussions, research on the determinants of stockmarket development in developing countries is limited. This study seeks to fill in this gap inliterature.
The overwhelming empirical evidence in support of the stock market development-economic growth nexus has led to most developing countries increasing efforts in establishingand strengthening their stock markets. In most African countries, stock market developmenthas been central to the domestic financial liberalisation programs. Botswana has not been anexception. However, concerns on the extent to which developing countries benefit from suchstock market development still exist (Yartey and Adjasi, 2007; Singh, 1999). These concernshave raised some policy questions broadly centred on how developing countries, such asBotswana can reap the benefits of stock market development, given the surge in stock marketsover the past two decades. Consequently, an empirical analysis of the major determinants ofstock market development is discernible.
Market capitalisation, defined as the aggregate valuation of a company based on its currentshare price and the total number of outstanding stocks, has been used widely in literature as ameasure of stock market development (see for instance, Billmeier and Massa, 2009; Cherifand Gazdar, 2010; and Yartey, 2007, 2008). Figure A1 in the Appendix indicate that theBotswana Stock Exchange (BSE) has recorded good and consistent performances in termsmarket capitalisation, domestic, as well as foreign indices since its inception in 19941. Thelevel of market capitalisation in 1991 was 6.6% and by 1999 it had reached 19.2% of GDP, anincrease of about 3 times its 1991 level. Furthermore, market capitalisation grew nine-foldfrom about P9.4 billion (25% of GDP) in 2003 to P49.9 billion (34.3% of GDP) in 20152. TheDomestic Company Index (DCI) and Foreign Company Index (FCI) also made positive strideswith the DCI appreciating by 74 percent in 2006, the highest growth recorded in DCI since2003. Similarly, the FCI appreciated by 57.3 percent compared to 78 percent in 2005 (BotswanaStock Exchange, 2006) The DCI and FCI recorded negative growth in 2008 following thefinancial crisis. DCI depreciated by 16.5 percent compared to an appreciation of 74.1 percentand 35.9 percent in 2006 and 2007 respectively, The FCI fell 45.8 percent below the levelrecorded in 2007 (See figure A1 in the appendix). The banking sector recorded the largestimpact with a contribution of -9.5 percent, followed by financial services sector whichcontributed -5.7 percent to the decline of the company indices. Post 2008, both indices as wellas market capitalisation recorded positive growth, signalling possible recovery from the effectsof 2007 financial crisis.
Despite these remarkable stock market performances, the trends in economic growth indicatea general decline in both GDP per capita growth and annual GDP growth in recent years3.Figure A2 in the Appendix show that the economy recorded a decline in the annual growth rateof GDP from about 7% in 1990 to 2% in 2000, before recovering to 8.7% by 2008. The effects
Empirical Analysis of Determinants of Stock Market Capitalisation 223
of the 2007/08 financial crisis together with the 2008 global economic recession translated toa negative GDP growth rate of 7.7% in 2009. Despite an economic recovery in 2010 (GDPgrowth rate of 8.6%), the economy grew at an average of about 5.9% over the 2011 to 2014period, and recorded negative growth of 0.2% in 2015. Generally, the growth in marketcapitalisation is expected to be positively correlated with economic growth, but the trends inthe Botswana economy between 2005 and 2012 seem to suggest otherwise, with effects of thefinancial crises evident in both stock market and economic growth variables. This raises severalquestions, that this study seeks to answer. To what extend has the 2007/8 financial crisesaffected stock market development in Botswana? What are the plausible determinants of marketcapitalisation in the case of the BSE? An understanding of these determinants would shedmore light on the relationship between stock market development and the growth. In so doing,this study contributes to the available literature that strives to offer in depth analysis to factorsthat may enhance BSE performance and hence contribute to economic growth.
Most of the studies on determinants of market capitalisation have focused on cross countrydata. Furthermore, country level research on the performance of BSE is sparse. Mothobi (2012)analysed price process for BSE using microstructure theory. Similarly, Amanze (2009) examinesfirm specific factors such as business risk, institutional shareholders, financial leverage, etc.,on dividend policy. In line with our study, Buzwani (2007) took a more direct macroeconomicapproach towards analysing performance of the BSE for the period 1995 to 2005. The currentstudy differs from the study by Buzwani in two ways. First, unlike Buzwani (2007), we introduce,as explanatory variables, financial crisis and contractual saving variables. The latter variable,offers an insight into the problematic dominance of institutional investors who through theirbuy and hold strategy, may cause liquidity problems in the stock exchange. Second, our studyemploys high frequency monthly data for the period 2005 to 2012, thus covering the periodsbefore, during and after the 2007/8 financial crises. This enables us to examine the behaviourof factors determining the stock market capitalisation and the general impact of the financialcrises on the BSE. Finally, our study employs the VECM approach and also assesses the dynamicinteractions among the variables using variance decomposition and impulse response function.The available literature on the Botswana Stock Exchange has not employed such analysis inrelated studies. The rest of this paper is organised as follows. The next section gives an overviewof relevant literature. Section 3 focuses on methodological issues, while section four presentsan analysis of the empirical findings. Lastly, Section 5 presents the conclusion and policyimplications of the study.
2. RELATED STUDIES
This section is subdivided into; i) studies relating to the theory and ii) empirical studies
2.1. Theoretical literature
There are several financial theories in literature that can help explain the relationship betweendifferent economic fundamentals and market capitalization. The Dividend Discount Modelanalyses how risk factors such as interest rate variations and changes in inflation rates affectstocks. In this model, the value of common stock is given as the present value of future dividend

224 Amantle Baleseng, James S. Juana and Gladys Gamariel
stream in perpetuity assuming that the corporation will have a perpetual life in line with itscharter. If the value of a stock is equivalent to the value for a perpetual annuity with a constantlevel of payments, then mathematically;
DV
k� (1)
Where V is the stock value, D is the dividend per share and k is the percentage discount rate. Ifthe dividends are assumed to grow at a certain constant rate, then;
DV
k g�
� (2)
Where g is the annual constant percentage growth in dividends per share and D next year’sdividends. The model assumes constant growth rate for the corporation being analysed. Equation(2) provides a simplified means of analysing the determinants of stock value.
The higher the growth rate of the dividends, g, the greater the value of the corporation’sstock. The greater the risk of the corporation (as represented by higher discount rate, k) thelower the value of the stock. The implication is that the two determinants (dividend growthrate and risk factors) of stock value impacts positively and negatively on stock marketcapitalization respectively, through price of the stock.
Farell (1985) in developing duration models of common stock noted that high growth
stocks, characterised by low dividend yields (k-g), have longer durations d, � �1d k g� � and
are relatively more sensitive to changes in discount rate (k) (changes in k affects dividendyields). Since stocks have perpetual life and positive growth character, stocks have longerduration than bonds, which carry fixed maturity periods and no growth characteristics. Thereforestocks should be more responsive than bonds to changes in real interest rates and carry ahigher premium (through the discount rate). Thus, in equation (2) high interest rate risk increasesdividend yield and reduces value of stock. Furthermore, Modigliani (1971) and Mishkin (1977)point out that lower interest rates causes high capital inflows to the stock market with theexpectation of earning high returns, thereby increasing stock prices, while high interest ratespromotes savings in banks, leading to reduced flow of capital to the stock market, and hencelowering stock prices.
The Capital Asset Pricing Model (CAPM) and Arbitrage Pricing Theory Model (APT)both provide more micro-based information on macroeconomic variables. The APT wasoriginally developed by Ross (1976), initially assuming that investors had access to domesticsecurities only. The model suggest that stock prices can be influenced by a set of factors inaddition to the market (Madura, 2009). The model, and later backed by empirical investigationsproviding evidence that GDP, money supply, personal consumption, and petroleum prices andother factors can influence asset prices. The APT model is as follows;
0 1( ) mi i iE R F�� � � � � (3)
Empirical Analysis of Determinants of Stock Market Capitalisation 225
Where E(R) is the expected return of the asset, �0 is a constant, F
i .... F
m are values of
factors 1 to m, and �i is the sensitivity of the asset return to particular force. The model suggests
that in equilibrium, expected return on assets are linearly related to the covariance betweenasset returns and other factors. In light of the APT model, Madura (2009) reviews economicand firm specific factors that affect stock prices: economic growth, exchange rates, investorsentiments, industry sales forecasts, entry into the industry by new competitors, and pricemovements of the industry’s products. These factors are considered to impact on stock marketcapitalization through their impact on stock prices.
2.2. Empirical Studies
Several studies examined the effects of macroeconomic factors on stock market development.Ayub (2000) and Mugumisi (2008), using narrow money conclude that excess liquidity in themarket creates higher demand for shares in the market which in turn drives up the price ofshares and results in increased market capitalization. Other empirical studies used broad moneyand still find a positive relationship between money supply and stock market capitalisationusing a VECM framework (Muktadir-Al-Mukit, 2013; Rahman et al., 2009). However, Hussinet al., (2012) report a negative relationship between money supply and stock market possiblydue to the excessive money supply in the market causing inflation problems which in turnincrease the discount rate thereby causing a fall in share prices.
Addo and Sunzuoye (2013) estimated a VECM model on the joint impact of interest ratesand treasury bill rate on stock market returns on Ghana Stock Exchange and found that bothTreasury bill rate and interest rate were found to have a negative relationship with stock marketreturns. Similar results were reported by Akingunola, Adekunle, and Hammed (2012).
Other studies analysed the effects of real income on market capitalisation, arguing thatgrowing incomes increases companies’ expected cash flows which in turn pushes both stockprices and stock market capitalization up (Hussin et al., 2012; Billmeier and Massa, 2009;Garcia and Liu, 1999).
Several studies report negative and significant effect of exchange rate on stock prices(Tudor and Popescu-Dutaa, 2012; Hasan and Javed, 2009; Li and Huang, 2008; and Abdallaand Murinde , 1997). This is consistent with theory such that foreign demand for any givenlocal stock may be higher when the local currency is expected to strengthen, other things beingequal.
With respect to contractual savings, Catalan et al. (2000) used panel data to examine thecausal relationship between contractual savings and stock market development. The studyfinds evidence that countries with developed contractual savings sectors have more developedstock markets, both in terms of market capitalization and valued traded. Furthermore, Hu (2012)analyses the impact of Asian pension funds on selected key transmission mechanisms frompension reform to financial development using a panel error correction model and report astrong positive relationship between pension fund assets and market capitalization. In terms ofsavings which are not contractual, Garcia and Liu (1999) found that savings and investmentrates were good predictors of market capitalization.

226 Amantle Baleseng, James S. Juana and Gladys Gamariel
Regarding financial intermediation, Billmeier and Massa (2009), Mugumisi (2008) andGarcia and Liu (1999) found financial intermediary development to have a positive impact onstock market development and conclude that financial intermediation complements rather thansubstitutes stock market development. On the contrary, Buzwani (2007) found evidence ofnegative relationship between financial intermediary development and stock market growthfor the case of Botswana Stock Exchange.
Other factors that influence the level of stock market capitalization include taxation issues,and accounting standards (Garcia & Liu, 1999). Billmeier and Massa (2009) note that political,economic, social, and educational institutions may affect stock market development.
In sum, the surveyed literature points out to several macroeconomic, financial, andinstitutional factors that impact on the level of stock market capitalization. In terms of themethodologies, most country level studies employed the granger causality and vector errorcorrection models while cross-country studies used fixed effect panel regressions, panelregressions, and panel error correction models.
While previous studies have identified macroeconomic, financial, and institutional factorsas important determinants, none of the studies have examined the effects of the financial crisis,with specific reference to market capitalisation of the Botswana Stock exchange. This studytherefore seeks to fill this gap in the empirical literature. The results from this study will shedlight on factors such as contractual savings, money supply, exchange rate, market liquidity,real income and the impact of the recent global financial crisis on the level of stock marketcapitalization. In terms of methodology, the study will follow a VECM framework as has beencase for similar country level studies and further examines the dynamic interactions among thevariables using variance decomposition and the impulse response function.
3. METHODOLOGY
This section discusses the empirical model, description and measurement of variables, datarequirements and sources, and pre-estimation tests
3.1. Model Specification
This study tests the hypothesis that there exists a long run equilibrium relationship betweenstock market capitalization, and macroeconomic and financial factors. Specifically, the studyhypothesises that contractual savings, real gross domestic product, and money supply have apositive impact on market capitalization while real exchange rate depreciation and interestrates in the money market impact negatively on stock market capitalization.
Functional Form
The theoretical framework adopted in this study is based on the Dividend Discount and theArbitrage Pricing Theory models discussed earlier. In this regard, this study will adopt andmodify the Rahman et al. (2009) model based on the availability of data on selected variables.A simple theoretical model of stock market capitalization as a function of the variables reviewedin the literature is specified as follows;
Empirical Analysis of Determinants of Stock Market Capitalisation 227
MC = f (REX, CS, BoBCN, M_ONE, FC, IPI) (4)
The variables are as defined in Table 1 below. To smoothen and stabilize these data serieslogarithmic transformations were performed on the data on market capitalization, contractualsavings, and money supply. Real exchange rate indices, industrial production index, and threemonths Bank of Botswana certificate nominal interest rate were not be transformed intologarithms since they are already in percentages form.
EMPIRICAL MODEL
The following is a Vector Error Correction Model to be estimated. The model follows Rahmanet al. (2009) with modifications to specify in matrix form drawing from equation (4).
11
__ _
t qt t i
t qt t i
t qt t iq
t qi i qt t i
t qt t i
t t i
t t i
LNMCLNMC LNMC
REXREX REX
LNCSLNCS LNCS
BoBCNBoBCN BoBCN
LNM ONELNM ONE LNM ONE
FFC FC
IPI IPI
��
��
���
�� �
��
�
�
�� �� � � �� � � � �� �� � � �
�� � � �� �� � � � �� � � ��� �� � � �� � � � �� �� � � �
�� �� � � �� � � �� �� � � �
1 1
2 2
3 3
4 4
5 5
6 6
7 7
t q
t q
c v
c v
c v
c v
c v
C c v
IPI c v�
�
� � � � � �� � � � � �� � � � � �� � � � � �� � � � � �� �� � � � � �� � � � � �� � � � � �� � � � � �� � � � � ��� � � � � �� �
(5)
�xt is the first difference lag operator of (n�1) vector of the variables, C is (n�1) vector of
constant terms, (q) is the lag structure, vt is (n�1) vector of unobservable white noise process, �
i
is (n�n) matrix of short run coefficients of lagged values of the variables. The coefficient matrix��provides information on the long run relationship between the variables in the data vector. If��has full rank r = n, it implies that elements in x
t are stationary in level and a Vector
Autoregressive (VAR) model without differencing the data set can be used and there will be nolong run relationship among the variables.
If the rank of matrix � is zero (null matrix), then there is no long run relationship betweenlevel variables and the first difference VAR is appropriate. If the rank of matrix � is r < n, thenthere exists r � n matrices of � and � such that ��= ��� where � is a vector ofadjustmentcoefficients measuring the speed at which variables in the system adjust to restore long runequilibrium and � is a vector estimates of the long run cointegrating relationships between thevariables in the model. In this case the vector ��x
t is stationary, even though is non-stationary.
Since the error correction term is stationary, equation (5) can be interpreted as a Vector ErrorCorrection Model (VECM).
Time Series Properties of the Data
Given the possibility of non-stationary of the variables from our preliminary data analysis, thisstudy follows the Augmented Dickey Fuller (ADF) test for unit root testing, complementedwith the Phillips-Peron test for unit roots. These unit root tests are necessary to ascertain that

228 Amantle Baleseng, James S. Juana and Gladys Gamariel
the variables employed for empirical work satisfy the classical stationary assumption and toavoid spurious regressions if the variables in the ordinary regressions are non-stationary.
To determine whether the variables have a stable or non-spurious cointegrating relationshipamong themselves, we follow the Johansen and Juselius (1990) maximum likelihood procedureto test for the number of cointegrating vectors which permits inferences on parameter restrictions.The maximum likelihood procedure operates under a vector autoregressive model (VAR) asfollows;
11
qt i i t i q t q tx x x c v�
� � �� � � � � �� � � � (6)
Where �xt is (n � 1), �
q is an (n � n) matrix of rank r = < n, C, is an (n � 1) vector of
constant term and v is an (n � 1) vector of residuals. The hypothesis is H0 = �
q = ��� where �
and � are (n � r) loading matrices and eigenvectors. The purpose of the procedure is to test thenumber of r cointegrating vectors �
1, �
2, ... .. �
r which provide r stationary linear combinations
of 1.tx ��� The likelihood ratio (LR) statistics for testing the hypothesis H0 = �
q = ��� is a test
that there are r cointegrating vectors, �Max
= –T ln (1 – �r+t
) against an alternative,*
1 ln(1 ).rTrace i r iT � �� � � � �� The linear restriction (LR) statistics for testing r against (r+1)
cointegrating vectors is given by
*
1
12ln( ) ln
1r ii
i
Q T �
� �� �� � � � ���� �
which determines the
significant eigenvalues and the corresponding number of eigenvectors. The statistic is embodiedas a chi-square distribution with r degrees of freedom.
After establishing the cointegrating relationship, the error correction model is estimatedusing VECM. This model is preferred over the Engle and Granger (1987) since it yields moreefficient estimators of the cointegrating vectors (Rahman et al., 2009). Moreover, the VECMpermits for testing for cointegration in the whole system of equation without requiring a specificvariable to be normalized. The VECM has a non-requirement for a prior assumption ofendogenity or exogenity of the variables and allows one to examine the causality in Grangersense which adds to its advantages. The error correction term is evaluated using the t-testwhile the lagged first-differenced term of each variable uses the F-test.
The VECM cannot alone provide indications of the dynamic properties of the system northe relative strength of the Granger causality test beyond the sample period. Given this limitation,a variance decomposition technique will be employed to assess the breakdown of the changein the value of the variable in a given period arising from its own shocks in addition to shocksin other variables from the previous period.
Also, the impulse response function will be carried out based on unrestricted VAR so as tomap the time profile of the effects of shocks in the residuals on the behavior of the series. Insimple terms, the impulse response function traces the response of current and future values ofendogenous variables to a one standard deviation shock through the dynamic structure of theVAR. It is estimated as follows;

Empirical Analysis of Determinants of Stock Market Capitalisation 229
0 ( )t i jk t ix µ i�� �� � � � � (7)
Where µ is a 6 by 1 vector of constant, �t–i
is a 6 ��1 error vector, �jk is a 6 � 1 matrix with
�jk (0) = I, and elements of �
jk (i) being impact multipliers which examine the interactions
among LNMC, REX, LNCS, BoBCN, LNM_ONE, and IPI.
3.2. Data and Variable Description
This study uses monthly time series data for the period 2005 to 2012, this sample period wasguided by availability of monthly data for most of the variables. For the sample period, monthlydata employed transforms into 96 observations. Table 1 presents the variables and data sourcesthat are used in this study.
Market capitalization (LnMC): is used as the dependent variable rather than stock marketindex. It measures the size of the stock market, which is the value of listed shares outstandingon the Botswana Stock Exchange in millions of Pula.
The independent variables include:
Industrial production index (IPI): Since GDP data is not available on monthly basis, andgiven that Botswana does not have an industrial production index which may alternatively beused to capture the impact of real economic activity on the stock market, this study uses the USIPI as a proxy to capture the impact of real economic activity on the stock market. A positiverelationship is anticipated.
Bank of Botswana Certificates (BoBCN) are part of the money market instruments usedby the Bank in open market operations to affect liquidity by either mopping up or creatingexcess liquidity. The rates for these instruments are used in this study to proxy for short-terminterest rate. Theory postulates that higher interest rates should raise the required rate of returnby investors and therefore reduce the present value of future cash flows generated by thestock. On the contrary, lower interest rates should boost the present value of cash flows andtherefore boost stock prices.
Contractual savings (LnCS): these are assets of pension funds (Occupational pension)invested in the local equity market in BWP millions. This covers investments in local and duallisted companies. The rapid growth of assets of pension funds over the past years and haveraised concerns that too much pension fund assets held locally could cause asset price bubblesand liquidity problems. This is attributed to both purchase and sale transactions on the BSEbeing dominated by local institutional investors (given the lower participation of individualinvestors) who through their buy and hold strategy, may cause liquidity problems in the stockexchange. It is expected that increased contractual savings leads to increased stock marketcapitalization as institutional investors increase their demand for stocks of listed companies.
Money supply (LnM_One): Narrow money supply (M1) is the sum of currency in circulationand demand deposits. High levels of money supply in the market creates higher demand forstock shares as economic agents attempt to rid themselves of excess cash, which in turn drives upthe price of shares and results in increased market capitalisation. M1 is preferred in this study as

230 Amantle Baleseng, James S. Juana and Gladys Gamariel
it captures currency in circulation and demand deposits unlike broad money supply (M2) whichincludes time deposits which are not readily available for investment (Ayub, 2000).
Exchange rate indices (REX): This is the real exchange rate indices in US dollar per Pula.Foreign demand for any given local stock may be higher when the local currency is expectedto strengthen, other things being equal. Stock prices of local firms primarily involved in exportingcould be favourably affected by a weak local currency and adversely affected by strong localcurrency and the opposite is true for importers.
Financial crisis (FC): a dummy variable to capture the effect of global economic recessionon stock market capitalization. The financial crises affected the Botswana economy throughthe resulting recession as opposed to the direct transmission of the credit crunch and lack ofliquidity as observed in advanced and other emerging economies. The slowdown in privatecapital flows and falling commodity prices negatively affected economy. The Bank of Botswana(2008) and Botswana Stock Exchange (2008) statistics show that signs of the global financialcrisis were visible by the end of 2008 as evidenced by slower growth of real GDP as early as2007/08. By 2009, real GDP experienced a negative growth of 6.7 percent compared to negativegrowth of 2.8 percent in 2008, as the global economic recession became severe. The dummytakes the value of 1 for global financial crisis years, and zero otherwise.
Table 1Variables and data sources
Acronym Variable Description Data Source
LnMC Market Capitalisation Bank of BotswanaREX Real exchange rate indices Bank of BotswanaLnCS Contractual savings Bank of BotswanaBoBCN Three month Bank of Botswana certificates nominal Bank of Botswana
interest rateLnM_ONE Narrow money supply Bank of BotswanaFC Dummy for global financial crisis. Bank of BotswanaIPI US Industrial production index. Board of Governors of the Federal Reserve
System (USA)
3. PRESENTATION AND DISCUSSION OF EMPIRICAL RESULTS
In this section the findings of the empirical analysis are presented. The section starts with thedescriptive statistics of the variables, followed by the results of the pre-estimation tests and theestimated econometric model.
3.1. Descriptive Statistics
The descriptive statistics were carried out to examine the properties of the data series and theresults are presented in Table 2. The mean for stock market capitalization (LnMC) was 10.14for the sample period. Table 2 indicates that stock market capitalization (LnMC) and financialcrisis dummy (FC) are positively skewed while real exchange rate indices (REX), contractualsavings (LnCS), money supply (LnM_ONE), three months Bank of Botswana Certificate nominalinterest rate (BOBCN), and industrial production index (IPI) are negatively skewed.

Empirical Analysis of Determinants of Stock Market Capitalisation 231
Table 2Descriptive Statistics
LnMC REX LnCS BOBCN LnM_ONE FC IPI
Mean 10.14008 113.4906 8.621557 9.772708 8.769975 0.166667 94.58046
Median 10.27070 114.1000 8.761381 11.61000 8.851067 0.000000 95.82840
Maximum 10.54613 132.2000 9.331974 13.13000 9.266541 1.000000 100.8200
Minimum 9.297160 92.20000 7.574918 3.450000 8.059308 0.000000 83.75720
Std. Dev. 0.346391 9.070775 0.414038 2.956246 0.340014 0.374634 4.548838
Skewness -1.196105 0.086723 -0.78765 -0.37068 -0.568003 1.788854 -0.74870
Kurtosis 3.127498 2.455502 3.001018 1.468346 2.228135 4.200000 2.640416
Jarque-Bera 22.95570 1.306247 9.926288 11.58235 7.545147 56.96000 9.486188
Probability 0.000010 0.520418 0.006991 0.003054 0.022993 0.000000 0.008712
Sum 973.4476 10895.10 827.6695 938.1800 841.9176 16.00000 9079.724
Sum Sq. Dev. 11.39874 7816.502 16.28563 830.2421 10.98291 13.33333 1965.733
Observations 96 96 96 96 96 96 96
Source: Authors’ computations
The skewness values for real exchange rate indices (REX), contractual savings (LNCS),money supply (LnM_ONE), three months Bank of Botswana Certificate nominal interest rate(BOBCN), and industrial production index (IPI) are almost zero with very small differencebetween mean and median values confirming that that the data distribution for these variablesis almost symmetric.
Kurtosis was employed to test the normality of the data distribution. Stock marketcapitalization (LNMC) and contractual savings (LNCS) have a normal distribution for the twovariables. Kurtosis for real exchange rate indicates (REX), three months Bank of BotswanaCertificate nominal interest rate (BOBCN), and industrial production index (IPI) confirms thedistribution are smaller than normal, while the tails of the distribution for money supply(LNM_ONE) and financial crisis dummy (FC) are greater than 3 which implies that they arethicker than normal. The Jarque – Bera (JB) statistic further confirms that the variables in thestudy do not follow a normal distribution except for real exchange rate indices. This may beattributed to the presence of outliers in the data set which causes deviations from normality.
3.2. Results of Unit Root Test
This study employed the ADF and the Phillips-Perron (PP) stationarity tests.
The results from Table 3 depict that ADF test for unit root fail to reject the null hypothesisof non-stationarity at 1 percent level of significance for all variables at level. In first difference,the ADF test rejects the null hypothesis in favour of the alternative hypothesis that all variablesare stationary at first difference. When the PP test is carried out with the variables in levels, thenull hypothesis is rejected at 1 percent level of significance .The PP tests also show similarresults of variables having unit root at levels, but becoming stationary in first difference. ThePP test confirms the results of the ADF test.

232 Amantle Baleseng, James S. Juana and Gladys Gamariel
3.3. Results of the Cointegration tests
The study uses the Johansen technique to test for cointegration between the variables. Thestudy employs the Trace (�
trace) statistics and the Maximum Eigenvalue (�
max) statistics to explore
the number of cointegrating vectors.
Table 4Results of the Unrestricted Cointegration test
Hypothesised No. Eigenvalue Trace 0.05 Prob.** Max-Eigen 0.05 Prob.**of Cointegrating Statistic Critical Statistic Criticalequations Value Value
None *(1) 0.408287 124.7695 95.75366 0.0001 47.22600 40.07757 0.0067At most 1 *(2) 0.314297 77.54352 69.81889 0.0106 33.95799 33.87687 0.0489At most 2(3) 0.227916 43.58553 47.85613 0.1189 23.27957 27.58434 0.1618At most 3(4) 0.111576 20.30596 29.79707 0.4023 10.64752 21.13162 0.6823At most 4(5) 0.073315 9.658434 15.49471 0.3079 6.852741 14.26460 0.5067At most 5(6) 0.030693 2.805693 3.841466 0.0939 2.805693 3.841466 0.0939
Source: Authors’ computations
Trace test and Max-eigenvalue test both indicate 2 cointegrating equations at 0.05 level. *denotes rejection of the hypothesis at the 0.05 level. **MacKinnon-Haug-Michelis (1999) p-values.
Table 3Results of the ADF and PP unit root tests
Variable ModelSpecification ADF unit root test PP unit root test
Test Statistic Test Statistic Order of
Levels 1st difference Levels 1st differenceIntegration
LnMC Intercept -2.39309 -5.799486* -2.3467 -5.76552* I(1)Intercept and -2.00015 -5.981920* -1.8553 -5.96276* I(1)trend
REX Intercept -2.5910 -10.99078* -2.5150 -10.9907* I(1)Intercept and -3.53506 -11.06145* -3.47232 -11.0614* I(1)trend
LnCS Intercept -1.95302 -8.778201* -1.9178 -8.83435* I(1)Intercept and -2.17350 -8.807881* -2.2658 -8.86098* I(1)trend
BOBCN Intercept 0.032205 -12.39238* -0.1532 -12.1990* I(1)Intercept and -1.80278 -12.42560* -1.8783 -12.2484* I(1)trend
LnM_ Intercept -1.00492 -10.02196* -1.0068 -17.7756* I(1)ONE Intercept and -3.82756 -9.981997* -3.5022 -18.0922* I(1)
trendIPI Intercept -2.44977 -2.111257 -1.3383 -7.88974* I(1)
Intercept and -2.37260 -2.158470 -1.2359 -7.90794* I(1)trend
Source: Authors’ computations* Significant at 1% level

Empirical Analysis of Determinants of Stock Market Capitalisation 233
The results presented in the first and second rows of Table 5 rejects the null hypothesis ofnone, and at most one cointegrating vector respectively. The third row shows that we fail toreject the null hypothesis of at most two cointegrating vectors. Both trace and maximumeigenvalue tests indicate two cointegrating vectors at 5 percent level, meaning that the selectedvariables move along together in the long run, and short run deviations adjust to equilibrium.
The long run cointegrating equation is based on the Johansen and Juselius framework.The cointegrating vector is normalized with respect to stock market capitalization and theestimated normalized cointegrating coefficients for the 2 cointegrating equations are reportedin Table 6 below. Coefficients that are normalized to 1 and for coefficients that are not identifiedare sometimes shown without standard errors. Furthermore, due to normalization process, thesigns are reversed to enable proper interpretation.
Table 5Long-run Cointegrating Equation
LNMC REX LNCS BOBCN LNM_ONE IPI
0.0000 -0.258145 -0.126632 -1.435211 0.002672(0.14497) (0.01276) (0.21729) (0.00499)[-1.7807] [-9.9241] [-6.6051] [0.5354]
Source: Authors’ computationsStandard errors ( ), t-statistics [ ]
Contractual savings are not a significant determinant of stock market capitalization, thoughthe sign is in accordance with economic theory. The insignificance of the variable implies thatcontractual savings mobilised in Botswana are not channelled to Botswana Stock Exchange inthe long run.
Money supply turned out to be a significant driver of stock market capitalization in thelong run. Holding other things constant, a 1 percent increase in money supply increases stockmarket capitalization by 1.44 percent in the Botswana Stock Exchange. This is consistent withthe findings by Ayub (2000), Hussin et al. (2012), Mugumisi, (2008), Muktadir-Al-Mukit(2013), and Rahman et al. (2009).
Contrary to theoretical expectations, the IPI has a negative albeit insignificant impact onstock market capitalization. This may be due to the limitations in the data. Theory on discountedcash flow models suggests that industrial production index shares a positive relationship withfirm’s expected future cash flows which impacts positively on market capitalization.
The results also show that interest rate positively and significantly drive long run stockmarket capitalization. This result suggests that investors in Botswana invest in both the moneyand capital market for purposes of diversification. This result contradicts economic theory andfindings from most other studies in the literature. Madura (2009) suggest that the effect ofinterest rates on stock prices should be considered with economic growth and other factors tooffer a more complete explanation of stock price movements. Taking this into consideration,the movement of real GDP for the sample period was considered. The real GDP registered apositive growth of 5.3, 2.9, 8, and 7.7 percent for 2007, 2008, 2011, and 2012 respectively.

234 Amantle Baleseng, James S. Juana and Gladys Gamariel
Only in 2009, real GDP growth registered a negative growth of -3.7 percent as a result of theeffects of the 2009 global recession. It may therefore be concluded that during the period ofpositive real GDP growth, stock prices increased in response to increase in expected cashflows thereby raising market capitalization.
3.4. Error Correction Model results
The Vector Error Correction was been applied to find the short run relationships among thevariables. Table 7 shows the speed of adjustment matrix which shows how variables adjust torestore stock market capitalization back to its equilibrium value. The coefficients on thecointegrating equation 1 and 2 (CointEq1 and CointEq2) estimate the speed of adjustment foreach variable, with their standard errors and the t-statistics shown in brackets and parenthesisrespectively.
Table 6Speed of adjustment
Error Correction D(LNMC) D(REX) D(LNCS) D(BOBCN) D(LNM_ONE) D(IPI)
-0.101728 -4.222300 -0.038450 0.0600731 0.145725 -5.245559(0.06660) (6.58300) (0.09475) (0.87741) (0.12604) (0.99832)[-1.52733] [-0.64139] [-0.40583] [0.68466] [1.15617] [-5.25438]
-0.002986 -0.127959 -0.005556 0.034007 0.000640 -0.021810(0.00097) (0.09630) (0.00139) (0.01284) (0.00184) (0.01460)[-3.06492] [-1.32874] [-4.00878] [2.64947] [0.34734] [-1.49339]
Source: Extracted from the estimation results
The second row (CointEq2) in Table 6 shows error correction terms that correspond to thelong run equation. It indicates a significant speed of adjustment coefficient of -0.002986implying convergence of stock market capitalization to equilibrium in the long run. A significantadjustment coefficient of -0.005556 for contractual savings indicates that in the short runcontractual savings adjusts to push stock market capitalization back to equilibrium in the longrun. Adjustment coefficient for three months interest rate is positive and significant, indicatingthat in the short-run short term interest rates adjust to push stock market capitalization intofurther disequilibrium. The adjustment coefficients for real exchange rate indices, money supply,and industrial production index are statistically insignificant.
The estimation of the short run coefficients of the lagged values of the variables show apositive and significant industrial production index and real exchange rate indices from firstlag to third lag respectively, while contractual savings are positive and significant at first lag.This implies these variables drive up stock market capitalization in the short run. Money supplyshort run coefficient turned out to be negative and significant. This may be due to the inclusionthe real exchange rate variable, whereby an increase in money supply technically inducesdepreciation, thereby causing a negative impact on stock market capitalization in the short run.Alternatively, excess money supply causing inflation problems would in turn increases thediscount rate thereby causing a fall in share price.

Empirical Analysis of Determinants of Stock Market Capitalisation 235
The percentage of the total variation of the dependent variable described in the model ishigh enough at 57 percent, with the F-statistic of 2.309 and prob. (F-statistic) 0.002819implying that the model significantly fits the data. The diagnostic tests were performed onthe VECM for stability, serial correlation, heteroscedasticity and normality. The results showthat all the diagnostic tests were passed except for normality test (Jarque-Bera). The VECMis stable, no serial correlation, and no heteroscedasticity. However, the residuals are notnormal.
3.5. Results for Granger Causality
Granger Causality is used to investigate causality between the variables in the Vector ErrorCorrection Model.
Table 7Granger Causality tests and coefficient of Error Correction Terms
Dependent Excluded Variable: Chi Square Wald Statistic t-StatVariable
LNMC REX LNCS BOBCN LNM_ONE IPI FC EC2t-1
LNMC - 13.13** 6.57 3.83 7.58 20.75 0.60 -3.065*
REX 1.66 - 1.10 8.85 4.58 6.67 1.00 -0.096
LNCS 13.70** 9.12*** - 1.34 10.62*** 9.77*** 5.81** -4.009*
BOBCN 5.93 7.36 2.15 - 13.95** 5.31 0.01 2.650**
LNM_ONE 3.83 2.17 8.05 5.86 - 5.30 0.02 0.347
IPI 35.43* 34.19* 20.90* 60.95* 3.30 - 36.61* -1.493
NB. Chi Square Wald statistic represent the joint significance of each of the lagged endogenous variables in the model.* denotes 1 percent level of significance, ** denotes 5 percent level of significance, *** denotes 10 percent level ofsignificance.
The causal relationships are captured from the short-run interactions as well as the long-run co-movements. The short run relations are revealed by the lagged values of the variableswhile the long run co-movements of the system are revealed by the cointegrating relation.Results of the t statistic which reports on the error correction terms in the VECM, and the ChiSquare Wald statistic checks on the joint significance of the lagged variables are reported inTable 7.
Results in Table 7 suggest a dynamic short run interaction between the variables. One waycausality is evident between stock market capitalization and industrial production index, realexchange rate indices and stock market capitalization, real exchange rate indices and industrialproduction index, contractual savings and industrial production index, interest rate and industrialproduction index, money supply and contractual savings, money supply and interest rate,financial crisis and contractual savings, as well as financial crisis and industrial productionindex. Furthermore, there is a two-way causality between stock market capitalization andindustrial production index, as well as between contractual savings and industrial productionindex.
236 Amantle Baleseng, James S. Juana and Gladys Gamariel
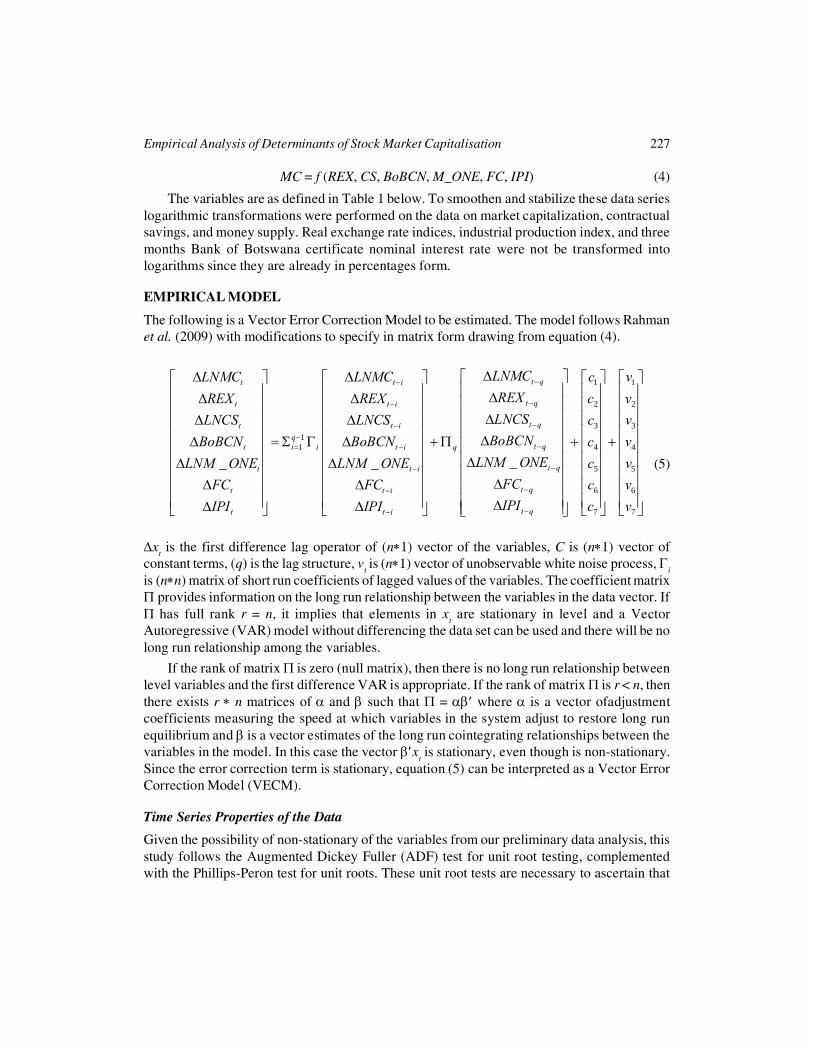
3.6. Variance Decomposition
The study further investigates the variance decomposition of stock market capitalization asshown in Table 8.
Table 8Variance Decomposition of Stock Market Capitalization (LNMC)
Period S.E. LNMC REX LNCS BOBCN LNM_ONE IPI
1 0.035631 100.0000 0.000000 0.000000 0.000000 0.000000 0.0000002 0.056732 97.34603 0.194787 0.493256 0.030721 0.095856 1.8393553 0.073686 90.68561 0.734891 0.866028 0.430921 1.354134 5.9284154 0.090343 81.02844 1.433079 0.660690 1.237058 3.968438 11.672305 0.106208 72.83528 3.603616 0.764894 1.554521 8.766199 12.475496 0.121335 66.52202 6.347403 0.682847 1.731231 12.25826 12.458247 0.136674 59.68450 7.607090 0.666368 2.511944 17.24195 12.288148 0.152576 52.97106 8.566419 0.624566 4.053128 22.11638 11.668449 0.169021 47.48946 9.266651 0.508980 6.867389 25.55636 10.3111610 0.186585 42.49971 9.747367 0.427296 10.64166 27.75447 8.929502
The results show that in the initial period, 100 percent of the variance in stock marketcapitalization is accounted for by itself. The second period shows that 97 percent is accountedfor by itself, while 1.839 percent of the variance is due to industrial production index.
The maximum effect of industrial production index shocks on the variance of stock marketcapitalization is not felt until the fifth period. In this period, industrial production index shocksaccount for 12.475 percent of total variations in stock market capitalization. For money supply,interest rate, and real exchange rate indices, the greatest impact of shocks in these variables arereflected in the variance of stock market capitalization in the tenth period when they respectivelyaccount for 27.754, 10.642, and 9.747 percent of the variance of stock market capitalization.
3.7. Impulse response function
The impulse response function traces the response of current and future values of endogenousvariables to a one standard deviation shock through the dynamic structure of the VAR. Theresults for the impulse response function in Figure 1 suggests that the response of stock marketcapitalization to its own shock is positive though constant from 1 month up to 10 months of theforecast period. One standard deviation shock to money supply leads to a positive reaction tostock market capitalization and the effect gradually rises until the 10th month. Stock marketcapitalization also responds positively to one standard deviation shock in industrial productionindex, however, the effect gradually decreases from the 4th month to the 10th month.
In the case of contractual savings, the response of stock market capitalization to one standarddeviation shock in contractual savings is positive but marginally different from zero throughoutthe forecast period. The response of stock market capitalization to one standard deviationshock to real exchange rate indices is negative throughout the forecast period. Also, stockmarket capitalization responds negatively to one standard deviation shock on three months

Empirical Analysis of Determinants of Stock Market Capitalisation 237
Bank of Botswana Certificate nominal interest rates from the 1 to 7 months, but after the 7th
month it becomes positive and gradually rises until the 10th month.
5. CONCLUSION AND POLICY IMPLICATIONS
This study empirically examined the macroeconomic and financial determinants of stock marketcapitalization in the Botswana Stock Exchange for the period 2005 to 2012 using monthly data.With guidance of data availability, the study examined the impact of real exchange rate indices,contractual savings, three months Bank of Botswana Certificate nominal interest rates, moneysupply, financial crisis dummy, and industrial production index (US) on stock marketcapitalisation. The study employs the VECM approach to investigate the short run relationshipsamong the variables, cointegration tests to establish any existence of long run relationshipbetween the variables, and further examines the dynamic interactions among the variables usingvariance decomposition and the impulse response function.
The major findings emanating from this study are summarised as follows: First, moneysupply and three months Bank of Botswana Certificate nominal interest rates are importantdeterminants of stock market capitalization in the long run for Botswana Stock Exchange. Theinterest rate variable however turned out to have an unexpected sign. Second, the VECM
Figure 1: Response to Cholesky one-Standard Deviation Innovations

238 Amantle Baleseng, James S. Juana and Gladys Gamariel
results indicate that contractual savings adjust in the short run to push stock market capitalizationback to equilibrium in the long run, while short run interest rates adjust to push stock marketcapitalization into further disequilibrium. The error correction term also shows convergenceof stock market capitalization to equilibrium in the long run, while all other variables turnedout to be statistically insignificant. Third, Granger Causality between the variables in the VECMindicate one way statistically significant relationship between real exchange rate indices andstock market capitalization amongst others. Furthermore, there is bi-directional causalitybetween stock market capitalization and industrial production index, as well as contractualsavings and industrial production index. Finally, the simulation results from variancedecomposition and impulse response functions show that stock market capitalization is sensitiveto the variables. Particularly, real exchange rate indices, money supply, and industrial productionindex they show stronger dynamic interaction with market capitalization compared to othervariables.
This study recommends that monetary authorities maintain short-term interest rates atlevels supportive of monetary policy, given that money supply affects demand for stocks,which in turn affects stock prices; hence, market capitalization. The study further recommendsthat policy makers should pursue policy directions that encourage contractual savings to bechannelled to the Botswana Stock Exchange so as to increase the supply of investment fundsto the stock market by institutional investors in the long run. A further analysis to examine therelationship between market capitalization, macroeconomic, and financial variables for varioussectors within the economy is ideal for future research.
References
Abdalla, I. S. A., & Murinde, V. (1997), Exchange rate and stock price interactions in emerging financialmarkets: evidence on India, Korea, Pakistan and the Philippines. Journal of Applied Financial Economics,Vol. 7, pp. 25 - 35.
Addo, A., & Sunzuoye, F. (2013), The Impact of Treasury Bill Rate and Interest Rate On The Stock MarketReturns: Case Of Ghana Stock Exchange. European Journal of Business and Economics, Vol. 8(2).
Akingunola, R. O., Adekunle, O. A., & Hammed, O. (2012), Impact of Interest Rate on Capital Market Growth(A Case of Nigeria). Universal Journal of Management and Social Sciences, Vol. 2(11), 1 - 23.
Alam, M., & Uddin, G. S. (2009), Relationship between Interest Rate and Stock Price: Empirical Evidencefrom Developed and Developing Countries. International Journal of Business and Management, Vol.4(3), pp 43 - 53.
Amanze, E. (2009), The Determinants of Dividend Policy in Botswana. A Dissertation Submitted in PartialFulfillment of the Requirements of a Masters (Economics) Degree, Department of Economics, Universityof Botswana
Ayub, M. (2000), Stock Market Consequences of Macroeconomic Fundamentals. Munich Personal RePEcArchive (MPRA) Paper No. 442
Bank of Botswana. (2005-2012), Bank of Botswana Annual Report: Bank of Botswana.
Billmeier, A., & Massa, I. (2009), What drives stock market development in emerging markets - institutions,remittances, or natural resources? Emerging Markets Review (10), 23–35.
Bodie, Z., Kane, A., & Marcus, A. J. (2004), Essentials of Investments (5 ed.): McGraw-Hill Higher Education.

Empirical Analysis of Determinants of Stock Market Capitalisation 239
Botswana Stock Exchange. (2006-2012), Botswana Stock Exchange Annual Report.
Buzwani, M. (2007), Determinants of Growth on the Botswana Stock Exchange. Masters of Arts (Economics),Department of Economics, University of Botswana.
Catalan, M., Impavido, G., & Musalem, A. R. (2000), Contractual Savings or Stock Markets Development:Which Leads? Policy Research Working Paper 2421. Financial Sector Development Department. TheWorld Bank.
Cherif, M., & Gazdar, K. (2010), Macroeconomic and institutional determinants of stock market developmentin MENA region: new results from a panel data analysis. International Journal of Banking and Finance7(1), pp 139 - 159.
Engle R.F. and Granger C.W.J., (1987), ‘Co-integration and error correction: Representation, estimation andtesting’, Econometrica, 55(2), 251-276.
Farrell, J. L. J. (1985), The Dividend Discount Model: A Primer. Financial Analysts Journal, Vol. 41(6), pp 16- 25.
Garcia, V. F., & Liu, L. (1999), Macroeconomic Determinants of Stock Market Development. Journal ofApplied Economics, Vol. 2(1), pp 29 - 59.
Granger C.W.J., (1981), ‘Some properties of time series data and their use in econometric model specification’,Journal of Econometrics 16, 121-130.
Hasan, A., & Javed, M. T. (2009), An Empirical Investigation of the Causal Relationship among MonetaryVariables and Equity Market Returns. The Lahore Journal of Economics, Vol. 14(1), 115 - 137.
Hu, Y. (2012), Growth of Asian Pension Assets: Implications for Financial and Capital Markets. ADBI WorkingPaper Series No. 360. Asian Development Bank Institute.
Hussin, M. Y. M., Muhammad, F., Abu, M. F., & Awang, S. A. (2012), Macroeconomic Variables and MalaysianIslamic Stock Market: A Time Series Analysis. Journal of Business Studies Quarterly, Vol. 3(4), pp 1 - 13.
Levine, R., & Zervos, S. (1998), Stock Markets, Banks, and Economic Growth. American Economic Review,Vol. 88, pp 537 - 558.
Li, Y., & Huang, L. (2008), On the Relationship between stock return and exchange rate: evidence on China.The Business School, Loughborough University ,UK.
Madura, J. (2009), Financial Markets and Institutions United States of America: Cengage Learning.
Mishkin, F. (1977), What Depressed the Consumer? The Household Balance Sheet and the 1973-1975 Recession.Brookings Papers on Economic Activity, vol. 1, pp 123 - 164.
Modigliani, F. (1971), Monetary policy and consumption: linkages via interest rate and wealth effects in theFMP model. Paper presented at the Conference Series.
Mothobi, O. (2012), The Role of Information in the Analysis of Stock Market Prices: Case of Botswana StockExchange. A Dissertation Submitted in Partial Fulfilment of the Requirements of a Masters (Economics)Degree, University of Botswana.
Mugumisi, N. (2008), An Empirical Analysis of the Determinants of Stock Market Capitalization: A Case of theZimbabwe Stock Exchange (1994 - 2007). A Dissertation submitted in partial fulfilment of the Requirementsfor the award of Masters of Science in Economics, University of Zimbabwe.
Muktadir-Al-Mukit, D. (2013), An Econometric Analysis of the Impact of Monetary Policy on Stock MarketPerformance in Bangladesh. World Review of Business Research, Vol. 3(3), pp 16 – 29.
Rahman, A. A., Sidek, N. Z. M., & Tafri, F. H. (2009), Macroeconomic determinants of Malaysian stockmarket. African Journal of Business Management, Vol. 3(3), pp 095 - 106.

240 Amantle Baleseng, James S. Juana and Gladys Gamariel
Ross, S. A. (1976), The Arbitrage Theory of Capital Asset Pricing. Journa of Economic Theory and Practice,Vol. 13, pp 341 - 360.
Singh A., (1999), ‘Financial Liberalization, Stock Markets and Economic Development’, The Economic Journal,107, 771-82.
Tudor, C., & Popescu-Dutaa, C. (2012), On the causal relationship between stock returns and exchange rateschanges for 13 developed and emerging markets. Procedia - Social and Behavioral Sciences, Vol. 57, pp275 – 282.
World Bank. (2016), World Development Indicators: The World Bank Publications.
Yartey, C. A. (2007), Well-developed Financial Intermediary Sector Promotes Stock Market Development:Evidence from Africa. Journal of Emerging Market Finance, Vol. 6(3), pp 269 - 289.
Yartey, C. A. (2008), The Determinants of Stock Market Development in Emerging Economies: Is South AfricaDifferent? IMF Working Paper WP/08/32. African Department. International Monetary Fund.


![Forecasting Earth Quake Using Back Propagation Algorithm ...serialsjournals.com/serialjournalmanager/pdf/1483683448.pdf · successful implementation of predicting earthquakes. [1]](https://img.pdfslide.net/doc/110x75/5aaa47487f8b9a95188de25c/forecasting-earth-quake-using-back-propagation-algorithm-implementation-of-predicting.jpg)