Embed Size (px)
Citation preview

Empirical Capital Structure Research: New Ideas, Recent Evidence, and
Methodological Issues
Ralf Elsas and David Florysiak
Discussion paper 2008-10
July 2008
Munich School of Management
University of Munich
Fakultät für Betriebswirtschaft
Ludwig-Maximilians-Universität München
Online at http://epub.ub.uni-muenchen.de/

1
Empirical Capital Structure Research: New Ideas, Recent Evidence, and
Methodological Issues
Ralf Elsas
Corresponding author, Institute for Finance & Banking, Ludwig-Maximilians-University Munich, Ludwigstrasse 28, 80539 Munich, Germany, [email protected]
David Florysiak
Institute for Finance & Banking, Ludwig-Maximilians-University Munich, Ludwigstrasse 28, 80539 Munich, Germany, [email protected]
This version: July 2008.
Abstract
Even 50 years after Modigliani/Miller’s irrelevance theorem, the basic question of how firms choose their capital structure remains unclear. This survey paper aims at summarizing and discussing corresponding recent developments in empirical capital structure research, which, in our view, are promising for future research.
We first present some “stylized facts” on capital structure issues. The focus of the discussion is set on studies taking on the key idea to differentiate between competing theories by testing for firm adjustment behavior following shocks to their capital structure. In addition, we discuss empirical studies examining additional factors that may influence capital structure decisions, but have gained only recently attention in the literature (like corporate ratings or irrational managers).
Since some of the available contradictory evidence on capital structure issues might be explained by econometric challenges due to the typical data structure, we also discuss methodological issues like panel data, endogeneity, and partial adjustment models in the capital structure context.
Finally, we illustrate the methodological and empirical aspects discussed in this survey by providing corresponding evidence for exchange-listed German companies in the period 1987-2006.
JEL Classification: G32
Keywords: Corporate finance, capital structure determinants, dynamic adjustment models.

2
A. Introduction
„How do firms choose their capital structure? ... We don‘t know.“
(Stewart Myers, Presidential Address AFA, Myers 1984, p. 575)
How do firms finance their investments? How does financing interact with investment? And,
most generally, do financing decisions affect firm value? These essential questions in corpo-
rate finance are still contended, and the theoretical and empirical literature is far from reach-
ing consensus even on some of the most basic issues. Therefore, 50 years after the seminal
Modigliani/Miller (1958) paper, Stewart Myers’ quote is still valid, but there have been
gained some insights in recent years. This survey paper aims at summarizing and discussing
corresponding recent developments in empirical capital structure research.
In the light of the vast literature on capital structure issues, we do not try to provide a compre-
hensive review, and we do not discuss theory in detail.1 Rather, as a starting ground, we will
give a brief outline of the major theoretical ideas and the corresponding empirical implica-
tions, and present some “stylized facts” on capital structure issues. The focus of our discus-
sion is on (subjectively) selected recent empirical studies. In particular, our selection of stu-
dies is based on Myers’ (1984) insight, that the key question to differentiate between compet-
ing capital structure theories is whether firms adjust to some target following shocks to their
capital structure. This is due to the fact, that trade-off theories suggest that firms try to main-
tain some “optimal” debt ratio, while e.g. pecking order or market-timing theories suggest that
there is no target level of leverage.
Correspondingly, we discuss the study by Welch (2004), who examines adjustment behavior
following shocks to the market-value based debt ratio due to changes in the equity value of
companies, the study by Flannery/Rangan (2006), which takes dynamic adjustment behavior
of firms explicitly into account in the design of the empirical model, and the studies by May-
er/Sussman (2005) and Elsas et al. (2007), which examine dynamic financing patterns, when
firms undertake very large investments. Also, we briefly address studies that focus on shocks
from macroeconomic factors and the competitive and regulatory environment.
We complement our review of studies on firms’ adjustment behavior to capital structure
shocks by discussing additional factors that may influence capital structure decisions, but
3
have gained only recently attention in the literature. For instance, Kisgen (2006) considers for
the first time the role of ratings from external rating agencies (like S&P or Moody’s) in the
capital structure context. This seems an important contribution due to the eminent role that
rating agencies play in capital markets nowadays. Finally, our review of further potential de-
terminants of capital structure is completed by looking at recent studies that consider irration-
al behavior of economic agents (in particular firm managers) as a potentially important deter-
minant of capital structure. This idea is exemplified by the studies of Malmendier et al. (2007)
and Ben-David et al. (2007), which analyze the consequences of managerial overconfidence
empirically.
Another major part of this survey is concerned with the econometrics of capital structure re-
search. There are three major econometric issues that make explaining systematic variation in
corporate leverage a formidable task (Welch 2007): i) the panel nature of the data, ii) endo-
geneity between the capital structure and potential determinants (i.e. explanatory variables in
a regression context), and iii) dynamic adjustment of leverage. These problems may lead to
severe biases of standard econometric estimators in the capital structure analysis context,
which in turn might help explaining parts of the contradictory evidence in leverage determi-
nants in the literature. We will discuss these issues in more detail, emphasizing the need to
take them into account carefully in an empirical design. This seems highly relevant because
(too) often these issues are ignored. For instance, the Fama/MacBeth (1973) regression ap-
proach is frequently used by researchers in the capital structure context. But this method fails
to adjust inference for the main econometric issue in using panel data, the correlation of ob-
servations from one firm (individual) over time (see Petersen 2007).
Also, the adjustment of leverage to a target level after the occurrence of shocks necessarily
takes time. This makes the challenges from the panel nature of the data even more complex,
since standard panel estimators like the fixed effects-model are severely biased within a dy-
namic panel structure (Arellano/Bond 1991). The econometric issue of how to estimate speeds
of adjustment using panel data is of course a major obstacle for studies analyzing dynamic
capital structure issues. The corresponding methodological discussion thus complements our
review of Flannery/Rangan (2006) and related studies, which tackle dynamic adjustments in
applied studies.
Finally, in order to illustrate the relevance of the methodological and empirical issues ad-
dressed in the survey, we conduct an analysis of capital structure determinants of German

4
exchange listed firms for the period 1987-2006. This serves to make the concepts and ideas
more transparent, and helps demonstrating the impact of modeling choices using an integrated
and concrete example throughout the discussion.
Putting all together, the survey is structured as follows. In Section B, we briefly discuss fun-
damental theoretical ideas and stylized facts of previous empirical capital structure research.
Important econometric issues like endogeneity and the panel structure of the data are dis-
cussed in Section C. Empirical studies that focus on firms’ adjustment behavior, or suggest
additional capital structure determinants, will be discussed in Section D. The empirical illu-
stration using the German firm sample is presented throughout all discussions, details on the
data are provided in the Appendix. Section E concludes.
B. Fundamental Ideas in Capital Structure Research and Stylized Facts
I. Fundamental Ideas in Capital Structure Research
Showing the irrelevance of capital structure decisions for firm value in perfect capital mar-
kets, Modigliani/Miller (1958) have defined the reference point for all theoretical discussions.
Their no-arbitrage result suggests that observed firm capital structures should not entail sys-
tematic patterns of within-group homogeneity and between-group heterogeneity. However,
these patterns, like industry-specific leverage ratios, are observable within and across finan-
cial systems, implying the relevance of capital market imperfections.
At the same time, patterns like industry-specific leverage render simple (but nevertheless for
companies important) tax-based explanations for capital structure patterns insufficient. Under
most international tax-regimes, debt financing is advantageous for companies, because inter-
est payments can, to some extent, reduce firms’ tax burden, while payments to equity holders
cannot. This different treatment of equity and debt leads to the so-called tax-shield of debt
financing, constituting a strong argument in favor of debt. However, tax-based explanations
are from an economic perspective a somewhat unsatisfactory capital structure determinant,
because taxes are set exogenously by governments, without a clear underlying economic ra-
tionale. Moreover, since corporate tax-regimes typically are homogenous for companies lo-
cated in the same country at the same time, taxes cannot explain fully the observed systematic
capital structure heterogeneity (Graham 2003).

5
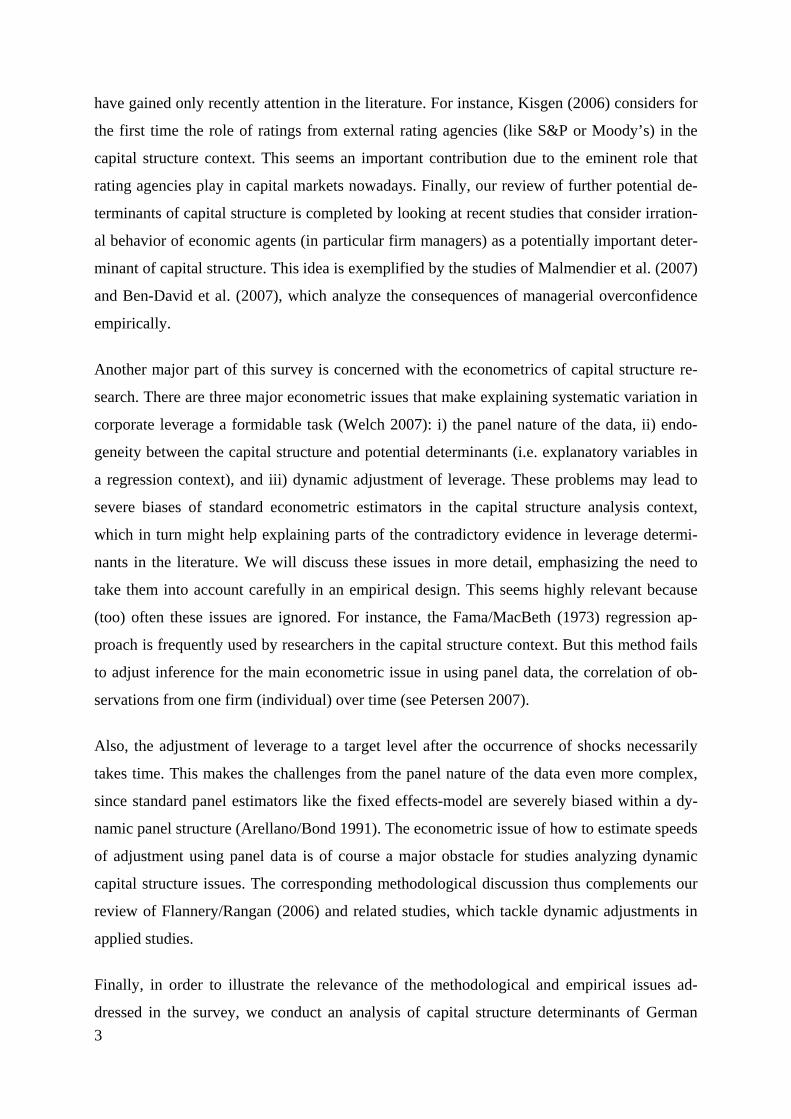
To illustrate that the tax-advantage of debt financing does not suffice to explain observed fi-
nancing patterns, Fig. 1 shows the yearly average of German firms’ interest expenditures as a
percentage of Earnings before Interest and Taxes (EBIT), which is an approximation for the
taxable income of firms. Ignoring that interest payments may not be the only possibility for
companies to reduce tax payments, the maximum tax benefit of leverage is exploited, if firms’
interest expenditures correspond to the expected EBIT per period. However, Fig. 1 clearly
illustrates for our German sample that firms do by far not exploit their potential tax benefit.2
The average interest to EBIT ratio (solid line) is constantly below 30% over the observation
period from 1987-2006. There is even a tendency to decrease the interest to EBIT ratio. The
same pattern holds if one excludes firm-year observations with a negative EBIT ratio. In this
case (dashed line), the ratio is always below 55%. This strongly suggests that taxes cannot be
the only determinant of optimal leverage (also see Rajan/Zingales 1995 and Graham 2000).
Fig. 1: Yearly averages of interest payments as a percentage of EBIT for German firms, 1990-2007
The figure shows yearly averages of interest payments as a percentage of positive and negative EBIT and posi-tive EBIT only for German firms, 1990-2007. The sample is described in detail in the Appendix.
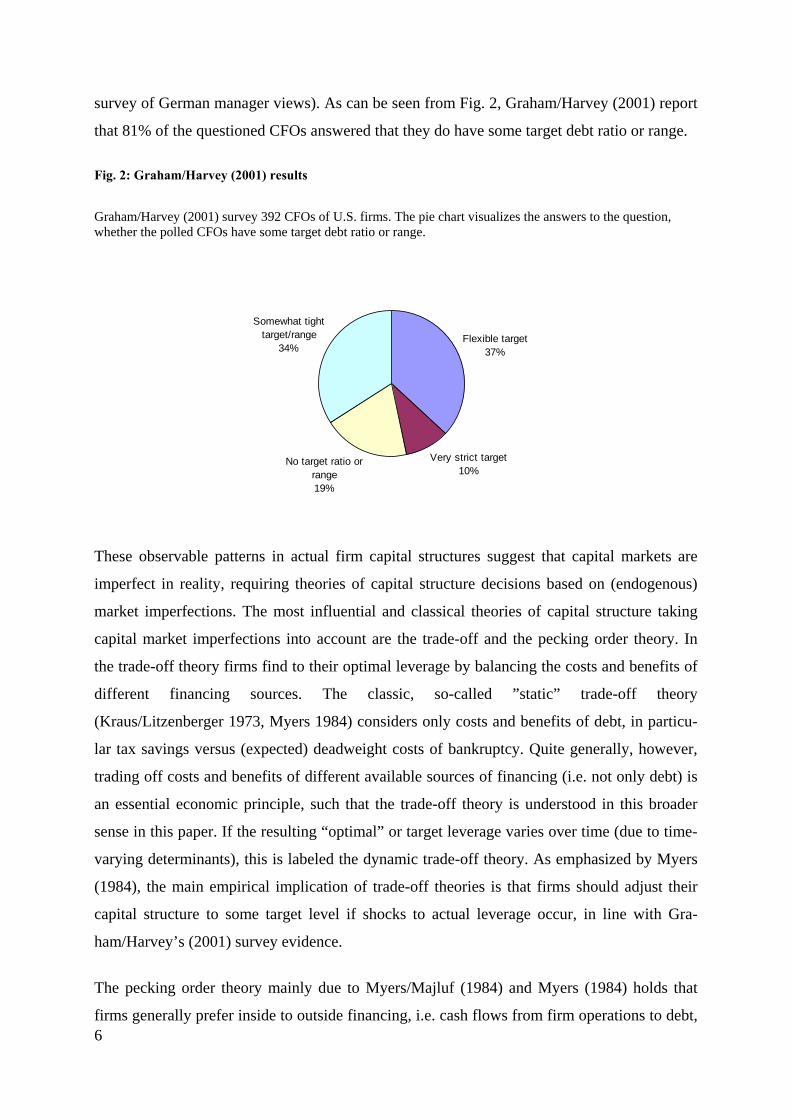
Moreover, firms (or their managers) themselves do not believe in the irrelevance of capital
structure. The Graham/Harvey (2001) survey of 392 CFOs of U.S. firms illustrates that the
majority of firm managers consider capital structure decisions important for firm value and
that firms have some target debt-equity ratio (see Brounen et al. (2006) for a corresponding
1990 1992 1994 1996 1998 2000 2002 2004 200610%
20%
30%
40%
50%
60%
Year
Inte
rest/
EBIT
Positive and negative EBITPositive EBIT only
6
survey of German manager views). As can be seen from Fig. 2, Graham/Harvey (2001) report
that 81% of the questioned CFOs answered that they do have some target debt ratio or range.
Fig. 2: Graham/Harvey (2001) results
Graham/Harvey (2001) survey 392 CFOs of U.S. firms. The pie chart visualizes the answers to the question, whether the polled CFOs have some target debt ratio or range.
These observable patterns in actual firm capital structures suggest that capital markets are
imperfect in reality, requiring theories of capital structure decisions based on (endogenous)
market imperfections. The most influential and classical theories of capital structure taking
capital market imperfections into account are the trade-off and the pecking order theory. In
the trade-off theory firms find to their optimal leverage by balancing the costs and benefits of
different financing sources. The classic, so-called ”static” trade-off theory
(Kraus/Litzenberger 1973, Myers 1984) considers only costs and benefits of debt, in particu-
lar tax savings versus (expected) deadweight costs of bankruptcy. Quite generally, however,
trading off costs and benefits of different available sources of financing (i.e. not only debt) is
an essential economic principle, such that the trade-off theory is understood in this broader
sense in this paper. If the resulting “optimal” or target leverage varies over time (due to time-
varying determinants), this is labeled the dynamic trade-off theory. As emphasized by Myers
(1984), the main empirical implication of trade-off theories is that firms should adjust their
capital structure to some target level if shocks to actual leverage occur, in line with Gra-
ham/Harvey’s (2001) survey evidence.
The pecking order theory mainly due to Myers/Majluf (1984) and Myers (1984) holds that
firms generally prefer inside to outside financing, i.e. cash flows from firm operations to debt,
Flexible target37%
Very strict target10%
No target ratio or range19%
Somewhat tight target/range
34%

7
and equity as a last financing resort. The underlying rationale is most often derived from
problems of asymmetric information among a company’s stakeholders, i.e. problems of ad-
verse-selection or moral hazard (see e.g. Frank/Goyal (2008) and Neus/Walter (2008) in this
volume). Such a preference order on financing sources suggests empirically that firms should
follow their preferences regardless of shocks. Hence, the existence of adjustment behavior
allows for discriminating between trade-off and pecking order theories, rendering tests for
adjustment behavior probably the most fruitful and important approach in designing empirical
tests of capital structure issues.
Two other theoretical ideas that compete with trade-off and pecking order theories are beha-
vioral finance and the so-called market-timing explanations. In behavioral finance theories,
agents (in particular managers) behave irrationally, e.g. being overconfident or optimistic.
Interestingly, opposed to the pecking order idea, the availability of free cash flow is in this
framework often instrumental for inefficiencies. For example, if managers are overconfident,
the theory predicts that they will invest in projects that appear beneficial to them but are cost-
ly to shareholders (e.g. due to a negative net present value). Regarding the implications, this is
similar to the implications of the free cash flow problem due to “empire building” managers
(Jensen 1986) and the “managerial hubris” hypothesis of Roll (1986). All these ideas suggest
that managers will have a tendency to hold cash excessively, because with having free cash
flow they are not subject to the scrutiny of external investors. However, the similarity in theo-
retical predictions makes it at the same time a challenge to differentiate between these argu-
ments empirically.
The market-timing explanation states that firms issue equity, when market prices are (irration-
ally) overpriced, using the corresponding “window of opportunity” (Baker/Wurgler 2002,
Ritter 1991). Similar to pecking order theories, market timing implies that there is no adjust-
ment to some target leverage if shocks occur. Rather, a firm’s leverage then reflects the pat-
tern of historical security mis-pricings at times, where new investments needed to be financed.
II. Stylized Facts
Most empirical studies on capital structure determinants build on a list of variables likely to
affect capital structure choices suggested by Harris/Raviv (1991) in their theory review: fixed
assets, non-debt tax shields, investment opportunities, firm size, earnings volatility, default
risk, profitability, advertising expenditures, R&D expenditures, and product uniqueness. Har-
8
ris/Raviv (1991, p. 334) even suggest that available studies “generally agree” on these deter-
minants, although already the classic paper by Titman/Wessels (1988) finds no significant
impact of non-debt tax-shields, volatility, collateral value, or future growth on debt ratios.
This pattern of ambiguous and in part contradictory evidence can be traced through the empir-
ical literature ever since Modigliani/Miller (1958). Still, the recent evidence has at least
reached consensus on some variables and financing patterns that appear sufficiently robust
empirically. These variables will be discussed in the following as “stylized facts”.
In their seminal empirical study, Rajan/Zingales (1995) examine the determinants of capital
structure choices in major industrialized countries. Overall, the authors find corporate leve-
rage and its determinants in the G-7 countries to be fairly similar. Their evidence serves as a
starting point for variable selection in empirical studies since, comprising the factors growth,
profitability, tangibility and size. Frank/Goyal (2007) suggest that using only these factors and
omitting expected inflation and the median industry debt ratio leads to misspecifications, ren-
dering other factors statistically insignificant or changing their signs. In their study based on
COMPUSTAT data for U.S. firms for the period 1950 to 2003, the authors identify several
cross-sectional factors of leverage that are “reliably important”. They provide a list of 25 va-
riables from prior literature and find that six core variables are able to robustly explain 27 %
of cross-sectional variation in leverage. The remaining 19 determinants explain only further 2
% of the variation.3
The following overview summarizes these “core” determinants of capital structure and their
theoretically predicted effect on leverage by classic capital structure theories, based upon the
findings of Frank/Goyal (2007):
a. Growth (-)
Growth or growth opportunities are most often measured by Tobin's Q (with the market-to-
book ratio of equity and/or assets serving as the empirical proxy). Growth has been found to
be negatively correlated with leverage. In a similar study, Shyam-Sunder/Myers (1999) draw
the same conclusion. Barclay et al. (2006) provide more distinguished results, concentrating
on debt capacity and growth options.
This empirical evidence is consistent with the theoretical prediction of the trade-off theory,
because the availability of growth opportunities might increase expected costs of financial

9
distress, resulting in lower leverage. On the other hand, current and future growth must arise
from (real) investments, which should be financed with more debt according to the pecking
order theory. Thus, the negative relation between leverage and growth is not consistent with
the pecking order theory.
b. Size (+)
Typical measures of firm size are the logarithm of assets or the age of firms, where mature
firms tend to be larger than immature firms. In most cross-sectional tests, size and leverage
are positively correlated. Evidence from dynamic trade-off studies also supports that size is
positively related to leverage.
This result is consistent with the prediction of the trade-off theory, because larger or more
mature firms are likely to have lower default risk, and are less opaque than smaller firms due
to their established track record of success and the attention received from analysts and rating
agencies (thus reducing informational asymmetries). These arguments imply a potential for
higher leverage. According to the pecking order theory, the prediction on the size-leverage
relationship is not clear due to the ambiguous impact of a reduced degree of asymmetric in-
formation on the relative agency costs of cash versus debt versus equity.
c. Tangibility (+)
Tangibility of assets is most often measured by the ratio of fixed assets to total assets. The
relationship between tangibility and leverage has been found to be positive in most cases.
Tangibility is also positively related to leverage as a control variable in dynamic trade-off
analyses.
This evidence is consistent with the trade-off theory, if tangible assets serve as collateral for
debt financing, thereby reducing costs of financial distress and increasing the debt capacity of
firms. However, a positive relationship between available tangible assets and leverage is con-
sistent with the pecking order theory as well, if collateral reduces the relevance of asymmetric
information, thereby making the preference order less strict.

10
d. Profitability (-)
The relation between profitability of firms and leverage is quite generally found to be signifi-
cantly negative in studies of the cross-section of debt ratios. Kayhan/Titman (2007) also find
this relation in their analysis of changes in debt ratios, but the effect is relatively weak. In dy-
namic trade-off studies, profitability is also clearly negatively related to leverage. As already
mentioned, the financing behavior of firms is likely to change over time. For example,
Frank/Goyal (2007) find that profitability has lost some of its explanatory power for U.S.
firms’ capital structures over the last decades.
If higher profitability decreased the expected costs of financial distress (assuming some sta-
tionarity of profitability), one would expect to find profitability to increase leverage under the
trade-off theory. Also, since higher profitability will translate into more free cash flow, debt
should be more valuable due to its disciplining effect on managers. Thus, the finding of a
negative relationship is more consistent with the pecking order theory, because higher cash
flows ceteris paribus reduce the necessity to issue debt.
e. Industry Median Debt Ratios (+)
The industry median leverage has been found to have high explanatory power and is most
often positively correlated with leverage. This seems obvious in univariate analysis, but in a
multivariate context the median leverage should not anymore affect leverage, because one
controls for the determinants of capital structure simultaneously. To explain the explanatory
power, Frank/Goyal (2007) assert that managers use industry median leverage as a benchmark
within the industry or some sort of target capital structure to which they adjust (e.g. Hovaki-
mian et al. (2001) find that firms adjust to the industry median leverage). Alternatively, the
relationship might be explained by industry median leverage accounting for omitted factors
common to the industry, such as product market interactions or the nature of competition.
Furthermore, MacKay/Phillips (2005) suggest that firms’ operational leverage relative to the
industry median and the industries’ degree of competition are important determinants of capi-
tal structures as well.
f. Expected Inflation (+)
There is cross-sectional evidence that the relationship between expected inflation and leverage
is positive. Among the six core factors suggested by Frank/Goyal (2007), expected inflation is

11
probably the least reliable due to estimation based upon the difficulty to observe expectations
in general and the low frequency of observations for macroeconomic data.
In their survey article, Frank/Goyal (2008) identify additional stylized facts in empirical capi-
tal structure research. These include, among others, further facts about financing decisions at
the aggregate level. For instance, over long periods of time, leverage of U.S. firms at the ag-
gregate level has been found to be stationary with the aggregate market-based leverage ratio
of 0.32. Also, market conditions have some impact on corporate financing decisions. For in-
stance, Baker/Wurgler (2002) find that firms time the market, which means they issue equity
when market conditions are good and repurchase equity when market conditions are bad. Ho-
vakimian et al. (2001) find that firms tend to issue equity following a stock-price run-up.
However, to which extent market conditions can explain capital structure is contended in the
literature, mostly because these results are challenged on econometric grounds (see e.g. Ho-
vakimian (2004) and Kayhan/Titman (2007)).
III. Stylized Facts for German Exchange Listed Firms
In order to illustrate the relationship between the “core” determinants discussed in the preced-
ing section and firm leverage, Tab. 1 summarizes the results of ordinary least squares (OLS,
fourth column) and fixed effects regressions (fifth column) for non-financial German firms in
the period from 1987 to 2006.4 In both models, the market-value-based debt ratio is regressed
on a set of explanatory variables that have been used by Rajan/Zingales (1995). Also, in both
models dummy variables for the year of the observation are included (omitting one year to
avoid collinearity). The fixed-effects estimator includes a set of indicator variables (dummies)
for all companies instead of the common intercept term.
In the table, all coefficient estimates are highly significant, independent of the method of es-
timation. Also, the year dummies are jointly significant in both regressions. Hence, time-
variant factors that are common to all firms (like the interest rate level and other macro va-
riables) systematically affect capital structure choices in Germany. In the fixed effects regres-
sion, the null hypothesis that all firm fixed effects are jointly equal to zero has to be rejected,
indicating firm-specific but time invariant variables (like e.g. the industry affiliation) to be
systematic determinants of capital structure choices for German exchange listed companies as
well.

12
The signs of estimated coefficients for German firms generally correspond to the findings of
Rajan/Zingales (1995), and Frank/Goyal (2007) for U.S. firms. Hence, the market debt ratio
decreases in firm profitability and the market-to-book ratio as the proxy for firms’ growth
opportunities. The debt ratio increases in firm size and the availability of tangible assets to
firms. An often cited finding by Rajan/Zingales (1995) is their negative estimate of the coeffi-
cient on firm size for German firms, while the authors report a positive relationship for all
other countries. Our evidence shows that this finding for Germany is not robust, when using a
larger sample and a panel of firm observations.
Tab. 1: OLS and fixed effects regressions for the Rajan/Zingales (1995) variables for German firms, 1987-
2006
The dependent variable is market leverage. All regressor variables are lagged one year. Year dummies have been included. Sign RZ/FG is the sign of the coefficient estimate found in Rajan/Zingales (1995) and Frank/Goyal (2007) for the United States. Sign RZ DE is the sign of the coefficient estimate found in Rajan/Zingales (1995) for Germany. OLS standard errors are White heteroscedasticity-consistent standard errors. p-values are in paren-theses. *, **, *** indicate significance at the 10%, 5%, and 1% level, respectively.
Regressors Sign FG/RZ Sign RZ DE OLS Regression Fixed Effects Regression
Constant -0.289 (0.000)*** -0.458 (0.000)***
Profitability [-] [-] -0.304 (0.000)*** -0.242 (0.000)***
Size [+] [-] 0.038 (0.000)*** 0.051 (0.000)***
Market-to-Book [-] [-] -0.014 (0.000)*** -0.007 (0.000)***
Tangibility [+] [+] 0.171 (0.000)*** 0.113 (0.000)***
N 8802 8802
R-squared 0.283 0.247
F-test 141.57 (0.000)*** 96.16 (0.000)***
F-test fixed effects - 17.06 (0.000)***
F-test year dummies 20.91 (0.000)*** 40.97 (0.000)***
Tab. 2 summarizes the results of OLS and fixed effects regressions for German firms, addi-
tionally including the core factors industry debt and expected inflation. The significance of
the Rajan/Zingales (1995) factors does not change after the inclusion. The coefficient signs
correspond to the findings by Frank/Goyal (2007), except for expected inflation in the fixed
effects regression. The most important variables in terms of their magnitude are profitability
and industry median debt.

13
Tab. 2: OLS and fixed effects regressions for the Frank/Goyal (2007) variables for German firms, 1987-
2006
The dependent variable is market leverage. All regressor variables are lagged one year. Year dummies have been included. Sign FG is the sign of the coefficient estimate found in Frank/Goyal (2007). OLS standard errors are White heteroscedasticity-consistent standard errors. p-values are in parentheses. *, **, *** indicate significance at the 10%, 5%, and 1% level, respectively.
Regressors Sign FG OLS Regression Baseline Model (Fixed Effects)
Constant -0.345 (0.000)*** -0.493 (0.000)***
Profitability [-] -0.314 (0.000)*** -0.237 (0.000)***
Size [+] 0.033 (0.000)*** 0.050 (0.000)***
Market-to-Book [-] -0.013 (0.000)*** -0.007 (0.000)***
Tangibility [+] 0.162 (0.000)*** 0.112 (0.000)***
Industry Median Debt [+] 0.334 (0.000)*** 0.111 (0.000)***
Expected Inflation [+] 0.006 (0.066)*** -0.007 (0.005)***
N 8802 8802
R-squared 0.305 0.259
F-test 160.59 (0.000)*** 94.02 (0.000)***
F-test fixed effects - 16.41 (0.000)***
F-test year dummies 24.65 (0.000)*** 43.68 (0.000)***
As we will argue below, when analyzing capital structure issues using data that consist of a
panel of firms repeatedly observed over time, controlling for unobservable time-invariant
firm-specific effects is a minimum requirement to the applied econometric method. Therefore,
the fixed effects regression shown in column 4 of Table 2 constitutes our baseline model
throughout the paper, which can then be compared to the results of other methods and empiri-
cal designs we will discuss in the following sections.
C. Econometric Issues in Capital Structure Research
I. Panel Data
Very often, firm-specific variables such as book values of debt, size proxies, or profitability
are observed as panel data, i.e. with a large number of observations in the cross-section (indi-
viduals) over short periods of time. Many studies do not adapt their econometric specifica-
tions to the panel nature of their data. This has two major drawbacks. First, the (additional)

14
information content of observing the same individual repeatedly is not fully exploited, and,
second, drawn inferences may be flawed.5
The severity of this problem is illustrated by an exercise of Petersen (2007). He has searched
a selection of the top finance journals for empirical studies using panel data in their analysis.
Tab. 3 summarizes his findings on the applied methods to adjust standard errors for the panel
nature in 207 papers.6
Tab. 3: Standard error adjustment in finance studies
Estimators and adjustment of standard errors in 207 studies relying on panel data and being published in top finance journals, as reported in Petersen (2007).
Estimation and Adjustment of Standard Errors Percentage (%)
No adjustment 42
Adjustment
Fama and MacBeth 34
Fixed Effects 29
OLS and White 23
OLS and Newey-West 7
Petersen (2007) finds that in 42% of the papers the standard errors have not been adjusted for
any type of correlation in the error terms, i.e. completely ignoring the panel structure of the
data. If standard errors were adjusted, the Fama/MacBeth (1973) procedure has been used
most often, with a share of 34%. However, since this method only corrects for the panel na-
ture of data in a very specific way (basically only correcting for time fixed effects), this popu-
lar choice of methodology can potentially affect the reliability of drawn inferences also in
many studies of capital structure issues.
Originally, Fama/MacBeth (1973) have used their procedure to test implications of the CAPM
empirically. In this procedure )1( xT returns ir for each cross-sectional unit i = 1,…,N are
regressed on some )1( xT factor variables in the first-stage. The results of this regression are
)1( xN OLS coefficient vector estimates. These are in turn used as explanatory variables in
the second stage cross-sectional regression of )1( xN returns tr for each time period t . The
Fama/MacBeth (1973) coefficient estimator is then just the time series average of OLS coeffi-
cient estimates of the return for each time period.

15
There are variants of this estimator, which differ in the use of the estimation technique in the
second stage of the two-pass procedure. Instead of using OLS, in some variants Generalized
Least Squares (GLS) or Weighted Least Squares (WLS) are applied in the second stage with
weighting matrices based on the residuals of the first stage OLS regressions.7
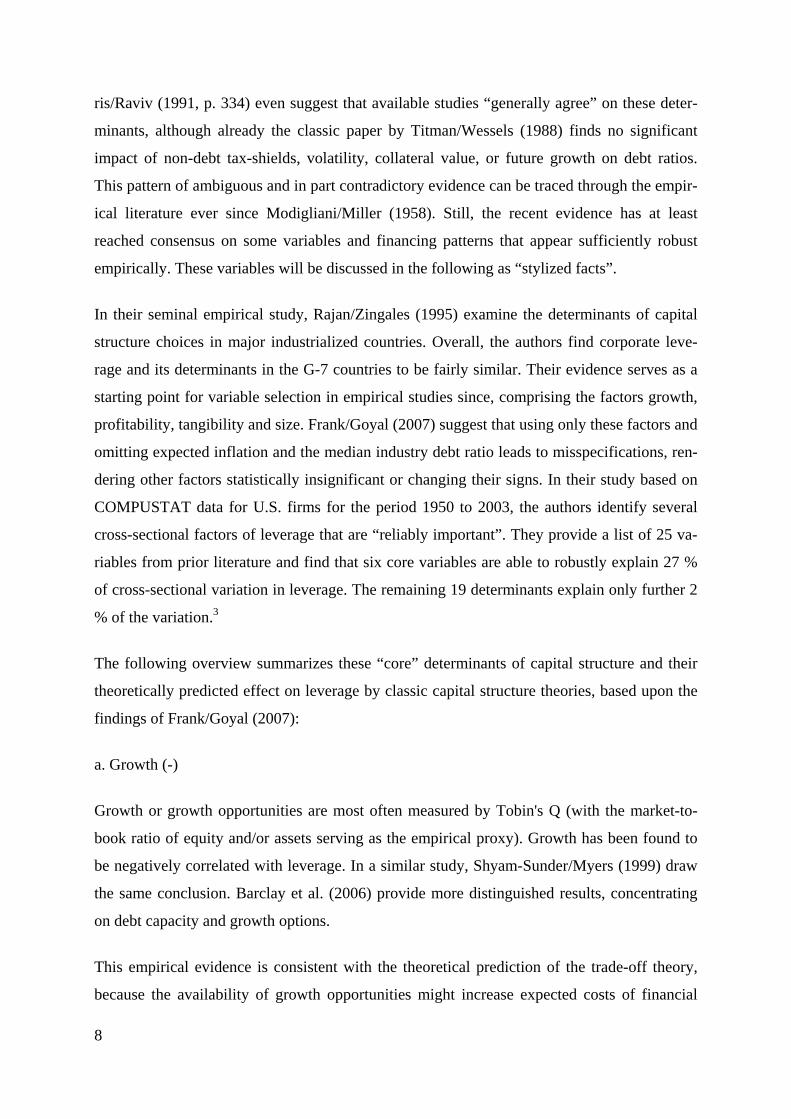
The version of the Fama/MacBeth (1973) procedure that is frequently used in the corporate
finance or capital structure context is just to conduct the second stage of the procedure above,
using OLS. For panel data with small T and large N , the cross-sectional coefficient vector is
estimated using OLS for each time period. The Fama/MacBeth (1973) estimator is then again
just the time-series average of cross-sectional OLS estimates over the time periods. The Fa-
ma/MacBeth (1973) procedure in general is visualized in Fig. 3.
Fig. 3: Fama/MacBeth (1973) procedure
The Fama/MacBeth (1973) procedure used in the capital structure context yields the estimator FMβ̂ by taking
the time series average (t = 1,...,T) of cross-sectional (i = 1,...,N) OLS coefficient estimates tβ̂ .
It is a common misunderstanding that this procedure corrects for the major correlation prob-
lem in typical panel data. Basically, there are two possibilities of error term correlation in re-
gressions with financial panel data. First, the error terms of a time period may be correlated
over the cross-section. This shall be called cross-sectional correlation and results for example
when the same macroeconomic factors are relevant for all firms in the sample, or time-series
of returns are examined. Petersen (2007) simulates a linear model with a time-variant unob-
served variable that is constant over the cross section, which produces such correlation struc-
∅→
t=1 ...
...
...
...
t=2 t=3 t=T
i=1
i=2
i=3
Cross-sectional Regressions
... 1β̂ 2β̂ 3β̂ Tβ̂ FMβ̂
i=N

16
ture in the error terms. The Fama/MacBeth (1973) procedure, which is designed for this type
of problem, yields unbiased standard error estimates in his simulations.
Second, the error term for a given cross-sectional unit (an individual like a firm) will probably
be correlated over time, since repeated observations from one company will be more similar
to each other than observations across companies. This shall be called serial correlation.
Moreover, it is likely that some capital structure relevant variables cannot be observed, result-
ing in endogeneity problems due to omitted variables. If the unobserved variable is time-
invariant, this will cause serial correlation in the error terms as well. Using Monte-Carlo-
simulations, Petersen (2007) shows that both OLS and the Fama/MacBeth (1973) standard
errors are systematically biased downward in this case. As a result, the Fama/MacBeth (1973)
procedure should not be used with regression specifications in a capital structure context,
when it is likely that some relevant variables are unobservable, or in the likely case that firm
heterogeneity is prevalent. Otherwise, inference based upon Fama/MacBeth (1973) standard
errors will produce too large test statistics and reject test hypotheses too often.
In the capital structure context, where the major econometric problem is firm heterogeneity,
instead of the Fama/MacBeth (1973) procedure one should use panel estimators. The standard
fixed effects estimator controls for firm heterogeneity by allowing for firm specific intercept
terms in the regression (Greene 2003, chap. 13), which corresponds to the inclusion of dum-
my variables for each individual (firm) in the sample.8 This estimator is consistent in the clas-
sic panel context, because it takes out the common, time invariant and firm-specific compo-
nent in the regression’s error term.
Tab. 4 summarizes the results of a Fama/MacBeth (1973) regression for the sample of Ger-
man firms. Compared to the fixed effects regression results, the signs and magnitudes of the
estimated coefficients remain stable.9 Also, inference on the six core variables of Frank/Goyal
(2007) is basically not affected, since standard errors are very small, such that the downward
bias of the Fama/MacBeth (1973) regression does not affect the results, as compared to the
fixed effects baseline model. There is no reason to expect this to be a general result, however.

17
Tab. 4: Fama/MacBeth (1973) regression for German firms, 1987-2006
The dependent variable is market leverage. All regressor variables are lagged one year. Year dummies have been included. Sign FG is the sign of the coefficient estimate found in Frank/Goyal (2007). p-values are in parenthes-es. *, **, *** indicate significance at the 10%, 5%, and 1% level, respectively.
Regressors Sign FG Fama/MacBeth (1973) Regression Baseline Model (FE)
Constant -0.150 (0.000)*** -0.493 (0.000)***
Profitability [-] -0.362 (0.000)*** -0.237 (0.000)***
Size [+] 0.029 (0.000)*** 0.050 (0.000)***
Market-to-Book [-] -0.037 (0.000)*** -0.007 (0.000)***
Tangibility [+] 0.124 (0.000)*** 0.112 (0.000)***
Industry Median Debt [+] 0.350 (0.000)*** 0.111 (0.000)***
Expected Inflation [+] - -0.007 (0.005)***
N 8802 8802
R-squared 0.363 0.259
F-test 366.26 (0.000)*** 94.02 (0.000) ***
F-test fixed effects - 16.41 (0.000)***
F-test year dummies - 43.68 (0.000)***
II. Endogeneity
In the econometric context, a regressor is said to be endogenous if it is correlated with the
error term of the data generating process in the population. Endogeneity problems mainly
arise due to omitted variables, measurement error of explanatory variables, or if there is (also)
a reverse causality between the dependent and the explanatory variables, i.e. the dependent
variable causing some explanatory variable as well.10 The consequence of endogeneity is that
OLS will be biased and inconsistent, which renders all point estimates of coefficient and infe-
rences invalid.
The problem of omitted variables is presumably the most common reason for endogeneity.
For instance, endogeneity may occur if either some variable suggested by the underlying
theory in a capital structure analysis is ignored, or the variable cannot be considered due to
data unavailability. As a consequence, the variation of the omitted variable is captured in the
error term. If omitted variables are correlated with some regressors in the specification, the
error term and these regressors will be correlated and thus be endogenous.

18
This problem can be alleviated, if the omitted variables are time invariant. A simple fixed
effects panel estimator would be robust, because the dummy variables included to control for
the individual effect automatically control for any time-invariant variable. This constitutes a
compelling reason to employ panel estimators wherever possible. It also makes a strong ar-
gument to use fixed effects (or estimators based on first-differencing) rather than random ef-
fects estimators, because random effects require that the regression’s other explanatory va-
riables are uncorrelated with the individual effects (Greene 2003, chap. 13).
A further possible source of endogeneity can arise if some relevant variables are measured
with error. Very often, there is only the availability of some proxy variable that naturally
measures the true variable with some error. For instance, in capital structure research it is
common to include a regressor controlling for growth opportunities of a firm. A standard
proxy for this variable is Tobin's Q, typically measured by the market value of assets divided
by the book value of assets. This proxy can only be a noisy signal for true growth opportuni-
ties, because it is just one of the set of possible measures for growth opportunities (only
broadly reflecting the idea to measure the marginal benefit of investment relative to its mar-
ginal costs), and it is based upon book values that are often proxies and imperfect measures of
some variable of interest themselves. The resulting measurement error is captured by the error
term and can lead to correlation of the error term and regressors.
Given endogenous regressors, standard OLS coefficient estimates are biased and inconsistent,
that is, their probability limits are not the true values of the data generating process in the
population. One possibility to cope with these types of endogeneity is to apply instrumental
variable estimation. A feasible instrument is one which is sufficiently correlated with one of
the endogenous variables, but not with the others. However, it is often difficult to find appro-
priate instruments, though panel data often offers a solution by relying on lagged values of
variables, which then are predetermined. The caveat is, as demonstrated by the classic study
by Nelson/Startz (1990) that instrumental variable techniques can lead to very poor finite-
sample results, if the instruments are weak.
In capital structure studies, usually a multitude of explanatory variables, which are potentially
endogenous with the debt ratio is used. For instance, endogeneity arises in this context, if ad-
justments of the capital structure take time (see the next section for a discussion of dynamic
adjustments), if capital structures are chosen to maximize firm value as approximated by To-
bin’s Q, if some explanatory variables are measured with error, and so on. Hence, as a general

19
recommendation, researchers on capital structure issues should systematically at least docu-
ment, whether their main findings are unaffected, if they try to take potential endogeneity into
account.
To illustrate the sensitivity of results, when considering potential endogeneity , Tab. 5 sum-
marizes the results of an instrumental variable regression with fixed effects applied to our
sample of German firms. In this illustration, the endogenous lagged dependent variable, the
(market) debt ratio, is instrumented with lagged book leverage. This is the situation addressed
in detail by Flannery/Rangan (2006), discussed in Sections D.I.2 of this paper.
Compared to the baseline results repeated in column 4 of Table 5, the industry median debt
ratio and expected inflation lose their significance. Also, the magnitudes of some effects de-
crease significantly, for instance for profitability and tangibility, compared to the fixed effects
regression.
It is important to emphasize, that applying an instrumental variable regression for some poten-
tially endogenous variables is no sufficient condition for having “better” results, in particular,
because of the weak instrument problem, and the multitude of possibly endogenous variables.
The best a researcher can hope to find is that estimation results are qualitatively not affected,
when taking endogeneity into account. In our German illustration, this is not the case, since
the significance of some variables vanishes and coefficient magnitudes change. Without fur-
ther analysis, it remains unclear, whether the baseline model or the instrumental variables
estimation is preferable. The results in Tab. 5 illustrate, however, that applying an instrumen-
tal variables estimator can have a strong impact on estimation results.

20
Tab. 5: Fama/MacBeth (1973) regression for the Frank/Goyal (2007) variables for German firms, 1987-
2006
The dependent variable is market leverage. All regressor variables are lagged one year. Year dummies have been included. Sign FG is the sign of the coefficient estimate found in Frank/Goyal (2007). Lagged market leverage has been instrumented with lagged book leverage. p-values are in parentheses. *, **, *** indicate significance at the 10%, 5%, and 1% level, respectively.
Regressors Sign FG Instrumental Variable with Fixed Ef-fects Regression Baseline Model (FE)
Constant -0.222 (0.000)*** -0.493 (0.000)***
Lagged Market Leverage 0.492 (0.000)*** -
Profitability [-] -0.066 (0.000)*** -0.237 (0.000)***
Size [+] 0.025 (0.000)*** 0.050 (0.000)***
Market-to-Book [-] -0.003 (0.000)*** -0.007 (0.000)***
Tangibility [+] 0.049 (0.000)*** 0.112 (0.000)***
Industry Median Debt [+] -0.023 (0.154)*** 0.111 (0.000)***
Expected Inflation [+] 0.000 (0.945)*** -0.005 (0.073)***
N 8802 8802
R-squared 0.722 0.259
F-test - 94.02 (0.000)***
F-test fixed effects 2.22 (0.000)*** 16.41 (0.000)***
F-test year dummies - 43.68 (0.000)***
III. Dynamic Adjustment
Dynamic adjustments of actual capital structures should be incorporated into an empirical
model, when adjustment costs keep firms away from their desired debt ratio, at least in the
short run (Leary/Roberts 2005). To this end, the model needs to include a lagged dependent
variable. Accordingly, dynamic adjustment cannot be captured econometrically, when relying
on a cross-section of firms. Panel data, however, inherently allows incorporating these partial
adjustment issues. Unfortunately, standard panel estimators like the fixed effects regression
are biased, when a lagged dependent variable is included in the true data generating process
(Arellano/Bond 1991). In this case, the lagged dependent variable is correlated with the error
term, and thus necessarily endogenous. This effect is not resolved, when taking first differ-
ences, as e.g. the fixed effects estimator implicitly does (Greene 2003, chap. 13).
As an econometric solution to this problem, one can use so-called dynamic panel estimators,
which rely on instrumental variables estimation in the Generalized Method of Moments-

21
framework (GMM). For example, the Arellano/Bond (1991) estimator takes first differences
of the panel data (thereby wiping out the individual effects) and resolves the endogeneity
problem by using lagged levels and differences of the dependent variable as instruments in a
GMM framework. This estimator is for a large number of individuals with few time observa-
tions (i.e. panel data) asymptotically unbiased.
Huang/Ritter (2007) analyze several econometric methods that can be applied to estimate par-
tial adjustment models in the capital structure context. Mainly, researchers are in this context
interested in the speed of adjustment, that is, one minus the estimated coefficient on the
lagged dependent variable in the partial adjustment models. In the capital structure context,
debt ratios as dependent variables tend to exhibit large persistence. A large part of variation of
future debt ratios can be explained by past debt ratios, which may result in coefficient esti-
mates of the lagged dependent variable near to one. A simple measure of persistence is the
correlation of market leverage and its first lag, which for example is 0.87 for our sample of
German firms.
Given this magnitude of persistence, Huang/Ritter (2007) show that standard econometric
methods are unable to obtain unbiased estimates of the speed of adjustment in partial adjust-
ment models for finite sample. The authors conduct several Monte Carlo simulations in order
to calculate the biases associated with common methods in the analysis of debt ratio changes,
given the typical financial panel data structure. Huang/Ritter (2007) find that applying pooled
OLS leads to upward biased coefficient estimates and applying fixed effects estimation leads
to a downward bias of the estimate of the speed of adjustment. Moreover, the bias with fixed
effects estimation increases the smaller the time dimension of the data.
In their simulations, Huang/Ritter (2007) also find that first differencing GMM estimators
such as Arellano/Bond (1991) and system GMM estimators such as Arellano/Bover (1995) or
Blundell/Bond (1998) may all be substantially biased for the considered type of data, condi-
tional on the true speed of adjustment. The bias mainly occurs, because first differences of
highly persistent dependent variables are close to zero, rendering first differences of the de-
pendent variable weak instruments. In their setup, the estimator with the smallest finite-
sample bias is the Hahn et al. (2007) long differencing estimator, because this estimator is
based upon less moment conditions and remedies the problem of weak instruments.

22
To illustrate the impact of taking dynamic adjustments into account and relying on different
estimators, Tab. 6 summarizes the results of an Arellano/Bond (1991) regression, instrumental
variables with fixed effects, and fixed effects regressions for our sample of German firms. We
do not report estimation results for the Hahn et al. (2007) long-difference estimator, because
this estimator is not yet implemented in standard econometric software.
Tab. 6 shows that the Arellano/Bond (1991) coefficient on lagged market leverage is about
one third larger than the instrumental variable estimate for German companies. Thus, different
econometric methods can yield substantial differences in the estimation of speeds of adjust-
ment with highly persistent data. Note that the adjustment speed for deviations from the target
is equal to one minus the coefficient on the lagged dependent variable. Hence, for German
firms, Tab. 6 shows a much faster speed of adjustment estimate using the instrumental varia-
ble estimation than with the mean differencing Arellano/Bond (1991) estimation. This finding
is consistent with Huang/Ritter (2007), who find downward-biased speeds of adjustment for
mean differencing methods.
Finally, it is remarkable that incorporating dynamic adjustment (and the choice of the estima-
tor) has a severe impact on the other model implications. In the Arellano/Bond (1991) regres-
sion, coefficients on profitability, market to book and industry median debt have the opposite
sign than in the baseline model, still being highly significant. Coefficient signs remain unal-
tered using the fixed effects model with an instrumented lagged dependent variable, though as
with the Arellano/Bond estimator, tangibility and size lose their significance. Below, the sec-
tion on dynamic trade-off models will provide further empirical evidence on different speeds
of adjustment.
It is worth emphasizing that due to the high persistence of debt ratios, probably none of the
estimation results shown in Tab. 6 will reflect true adjustment speeds, but the methodological
papers discussed seem to suggest, that the Arellano/Bond results in the third column of Tab. 6
are likely to be least reliable (also see Flannery/Rangan 2006). It remains an open issue,
which dynamic panel estimator has in the context of capital structure data adequate finite-
sample properties. The work by Hahn et al. (2007) and Huang/Ritter (2007) provide some
initial insights in this regard, but further research needs to be done.

23
Tab. 6: Arellano/Bond (1991) regression, instrumental variables with fixed effects, and fixed effects re-
gressions for German firms, 1987-2006
The dependent variable is market leverage. All regressor variables are lagged one year. Year dummies have been included. Sign FG is the sign of the coefficient estimate found in Frank/Goyal (2007). Lagged market leverage has been instrumented with lagged book leverage. p-values are in parentheses. *, **, *** indicate significance at the 10%, 5%, and 1% level, respectively.
Regressors Sign FG
Arellano/Bond (1991) Regression
Instrumental Varia-ble with Fixed Ef-fects Regression
Baseline Model (FE)
Constant 0.085 (0.408)*** -0.222 (0.000)*** -0.493(0.000)***
Lagged Market Leverage 0.726 (0.000)*** 0.492 (0.000)*** -
Profitability [-] 0.146 (0.000)*** -0.066 (0.000)*** -0.237 (0.000)***
Size [+] 0.003 (0.651)*** 0.025 (0.000)*** 0.050 (0.000)***
Market-to-Book [-] 0.001 (0.025)*** -0.003 (0.000)*** -0.007 (0.000)***
Tangibility [+] 0.018 (0.461)*** 0.049 (0.000)*** 0.112 (0.000)***
Industry Median Debt [+] -0.127 (0.000)*** -0.023 (0.154)*** 0.111 (0.000)***
Expected Inflation [+] 0.004 (0.006)*** 0.000 (0.945)*** -0.005 (0.073)***
N 7704 8802 8802
F-test fixed effects - 2.22 (0.000)*** 16.41 (0.000)***
F-test year dummies 597.09 (0.000)*** - 43.68 (0.000)***
D. Promising Directions of Empirical Capital Structure Research
I. Shocks to the Capital Structure and Adjustment Behavior
1. Equity Value Shocks
Since the existence of firm adjustment behavior to capital structure shocks appears as the
main feature that allows for testing the trade-off versus other theories (Myers 1984), one im-
portant way to learn about capital structure issues is to examine firm behavior after exogenous
shocks. The inherent difficulty is to decide (or reach agreement) on the exogeneity of eco-
nomic events. One particularly interesting attempt in the literature to test for adjustment beha-
vior by Welch (2004) relies on market-value-based leverage shocks due to stock price
changes.
The market-value based capital structure changes with the market price of equity, and there-
fore at almost any given point in time, given the volatility of today’s equity markets. How do

24
firms behave after (exogenous) stock return shocks to their market based capital structures?
Welch (2004) examines, whether firms adjust their capital structures after these shocks to
maintain some target debt ratio by issuing and repurchasing debt and equity. The analysis is
based on data of publicly traded U.S. corporations from the period 1962 to 2000 available in
COMPUSTAT and CRSP, where some size restrictions are applied, but financially restricted
firms are included.
Welch (2004) introduces the following variables into his econometric specification: The ac-
tual debt ratio (ADR) and the implied debt ratio (IDR) for all i are given by
11
11
++
++ +=
tt
tt DE
DADR , ( ) tttt
ttt DxE
DIDR++
=+
+1,
1, 1 (1)
The variable 1+tADR is the market-value debt ratio at time 1+t , where 1+tD is debt and 1+tE
is equity at the corresponding time. The variable 1, +ttIDR denotes the debt ratio that is implied
if the firm issued neither debt nor equity from t to 1+t , where 1, +ttx is the stock return with-
out dividends in this period. The Welch (2004) basic regression equation for all i is then
11,2101 +++ +++= ttttt IDRADRADR εααα , (2)
where 1+tε is an error term.
Using this framework, Welch (2004) tests two hypotheses. First, if firms perfectly readjust
after equity shocks, the current actual debt ratio should correspond to the future actual debt
ratio, suggesting 0,1 21 == αα . Second, if firms do not readjust at all after stock return
shocks, but let their capital structure fluctuate freely, this suggests 1,0 21 == αα .
Using the Fama/MacBeth (1973) procedure, Welch (2004) obtains the following coefficient
estimates
( ) ( )
%3.96,02.105.0ˆ 21,57.72871.351 =+−= +−+ RIDRADRRDA tttt , (3)

25
where t-statistics are reported in parentheses. The estimated ADR coefficient for the yearly
data is economically very close to zero and the estimated IDR coefficient is almost equal to
one.
Hence, firms do not readjust their capital structure to a target value after equity value changes
within a year. The future actual debt ratio is basically one-to-one determined by IDR in this
specification. Welch (2004) conducts further regressions that consider different time horizons
of more than a year, finding only weak adjustment behavior even in the long-run. Equity
shocks remain the main determinant of capital structure in his analysis also after controlling
for standard proxies used in capital structure research.
The Welch (2004) study exemplifies the basic idea of using exogenous shocks to capital
structures to test for firm adjustment behavior. However, it also illustrates the typical problem
– if investors in equity markets are fully rational, and stock prices reflect available informa-
tion, then the equity value will reflect future expected changes in the determinants of firm
capital structure. In turn, if the capital structure affected firm value, the capital structure and
the change in equity value would be endogenous. This causes some concerns, whether the
analysis by Welch (2004) indeed represents a valid test for firm adjustment behavior.
The study also raises several other issues:
Sample Selection: Welch’s (2004) sample includes firms with regulated capital structure, like
banks.
Estimation: Inference is based on standard panel estimators, which are biased in the context of
dynamic adjustments. This is potentially relevant under the hypothesis of any adjustment be-
havior, since the right-hand side of equation (2) includes a lagged dependent variable.
Implicit Restrictions: There might be a difference in firm reaction with regard to expected
versus unexpected stock price changes. The Welch specification assumes that firms react sim-
ilar to either of the two, since the implied debt ratio reflects both effects and allows for just
one coefficient of adjustment.
However, it seems that most of these issues do not affect the qualitative result of Welch
(2004). Elsas/Florysiak (2008) use Monte Carlo simulations to analyze the empirical proper-
ties of several estimators in the Welch setting of capital structure analysis. As it turns out,

26
simple OLS and the Fama/MacBeth (1973) approach are the most robust estimators in this
context and show only a minor bias of coefficients (as opposed to the Arellano/Bond (1991)
dynamic panel estimator, which is heavily biased in this setting).
Moreover, when replicating the Welch (2004) analysis relying on the same merged COM-
PUSTAT/CRSP database, regression results are unaffected by the sample characteristics. For
example, if Welch’s (2004) firm size-selections are ignored and firms with a regulated capital
structure are excluded from the sample (i.e. financials and utilities), OLS results read as fol-
lows
( ) ( )
117087,37,990.0072.0ˆ1,96.20905.151 ==+−= +−+ NTTIDRADRRDA tttt . (4)
It matters, however, if one differentiates between expected and unexpected shocks to equity
prices (and therefore capital structure). Using estimated betas and implied expected returns
from a 5-year rolling-window estimation, an OLS estimate of on lagged tADR , the
expected debt ratio 1, +ttEDR (i.e. the expected capital structure taking expected stock returns
into account) and the unexpected change in capital structure (‘ 1+tSurprise ’) is
( ) ( ) ( )
22,952.0553.0341.0ˆ10.761,7.28.11 =++= +++ TSurpriseEDRADRRDA ttttt . (5)
Note that adding and yields 1, +ttIDR . Equation (5) implies that firms do
adjust to expected changes in the capital structure, since the coefficient on is much
smaller than one. The coefficient of 0.952 on Surprise shows that there is little adjustment to
unexpected shocks, however. This result implies to examine a more elaborated model of dy-
namic capital structure adjustments, which is the basic idea of Flannery/Rangan (2006).
2. Dynamic Adjustment to Target Leverage and Adjustment Speed
In the dynamic version of the classic trade-off theory, target leverage can be time-varying. If
there are (for any reason) deviations from the optimal capital structure, the theory states that
there will be adjustment toward the “optimal” target. Depending on the costs of adjustment,
target leverage will be adjusted at a different pace.11 The major objective of capital structure
research using dynamic partial adjustment models is then to estimate the speed of adjustment.
In this regard, this strand of the literature is similar to Welch (2004), but the designs differ
1+tADR
1, +ttEDR 1+tSurprise
1, +ttEDR

27
fundamentally in terms of the empirical model. And contrary to Welch (2004), these studies
systematically find adjustment behavior, though speed of adjustment estimates are within a
rather large range.
Flannery/Rangan (2006) analyze whether U.S. firms indeed have long-run target capital struc-
tures and if so, how fast they adjust to this target. In comparison to prior studies, they put spe-
cial emphasis on the econometric methods and the model specification, emphasizing the need
to take the panel nature of the data into account.12
Target leverage of firm i at time 1+t is determined by a vector of firm characteristics itX
that are related to the trade-off between the costs and benefits of debt in different capital
structures.13 Target leverage is given by
ittiMDR βX=+*
1, , (6)
where β is a coefficient vector, and MDR denotes market debt ratio.14 For firms to have a
target capital structure, there must be at least some elements of β different from zero.
The partial adjustment model of Flannery/Rangan (2006) is given by
( ) ( ) 1,,1,~1 ++ ++−+= tiitiitti MDRMDR δμλλ Xβ , (7)
where λ is the adjustment speed coefficient, iμ a time-invariant unobserved variable (firm
fixed effect), and 1,~
+tiδ an error term. The speed of adjustment is assumed to be the same for
all firms and captures the extent to which deviations from optimal leverage are eliminated in
each period: if the current deviation from the target debt ratio marginally increases, the differ-
ence between the future and the current debt ratio increases by λ . If 0=λ , the speed of ad-
justment is zero, that is, there is no adjustment at all. If 1=λ , the speed of adjustment is infi-
nitely high, that is, the debt ratio is always at its target value.
Tab. 7 shows results of instrumental variable estimations controlling for time-invariant and
firm-invariant unobserved variables (time and firm fixed effects) of the partial adjustment
model in (7). It summarizes the core regression results of Flannery/Rangan (2006) shown in
their Table 2, model 7, and compares them to a similar regression for our German firm sam-
ple. Slight differences in the empirical model for Germany occur, because data for construct-
28
ing a rating dummy is not available for the German sample. However, few non-financial firms
in Germany are rated, such that we do not expect this to affect the empirical results. Similar to
Flannery/Rangan (2006), we include a dummy indicating if German firms did not report re-
search & development expenditures (R&D), and set in this case the variable to zero. This
serves to avoid biases from the fact that reporting R&D expenditures is voluntary under both
the U.S. and German accounting standards.
In terms of the Flannery/Rangan (2006) results in column 3, most of the firm characteristics
itX that determine the target capital structure are highly significant after controlling for the
lagged market debt ratio, which supports the existence of a target leverage. According to the
estimated coefficient on tiMDR , , the speed of adjustment is 344.0656.01 =−=λ , thus signif-
icantly different from zero in a statistical and economic sense. Hence, about 34 % of the devi-
ation from optimal leverage is eliminated in each period, taking about three years for the av-
erage firm to adjust to its target capital structure following shocks. The corresponding estima-
tion results for German firms (column 2) show that the adjustment speed is at 49% much fast-
er. In terms of the other explanatory variables, estimated coefficients for market-to-book, in-
dustry median leverage and R&D expenditure exhibit the largest differences between the
German and the U.S. sample. For example, market-to-book is significant in the German sam-
ple and insignificant with Flannery and Rangan (2006), where the opposite holds for industry
median leverage. Moreover, the effect of R&D expenditures is much larger in the German
sample. Similar to Flannery/Rangan (2006), however, firm fixed effects explain a large pro-
portion of the cross-sectional variation of the market debt ratio of German firms.15 Ignoring
firm-individual effects would lead to much lower adjustment speed estimates and a mis-
specified model, emphasizing the need to take the panel nature of the data into account.

29
Tab. 7: Flannery/Rangan (2006) regression results and instrumental variables with fixed effects regression
for German firms, 1987-2006
The dependent variable is market leverage. All regressor variables are lagged one year. Year dummies have been included. Lagged market leverage has been instrumented with lagged book leverage. Depreciation and R&D expenditure are divided by total assets. p-values are in parentheses. *, **, *** indicate significance at the 10%, 5%, and 1% level, respectively.
Regressors Instrumental Variable Regression, Fixed Effects (German sample)
Flannery and Rangan (2006), Instrumental Variable Regression, Fixed Effects (U.S. firms)
Constant -0.216 (0.000)*** -
Lagged Market Leverage 0.506 (0.000)*** 0.656 (0.000)***
Profitability -0.075(0.000) *** -0.030 (0.000) ***
Size 0.025 (0.000) *** 0.025 (0.000) ***
Market-to-Book -0.003 (0.000)*** 0.000 (0.418) ***
Tangibility 0.057 (0.000) *** 0.053 (0.000) ***
Industry Median Debt -0.025 (0.124) 0.034 (0.000) ***
Depreciation -0.104 (0.000) *** -0.226 (0.000) ***
Expected Inflation -0.000 (0.960) -
R&D Expenditure -0.166 (0.005) *** -0.025 (0.000) ***
No R&D Expenditure Re-ported [Dummy]
-0.011 (0.014)** 0.000 (0.010) ***
Firm is Rated [Dummy] - 0.003 (0.087)*
N 8,802 111,106
R-squared 0.465 0.466
F-test fixed effects 2.16 (0.000)*** -
Wald-test year dummies 1068.2 (0.000)*** -
Complementing the type of analysis of dynamic adjustment behavior as exemplified by the
Flannery/Rangan (2006) study, some studies combine a theoretical and empirical analysis.
The underlying theoretical models are constructed such that they account for as many stylized
facts as possible, but also generate new hypotheses. The theoretically derived firm behavior is
then simulated, generating data with known properties of the firms’ capital structure determi-
nants. The data is then used to test the characteristics of standard econometric estimators in
this context.
As a recent example for this type of analysis, Titman/Tsyplakov (2007) present a model of the
dynamic trade-off class, incorporating firm investments triggered by product market changes,
deadweight costs of financial distress, and debtholder/equityholder agency problems. They

30
simulate model-generated panel data for debt ratios, cash flows and investment choices and
conduct partial adjustment regressions as in Flannery/Rangan (2006) and others. In this simu-
lated universe, the speed of adjustment is about 7.1% under realistic parameter settings. This
magnitude is similar to the real-world estimates by Kayhan/Titman (2007) and Fama/French
(2002), but slower than the estimate by Flannery/Rangan (2006). Furthermore, Tit-
man/Tsyplakov (2007) show that there is a strong association between the equity returns of
companies and their debt ratios, supporting the similar results by Welch (2004).
3. Major Real Investments
Another strand of the literature analyzes a fundamentally different shock to capital structures
of firms, but in a dynamic context as well. The studies by Mayer/Sussman (2005) and Elsas et
al. (2007) examine dynamic financing patterns of U.S. firms, when these undertake major real
investments from their perspective. Mayer/Sussman (2005) consider equity and debt issues
following spikes in firms’ investment expenditures, while Elsas et al. (2007) examine jumps
(rather than spikes) in capital expenditures. Here, a major investment occurs if
(i) investment expenditures exceed 200% of the firm’s past three years’ average in-
vestment level (its “benchmark” investment), and
(ii) the investment is at least 30% of the firm’s prior year-end total assets.
Note that examining spikes in investment expenditures mainly leads to the identification of
major acquisitions, because the investment pattern is defined to be a major increase followed
by a subsequent corresponding decrease. In contrast, the definition of Elsas et al. (2007) iden-
tifies major acquisitions and internal investment, because no decrease in investment expendi-
tures is mandated.
Both studies pursue the idea that the exercise of very large real investment options allows to
observe major financing decisions by firms. Moreover, if the major real investment is more
driven by the availability of the investment opportunities rather than the availability of in-
vestment funding, it will constitute an exogenous shock to the sample firms’ capital structure.
Another novelty of both studies is that they rely on an event driven framework that is particu-
larly suited to analyze adjustment behavior. Focusing on investment events helps separating
new and extraordinary investments from “normal” investments, which often reflect the main-
tenance of assets already in place. The event perspective allows in addition to trace financing

31
patterns by separating newly issued funds induced by the investment from repayments and
refinancing transactions. Also, as pointed out by Leary/Roberts (2005) and Hovakimian et al.
(2004), if adjusting capital structures entails some fixed cost, firms should be closest to their
desired capital structure after major recapitalizations.
Both studies use the COMPUSTAT universe of North-American firms and identify firm fi-
nancing patterns driven by the major investments out of the cash flow statements of these
firms. This allows for disentangling external from internal investment financing. Surprisingly,
major investments are primarily financed using external funds, in particular debt financing. In
addition, Mayer/Sussman (2005) show that external funds are used before internal funds are
exhausted, contradicting a strict pecking order of financing, though the observed debt prefe-
rence is consistent.
Both studies also show that there is adjustment behavior. Mayer/Sussman (2005) find that
about 70 % of capital structure disturbances due to the investment event are offset after five
years for large firms. Elsas et al. (2007) show in addition, that even in the event year, the fi-
nancing of the major investment moves the firm strongly towards its target capital structure,
in the frequent case, where financing is predominantly based on debt financing.16 However,
equity issuances in both studies contradict patterns consistent with trade-off and pecking order
theory. Mayer/Sussman (2005) report that up to 35 % of event firms issue equity several times
around investment spikes, while Elsas et al. (2007) document that in particular small firms
rely more on equity financing. Elsas et al. (2007) also show that stock-price run-ups preceding
the major investment strongly increase the likelihood of equity issues, consistent with market-
timing behavior.
4. Macroeconomic Shocks
One stream of literature is concerned with the impact of macroeconomic conditions on corpo-
rate leverage. Macroeconomic shocks are highly exogenous to the single firm in the economy.
Within their analysis, Hackbarth et al. (2006) provide an overview of recent theoretical works
in this area. In an empirical study, Campello (2003) analyzes the influence of exogenous
shocks in the product market environment on capital structure, using aggregate demand
shocks as a proxy. He finds that debt financing and relative-to-industry sales growth have a
negative relationship in industries with low industry leverage during recessions, but not dur-
ing booms. This effect cannot be observed in industries with high industry leverage. In a fur-

32
ther empirical analysis, Korajczyk/Levy (2003) also examine the impact of macroeconomic
conditions on leverage, controlling for firm-specific variables. They find financially uncon-
strained firms issue equity pro-cyclically and debt counter-cyclically, although the underlying
economic rationale remains somewhat unclear.
II. Further Potential Determinants of Capital Structure
1. Ratings
The study by Kisgen (2006) emphasizes a determinant of capital structure decisions that has
received only little attention before – the rating of companies by external rating agencies like
Moody’s or S&P. Kisgen (2006) tries to analyze how the financing behavior of firms is af-
fected if firms are near credit rating upgrades or downgrades.17 The basic idea is that under
both the trade-off and the pecking order theory the capital structure depends on the (marginal)
costs of debt and equity. Since rating changes might affect the costs of capital, potential rating
changes through financing decisions can alter the target debt level or the marginal benefit of
debt over equity, rendering the corporate rating a potentially important determinant. Argua-
bly, this effect will be strongest the closer a firm is to a rating change.
Correspondingly, Kisgen (2006) analyzes firm financing decisions, when firms are close to
rating changes and finds that these firms issue significantly less debt than other comparable
firms. This finding is robust even if one controls for several differing approaches to take
“standard” capital structure determinants into account.
However, there is one potential issue with the empirical design of Kisgen (2006). The proxies
he uses to identify firms close to a rating change seem uninformative regarding the probability
of a rating change. His results are primarily based on firms being in a + or – notch on the S&P
corporate rating scale. These are, however, only ordinal categories for some probabilities of
default and not necessarily related to an intended change of the ratings. Indeed, Kisgen (2006)
reports that the likelihood of rating changes is barely different for firms in these notches from
firms in the main categories (although this might be endogenous). As a solution, testing the
validity of the results by Kisgen (2006) could be done by relying on the rating agencies watch
list announcements, where an agency publicly announces that a firm will be examined for a
change in its rating.18

33
2. Competition and Regulatory Changes
Another potential set of determinants of capital structure decisions is the competitive and reg-
ulatory environment of firms. These constitute determinants in the first place, but offer at the
same time the possibility to observe shocks to the firm that are exogenous. The classic study
by Zingales (1998) illustrates this idea.
Zingales (1998) analyzes the impact of financing decisions on the survival of firms in the U.S.
trucking industry. The basic idea of the study is that firm financing decisions and the competi-
tive environment (the industry structure) are endogenous. The trucking industry in the U.S.
had been subject to severe restrictions on price competition. When this was unexpectedly
abandoned, fierce competition started and many market entries occurred. Since this was large-
ly unexpected, pre-deregulation capital structures could not reflect the new environment op-
timally. At the same time, the value of the companies consisted to a large extent of the charter
value of the limited competition. Hence the deregulation induced a huge increase in leverage
once competition set in, inducing potentially a high pressure on firms to lower leverage to get
back to some optimum.
Zingales (1998) estimates survival rates of firms, controlling for pre-deregulation leverage
ratios, firm efficiency, and the ex ante default risk. Highly levered firms are less likely to sur-
vive the exogenous deregulation shock. As an explanation, among others, firms with high
(initial) debt might have fewer possibilities to make investments. Hence, the most efficient
firms and the firms with large internal financial resources survive the deregulation. This pro-
vides evidence showing the relevance of the underinvestment problem due to too high leve-
rage, and therefore evidence on some of the costs typically associated with debt in trade-off
theory. Most remarkably, the unanticipated change in the regulatory framework, probably
constitutes a truly exogenous event, such that the results regarding capital structure issues are
not subject to endogeneity problems.
3. Behavioral Corporate Finance
Fully rational behavior means that all agents in the market have rational expectations and are
expected utility maximizers. In behavioral corporate finance, the assumption of fully rational
investors and managers is abandoned. Beliefs and preferences may be non-standard and thus

34
allow for irrational behavior, and theories taking this into account might lead to new determi-
nants that help improving our understanding of capital structure determinants.19
In the behavioral corporate finance literature, two salient approaches have emerged (see
Neus/Walter (2008) in this issue). In the irrational investors approach, rational managers are
facing irrational investors. The associated literature basically deals with inefficient markets
and rational managers exploiting mispricing, such as the market timing story of Bak-
er/Wurgler (2002).20 In the irrational managers approach, it is assumed that not fully rational
managers are operating in efficient markets, i.e. facing rational investors.
Most of the literature in the irrational managers approach focuses on deviations from rational
expectations. There is some evidence from social psychology that individuals and especially
managers have biased beliefs.21 Some possible distortions in managerial beliefs emphasized in
the behavioral corporate finance literature are optimism and overconfidence (see Barbe-
ris/Thaler (2003) for detailed definitions). Optimism is basically the overestimation of the
expected value of some quantity. For instance, the manager estimates too large a return on a
certain project. This relates to the notion of assessing oneself as being better than average. On
the other hand, overconfidence is the underestimation of the variance of some quantity (i.e.
underestimation of risk). This leads to confidence interval estimates that are too narrow,
where e.g. the manager then estimates too small a range of returns on a certain project.
Ben-David et al. (2007) analyze, whether CFOs are overconfident and whether this has an
impact on corporate policies, including capital structure issues. The authors measure mana-
gerial overconfidence based upon stock market predictions made by CFOs. They use a sur-
vey22 of S&P 500 return forecasts of CFOs between 2001 and 2007, in which they directly ask
CFOs to predict the 10th and 90th percentiles of the one and ten year return distribution.23
Their survey data thus allows for differentiating between overconfidence and optimism (as
defined above), because the gathered information on the estimated index level and the ex-
pected dispersion allows disentangling these two characteristics. Based on their survey, over-
confidence is a measure based upon the implicit standard deviation of estimated confidence
interval bounds.
Ben-David et al. (2007) derive several hypotheses on corporate policies from a simple model
incorporating overconfident managers. The financing-related hypotheses state that overconfi-
dent managers perceive their firms’ equity to be undervalued by the market, that leverage in-

35
creases with managerial overconfidence, and that overconfident managers repurchase shares
more often. They find that CFOs are overconfident, i.e. they underestimate the variance of
market returns, because realized market returns are within the estimated 80 % confidence in-
tervals only 38 % of the time. Since managerial overconfidence might have an impact on
capital structure, it is also important to know, which determinants drive overconfidence. Ben-
David et al. (2007) find that the return confidence interval estimates depend on recent past
returns and on returns of the CFOs' firms. The lower bound of the confidence interval is more
sensitive to past returns than the upper bound, thus managerial overconfidence is fragile and
decreases more after low return periods than it increases after high return periods.
Malmendier et al. (2007) test capital structure-related hypotheses using two alternative meas-
ures of managerial irrationality. First, they infer from revealed beliefs based upon personal
portfolio decisions of CEOs the level of overconfidence.24 CEOs are compensated with stock
options of their firms. Thus, they are under-diversified and should exercise in-the-money op-
tions at the earliest possible time to diversify their personal portfolios. Malmendier et al.
(2007) suggest that a higher degree of managerial overconfidence induces managers to stick
with option rights from after the vesting period. Thus, the excess holding time of employee
stock options can serve as proxy for overconfidence. 25 As a robustness check, they use press
portrayals of CEOs as an alternative indicator for managerial optimism. Here, higher mana-
gerial optimism is assumed to translate into a higher number of corresponding keywords in
the portrayals.
The first hypothesis by Malmendier et al. (2007) is that overconfident managers prefer debt to
equity conditional upon using external financing, because managers perceive the price of
newly issued equity as too low in their model. Their second hypothesis is that managers prefer
internal to external financing unconditionally, which might result in using debt too conserva-
tively, thus exploiting the tax benefits not optimally.26 Testing the first hypothesis, the evi-
dence implies that overconfident CEOs are less likely to issue equity in comparison to their
peers, which supports pecking order financing due to overconfidence. Malmendier et al.
(2007) also find support for their second hypothesis that overconfident CEOs rely more heavi-
ly on internal financing. Furthermore, they find that the longer a firm is managed by overcon-
fident managers, the higher is the firm's leverage in the long term.

36
E. Conclusions
According to Myers (1984), the key question to differentiate between competing theories on
capital structure choices by companies is whether firms adjust to some target following
shocks to their capital structure. Our review of recent studies addressing this question shows
that some progress has been made, but the evidence is still contradictory. For example, Welch
(2004) barely finds any adjustment behavior for U.S. companies following shocks to their
market debt ratios from changes in equity values. In contrast, empirical studies estimating
partial adjustment models of leverage arrive at estimated adjustment speeds to a target capital
structure in the range from 10% up to 50% per year.
Our discussion of corresponding studies indicates that the econometric issue of endogeneity
and the panel nature of most datasets appear to be central obstacles, which potentially explain
at least partly this contradictory evidence. Overall, however, the evidence, is striking that le-
verage adjustments do take time (potentially due to fixed costs of issuing new securities), and
are a significant characteristic of observed capital structure patterns. Some of the older studies
rely on a single cross-section of firm data, which makes it impossible to take dynamic adjust-
ments to the capital structure into account. Studies relying on panel data too often ignore the
panel structure at all, potentially leading to flawed inferences. The available evidence unique-
ly suggests that controlling for firm specific heterogeneity is inalienable. Since standard panel
estimators like the fixed effects model are biased under dynamic partial adjustment due to
endogeneity, and dynamic panel estimators are plagued by finite-sample biases in the capital
structure context, there remain severe methodological issues to be resolved. The papers by
Hahn et al. (2007) and Huang/Ritter (2007) provide some initial insights on the choice of dy-
namic panel estimators in the capital structure context, however.
In the context of testing adjustments following shocks to capital structure, several ideas on
what constitutes exogenous shocks have been suggested in the literature, for example includ-
ing equity value changes and very large investments by firms, as discussed in Section D of
this review. Clearly, one promising avenue for future research is to come up with additional
events that are indisputably exogenous to the capital structure decision of single firms, and
use them to learn about the prevalence of adjustment behavior.
The discussion of empirical studies on additional determinants of corporate leverage, which
have gained only recently attention in the literature, illustrates that apart from adjustment be-

37
havior, there is still room for future theoretical and empirical work. Only recently, the role of
rating agencies for capital structure decisions has been analyzed (Kisgen 2006), despite the
obvious relevance in modern capital markets. There is probably much future research to do, to
really understand the impact of this and other corporate governance mechanisms on capital
structure choices. Also, the emerging empirical literature inspired by motives from behavioral
finance has revealed that problems other than asymmetric information and agency costs,
which are the dominating arguments leading to the classic trade-off or pecking order theories,
seem to be of empirical relevance.
With respect to these classical theories, the available evidence is still contradictory, finding
empirical results consistent with adjustment behavior and some preference of firms for cash
flow financing. But e.g. patterns like the pronounced usage of equity financing for smaller
firms (Elsas et al. 2007, Frank/Goyal 2003) remain puzzling in the pecking order context.
Quite consistently, however, the evidence suggests that market-timing behavior to some ex-
tent explains observed capital structure patterns.
To illustrate the impact of the economic and methodological aspects discussed in our review,
we have provided evidence for the sample of exchange listed German firms over the period
from 1987 to 2006. On the one hand side, these exercises have shown that taking the panel
nature of the data, dynamic adjustment, and endogeneity into account can have a large impact
on estimation results. On the other hand, the German evidence also shows that many of the
“standard” determinants of capital structures are similarly to the U.S. relevant for corporate
finance in Germany. In particular, firm profitability, firm size, and the market-to-book ratio as
a proxy for firms’ growth options are very robust determinants of capital structure.
In conclusion, it remains an interesting challenge for future (empirical) research, to improve
our understanding of circumstances, where certain capital structure determinants are relevant,
and to identify (further) reliable empirical patterns and core factors of systematic variation in
corporate leverage.

38
Appendix
This appendix provides details on the data of German exchange listed firms used throughout
the study to illustrate the relevance of the methodological and empirical issues discussed.
The base sample consists of all yearly financial statement data available in Hoppenstedt for
German exchange listed firms with unregulated capital structures, i.e. excluding financials
and utilities. The observation period is from 1987 to 2006. The sample is pooled over ac-
counting standards IAS, US-GAAP, "HGB-Gesamtkostenverfahren", and "HGB-Umsatz-
kostenverfahren", for consolidated and individual financial statements, in this order of prefe-
rence. If a firm has both a consolidated and an individual financial statement, the consolidated
financial statement has been selected. Market data comes from the Datastream database by
Thomson Financial. Financial statement data are deflated using the GDP-deflator with base
year 2005. Tab. A.1 describes the construction of variables used in the capital structure re-
gressions throughout the paper.
Tab. A.1: Regression variables and their proxies
Variable Proxy
Market Leverage Total Liabilities / (Total Liabilities + Market value Equity)
Book Leverage Total Liabilities / (Total Liabilities + Equity)
Profitability EBITDA / (Total Liabilities + Equity)
Size Natural Logarithm of Sales
Market-to-Book (Total Liabilities + Market value Equity) / (Total liabilities + Equity)
Tangibility Fixed Assets / (Total Liabilities + Equity)
Industry Median Debt
Median of Market Leverage by NACE code and by year. Industry is defined as the first digit NACE code level.
Expected Inflation CPI forecasts by Economist Intelligence Unit
All variables have been winsorized at the 0.5% and 99.5% percentile. The market value of
equity has been taken 3 month after the fiscal year end. If a firm year has negative book equi-
ty, it has been dropped. After further data cleaning, the sample comprises 1182 firms and
10082 firm years. Tab. A.2 provides descriptive statistics for the regression variables.

39
Tab. A.2: Descriptive statistics for the regression variables
Variable Mean Min Max Standard Deviation
Market Leverage 0.452 0.003 0.969 0.254
Book Leverage 0.596 0.015 1.000 0.225
Profitability 0.093 -1.736 0.682 0.159
Size 18.272 10.312 25.695 2.413
Market-to-Book 2.179 0.389 97.260 4.290
Tangibility 0.286 0 1.199 0.234
Industry Median Debt 0.430 0.030 0.835 0.140
Expected Inflation 1.893 0.159 5.091 1.086

40
Endnotes
1 A detailed review of theoretical issues can be found in the survey by Neus/Walter (2008) in the same issue of
this journal. The classic theory survey is Harris/Raviv (1991), complemented by more recent discussions by
Myers (2001), and Frank/Goyal (2008).
2 See Berk/deMarzo (2007, p. 483) for a similar analysis of U.S. companies.
3 Frank/Goyal (2007) also assert that it is likely that financing behavior of firms is not constant over time. This
points to the dynamic trade-off models that may allow for time-varying target leverage, which will be discussed
in Section D in more detail.
4 See the Appendix for details on the firm sample.
5 Further problems associated with financial panel data may arise with incomplete data, sample selection and
survivorship biases, and outliers in the data. Frank/Goyal (2008) and Welch (2007) provide some starting point
for these issues.
6 Petersen (2007) examines publications in the Journal of Finance, the Journal of Financial Economics, and the
Review of Financial Studies over the period 2001-2004.
7 Shanken/Zhou (2007) provide an overview of the theory and a simulation analysis of the Fama/MacBeth
(1973) procedure in the asset pricing context.
8 Mathematically, this is equivalent to take the first differences of all variables in the regression, run OLS and
correct standard errors to the loss in degrees of freedom.
9 Note that due to the nature of the Fama/MacBeth (1973) procedure, variables that have identical values in a
time period for each cross-sectional unit cannot be estimated. In the reported fixed effects regression, which also
comprise year dummies and the macroeconomic variable expected inflation, this problem is circumvented by
dropping an additional time dummy.
10 Wooldridge (2002) is an excellent textbook on endogeneity issues.
11 For more on the theory of dynamic trade-off, see the survey by Frank/Goyal (2008). The review of theoretical
literature in Titman/Tsyplakov (2007) is also helpful for an overview on this topic.
12 Other studies estimating the speed of adjustment are Fama/French (2002), Alti (2006), and Lemmon et al.
(2006). Estimates in these studies range from 10% per year up to 34%, always based on samples of U.S. firms.
13 Flannery/Rangan (2006) use COMPUSTAT data from 1965 to 2001, excluding financials and regulated utili-
ties.

41
14 The market debt ratio has been defined as (book value of debt) / (book value of debt + common shares out-
standing x price per share).
15 Flannery/Rangan (2006) also use book debt ratio instead of market debt ratios, but the results do not change
significantly.
16 Elsas et al. (2007) rely on target debt ratios estimated from pre-event observations of the firms using the dy-
namic partial adjustment approach from Flannery/Rangan (2006).
17 Kisgen (2006) uses S&P credit ratings and data from COMPUSTAT for North-American firms from 1986 to
2001, excluding financials and utilities.
18 See Boot et al. (2006) and Hirsch/Krahnen (2007) for an analysis of the disciplining effect of watch list an-
nouncements and their informational content.
19 Barberis/Thaler (2003) on behavioral finance and Baker et al. (2007) on behavioral corporate finance provide
nice introductions to these streams of literature.
20 Baker et al. (2007) discuss the irrational investors approach in depth.
21 Barberis/Thaler (2003) also provide an excellent review of this evidence.
22 For more information about this survey, see http://www.cfosurvey.org/.
23 Excluding utilities and financials, Ben-David et al. (2007) use a sample of 1104 observations with 504 unique
firms, for which survey responses and accounting data are available.
24 The measures of Malmendier et al. (2007) cannot differentiate between overconfidence and optimism.
25 The CEO data on personal portfolios is taken from Hall/Liebmann (1998) and Yermack (1995) and include
data for CEOs of 477 large publicly traded U.S. firms between 1980 and 1994.
26 Malmendier/Tate (2005) find that CEOs, who are more overconfident than their peers, make more investments
if they can use internal cash flows to finance them.

42
References
Alti, A., (2006): How persistent is the impact of market timing on capital structure? Journal of
Finance, 61(4), 1681-1710.
Arellano, M., Bond, S. (1991): Some tests of specification for panel data: Monte Carlo evi-
dence and an application to employment equations. Review of Economic Studies, 58(2), 277-
297.
Arellano, M., Bover, O. (1995): Another look at the instrumental variable estimation of error-
components models. Journal of Econometrics, 68(1), 29-51.
Baker, M., Wurgler, J. (2002): Market timing and capital structure. Journal of Finance, 57(1),
1-32.
Baker, M., Ruback, R.S., Wurgler, J. (2007): Behavioral corporate finance: A survey. In:
Eckbo, E. (2007): Handbook of corporate finance: Empirical corporate finance. Volume 1,
Handbooks in finance series, Chapter 4, Elsevier, 2007, 146-178.
Barberis, N., Thaler, R. (2003): A survey of behavioral finance. In: Constantinides, G.M.,
Harris, M., Stulz, R. M. (2003): Handbook of the economics of finance. Volume 1B, Chapter
18, Elsevier, 2003, 1053-1128.
Barclay, M.J., Smith, C.W. Jr., Morellec, E. (2006): On the dept capacity of growth options.
Journal of Business, 79(1), 37-59.
Ben-David, I., Graham, J.R., Harvey, C.R. (2007): Managerial overconfidence and corporate
policies. Working paper, Duke University.
Berk, J., DeMarzo, P. (2007): Corporate Finance. Pearson, 2007.
Blundell, R., Bond, S.R. (1998): Initial conditions and moment restrictions in dynamic panel
data models. Journal of Econometrics, 87(1), 115-143.
Boot, A., Milbourn, T.T., Schmeits, A. (2006): Credit ratings as coordination mechanisms.
Review of Financial Studies, 19(1), 81-118.

43
Brounen, D., de Jong, A., Koedijk, K. (2006): Capital structure policies in Europe: Survey
evidence. Journal of Banking and Finance, 30(5), 1409-1442.
Campello, M. (2003): Capital structure and product markets interactions: Evidence from busi-
ness cycles. Journal of Financial Economics, 68(3), 353-378.
Elsas, R., Florysiak, D. (2008): Dynamic capital structure and exogenous stock returns: An
econometric analysis. Working paper, Ludwig-Maximilians-University Munich.
Elsas, R., Flannery, M.J., Garfinkel, J.A. (2007): Major investments, firm financing decisions,
and long-run performance. Working paper, Ludwig-Maximilians-University Munich, Univer-
sity of Florida, and University of Iowa.
Fama, E.F., French, K.R. (2002): Testing trade-off and pecking order predictions about divi-
dends and debt. Review of Financial Studies, 15(1), 1-33.
Fama, E.F., MacBeth, J.D. (1973): Risk, return, and equilibrium: Empirical tests. Journal of
Political Economy, 81(3), 607-636.
Flannery, M.J., Rangan, K.P. (2006): Partial adjustment toward target capital structures. Jour-
nal of Financial Economics, 79(3), 469-506.
Frank, M.Z., Goyal, V.K. (2008): Trade off and pecking order theories of debt. In: Eckbo, E.
(2008): Handbook of corporate finance: Empirical corporate finance. Volume 2, Handbooks
in finance series, Chapter 12, Elsevier, forthcoming.
Frank, M.Z., Goyal, V.K. (2007): Capital structure decisions: Which factors are reliably im-
portant? Working paper, University of Minnesota and Hong Kong University of Science and
Technology.
Frank, M.Z., Goyal, V.K. (2003): Testing the pecking-order theory of capital structure. Jour-
nal of Financial Economics, 67(2), 217-248.
Graham, J.R. (2003): Taxes and corporate finance: A review. Review of Financial Studies,
16(4), 1075-1129.

44
Graham, J.R. (2000): How big are the tax benefits of debt? Journal of Finance, 55(5), 1901-
1941.
Graham, J.R., Harvey, C.R. (2001): The theory and practice of corporate finance: Evidence
from the field. Journal of Financial Economics, 60(2-3), 187-243.
Greene, W.H. (2003): Economic analysis. Fifth edition, Prentice Hall, 2007.
Hackbarth, D., Miao, J. Morellec, E. (2006): Capital structure, credit risk, and macroeconomic
conditions. Journal of Financial Economics, 82(3), 519-550.
Hahn, J., Hausman, J., Kuersteiner, G. (2007): Long difference instrumental variables estima-
tion for dynamic panel models with fixed effects. Journal of Econometrics, 140(2), 574-617.
Hall, B.J., Liebman, J.B. (1998): Are CEOs really paid like bureaucrats? Quarterly Journal of
Economics, 113(3), 653-691.
Harris, M., Raviv, A. (1991): The theory of capital structure. Journal of Finance, 46(1), 297-
355.
Hirsch, C., Krahnen, J.P. (2007): A primer on rating agencies as monitors: An analysis of the
watchlist period. Working paper, Goethe-University Frankfurt.
Hovakimian, A. (2004): The role of target leverage in security issues and repurchases. Journal
of Business, 77(4).
Hovakimian, A., Hovakimian, G., Tehranian, H. (2004): Determinants of target capital struc-
ture: The case of combined debt and equity financing. Journal of Financial Economics, 71(3),
517-540.
Hovakimian, A., Opler, T., Titman, S. (2001): The debt-equity choice. Journal of Financial
and Quantitative Analysis, 36(1), 1-24.
Huang, R., Ritter, J.R. (2007): Testing theories of capital structure and estimating the speed of
adjustment. Working paper, Kennesaw State University and University of Florida.
Jensen, M.C. (1986): Agency costs of free cash flow, corporate finance, and takeovers. Amer-
ican Economic Review, 76(2), 323-329.

45
Jensen, M.C., Meckling, W.H. (1976): Theory of the firm: Managerial behavior, agency costs
and capital structure. Journal of Financial Economics, 3(4), 305-360.
Kayhan, A., Titman, S. (2007): Firms’ histories and their capital structures. Journal of Finan-
cial Economics, 83(1), 1-32.
Kisgen, D.J. (2006): Credit ratings and capital structure. Journal of Finance, 61(3), 1035-
1073.
Korajczyk, R.A., Levy, A. (2003): Capital structure choice: Macroeconomic conditions and
financial constraints. Journal of Financial Economics, 68(1), 75-109.
Kraus, A., Litzenberger, R. (1973): A state-preference model of optimal financial leverage.
Journal of Finance, 28(4), 911-922.
Leary, M.T., Roberts, M. (2005): Do firms rebalance their capital structures? Journal of
Finance, 60(6), 2575-2619.
Lemmon, M.L., Roberts, M.R., Zender, J.F. (2006): Back to the beginning: Persistence and
the cross-section of corporate capital structure, Working paper, University of Utah, University
of Pennsylvania, and University of Colorado at Boulder.
MacKay, P., Phillips, G.M. (2005): How does industry affect firm financial structure? Review
of Financial Studies, 18(4), 1433-1466.
Malmendier, U., Tate, G. (2005): CEO overconfidence and corporate investment. Journal of
Finance, 60(6), 2661-2700.
Malmendier, U., Tate, G., Yan, J. (2007): Corporate financial policies with overconfident
managers. Working paper, UC Berkeley, NBER, UCLA, and Stanford University.
Mayer, C. Sussman, O. (2005): A new test of capital structure. Working paper, Saïd Business
School, University of Oxford.
Modigliani, F., Miller, M.H. (1958): The cost of capital, corporation finance and the theory of
investment. American Economic Review, 48(3), 261-297.
Myers, S.C. (2001): Capital Structure. Journal of Economic Perspectives, 15(2), 81-102.

46
Myers, S.C. (1984): The capital structure puzzle. Journal of Finance, 39(3), 575-592.
Myers, C., Majluf, N.S. (1984): Corporate financing and investment decisions when firms
have information that investors do not. Journal of Financial Economics, 13(2), 187-221.
Nelson, C.R., Startz, R. (1990): Some further results on the exact small sample properties of
the instrumental variable estimator. Econometrica, 58(4), 967-976.
Neus, W., Walter, A. (2008): Lines of research in fifty years of corporate financial theory.
Zeitschrift für Betriebswirtschaft, 78, Special Issue 6: “50 years after MM: Recent develop-
ments in corporate finance”, forthcoming.
Petersen, M.A. (2007): Estimating standard errors in finance panel data sets: Comparing ap-
proaches. Working paper, Northwestern University and NBER.
Rajan, R.G., Zingales, L. (1995): What do we know about capital structure? Some evidence
from international data. Journal of Finance, 50(5), 1421-1460.
Ritter, J.R. (1991): The long-run performance of initial public offerings. Journal of Finance,
46(1), 3-27.
Roll, R. (1986): The hubris hypothesis of corporate takeovers. Journal of Business, 59(2),
197-216.
Shanken, J., Zhou, G. (2007): Estimating and testing beta pricing models: Alternative me-
thods and their performance in simulations. Journal of Financial Economics, 84(1), 40-86.
Shyam-Sunder, L., Myers, S.C. (1999): Testing static trade-off against pecking order models
of capital structure. Journal of Financial Economics, 51(2), 219-244.
Titman, S., Tsyplakov, S. (2007): A dynamic model of optimal capital structure. Review of
Finance, 11(3), 401-451.
Titman, S., Wessels, R. (1988): The determinants of capital structure choice. Journal of
Finance, 43(1), 1-12.
Welch, I. (2007): Common flaws in empirical capital structure research. Working paper,
Brown University.

47
Welch, I. (2004): Capital structure and stock returns. Journal of Political Economy, 112(1),
106-131.
Wooldridge, J.M. (2002): Economic analysis of cross section and panel data. MIT Press,
2002.
Yermack, D. (1995): Do corporations award CEO stock options effectively? Journal of Finan-
cial Economics, 39(2-3), 237-269.
Zingales, L. (1998): Survival of the fittest or the fattest? Exit and financing in the trucking
industry. Journal of Finance, 53(3), 905-938.