Embed Size (px)
Citation preview
Tectonophysics 477 (2009) 77–92
Contents lists available at ScienceDirect
Tectonophysics
j ourna l homepage: www.e lsev ie r.com/ locate / tecto
Empirical constraints on extrusion mechanisms from the upper margin of anexhumed high-grade orogenic core, Sutlej valley, NW India
Jennifer Chambers a,⁎, Mark Caddick b, Tom Argles a, Matthew Horstwood c, Sarah Sherlock a, Nigel Harris a,Randall Parrish c,d, Talat Ahmad e
a Department of Earth and Environmental Sciences, CEPSAR, The Open University, Milton Keynes MK7 6AA, UKb Institute for Mineralogy and Petrology, ETH Zürich, NW, Clausiusstrasse 25, CH 8092, Switzerlandc NERC Isotope Geosciences Laboratory, Kingsley Dunham Centre, Keyworth, Nottingham NG12 5GG, UKd Department of Geology, University of Leicester, Leicester LE1 7RH, UKe Department of Geology, University of Delhi, Delhi-110007, India
⁎ Corresponding author. Fax: +1 208 426 4061.E-mail addresses: [email protected] (J. Ch
[email protected] (M. Caddick), t.w.argles@[email protected] (M. Horstwood), [email protected]@open.ac.uk (N. Harris), [email protected]@gmail.com (T. Ahmad).
0040-1951/$ – see front matter © 2008 Elsevier B.V. Aldoi:10.1016/j.tecto.2008.10.013
a b s t r a c t
a r t i c l e i n f oArticle history:
The Early–Middle Miocene e Received 14 May 2008Received in revised form 19 September 2008Accepted 14 October 2008Available online 1 November 2008Keywords:OrogenesisHimalayaHaimanta GroupPseudosectionsP–T–t–d pathsExhumation
xhumation of the crystalline core of the Himalaya is a relatively well-understoodprocess compared to the preceding phase of burial and prograde metamorphism in the Eocene–Oligocene.Highly deformed rocks of the Greater Himalayan Sequence (GHS) dominate the crystalline core, and feature astrong metamorphic and structural overprint related to the younger exhumation. The Tethyan SedimentarySeries was tectonically separated from the underlying GHS during the Miocene by the South TibetanDetachment, and records a protracted and complex history of Cenozoic deformation. Unfortunately thesetypically low-grade or unmetamorphosed rocks generally yield little quantitative pressure–temperature–time information to accompany this deformation history. In parts of the western Himalaya, however, thebasal unit of the Tethyan Sedimentary Series (the Haimanta Group) includes pelites metamorphosed toamphibolite facies. This presents a unique opportunity to explore the tectono-thermal evolution ofcrystalline rocks which record the early history of the orogen.Pressure–temperature–time–deformation (P–T–t–d) paths modelled for two Haimanta Group peliticrocks reveal three distinct stages of metamorphism: (1) prograde Barrovian metamorphism to 610–620 °Cat c. 7–8 kbars, with garnet growing over an early tectonic fabric (S1); (2) initial decompression duringheating to 640–660 °C at c. 6–7 kbars, with development of a pervasive crenulation cleavage (S2) andstaurolite and kyanite porphyroblast growth; (3) further exhumation during cooling, with minor retrogrademetamorphism and modification of the pervasive S2 fabric. Monazite growth ages constrain the timing ofinitial garnet growth (N34 Ma), the start of D2 and maximum burial (c. 30 Ma), and the termination of garnetgrowth (c. 28 Ma). Muscovite Ar/Ar ages indicate cooling through c. 300 °C at c. 13 Ma, fromwhich we derivean initial exhumation rate of c. 1.3 mm year−1 for the Haimanta Group. The underlying GHS was exhumed ata rate of 2.2 to 3 mm year−1 during this time. The difference in exhumation rate between these two units isconsidered to reflect Early Miocene displacement on the intervening South Tibetan Detachment. Slowerexhumation (c. 0.6 mm year−1) of both units after c. 13 Ma followed the cessation of major displacement onthis structure, after which time the Haimanta Group and the GHS were exhumed as one relatively coherenttectonic block.
© 2008 Elsevier B.V. All rights reserved.
1. Introduction
As an active zone of Cenozoic crustal deformation (e.g. Hodges,2000; Aitchison et al., 2007), the Himalayan orogen is the focus of
ambers),en.ac.uk (T. Argles),(S. Sherlock),(R. Parrish),
l rights reserved.
numerous studies examining the mechanical response to this process(Harris, 2007 and references therein). Critical to this challenge aretectonic reconstructions and models revealing how, when, and onwhat scale rocks were deformed, metamorphosed and transportedwithin the evolving orogen. Pressure–temperature–time–deforma-tion (P–T–t–d) data provide a record of the integrated effects of thethermal and mechanical processes involved, and present importantconstraints onmodel feasibility. Furthermore, identification of distincttectono-stratigraphic units, e.g. the Greater Himalayan Sequence(GHS), and their bounding faults, e.g. the Main Central Thrust (MCT),

78 J. Chambers et al. / Tectonophysics 477 (2009) 77–92
provides an invaluable framework for tectonic reconstructions. Herewe present new P–T–t–d data from the uppermost tectono-strati-graphic unit of the crystalline core.
Gneisses and migmatites of the GHS (Le Fort, 1975; Yin, 2006)dominate the crystalline core of the Himalaya (Fig. 1). P–T–t–d data fromthe GHS have provided key constraints for mechanical models of theevolving Himalayan orogen (e.g. Beaumont et al., 2001; Jamieson et al.,2004). These data suggest that the GHS was overthrust, buried andmetamorphosed during the Eocene–Oligocene (‘M1’ or ‘Eohimalayan’phase), and thenexhumedas thehighly-deformedGHSduring theEarly–MiddleMiocene (‘M2’or ‘Neohimalayan’phase) (Vance andHarris,1999;Hodges, 2000; Vannay et al., 2004). Exhumation was facilitated bysimultaneous reverse and normal sense motion on the MCT and SouthTibetan Detachment (STD), respectively (Godin et al., 2006; Yin, 2006).Leucogranite intrusion into the GHS (the HighHimalayan Leucogranites)records an approximately isothermal phase of decompression associatedwith this (Harris and Massey, 1994). In many cases, the younger ‘Neohi-malayan’ phase has strongly overprinted metamorphic and structuralrecords of the earlier history. A notable exception exists in the uppermostGHS of central Nepal (Vannay and Hodges, 1996; Coleman and Hodges,1998; Gleeson andGodin, 2006), but generally the early tectono-thermalevolution of the crystalline core is much less well-constrained than itsMiocene exhumation (Hodges, 2000; Godin et al., 2001).
Studies on the major tectono-stratigraphic unit above the GHS, theTethyanSedimentary Series (TSS, Fig.1) (Thakur,1992) reveal a longandcomplex history of Tertiary deformation invaluable for understandingearly orogenic processes (Ratschbacher et al., 1994; Wiesmayr andGrasemann, 2002; Godin, 2003). These rocks are typically unmetamor-phosed or low-grade, with fewwell-developed U–Pb or Sm–Nd bearingmetamorphic phases, so detailed structural studies cannot usually becoupled to P–T data and absolute ages. However, in parts of the westernHimalaya, the base of the Phanerozoic TSS, the Haimanta Group, ismetamorphosed up to amphibolite-grade. This unit has been correlatedto the Phe Formation in Zanskar (Thakur, 1992), the Everest Series (alsoknown as the North Col Formation) in eastern Nepal (e.g. Searle et al.,2003), the Upper Bhimphedi Group in the Kathmandu Nappe (Yin,2006), and the Harsil Formation in Garhwal (Metcalfe, 1990; Prince,1999). Due to the location of the Haimanta Group in the hangingwall ofthe STD, this unit is likely to retain valuable information regarding theearly evolution of the Himalaya, owing to its tectonic separation fromthe underlying GHS during ‘Neohimalayan’ high-grade deformation.
This study uses petrographic, geochemical and geochronological(Ar/Ar mica and U–Pb monazite) data to record, date and model the
Fig. 1. Generalized geologica
high-grade metamorphism of the Haimanta Group in the Sutlej valley,NW India. We present the first comprehensive account of the P–T–t–devolution of this unit, which constitutes the structurally highestcrystalline rocks in the Himalayan core. These data help to constrainthe Eocene to Oligocene development of the young Himalayan orogen,and contribute further to our understanding of the thermo-tectonicevolution of the crystalline core into and since the Miocene.
2. Geology of the upper Sutlej valley
Metasediments of the Haimanta Group (Hayden, 1904) consistof interlayered psammitic and pelitic schists with minor calcareouslayers. The main foliation is a regular crenulation cleavage (Fig. 3a)with an associated ENE-plunging stretching lineation (Fig. 2c). Thecrenulation cleavage decreases in intensity up-section towards alow-grade spaced solution-cleavage (locality 18, Fig. 2a). Competentpsammitic and calcareous beds define meso-scale folds (Fig. 3b), towhich the main foliation is axial planar. On the macro-scale, abroad synform (axial plane inclined to the SW) strikes ∼NW–SEacross the upper Sutlej valley folding the dominant foliation(Fig. 2b, c).
The Lower Haimanta Group was intruded by the Ordovician(c. 488 Ma) Akpa (also termed ‘Kinnaur Kailas’) granite (Marquer et al.,2000; Miller et al., 2001). Pelites in close proximity to the granite showhighly variable structures (Fig. 2c) probably reflecting strain hetero-geneities in the ‘shadow’ of the granite during Himalayan deforma-tion. In places, the margin of the granite itself has been deformedand has developed synkinematic kyanite, presumably during Tertiaryorogenesis. The interior of the granite is relatively undeformed.Xenoliths of the Haimanta Group have been found within the granite(Vannay and Grasemann, 1998; Marquer et al., 2000). The sharpcontact between the base of the Akpa granite (locally deformed toaugengneiss) and migmatitic gneisses of the Vaikrita Group (GreaterHimalayan Sequence) represents a ductile–brittle strand of the SouthTibetan detachment (STD), locally termed the ‘Sangla detachment’.Mylonites in this shear zone preserve evidence of both early SW-directed and later E-directed ductile shearing, as a result of the normalsense reactivation of a foreland-propagating thrust (Vannay et al.,2004). These ductile fabrics have been overprinted by a broad zone ofsteep brittle faults accommodating further E-directed extension(Vannay and Grasemann, 1998, and own authors' observations).
Metamorphic grade in the Haimanta Group decreases rapidly up-section; kyanite–staurolite–garnet mica schists are exposed at the
l map of the Himalaya.
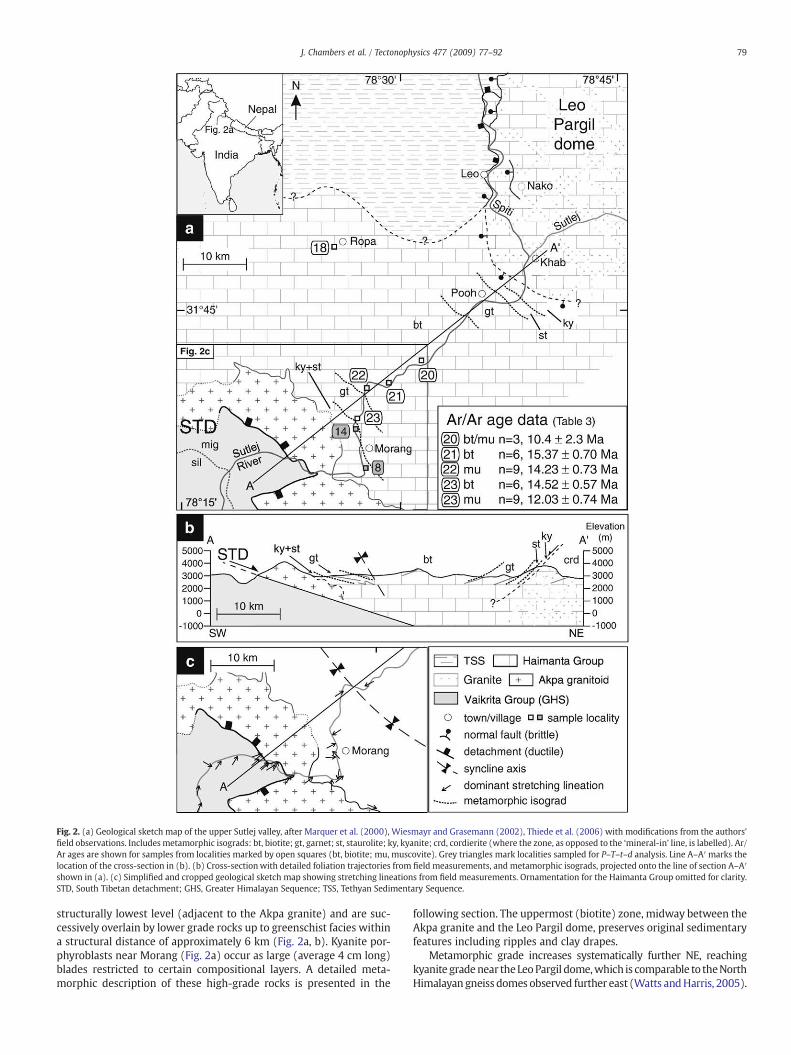
Fig. 2. (a) Geological sketch map of the upper Sutlej valley, after Marquer et al. (2000), Wiesmayr and Grasemann (2002), Thiede et al. (2006) with modifications from the authors'field observations. Includes metamorphic isograds: bt, biotite; gt, garnet; st, staurolite; ky, kyanite; crd, cordierite (where the zone, as opposed to the ‘mineral-in’ line, is labelled). Ar/Ar ages are shown for samples from localities marked by open squares (bt, biotite; mu, muscovite). Grey triangles mark localities sampled for P–T–t–d analysis. Line A–A′marks thelocation of the cross-section in (b). (b) Cross-sectionwith detailed foliation trajectories from field measurements, and metamorphic isograds, projected onto the line of section A–A′shown in (a). (c) Simplified and cropped geological sketch map showing stretching lineations from field measurements. Ornamentation for the Haimanta Group omitted for clarity.STD, South Tibetan detachment; GHS, Greater Himalayan Sequence; TSS, Tethyan Sedimentary Sequence.
79J. Chambers et al. / Tectonophysics 477 (2009) 77–92
structurally lowest level (adjacent to the Akpa granite) and are suc-cessively overlain by lower grade rocks up to greenschist facies withina structural distance of approximately 6 km (Fig. 2a, b). Kyanite por-phyroblasts near Morang (Fig. 2a) occur as large (average 4 cm long)blades restricted to certain compositional layers. A detailed meta-morphic description of these high-grade rocks is presented in the
following section. The uppermost (biotite) zone, midway between theAkpa granite and the Leo Pargil dome, preserves original sedimentaryfeatures including ripples and clay drapes.
Metamorphic grade increases systematically further NE, reachingkyanite gradenear theLeoPargil dome,which is comparable to theNorthHimalayan gneiss domes observed further east (Watts andHarris, 2005).

Fig. 3. Outcrop photographs at locality 8 (Fig. 2a) of (a) the dominant fabric in the Haimanta Group pelites, a crenulation cleavage (S2). Garnet porphyroblasts have beenwrapped bythis foliation (see bulge top centre, and indentation where garnet has fallen out, bottom right). Coin 2.5 cm; (b) Near flat-lying meso-scale fold (hinge line dips 3° towards SSE)depicted by competent psammitic and calcareous layers. Pelites contain an axial planar cleavage.
80 J. Chambers et al. / Tectonophysics 477 (2009) 77–92
The metasediments exposed within the Leo Pargil dome (Fig. 2) areindistinguishable in appearance from theHaimanta Group seen south ofthe Sutlej–Spiti confluence, with the exception of chaotically-orientated,mainly discordant leucogranite veins which increase in proportiontowards the centre of the dome, where granite constitutes more than50% of the exposures at Nako (Fig. 2a). Thewestern edge of the dome isflanked by both ductile and brittle detachments, and although nodetachmenthas yet been traced south across the Sutlej valley in thefield,a continuation of the brittle detachment is inferred from satelliteimagery (Thiede et al., 2006). Unmetamorphosed Tethyan sediments liein thehangingwall of thedetachment thatexhumed the Leo Pargil dome(Thiede et al., 2006), and in sections to thewest these clearly overlie theHaimantaGrouponanunconformity (WiesmayrandGrasemann, 2002).
3. Pressure–temperature–deformation (P–T–d) analysis
Petrographic examination of c. 100 thin sections from over 30samples revealed two pelitic samples, 8i and 14i (see Fig. 2a forrespective localities), that are representative of proposed P–T–d trendsand are described in some detail below. Textural and chemical ana-lyses were undertaken to relate growth and/or resorption of mineralphases to microstructures, and quantify major-phase compositionsand zoning trends (Appendix A). Combined with whole-rock majorelement analyses (Table 1), these data allow us to model P–T–d evo-lution using the pseudosection approach (Powell et al., 1998).
3.1. Textural analysis
3.1.1. Sample 8iAn early tectonic fabric (S1) consists of aligned plagioclase feldspar
(euhedral to subhedral and with distinct zoning), biotite and minorwhite mica. A second fabric-forming event (D2) led to the developmentof a crenulation cleavage (S2) that is thedominant fabric of theHaimantaGroup (Figs. 3a and 4). The deformation responsible for S2 is likely torepresent a stage of deformation in the continuumof crustal shortening,
Table 1Whole-rock major element data (in wt.%) for two high-grade Haimanta Group metapelites.
SiO2 TiO2 Al2O3 Fe2O3 MnO
8i 56.79 0.89 21.07 8.40 0.1014i 53.25 0.83 19.10 9.54 0.11“Typical” pelitea 59.80 16.57 5.81 0.10
LOI, loss on ignition.aFrom Mahar et al. (1997).
as opposed to a discrete deformation event associated with a distinctgeological process. S2 is defined by mats of fine-grained white micaaligned in parallel bands along the limbs of the crenulated S1 fabric(Fig. 4a, c). S1 biotite andwhitemica feature sweeping extinction and/orpolygonal recrystallization as a result of deformation and/or recrystalli-zation in crenulation hinges, whereas S1 plagioclase (stronger thanquartz and micas) is either fractured or internally altered (Fig. 4a).Quartz inclusion trails in subhedral garnet porphyroblasts (0.5–2 mm),and oblique to the external foliation (Fig. 4b, d), also represent S1. Trailsare either straight, or weakly sigmoidal suggesting synkinematic garnetgrowth over aweakly deformed S1 fabric during the early stages ofD2. Inplaces biotite grewmimetically uponplagioclase andgarnet, fromwhichwe infer that biotite growth outlasted the growth of these other phases.
Porphyroblasts of staurolite (0.5–3 cm) and kyanite (1–3 mm)grew during a later stage of D2, overprinting S2 and occluding garnet(Fig. 4b–d). The final stage of deformation (D3) tightened the S2crenulation cleavage about these porphyroblasts (including garnetwhere not occluded), modifying (but not completely transposing) S2 toform ‘S2m’ (Fig. 4c, d). Asymmetric pressure shadows around por-phyroblasts suggest a component of simple shear (Fig. 4c). However,determining an unequivocal shear sense for this late deformation phasewasnotpossible, because thegeometryof thepressure shadowsappearsto have been modified by minor rotation of the porphyroblasts.
Staurolite continued to grow during D3, overprinting a progressivelymodified S2 fabric recorded by the change in orientation of inclusiontrails in staurolite continuously towards the tip, finally merging with‘S2m’ (Fig. 4b). However, D3 outlasted staurolite growth, as shown bydeformed white mica crystals wrapping around the end of stauroliteporphyroblasts and featuring a sweeping extinction.Meanwhile, kyanitesuffered internal deformation, and the crystal lattice is noweither kinked(Fig. 4d), and/or degraded along crystal edges parallel to D3 microfolds.
3.1.2. Sample 14iSample 14i shares a number of features with sample 8i: garnet
porphyroblasts overgrewS1 and grew up to early-D2 (Fig. 5); staurolite
MgO CaO Na2O K2O P2O5 LOI Total
3.82 0.42 1.28 5.43 0.21 1.60 100.016.13 1.59 4.44 3.67 0.18 0.44 99.292.62 1.09 1.73 3.53 91.25
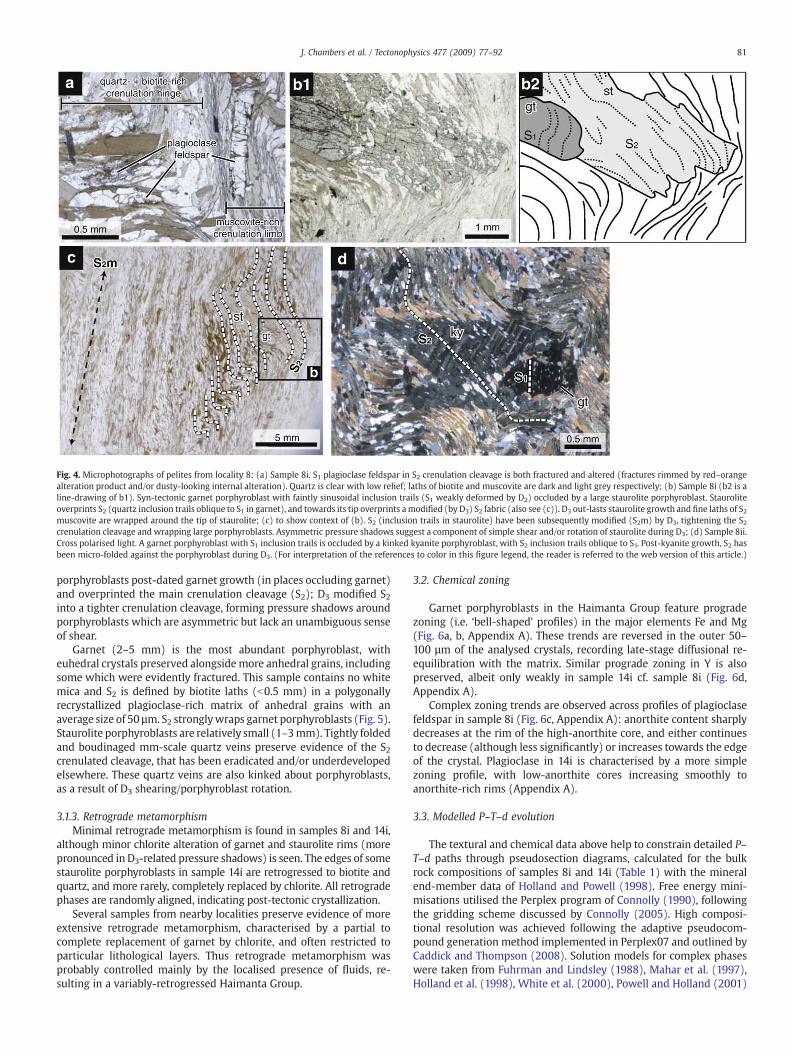
Fig. 4. Microphotographs of pelites from locality 8: (a) Sample 8i. S1 plagioclase feldspar in S2 crenulation cleavage is both fractured and altered (fractures rimmed by red–orangealteration product and/or dusty-looking internal alteration). Quartz is clear with low relief; laths of biotite and muscovite are dark and light grey respectively; (b) Sample 8i (b2 is aline-drawing of b1). Syn-tectonic garnet porphyroblast with faintly sinusoidal inclusion trails (S1 weakly deformed by D2) occluded by a large staurolite porphyroblast. Stauroliteoverprints S2 (quartz inclusion trails oblique to S1 in garnet), and towards its tip overprints amodified (by D3) S2 fabric (also see (c)). D3 out-lasts staurolite growth and fine laths of S2muscovite are wrapped around the tip of staurolite; (c) to show context of (b). S2 (inclusion trails in staurolite) have been subsequently modified (S2m) by D3, tightening the S2crenulation cleavage and wrapping large porphyroblasts. Asymmetric pressure shadows suggest a component of simple shear and/or rotation of staurolite during D3; (d) Sample 8ii.Cross polarised light. A garnet porphyroblast with S1 inclusion trails is occluded by a kinked kyanite porphyroblast, with S2 inclusion trails oblique to S1. Post-kyanite growth, S2 hasbeen micro-folded against the porphyroblast during D3. (For interpretation of the references to color in this figure legend, the reader is referred to the web version of this article.)
81J. Chambers et al. / Tectonophysics 477 (2009) 77–92
porphyroblasts post-dated garnet growth (in places occluding garnet)and overprinted the main crenulation cleavage (S2); D3 modified S2into a tighter crenulation cleavage, forming pressure shadows aroundporphyroblasts which are asymmetric but lack an unambiguous senseof shear.
Garnet (2–5 mm) is the most abundant porphyroblast, witheuhedral crystals preserved alongsidemore anhedral grains, includingsome which were evidently fractured. This sample contains no whitemica and S2 is defined by biotite laths (b0.5 mm) in a polygonallyrecrystallized plagioclase-rich matrix of anhedral grains with anaverage size of 50 µm. S2 stronglywraps garnet porphyroblasts (Fig. 5).Staurolite porphyroblasts are relatively small (1–3mm). Tightly foldedand boudinaged mm-scale quartz veins preserve evidence of the S2crenulated cleavage, that has been eradicated and/or underdevelopedelsewhere. These quartz veins are also kinked about porphyroblasts,as a result of D3 shearing/porphyroblast rotation.
3.1.3. Retrograde metamorphismMinimal retrograde metamorphism is found in samples 8i and 14i,
although minor chlorite alteration of garnet and staurolite rims (morepronounced in D3-related pressure shadows) is seen. The edges of somestaurolite porphyroblasts in sample 14i are retrogressed to biotite andquartz, and more rarely, completely replaced by chlorite. All retrogradephases are randomly aligned, indicating post-tectonic crystallization.
Several samples from nearby localities preserve evidence of moreextensive retrograde metamorphism, characterised by a partial tocomplete replacement of garnet by chlorite, and often restricted toparticular lithological layers. Thus retrograde metamorphism wasprobably controlled mainly by the localised presence of fluids, re-sulting in a variably-retrogressed Haimanta Group.
3.2. Chemical zoning
Garnet porphyroblasts in the Haimanta Group feature progradezoning (i.e. ‘bell-shaped’ profiles) in the major elements Fe and Mg(Fig. 6a, b, Appendix A). These trends are reversed in the outer 50–100 µm of the analysed crystals, recording late-stage diffusional re-equilibration with the matrix. Similar prograde zoning in Y is alsopreserved, albeit only weakly in sample 14i cf. sample 8i (Fig. 6d,Appendix A).
Complex zoning trends are observed across profiles of plagioclasefeldspar in sample 8i (Fig. 6c, Appendix A): anorthite content sharplydecreases at the rim of the high-anorthite core, and either continuesto decrease (although less significantly) or increases towards the edgeof the crystal. Plagioclase in 14i is characterised by a more simplezoning profile, with low-anorthite cores increasing smoothly toanorthite-rich rims (Appendix A).
3.3. Modelled P–T–d evolution
The textural and chemical data above help to constrain detailed P–T–d paths through pseudosection diagrams, calculated for the bulkrock compositions of samples 8i and 14i (Table 1) with the mineralend-member data of Holland and Powell (1998). Free energy mini-misations utilised the Perplex program of Connolly (1990), followingthe gridding scheme discussed by Connolly (2005). High composi-tional resolution was achieved following the adaptive pseudocom-pound generation method implemented in Perplex07 and outlined byCaddick and Thompson (2008). Solution models for complex phaseswere taken from Fuhrman and Lindsley (1988), Mahar et al. (1997),Holland et al. (1998), White et al. (2000), Powell and Holland (2001)

Fig. 5. Back-scatter electron images of two garnet porphyroblasts from sample 14i, plus a selection of the monazite grains analysed (including one Mg-element map, of monazite“m4a6”). Garnets overprint a pre-existing S1 fabric, as well as an S1–S2 fabric at the rim consistent with late stage garnet growth syn-tectonic with early D2. S2, defined by the biotite/plagioclase matrix (light and dark greymatrix phases respectively), is oblique to S1 andwraps garnet porphyroblasts. Chlorite (mid-grey between biotite and plagioclase) is present inthe pressure shadows to garnet 4a (top and bottom of the image). Monazites are labelled with a prefix ‘g’ (garnet) or ‘m’ (matrix) which refers to the host phase, a subscript whichrefers to the section name (e.g. ‘2’) and the occluding or adjacent garnet (e.g. ‘a’), and a suffix which indicates the analysis number (Table 2). Where elongate, monazite grains arealigned with the tectonic fabric (e.g. “m2a1”, “m4a6”). Some other grains are distinctly anhedral (e.g. “g2a1” and “m2a3”). Black scale bar (garnet images) 2 mm; white scale bar(monazite grain images), 100 µm.
82 J. Chambers et al. / Tectonophysics 477 (2009) 77–92
and Coggon and Holland (2002) as detailed in Appendix I of Caddickand Thompson (2008). Herewe discuss the P–T–d histories implied bycomparing the pseudosection predictions with the presence, absenceand modal abundance of phases observed in samples 8i and 14i, andthe measured chemical compositions of these phases.
3.3.1. Sample 8iAn early stage of prograde metamorphism between 450 and 500 °C
at 6 to 7 kbars is associated with an appreciable increase in thecalculated proportion of biotite (Fig. 7b) and muscovite. Low-anorthiteplagioclase is also stable at these P–T conditions and is consistent withanalysed plagioclase rims. The high-anorthite plagioclase cores, how-ever, are only consistent with high-T (N 550 °C), low-P (1–4 kbars)conditions and are not easily reconciled with the moderate pressurehistory suggested by other phases (Fig. 7a). Therefore we suggest thatthe plagioclase cores are relicts of a pre-Himalayan (contact?)metamorphic event (e.g. Marquer et al., 2000; Gehrels et al., 2006).
Between c. 500 and 600 °C along the best-fit P–T path neither pla-gioclase nor rutile are predicted as stable phases. With P and T increaseany pre-existing rutile is consumed by ilmenite forming reactions, com-patible with the presence of ilmenite rather than rutile in this sample.Embayed plagioclase crystals suggest partial resorption of this phase,where slow dissolution rates at these temperatures presumably pro-hibited its complete resorption. Garnet is predicted to be stable above550 °C (Fig. 7c), but analysedXspessartine and [Fe/Fe+Mg] ratios in garnetcrystal cores (Fig. 6) coincide with calculated compositions at c. 575 °C(Fig. 7d and e). Thus either garnet growth overstepped the calculatedgarnet-in reaction by c. 25 °C, as previously observed by Waters and
Lovegrove (2002), or preserved crystal core compositions have beensubsequently modified. Crystal rim compositions are consistent withgarnet growth until c. 625 °C, although subsequent modification of rimcompositions can also not be excluded. A calculated garnet proportion ofapproximately 4% at 625 °C and c. 8 kbars agrees well with observedproportions. Pressure is less well-constrained than temperature for thispart of the prograde path but textural evidence confirms the growth ofgarnet then staurolite, with this being most easily achieved at pressuresabove c. 6 kbars (Fig. 7a). Heating at lower pressure would result ingarnet growth predominantly in staurolite-bearing assemblage fields.
A peak T of 660 °C at c. 7 kbars is constrained by the growth of ≤1%kyanite (Fig. 7a), with the best-fit P–T path experiencing decompressionas this temperature is approached. Modal proportion isopleths implyadditionalminor garnet growth thenweak resorption over this heating/decompression interval (Fig. 7c), although thesedetails areprobably lostin the thin, diffusionally-modified rims. The path through staurolitestability fields near peak T is consistent with petrographic observationsthat staurolite grewboth pre andpost kyanite growth. Plagioclase is alsopredicted as a stable phase throughout the high-temperature part of themodelled P–T path (Fig. 7a) but no plagioclase crystals with anorthitecompositions calculated for this regionwere identified. This may partlyreflect the sequestration of some Ca and Al into pre-existing high-anorthite plagioclase cores. As a D2 crenulation began to formduring thefinal stages of garnet growth, D2 must have coincided with approxi-mately peak pressure and the initial phase of exhumation accompaniedby heating. The start of D3 coincided with or closely followed peak Tbecause both staurolite and kyanite overprint S2 but only stauroliteoverprints S2m.
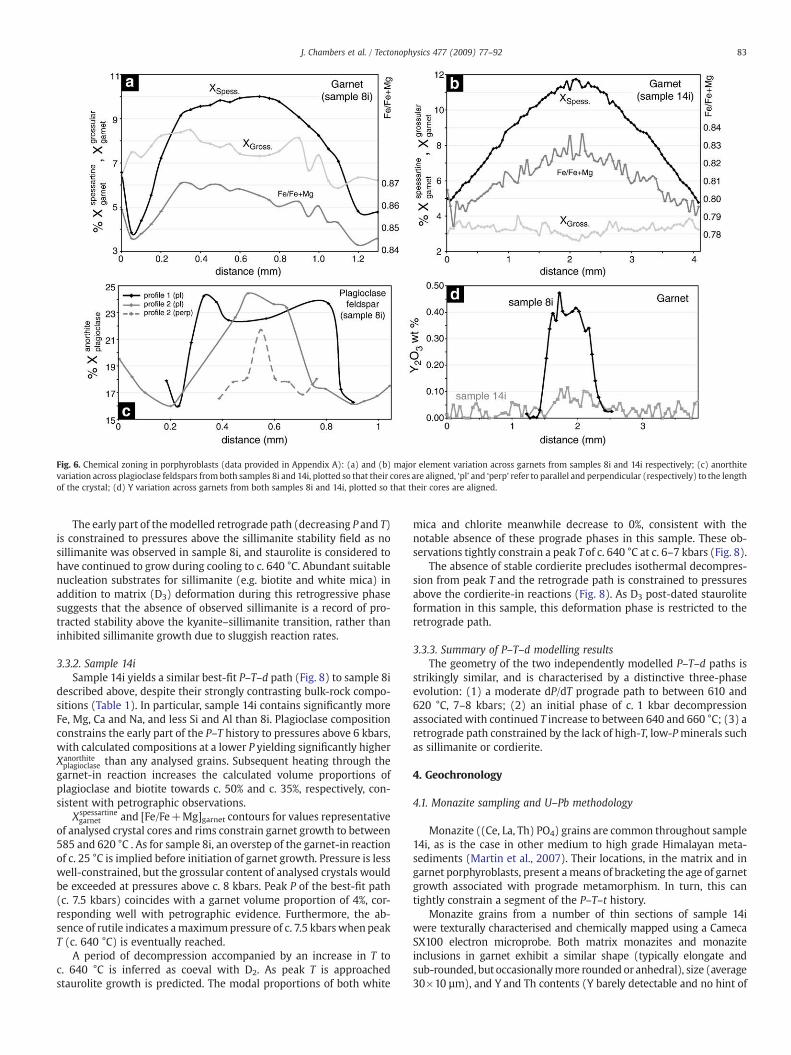
Fig. 6. Chemical zoning in porphyroblasts (data provided in Appendix A): (a) and (b) major element variation across garnets from samples 8i and 14i respectively; (c) anorthitevariation across plagioclase feldspars from both samples 8i and 14i, plotted so that their cores are aligned, ‘pl’ and ‘perp’ refer to parallel and perpendicular (respectively) to the lengthof the crystal; (d) Y variation across garnets from both samples 8i and 14i, plotted so that their cores are aligned.
83J. Chambers et al. / Tectonophysics 477 (2009) 77–92
The early part of themodelled retrograde path (decreasing P and T)is constrained to pressures above the sillimanite stability field as nosillimanite was observed in sample 8i, and staurolite is considered tohave continued to grow during cooling to c. 640 °C. Abundant suitablenucleation substrates for sillimanite (e.g. biotite and white mica) inaddition to matrix (D3) deformation during this retrogressive phasesuggests that the absence of observed sillimanite is a record of pro-tracted stability above the kyanite–sillimanite transition, rather thaninhibited sillimanite growth due to sluggish reaction rates.
3.3.2. Sample 14iSample 14i yields a similar best-fit P–T–d path (Fig. 8) to sample 8i
described above, despite their strongly contrasting bulk-rock compo-sitions (Table 1). In particular, sample 14i contains significantly moreFe, Mg, Ca and Na, and less Si and Al than 8i. Plagioclase compositionconstrains the early part of the P–T history to pressures above 6 kbars,with calculated compositions at a lower P yielding significantly higherXanorthiteplagioclase than any analysed grains. Subsequent heating through the
garnet-in reaction increases the calculated volume proportions ofplagioclase and biotite towards c. 50% and c. 35%, respectively, con-sistent with petrographic observations.
Xspessartinegarnet and [Fe/Fe+Mg]garnet contours for values representative
of analysed crystal cores and rims constrain garnet growth to between585 and 620 °C . As for sample 8i, an overstep of the garnet-in reactionof c. 25 °C is implied before initiation of garnet growth. Pressure is lesswell-constrained, but the grossular content of analysed crystals wouldbe exceeded at pressures above c. 8 kbars. Peak P of the best-fit path(c. 7.5 kbars) coincides with a garnet volume proportion of 4%, cor-responding well with petrographic evidence. Furthermore, the ab-sence of rutile indicates amaximumpressure of c. 7.5 kbars whenpeakT (c. 640 °C) is eventually reached.
A period of decompression accompanied by an increase in T toc. 640 °C is inferred as coeval with D2. As peak T is approachedstaurolite growth is predicted. The modal proportions of both white
mica and chlorite meanwhile decrease to 0%, consistent with thenotable absence of these prograde phases in this sample. These ob-servations tightly constrain a peak Tof c. 640 °C at c. 6–7 kbars (Fig. 8).
The absence of stable cordierite precludes isothermal decompres-sion from peak T and the retrograde path is constrained to pressuresabove the cordierite-in reactions (Fig. 8). As D3 post-dated stauroliteformation in this sample, this deformation phase is restricted to theretrograde path.
3.3.3. Summary of P–T–d modelling resultsThe geometry of the two independently modelled P–T–d paths is
strikingly similar, and is characterised by a distinctive three-phaseevolution: (1) a moderate dP/dT prograde path to between 610 and620 °C, 7–8 kbars; (2) an initial phase of c. 1 kbar decompressionassociated with continued T increase to between 640 and 660 °C; (3) aretrograde path constrained by the lack of high-T, low-Pminerals suchas sillimanite or cordierite.
4. Geochronology
4.1. Monazite sampling and U–Pb methodology
Monazite ((Ce, La, Th) PO4) grains are common throughout sample14i, as is the case in other medium to high grade Himalayan meta-sediments (Martin et al., 2007). Their locations, in the matrix and ingarnet porphyroblasts, present ameans of bracketing the age of garnetgrowth associated with prograde metamorphism. In turn, this cantightly constrain a segment of the P–T–t history.
Monazite grains from a number of thin sections of sample 14iwere texturally characterised and chemically mapped using a CamecaSX100 electron microprobe. Both matrix monazites and monaziteinclusions in garnet exhibit a similar shape (typically elongate andsub-rounded, but occasionallymore rounded or anhedral), size (average30×10 µm), and Y and Th contents (Y barely detectable and no hint of
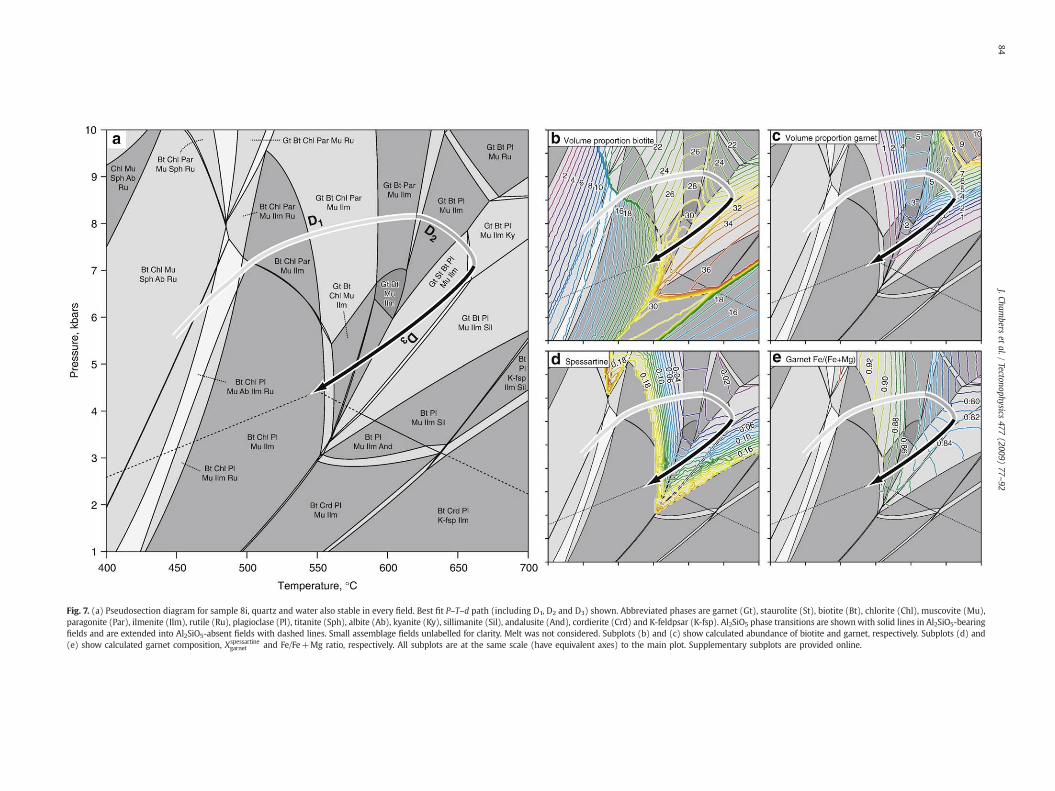
Fig. 7. (a) Pseudosection diagram for sample 8i, quartz and water also stable in every field. Best fit P–T–d path (including D1, D2 and D3) shown. Abbreviated phases are garnet (Gt), staurolite (St), biotite (Bt), chlorite (Chl), muscovite (Mu),paragonite (Par), ilmenite (Ilm), rutile (Ru), plagioclase (Pl), titanite (Sph), albite (Ab), kyanite (Ky), sillimanite (Sil), andalusite (And), cordierite (Crd) and K-feldpsar (K-fsp). Al2SiO5 phase transitions are shownwith solid lines in Al2SiO5-bearingfields and are extended into Al2SiO5-absent fields with dashed lines. Small assemblage fields unlabelled for clarity. Melt was not considered. Subplots (b) and (c) show calculated abundance of biotite and garnet, respectively. Subplots (d) and(e) show calculated garnet composition, Xspessartine
garnet and Fe/Fe+Mg ratio, respectively. All subplots are at the same scale (have equivalent axes) to the main plot. Supplementary subplots are provided online.
84J.Cham
berset
al./Tectonophysics
477(2009)
77–92
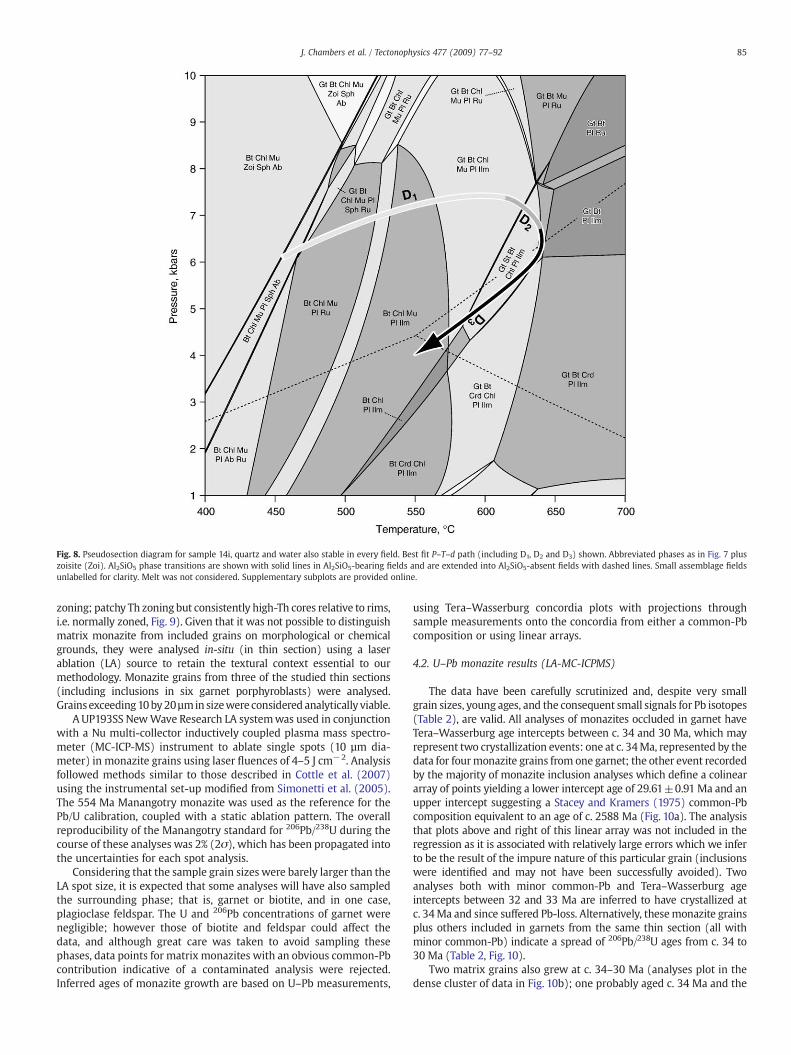
Fig. 8. Pseudosection diagram for sample 14i, quartz and water also stable in every field. Best fit P–T–d path (including D1, D2 and D3) shown. Abbreviated phases as in Fig. 7 pluszoisite (Zoi). Al2SiO5 phase transitions are shown with solid lines in Al2SiO5-bearing fields and are extended into Al2SiO5-absent fields with dashed lines. Small assemblage fieldsunlabelled for clarity. Melt was not considered. Supplementary subplots are provided online.
85J. Chambers et al. / Tectonophysics 477 (2009) 77–92
zoning; patchy Th zoning but consistently high-Th cores relative to rims,i.e. normally zoned, Fig. 9). Given that it was not possible to distinguishmatrix monazite from included grains on morphological or chemicalgrounds, they were analysed in-situ (in thin section) using a laserablation (LA) source to retain the textural context essential to ourmethodology. Monazite grains from three of the studied thin sections(including inclusions in six garnet porphyroblasts) were analysed.Grainsexceeding10by20µmin sizewere considered analytically viable.
A UP193SS NewWave Research LA systemwas used in conjunctionwith a Nu multi-collector inductively coupled plasma mass spectro-meter (MC-ICP-MS) instrument to ablate single spots (10 µm dia-meter) in monazite grains using laser fluences of 4–5 J cm−2. Analysisfollowed methods similar to those described in Cottle et al. (2007)using the instrumental set-up modified from Simonetti et al. (2005).The 554 Ma Manangotry monazite was used as the reference for thePb/U calibration, coupled with a static ablation pattern. The overallreproducibility of the Manangotry standard for 206Pb/238U during thecourse of these analyses was 2% (2σ), which has been propagated intothe uncertainties for each spot analysis.
Considering that the sample grain sizes were barely larger than theLA spot size, it is expected that some analyses will have also sampledthe surrounding phase; that is, garnet or biotite, and in one case,plagioclase feldspar. The U and 206Pb concentrations of garnet werenegligible; however those of biotite and feldspar could affect thedata, and although great care was taken to avoid sampling thesephases, data points for matrix monazites with an obvious common-Pbcontribution indicative of a contaminated analysis were rejected.Inferred ages of monazite growth are based on U–Pb measurements,
using Tera–Wasserburg concordia plots with projections throughsample measurements onto the concordia from either a common-Pbcomposition or using linear arrays.
4.2. U–Pb monazite results (LA-MC-ICPMS)
The data have been carefully scrutinized and, despite very smallgrain sizes, young ages, and the consequent small signals for Pb isotopes(Table 2), are valid. All analyses of monazites occluded in garnet haveTera–Wasserburg age intercepts between c. 34 and 30 Ma, which mayrepresent two crystallization events: one at c. 34Ma, represented by thedata for fourmonazite grains from one garnet; the other event recordedby the majority of monazite inclusion analyses which define a colineararray of points yielding a lower intercept age of 29.61±0.91 Ma and anupper intercept suggesting a Stacey and Kramers (1975) common-Pbcomposition equivalent to an age of c. 2588 Ma (Fig. 10a). The analysisthat plots above and right of this linear array was not included in theregression as it is associated with relatively large errors which we inferto be the result of the impure nature of this particular grain (inclusionswere identified and may not have been successfully avoided). Twoanalyses both with minor common-Pb and Tera–Wasserburg ageintercepts between 32 and 33 Ma are inferred to have crystallized atc. 34Ma and since suffered Pb-loss. Alternatively, thesemonazite grainsplus others included in garnets from the same thin section (all withminor common-Pb) indicate a spread of 206Pb/238U ages from c. 34 to30 Ma (Table 2, Fig. 10).
Two matrix grains also grew at c. 34–30 Ma (analyses plot in thedense cluster of data in Fig. 10b); one probably aged c. 34 Ma and the
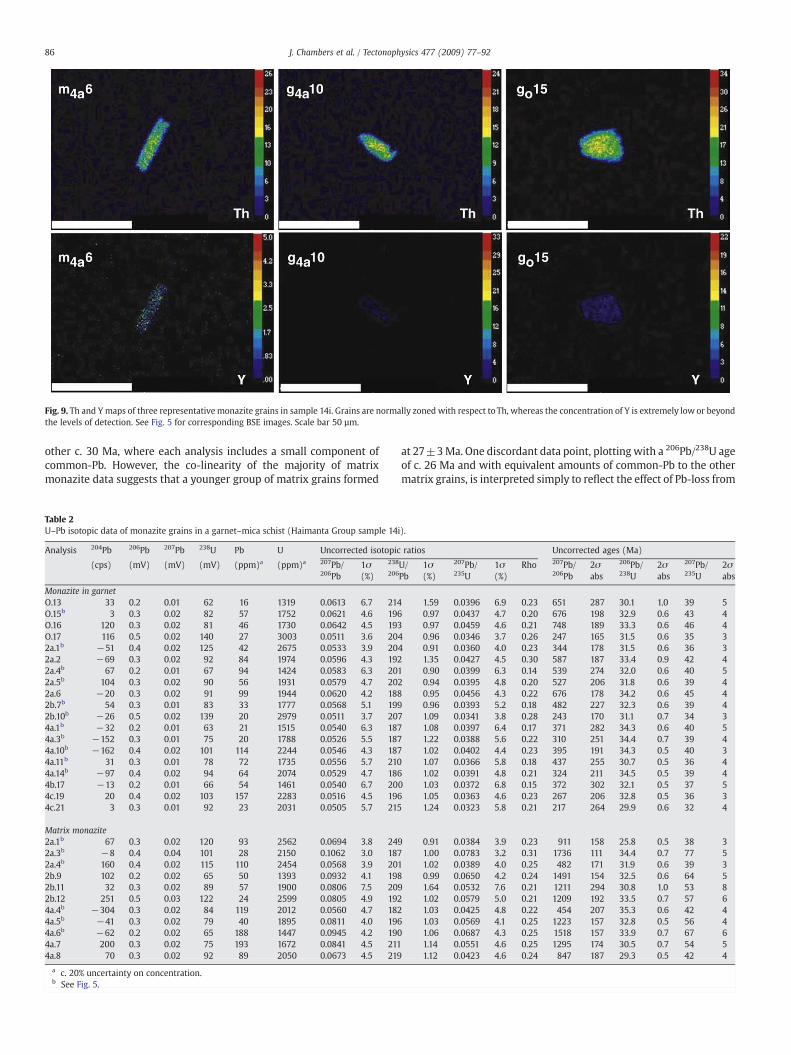
Fig. 9. Th and Ymaps of three representative monazite grains in sample 14i. Grains are normally zoned with respect to Th, whereas the concentration of Y is extremely low or beyondthe levels of detection. See Fig. 5 for corresponding BSE images. Scale bar 50 µm.
86 J. Chambers et al. / Tectonophysics 477 (2009) 77–92
other c. 30 Ma, where each analysis includes a small component ofcommon-Pb. However, the co-linearity of the majority of matrixmonazite data suggests that a younger group of matrix grains formed
Table 2U–Pb isotopic data of monazite grains in a garnet–mica schist (Haimanta Group sample 14i
Analysis 204Pb 206Pb 207Pb 238U Pb U Uncorrected isotopic
(cps) (mV) (mV) (mV) (ppm)a (ppm)a 207Pb/206Pb
1σ(%)
238
206
Monazite in garnetO.13 33 0.2 0.01 62 16 1319 0.0613 6.7 214O.15b 3 0.3 0.02 82 57 1752 0.0621 4.6 196O.16 120 0.3 0.02 81 46 1730 0.0642 4.5 193O.17 116 0.5 0.02 140 27 3003 0.0511 3.6 202a.1b −51 0.4 0.02 125 42 2675 0.0533 3.9 202a.2 −69 0.3 0.02 92 84 1974 0.0596 4.3 1922a.4b 67 0.2 0.01 67 94 1424 0.0583 6.3 2012a.5b 104 0.3 0.02 90 56 1931 0.0579 4.7 2022a.6 −20 0.3 0.02 91 99 1944 0.0620 4.2 1882b.7b 54 0.3 0.01 83 33 1777 0.0568 5.1 1992b.10b −26 0.5 0.02 139 20 2979 0.0511 3.7 2074a.1b −32 0.2 0.01 63 21 1515 0.0540 6.3 1874a.3b −152 0.3 0.01 75 20 1788 0.0526 5.5 1874a.10b −162 0.4 0.02 101 114 2244 0.0546 4.3 1874a.11b 31 0.3 0.01 78 72 1735 0.0556 5.7 2104a.14b −97 0.4 0.02 94 64 2074 0.0529 4.7 1864b.17 −13 0.2 0.01 66 54 1461 0.0540 6.7 204c.19 20 0.4 0.02 103 157 2283 0.0516 4.5 1964c.21 3 0.3 0.01 92 23 2031 0.0505 5.7 215
Matrix monazite2a.1b 67 0.3 0.02 120 93 2562 0.0694 3.8 2492a.3b −8 0.4 0.04 101 28 2150 0.1062 3.0 1872a.4b 160 0.4 0.02 115 110 2454 0.0568 3.9 2012b.9 102 0.2 0.02 65 50 1393 0.0932 4.1 1982b.11 32 0.3 0.02 89 57 1900 0.0806 7.5 2092b.12 251 0.5 0.03 122 24 2599 0.0805 4.9 1924a.4b −304 0.3 0.02 84 119 2012 0.0560 4.7 1824a.5b −41 0.3 0.02 79 40 1895 0.0811 4.0 1964a.6b −62 0.2 0.02 65 188 1447 0.0945 4.2 1904a.7 200 0.3 0.02 75 193 1672 0.0841 4.5 2114a.8 70 0.3 0.02 92 89 2050 0.0673 4.5 219
a c. 20% uncertainty on concentration.b See Fig. 5.
at 27±3Ma. One discordant data point, plotting with a 206Pb/238U ageof c. 26 Ma and with equivalent amounts of common-Pb to the othermatrix grains, is interpreted simply to reflect the effect of Pb-loss from
).
ratios Uncorrected ages (Ma)
U/Pb
1σ(%)
207Pb/235U
1σ(%)
Rho 207Pb/206Pb
2σabs
206Pb/238U
2σabs
207Pb/235U
2σabs
1.59 0.0396 6.9 0.23 651 287 30.1 1.0 39 50.97 0.0437 4.7 0.20 676 198 32.9 0.6 43 40.97 0.0459 4.6 0.21 748 189 33.3 0.6 46 4
4 0.96 0.0346 3.7 0.26 247 165 31.5 0.6 35 34 0.91 0.0360 4.0 0.23 344 178 31.5 0.6 36 3
1.35 0.0427 4.5 0.30 587 187 33.4 0.9 42 40.90 0.0399 6.3 0.14 539 274 32.0 0.6 40 50.94 0.0395 4.8 0.20 527 206 31.8 0.6 39 40.95 0.0456 4.3 0.22 676 178 34.2 0.6 45 40.96 0.0393 5.2 0.18 482 227 32.3 0.6 39 41.09 0.0341 3.8 0.28 243 170 31.1 0.7 34 31.08 0.0397 6.4 0.17 371 282 34.3 0.6 40 51.22 0.0388 5.6 0.22 310 251 34.4 0.7 39 41.02 0.0402 4.4 0.23 395 191 34.3 0.5 40 31.07 0.0366 5.8 0.18 437 255 30.7 0.5 36 41.02 0.0391 4.8 0.21 324 211 34.5 0.5 39 4
0 1.03 0.0372 6.8 0.15 372 302 32.1 0.5 37 51.05 0.0363 4.6 0.23 267 206 32.8 0.5 36 31.24 0.0323 5.8 0.21 217 264 29.9 0.6 32 4
0.91 0.0384 3.9 0.23 911 158 25.8 0.5 38 31.00 0.0783 3.2 0.31 1736 111 34.4 0.7 77 51.02 0.0389 4.0 0.25 482 171 31.9 0.6 39 30.99 0.0650 4.2 0.24 1491 154 32.5 0.6 64 51.64 0.0532 7.6 0.21 1211 294 30.8 1.0 53 81.02 0.0579 5.0 0.21 1209 192 33.5 0.7 57 61.03 0.0425 4.8 0.22 454 207 35.3 0.6 42 41.03 0.0569 4.1 0.25 1223 157 32.8 0.5 56 41.06 0.0687 4.3 0.25 1518 157 33.9 0.7 67 61.14 0.0551 4.6 0.25 1295 174 30.5 0.7 54 51.12 0.0423 4.6 0.24 847 187 29.3 0.5 42 4
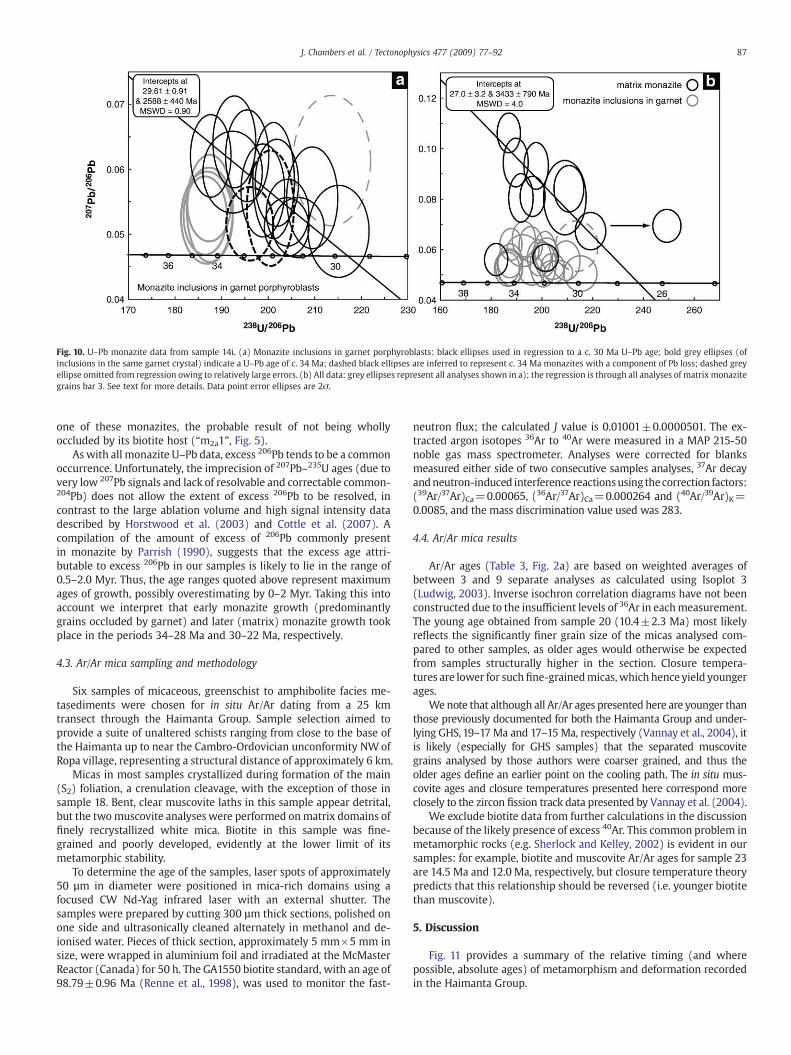
Fig. 10. U–Pb monazite data from sample 14i. (a) Monazite inclusions in garnet porphyroblasts: black ellipses used in regression to a c. 30 Ma U–Pb age; bold grey ellipses (ofinclusions in the same garnet crystal) indicate a U–Pb age of c. 34 Ma; dashed black ellipses are inferred to represent c. 34 Ma monazites with a component of Pb loss; dashed greyellipse omitted from regression owing to relatively large errors. (b) All data: grey ellipses represent all analyses shown in a); the regression is through all analyses of matrix monazitegrains bar 3. See text for more details. Data point error ellipses are 2σ.
87J. Chambers et al. / Tectonophysics 477 (2009) 77–92
one of these monazites, the probable result of not being whollyoccluded by its biotite host (“m2a1”, Fig. 5).
As with all monazite U–Pb data, excess 206Pb tends to be a commonoccurrence. Unfortunately, the imprecision of 207Pb–235U ages (due tovery low 207Pb signals and lack of resolvable and correctable common-204Pb) does not allow the extent of excess 206Pb to be resolved, incontrast to the large ablation volume and high signal intensity datadescribed by Horstwood et al. (2003) and Cottle et al. (2007). Acompilation of the amount of excess of 206Pb commonly presentin monazite by Parrish (1990), suggests that the excess age attri-butable to excess 206Pb in our samples is likely to lie in the range of0.5–2.0 Myr. Thus, the age ranges quoted above represent maximumages of growth, possibly overestimating by 0–2 Myr. Taking this intoaccount we interpret that early monazite growth (predominantlygrains occluded by garnet) and later (matrix) monazite growth tookplace in the periods 34–28 Ma and 30–22 Ma, respectively.
4.3. Ar/Ar mica sampling and methodology
Six samples of micaceous, greenschist to amphibolite facies me-tasediments were chosen for in situ Ar/Ar dating from a 25 kmtransect through the Haimanta Group. Sample selection aimed toprovide a suite of unaltered schists ranging from close to the base ofthe Haimanta up to near the Cambro-Ordovician unconformity NWofRopa village, representing a structural distance of approximately 6 km.
Micas in most samples crystallized during formation of the main(S2) foliation, a crenulation cleavage, with the exception of those insample 18. Bent, clear muscovite laths in this sample appear detrital,but the twomuscovite analyses were performed onmatrix domains offinely recrystallized white mica. Biotite in this sample was fine-grained and poorly developed, evidently at the lower limit of itsmetamorphic stability.
To determine the age of the samples, laser spots of approximately50 µm in diameter were positioned in mica-rich domains using afocused CW Nd-Yag infrared laser with an external shutter. Thesamples were prepared by cutting 300 µm thick sections, polished onone side and ultrasonically cleaned alternately in methanol and de-ionised water. Pieces of thick section, approximately 5 mm×5 mm insize, were wrapped in aluminium foil and irradiated at the McMasterReactor (Canada) for 50 h. The GA1550 biotite standard, with an age of98.79±0.96 Ma (Renne et al., 1998), was used to monitor the fast-
neutron flux; the calculated J value is 0.01001±0.0000501. The ex-tracted argon isotopes 36Ar to 40Ar were measured in a MAP 215-50noble gas mass spectrometer. Analyses were corrected for blanksmeasured either side of two consecutive samples analyses, 37Ar decayandneutron-induced interference reactionsusing thecorrection factors:(39Ar/37Ar)Ca=0.00065, (36Ar/37Ar)Ca=0.000264 and (40Ar/39Ar)K=0.0085, and the mass discrimination value used was 283.
4.4. Ar/Ar mica results
Ar/Ar ages (Table 3, Fig. 2a) are based on weighted averages ofbetween 3 and 9 separate analyses as calculated using Isoplot 3(Ludwig, 2003). Inverse isochron correlation diagrams have not beenconstructed due to the insufficient levels of 36Ar in eachmeasurement.The young age obtained from sample 20 (10.4±2.3 Ma) most likelyreflects the significantly finer grain size of the micas analysed com-pared to other samples, as older ages would otherwise be expectedfrom samples structurally higher in the section. Closure tempera-tures are lower for suchfine-grainedmicas,which hence yield youngerages.
We note that although all Ar/Ar ages presented here are younger thanthose previously documented for both the Haimanta Group and under-lying GHS, 19–17 Ma and 17–15 Ma, respectively (Vannay et al., 2004), itis likely (especially for GHS samples) that the separated muscovitegrains analysed by those authors were coarser grained, and thus theolder ages define an earlier point on the cooling path. The in situ mus-covite ages and closure temperatures presented here correspond moreclosely to the zircon fission track data presented by Vannay et al. (2004).
We exclude biotite data from further calculations in the discussionbecause of the likely presence of excess 40Ar. This common problem inmetamorphic rocks (e.g. Sherlock and Kelley, 2002) is evident in oursamples: for example, biotite and muscovite Ar/Ar ages for sample 23are 14.5 Ma and 12.0 Ma, respectively, but closure temperature theorypredicts that this relationship should be reversed (i.e. younger biotitethan muscovite).
5. Discussion
Fig. 11 provides a summary of the relative timing (and wherepossible, absolute ages) of metamorphism and deformation recordedin the Haimanta Group.

Table 3Infrared laserprobe Ar/Ar age data.
Sample-Mineral 40Ar ± 39Ar ± 38Ar ± 37Ar ± 36Ar ± 40Ar⁎/39Ar ± Age (Ma) +/−20-Wm 1.1618 0.0110 0.9917 0.0047 0.0125 0.0004 1.3427 0.0074 0.0021 0.0004 0.5577 0.1053 10.0 1.920-Wm 2.1705 0.0024 0.4868 0.0010 0.0082 0.0001 0.3855 0.0001 0.0064 0.0001 0.5859 0.0860 10.6 1.520-Wm 0.2096 0.0005 0.2173 0.0004 0.0024 0.0001 0.1177 0.0000 0.0003 0.0002 0.6108 0.2859 11.0 5.121-Bt 0.3481 0.0014 0.3488 0.0019 0.0043 0.0001 0.0029 0.0001 0.0002 0.0001 0.7948 0.0849 14.3 1.521-Bt 0.1623 0.0005 0.1404 0.0007 0.0017 0.0000 0.0005 0.0000 0.0001 0.0000 0.9138 0.0120 16.4 0.221-Bt 0.1843 0.0005 0.1605 0.0006 0.0021 0.0000 0.0010 0.0000 0.0002 0.0000 0.8075 0.0102 14.5 0.221-Bt 0.3641 0.0010 0.3868 0.0025 0.0032 0.0002 0.0147 0.0007 0.0002 0.0001 0.8076 0.0431 14.5 0.821-Bt 0.4121 0.0013 0.3555 0.0013 0.0039 0.0002 0.0083 0.0007 0.0006 0.0001 0.6314 0.0467 11.4 0.821-Bt 0.1643 0.0003 0.1354 0.0003 0.0015 0.0000 0.0062 0.0003 0.0002 0.0000 0.8867 0.0691 15.9 1.222-Wm 0.3344 0.0003 0.3478 0.0015 0.0040 0.0000 0.0005 0.0000 0.0003 0.0001 0.7150 0.0602 12.9 1.122a-Wm 0.2531 0.0004 0.2343 0.0010 0.0029 0.0001 0.0010 0.0000 0.0002 0.0000 0.8407 0.0183 15.1 0.322a-Wm 0.2137 0.0007 0.2031 0.0006 0.0023 0.0000 0.0005 0.0000 0.0002 0.0000 0.7464 0.0210 13.4 0.422a-Wm 0.3242 0.0006 0.3426 0.0002 0.0033 0.0001 0.0014 0.0001 0.0002 0.0000 0.7522 0.0216 13.5 0.422a-Wm 0.2218 0.0009 0.2102 0.0010 0.0025 0.0001 0.0012 0.0001 0.0002 0.0000 0.7921 0.0619 14.2 1.122a-Wm 0.2104 0.0008 0.2239 0.0015 0.0027 0.0000 0.0009 0.0001 0.0001 0.0000 0.7588 0.0582 13.6 1.022a-Wm 0.4092 0.0033 0.3922 0.0010 0.0046 0.0001 0.0010 0.0001 0.0002 0.0001 0.8797 0.0403 15.8 0.722a-Wm 0.1978 0.0003 0.1863 0.0002 0.0021 0.0000 0.0005 0.0001 0.0002 0.0000 0.8238 0.0502 14.8 0.922a-Wm 0.2615 0.0003 0.2602 0.0012 0.0033 0.0001 0.0004 0.0000 0.0001 0.0001 0.8745 0.0973 15.7 1.723-Bt 2.8174 0.0054 1.1911 0.0033 0.0157 0.0002 0.0020 0.0001 0.0063 0.0000 0.8098 0.0117 14.6 0.223-Bt 0.3705 0.0006 0.1527 0.0006 0.0021 0.0000 0.0001 0.0001 0.0008 0.0000 0.8588 0.0614 15.4 1.123-Bt 0.2776 0.0017 0.1655 0.0009 0.0020 0.0001 −0.0001 0.0004 0.0005 0.0000 0.8118 0.0340 14.6 0.623-Bt 0.7917 0.0010 0.3438 0.0015 0.0042 0.0000 0.0002 0.0001 0.0018 0.0000 0.7928 0.0369 14.2 0.723-Bt 1.0926 0.0013 0.4885 0.0016 0.0043 0.0002 0.0006 0.0001 0.0023 0.0000 0.8592 0.0288 15.4 0.523-Bt 1.0469 0.0013 0.5364 0.0014 0.0065 0.0000 0.0008 0.0001 0.0022 0.0000 0.7524 0.0261 13.5 0.523-Wm 0.7105 0.0015 0.4702 0.0022 0.0059 0.0001 0.0008 0.0001 0.0014 0.0000 0.6186 0.0203 11.1 0.423-Wm 0.2957 0.0006 0.2478 0.0015 0.0026 0.0001 0.0024 0.0003 0.0005 0.0000 0.6446 0.0380 11.6 0.723-Wm 0.2336 0.0011 0.1719 0.0013 0.0012 0.0001 0.0034 0.0007 0.0004 0.0000 0.7487 0.0364 13.5 0.723-Wm 0.4360 0.0009 0.3878 0.0027 0.0047 0.0002 0.0007 0.0001 0.0007 0.0000 0.6059 0.0246 10.9 0.423-Wm 0.8057 0.0014 0.4508 0.0003 0.0055 0.0001 0.0006 0.0001 0.0016 0.0000 0.7186 0.0239 12.9 0.423-Wm 0.5825 0.0007 0.4759 0.0003 0.0058 0.0001 0.0014 0.0001 0.0010 0.0000 0.6340 0.0224 11.4 0.423-Wm 0.6531 0.0015 0.4474 0.0010 0.0057 0.0000 0.0011 0.0001 0.0011 0.0000 0.7332 0.0212 13.2 0.423-Wm 0.2334 0.0005 0.2535 0.0010 0.0023 0.0001 0.0014 0.0003 0.0001 0.0001 0.7983 0.0998 14.4 1.823-Wm 0.2726 0.0004 0.2470 0.0010 0.0031 0.0001 0.0027 0.0001 0.0004 0.0000 0.6670 0.0324 12.0 0.623-Wm 0.3008 0.0007 0.2801 0.0011 0.0034 0.0001 0.0071 0.0005 0.0004 0.0000 0.6941 0.0336 12.5 0.6Average blank 0.0096 0.0016 0.0005 0.0001 0.0005 0.0002 0.0003 0.0007 0.0012 0.0006
All measurements are in volts; the calculated ages include the error on J and are 2σ.
88 J. Chambers et al. / Tectonophysics 477 (2009) 77–92
5.1. Timing of the modelled P–T–d path
The timing of monazite crystallization, derived from U–Pb monazitedata (sample 14i), is assigned to the modelled prograde P–T path basedon several lines of evidence: (1) simple Th zoning in monazite is con-sistentwith fractionationduringgrowthuponheating(KohnandMalloy,2004); (2)we foundno textural evidence for the formation of retrogrademonazite (e.g. after allanite; Bollinger and Janots, 2006); (3) smoothzoning profiles in garnet (Fig. 6) do not support the hypothesis thatoccludedmonazite grains grew post-garnet growth along nowannealedcracks; (4) retrograde metamorphism for this sample is minimal. Giventhat the garnet porphyroblasts preserve included phases from core torim, and that monazite is restricted to the outer-core to rim regions(Fig. 5), monazite growth (beginning at c. 34 Ma) is interpreted to havepost-dated the initiation of garnet growth. This explains the low Ycontent of the monazite grains, Y having been sequestered by earliergarnet growth (Pyle and Spear, 1999; Foster et al., 2002) as indicated bydecreasingY concentration fromcore to rimof garnet crystals (Fig. 6d). Ifmonazite grew as the result of a single reaction as implied by the simpleTh zoning in the analysed grains (Kohn andMalloy, 2004), we infer thatthe garnet-in reaction involving the breakdown of muscovite andchlorite released the necessary P and LREE to form monazite (Kohn andMalloy, 2004). The observed monazite-free garnet cores, however, sug-gest a delay between the first growth of garnet and the earliest recordedmonazite grains. These observations imply monazite formation at≥600 °C (taking into account an overstep of the garnet-in reaction,Figs. 7 and 8) rather thanat lower Tas a productof allanite breakdown (c.350–400 °C;Wing et al., 2003). In contrast, monazite growth in the GHSofGarhwal grewbothbefore andafter garnet growth (Foster et al., 2000).
The ages of the youngest monazite grains occluded by garnet(c. 28Ma) and of the analysedmatrix grains (c. 27Ma) bracket the finalstage of garnet growth to c. 28 Ma. As the rims of garnet crystals record
syn-tectonic growth during early-D2, we infer that this phase ofdeformation began c. 30 Ma. Hence most matrix monazite grains, aged27±3 Ma, crystallized during D2 with continued heating. Two oldermatrix grains (c. 34 and c. 30Ma, Fig.10b) are located in garnet pressureshadows, and we infer that these were protected from D2 recrystalliza-tion. All othermatrixmonazite grainsmay have initially grown between34 and 30 Ma and been subsequently recrystallized during D2. Alter-natively, matrix grainsmaymerely preserve their various crystallizationages (c. 34, 30 and 27 Ma), as the peak temperature for this sample(640 °C, Fig. 8) is significantly below the closure temperature formonazite (N800 °C, Spear and Parrish, 1996; Cherniak et al., 2004).
Garnet growth in the latest Eocene to Early Oligocene is consistentwith data from elsewhere in the NW Himalaya, notably in the HarsilFormation, Garhwal (c. 36–30 Ma, Foster et al., 2000), but also in theunderlyingGHS of Garhwal (c. 36–30Ma, Foster et al., 2000) and Zanskar(c. 33–28 Ma, Vance and Harris, 1999). A 35±3 Ma kyanite-bearingleucosome in the uppermost GHS in central Nepal provides further evi-dence of high-grade Early Oligocenemetamorphism (Godin et al., 1999).
The Oligocene high-grade metamorphism experienced by theHaimanta Group questions the suggestion that a pre-Tertiary eventwas responsible for the main deformation fabrics and metamorphicminerals (Marquer et al., 2000). Other than early plagioclase cores thatwe can only tentatively assign to a pre-Himalayanmetamorphic event,we found no evidence for pre-Himalayan deformation and metamor-phism including a striking lack of pre-Tertiary monazite (cf. Martinet al., 2007). This clearly does not preclude a pre-Tertiary metamor-phic history for these samples, although it does imply a pervasiveOligocene overprint. Syn-kinematic kyanite observed in sheared Akpagranite at its upper contact with the Haimanta Group almost cer-tainly formed during Tertiary metamorphism, and it is possible thatdeformation fabrics in xenoliths of the Haimanta Group also recordTertiary strain, especially where they are close to the granite margin.
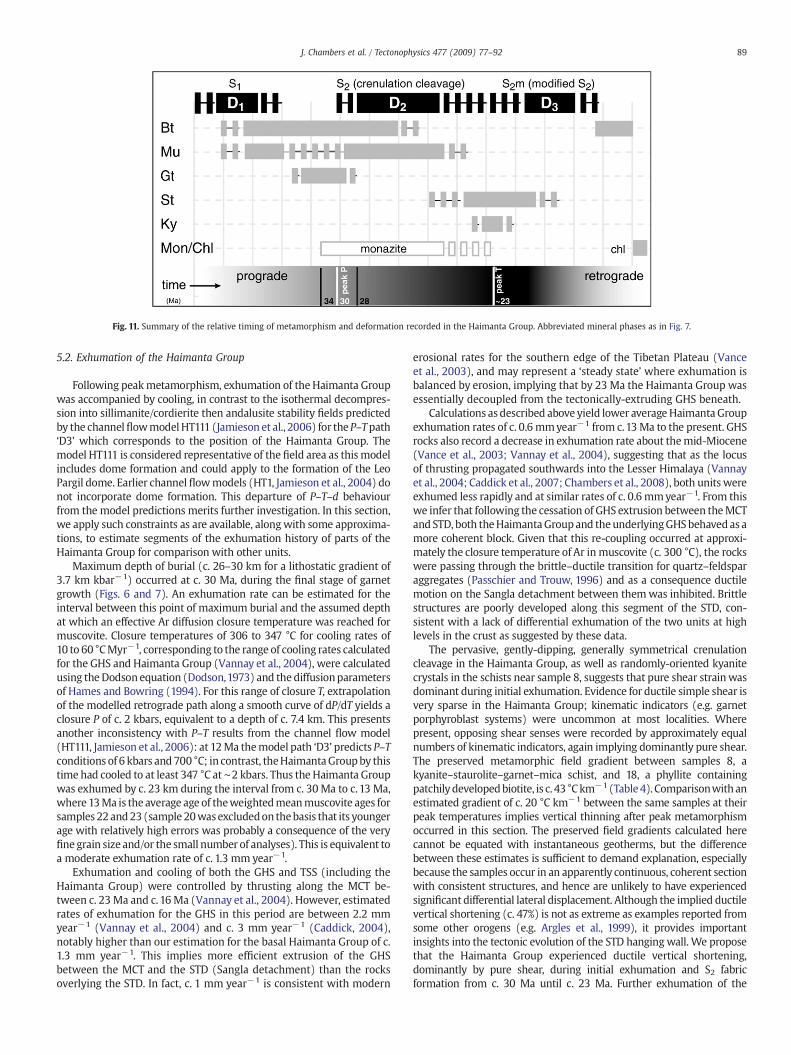
Fig. 11. Summary of the relative timing of metamorphism and deformation recorded in the Haimanta Group. Abbreviated mineral phases as in Fig. 7.
89J. Chambers et al. / Tectonophysics 477 (2009) 77–92
5.2. Exhumation of the Haimanta Group
Following peakmetamorphism, exhumation of the Haimanta Groupwas accompanied by cooling, in contrast to the isothermal decompres-sion into sillimanite/cordierite then andalusite stability fields predictedby the channelflowmodelHT111 (Jamieson et al., 2006) for theP–Tpath‘D3’ which corresponds to the position of the Haimanta Group. Themodel HT111 is considered representative of the field area as this modelincludes dome formation and could apply to the formation of the LeoPargil dome. Earlier channel flowmodels (HT1, Jamieson et al., 2004) donot incorporate dome formation. This departure of P–T–d behaviourfrom the model predictions merits further investigation. In this section,we apply such constraints as are available, alongwith some approxima-tions, to estimate segments of the exhumation history of parts of theHaimanta Group for comparison with other units.
Maximum depth of burial (c. 26–30 km for a lithostatic gradient of3.7 km kbar−1) occurred at c. 30 Ma, during the final stage of garnetgrowth (Figs. 6 and 7). An exhumation rate can be estimated for theinterval between this point of maximum burial and the assumed depthat which an effective Ar diffusion closure temperature was reached formuscovite. Closure temperatures of 306 to 347 °C for cooling rates of10 to 60 °CMyr−1, corresponding to the range of cooling rates calculatedfor the GHS and Haimanta Group (Vannay et al., 2004), were calculatedusing theDodson equation (Dodson,1973) and the diffusionparametersof Hames and Bowring (1994). For this range of closure T, extrapolationof the modelled retrograde path along a smooth curve of dP/dT yields aclosure P of c. 2 kbars, equivalent to a depth of c. 7.4 km. This presentsanother inconsistency with P–T results from the channel flow model(HT111, Jamieson et al., 2006): at 12Ma themodel path ‘D3’ predicts P–Tconditions of 6 kbars and700 °C; in contrast, theHaimantaGroupby thistime had cooled to at least 347 °C at∼2 kbars. Thus the Haimanta Groupwas exhumed by c. 23 km during the interval from c. 30 Ma to c. 13 Ma,where 13Ma is the average age of theweightedmeanmuscovite ages forsamples 22 and23(sample 20wasexcludedon thebasis that its youngerage with relatively high errors was probably a consequence of the veryfinegrain size and/or the small number of analyses). This is equivalent toa moderate exhumation rate of c. 1.3 mm year−1.
Exhumation and cooling of both the GHS and TSS (including theHaimanta Group) were controlled by thrusting along the MCT be-tween c. 23Ma and c.16 Ma (Vannay et al., 2004). However, estimatedrates of exhumation for the GHS in this period are between 2.2 mmyear−1 (Vannay et al., 2004) and c. 3 mm year−1 (Caddick, 2004),notably higher than our estimation for the basal Haimanta Group of c.1.3 mm year−1. This implies more efficient extrusion of the GHSbetween the MCT and the STD (Sangla detachment) than the rocksoverlying the STD. In fact, c. 1 mm year−1 is consistent with modern
erosional rates for the southern edge of the Tibetan Plateau (Vanceet al., 2003), and may represent a ‘steady state’ where exhumation isbalanced by erosion, implying that by 23 Ma the Haimanta Group wasessentially decoupled from the tectonically-extruding GHS beneath.
Calculations as described above yield lower averageHaimanta Groupexhumation rates of c. 0.6 mmyear−1 from c.13Ma to the present. GHSrocks also record a decrease in exhumation rate about themid-Miocene(Vance et al., 2003; Vannay et al., 2004), suggesting that as the locusof thrusting propagated southwards into the Lesser Himalaya (Vannayet al., 2004; Caddick et al., 2007; Chambers et al., 2008), both units wereexhumed less rapidly and at similar rates of c. 0.6 mmyear−1. From thiswe infer that following the cessation of GHS extrusion between theMCTand STD, both theHaimantaGroupand theunderlyingGHSbehavedas amore coherent block. Given that this re-coupling occurred at approxi-mately the closure temperature of Ar in muscovite (c. 300 °C), the rockswere passing through the brittle–ductile transition for quartz–feldsparaggregates (Passchier and Trouw, 1996) and as a consequence ductilemotion on the Sangla detachment between themwas inhibited. Brittlestructures are poorly developed along this segment of the STD, con-sistent with a lack of differential exhumation of the two units at highlevels in the crust as suggested by these data.
The pervasive, gently-dipping, generally symmetrical crenulationcleavage in the Haimanta Group, as well as randomly-oriented kyanitecrystals in the schists near sample 8, suggests that pure shear strainwasdominant during initial exhumation. Evidence for ductile simple shear isvery sparse in the Haimanta Group; kinematic indicators (e.g. garnetporphyroblast systems) were uncommon at most localities. Wherepresent, opposing shear senses were recorded by approximately equalnumbers of kinematic indicators, again implying dominantly pure shear.The preserved metamorphic field gradient between samples 8, akyanite–staurolite–garnet–mica schist, and 18, a phyllite containingpatchily developedbiotite, is c. 43 °Ckm−1 (Table4). Comparisonwithanestimated gradient of c. 20 °C km−1 between the same samples at theirpeak temperatures implies vertical thinning after peak metamorphismoccurred in this section. The preserved field gradients calculated herecannot be equated with instantaneous geotherms, but the differencebetween these estimates is sufficient to demand explanation, especiallybecause the samples occur in an apparently continuous, coherent sectionwith consistent structures, and hence are unlikely to have experiencedsignificant differential lateral displacement. Although the implied ductilevertical shortening (c. 47%) is not as extreme as examples reported fromsome other orogens (e.g. Argles et al., 1999), it provides importantinsights into the tectonic evolution of the STD hangingwall. We proposethat the Haimanta Group experienced ductile vertical shortening,dominantly by pure shear, during initial exhumation and S2 fabricformation from c. 30 Ma until c. 23 Ma. Further exhumation of the

Table 4Calculations of metamorphic field gradients in the Haimanta Group.
Sample/section
PeakT (°C)
PeakP (kbar)a
Peakdepth(km)b
Presentdistance(km)
Peakgradient(°C km−1)c
Presentgradient(°C km−1)c
Verticalshorteningfactor
18 400 3.54 13 – 31 – –
8 660 7 26 – 25 – –
18 to 8 260 3.5 13 ∼6e 20 43 ∼2
aP at peak T conditions.bCalculated assuming lithostatic gradient of 3.7 km/kbar.cMetamorphic field gradient, not necessarily instantaneous geothermal gradient.dEstimated for biotite isograd (Ferry, 1984).eStructural distance between samples 18 and 8 (Fig. 2a).
90 J. Chambers et al. / Tectonophysics 477 (2009) 77–92
underlying GHS between c. 23 Ma and c. 16 Ma was accomplished byductile extrusion beneath the extensional Sangla detachment. This phaseis represented in the hanging wall (Haimanta Group) by the develop-ment of simple shear ductile structures thatmodify S2 (i.e. the D3 stage),which may also have contributed to vertical thinning of the section.However, it is important to note thatwe did not observe anymajor brittlestructures between localities 8 and 18 that could have excised substantialparts of the section, aswasdemonstrated in the Betic Cordillera by Argleset al. (1999). From this structural evolutionwe infer the age of peak T onthe modelled P–T–t–d paths (Figs. 7 and 8), which is marked by thetransition from D2 to D3 preserved in sample 8i, at c. 23 Ma (Fig. 1).
5.3. Tectonic implications of the Haimanta Group
Despite a relativelyminor difference inmetamorphic grade betweenthe basal Haimanta Group (kyanite-grade) and the uppermost GHS(sillimanite-grade) seen in the Sutlej valley, there are several crucialreasons for separating them into two distinct tectonic units: (1) they areseparated by a mylonite zone with both top-to-the-SW (thrust) andoverprinting top-to-the-NE (normal) shear sense indicators that clearlydefine a major tectonic boundary; (2) they display different structuralstyles: a constantly oriented crenulation cleavage in the HaimantaGroup, but a highly disrupted and deformed migmatitic foliation in theGHS gneisses; (3) theHaimanta Group lacks any evidence of in situmelt,which is abundant in the underlying rocks, both as deformed kyanite-bearing leucosomes and later segregations associated with sillimanite-grade metamorphism; (4) decoupled exhumation between c. 23 and16 Ma resulted in distinct retrograde P–T paths, which for the GHSare characterised by decompression through muscovite-out reactions(Vance and Harris, 1999; Caddick, 2004; Harris et al., 2004).
The structures observed in the Haimanta Group (crenulation cleav-age, flat-lying folds, weak to moderate stretching lineations) areincompatible with extreme ductile flow and thus preclude theassignment of this unit to a low-viscosity crustal channel (e.g.Beaumont et al., 2001). The notable absence of in situ melt in theHaimanta Group supports this deduction, with in situ melting asidentified in parts of the GHS providing a means of weakening leadingto flow beneath southern Tibet (Zhang et al., 2004). Thus, the HaimantaGroup may represent a relatively passive ‘lid’ to a ‘GHS channel’localising intense ductile deformation below. Having been buried togreater depths than the Haimanta Group, and consequently attainedhigher temperatures, a sufficiently melt-weakened GHS now exposedin the Sutlej valley may have formed a south-directed plastic flowduring the Late Oligocene–early Miocene, as proposed for rocks incentral Nepal (Godin et al., 2007). The rheological contrast between themiddle and upper crust (effectively the GHS and the Akpa granite/Haimanta Group, respectively) became such that they were decoupledduring this phase of exhumation. Decompression before significantcooling in the GHS resulted in the ‘Neohimalayan’ phase of meta-morphism, i.e. the high-T (sillimanite-grade) ‘event’ associated withmelt generation, while the Haimanta Group was exhumed at more
moderate rates associated with steady cooling. The lower peak tem-peratures attained in the Haimanta Group helped to preserve evidenceof its ‘Eohimalayan’ burial history.
Ductile thinning of the Haimanta Group (lowermost TSS) duringinitial exhumation is consistent with predictions of the critical oro-genic wedge model (Platt, 1986) for rocks near the rear of the wedge.However, this model assumes a uniform rheology for the wedge ma-terial (on a large scale), which is contrary to theweakmid-crustal layer,represented by the GHS, prescribed in the channel flow model(Beaumont et al., 2001). While vertical compression of the channellid (i.e. the STD hanging wall) is not explicitly predicted by somechannel flow numerical models (e.g. HT1, Jamieson et al., 2004),simulations involving a weakened upper crust do produce localisedthinning of the channel lid and doming of the underlying high-gradematerial (model HT111, Jamieson et al., 2006). The thinned Haimantasection could be an expression of such crustal thinning above thenearby Leo Pargil dome, as is recognised in some crustal sectionssurrounding the North Himalayan Gneiss Domes further east (Quigleyet al., 2008). The Leo Pargil dome may thus represent the closestchannel doming to the STD currently recorded.
The Haimanta Group represents a distinct tectonic unit of thecrystalline core of theHimalaya.We recognise that it shares a strikinglysimilar tectonic evolution to that of the uppermost GHS in centralNepal (VannayandHodges,1996; Coleman andHodges,1998; Godin etal., 2001; Gleeson and Godin, 2006), where the ductile Chame andbrittle Phu detachments are likely equivalent structures to the Sangladetachment and the detachment north and east of the Leo Pargil dome(see Fig. 1 in Thiede et al., 2006), respectively. Gleeson and Godin(2006) propose that the uppermost GHS in central Nepal may beequivalent to units up to 300 km further east along-strike, e.g. theEverest Series. Indeed, if the Haimanta Group can be correlated withthese units then it is of greater regional significance than has beenpreviously recognised.
6. Conclusions
Amphibolite facies metasediments of the Haimanta Group, seen inthe western Himalaya at the base of the Tethyan sediments andstructurally above the GHS, record a history of burial and heating to amaximum depth of b8 kbars at c. 600 °C. The ensuing phase ofdecompression during further heating began at c. 30 Ma, and wasaccompanied by (D2) deformation resulting in the formation of apervasive crenulation cleavage (S2), and the growth of staurolite andkyanite porphyroblasts. Continued cooling from a peak T of b660 °Caccompanied further decompression, and a temperature of 300–350 °C was reached at approximately 2 kbars, by c. 13 Ma. The initialaverage exhumation rate of c. 1.3 mm year−1 during the interval c. 30and 13Mawas followed by a reduced average rate of c. 0.6 mmyear−1
from 13 Ma to the present. During the first part of this exhumationhistory the underlying GHS was more rapidly exhumed than theHaimanta Group, with the two units remaining decoupled untilc. 16 Ma. After c. 13 Ma, both units were exhumed at equal rates(c. 0.6mmyear−1), implying exhumation as a single tectonic unit. TheHaimanta Group is recognised as a distinct tectono-thermal unit fromthe underlying GHS and, with along-strike correlatives, is important toreconcile with current models of Himalayan orogenesis.
Acknowledgements
Field work was supported by a NERC Research Studentship fieldgrant (JC) and a NERC Research Grant NE/C513942/1 (TA and NH). MCwas in receipt of ETH Research Funds. Analytical work at the NERCIsotope Geoscience Laboratory in the UK was supported by NIGF grantIP/868/1105. We thank Andy Tindle for his assistance with electronmicroprobe analyses, and to R. Jamieson, R. Law and an anonymousreviewer for their helpful reviews.
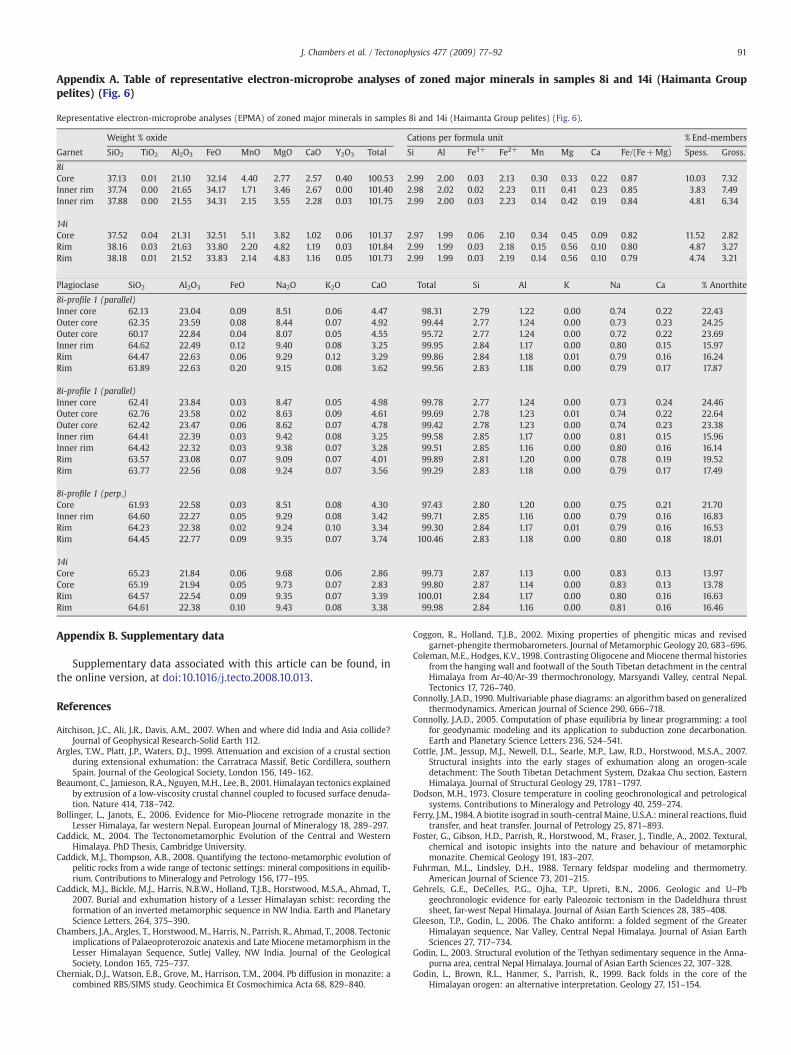
Appendix A. Table of representative electron-microprobe analyses of zoned major minerals in samples 8i and 14i (Haimanta Grouppelites) (Fig. 6)
Representative electron-microprobe analyses (EPMA) of zoned major minerals in samples 8i and 14i (Haimanta Group pelites) (Fig. 6).
Weight % oxide Cations per formula unit % End-members
Garnet SiO2 TiO2 Al2O3 FeO MnO MgO CaO Y2O3 Total Si Al Fe3+ Fe2+ Mn Mg Ca Fe/(Fe+Mg) Spess. Gross.
8iCore 37.13 0.01 21.10 32.14 4.40 2.77 2.57 0.40 100.53 2.99 2.00 0.03 2.13 0.30 0.33 0.22 0.87 10.03 7.32Inner rim 37.74 0.00 21.65 34.17 1.71 3.46 2.67 0.00 101.40 2.98 2.02 0.02 2.23 0.11 0.41 0.23 0.85 3.83 7.49Inner rim 37.88 0.00 21.55 34.31 2.15 3.55 2.28 0.03 101.75 2.99 2.00 0.03 2.23 0.14 0.42 0.19 0.84 4.81 6.34
14iCore 37.52 0.04 21.31 32.51 5.11 3.82 1.02 0.06 101.37 2.97 1.99 0.06 2.10 0.34 0.45 0.09 0.82 11.52 2.82Rim 38.16 0.03 21.63 33.80 2.20 4.82 1.19 0.03 101.84 2.99 1.99 0.03 2.18 0.15 0.56 0.10 0.80 4.87 3.27Rim 38.18 0.01 21.52 33.83 2.14 4.83 1.16 0.05 101.73 2.99 1.99 0.03 2.19 0.14 0.56 0.10 0.79 4.74 3.21
Plagioclase SiO2 Al2O3 FeO Na2O K2O CaO Total Si Al K Na Ca % Anorthite
8i-profile 1 (parallel)Inner core 62.13 23.04 0.09 8.51 0.06 4.47 98.31 2.79 1.22 0.00 0.74 0.22 22.43Outer core 62.35 23.59 0.08 8.44 0.07 4.92 99.44 2.77 1.24 0.00 0.73 0.23 24.25Outer core 60.17 22.84 0.04 8.07 0.05 4.55 95.72 2.77 1.24 0.00 0.72 0.22 23.69Inner rim 64.62 22.49 0.12 9.40 0.08 3.25 99.95 2.84 1.17 0.00 0.80 0.15 15.97Rim 64.47 22.63 0.06 9.29 0.12 3.29 99.86 2.84 1.18 0.01 0.79 0.16 16.24Rim 63.89 22.63 0.20 9.15 0.08 3.62 99.56 2.83 1.18 0.00 0.79 0.17 17.87
8i-profile 1 (parallel)Inner core 62.41 23.84 0.03 8.47 0.05 4.98 99.78 2.77 1.24 0.00 0.73 0.24 24.46Outer core 62.76 23.58 0.02 8.63 0.09 4.61 99.69 2.78 1.23 0.01 0.74 0.22 22.64Outer core 62.42 23.47 0.06 8.62 0.07 4.78 99.42 2.78 1.23 0.00 0.74 0.23 23.38Inner rim 64.41 22.39 0.03 9.42 0.08 3.25 99.58 2.85 1.17 0.00 0.81 0.15 15.96Inner rim 64.42 22.32 0.03 9.38 0.07 3.28 99.51 2.85 1.16 0.00 0.80 0.16 16.14Rim 63.57 23.08 0.07 9.09 0.07 4.01 99.89 2.81 1.20 0.00 0.78 0.19 19.52Rim 63.77 22.56 0.08 9.24 0.07 3.56 99.29 2.83 1.18 0.00 0.79 0.17 17.49
8i-profile 1 (perp.)Core 61.93 22.58 0.03 8.51 0.08 4.30 97.43 2.80 1.20 0.00 0.75 0.21 21.70Inner rim 64.60 22.27 0.05 9.29 0.08 3.42 99.71 2.85 1.16 0.00 0.79 0.16 16.83Rim 64.23 22.38 0.02 9.24 0.10 3.34 99.30 2.84 1.17 0.01 0.79 0.16 16.53Rim 64.45 22.77 0.09 9.35 0.07 3.74 100.46 2.83 1.18 0.00 0.80 0.18 18.01
14iCore 65.23 21.84 0.06 9.68 0.06 2.86 99.73 2.87 1.13 0.00 0.83 0.13 13.97Core 65.19 21.94 0.05 9.73 0.07 2.83 99.80 2.87 1.14 0.00 0.83 0.13 13.78Rim 64.57 22.54 0.09 9.35 0.07 3.39 100.01 2.84 1.17 0.00 0.80 0.16 16.63Rim 64.61 22.38 0.10 9.43 0.08 3.38 99.98 2.84 1.16 0.00 0.81 0.16 16.46
91J. Chambers et al. / Tectonophysics 477 (2009) 77–92
Appendix B. Supplementary data
Supplementary data associated with this article can be found, inthe online version, at doi:10.1016/j.tecto.2008.10.013.
References
Aitchison, J.C., Ali, J.R., Davis, A.M., 2007. When and where did India and Asia collide?Journal of Geophysical Research-Solid Earth 112.
Argles, T.W., Platt, J.P., Waters, D.J., 1999. Attenuation and excision of a crustal sectionduring extensional exhumation: the Carratraca Massif, Betic Cordillera, southernSpain. Journal of the Geological Society, London 156, 149–162.
Beaumont, C., Jamieson, R.A., Nguyen, M.H., Lee, B., 2001. Himalayan tectonics explainedby extrusion of a low-viscosity crustal channel coupled to focused surface denuda-tion. Nature 414, 738–742.
Bollinger, L., Janots, E., 2006. Evidence for Mio-Pliocene retrograde monazite in theLesser Himalaya, far western Nepal. European Journal of Mineralogy 18, 289–297.
Caddick, M., 2004. The Tectonometamorphic Evolution of the Central and WesternHimalaya. PhD Thesis, Cambridge University.
Caddick, M.J., Thompson, A.B., 2008. Quantifying the tectono-metamorphic evolution ofpelitic rocks from a wide range of tectonic settings: mineral compositions in equilib-rium. Contributions to Mineralogy and Petrology 156, 177–195.
Caddick, M.J., Bickle, M.J., Harris, N.B.W., Holland, T.J.B., Horstwood, M.S.A., Ahmad, T.,2007. Burial and exhumation history of a Lesser Himalayan schist: recording theformation of an inverted metamorphic sequence in NW India. Earth and PlanetaryScience Letters, 264, 375–390.
Chambers, J.A., Argles, T., Horstwood,M., Harris, N., Parrish, R., Ahmad, T., 2008. Tectonicimplications of Palaeoproterozoic anatexis and Late Miocene metamorphism in theLesser Himalayan Sequence, Sutlej Valley, NW India. Journal of the GeologicalSociety, London 165, 725–737.
Cherniak, D.J., Watson, E.B., Grove, M., Harrison, T.M., 2004. Pb diffusion in monazite: acombined RBS/SIMS study. Geochimica Et Cosmochimica Acta 68, 829–840.
Coggon, R., Holland, T.J.B., 2002. Mixing properties of phengitic micas and revisedgarnet-phengite thermobarometers. Journal of Metamorphic Geology 20, 683–696.
Coleman, M.E., Hodges, K.V., 1998. Contrasting Oligocene andMiocene thermal historiesfrom the hanging wall and footwall of the South Tibetan detachment in the centralHimalaya from Ar-40/Ar-39 thermochronology, Marsyandi Valley, central Nepal.Tectonics 17, 726–740.
Connolly, J.A.D., 1990. Multivariable phase diagrams: an algorithm based on generalizedthermodynamics. American Journal of Science 290, 666–718.
Connolly, J.A.D., 2005. Computation of phase equilibria by linear programming: a toolfor geodynamic modeling and its application to subduction zone decarbonation.Earth and Planetary Science Letters 236, 524–541.
Cottle, J.M., Jessup, M.J., Newell, D.L., Searle, M.P., Law, R.D., Horstwood, M.S.A., 2007.Structural insights into the early stages of exhumation along an orogen-scaledetachment: The South Tibetan Detachment System, Dzakaa Chu section, EasternHimalaya. Journal of Structural Geology 29, 1781–1797.
Dodson, M.H., 1973. Closure temperature in cooling geochronological and petrologicalsystems. Contributions to Mineralogy and Petrology 40, 259–274.
Ferry, J.M., 1984. A biotite isograd in south-central Maine, U.S.A.: mineral reactions, fluidtransfer, and heat transfer. Journal of Petrology 25, 871–893.
Foster, G., Gibson, H.D., Parrish, R., Horstwood, M., Fraser, J., Tindle, A., 2002. Textural,chemical and isotopic insights into the nature and behaviour of metamorphicmonazite. Chemical Geology 191, 183–207.
Fuhrman, M.L., Lindsley, D.H., 1988. Ternary feldspar modeling and thermometry.American Journal of Science 73, 201–215.
Gehrels, G.E., DeCelles, P.G., Ojha, T.P., Upreti, B.N., 2006. Geologic and U–Pbgeochronologic evidence for early Paleozoic tectonism in the Dadeldhura thrustsheet, far-west Nepal Himalaya. Journal of Asian Earth Sciences 28, 385–408.
Gleeson, T.P., Godin, L., 2006. The Chako antiform: a folded segment of the GreaterHimalayan sequence, Nar Valley, Central Nepal Himalaya. Journal of Asian EarthSciences 27, 717–734.
Godin, L., 2003. Structural evolution of the Tethyan sedimentary sequence in the Anna-purna area, central Nepal Himalaya. Journal of Asian Earth Sciences 22, 307–328.
Godin, L., Brown, R.L., Hanmer, S., Parrish, R., 1999. Back folds in the core of theHimalayan orogen: an alternative interpretation. Geology 27, 151–154.
92 J. Chambers et al. / Tectonophysics 477 (2009) 77–92
Godin, L., Parrish, R.R., Brown, R.L., Hodges, K.V., 2001. Crustal thickening leadingto exhumation of the Himalayan Metamorphic core of central Nepal: insight fromU–Pb Geochronology and Ar-40/Ar-39 thermochronology. Tectonics 20, 729–747.
Godin, L., Grujic, D., Law, R.D., Searle, M.P., 2006. Channel flow, extrusion, and exhu-mation in continental collision zones: an introduction. In: Law, R.D., Searle, M.P.,Godin, L. (Eds.), Channel Flow, Ductile Extrusion and Exhumation in ContinentalCollision Zones. Geological Society, London, pp. 1–23. Special Publications.
Godin, L., Kellet, D., Larson, K.P., 2007. Orogenic superstructure behaviour and mid-crustal plastic flow in the central Nepal Himalaya. Fall Meeting Supplement,Abstract T31D-0672. Eos Transactions, AGU, 88(52).
Hames, W.E., Bowring, S.A., 1994. An empirical evaluation of the argon diffusion geo-metry in muscovite. Earth and Planetary Science Letters 124, 161–167.
Harris, N., 2007. Channel flow and the Himalayan–Tibetan orogen — a critical review.Journal of the Geological Society 164, 511–523.
Harris, N., Massey, J., 1994. Decompression and anatexis of Himalayan metapelites.Tectonics 13, 1537–1546.
Harris, N.B.W., Caddick, M., Kosler, J., Goswami, S., Vance, D., Tindle, A.G., 2004. Thepressure–temperature–time path of migmatites from the Sikkim Himalaya. Journalof Metamorphic Geology 22, 249–264.
Hayden, H.H., 1904. The geology of the Spiti with parts of the Bashur and Rupshu.Geological Survey of India 36, 121.
Hodges, K.V., 2000. Tectonics of the Himalaya and southern Tibet from two perspec-tives. Geological Society of America Bulletin 112, 324–350.
Holland, T.J.B., Powell, R., 1998. An internally consistent thermodynamic data set forphases of petrological interest. Journal of Metamorphic Geology 16, 309–343.
Holland, T.J.B., Baker, J.M., Powell, R., 1998. Mixing properties and activity-compositionrelationships of chlorites in the system MgO–FeO–Al2O3–SiO2–H2O. EuropeanJournal of Mineralogy 10, 395–406.
Horstwood, M.S.A., Foster, G.L., Parrish, R.R., Noble, S.R., Nowellg, G.M., 2003. Common-Pb corrected in situ U-Pb accessory mineral geochronology by LA-MC-ICP-MS.Journal of Analytical Atomic Spectrometry 18, 837–846.
Jamieson, R.A., Beaumont, C., Medvedev, S., Nguyen, M.H., 2004. Crustal channel flows: 2.Numerical models with implications for metamorphism in the Himalayan–Tibetanorogen. Journal of Geophysical Research-Solid Earth 109. doi:10.1029/2003JB002811.
Jamieson, R.A., Beaumont, C., Nguyen, M.H., Grujic, D., 2006. Provenance of the GreaterHimalayan Sequence and associated rocks: predictions of channel flow models. In:Law, R.D., Searle, M.P., Godin, L. (Eds.), Channel Flow, Ductile Extrusion and Exhu-mation in Continental Collision Zones. Geological Society, London, pp. 165–182.Special Publications.
Kohn, M.J., Malloy, M.A., 2004. Formation of monazite via prograde metamorphicreactions among common silicates: implications for age determinations. Geochi-mica et Cosmochimica Acta 68, 101–113.
Le Fort, P., 1975. Himalayas — collided range — present knowledge of continental Arc.American Journal of Science A275, 1–44.
Ludwig, K.R., 2003. Users manual for Isoplot/Ex version 3.0: a geochronological toolkitfor Microsoft Excel. Berkeley Geochronology Center Spec. Pub. No. 4, Berkeley,California. 70 pp.
Mahar, E.M., Baker, J.M., Powell, R., Holland, T.J.B., Howell, N., 1997. The effect of Mn onmineral stability in metapelites. Journal of Metamorphic Geology 15, 223–238.
Marquer, D., Chawla, H.S., Challandes, N., 2000. Pre-alpine high-grade metamorphismin High Himalaya crystalline sequences: evidence from Lower Palaeozoic KinnaurKailas granite and surrounding rocks in the Sutlej Valley (Himachal Pradesh, India).Eclogae Geologicae Helvetiae 93, 207–220.
Martin, A.J., Gehrels, G.E., DeCelles, P., 2007. The tectonic significance of (U, Th)/Pb agesof monazite inclusions in garnet from the Himalaya of central Nepal. ChemicalGeology 244, 1–24.
Metcalfe, R.P., 1990. A Thermotectonic Evolution for the Main Central Thrust and HigherHimalaya, Western Garhwal, India. University of Leicester.
Miller, C., Thöni, M., Frank, W., Grasemann, B., Klötzli, U., Guntli, P., Draganits, E., 2001.The early Palaeozoic magmatic event in the Northwest Himalaya, India: source,tectonic setting and age of emplacement. Geological Magazine 138, 237–251.
Parrish, R.R., 1990. U–Pb dating of monazite and its application to geological problems.Canadian Journal of Earth Sciences 27, 1431–1450.
Passchier, C.W., Trouw, R.A.J., 1996. Microtectonics. Springer, Berlin. 289 pp.Platt, J.P., 1986. Dynamics of orogenic wedges and the uplift of high-pressure meta-
morphic rocks. Geological Society of America Bulletin 97, 1037–1053.Powell, R. and Holland, T.J.B., 2001. Course Notes for “THERMOCALC Workshop 2001:
Calculating Metamorphic Phase Equilibria” (on CD-ROM).
Powell, R., Holland, T., Worley, B., 1998. Calculating phase diagrams involving solidsolutions via non-linear equations, with examples using THERMOCALC. Journal ofMetamorphic Geology 16, 577–588.
Prince, C.I., 1999. The Timing of Prograde Metamorphism in the Garhwal Himalaya,India. The Open University, Milton Keynes.
Pyle, J.M., Spear, F.S., 1999. Yttrium zoning in garnet: coupling of major and accessoryphases during metamorphic reactions. Geological Materials Research 1, 2–49.
Quigley, M., Liangjun, Y., Gregory, C., Corvino, A., Sandiford, M.,Wilson, C.J.L., Xiaohan, L.,2008. U–Pb SHRIMP zircon geochronology and T–t–d history of the Kampa Dome,southern Tibet. Tectonophysics 446, 97–113.
Ratschbacher, L., Frisch, W., Liu, G., Chen, C., 1994. Distributed deformation in southernand western Tibet during and after the Indian–Asia collision. Journal of GeophysicalResearch 99 (B10), 19917–19945.
Renne, P.R., Swisher, C.C., Deino, A.L., Karner, D.B., Owens, T.O., DePaolo, D.J., 1998.Intercalibration of standards, absolute ages and uncertainties in 40Ar/39Ar dating.Chemical Geology 145, 117–152.
Searle, M.P., Simpson, R.L., Law, R.D., Parrish, R.R., Waters, D.J., 2003. The structuralgeometry, metamorphic and magmatic evolution of the Everest massif, HighHimalaya of Nepal-South Tibet. Journal of the Geological Society 160, 345–366.
Sherlock, S.C., Kelley, S.P., 2002. Excess argon in HP-LT rocks: a UV laserprobe study ofphengite and K-free minerals. Chemical Geology 182, 619–636.
Simonetti, A., Heaman, L.M., Hartlaub, R.P., Creaser, R.A., MacHattie, T.G., Bohm, C., 2005.U–Pb zircon dating by laser ablation-MC-ICP-MS using a newmultiple ion countingFaraday collector array. Journal of Analytical Atomic Spectrometry 20, 677–686.
Spear, F.S., Parrish, R.R., 1996. Petrology and cooling rates of the Valhalla Complex,British Columbia, Canada. Journal of Petrology 37, 733–765.
Stacey, J.S., Kramers, J.D., 1975. Approximation of terrestrial lead isotope evolution by a2-stage model. Earth and Planetary Science Letters 26, 207–221.
Thakur, V.C., 1992. Geology ofWestern Himalaya. Physics and Chemistry of the Earth,19.Pergamon Press, Oxford. 366 pp.
Thiede, R.C., Arrowsmith, J.R., Bookhagen, B., McWilliams, M., Sobel, E.R., Strecker, M.R.,2006. Dome formation and extension in the Tethyan Himalaya, Leo Pargil,northwest India. Geological Society of America Bulletin 118, 635–650.
Vance, D., Harris, N., 1999. Timing of prograde metamorphism in the Zanskar Himalaya.Geology 27, 395–398.
Vance, D., Bickle, M., Ivy-Ochs, S., Kubik, P.W., 2003. Erosion and exhumation in theHimalaya from cosmogenic isotope inventories of river sediments. Earth andPlanetary Science Letters 206, 273–288.
Vannay, J.-C., Grasemann, B., 1998. Inverted metamorphism in the High Himalaya ofHimachal Pradesh (NW India): phase equilibria versus thermobarometry. Schwei-zerische Mineralogische Und Petrographische Mitteilungen 78, 107–132.
Vannay, J.-C., Hodges, K.V., 1996. Tectonomorphic evolution of the Himalayan meta-morphic core between the Annapurna and Dhaulagiri, central Nepal. Journal ofMetamorphic Geology 14, 635–656.
Vannay, J.-C., Grasemann, B., Rahn, M., Frank, W., Carter, A., Baudraz, V., Cosca, M., 2004.Miocene toHoloceneexhumationofmetamorphic crustalwedges in theNWHimalaya:Evidence for tectonic extrusion coupled to fluvial erosion. Tectonics 23 (TC1014).
Waters, D.J., Lovegrove, D.P., 2002. Assessing the extent of disequilibrium and over-stepping of prograde metamorphic reactions in metapelites from the Bushveldaureole. Journal of Metamorphic Geology 20, 135–149.
Watts, D.R., Harris, N.B.W., 2005. Mapping granite and gneiss in domes along the NorthHimalayan antiform with ASTER SWIR band ratios. Geological Society of AmericaBulletin 117, 879–886.
White, R.W., Powell, R., Holland, T.J.B., Worley, B.A., 2000. The effect of TiO2 and Fe2O3
on metapelitic assemblages at greenschist and amphibolite facies conditions:mineral equilibria calculations in the system K2O–FeO–MgO–Al2O3–SiO2–H2O–TiO2–Fe2O3. Journal of Metamorphic Geology 18, 497–511.
Wiesmayr, G., Grasemann, B., 2002. Eohimalayan fold and thrust belt: Implications forthe geodynamic evolution of the NW-Himalaya (India). Tectonics 21.
Wing, B.A., Ferry, J.M., Harrison, T.M., 2003. Prograde destruction and formation ofmonazite andallanite duringcontact and regionalmetamorphismofpelites: petrologyand geochronology. Contributions to Mineralogy and Petrology 145, 228–250.
Yin, A., 2006. Cenozoic tectonic evolution of the Himalayan orogen as constrained byalong-strike variation of structural geometry, exhumation history, and forelandsedimentation. Earth-Science Reviews 76, 1–131.
Zhang, H.F., Harris, N., Parrish, R., Kelley, S., Zhang, L., Rogers, N., Argles, T., King, J., 2004.Causes and consequences of protracted melting of the mid-crust exposed in theNorth Himalayan antiform. Earth and Planetary Science Letters 228, 195–212.