Embed Size (px)
Citation preview
11
Chapter Three
EMPIRICAL DETERMINATION OF THE GROWTH–MILITARY EXPENDITURES RELATIONSHIP
We begin our empirical analysis with a simple comparison of trendsfor each of the “great power” countries from approximately 1870 to1939. Simple graphs show how such historical events as the Russo-Japanese War or the Versailles Treaty influenced movements in mili-tary expenditures and economic output. They also provide an initialtest of the universality of the military expenditures–growth relation-ship without being subject to the data requirements of a more formalstatistical analysis.
To control for some of the other factors that may influence domesticresource allocation toward the military, however, statistical analysisis a useful tool. In particular, a system of regressions explicitly allowsfor the possibility that increases in one country’s military expendi-tures, or in the size of its armed forces, might influence anothercountry’s decision on how much to spend. We stress, however, thatour analysis here asks simply whether the relationships illustrated inthe graphs appear robust when other variables are factored in. Ourfocus is on the sign rather than the magnitude of particular para-meters because data limitations—including significant numbers ofmissing observations—preclude more precise estimation.
DATA DESCRIPTION
Our data consist of annual measures of national output, military ex-penditures, military personnel, and government expenditures foreach country, plus price deflators and currency exchange rates formaking cross-national comparisons. Measures of real output growthare calculated by taking the log difference of real output. An index
12 Military Expenditures and Economic Growth
measuring the general openness of political institutions is also em-ployed. The sample period is 1870 to 1939. A primary reason for ourchoice of a particular data source was because of the availability ofan extended and reasonably representative time series. Nevertheless,for some countries and some variables data are incomplete, asdescribed in Tables 3.1 through 3.5 below.
National Output Measures
For France, we considered two alternative inflation-adjusted (real)output measures: a real Gross Domestic Product (GDP) series basedon average prices in France over the period 1905–1913 (in francs),and a nominal GDP series converted to 1982 U.S. dollars using ex-change rates from Mitchell (1988) and a U.S. implicit price deflatorfrom Romer (1989). A U.S., rather than French, price deflator wasused to construct the second real output series to allow for consistentcomparisons with data for which appropriate national deflators arenot available.1 No French output or price data are available for theperiod 1914–1919. For reasons of cross-national comparability, thesecond measure is used and described here.
For Germany, again two alternative inflation-adjusted output mea-sures are considered: a real Net National Product (NNP) series re-flecting average prices in German marks in 1913, and a nominal GDPseries converted to 1982 dollars using exchange rates and an implicitprice deflator obtained from the sources described above. No Ger-man output or price data are available for the period 1914–1924.Again, the second measure is used for the reasons given above.
For Japan, one output measure we considered was real Gross Na-tional Product (GNP), a series constructed by Ohkawa, Takamatsu,and Yamamoto (JSA, 1987) and measured in 1936–1938 yen. A sec-ond measure was Productive National Income (PNI), a series con-structed by Yamada (JSA, 1987) on the basis of historical estimates ofnational productive capacity. This last, longer, series is used hereand converted to dollars using exchange rates from JSA (1987, Vol. 3).
______________ 1Although the use of a domestic deflator would have been preferable, large gaps in thedomestic data precluded this option.

Empirical Determination of the Growth–Military Expenditures Relationship 13
It is adjusted to reflect 1982 prices with the deflator provided inRomer (1989).
No broad measure of national economic output is available for Rus-sia during the time period of interest. Accordingly, to explore howRussian military spending responded to increases in the size of Rus-sia’s economy we considered two proxies: Russian domestic pro-duction of iron and steel, measured in tons, and Russian energy con-sumption, measured in coal-ton equivalents. Table 3.1 shows thesimple correlations between real output and the energy and iron andsteel variables for the other four nations. All the correlations arehighly positive; this suggests that both energy consumption and ironand steel production are good instruments with which to substitutefor the unavailable Russian real output data. The simple correlationbetween the two instruments is also high at 0.985; to keep thingssimple, therefore, we report here only the regression results for ironand steel.
Finally, for the United States, real output in 1982 dollars is takenfrom Romer (1989). A summary of information on the national out-put measures for all five countries in our sample is presented inTable 3.2.
Table 3.1
Output Correlations with Coal Consumption andIron/Steel Production
GDP
U.S. France Germany Japan
Energy 0.99Iron and steel 0.94
Energy 0.70Iron and steel 0.56
Energy 0.86Iron and steel 0.90
Energy 0.88Iron and steel 0.69

14 Military Expenditures and Economic Growth
Table 3.2
National Output Measures: Five Great Powers, 1870–1939
Country Measure UnitsData
Availability Sourcea
France Real GDP (1) 1905–1913 francs,millions
1870–1913,1920–1938
Mitchell (1992, J1)
Real GDP (2) 1982 dollars,millions
1870–1913,1920–1938
Mitchell (1992, J1);Mitchell (1988);Romer (1989)
Germany Real NNP 1913 marks,millions
1870–1913,1925–1938
Mitchell (1992), J1)
Real GDP 1982 dollars,millions
1873–1913,1925–1939
Mitchell (1992, J1);Mitchell (1988);Romer (1989)
Japan Real GNP 1936–1938 yen,millions
1885–1939 JSA (1987)
Real PNI 1982 dollars,millions
1875–1939 JSA (1987);Romer (1989)
Russia Iron and steelproduction
Thousand tons 1870–1939 Singer and Small(1993)
Energyconsumption
Thousand coal-ton equivalents
1870–1939 Singer and Small(1993)
UnitedStates
Real GNP 1982 dollars,millions
1870–1939 Romer (1989)
aTable number follows publication year where relevant.
Military Expenditure Measures
As pointed out by Herrmann (1996, Appendix B), official statisticalpublications often understate the true magnitude of military spend-ing because governments routinely try to conceal important ele-ments of their military expenditures. Different official and scholarlypublications therefore report varying military spending estimatesdepending on their criteria for inclusion and the purpose for whichthe data are to be used. Although we choose our series to be asclosely comparable as possible in their treatment of various cate-gories of military expenditures, significant differences may exist. Anexhaustive comparison of the data collection methodologies forthese series was beyond the scope of this study.

Empirical Determination of the Growth–Military Expenditures Relationship 15
We obtained data on military expenditures for France, Germany, andRussia from Singer and Small (1993). As this source expresses datafor 1870–1913 in British pounds and data for 1914–1939 in dollars,each series was converted to dollars using exchange rates fromMitchell (1988). Data for Japan were obtained from JSA (1987) andconverted to dollars using exchange rates obtained from the samesource. Data for the United States were obtained from Census(1975). For all countries, inflation-adjusted measures were calcu-lated using the deflator in Romer (1989). The data and other sourcesare summarized in Table 3.3.
Table 3.3
Real Military Expenditures: Five Great Powers, 1870–1939
Country UnitsData
Availability Source
France 1982 dollars, millions 1870–1939 Singer and Small (1994);Mitchell (1988); Romer (1989)
Germany 1982 dollars, millions 1870–1939 Singer and Small (1993);Mitchell (1988); Romer (1989)
Japan 1982 dollars, millions 1870–1939 Singer and Small (1993);Mitchell (1988); Romer (1989)
Russia 1982 dollars, millions 1870–1939 Singer and Small (1993);Mitchell (1988); Romer (1989)
UnitedStates
1982 dollars, millions 1870–1939 Singer and Small (1993);Romer (1989)
Military Personnel Measures
Data on military personnel serve not only to confirm or contest pat-terns suggested by data on military expenditures, but also provideone reasonable proxy for the military threat to each of our five great-power countries.2 For France prior to 1918, we calculate a “threat”variable consisting of the sum of German and Austro-Hungarianmilitary personnel; after 1918 it is just German military personnel.
______________ 2A second proxy is military spending in friendly as well as rival states; the two differentapproaches are discussed more fully in the estimation section below.

16 Military Expenditures and Economic Growth
For Germany, the threat is the sum of Russian, French, and Englishmilitary personnel; for Japan, it is the sum of Russian and U.S.military personnel; for Russia, it is the sum of Japanese, German,and, prior to 1918, Austro-Hungarian military personnel; and for theUnited States, it is Japanese and German military personnel.
However, as discussed at length in Herrmann (1996, Appendix A), thevarious statistical publications of the great-power governments usedquite divergent criteria for computing the number of officers andmen under arms. Thus, only a very general sense of the relativestrength of each country’s military can be obtained from these data.3
As shown in a limited way in the figures below, the data we use areon the whole consistent with other published sources.
For France, Germany, and the United States, the military personneldata count active-duty army and navy personnel only. For Japan,data from 1899 on include civilian employees of the Japanese Armyas well as active-duty army and navy officers and men. For Russia,only one data source is available and the breakdown is not clear: In1916–1917, for example, the number presented may include civiliansconnected to the war effort. Coverage details are given in Table 3.4.
Government Expenditure Measures
Two plausible alternative measures of a nation’s fear of—or desirefor—war are, first, military spending as a proportion of national out-put and, second, military spending as a proportion of governmentexpenditures. Generally speaking, the larger the role played by thegovernment in the economy, the closer the two measures will be. Itcan be argued that military spending as a share of governmentexpenditures is most useful as a measure of warlike intent, whilemilitary spending as a proportion of national output is most useful asa measure of military capability.
The measure of government expenditures available to us is centralgovernment expenditures (CGE), which does not include local- andstate-level resource allocations. While this works well for countries
______________ 3The figures for 1914–1918 are particularly unreliable as several governments ceasedpublishing comparative statistics when the war broke out.

Empirical Determination of the Growth–Military Expenditures Relationship 17
Table 3.4
Military Personnel: Five Great Powers, 1870–1939
Country UnitsData
Availability Sourcea
Austria-Hungary
Thousands of active-duty personnel
1870–1913,1919–1938
Flora (1987, Ch. 6)
France Thousands of active-duty personnel
1870–1913,1919–1938
Flora (1987, Ch. 6)
Germany Thousands of active-duty personnel
1870–1913,1919–1938
Flora (1987, Ch. 6)
Japan Thousands ofpersonnel
1876–1935;1937–1939
JSA (1987, 26-3-a)
Russia Thousands ofpersonnel
1870–1939 Singer and Small (1993)
UnitedStates
Thousands of active-duty personnel
1870–1939 Census (1975, Y 904–916)
aTable number follows publication year where relevant.
such as France, where the administration is highly centralized, it ismore problematic for countries such as Germany or the UnitedStates that have federal political structures. And because of differ-ences in definition, the series are not comparable across countries:For example, the German data include expenditures on social insur-ance institutions, while the U.S. data include interest payments onthe public debt. There are also many missing observations. For thepurposes of this analysis, therefore, we track military expenditures-to-CGE only as a measure of changes in military posture within asingle country over time. Table 3.5 gives coverage details.
Political Participation Measure
Finally, according to some political theorists, the more accessible acountry’s political institutions are, the less likely it is to pursueaggressive foreign policies. We use an index of political participationconstructed by Gurr, Jaggers, and Moore (GJM) (1990) as one of the

18 Military Expenditures and Economic Growth
Table 3.5
Central Government Expenditures: Five Great Powers, 1870–1939
Country Measure UnitsData
Availability Sourcea
France CGE New franc,millions
1870–1939 Mitchell (1992)
Germany CGE Mark, millions 1872–1921;1924–1934
Mitchell (1992)
Japan CGE Yen, millions 1870–1939 JSA (1987)
Russia CGE Paper rubles,millions
1870–1914;1924–1934;1938
Mitchell (1992)
UnitedStates
Central govern-ment outlaysb
Dollar,thousands
1870–1939 Census(1975, Y 904–916)
aTable number follows publication year where relevant.bAt the aggregate central government level, outlays and actual expenditures areapproximately equal.
explanatory variables in our statistical analysis. In the GJM system, a10 indicates that national political institution are very open(democracy), a 0 indicates that they are closed (autocracy). Averageindex values for each country using the GJM system are presented inTable 3.6.
Table 3.6
Political Participation Indexes: 1870–1939 Averages
Country1870–1880
1881–1890
1891–1900
1901–1913
1914–1919
1920–1932
1933–1939
France 5.7 7.0 7.3 8.0 8.0 9.2 10.0
Germany 0.7 1.3 4.0 4.5 5.2 6.0 0.0
Japan 5.0 5.0 5.0 5.0 5.0 5.0 5.0
Russia 0.0 0.0 0.0 1.0 1.7 0.2 0.0
United States 9.9 10.0 10.0 10.0 10.0 10.0 10.0
SOURCE: Gurr, Jaggers, and Moore (1990).

Empirical Determination of the Growth–Military Expenditures Relationship 19
TRENDS IN ECONOMIC OUTPUT AND MILITARYEXPENDITURES FOR FIVE GREAT POWERS
Cross-National Trends
Figures 3.1, 3.2, and 3.3 illustrate the trends in real national output,real military expenditures, and the shares of military expenditures innational output for the five countries in our data sample. (Russia isomitted in Figures 3.1 and 3.3 and in our discussions of those figuresbecause historical data on Russian national output is unavailable.)To make cross-national comparisons, we use real output and mili-tary expenditures series that have been converted to 1982 dollars, asdescribed above.
In 1873, the U.S. economy was more than half again as large as thatof its nearest economic rival, Germany, and more than 16 times thesize of the smallest economy in the sample, Japan (Figure 3.1). By1939, strong German and Japanese output growth together with theU.S. Great Depression had shrunk the differentials, but only slightly:The United States was twice as large as Germany and more than 13times as large as Japan. The French economy, which was approxi-
U.S
. 198
2 $
billi
ons
700
1930192019101900
Year
189018801870 19400
100
600
500
400
300
200
RANDMR1112-3.1
United StatesGermanyFranceJapan
Figure 3.1—Real Output 1870–1939, Four Powers

20 Military Expenditures and Economic Growth
U.S
. 198
2 $
billi
ons
90
1930192019101900
Year
189018801870 19400
10
80
70
60
50
40
30
20
RANDMR1112-3.2
GermanyRussiaJapanUnited StatesFrance
Figure 3.2—Real Military Expenditures 1870–1939, Five Powers
Per
cent
35
1930192019101900
Year
189018801870 19400
5
25
30
20
15
10
RANDMR1112-3.3
JapanGermanyFranceUnited States
Figure 3.3—Military Expenditures as a Share of Output 1870–1939,Four Powers

Empirical Determination of the Growth–Military Expenditures Relationship 21
mately the same size as Germany’s at the beginning of the period,was just one-third as large by 1939.
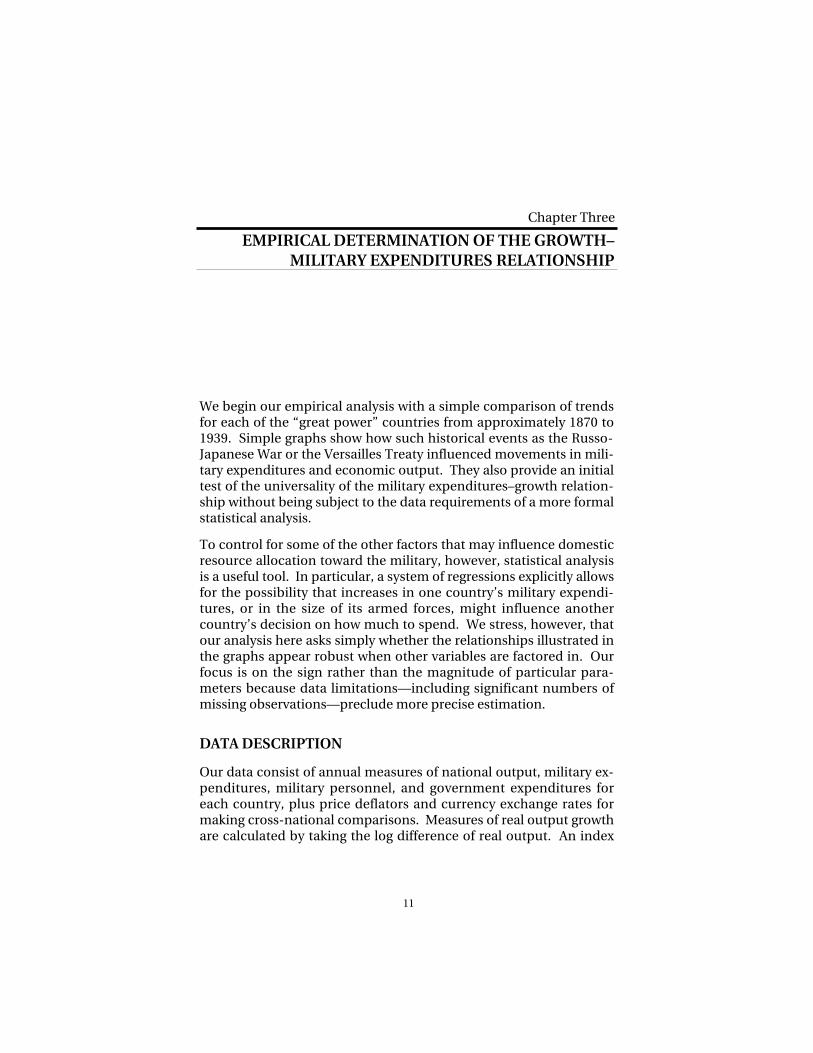
As Figure 3.2 illustrates, French, Russian, and U.S. real military ex-penditures peaked during World War I, while German and Japanesemilitary expenditures reached their height during the buildup toWorld War II. By 1939, Germany was spending more than twice asmuch on defense as the next biggest spender, Russia, while Japanhad overtaken both France and the United States for third place.
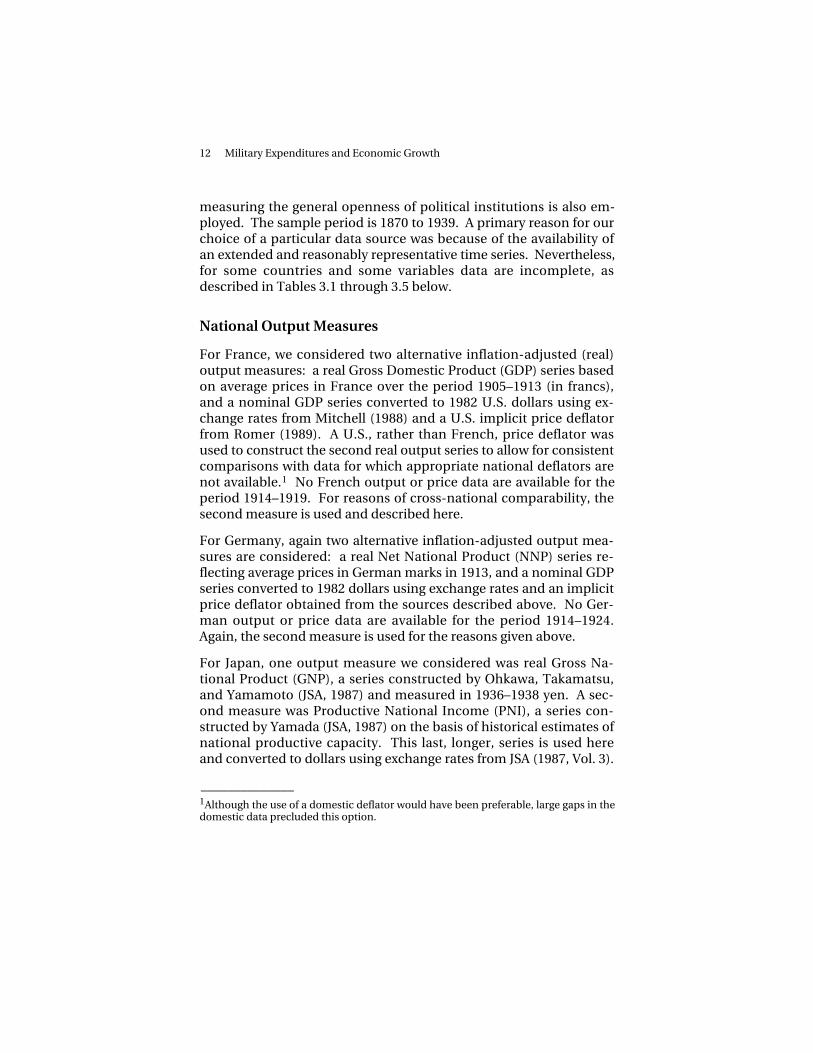
As shown in Figure 3.3, on average, the French and Japanese devotedconsiderably more of their national output to a strong nationaldefense than either Germany or the United States.4 For example,during the Russo-Japanese War of 1904–1905, almost 25 percent ofJapanese output was invested in the military. In 1938, Japanese mili-tary expenditures as a share of output topped 25 percent. In theUnited States, by way of contrast, less than 15 percent of output wasdevoted to defense even at the height of U.S. involvement in WorldWar I. And by 1929, U.S. military expenditures had fallen back to just1.5 percent of output.
Individual Country Trends
France. Figure 3.4 allows us to compare trends in real economicoutput and real military expenditures during the 1870–1939 period.Both series are denominated in 1982 dollars, with output measuredon the left-hand scale and military expenditures on the right-handscale. As shown in the figure, French military spending was growingduring the period between the Franco-Prussian War and World WarI, but from a relatively low base: Expenditures rose from $1.3 billionin 1872 to $3.7 billion in 1913. Output, on the other hand, rosestrongly over the same period: from $54.2 to $104.8 billion. No par-ticular trend in either series is discernible in the chaotic economicconditions of the 1920s, but French military spending began to climbsignificantly faster than the economy with the rise of Hitler in 1932.
______________ 4For France and Germany, these estimates exclude World War I and the years imme-diately following.

22 Military Expenditures and Economic Growth
U.S
. 198
2 $
billi
ons
120
1930192019101900
Year
189018801870 194040
60
100
Real output
Real militaryexpenditures
Mili
tary
exp
endi
ture
s
80
60
50
40
30
20
10
0
RANDMR1112-3.4
Figure 3.4—French Real Output Versus Real Military Expenditures
U.S
. 198
2 $
billi
ons
120
1930192019101900
Year
189018801870 194040
60
100Output
Militaryexpenditures
ratio
Per
cent
80
9
8
4
3
2
1
0
7
6
5
RANDMR1112-3.5
Figure 3.5—French Real Output VersusMilitary Expenditures-to-Output Ratio

Empirical Determination of the Growth–Military Expenditures Relationship 23
This postwar pattern is seen more clearly in Figure 3.5, where outputis again measured on the left axis, but with military expenditures as apercent of output now on the right axis. As a share of output, militaryspending rose from 3 percent in 1920–1921 to almost 8 percent in1938. Excepting World War I itself, the share of national outputdevoted to the military averaged 3.3 percent.
As shown in Figure 3.6, between 1870 and 1913 the share of FrenchCGE devoted to the military also remained fairly constant, averagingapproximately 27 percent. Military expenditure shares plummetedat the end of World War I, however, not reaching their prewar per-centages again until 1938.
As shown in Figure 3.7, in nonwar years French force levels remainedrelatively constant, averaging 500,000 men. This was despite largeincreases in German military personnel before each of the two worldwars. Data from Herrmann (1996), designated by white circles, trackthe Singer and Small (1993) data very closely. One year in which theestimates do differ slightly is 1913, where Herrmann puts Frencharmy strength at more than 700,000 men as a result of a 1913 law that
Per
cent
120
1930192019101900
Year
1890
1918
18801870 19400
20
80
100
60
40
RANDMR1112-3.6
Figure 3.6—French Military Expenditures as a Share ofCentral Government Expenditure

24 Military Expenditures and Economic Growth
Tho
usan
ds2,500
1930192019101900
Year
189018801870 19400
500
2,000
1,500
1,000
RANDMR1112-3.7
1920
1919
Figure 3.7—French Active-Duty Military Personnel
returned France to a three-year military service standard.5 This lawwas passed just two weeks after a German law had raised Germantroop strength dramatically.
Germany. As indicated by Figure 3.8, German real output rosestrongly and steadily between unification in 1872 and the beginningof World War I, rising from $55.8 to $150.2 billion in 1982 U.S. prices.(As before, output is measured on the left-hand axis while militaryspending is measured on the right.) In fact, World War I and theyears of the Weimar Republic can be seen as a brief interruption inan overall strongly upward economic trend.
German real military expenditures prior to World War I grew fasterthan output but, as in France, did so from a relatively low base:German military spending rose from just $0.8 billion in 1872 to $4.8billion in 1913. From 1919 to approximately 1931, when Germanmilitary policy was governed by the Treaty of Versailles, Germanmilitary spending was effectively isolated from movements in theeconomy. But this pattern changed dramatically after 1933, when
______________ 5The figure reported by Singer and Small for 1913 is 632,000 men.

Empirical Determination of the Growth–Military Expenditures Relationship 25
U.S
. 198
2 $
billi
ons
320
1930192019101900
Year
189018801870 194050
80
290
Real output
Real militaryexpenditures
Mili
tary
exp
endi
ture
s
260
230
200
170
140
110
90
80
40
30
20
10
0
70
60
50
RANDMR1112-3.8
Figure 3.8—German Real Output Versus Real Military Expenditures
both output and military expenditures surged under Adolf Hitler’sNational Socialist Party.
Figure 3.9 presents a comparison of German real output (left axis)and military expenditures as a share of output (right axis). Duringmost of the sample period, Germany devoted fewer resources todefense as a percentage of output than did France: Except for themassive buildup just prior to World War II, the German military’sshare of output hovered between 2 and 3 percent as opposed to theFrench military’s 3 to 4 percent. But because Germany’s economygrew faster than France’s, by the turn of the century the Germanshad begun to spend more on defense in absolute terms than France.German military expenditures temporarily fell below those of Franceas a result of the Weimar Republic’s adherence to the VersaillesTreaty, but with Hitler’s abandonment of the treaty Germany soonregained the lead.
As shown in Figure 3.10, the share of German central governmentexpenditures devoted to defense ranged between 35 and 80 percentin the 1875–1913 period, reaching a high of 77 percent in 1888, theyear that Wilhelm II ascended the throne. The average German mili-tary expenditures-to-CGE ratio over the period is considerably higher

26 Military Expenditures and Economic Growth
U.S
. 198
2 $
billi
ons
350
1930192019101900
Year
189018801870 19400
50
Real output
Militaryexpenditures ratio
Per
cent
300
250
200
150
100
20
18
8
6
4
2
0
16
14
12
10
RANDMR1112-3.9
Figure 3.9—German Real Output VersusMilitary Expenditures-to-Output Ratio
Per
cent
90
1930192019101900
Year
1890
1888
1913 1921
1933
18801870 19400
10
40
80
70
60
50
30
20
RANDMR1112-3.10
Figure 3.10—German Military Expenditures as a Share ofCentral Government Expenditure

Empirical Determination of the Growth–Military Expenditures Relationship 27
than that for France, but this is probably misleading. Unlike France,nonmilitary expenditures by German state-level government arelarge, so that data for the central government tend to overestimateoverall government emphasis on defense.
Germany’s military personnel strength shows much the same patternas military expenditures, as shown in Figure 3.11. At unification, thepeacetime army was set by the German constitution to 1 percent ofthe population, and it often did not reach that limit (Herrmann,1996). In 1912, a changing balance of power on the European conti-nent convinced Germany’s leaders that an increase was necessary.Under the army law of 1913, the number of active-duty German armypersonnel further increased by about a fifth, from approximately650,000 to 780,000 officers and men. (This pattern is shown clearly inthe Herrmann data, again designated by white circles, which exhibita clear jump in 1912 and again in 1913.)
After Germany’s defeat at the end of the World War I, the VersaillesTreaty constrained the size of the German military to 100,000. Withthe rise of Hitler in 1933, however, it experienced a rapid ramp-up,reaching prewar levels by 1938.
Tho
usan
ds
1,000
1930192019101900
Year
Versailleslimitations
189018801870 19400
100
900
800
700
600
500
400
300
200
RANDMR1112-3.11
1870
1938
1934
19131871
Figure 3.11—German Active-Duty Military Personnel

28 Military Expenditures and Economic Growth
Japan. As shown in Figure 3.12 (left axis), Japanese real output rosesteadily through the end of World War I, climbing from less than $6billion in 1875 to almost $42 billion in 1919, as measured in 1982 dol-lars. After a sharp contraction in the early 1930s when Japan sharedin the worldwide recession, real output boomed again in the yearsbefore World War II, almost doubling in the six years between 1933and 1939. Excluding war years, Japanese military spending (rightaxis) also grew steadily until 1936, but it rose even more dramaticallythan output with the invasion of the Chinese mainland in 1937.
Figure 3.13 presents a similar pattern. Japanese output devoted todefense, measured on the right axis, rose from an average of 2 per-cent between 1875 and 1893 to an average of 5 percent from 1894 to1936 (excluding the period of the Russo-Japanese War). During theboom years of the 1920s the military expenditures-to-output ratio fellslightly, but it began rising again in 1930 and jumped dramatically in1937 with the invasion of China.
U.S
. 198
2 $
billi
ons
60
1930192019101900
Year
189018801870 19400
10
Real output
Real militaryexpenditures
Mili
tary
exp
endi
ture
s
50
40
30
20
14
8
6
4
2
0
12
10
RANDMR1112-3.12
Figure 3.12—Japanese Real Output Versus Real Military Expenditures,1870–1938

Empirical Determination of the Growth–Military Expenditures Relationship 29
To an even greater extent than the other countries in our sample, theshare of Japanese government spending devoted to the military isdominated by periods of war. As shown in Figure 3.14, military ex-penditures absorbed more than 100 percent of the official govern-ment budget during wartime. This was possible because of thecreation of extrabudgetary accounts for financing the war that al-lowed the government to spend more than was allocated in thecentral government budget.
As shown in Figure 3.15, there were mass mobilizations of Japanesemilitary personnel during the Russo-Japanese war of 1904–1905 andagain prior to World War II in 1937–1939. Japan played only a verysmall role in World War I. In nonwar years, the trend in Japanesemilitary personnel rose slowly but consistently, from 240,000 in 1906to 330,000 by 1935.
U.S
. 198
2 $
billi
ons
60
1930192019101900
Year
189018801870 19400
10
Real output
Militaryexpenditures
ratioP
erce
nt
50
40
30
20
35
20
15
10
5
0
30
25
RANDMR1112-3.13
Figure 3.13—Japanese Real Output VersusMilitary Expenditures-to-Output Ratio

30 Military Expenditures and Economic Growth
Per
cent
180
1930192019101900
Year
1890
1894
1904
1905
1937
18801870 19400
20
80
160
140
120
100
60
40
RANDMR1112-3.14
Figure 3.14—Japanese Military Expenditures as a Share ofGovernment Expenditure
Tho
usan
ds
1,600
1930192019101900
Year
189018801870 19400
200
1,400
1,200
1,000
800
600
400
RANDMR1112-3.15
1904
1906
1884–1886
1905
1939
1939
1938
1937
Figure 3.15—Japanese Military Personnel

Empirical Determination of the Growth–Military Expenditures Relationship 31
Russia. As discussed above, no data on Russian GNP or a similarbroad measure of national economic output are available for thetime period of interest. Accordingly, Figure 3.16 portrays the rela-tionship between Russian iron and steel production (left axis) andreal military expenditures (right axis).6 The trend is strongly positive,but exhibits a significant interruption in the years surrounding WorldWar I and the Russian Revolution of 1917.
The relationship appears to be positive, driven by large increases inboth series beginning in the mid-1920s. For the full 1870–1939 sam-ple period, the correlation between the two series is 0.72.7 It is evenhigher following World War I, at 0.86 for the period 1920–1939.
Mill
ions
of t
ons
20
1930192019101900
Year
189018801870 19400
2
Ironand
steel
Realmilitary
expenditures
U.S
. 198
2 $
billi
ons
18
16
14
12
10
8
6
4
60
40
30
20
10
0
50
RANDMR1112-3.16
Figure 3.16—Russian Iron and Steel Production and Real MilitaryExpenditures, 1870–1939
______________ 6The high correlation between GDP and iron and steel production for most countriesmakes this a reasonable proxy; see Table 3.1 above.7For our other proxy for national output, energy consumption, the 1870–1939 correla-tion with military expenditures is somewhat higher at 0.75.

32 Military Expenditures and Economic Growth
Tho
usan
ds12,000
1930192019101900
Year
189018801870 19400
2,000
10,000
8,000
6,000
4,000
RANDMR1112-3.17
1905
1923
19211915
1917
1916
Figure 3.17—Russian Military Personnel
Figure 3.17 shows a steadily rising trend in peacetime Russian mili-tary personnel from approximately 700,000 in 1870 to over 1.3 mil-lion in 1914. Singer and Small (1993) differ from Herrmann (1996) intheir estimate of the size of the 1904 mobilization, but their estimatesfor the years 1906–1913 match closely. In any case, the prewar trendis dwarfed by the massive mobilizations of 1916 and 1917. Unfortu-nately for purposes of comparison, we were not able to obtain longertime series estimates from other sources for these years.
United States. The U.S. economy grew strongly over the full sampleperiod, with the prominent exception of the Great Depression in theearly 1930s (left axis, Figure 3.18).8 Measured in 1982 dollars, the U.S.economy grew from roughly $75 billion in 1870 to almost $425 billionin 1913, implying a simple annual growth rate of over 8 percent formore than 40 years. But in contrast to most of the other countries inthe sample, increases in U.S. military expenditures were dwarfed byU.S. output growth. As measured on the right axis, during the period
______________ 8Brief recessions in 1909 and again in the early 1920s show as mere blips on the strongupward trend.

Empirical Determination of the Growth–Military Expenditures Relationship 33
when the other major powers were ramping up their militaryspending in preparation for World War II, U.S. military expendituresremained resolutely below $10 billion.9
The pattern for military expenditures as a share of output closelytracks the pattern in levels, averaging less than one percent in allnonwartime years (Figure 3.19, right axis). Again this contrastssharply with the other nations in our sample, where nonwartimemilitary expenditures averaged between 2.5 and 4 percent of output.
Figure 3.20 illustrates the U.S. military expenditures-to-CGE ratio.Although the share of U.S. government resources devoted to defenseratcheted up following the Spanish American war, the end of WorldWar I saw a dramatic dropoff in U.S. government support for the mil-itary. In 1934, just twenty years after the onset of World War I, themilitary expenditures-to-CGE ratio was lower than it had been in1870.
U.S
. 198
2 $
billi
ons
800
1930192019101900
Year
189018801870 19400
100
Real output
Real militaryexpenditures
Mili
tary
exp
endi
ture
s
700
600
500
400
300
200
80
40
30
20
10
0
60
70
50
RANDMR1112-3.18
Figure 3.18—U.S. Real Output Versus Real Military Expenditures,1870–1939
______________ 9U.S. military expenditure figures do not include U.S. government purchases ofequipment for the British Lend-Lease program.

34 Military Expenditures and Economic Growth
U.S
. 198
2 $
billi
ons
800
1930192019101900
Year
189018801870 19400
100
Real output
Militaryexpenditures
ratio
Per
cent
700
600
500
400
300
200
16
8
6
4
2
0
12
14
10
RANDMR1112-3.19
Figure 3.19—U.S. Real Output Versus MilitaryExpenditures-to-Output Ratio
Per
cent
70
1930192019101900
Year
1890
1899
1919
1918
1934
18801870 19400
10
40
60
50
30
20
RANDMR1112-3.20
Figure 3.20—U.S. Military Expenditures as a Share ofGovernment Expenditures

Empirical Determination of the Growth–Military Expenditures Relationship 35
Similarly, as shown in Figure 3.21, increases in U.S. active-duty mili-tary personnel remained well behind increases in the overall popu-lation. Except for the years immediately surrounding World War I(1917–1919), the U.S. armed services rarely rose above 300,000.Significant expansions in military personnel during World War I, forexample, were offset by a large postwar demobilization that broughtthe number of U.S. military personnel back to almost prewar levelsby 1922. These numbers did not rise significantly again until thebombing of Pearl Harbor pushed the United States into World War II.
Tho
usan
ds
3,500
1930192019101900
Year
189018801870 19400
500
3,000
2,500
2,000
1,500
1,000
RANDMR1112-3.21
1919
1917
1898
1918
Figure 3.21—U.S. Active-Duty Military Personnel
STATISTICAL ANALYSIS OF MILITARY SPENDING ANDECONOMIC OUTPUT
The graphical analysis above indicates that as their economies grewduring the nonwar years before World War I, the five great powers inour sample did generally attempt to match—and only occasionally tooutmatch—that growth by increasing their military expenditures.Before World War I, French, German, and U.S. military expendituresgenerally remained within 1 percent bands centering respectively on

36 Military Expenditures and Economic Growth
1 percent of output (United States), 3 percent of output (Germany),and 3.5 percent of output (France). Japanese military expendituresas a percentage of output fluctuated considerably more. During theinterwar period, however, the share of German, French, andJapanese output devoted to the military trended sharply upward,while in the United States military spending appeared to stagnate atunder 2 percent.
What graphical analysis cannot tell us is whether such patternsshould be cause for concern. For example, one rather benign inter-pretation of a positive relationship between economic growth andmilitary expenditures is that as nations become wealthier, they be-lieve they have more to protect. According to this interpretation,growth-led increases in military expenditures are defensive. A lessbenign interpretation is that greater wealth allows nations to pursueaggressive foreign policy objectives considered unobtainable before.If these foreign policy objectives include, for example, territorial ex-pansion at the expense of neighbors, rapid economic growth shouldbe viewed with more concern by the international community ofnations.
In the analysis that follows, we attempt to control for some of the fac-tors other than expansions and contractions in the economy thatmay have influenced the allocation of national resources toward themilitary in our five sample countries. In addition to changes in realoutput, we allow for the possibility that changes in the growth rate ofoutput might also influence military spending decisions. The twovariables we condition on are measures of perceived threats fromabroad and the openness of the domestic political system. Twoalternative models are presented.10
Model 1
In our first model, we examine how the respective dependent vari-ables for each nation are affected by changes in four explanatoryvariables: the level of real national output, the growth rate of realnational output, a “threat” variable measured as the active-duty mili-
______________ 10Regressions on natural log transformations of the military expenditure, output, andthreat variables produced results similar to those presented here.

Empirical Determination of the Growth–Military Expenditures Relationship 37
tary personnel of the given nation’s major political rivals, and anindex of political participation that rates the access of nonelites topolitical institutions. Defense policymakers are assumed able torespond only with a lag to changes in real output, accelerations inreal output growth, and foreign military threats. Lagged values of thedependent variable are also included in each equation in the beliefthat adjustments to military expenditures are conditioned by thelevel (or share) of existing allocations.11 The null hypothesis is thatchanges in real economic output and real economic growth do notaffect military spending decisions.
The equation we estimate for each nation in Model 1 is
m c m B Output B Growth B Threat B
Democ B u
t t M t j Oj t j Gj t j Tjj
t D t
= + ∗ + ∗ + ∗ + ∗( )+ ∗ +
− − − −∑1
,
where mt represents real military expenditures or expenditure sharesrespectively for France, Germany, Japan, Russia, and the UnitedStates.12 The variables c (constant terms), Output (national realoutput measures), Growth (national real output growth measures),Threat (threat variables), and Democ (democracy indexes) all takethe same form. The subscripts t and j are time indexes; for the pur-poses of our estimation, j is set to 1.
We assume that the disturbance term, u, is correlated across timeperiods.13 The assumption of time dependence is based on the belief
______________ 11We also estimated ordinary least squares regressions for each country with up to 5lags of output and 5 lags of output growth and no lagged dependent variable. Testsindicated the presence of higher serial correlation—often an indicator of an omittedvariable—for every country except Germany. In no case could we reject the hypothe-sis that the net influence of lagged output and output growth on military expenditureswas zero.12The system with military expenditures as a share of output does not include Russia,since Russian national output data are unavailable.13That is, both Cov(uit, uit–1) and Cov(uit, ukt) are nonzero for countries i and k. Thisimplies that the structure of the time dependence is first-order autoregressive (AR(1))and that disturbances are contemporaneously correlated across countries. Thedisturbances are assumed to be stationary, although (unsurprisingly) we cannotformally reject the presence of a unit root in output using augmented Dickey-Fullertests. Cointegration tests do not suggest that military expenditures and economicoutput are cointegrated.

38 Military Expenditures and Economic Growth
that events leading to unplanned military expenditures in one yearcontinue to influence spending decisions the following year.
Because of the correlation between the disturbance term and thelagged dependent variable, mt–1, an ordinary least squares estimationof the system outlined above would result in inconsistent as well asinefficient estimates of the coefficient parameters. We thereforeemploy an iterative two-step least squares procedure using furtherlags of the explanatory variables as instruments for mt–1.14 The signand significance of the parameter estimates for each country arereported in Tables 3.7 through 3.11. As the democracy variableproved not significant for any country (unsurprising, given its lowvariance), the regressions reported below exclude it.
France. Table 3.7 presents the findings for France. The signs of theestimated parameters vary across model specifications, and just onecoefficient estimate is significant across both specifications. Foreach specification, the lagged military expenditure variable is statis-tically significant and positively related to the military expenditurevariable in the current period. On average, therefore, increases inFrench military expenditures in the previous year are good predic-tors of increases in military expenditures in the next period. There islittle support for a positive relationship between output and militaryexpenditures. The sign of the coefficient estimate for lagged Frenchreal output is not robust across model specifications, and neither itnor output growth is significantly different from zero in either speci-fication. The threat variable appears to be positive and significantwhen the dependent variable is real military expenditures, but itchanges sign and becomes insignificant when the dependent vari-able is the military expenditures-to-output ratio. As indicated by theBox-Ljung “Q” statistic, there is evidence of some higher-order serialcorrelation in the errors for the military expenditures ratio, but notthe real military expenditures, specification. Common explanationsfor the presence of higher-order serial correlation are either the pres-ence of an omitted variable or a high degree of measurement error inthe explanatory variables. Either explanation is plausible here.
______________ 14The technique we use was first suggested by Hildreth and Lu (1960); it does notrequire the absence of missing values in the data.

Empirical Determination of the Growth–Military Expenditures Relationship 39
Table 3.7
France: Sign and Significance of Model 1 Parameter Estimates
Dependent Variable Is:
Real MilitaryExpenditures
Military ExpendituresRatio
Variable Sign Signif Sign Signif
Constant – No – NoLag Depend + Yes + YesLag Output + No – NoLag Growth – No – NoLag Threat + Yes* – No
Reject Q = 0? No Yes
Adjusted R2 0.43 0.59
NOTE: “Yes” denotes significance at the 5 percent level unless marked with anasterisk, which denotes the 10 percent level.
Germany. The model does not do much better at explaining patternsin Germany, as shown in Table 3.8. As with France, the estimatedrelationship between current and past German military expendi-tures—whether measured in real terms or as a ratio to national out-put—is both positive and significant. But coefficients on the level aswell as the growth rate of German real output are insignificantlynegative in both model specifications. The threat coefficients arealso negative, contrary to what most theories would predict, andsignificantly so when the dependent variable is the military expendi-tures ratio. Like France, there is evidence of higher-order serial cor-relation in the errors for the military expenditures ratio specification.
Japan. As reported in Table 3.9, the model does a relatively poor jobof explaining Japanese military expenditures. Past military expendi-tures are both significant and positively related to current expendi-tures whether measured in real terms or as a ratio to national output,but no other coefficient estimates are statistically significant. Thereis no evidence of higher-order serial correlation in the errors.

40 Military Expenditures and Economic Growth
Table 3.8
Germany: Sign and Significance of Model 1 Parameter Estimates
Dependent Variable Is:
Real MilitaryExpenditures
Military ExpendituresRatio
Variable Sign Signif Sign Signif
Constant + No + NoLag Depend + Yes + YesLag Output – No – NoLag Growth – No – NoLag Threat – No – Yes*
Reject Q = 0? No Yes
Adjusted R2 0.93 0.42
NOTE: “Yes” denotes significance at the 5 percent level unless marked with anasterisk, which denotes the 10 percent level.
Table 3.9
Japan: Sign and Significance of Model 1 Parameter Estimates
Dependent Variable Is:
Real MilitaryExpenditures
Military ExpendituresRatio
Variable Sign Signif Sign Signif
Constant + No – NoLag Depend + Yes + YesLag Output + No – NoLag Growth – No – NoLag Threat – No – No
Reject Q = 0? No No
Adjusted R2 0.76 –0.11
NOTE: “Yes” denotes significance at the 5 percent level unless marked with anasterisk, which denotes the 10 percent level.

Empirical Determination of the Growth–Military Expenditures Relationship 41
Russia. As indicated in the section “Data Description,” iron and steelproduction (measured in tons) is used as a proxy for Russian nationaloutput. Because iron and steel production is measured in real out-put units, rather than inflation-adjusted rubles, data on the militaryexpenditures ratio are not available for Russia.
Table 3.10 reports the results for Russia. In contrast to France, Ger-many, and Japan, movements in past military expenditures do notseem to explain current movements. Lagged values of the outputproxy are significant and positive, while output growth is statisticallyinsignificant. Again surprisingly, the threat variable is negative andsignificant. The “Q” statistic is quite high, suggesting that higher-order serial correlation of the errors is a problem.
Table 3.10
Russia: Sign and Significance of Model 1 Parameter Estimates
Dependent Variable Is:
Real MilitaryExpenditures
Military ExpendituresRatio
Variable Sign Signif Sign Signif
Constant + Yes NALag Depend – No NALag Output + Yes NALag Growth + No NALag Threat – Yes NA
Reject Q=0? Yes
Adjusted R2 0.58 NA
NOTE: “Yes” denotes significance at the 5 percent level unless marked with anasterisk, which denotes the 10 percent level.
United States. Table 3.11 presents the econometric findings for theUnited States. The explanatory power of the model is universallypoor: none of the coefficients are statistically significant. We cannotreject the hypothesis of no higher-order serial correlation for the realmilitary expenditures regression, but Q is statistically significant forthe military expenditures ratio regression.

42 Military Expenditures and Economic Growth
Table 3.11
United States: Sign and Significance of Model 1 Parameter Estimates
Dependent Variable Is:
Real MilitaryExpenditures
Military ExpendituresRatio
Variable Sign Signif Sign Signif
Constant – No + NoLag Depend + No + NoLag Output + No + NoLag Growth + No + NoLag Threat + No – No
Reject Q = 0? No Yes
Adjusted R2 0.89 –0.11
NOTE: “Yes” denotes significance at the 5 percent level unless marked with anasterisk, which denotes the 10 percent level.
Model 2
The relatively weak explanatory power of our first model suggeststhat it may have been poorly specified. Our second model explicitlyallows for a more simultaneous decisionmaking process. Whereas inthe first model we assumed that defense policymakers responded(one year later) to external threats in the form of buildups of militarypersonnel, here it is posited that defense policymakers contempora-neously observe each other’s military spending decisions and re-spond accordingly. Such an approach has an additional advantagein that it allows increases in spending by both friends and rivals toinfluence spending decisions.
The system of simultaneous equations we estimate for Model 2 is
M C M B OUTPUT B GROWTH B
M U
it i it Mi it j Oij it j Gijj
kt itk i
= + ∗ + ∗ + ∗( )+ +
− − −
≠
∑∑
1
,

Empirical Determination of the Growth–Military Expenditures Relationship 43
where i and k are country indexes, t and j are time indexes, and allexplanatory variables are defined as in Model 1. In this model, how-ever, we assume that the vector of disturbance terms, U, is correlatedacross countries as well as across time periods.15 This secondassumption derives from the fact that many external events (forexample, Austria-Hungary’s declaration of war on Serbia) leading tounplanned military expenditures are likely to have affected all four ofthe countries in our sample contemporaneously. As with the firstmodel, we consider two possible decision variables: real militaryexpenditures and military expenditures as a share of output. Ourinstrumental variables estimation methodology derives from Fair(1970). Once again, further lags of the explanatory variables are usedas instruments for Mit–1.
France. The results for France are presented in Table 3.12. Esti-mated coefficients for three of the explanatory variables are statisti-cally significant: past military expenditures, past output, and pastoutput growth. Consistent with Model 1, the sign on past output ispositive, while the sign on past output growth is negative. The effectof contemporaneous German military expenditures on French mili-tary spending is not robust across the three specifications and isnever statistically significant. The Box-Ljung “Q” test for higher-order serial correlation is not valid for these types of simultaneoussystems, so it is not used here.
Germany. As shown in Table 3.13, past military expenditures onceagain provide most of the explanatory power for current militaryexpenditures. As in Model 1, neither German output measure has acoefficient that differs significantly from zero. Instead, it is the Rus-sian and especially the French contemporaneous military expendi-tures measures that provide additional explanatory power. Increasesin French military spending are associated with increases in Germanmilitary spending in both specifications of the model.
______________ 15That is, both Cov(uit, uit–1) and Cov(uit, ukt) are nonzero, implying that the structureof the time dependence is first-order autoregressive (AR(1)) and that disturbances arecontemporaneously correlated across countries.

44 Military Expenditures and Economic Growth
Table 3.12
France: Sign and Significance of Model 2 Parameter Estimates
Dependent Variable Is:
Real MilitaryExpenditures
Military ExpendituresRatio
Variable Sign Signif Sign Signif
Constant – Yes – NoLag Depend + Yes + YesLag Output + Yes + Yes*Lag Growth – Yes – YesGerman military
expenditures– No + No
Adjusted R2 0.49 0.81
NOTE: “Yes” denotes significance at the 5 percent level unless marked with anasterisk, which denotes the 10 percent level.
Table 3.13
Germany: Sign and Significance of Model 2 Parameter Estimates
Dependent Variable Is:
Real MilitaryExpenditures
Military ExpendituresRatio
Variable Sign Signif Sign Signif
Constant – Yes* – YesLag Depend + Yes + YesLag Output – No + NoLag Growth – No – NoFrench military
expenditures+ Yes + Yes
Russian militaryexpenditures
+ No NA
Adjusted R2 0.96 0.89
NOTE: “Yes” denotes significance at the 5 percent level unless marked with anasterisk, which denotes the 10 percent level.

Empirical Determination of the Growth–Military Expenditures Relationship 45
Japan. For Japan, Model 2 has much greater explanatory power thanModel 1. As shown in Table 3.14, lagged military expenditures aresignificant across both model specifications, while real output andU.S. military expenditures are significant in the real military expendi-tures specification. Although statistically significant, the coefficienton real output is negative. The U.S. military expenditures variable,however, is positive as predicted.
Table 3.14
Japan: Sign and Significance of Model 2 Parameter Estimates
Dependent Variable Is:
Real MilitaryExpenditures
Military ExpendituresRatio
Variable Sign Signif Sign Signif
Constant + No – NoLag Depend + Yes + YesLag Output – Yes + NoLag Growth – No – NoRussian military
expenditures+ No NA
U.S. militaryexpenditures
+ Yes + No
Adjusted R2 0.81 0.50
NOTE: “Yes” denotes significance at the 5 percent level unless marked with anasterisk, which denotes the 10 percent level.
Russia. The regression results for Russia are presented in Table 3.15.With Russian iron and steel production as the proxy for output, coef-ficients on output and output growth appear to have no statisticallysignificant relation to real military expenditures. This is not consis-tent with the Model 1 results. Neither German nor Japanese militaryexpenditures have any significant explanatory power.

46 Military Expenditures and Economic Growth
Table 3.15
Russia: Sign and Significance of Model 2 Parameter Estimates
Dependent Variable Is:
Real MilitaryExpenditures
Military ExpendituresRatio
Variable Sign Signif Sign Signif
Constant – No NALag Depend + Yes NAOutput – No NAGrowth + No NAGerman military
expenditures– No NA
Japanese militaryexpenditures
+ No NA
Adjusted R2 0.84 NA
NOTE: “Yes” denotes significance at the 5 percent level unless marked with anasterisk, which denotes the 10 percent level.
United States. The U.S. results from Model 2 are presented in Table3.16. Lagged military expenditures are now the best predictor of cur-rent military expenditures, with a strong and significant positive re-lationship. Real output and real output growth continue to have nosignificant relation to either real military expenditures or the militaryexpenditures ratio. However, German and Japanese military ex-penditures are, respectively, positively and negatively related to U.S.military expenditures in the real military expenditures specification.
CONCLUSION
Overall, both our graphical and statistical analysis indicate that therelationship between military expenditures, economic output, andeconomic output growth varies over time and across countries.Further, our statistical results are not robust to different modelspecifications. In terms of explanatory power, there is no consistentpattern across models or across countries, although Model 1 isclearly less able to explain movements in Japanese and U.S. militaryexpenditures ratios, while Model 2 does well at explaining move-

Empirical Determination of the Growth–Military Expenditures Relationship 47
Table 3.16
United States: Sign and Significance of Model 2 Parameter Estimates
Dependent Variable Is:
Real MilitaryExpenditures
Military ExpendituresRatio
Variable Sign Signif Sign Signif
Constant – No + NoLag Depend + Yes + YesOutput + No + NoGrowth + No – NoGerman military
expenditures+ Yes + No
Japanese militaryexpenditures
– Yes* + No
Adjusted R2 0.90 0.61
NOTE: “Yes” denotes significance at the 5 percent level unless marked with anasterisk, which denotes the 10 percent level.
ments in both measure of military expenditures for France. For mostcountries, the strongest predictor of current military expenditures ismilitary expenditures in the immediate past, whether these expendi-tures are measured in levels or as a share of output. While it is un-surprising that current military spending decisions are heavily influ-enced by decisions made in the past, this fact sheds little light on whydecisions were made in the first place.
Our results indicate that the statistical evidence for a strong relation-ship between great-power military expenditures and economic out-put during the 1870–1939 sample period is less than overwhelming.Certainly no conclusive evidence as to the direction of causalitybetween the two has been presented. Threat-based explanations formilitary spending also receive mixed support from our analysis:While it seems plausible that Germany might respond positively toincreases in French military spending, for example, it seems muchless plausible that the United States actually reduced its militaryexpenditures in response to Japanese spending increases.

48 Military Expenditures and Economic Growth
In the next chapter, therefore, we provide a more qualitative but noless rigorous analysis of the military expenditures–growth relation-ship. We begin with a careful analytical construction of three alter-native hypotheses about the growth–military expenditures relation-ship. Then, using a case study methodology, we examine influentialnational and international events in an effort to determine which ofthe three hypotheses best explains an individual nation’s militaryspending decisions.


![On the determination of the empirical formula of a hydrocarbon · Washburn] EmpiricalFormulaofaHydrocarbon 869 Ontheotherhand,ifthelaboratoryhadnocombustionapparatus inworkingconditionbutwasinsteadequippedwithsuitableapparatus](https://img.pdfslide.net/doc/110x75/5b3611967f8b9a5f288c48b7/on-the-determination-of-the-empirical-formula-of-a-hydrocarbon-washburn-empiricalformulaofahydrocarbon.jpg)