Embed Size (px)
Citation preview
E M P L O Y A B I L I T Y O F
E N G I N E E R S
S T A T E W I S E
E X C E R P T S F R O M A S P I R I N G M I N D S
N A T I O N A L E M P L O Y A B I L I T Y S T U D Y 2 0 1 1
B Y A S P I R I N G M I N D S R E S E A R C H C E L L
AS PI RI NG MI N DS , I ND IA’S LE ADI NG E MPL OYA BIL I TY S OLU TI O NS C OMP A NY
Highlights
- Tamil Nadu, Andhra Pradesh lag behind in average quality of talent
- States focusing on numbers and not quality, reveals the report
- In metros, Delhi again has the best engineers followed by Kolkata and Bangalore
SUMMARY
India is a diverse country and the diversity extends to the engineering graduates across states. The
States Employability report explores the sectoral employability of students from every state.
Technical education in India has scaled over the last decade boasting of 1000s of engineering colleges
spread across the length and breadth of the country producing over half a million engineering graduates
annually.
Aspiring Minds study is based on AMCAT – India’s Largest Employability Test results of over 120,000
Engineers across the country. AMCAT being the leading measure of employability is able to accurately
predict the employability of Engineers in various technical roles including IT services, IT Product, KPOs,
BPOs, technical support, etc.
The study show the drop in percentage of employability of engineers across different states for diffeent
sectors. Aspiring Minds Research cell has done advanced statistical studies to uncover the core reasons
for the dramatic variation in the quality of talent being produced.
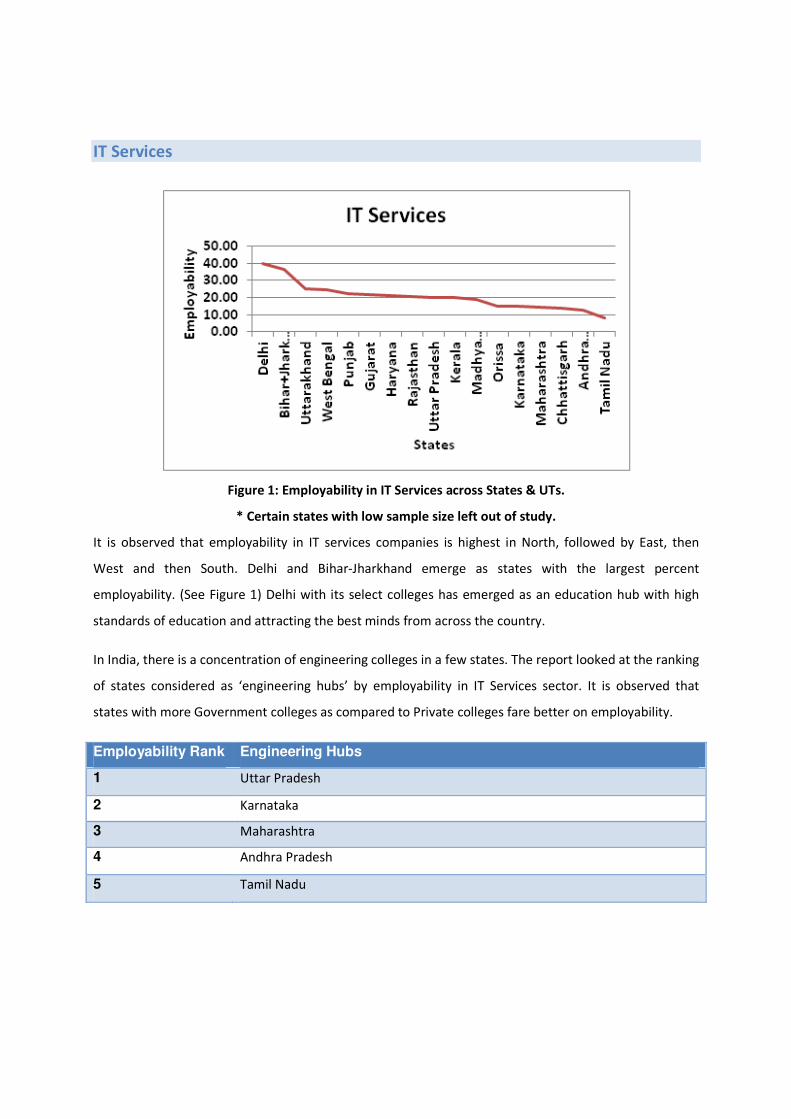
IT Services
Figure 1: Employability in IT Services across States & UTs.
* Certain states with low sample size left out of study.
It is observed that employability in IT services companies is highest in North, followed by East, then
West and then South. Delhi and Bihar-Jharkhand emerge as states with the largest percent
employability. (See Figure 1) Delhi with its select colleges has emerged as an education hub with high
standards of education and attracting the best minds from across the country.
In India, there is a concentration of engineering colleges in a few states. The report looked at the ranking
of states considered as ‘engineering hubs’ by employability in IT Services sector. It is observed that
states with more Government colleges as compared to Private colleges fare better on employability.
Employability Rank Engineering Hubs
1 Uttar Pradesh
2 Karnataka
3 Maharashtra
4 Andhra Pradesh
5 Tamil Nadu
Variations in Employability across states: Exploring the reasons
Aspiring Minds Research Cell looked into establishing the factors which could explain the dramatics
variations in Employability across states. They considered the impact of state population, size of state,
number of colleges, gender spread, etc as possible explanation for the same.
Hypothesis: Impact of number of colleges on quality of education
We hypothesize that just the sheer number of engineering colleges in a state influences the percent
employability of students in the state. Wherein the number of engineering schools are lower in number,
the percent employability is higher and vice-versa. To check this hypothesis we analyzed the relation
between the percent employability vs. the number of engineering colleges in each state.
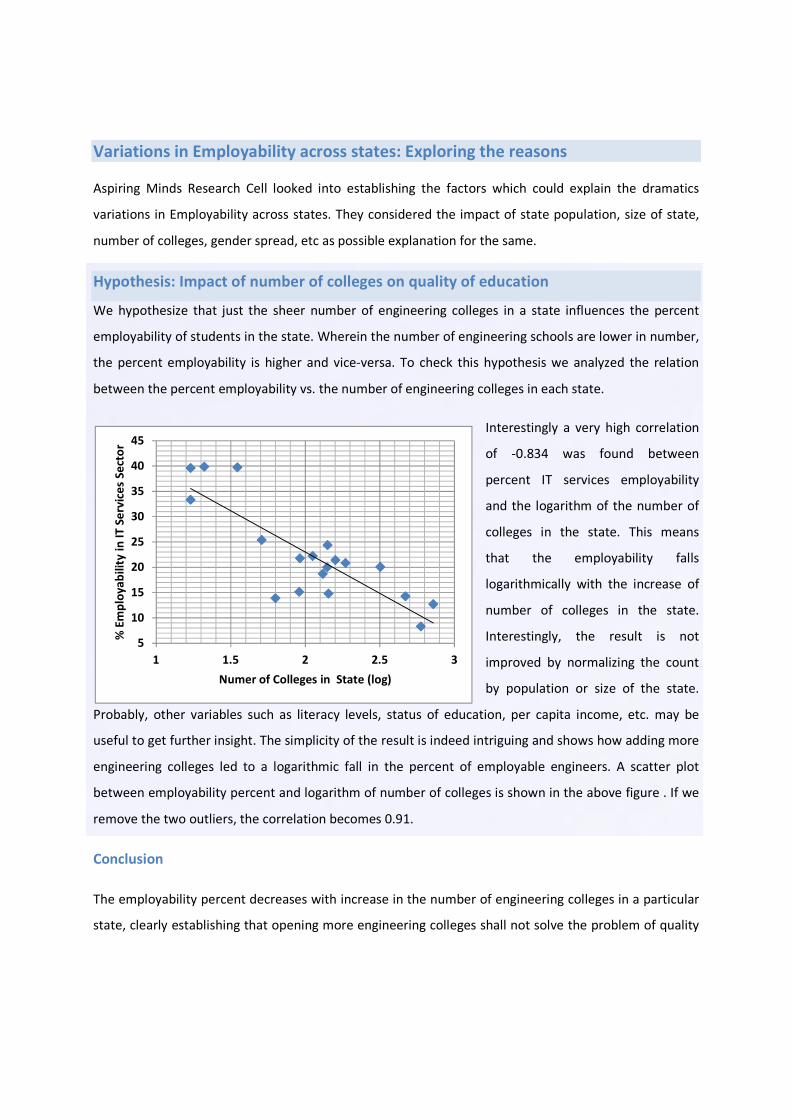
Interestingly a very high correlation
of -0.834 was found between
percent IT services employability
and the logarithm of the number of
colleges in the state. This means
that the employability falls
logarithmically with the increase of
number of colleges in the state.
Interestingly, the result is not
improved by normalizing the count
by population or size of the state.
Probably, other variables such as literacy levels, status of education, per capita income, etc. may be
useful to get further insight. The simplicity of the result is indeed intriguing and shows how adding more
engineering colleges led to a logarithmic fall in the percent of employable engineers. A scatter plot
between employability percent and logarithm of number of colleges is shown in the above figure . If we
remove the two outliers, the correlation becomes 0.91.
Conclusion
The employability percent decreases with increase in the number of engineering colleges in a particular
state, clearly establishing that opening more engineering colleges shall not solve the problem of quality
5
10
15
20
25
30
35
40
45
1 1.5 2 2.5 3
% E
mp
loy
ab
ilit
y i
n I
T S
erv
ice
s S
ect
or
Numer of Colleges in State (log)
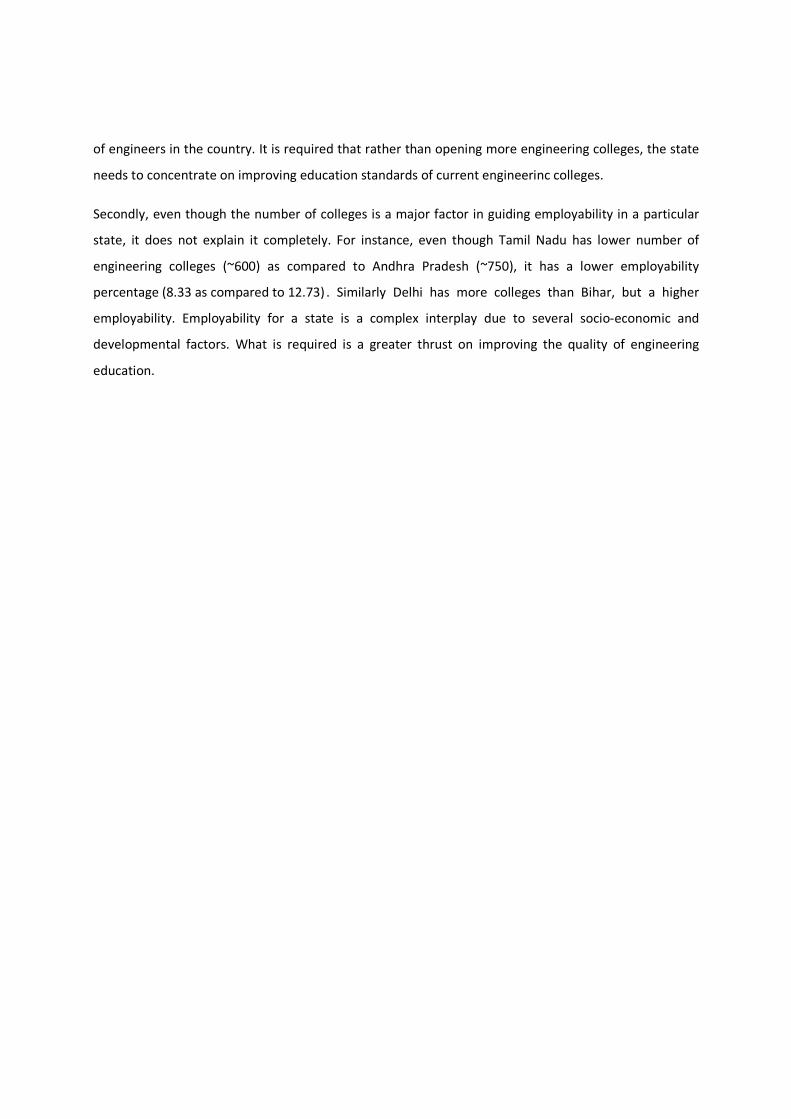
of engineers in the country. It is required that rather than opening more engineering colleges, the state
needs to concentrate on improving education standards of current engineerinc colleges.
Secondly, even though the number of colleges is a major factor in guiding employability in a particular
state, it does not explain it completely. For instance, even though Tamil Nadu has lower number of
engineering colleges (~600) as compared to Andhra Pradesh (~750), it has a lower employability
percentage (8.33 as compared to 12.73) . Similarly Delhi has more colleges than Bihar, but a higher
employability. Employability for a state is a complex interplay due to several socio-economic and
developmental factors. What is required is a greater thrust on improving the quality of engineering
education.
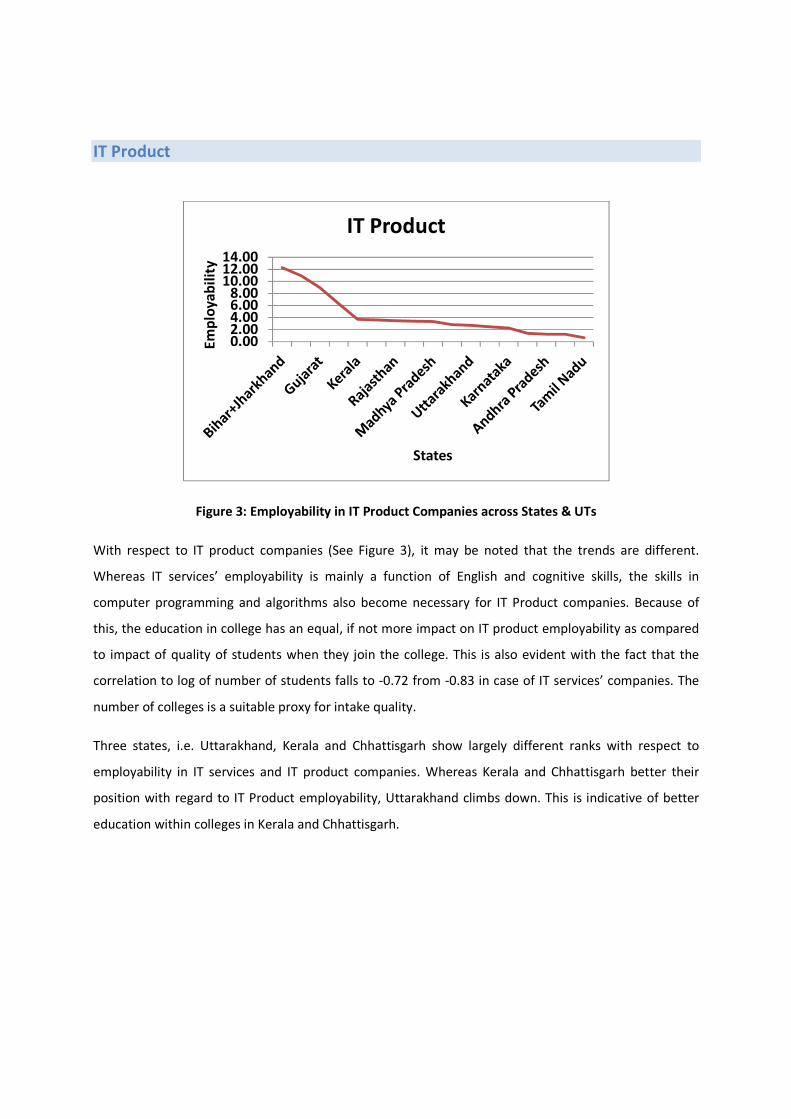
IT Product
Figure 3: Employability in IT Product Companies across States & UTs
With respect to IT product companies (See Figure 3), it may be noted that the trends are different.
Whereas IT services’ employability is mainly a function of English and cognitive skills, the skills in
computer programming and algorithms also become necessary for IT Product companies. Because of
this, the education in college has an equal, if not more impact on IT product employability as compared
to impact of quality of students when they join the college. This is also evident with the fact that the
correlation to log of number of students falls to -0.72 from -0.83 in case of IT services’ companies. The
number of colleges is a suitable proxy for intake quality.
Three states, i.e. Uttarakhand, Kerala and Chhattisgarh show largely different ranks with respect to
employability in IT services and IT product companies. Whereas Kerala and Chhattisgarh better their
position with regard to IT Product employability, Uttarakhand climbs down. This is indicative of better
education within colleges in Kerala and Chhattisgarh.
0.002.004.006.008.00
10.0012.0014.00
Em
plo
ya
bil
ity
States
IT Product
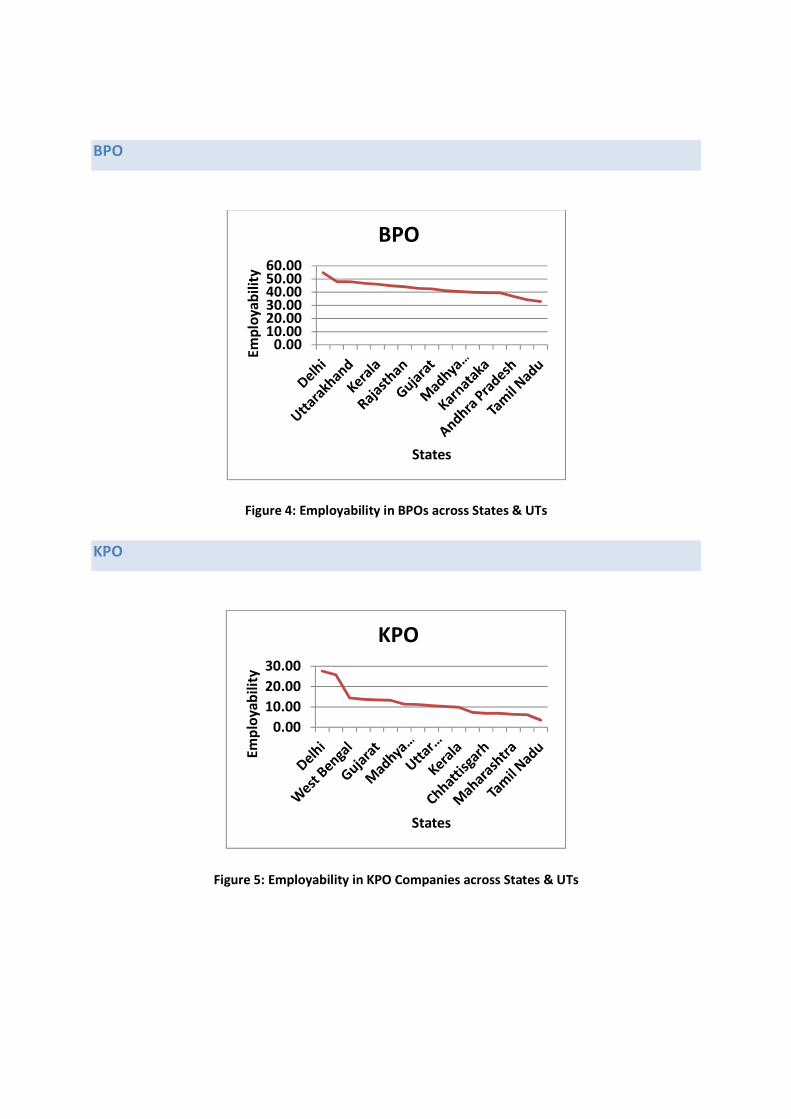
BPO
Figure 4: Employability in BPOs across States & UTs
KPO
Figure 5: Employability in KPO Companies across States & UTs
0.0010.0020.0030.0040.0050.0060.00
Em
plo
ya
bil
ity
States
BPO
0.00
10.00
20.00
30.00
Em
plo
ya
bil
ity
States
KPO
Key Cities
Figure
We compared employability across colleges within major metros in the country (see
similar trends to those with regard to employab
percent followed by Kolkata (East), cities in the West and the lowest employability figures were
observed in colleges in Southern cities. The skew in employability is quite high, for instance, the
product employability in Delhi in as high as 1 in every 9 candidates and as low as 1 in every 200 in
Chennai. Even though Bengaluru has similar IT Services’ employability as compared to other Southern
and Western cities, it shows much higher employabili
candidates in Bengaluru do much better at computer programming and algorithms even though they
show similar English and cognitive skills. This could be better exposure to computer programming either
at home, schools or college.
The reason for this skew in employability is explained again by the trend in number of colleges in each of
these cities (See Table 1). The proliferation of engineering colleges in South India and West has
down the employability figures. There are way lesser engineering colleges both in Delhi and
This is in spite of the fact that the population of Delhi is much more t
comparable to that of Mumbai.
IT Services
Delhi
Kolkata
Bengaluru
Hyderabad
Mumbai+Pune
Chennai (Inc. Thiruvallur)
0.00
10.00
20.00
30.00
40.00
50.00
60.00E
mp
loy
ab
ilit
y
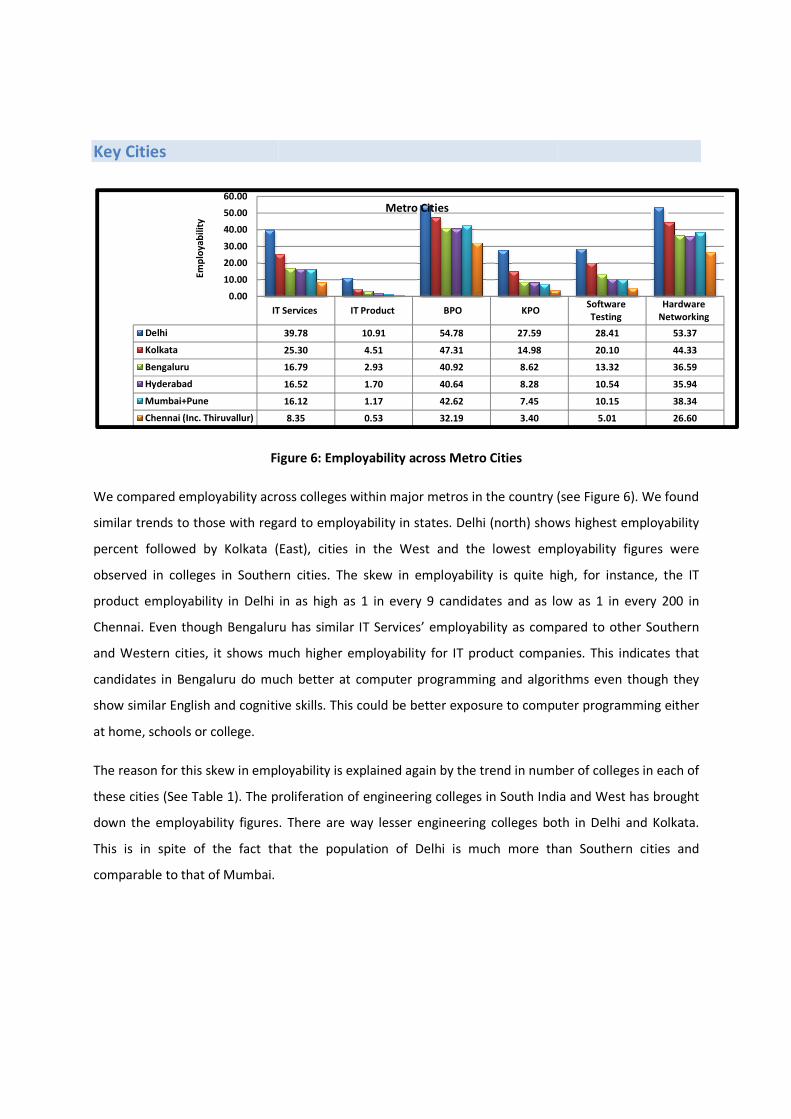
Figure 6: Employability across Metro Cities
We compared employability across colleges within major metros in the country (see
similar trends to those with regard to employability in states. Delhi (north) shows highest employability
percent followed by Kolkata (East), cities in the West and the lowest employability figures were
observed in colleges in Southern cities. The skew in employability is quite high, for instance, the
product employability in Delhi in as high as 1 in every 9 candidates and as low as 1 in every 200 in
Chennai. Even though Bengaluru has similar IT Services’ employability as compared to other Southern
and Western cities, it shows much higher employability for IT product companies. This indicates that
candidates in Bengaluru do much better at computer programming and algorithms even though they
show similar English and cognitive skills. This could be better exposure to computer programming either
The reason for this skew in employability is explained again by the trend in number of colleges in each of
proliferation of engineering colleges in South India and West has
down the employability figures. There are way lesser engineering colleges both in Delhi and
of the fact that the population of Delhi is much more than Southern cities and
IT Services IT Product BPO KPO
39.78 10.91 54.78 27.59
25.30 4.51 47.31 14.98
16.79 2.93 40.92 8.62
16.52 1.70 40.64 8.28
16.12 1.17 42.62 7.45
8.35 0.53 32.19 3.40
Metro Cities
We compared employability across colleges within major metros in the country (see Figure 6). We found
ility in states. Delhi (north) shows highest employability
percent followed by Kolkata (East), cities in the West and the lowest employability figures were
observed in colleges in Southern cities. The skew in employability is quite high, for instance, the IT
product employability in Delhi in as high as 1 in every 9 candidates and as low as 1 in every 200 in
Chennai. Even though Bengaluru has similar IT Services’ employability as compared to other Southern
ty for IT product companies. This indicates that
candidates in Bengaluru do much better at computer programming and algorithms even though they
show similar English and cognitive skills. This could be better exposure to computer programming either
The reason for this skew in employability is explained again by the trend in number of colleges in each of
proliferation of engineering colleges in South India and West has brought
down the employability figures. There are way lesser engineering colleges both in Delhi and Kolkata.
han Southern cities and
Software
Testing
Hardware
Networking
28.41 53.37
20.10 44.33
13.32 36.59
10.54 35.94
10.15 38.34
5.01 26.60
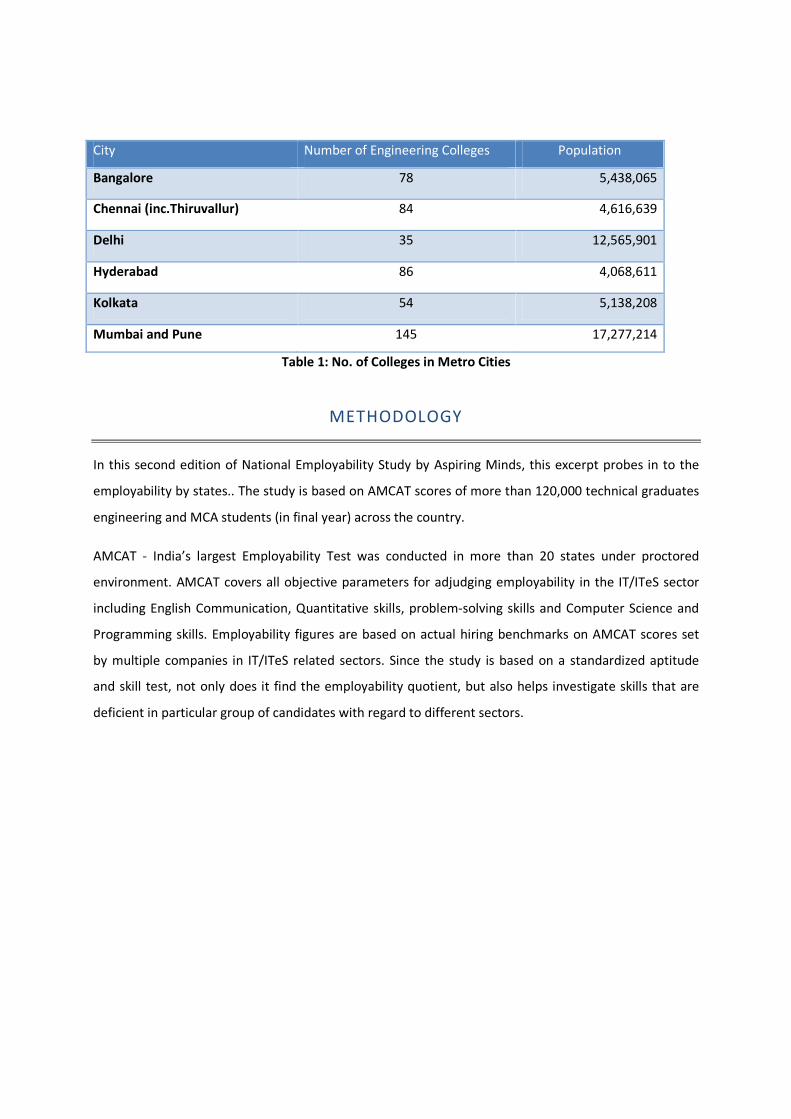
City Number of Engineering Colleges Population
Bangalore 78 5,438,065
Chennai (inc.Thiruvallur) 84 4,616,639
Delhi 35 12,565,901
Hyderabad 86 4,068,611
Kolkata 54 5,138,208
Mumbai and Pune 145 17,277,214
Table 1: No. of Colleges in Metro Cities
METHODOLOGY
In this second edition of National Employability Study by Aspiring Minds, this excerpt probes in to the
employability by states.. The study is based on AMCAT scores of more than 120,000 technical graduates
engineering and MCA students (in final year) across the country.
AMCAT - India’s largest Employability Test was conducted in more than 20 states under proctored
environment. AMCAT covers all objective parameters for adjudging employability in the IT/ITeS sector
including English Communication, Quantitative skills, problem-solving skills and Computer Science and
Programming skills. Employability figures are based on actual hiring benchmarks on AMCAT scores set
by multiple companies in IT/ITeS related sectors. Since the study is based on a standardized aptitude
and skill test, not only does it find the employability quotient, but also helps investigate skills that are
deficient in particular group of candidates with regard to different sectors.
ABOUT ASPIRING MINDS
Aspiring Minds is India’s leading employability solutions company, headquartered in Gurgaon. The state
of the art assessment tools developed by Aspiring Minds have been used across industry verticals to
help recruit the right people, develop profile-wise employability benchmarks and assess workforce
health.
Aspiring Minds’ intelligent adaptive assessments span across Language, Cognitive skills, Domain
knowledge and Personality. A strong in-house research and development team with alumni from IITs
and MIT form the development back bone of the patent pending assessment tools. AMCAT® - the
flagship product is India’s Largest Employability Test. Conducted across the country throughout the year,
tens of thousands of candidates secure their dream jobs every year through AMCAT.
The management from IITs and IIMs, more than 135 full-time employees, and a pan-India operational
presence have helped leading corporations across industry verticals improve their recruitment process
efficiency and the quality of talent being acquired. Aspiring Minds products and solutions have been
adopted by leading corporates including HCL, Genpact, Accenture, L&T Finance, Keane, Mphasis,
Ericsson, Sapient, John Deere, Tavant, Tally, among others.
FOR FURTHER ENQUIRIES MEDIA ENQUIRIES
Himanshu Aggarwal
Aakriti Bhargava
+91 9871220114
DISCLAIMER
Our analytics team has used statistical techniques to derive insights which might be useful for our
users/stake holders/ audiences. There may be a statistical margin of error.