Embed Size (px)
Citation preview
Employee Benefits: Just How Competitive is Your Company?
Mark Schmit, Ph.D., SPHR, director, SHRM Research
June 26-29, 2011Las Vegas, Nevada
©SHRM 2010
Mark Schmit, Ph.D., SPHR, director, SHRM Research
June 27, 2011
SHRM 2011 Annual Conference & Exposition
Examining Employee Benefits Amidst Uncertainty
• Organizations offer a wide range of traditional and nontraditional benefits. In the past, the dilemma for organizations was how to offer the right mix of these benefits to attract and retain top performers while also balancing their increasing costs.
> On average the percentage of payroll reflecting total cost of benefits:• 19% of an employee’s annual salary on mandatory benefits (such as unemployment,
©SHRM 2010 2
• 19% of an employee’s annual salary on mandatory benefits (such as unemployment, worker’s compensation, Social Security)
• 19% of an employee’s annual salary on voluntary benefits (such as medical plans, dental plans, prescription coverage, flexible spending accounts, vision plans, survivor benefits)
• 11% of an employee’s annual salary on on pay for time not worked benefits (regular rate of pay for a nonworking period of time, such as vacations, holidays, personal, bereavement and sick leave).
Examining Employee Benefits Amidst Uncertainty
• Today, organizations are managing these ever-increasing costs amidst the uncertainty of the U.S. economy and the complex health care reform law.
• Given that the benefits allocation in HR budgets is typically fixed, or marginally flexible, it is not surprising according to this research,
©SHRM 2010 3
marginally flexible, it is not surprising according to this research, employers continue to remodel their benefits plans so employees are given greater responsibility to manage their health care costs, retirement and financial security, and leave time.

In a 2010 survey of 479 global C-suite executives, the Global Firms 2020 survey,
commissioned by SHRM with the Economist Intelligence Unit, it was found that C-suite
executives believe the two biggest challenges facing HR over the coming 10 years will
be:
1. Retaining and rewarding the best people
Examining Employee Benefits Amidst Uncertainty
©SHRM 2010
1. Retaining and rewarding the best people
2. Attracting the best people to the organization
4
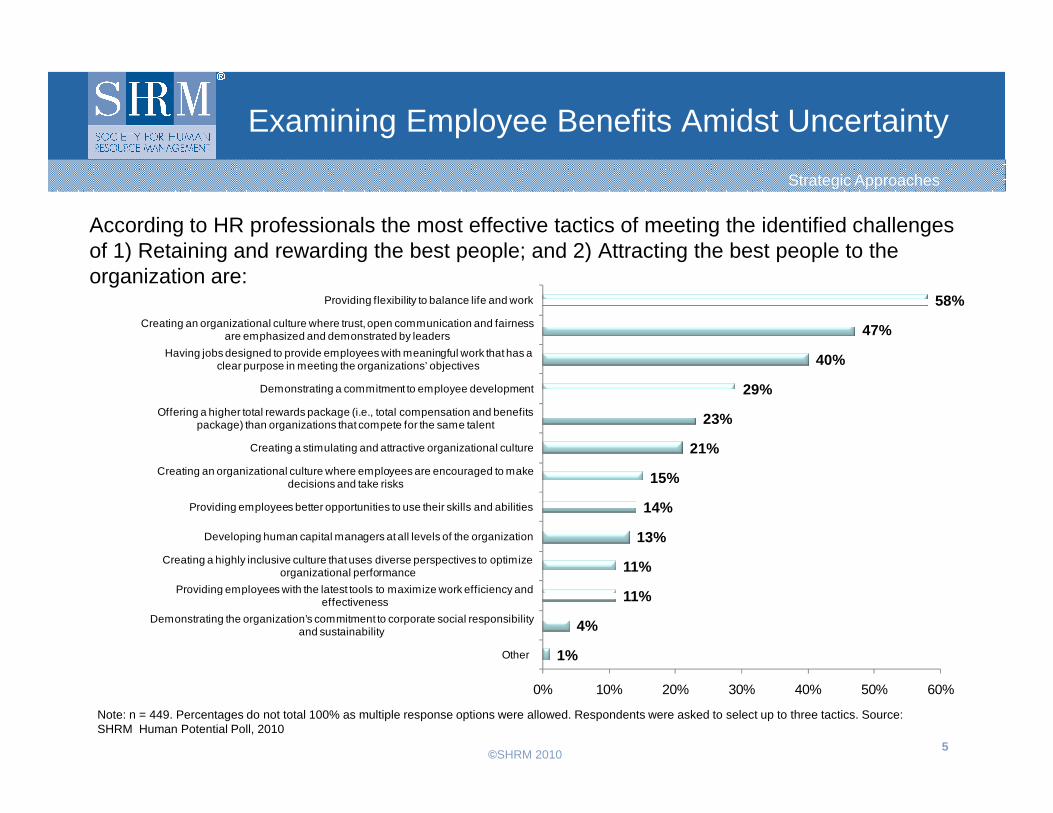
According to HR professionals the most effective tactics of meeting the identified challenges of 1) Retaining and rewarding the best people; and 2) Attracting the best people to the organization are:
29%
40%
47%
58%
Offering a higher total rewards package (i.e., total compensation and benefits
Demonstrating a commitment to employee development
Having jobs designed to provide employees with meaningful work that has a clear purpose in meeting the organizations’ objectives
Creating an organizational culture where trust, open communication and fairness are emphasized and demonstrated by leaders
Providing flexibility to balance life and work
Strategic Approaches
Examining Employee Benefits Amidst Uncertainty
©SHRM 2010 5
Note: n = 449. Percentages do not total 100% as multiple response options were allowed. Respondents were asked to select up to three tactics. Source: SHRM Human Potential Poll, 2010
1%
4%
11%
11%
13%
14%
15%
21%
23%
0% 10% 20% 30% 40% 50% 60%
Other
Demonstrating the organization’s commitment to corporate social responsibility and sustainability
Providing employees with the latest tools to maximize work efficiency and effectiveness
Creating a highly inclusive culture that uses diverse perspectives to optimize organizational performance
Developing human capital managers at all levels of the organization
Providing employees better opportunities to use their skills and abilities
Creating an organizational culture where employees are encouraged to make decisions and take risks
Creating a stimulating and attractive organizational culture
Offering a higher total rewards package (i.e., total compensation and benefits package) than organizations that compete for the same talent
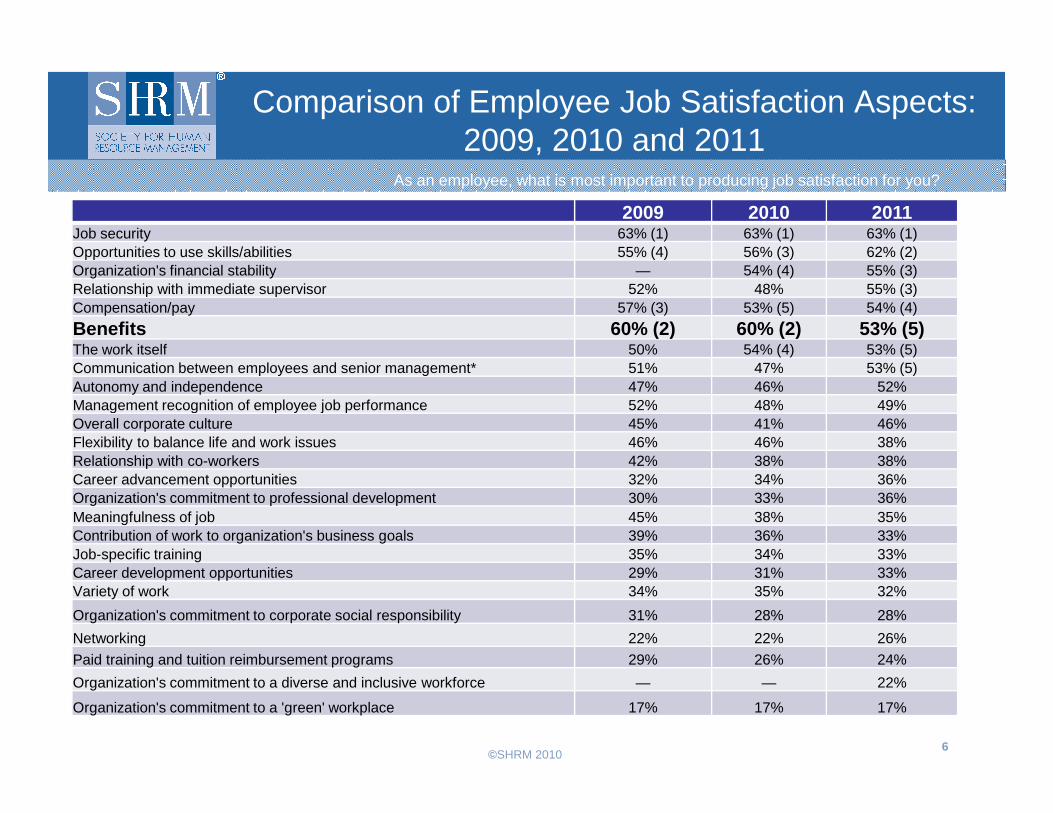
Comparison of Employee Job Satisfaction Aspects: 2009, 2010 and 2011
2009 2010 2011Job security 63% (1) 63% (1) 63% (1)Opportunities to use skills/abilities 55% (4) 56% (3) 62% (2)Organization's financial stability — 54% (4) 55% (3)Relationship with immediate supervisor 52% 48% 55% (3)Compensation/pay 57% (3) 53% (5) 54% (4)
Benefits 60% (2) 60% (2) 53% (5)The work itself 50% 54% (4) 53% (5)Communication between employees and senior management* 51% 47% 53% (5)Autonomy and independence 47% 46% 52%Management recognition of employee job performance 52% 48% 49%
As an employee, what is most important to producing job satisfaction for you?
©SHRM 2010 6
Management recognition of employee job performance 52% 48% 49%Overall corporate culture 45% 41% 46%Flexibility to balance life and work issues 46% 46% 38%Relationship with co-workers 42% 38% 38%Career advancement opportunities 32% 34% 36%Organization's commitment to professional development 30% 33% 36%Meaningfulness of job 45% 38% 35%Contribution of work to organization's business goals 39% 36% 33%Job-specific training 35% 34% 33%Career development opportunities 29% 31% 33%Variety of work 34% 35% 32%
Organization's commitment to corporate social responsibility 31% 28% 28%
Networking 22% 22% 26%
Paid training and tuition reimbursement programs 29% 26% 24%
Organization's commitment to a diverse and inclusive workforce — — 22%
Organization's commitment to a 'green' workplace 17% 17% 17%
Examining Employee Benefits Amidst Uncertainty
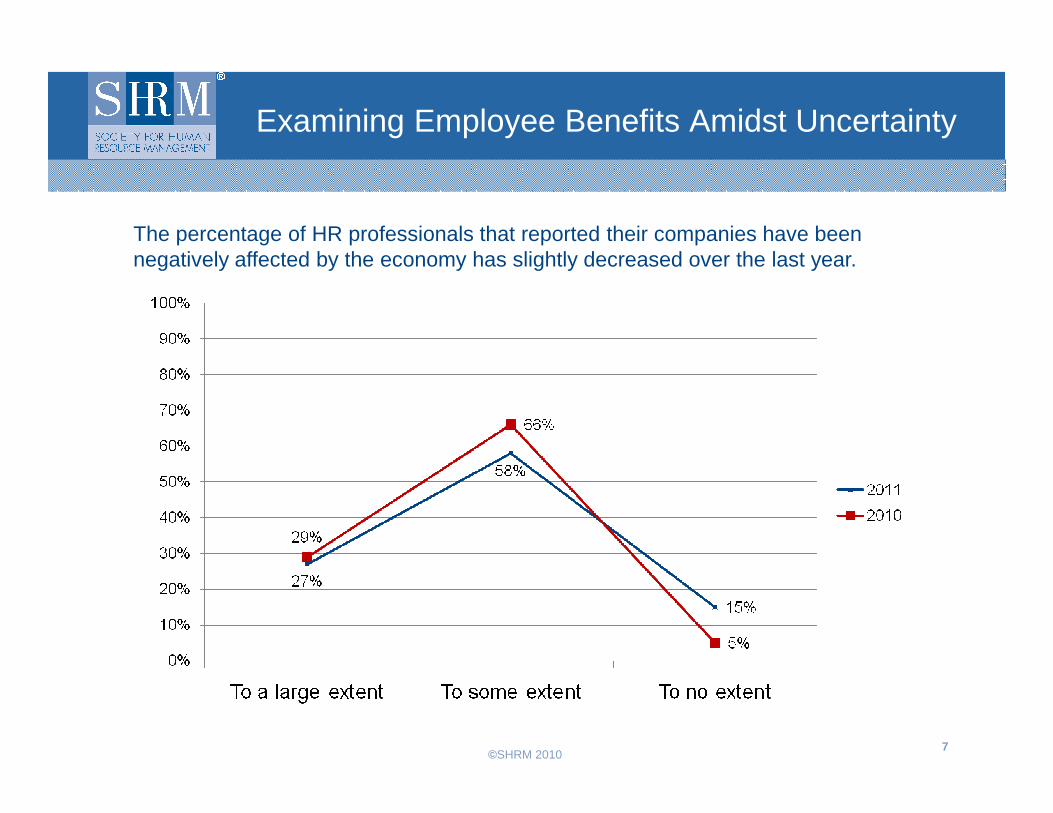
The percentage of HR professionals that reported their companies have been negatively affected by the economy has slightly decreased over the last year.
©SHRM 2010 7
Examining Employee Benefits Amidst Uncertainty
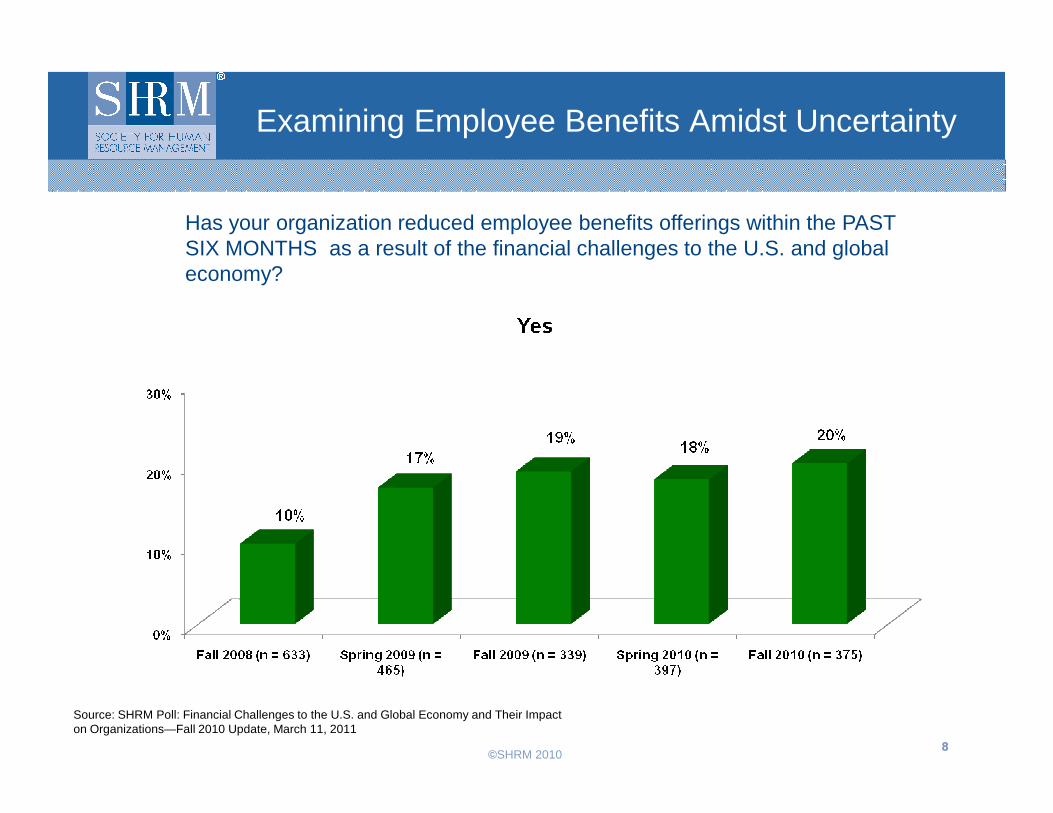
Has your organization reduced employee benefits offerings within the PAST SIX MONTHS as a result of the financial challenges to the U.S. and global economy?
©SHRM 2010 88
Source: SHRM Poll: Financial Challenges to the U.S. and Global Economy and Their Impact on Organizations—Fall 2010 Update, March 11, 2011

Examining Employee Benefits Amidst Uncertainty
What employee benefits offerings has your organization reduced, frozen or eliminated within the PAST SIX MONTHS due to the financial challenges to the U.S. and global economy? (Fall 2010)
©SHRM 2010 99
Source: SHRM Poll: Financial Challenges to the U.S. and Global Economy and Their Impact on Organizations—Fall 2010 Update, March 11, 2011
SHRM 2011 Benefits Survey
• Annual survey to gather information on the types of benefits employers offer to their employees.
• The survey instrument listed 284 benefits and asked human resource (HR) professionals to indicate whether they offered these benefits. If the HR professional reported that his or her organization did not offer the benefit, the respondent was asked if there were plans to offer the
©SHRM 2010
the benefit, the respondent was asked if there were plans to offer the benefit in the next year.
• A sample of 3,500 HR professionals was randomly selected from SHRM’s membership database of approximately 255,000 individual members at the time the survey was conducted - 3,325 e-mails were successfully delivered.
• 600 HR professionals responded, yielding a response rate of 18%. • The sample of HR professionals was representative of the SHRM
membership population.• Margin of error of 4%.
10
Section 1
Health Care and Welfare
©SHRM 2010
Health Care and Welfare Benefits
11
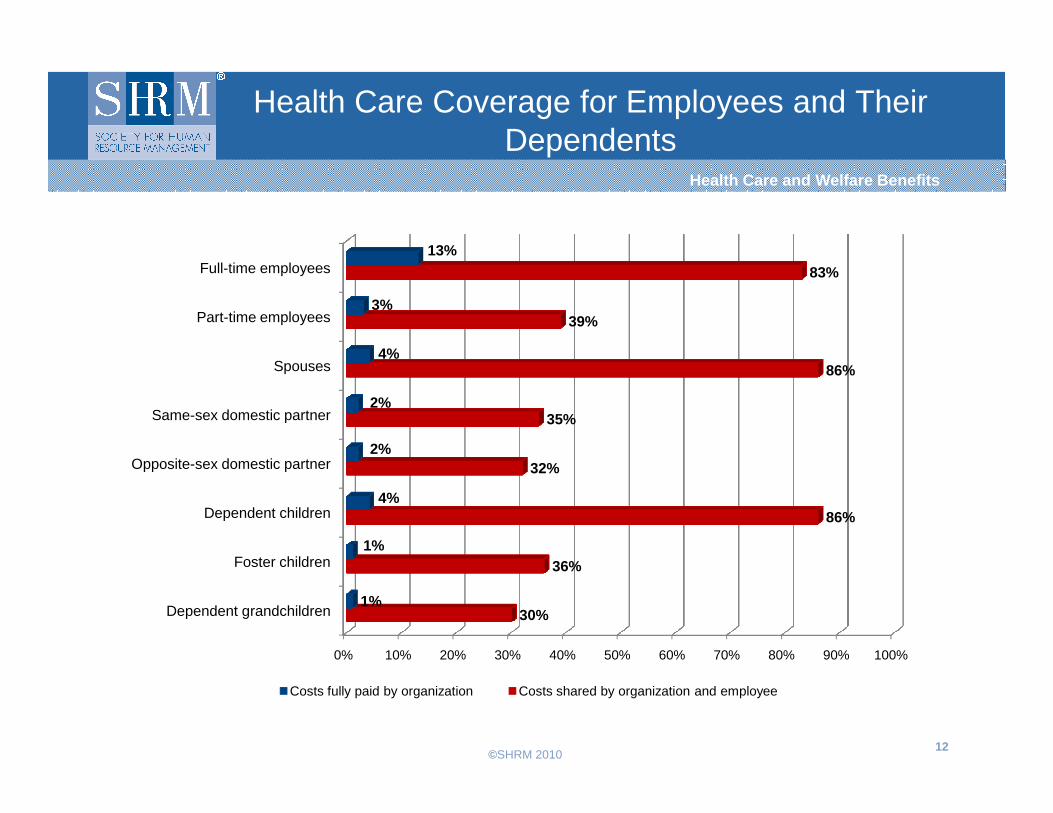
Health Care Coverage for Employees and Their Dependents
Health Care and Welfare Benefits
Same-sex domestic partner
Spouses
Part-time employees
Full-time employees
86%
39%
83%
2%
4%
3%
13%
©SHRM 2010 12
0% 10% 20% 30% 40% 50% 60% 70% 80% 90% 100%
Dependent grandchildren
Foster children
Dependent children
Opposite-sex domestic partner
Same-sex domestic partner
30%
36%
86%
32%
35%
1%
1%
4%
2%
2%
Costs fully paid by organization Costs shared by organization and employee

Health Care and Welfare BenefitsBenefits Trends
Health Care and Welfare Benefits
Health savings accounts (HSA) are growing in popularity, while HMO plans continue to decline in popularity.
©SHRM 2010 13
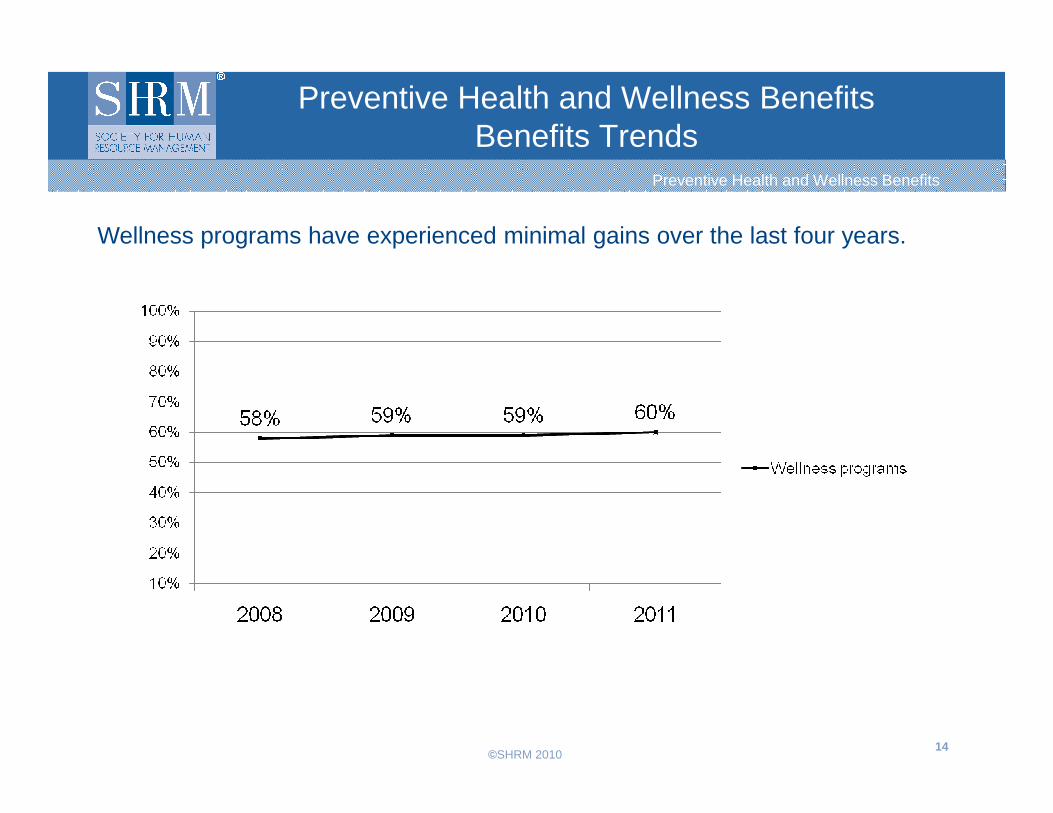
Preventive Health and Wellness BenefitsBenefits Trends
Preventive Health and Wellness Benefits
Wellness programs have experienced minimal gains over the last four years.
©SHRM 2010 14
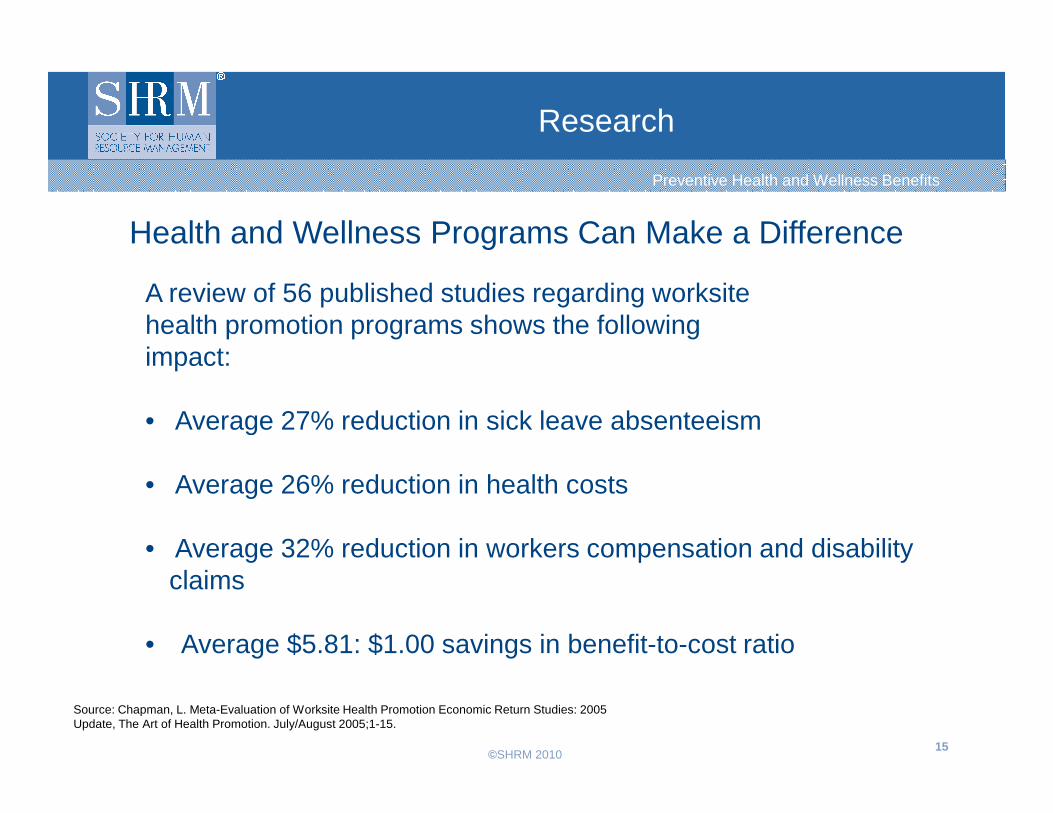
A review of 56 published studies regarding worksitehealth promotion programs shows the followingimpact:
• Average 27% reduction in sick leave absenteeism
Health and Wellness Programs Can Make a Difference
Research
Preventive Health and Wellness Benefits
©SHRM 2010 15
• Average 27% reduction in sick leave absenteeism
• Average 26% reduction in health costs
• Average 32% reduction in workers compensation and disability claims
• Average $5.81: $1.00 savings in benefit-to-cost ratio
Source: Chapman, L. Meta-Evaluation of Worksite Health Promotion Economic Return Studies: 2005 Update, The Art of Health Promotion. July/August 2005;1-15.
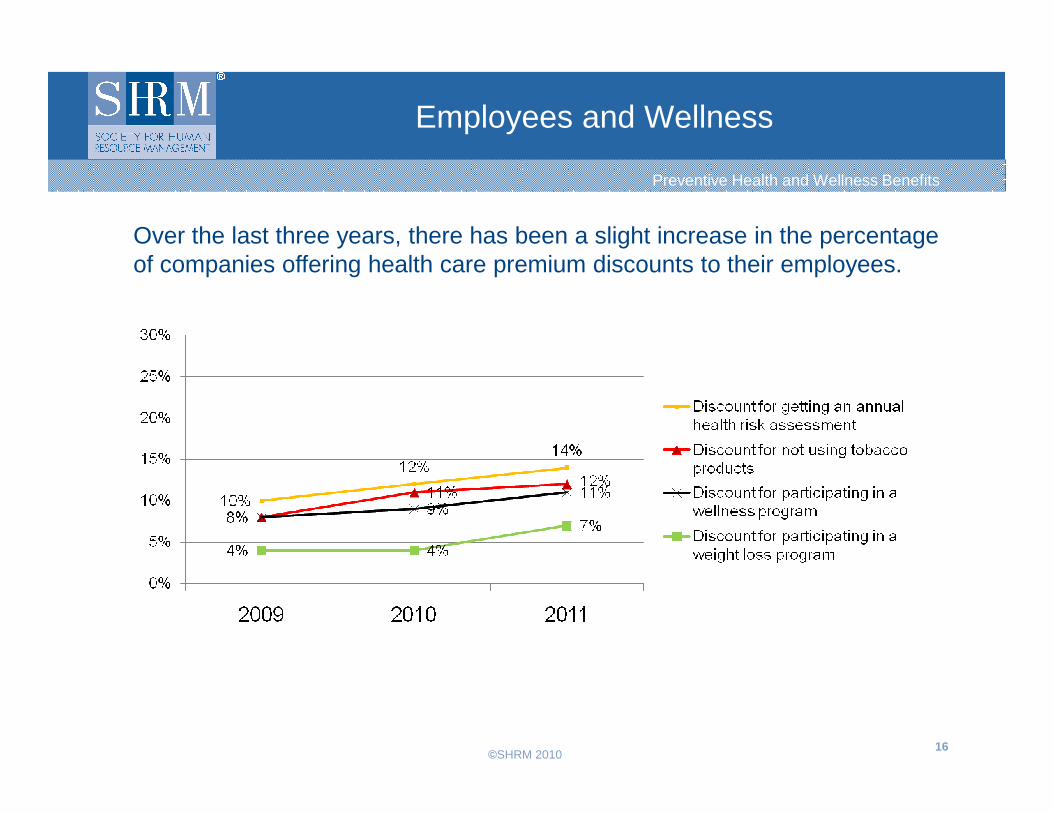
Employees and Wellness
Preventive Health and Wellness Benefits
Over the last three years, there has been a slight increase in the percentage of companies offering health care premium discounts to their employees.
©SHRM 2010 16
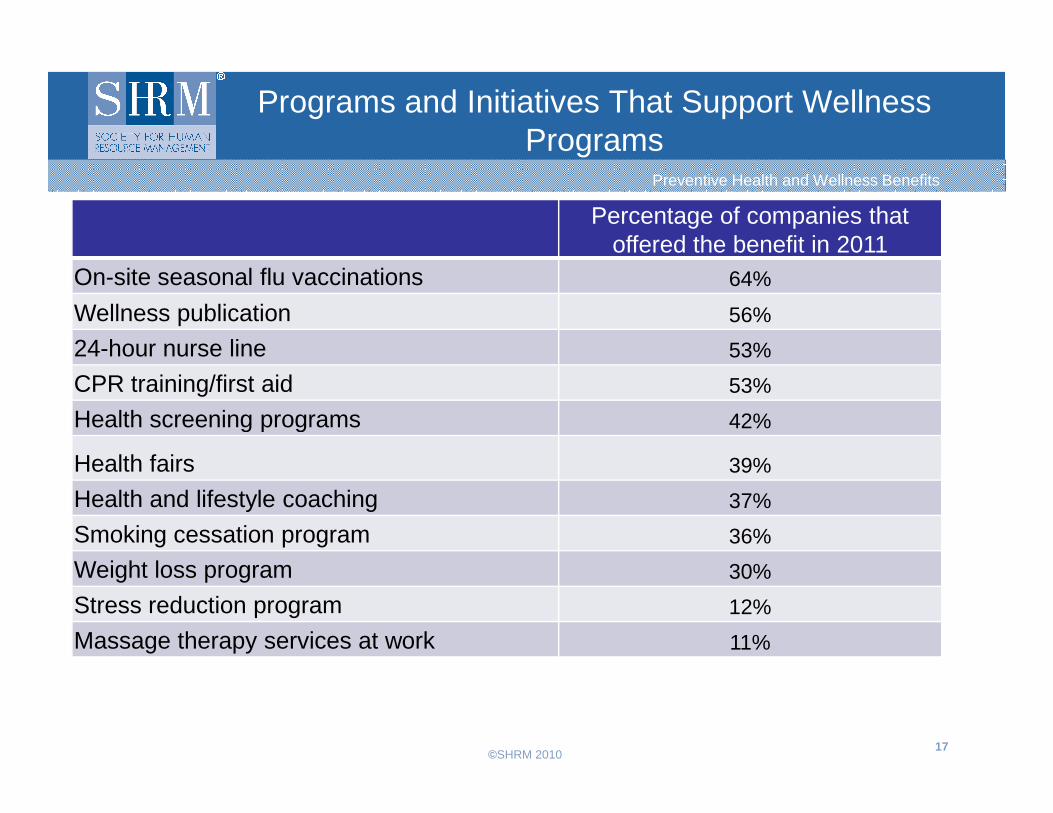
Programs and Initiatives That Support Wellness Programs
Percentage of companies that offered the benefit in 2011
On-site seasonal flu vaccinations 64%
Wellness publication 56%
24-hour nurse line 53%
CPR training/first aid 53%
Health screening programs
Preventive Health and Wellness Benefits
©SHRM 2010 17
Health screening programs 42%
Health fairs 39%
Health and lifestyle coaching 37%
Smoking cessation program 36%
Weight loss program 30%
Stress reduction program 12%
Massage therapy services at work 11%
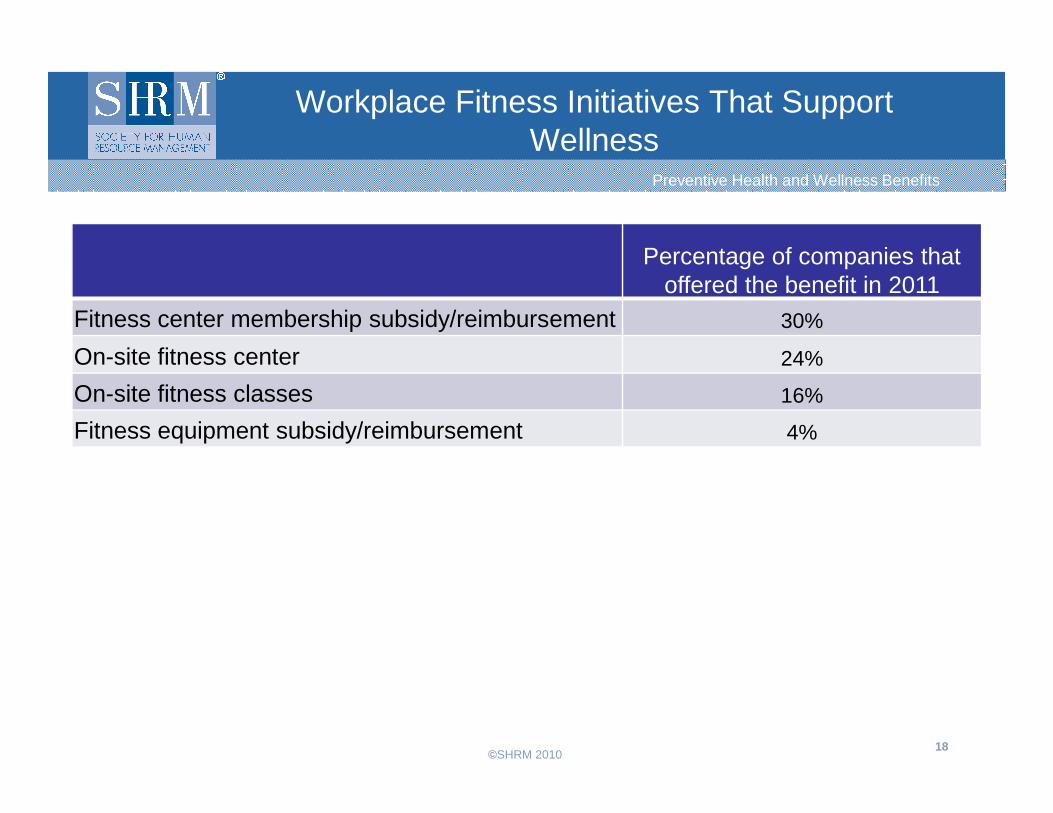
Workplace Fitness Initiatives That Support Wellness
Percentage of companies that offered the benefit in 2011
Fitness center membership subsidy/reimbursement 30%
On-site fitness center 24%
On-site fitness classes 16%
Preventive Health and Wellness Benefits
©SHRM 2010 18
16%
Fitness equipment subsidy/reimbursement 4%
Section 2
Retirement Savings
©SHRM 2010 19
Retirement Savings and Planning Benefits
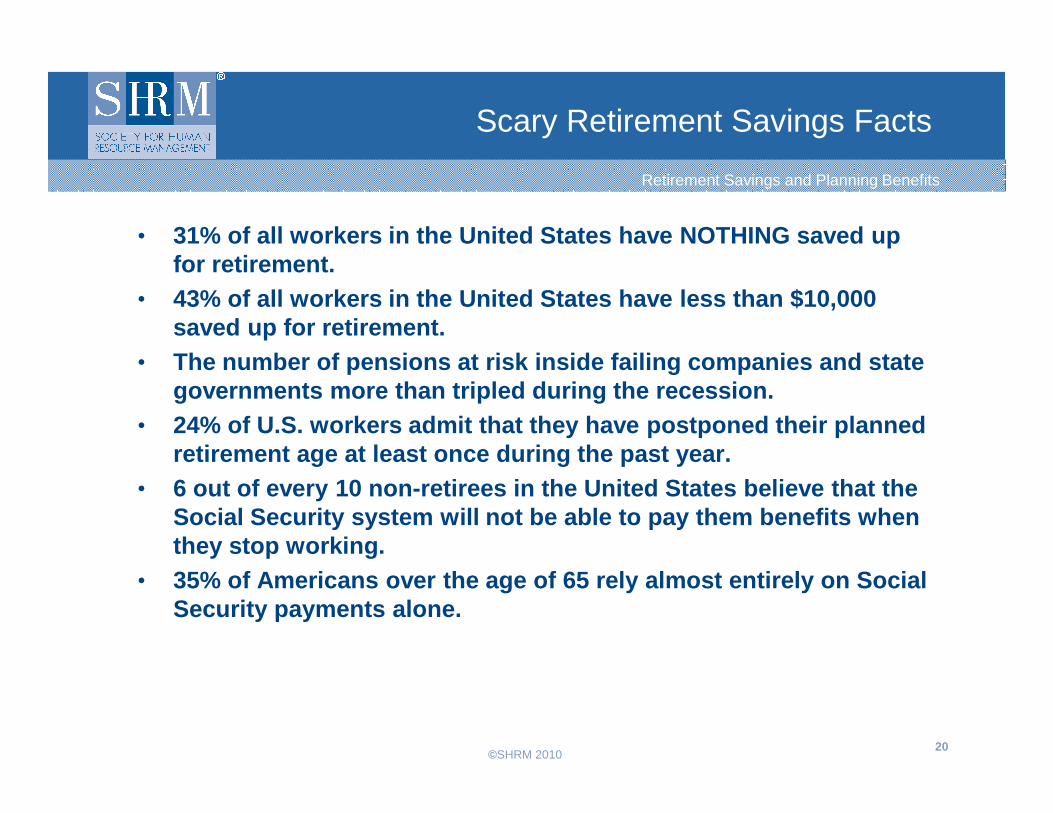
Scary Retirement Savings Facts
• 31% of all workers in the United States have NOTHIN G saved up for retirement.
• 43% of all workers in the United States have less t han $10,000 saved up for retirement.
• The number of pensions at risk inside failing compa nies and state governments more than tripled during the recession.
Retirement Savings and Planning Benefits
©SHRM 2010
• 24% of U.S. workers admit that they have postponed their planned retirement age at least once during the past year.
• 6 out of every 10 non-retirees in the United States believe that the Social Security system will not be able to pay them benefits when they stop working.
• 35% of Americans over the age of 65 rely almost ent irely on Social Security payments alone.
20
350,000
400,000
450,000
65+
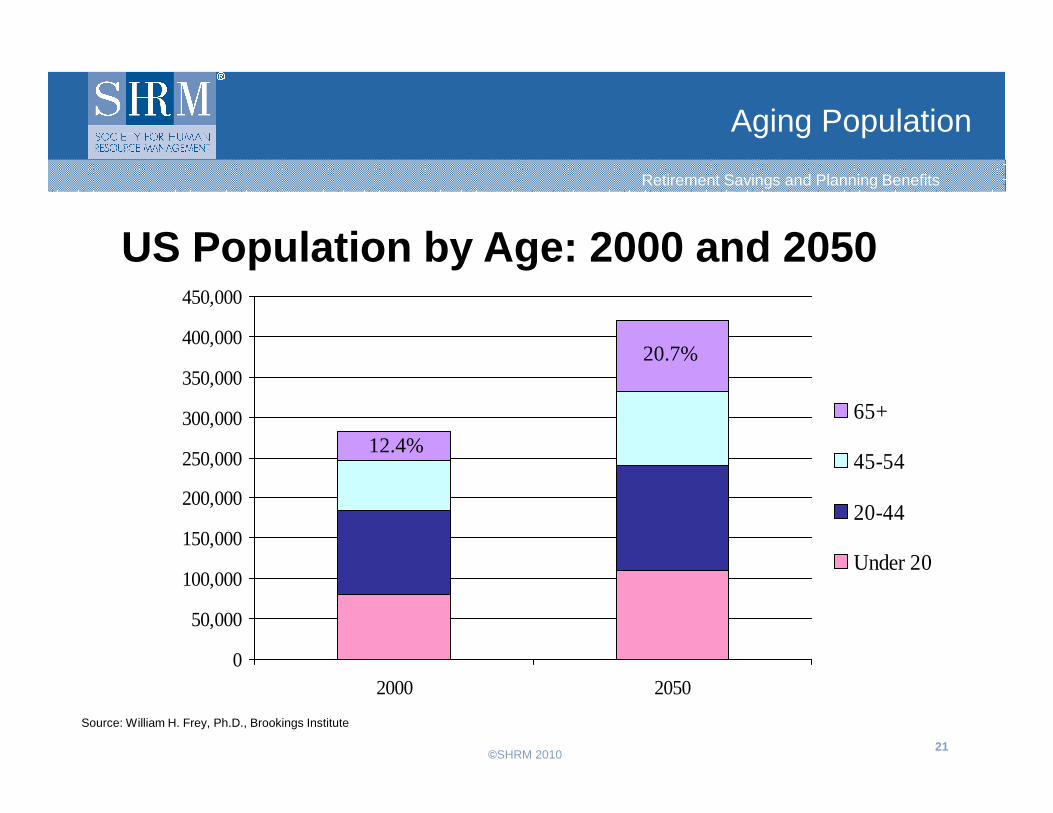
US Population by Age: 2000 and 2050
Aging Population
20.7%
Retirement Savings and Planning Benefits
©SHRM 2010 21
0
50,000
100,000
150,000
200,000
250,000
300,000
2000 2050
65+
45-54
20-44
Under 20
Source: William H. Frey, Ph.D., Brookings Institute
12.4%
Retirement Savings and Planning Benefits Trends
Retirement Savings and Planning Benefits
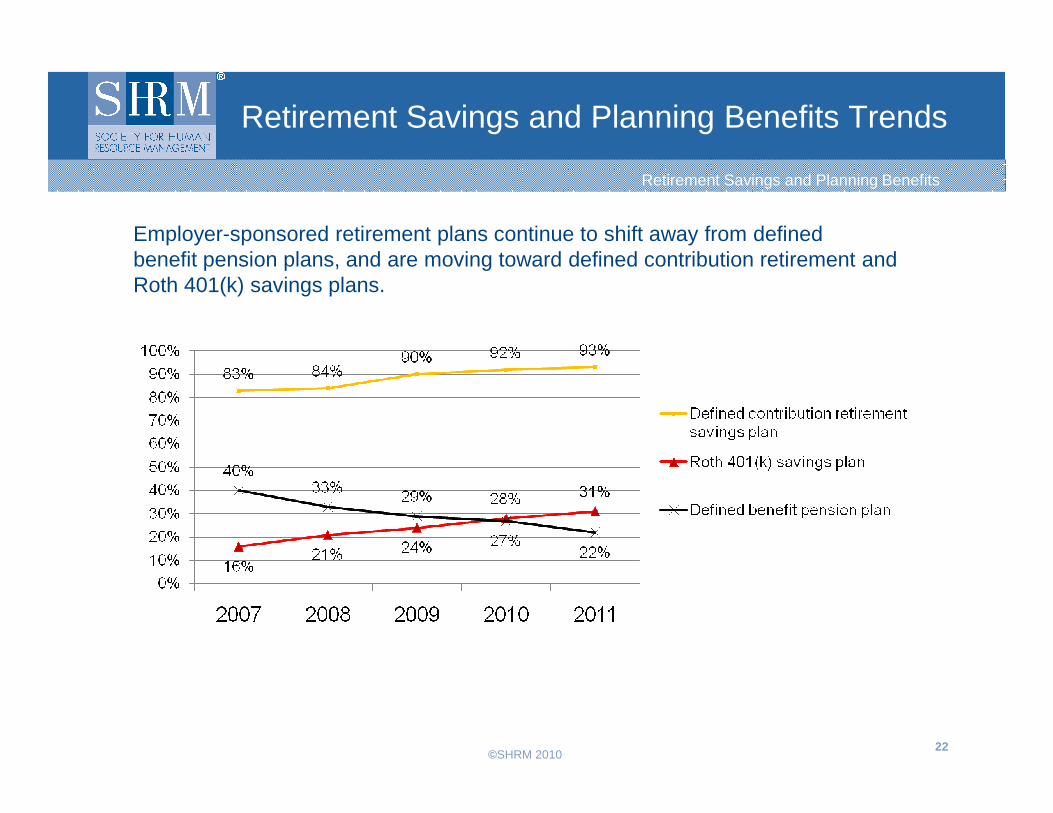
Employer-sponsored retirement plans continue to shift away from defined benefit pension plans, and are moving toward defined contribution retirement and Roth 401(k) savings plans.
©SHRM 2010 22
Retirement Savings and Planning Benefits Trends
Retirement Savings and Planning Benefits
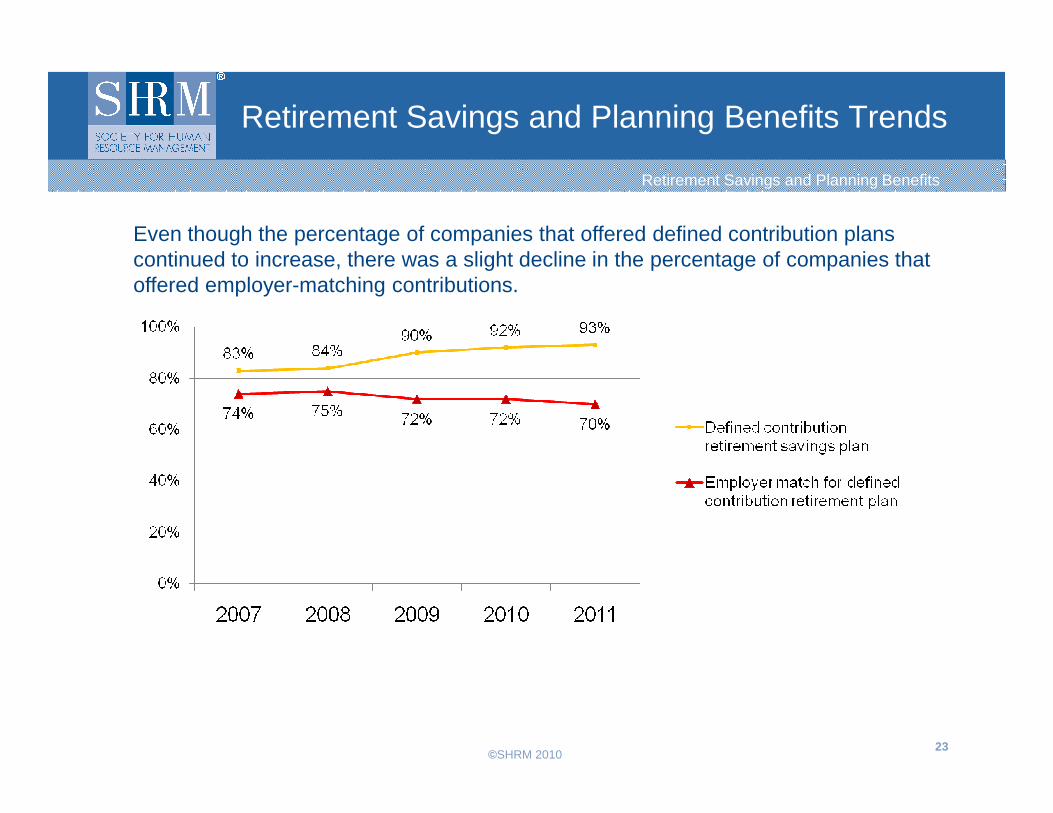
Even though the percentage of companies that offered defined contribution plans continued to increase, there was a slight decline in the percentage of companies that offered employer-matching contributions.
©SHRM 2010 23
Section 3
Other Benefit Trends
©SHRM 2010 24
Other Benefit Trends
Leave Benefits Trends
Leave Benefits
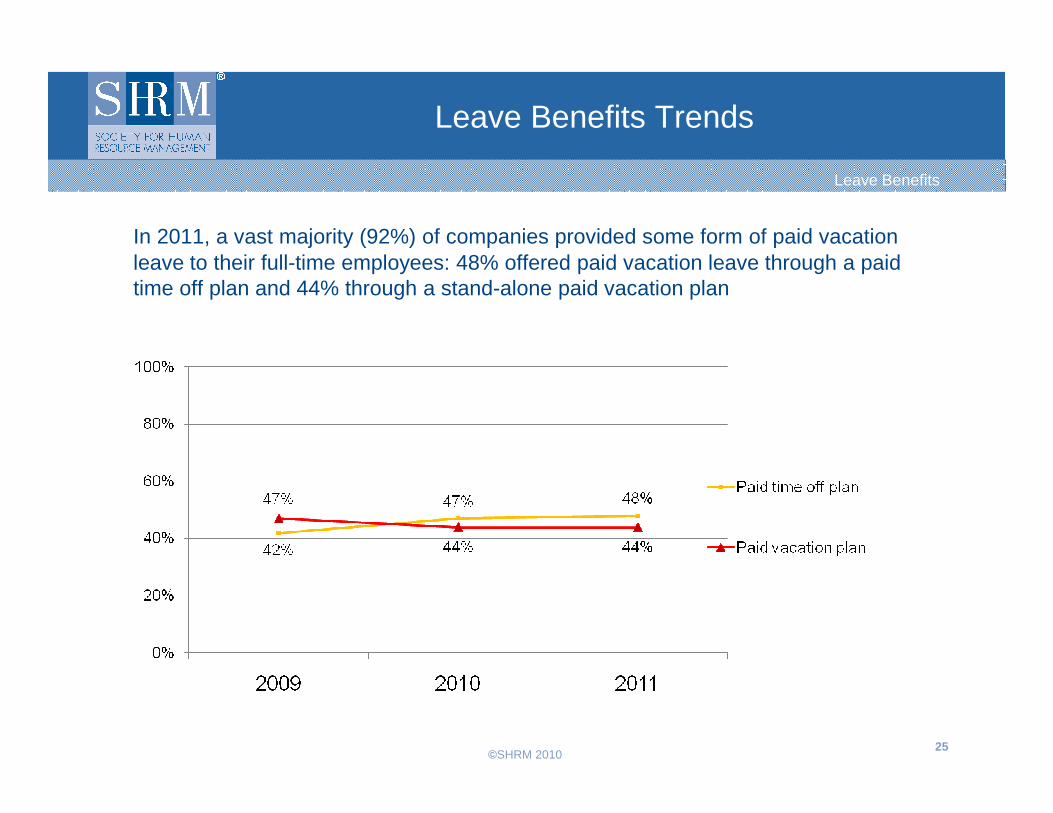
In 2011, a vast majority (92%) of companies provided some form of paid vacation leave to their full-time employees: 48% offered paid vacation leave through a paid time off plan and 44% through a stand-alone paid vacation plan
©SHRM 2010 25
Educational Assistance Benefits Trends
Educational Assistance Benefits
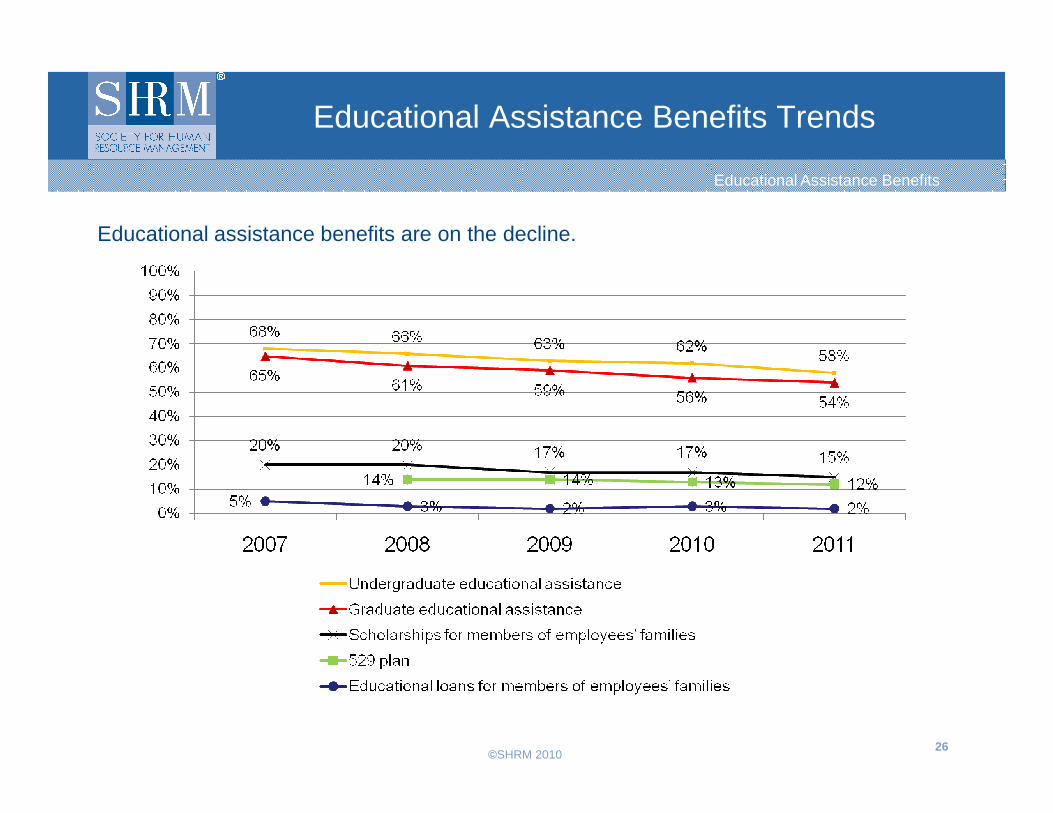
Educational assistance benefits are on the decline.
©SHRM 2010 26
Financial and Compensation Benefits Trends
Financial and Compensation Benefits
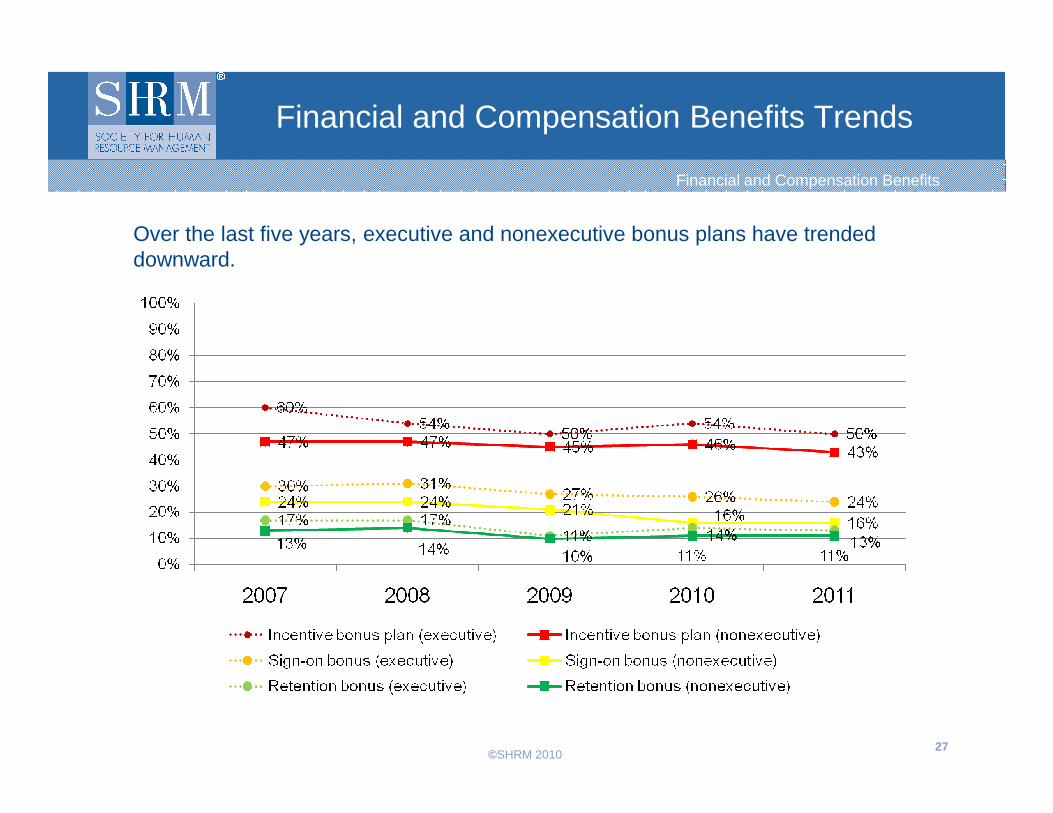
Over the last five years, executive and nonexecutive bonus plans have trended downward.
©SHRM 2010 27
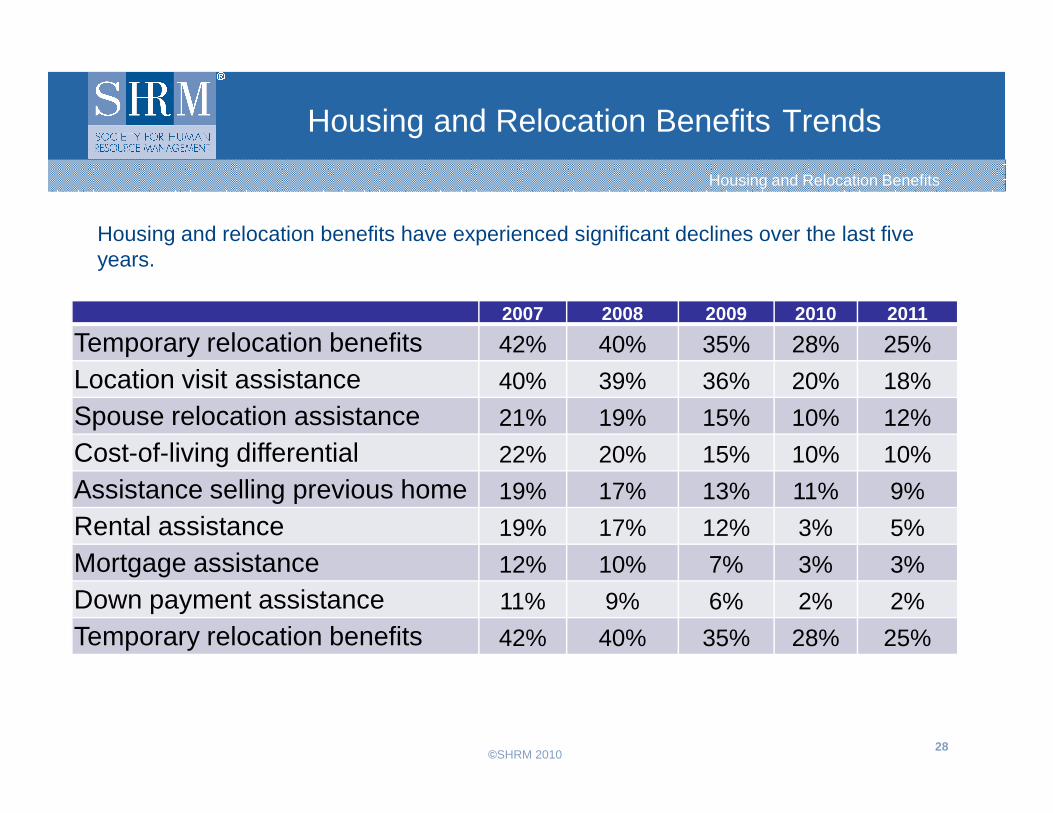
Housing and Relocation Benefits Trends
2007 2008 2009 2010 2011
Temporary relocation benefits 42% 40% 35% 28% 25%
Location visit assistance 40% 39% 36% 20% 18%
Spouse relocation assistance 21% 19% 15% 10% 12%
Housing and Relocation Benefits
Housing and relocation benefits have experienced significant declines over the last five years.
©SHRM 2010 28
Spouse relocation assistance 21% 19% 15% 10% 12%
Cost-of-living differential 22% 20% 15% 10% 10%
Assistance selling previous home 19% 17% 13% 11% 9%
Rental assistance 19% 17% 12% 3% 5%
Mortgage assistance 12% 10% 7% 3% 3%
Down payment assistance 11% 9% 6% 2% 2%
Temporary relocation benefits 42% 40% 35% 28% 25%
Flexible Working Benefits Are an Important Aspect of Job Satisfaction
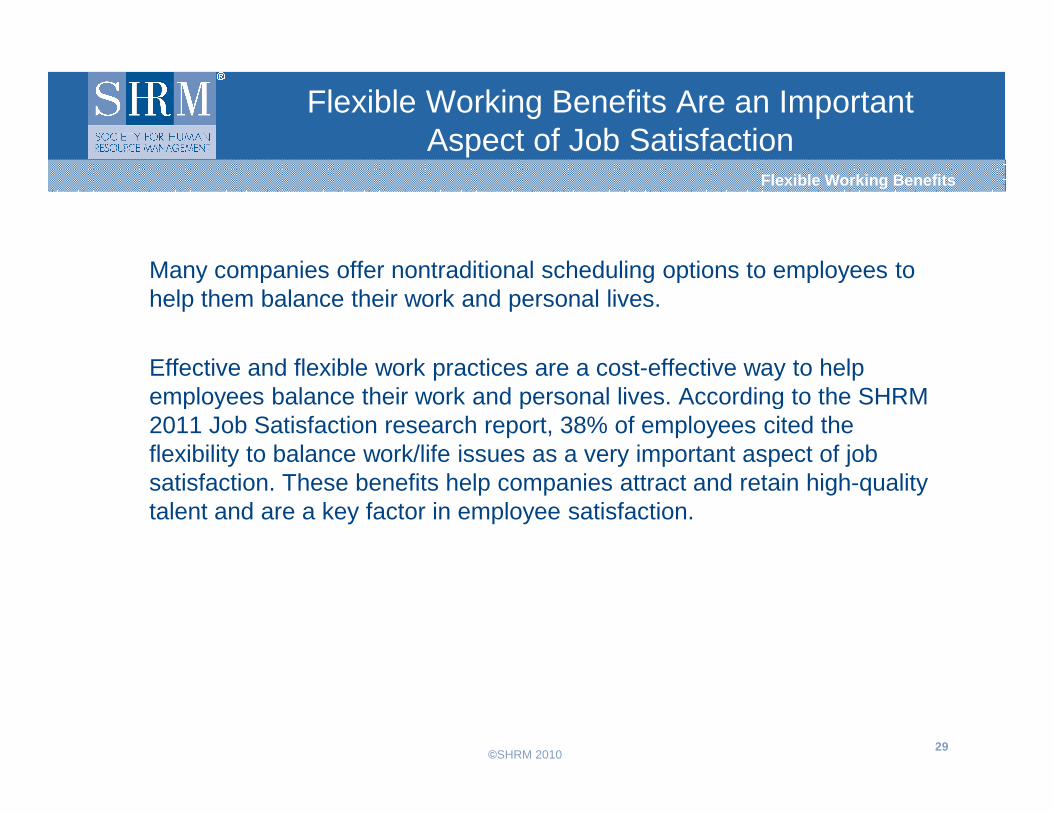
Many companies offer nontraditional scheduling options to employees to help them balance their work and personal lives.
Effective and flexible work practices are a cost-effective way to help employees balance their work and personal lives. According to the SHRM
Flexible Working Benefits
©SHRM 2010 29
employees balance their work and personal lives. According to the SHRM 2011 Job Satisfaction research report, 38% of employees cited the flexibility to balance work/life issues as a very important aspect of job satisfaction. These benefits help companies attract and retain high-quality talent and are a key factor in employee satisfaction.
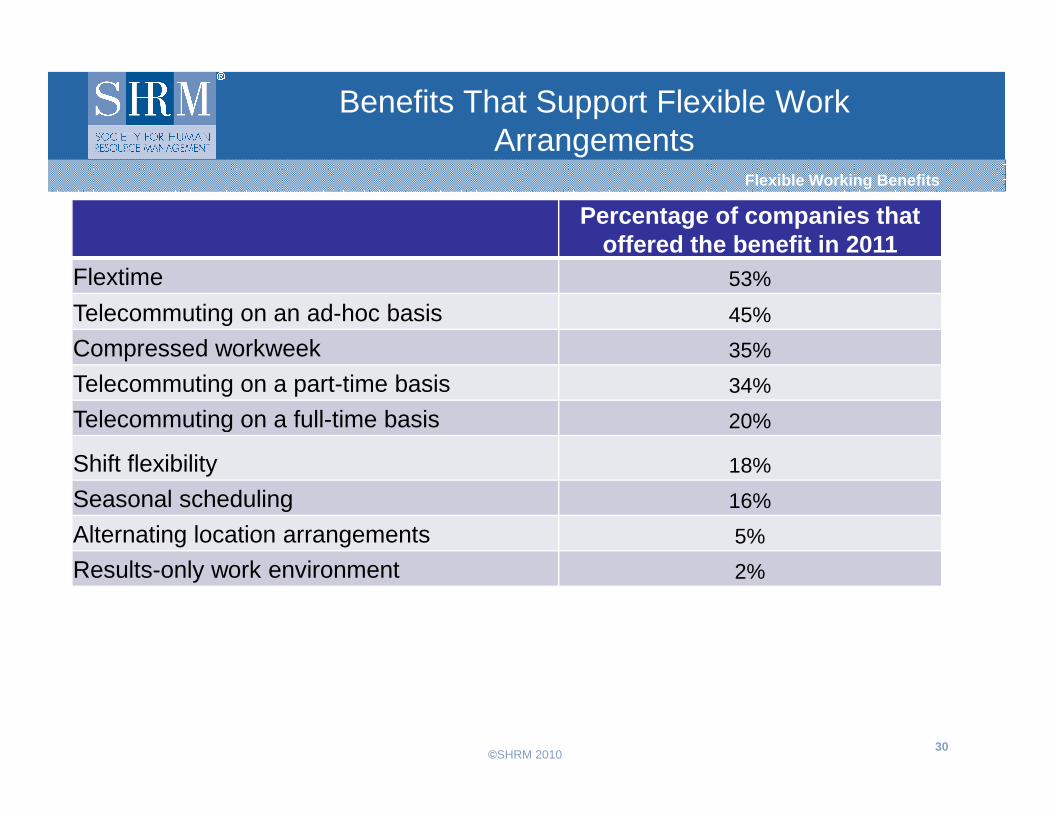
Benefits That Support Flexible Work Arrangements
Percentage of companies that offered the benefit in 2011
Flextime 53%
Telecommuting on an ad-hoc basis 45%
Compressed workweek 35%
Telecommuting on a part-time basis 34%
Telecommuting on a full-time basis
Flexible Working Benefits
©SHRM 2010 30
Telecommuting on a full-time basis 20%
Shift flexibility 18%
Seasonal scheduling 16%
Alternating location arrangements 5%
Results-only work environment 2%
Strategies
Ten Benefit Strategies
©SHRM 2010 31
Ten Benefit Strategies
Employee Benefits Strategies to Keep Your Organization Competitive
1. Monitor legislation and its potential impact
HR professionals should continually monitor changes in legislation to make sure their benefits programs are compliant with local, state and federal laws. Health care reform law in particular will affect how all organizations administer health care benefits. This new law is extremely complex, and some of its parts have already
©SHRM 2010 32
benefits. This new law is extremely complex, and some of its parts have already been executed, while others will be implemented over the next several years. HR professionals will be relied upon to lead their organizations through this complex legislation.
.
.
Employee Benefits Strategies to Keep Your Organization Competitive
2. Conduct Quantitative and Employeee Opinion Analy ses
Financial officers think in numbers, while HR tends to think about employee impacts. You need to consider both positions in making the best evidence-based management decisions.
©SHRM 2010 33
Example
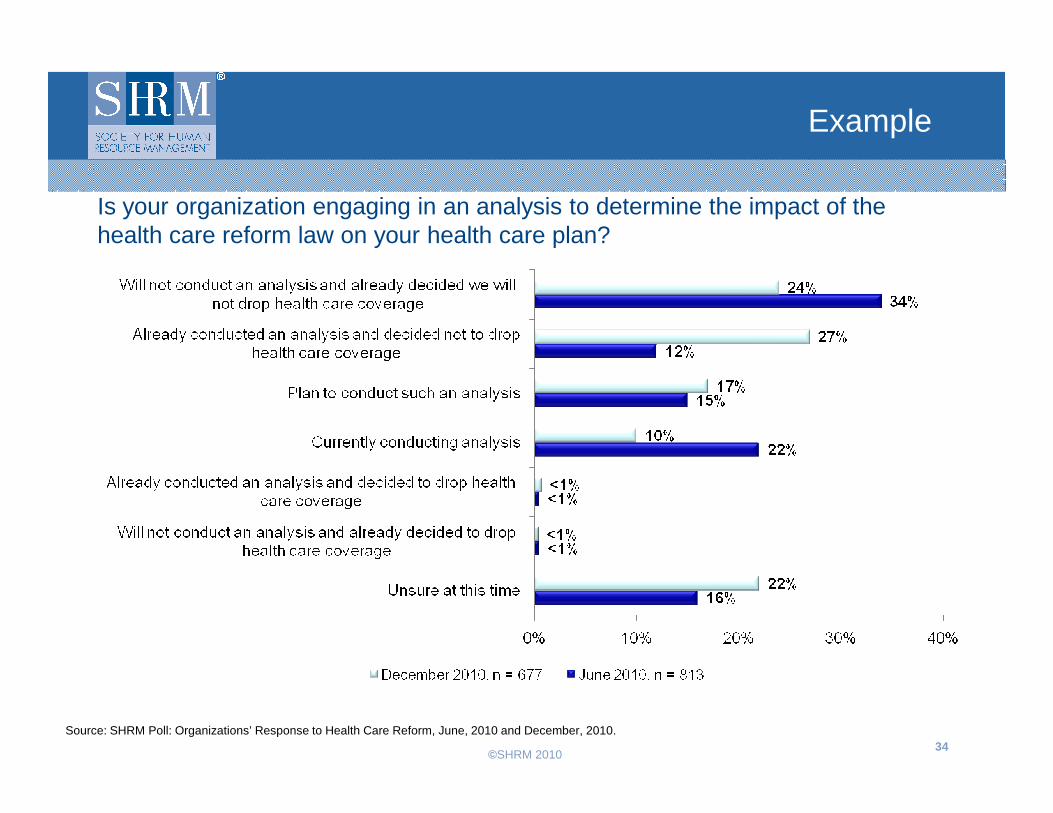
Is your organization engaging in an analysis to determine the impact of the health care reform law on your health care plan?
©SHRM 2010 34
Source: SHRM Poll: Organizations’ Response to Health Care Reform, June, 2010 and December, 2010.
Example
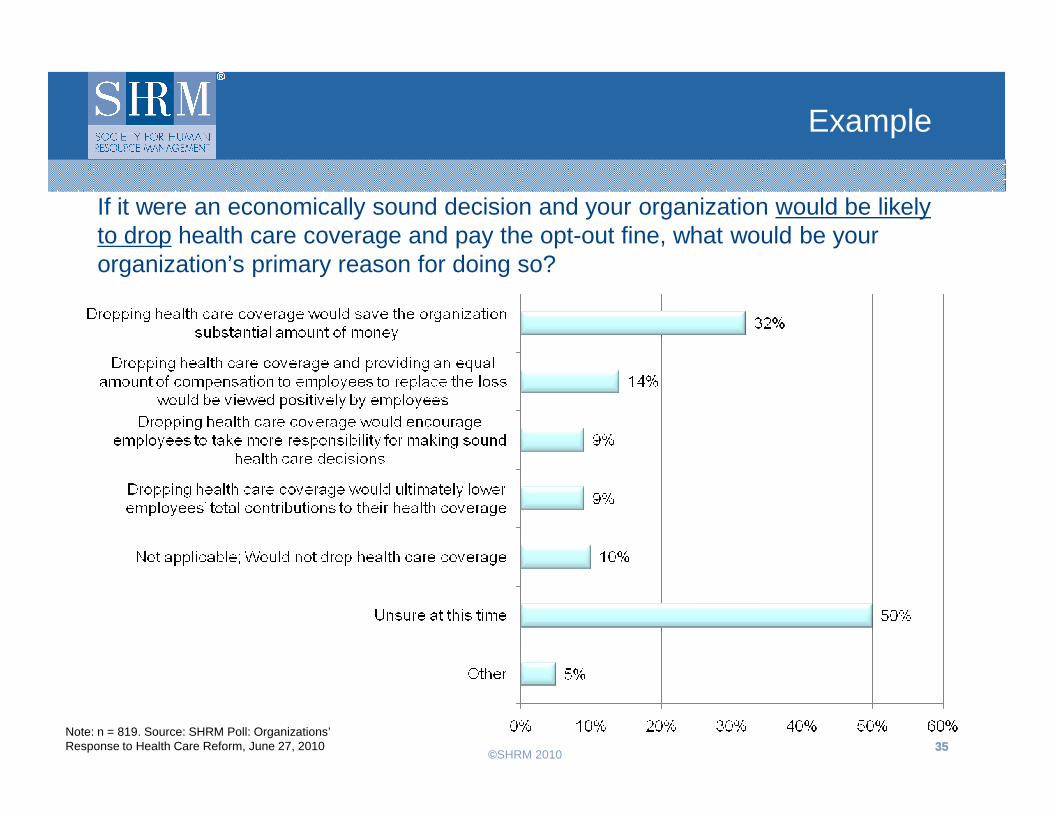
If it were an economically sound decision and your organization would be likely to drop health care coverage and pay the opt-out fine, what would be your organization’s primary reason for doing so?
©SHRM 2010 3535
Note: n = 819. Source: SHRM Poll: Organizations’ Response to Health Care Reform, June 27, 2010
Example
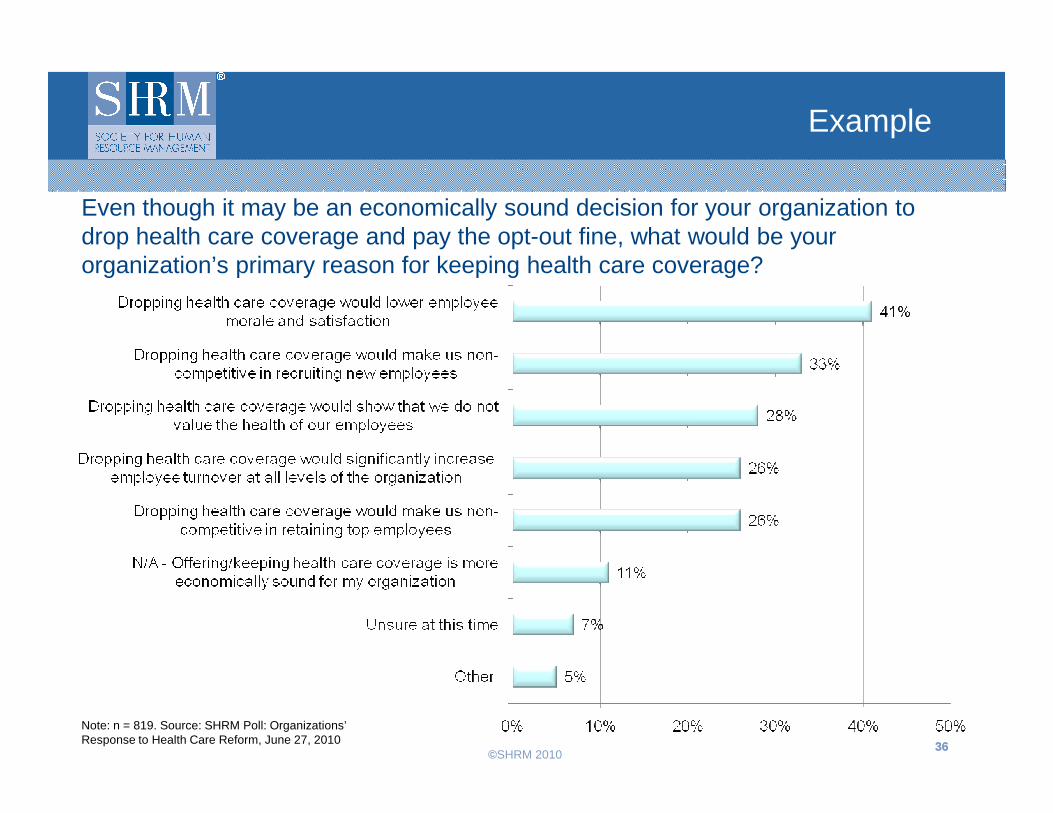
Even though it may be an economically sound decision for your organization to drop health care coverage and pay the opt-out fine, what would be your organization’s primary reason for keeping health care coverage?
©SHRM 2010 3636
Note: n = 819. Source: SHRM Poll: Organizations’ Response to Health Care Reform, June 27, 2010
Employee Benefits Strategies to Keep Your Organization Competitive
3. Evaluate your benefits program frequently
An organization’s benefits program should be evaluated not only to monitor associated costs and compliance with governmental requirements, but also to evaluate the competitiveness in the marketplace. A well-designed employee program responds to employees’ needs and supports an organization's ability to
©SHRM 2010 37
program responds to employees’ needs and supports an organization's ability to attract and retain talent.
� More than three-quarters of organizations in this study reported that their organizations reviewed their benefits programs at least once a year. Benchmarking data, benefits needs assessments and employee surveys are great tools organizations can use to help tailor their benefits programs to meet their needs and to remain competitive.
.
Employee Benefits Strategies to Keep Your Organization Competitive
4. Encourage greater use of prevention, promotion and wellness programs
As the costs of health care continue to spiral upward, employees and employers are searching for ways to keep these costs under control and as manageable as possible. Preventive health and wellness benefits are
©SHRM 2010 38
as manageable as possible. Preventive health and wellness benefits are designed to help maintain or change employees' behavior in order to achieve better health and decrease the associated health risks. By preventing or lessening the incidence of health conditions, companies will save on long-term health costs.
.
Employee Benefits Strategies to Keep Your Organization Competitive
5. Communication is vital
According to SHRM’s job satisfaction and engagement research, employees consistently ranked benefits among their top contributors to job satisfaction. However, a disconnect exists between the dollar amount organizations spend on benefits and the employees’ perception of the value of their benefits package. It is
©SHRM 2010 39
benefits and the employees’ perception of the value of their benefits package. It is important that HR professionals help employees fully understand all of their options and the true value of their benefits package.
� Total compensation statements, benefits workshops, employee meetings and social networking tools are examples of communication methods that organizations can use to help ensure their benefits program is valued, understood and used by employees.
Employee Benefits Strategies to Keep Your Organization Competitive
6. Effective and flexible work practices can be eff ective benefits to attract and retain
As noted earlier, HR professionals are finding this one of the most valuable tactics in recruiting and retaining talent. Work-life fit is also among the top 10 most important drivers of job satisfaction in SHRMs annual job satisfaction
©SHRM 2010 40
most important drivers of job satisfaction in SHRMs annual job satisfaction survey.
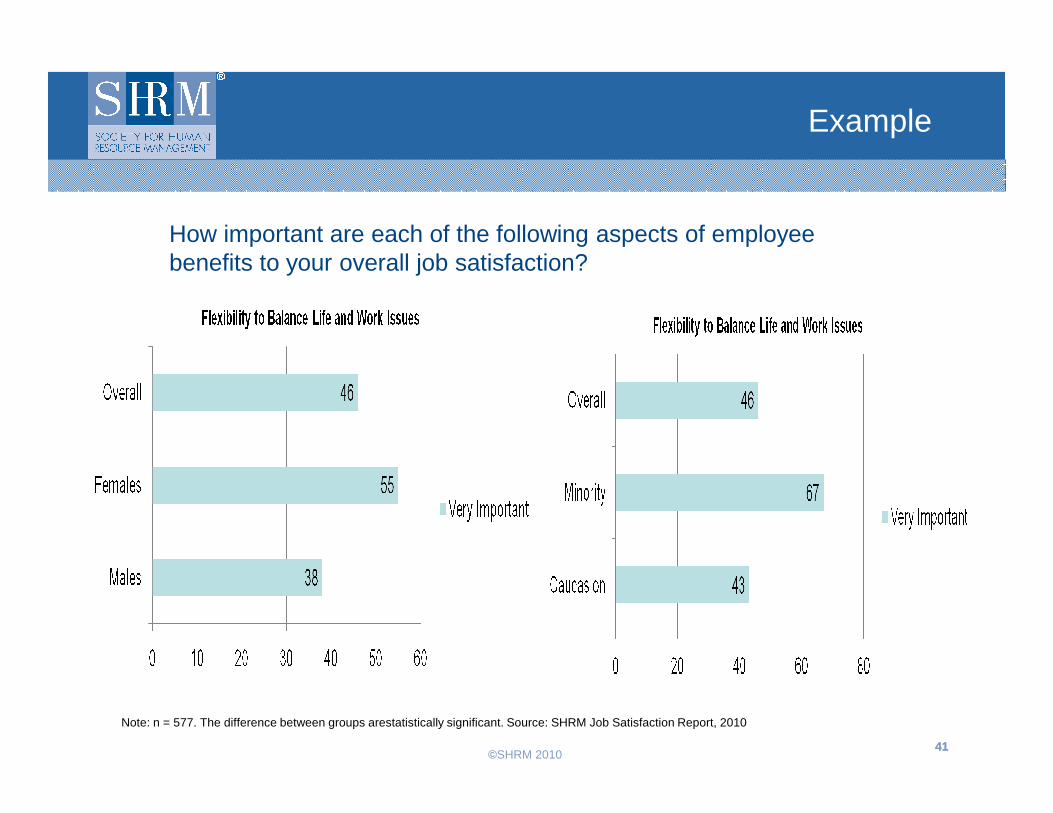
Example
How important are each of the following aspects of employee benefits to your overall job satisfaction?
©SHRM 2010 4141
Note: n = 577. The difference between groups arestatistically significant. Source: SHRM Job Satisfaction Report, 2010
7. Flexible work practices can often be implemented without major investments
Given the reductions in benefit budgets, workplace flexibility practices can be used as an offset benefit for increased costs of benefits contributed by employees or the total elimination of some benefits.
Employee Benefits Strategies to Keep Your Organization Competitive
©SHRM 2010 42
employees or the total elimination of some benefits.
However, there are some workplace flexibility programs that do require major investments, but can also result in major cost savings. Again, you have to do both the financial and employee data analyses to justify these programs.
Examples:- Hospital Nurse Scheduling Software- Closure of an entire building- Upgrade to bandwidth of incoming intranet access
Employee Benefits Strategies to Keep Your Organization Competitive
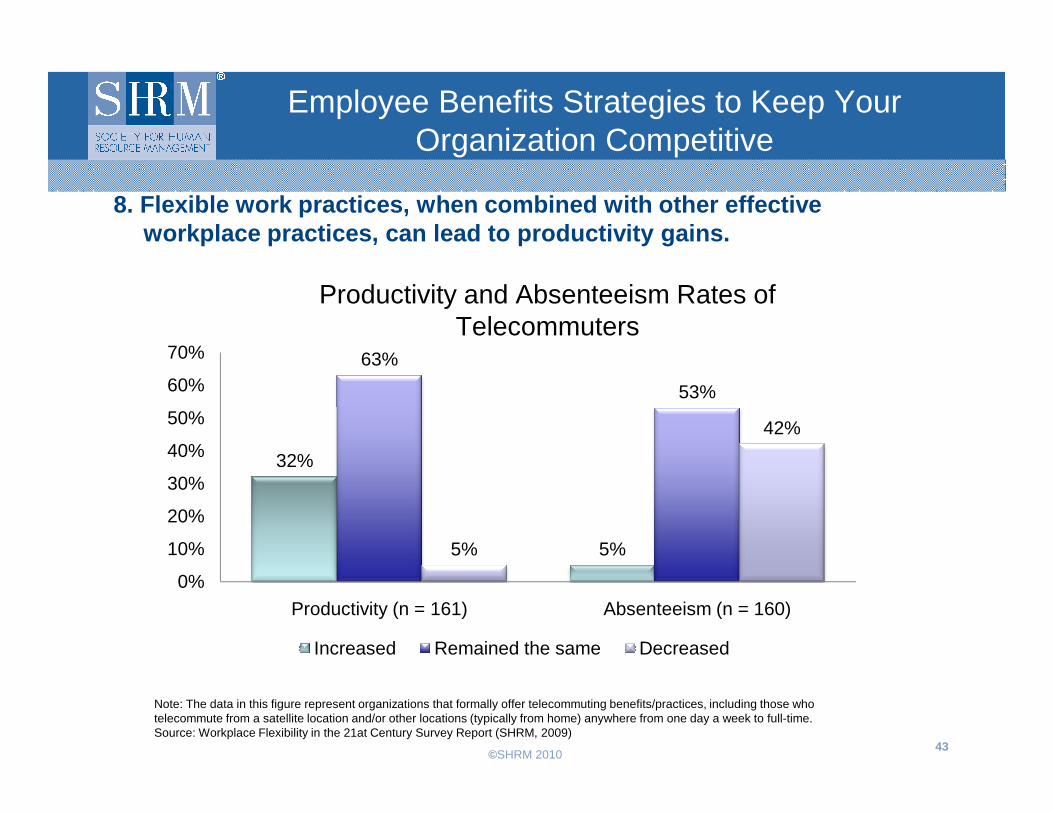
8. Flexible work practices, when combined with othe r effective workplace practices, can lead to productivity gains .
63%
53%60%
70%
Productivity and Absenteeism Rates of Telecommuters
©SHRM 2010 43
32%
5%5%
42%
0%
10%
20%
30%
40%
50%
Productivity (n = 161) Absenteeism (n = 160)
Increased Remained the same Decreased
Note: The data in this figure represent organizations that formally offer telecommuting benefits/practices, including those who telecommute from a satellite location and/or other locations (typically from home) anywhere from one day a week to full-time. Source: Workplace Flexibility in the 21at Century Survey Report (SHRM, 2009)
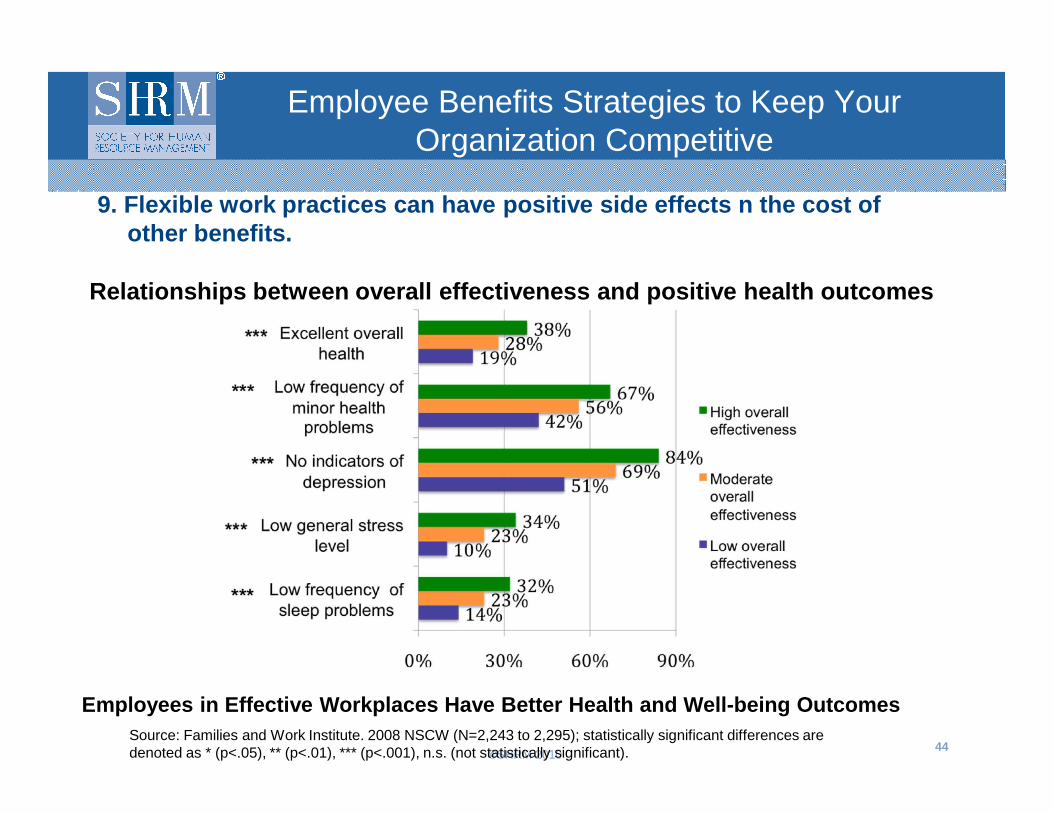
9. Flexible work practices can have positive side ef fects n the cost of other benefits.
Employee Benefits Strategies to Keep Your Organization Competitive
Relationships between overall effectiveness and pos itive health outcomes
©SHRM 2010 44
Source: Families and Work Institute. 2008 NSCW (N=2,243 to 2,295); statistically significant differences are denoted as * (p<.05), ** (p<.01), *** (p<.001), n.s. (not statistically significant).
Employees in Effective Workplaces Have Better Healt h and Well-being Outcomes
10. Benefits decisions must be considered in the co ntext of the corporate culture and workplace practices to be mos t effective.
There needs to be alignment of benefit practices and policies with the environment in which they exist.
Employee Benefits Strategies to Keep Your Organization Competitive
©SHRM 2010 45
Example
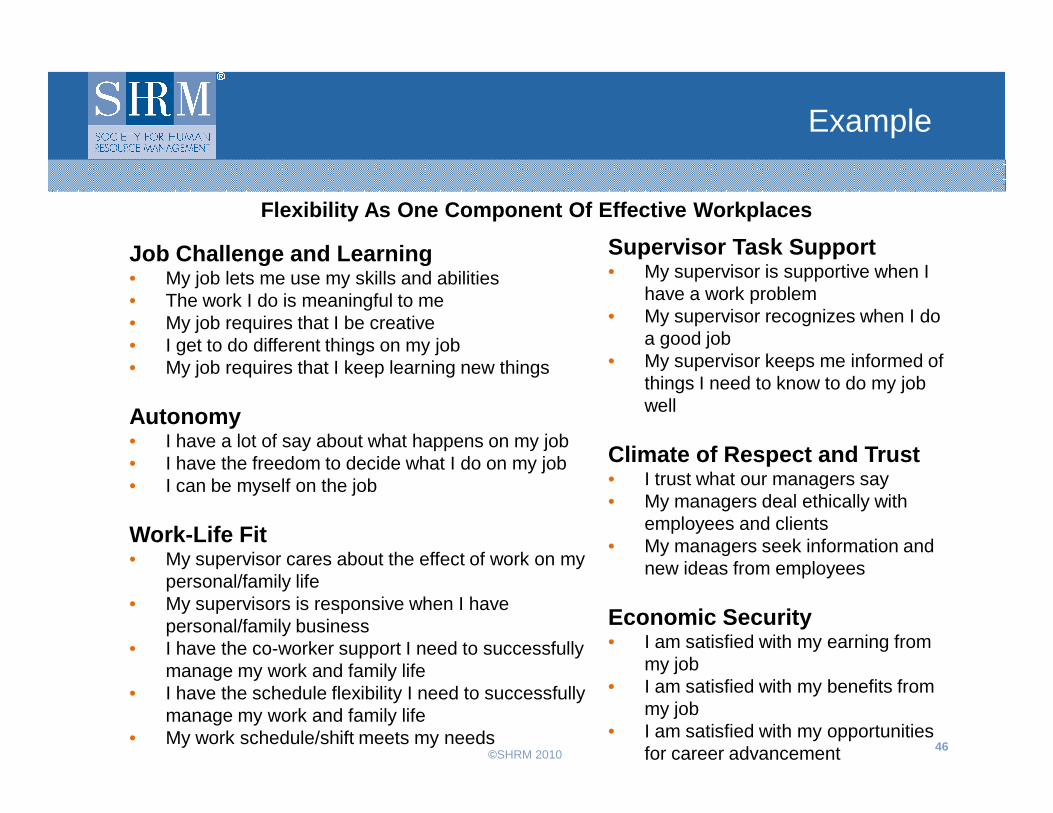
Flexibility As One Component Of Effective Workplace s
Job Challenge and Learning• My job lets me use my skills and abilities• The work I do is meaningful to me• My job requires that I be creative• I get to do different things on my job• My job requires that I keep learning new things
Autonomy
Supervisor Task Support• My supervisor is supportive when I
have a work problem• My supervisor recognizes when I do
a good job• My supervisor keeps me informed of
things I need to know to do my job well
©SHRM 2010 46
Autonomy• I have a lot of say about what happens on my job• I have the freedom to decide what I do on my job• I can be myself on the job
Work-Life Fit• My supervisor cares about the effect of work on my
personal/family life• My supervisors is responsive when I have
personal/family business• I have the co-worker support I need to successfully
manage my work and family life• I have the schedule flexibility I need to successfully
manage my work and family life• My work schedule/shift meets my needs
well
Climate of Respect and Trust• I trust what our managers say• My managers deal ethically with
employees and clients• My managers seek information and
new ideas from employees
Economic Security• I am satisfied with my earning from
my job• I am satisfied with my benefits from
my job• I am satisfied with my opportunities
for career advancement
Employee Benefits: Just How Competitive is Your Company?
©SHRM 2010 47
Questions?