Embed Size (px)
Citation preview

1
Employee Rights and Dividend Policy around the World
Bing Yu*
Associate Professor of Finance
School of Business
Meredith College
3800 Hillsborough St.
Raleigh, NC 27607
Shengxiong Wu
Assistant Professor of Finance
School of Business
Texas Wesleyan University
Fort Worth, TX 76105
Submitted to: European Financial Management Association Annual Meeting
January 2017
* Corresponding and presenting author
Employee Rights and Dividend Policy around the World
Abstract
This paper explores the relationship between employee rights and dividend policy across countries.
Using labor right index as a proxy for agency costs of employees, we test the association between
labor rights and dividend policies across countries. The empirical results reveal that labor rights are
negatively related to firms’ decision to pay dividends and dividend payment amounts. This
relationship is reinforced to be more salient in civil countries where shareholder rights are weak.
The empirical results are robust by controlling for test model specification, and a series of country-
level control variables.
Keywords: Dividends, International, Agency Costs, Corporate Governance, Labor Right
EFM Classification Code: 110, 150, 170, 170, 750.
3
Employee Rights and Dividend Policy around the World
Introduction
Under the agency costs hypothesis, dividends, along with corporate governance mechanisms,
are used to reduce agency costs and thus improve firm value. The extensive research investigates
how dividends can be used as a tool to mitigate agency costs of managers which result from the
interest conflict between shareholders and managers. While the interest conflict between
shareholders and managers is the major focus of corporate governance pattern in Anglo-Saxon
countries, different corporate governance mechanisms exist in many other countries. Therefore, the
agent-principal conflicts might be different in other countries as well. In additional to agency
problems of managers, agency problems of employees are quite salient in some countries. This
paper examines the relationship between agency costs of employees and dividend policy across
countries, using labor right as a proxy for agency costs of employees.
Essentially, the dividend is a vehicle through which companies distribute wealth and
investors realize investment return. Firms also pay dividends for corporate governance purpose
such as to reduce agency costs and to provide a signal to outsiders. Companies operate in various
business environments under different societal institutions. In each society, to maximize their own
benefits, various stakeholders such as shareholders, managers, workers, and creditors will utilize
their influence to take part in wealth distribution. With regard to dividends, those influences will
be applied on either supply or demand side of dividends. Dividend policy is a consequence of the
interaction between supply and demand of dividends. When this interaction reaches its equilibrium
point, dividend policy is determined. When this equilibrium point is reached, the powers of various
interest groups are also balanced. Therefore, for across country analysis, to study dividend policy
is to explore the interaction among various interest groups and to examine how that interaction
affects supply and demand of dividends.
In different institutional environments, interest groups of firms have different influence in
corporation decision makings. For example, through a survey, Allen (2009) finds that ninety-seven
percent of Japanese managers, fifty-nine percent of German managers, and sixty percent French
managers believe employees’ job security is more important than dividends while only eleven
percent of American managers and ten percent of British managers have this belief. To shed light
on the essentials of corporate finance decision makings around the world, we need to explore each
stakeholder’s role in corporate finance. While the impacts of managers and creditors on dividend
policy are well studied, the role of employees in dividend policy across countries remains
unrevealed.
When employees in Germany and Japan can influence corporate decision making directly
through their seats in corporation boards, not every country in the world has such a codetermination
corporate governance mechanism. Consequently, employees in countries without codetermination
corporate governance devices will seek alternatives inside and outside companies to protect their
interests. Within a firm, employees can protect themselves through organizing unions, negotiate
individually for better terms, or strike. Outside a company, employees can seek legislation, appeal
to the media, or file lawsuits to pursue protection. The above procedures provide protection for
employees directly. However, the availability of those procedures differs country by country,
constrained by a country’s political and legal systems. Especially, a country’s labor law and
regulatory regime grant employees such rights as union formation, striking, and bargaining power.
Botero et al. (2004) recognize that when a country’s labor law and regulatory system provides labor
rights for employees, it also provides protection for employees by applying some restrictions to
shareholders. For example, labor law or regulation can protect employees by making it harder and
more costly to fire employees. From shareholders’ standpoint, strong labor laws widen the gap
between shareholders and employees and cause agency costs of employees to be raised.
Since employee rights granted by law and regulatory regime are exogenous, shareholders
will seek a reduction of agency costs of employees within a corporation. Basically, when a
corporation’s free cash flows are reduced, employees are less likely to obtain explicit or implicit
benefits. As a result, the agency costs of employees will be mitigated in such a way. Agency costs
theory suggests that cash dividends remove corporations’ free cash flows and thus reduce agency
costs.
This paper explores the role of employees in dividend policy under different legal and
political regimes across countries, by addressing the following research questions:
1. What is the relationship between employee rights and corporations’ decision to pay
dividends across countries?
2. How do employee rights affect amounts of dividend payout across countries?
3. Taking all stakeholders into account, how does interaction among shareholders, creditors,
and employees affect dividend policy across countries?
4. What is the impact of country-level employee protection level on corporations’ dividend
policies in different country groups?
This paper contributes to the broader corporate governance literature on the strategic
interaction between shareholders and employees. It considers all stakeholders when studying
agency problems. It tests the impact of agency costs of labor on dividend policy and provides a new
perspective to interpreting international variation in dividend policy in the world. The results
obtained from this paper help us to understand dividend policy in different countries with various
corporate governance mechanisms and fill significant gaps in the literature on agency problems.
The remaining of the paper is organized as follows. Following the introduction, a review of
existing studies and a conceptual framework are discussed in section I. Section II describes data
and research methodologies. Empirical results are discussed in section III. The conclusion is in
section IV.
I. Conceptual Framework
Dividend policy is affected both by firm level factors and by country level factors (see Allen
and Michaely (2003) for comprehensive reviews). At the firm level, firm size, leverage, investment
growth opportunities, tax, firm age, corporate governance characteristics such as ownership
structure, board structure, distribution of voting rights, and distribution of cash flow rights all
influence firm dividend policy (Bhattacharya (1979), Rozeff (1982), Easterbrook (1984), Miller
and Rock (1985), Jensen (1986), Fama and French (2001), DeAngelo, DeAngelo, and Stulz (2005),
among others). At the country level, to our knowledge, legal factors such as legal origin, protection
for minority shareholders, and enforcement of law are relevant to dividend payout (LLSV 2000a).
This complexity of dividend determinants means that none of the various dividend policy theories
developed to explain dividend payout behavior and its variations in dividend behavior across
countries are perfect.
International studies on dividend policy extend dividend theories to an international context.
Usually research in this area analyzes dividends either in specific non-US countries (Goergen,
Renneboog, and Silva (2004), Chen, Cheung, Stouraitis, and Wong (2005), among others) or in
certain country groups such as emerging countries or European countries (Faccio, Lang, and
Young, 2001; Aivazian et al., 2003a, 2003b).
Research on international dividend policy has focused primarily on testing validation of
various dividend theories in international context using foreign countries’ firm samples. Few
studies examine the impact of agency costs of stakeholders on corporate finance based on differing
natures of legal and political systems across countries.
Legal and political systems affect finance through various channels. In particular, they
provide heterogeneous protection for different interest groups in a corporate context, cause power
and benefit imbalanced among stakeholders, and shape characteristics of agency problems of
stakeholders.
Tirole (2001, 2006) asserts that corporations select optimal investment and financing
decisions within the constraints of legal and political environments to which they belong. While
agency problems have great impacts on dividends, what shape characteristics of agency problems
cause lots of interests.
There are essentially two explanations for international differences in agency problems of
stakeholders. The “law and finance” theory (LLSV (1997, 1998, 1999), Beck, Demirguc-Kunt, and
Levine (2001, 2003)) suggests that legal origin rooted in historical accident determines investor
protection and then financial market development. Investor protection and financial market
development level generate corporate governance mechanisms in which stakeholders interact with
each other. Political economics school studies benefits and protection of employees, and more
importantly, the interaction between employees, managers, and shareholders under various political
environments. In the “political economics” framework (Pagano and Volpin (2005, 2006), Rajan
and Zingales (2003), Roe (2003, 2004)), researchers argue that it is the interaction between different
political interest groups that shapes legal rules and investor protection, with the latter influences
financial market development and derives corporate governance mechanisms.
Blair (1999) views the corporation as a mechanism for governing the relationship among all
stakeholders, not the just relationship between shareholders and managers. Those stakeholders
include employees who contribute their human capital, shareholders who invest capital, and
managers who input their management expertise. She points out that investments in knowledge,
skills, relationships, and other forms of human capital can create contracting difficulties that neither
arm’s-length market transactions nor formal contracts can readily resolve. She suggests that
institutions with the ability to foster sustainable development should encourage continuity in the
relationship between employees and the firms. This institutional environment might include unions,
severance pay, social norms of lifetime employment, internal job ladders, career paths, seniority
rules, and direct and formal control rights.
Bebchuk and Roe (2004) argue that although the shareholders-oriented model is emerging
around the world, it is not so powerfully encompassing: Other corporate governance styles still
exist in some nations. Bebchuk and Roe’s argument reminds a realistic fact that diverse corporate
governance mechanisms will generate heterogeneous agency problems. The root of this agency
problem heterogeneity relies fundamentally on the differences in institutional environments of
countries in the world.
Most corporate governance analyses ignore employees. However, agency costs of employees
affect firm decisions in many aspects. A tension always exists between shareholders and
employees. Shareholders want to keep flexibilities in restructuring the business, downsizing firms,
and lay-offing employees so as to maximize firm value. Shareholders don’t mind if those changes
or restructures put employees at risk. Employees, however, may resist change if the change lets
work become disruptive, difficult, and risky. The contradictory preferences and pursuits between
shareholders and employees induce employees to seek for protection for their interests and job
security through any available channels.
The ways employees use to protect their benefits include labor contracting, direct
involvement in corporate governance mechanism through assigning employee representation on
the firm’s board of directors, and the use of their political voting right to put pressure on legislation
so as to get protection from government, depending on a country’s legal and political institutions.
Hansmann and Kraakman (2004) argue that protecting for employees through labor law and labor
regulatory mechanism is more efficient and strong and can prevent employees from exploitation at
the hand of shareholders. When employees obtain more benefits from stronger employee protection
provided by a country’s labor law and regulation, those benefits are at expenses of shareholders’
increased agency costs of employees.
It is a country’s legal and regulatory regime that provides valid protection for employees.
Botero et al. (2004) investigate labor right across countries and find that countries with different
legal and political regimes have different labor regulation structures in such terms as the difficulty
of firing employees, costs of firing employees, and easiness of union formation. If a country’s legal
regime is in favor of employees, shareholders in such a country will seek tools that could control
agency costs within a corporation to maximize firm value and protect themselves. Cash dividends
remove free cash flows and thus mitigate agency costs of managers (Easterbrook (1984)). Less free
cash flows also lower employees expectation to obtain extra benefits from the firm even the labor
law and regulatory regime provide high employee right in that country. Therefore, dividends can
also be used to reduce agency costs of employees.
Given a country’s labor regulatory regime, employees prefer low dividends because more
free cash flows remained in a firm allow employees to have stronger bargaining to pursue high
wages and job security. On the one hand, paying cash dividends can reduce free cash flows and
hence mitigate agency costs. On the other hand, from the perspective of corporate finance,
dividends payment is a distribution of wealth to investors. Comprehensively, corporations will
apply different dividend policies in the reduction of agency costs of employees, depending on
employee rights at country-level. We test the relationship between county-level employee rights
and dividend policy across countries through the following hypothesis. Using country-level labor
right as a proxy for employee protection (Botero et al (2004)) and creditor right as a proxy for
creditor protection (LLSV (2006)), we hypothesize:

The stronger the labor right, the fewer cash dividends the company will pay.
When labor right is strong, more employees’ benefits are granted by labor law and regulation.
Consequently, high employee benefits will take up cash and reduce cash flows distributed to
shareholders via cash dividends. Especially in countries where protection for investors is weak, the
dominance of strong labor right will cause corporations not to pay or pay fewer cash dividends.
This is the case of civil law countries whose protection for investors is weaker than common law
countries. Therefore, we assume the negative relationship between labor right and dividends will
be more obvious in civil law countries.
II. Data and Methodology
2.1 Data sources and sample selection
We collect firm data from Compustat Global Vantage. All firm-level financial accounting
variable data is obtained from Global Industrial file. Market price data is collected from Compustat
Global Issue file. Country currency exchange rate data is from Compustat Global Currency File.
Country-level variables are obtained from previous research in each aspect, respectively. We
obtained shareholder rights, creditor rights, and labor rights data from Djankov, La Porta, Lopez-
de-Silanes, and Shleifer (2008), Dajankov, Mcliesh, and Shleifer (2007), and Botero, Djankov, La
Porta, Lopez-de-Silanes, and Shleifer (2004), respectively. Table 1 lists data and variable
information.
< Insert Table 1 here>
The sample period is 1990-2007. We begin sample construction by matching the Compustat
Global Industrial with Global Issue and Global Currency files.
Differences in accounting practices across countries might cause a discrepancy in financial
reporting. To avoid this bias, we select firms with fully consolidated accounting statements only
(consol = F in Global Industrial file). Following the literature on dividends (Aivazian et al. (2003),
and LLSV (2000a), we exclude financial firms (6999>SIC code>6000), and utility firms
(4999>SIC code>4900). We also dropped firms with negative equity, negative sales revenue,
missing value of total assets, negative dividends, and negative cash flows, and firms with dividends
larger than sales revenue.
We match firm-level data from Global Vantage with our country-level data from various
resources and require our main three country-level explanatory variables, shareholder rights index
(SR), creditor rights index (CR), and labor rights index (LR), be available to each country included
in our sample. To comply with the requirements of time-series cross-sectional regression, we drop
the following countries with less than 30 firm-year observations, Ghana, Croatia, Jordan, Kenya,
and Romania. Following literature on international dividends (LLSV 2000a; and Ferris et al. 2009),
we dropped countries with mandatory dividend payment, namely Brazil, Chile, Colombia, Greece,
and Venezuela. After applying these filters, our sample includes 164,419 firm-year observations
from 19,147 unique firms from 46 countries during the period of 1990-2007. Table 2 describes
sample information.
< Insert Table 2 here>
We use country-level variable, labor rights index (LR) as the proxy for the agency costs of
employees. The shareholder rights index (SR) and creditor rights index (CR) are used as control
variables.
LLSV (1998) develop a shareholder rights index. This shareholder rights index is widely
used in literature (LLSV 2000a; 2000b; Pinlowitz et al. 2006; and Faccio 2001). Djankov et al.
(2008) update LLSV(1998) shareholder rights index to make it more accurate. We use the updated
anti-self-dealing index from Djankov et al. (2008) as our proxy for shareholder rights (SR).
Similar to shareholder rights index, Djankov et al. (2007) use creditor rights index to measure
for country-level protection for creditors. Research using creditor rights index focuses on the
relationship between creditor rights and debt contract terms (Roberts and Sufi (2009)). Brockman
et al. (2009) test the impact of creditor rights on dividend policy across countries and assert that
dividend policy can be used by creditors as a substitute for weak creditor protection from country
level. This approach implies that from the perspective of shareholders, there is an association
between creditor rights and agency costs of creditors. Our independent variable CR is the creditor
rights index from Djankove et al. (2007).
Labor rights index is used as a proxy for agency costs of employees. Roe (2004) asserts that
a marginal increase in benefits of employees would be a marginal decrease in shareholders’ value
and that strong labor right provided by legal and political systems in fact cause agency costs to
increase. Therefore, we use measures for labor rights as proxies for agency costs of employees.
There is an extensive literature on the relationship between labor rights and law and regulation
of labor (Besley and Burgess (2003), Heckman and Pages-Serra (2000), and Lazear (1990)). Those
studies check the law and regulatory provisions on such aspects as the difficulty of firing
employees, the costs of firing employees, and the easiness of hiring employees and explore how
employees’ benefits are affected due to the differences in those provisions. In alignment with the
above approach, Botero et al. (2004) analyze the regulation of labor comprehensively and suggest
that regulation of labor markets protects employees in the following four areas: (1) forbidding
discrimination in the labor market; (2) restricting the ranges of feasible contracts and raising costs
of laying off employees; (3) empowering labor unions to negotiate with employers; and (4)
regulating social insurance for employees. They develop a group of indices to measure for
employee protection in each aspect. With regard to employees’ power to pursue maximum benefits,
Botero et al. (2004) use the labor union power index as a proxy for labor rights.
2.2 Methodology and research design
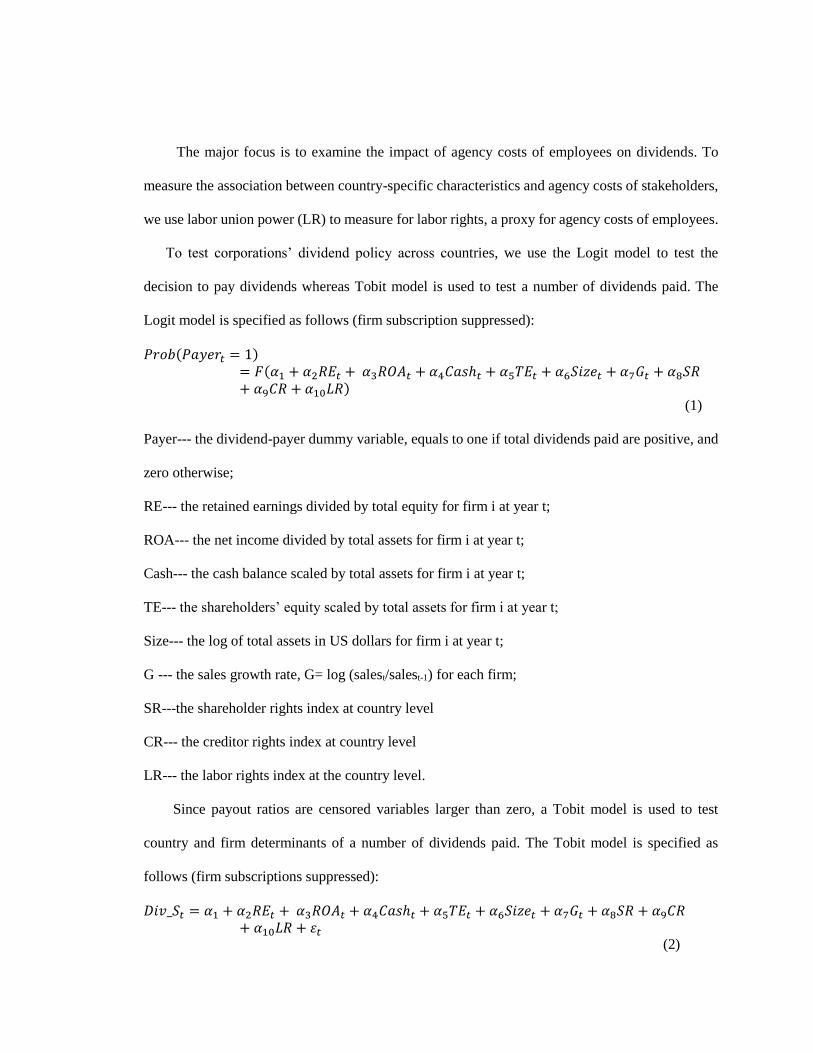
The major focus is to examine the impact of agency costs of employees on dividends. To
measure the association between country-specific characteristics and agency costs of stakeholders,
we use labor union power (LR) to measure for labor rights, a proxy for agency costs of employees.
To test corporations’ dividend policy across countries, we use the Logit model to test the
decision to pay dividends whereas Tobit model is used to test a number of dividends paid. The
Logit model is specified as follows (firm subscription suppressed):
𝑃𝑟𝑜𝑏(𝑃𝑎𝑦𝑒𝑟𝑡 = 1)= 𝐹(𝛼1 + 𝛼2𝑅𝐸𝑡 + 𝛼3𝑅𝑂𝐴𝑡 + 𝛼4𝐶𝑎𝑠ℎ𝑡 + 𝛼5𝑇𝐸𝑡 + 𝛼6𝑆𝑖𝑧𝑒𝑡 + 𝛼7𝐺𝑡 + 𝛼8𝑆𝑅+ 𝛼9𝐶𝑅 + 𝛼10𝐿𝑅)
(1)
Payer--- the dividend-payer dummy variable, equals to one if total dividends paid are positive, and
zero otherwise;
RE--- the retained earnings divided by total equity for firm i at year t;
ROA--- the net income divided by total assets for firm i at year t;
Cash--- the cash balance scaled by total assets for firm i at year t;
TE--- the shareholders’ equity scaled by total assets for firm i at year t;
Size--- the log of total assets in US dollars for firm i at year t;
G --- the sales growth rate, G= log (salest/salest-1) for each firm;
SR---the shareholder rights index at country level
CR--- the creditor rights index at country level
LR--- the labor rights index at the country level.
Since payout ratios are censored variables larger than zero, a Tobit model is used to test
country and firm determinants of a number of dividends paid. The Tobit model is specified as
follows (firm subscriptions suppressed):
𝐷𝑖𝑣_𝑆𝑡 = 𝛼1 + 𝛼2𝑅𝐸𝑡 + 𝛼3𝑅𝑂𝐴𝑡 + 𝛼4𝐶𝑎𝑠ℎ𝑡 + 𝛼5𝑇𝐸𝑡 + 𝛼6𝑆𝑖𝑧𝑒𝑡 + 𝛼7𝐺𝑡 + 𝛼8𝑆𝑅 + 𝛼9𝐶𝑅+ 𝛼10𝐿𝑅 + 𝜀𝑡
(2)
Div_St = Div_St* if Div_St
*>0, zero otherwise.
Consistent with LLSV (2000a), we use dividends to sales ratio as our payout ratio for each
firm i at year t, Div_S, defined by cash dividend paid to common and preferred stockholders divided
by net sales. Durnev and Kim (2005) argue that the differences in accounting practices across
countries make the direct comparison of firm-level data biased. However, the inclusion of legal
variables, in particular, anti-self dealing index, will partially take the accounting standards
differences across countries into account, and therefore, control for these differences (Djankov et
al. (2008)). Another bias may arise from the possibility that firms in different countries may have
a different degree of incentive to manipulate accounting earnings through accounting tricks. Using
dividend to sales ratio will mitigate this bias because the sales depend less on accounting
conventions and are less likely to manipulate, as argued by LLSV (2000a). Using dividends to sales
ratio also allows us to keep a larger sample size than using dividends to earnings ratio, because
using dividends to earnings ratios results in eliminating firms with negative earnings.
For any missing values of total dividends items in Global Industrial file, we use the total
amount of dividends paid from Global Issue file as a supplement. The total amount of dividends
paid is an accumulated amount of dividends paid during a fiscal year in Global Issue file adjusted
by currency exchange rate. The currency exchange rate information is from Global Currency file.
Table 3 provides summary statistics for the dividend payout.
< Insert Table 3 here>
Selection of independent variables in the Logit and Tobit models is based on dividend
theories, following prior research on dividends. Dividend theories include the agency costs theory,
the signaling theory, the catering theory, the pecking order theory, and the life-cycle theory.
Different dividend theories predict firm-level factors play different roles in the determination of
dividend policy.
Consistent with the dividend theories, we use the following variables to control for firm-level
factors: RE is the retained earnings divided by total equity. RE is widely used to test the life-cycle
theory (DeAngelo et al (2006), Fama and French (2002)). Cash is the cash balance scaled by total
assets. TE is the shareholders’ equity scaled by total assets. G is the growth rate computed by annual
log sales growth. LLSV (2000a) provide an argument for why sales growth is a good proxy for
investment opportunities in across countries analysis. They assert that sales are less likely to be
manipulated in financial statements considering the different accounting principles and conventions
across countries. Thus sales growth rate is a more reliable measure for growth opportunities than
other growth rates. Firm size is measured by nature log of total assets in US dollars, as used by
Brockman et al (2009) and Faccio et al. (2001). Prior empirical studies show that dividend payment
is highly related to profitability. Return on assets (ROA) is widely used as a profitability measure
in literature (Bhattacharya 1979; Grullon, Michaely, and Swaminathan 2002). ROA is computed
using the net income divided by total assets. Table 4 lists descriptive statistics for firm-level
independent variables.
Following the prior literature, we also include other country-level variables to control
country-specific economic factors. Table 5 lists all country-level variables.
< Insert Table 4 and 5 here>
III. Empirical results
3.1 Summary statistics
Summary statistics is presented in Table 3. Following the literature, we divide dividends
sample into two sub-groups based on a country’s legal origin (LLSV (1998)): common law
countries and civil law countries. Table 3 panel A shows summary statistics for common law
countries. In the common law country group, the median of payer ratio is 69.37% and the mean
and median of payout ratio are 1.99% and 2.01%, respectively. In the civil law country group, the
median of payer ratio, the mean, and median of payout ratio are 58.98%, 1.5%, and 1.44%,
respectively. Consistent with the literature (LLSV(2000a), Brockman et al. (2009)), common law
countries have higher dividend payout ratio and are more likely to pay cash dividends than civil
law countries do. Checking the distribution graph country by country reveals that large variations
exist in dividend policy across countries, although at the firm level, factors that influence dividend
policy are homogeneous. This cross-country variation in dividend policy leads us to explore the
impact of country-level factors on dividend policy across countries1.
<Insert Table 3 here>
3.2 Firm-level determinants of dividend policy
We start our analysis by running a regression using firm-level variables only. To address the
outliers issue, we winsorize all firm-level variables at 5% level.2
We test firm determinants of a dividend policy by implementing the Logit model and the
Tobit model with firm-level independent variables only. The regression results are presented in
Tables 6 and 7. To control for industry effect, we run the Logit and Tobit models both using industry
segment sample separately and using pooled sample. To get an unbiased estimation, we use robust
clustering estimator of variance, controlling for the interdependence across observations.
< Insert Table 6 and 7 here>
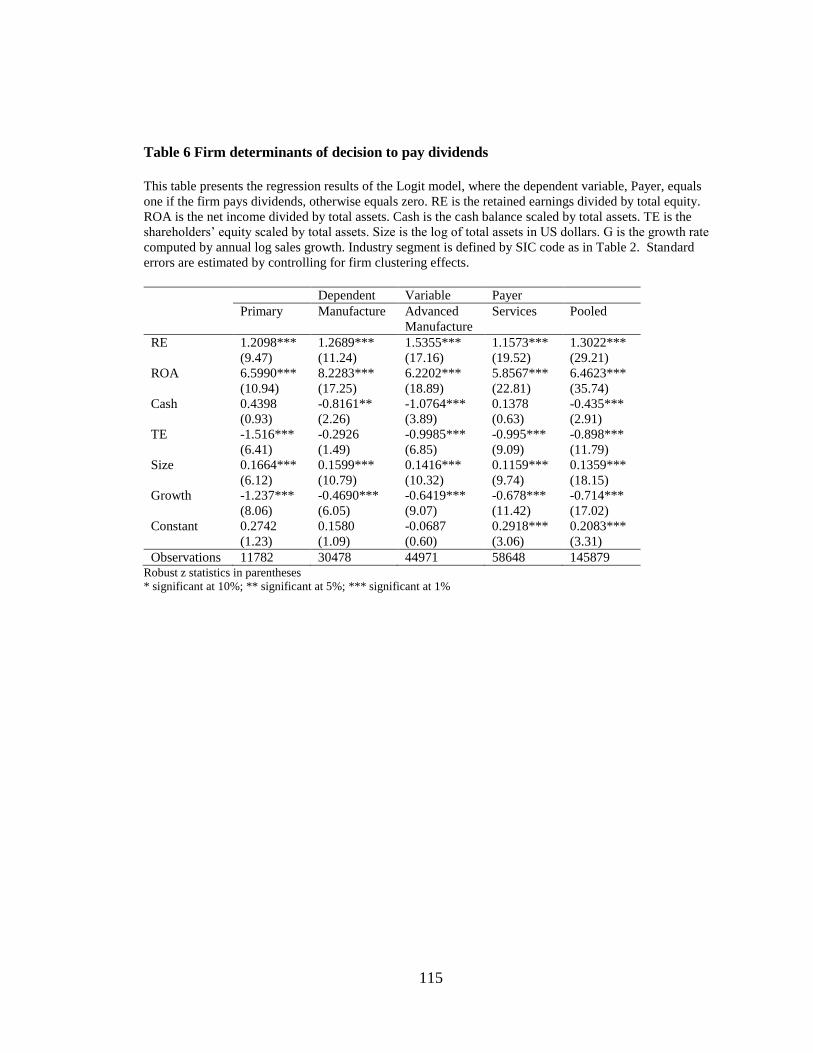
The results of the Logit and Tobit models are pretty consistent across different industry
segments. The coefficients of Logit and Tobit models are statistically significant, most at 1% except
for coefficients of cash in Logit model. As predicted by the agency costs theory, and the life-cycle
theory, and consistent with the prior research (Easterbrook (1984), DeAngelo et al. (2005), Li and
Zhao (2008), and Brockman et al. (2009), our results show that corporations with higher profit and
1 The country by country payout ratio graphs can be provided at request. 2 We also used 1% winsorized sample and original sample to run all tests. The tests results don’t change
qualitatively.
more retained earnings and larger corporations are more likely to pay dividends and pay more
amount of dividends if they are dividends payers. Corporations with more investment opportunities
pay less or no dividends. Cash balance has a mixed effect on dividend policy with negatively
significant coefficients in Tobit model and mixed coefficient signs in Logit model.
As discussed previously, we use country-level labor rights index as a proxy for agency costs
of employees. Our analysis is implemented by running the pooled sample ordinary least square
(OLS) regression with year and industry fixed-effects. Robust clustering standard errors are
estimated to control for interdependence across firms.
3.3 Labor rights and dividend policy
We test the likelihood to pay dividends and amount of dividend payments under different labor
rights using the Logit and Tobit model, respectively. LLSV (2000a) find the positive relationship
between shareholder rights and dividend amounts and suggest that high dividends are the outcome
of strong investor protection. Brockman et al. (2009) document the positive relationship between
creditor rights and dividend payment decision and dividend amounts and argue that lower dividend
payment is used as a substitute for weak creditor rights because creditors are likely to restrict
dividend payment if creditors are not well protected.
With the same logic, we examine the relationship between employee rights and dividend
policy across countries. Controlling for firm-level factors, we run year- and industry-fixed-effect
Logit model with firm clustering standard error estimation using pooled sample. We also
implement the same regression using sub-samples: common law country group, and civil law
country group. To test the impacts of labor rights on dividend amounts, we implement both Tobit
and OLS regression using pooled samples for three groups: common law country group, civil law
country group, and the whole country group. To test the interaction and compounded effect of all
stakeholders, we add creditor rights and shareholder rights indices to our regressions as control
variables. The Logit model results are presented in Table 8 and the Tobit model results are reported
in Table 9.3
In Logit model, the coefficients of the labor rights index are significantly negative in full
sample and in the civil law country sample. In common law country sample, the coefficient of labor
rights index is significantly positive. When we test the SR, CR, and LR together, we document
significantly negative coefficients of SR in full sample and civil law sample.
In Tobit model, coefficients of LR are insignificantly negative. The subsample regressions
generate significant results, positive for common law countries and negative for civil countries. The
coefficient of CR in civil law country sample becomes significantly negative. We use VIF to check
the multicollinearity and the VIF does not show serious multicollinearity problem.
< Insert Table 8 and 9 here>
In both Logit and Tobit models, the civil law country samples generate consistent results for
LR coefficients. The negative coefficient of LR reveals the negative relationship between labor
rights and dividends, The results support our hypothesis, in which we assume the negative
relationship between employee rights and corporations’ dividends. Unlike debt repayment,
dividend distribution is not a firm’s obligation. The major source of dividends is corporations’
profits, after all expense and costs including labor costs are deducted. As a result, shareholders are
harder to remove free cash flows through paying dividends when they face stronger labor rights
from labor law and regulations. This inability to mitigate agency costs of employees is exacerbated
when shareholder rights are weak. That’s why our tests results show the negative coefficients are
more salient in civil law countries whose shareholder rights are weaker than common law countries.
3 We run the OLS regression of dividend payout ratio but only report Tobit model results here. The OLS
regression results are not qualitatively different from Tobit model results with regard to our research
targets.
Our full sample and common law country sample generate results inconsistent with the prior
research (LLSV (2000a), and Brockman et al. (2009), but the results will remain inconclusive
without robustness check.
3.4 Robustness tests
This paper is to explore the impacts of country-level employee rights on dividend policy
across countries, using firm-level variables as control variables. Our pooled sample regressions
have two limitations. First, running pooled sample regression can not totally remove the disturbance
of firm-level variables. Second, including all countries in our sample results in unequal weights in
our sample. Some countries such as the US, Britain, and Japan have a much larger number of
observations than other countries do. As a result, our results cannot exclude the excess impact of
those big countries. To overcome such limitations, we use a two-stage regression model to remove
the firm-level factors and to exclude the dominance of countries that have a large number of
observations. We run the two-stage residual regressions for Tobit model4.
In the first stage, following Chui et al. (2002), we construct an adjusted dependent variable
by the following method. We generate the residual from Tobit regression and get the adjusted
dividend ratio using the same procedure in the first stage. Then in the second stage, we run the
following cross-national regression model:
(3)
The two-stage regression results are presented in Table 11. After removing firm-level factors
totally and controlling for imbalance sample issue through two-stage regression, our tests results
stay statistically significant.
To address the omitting variable issue, we run the robust tests by adding additional country-
level controlling variables and re-run the two-stage regression. Following the prior research, we
4 We also run OLS and Tobit regressions using samples without the US, or Britain, or Japan, or all three.
The significance of results stays the same essentially.
add both country-level corporate governance quality variables such as government quality index
and ownership concentration index. The regression results are included in Table 11.
< Insert Table 11 here>
The above robust tests results show that the coefficients of our major target variable: labor
rights index (LR), stays statistically significant. These significant results suggest that labor rights
are negatively related to dividend payout, and this negative relation becomes stronger when
shareholder rights are weak.
IV. Conclusion
This paper explores the relationship between employee rights and dividend policy across
countries. The results of the study reveal the impacts of agency costs of employees on dividend
policies are given a country’s legal and political framework.
Based on the agency problem theory in finance, agency costs arise when the interests of
agents are not aligned with those of principals. Current corporate governance theory focuses
primarily on agency costs of managers and existing literature studies extensively on this aspect.
This paper examines an interest group that is ignored by corporate governance studies. This interest
group is employees of firms. With a different utility function from shareholders, employees seek
various ways such as labor contracting, unionization, and the use of their voting rights on Politian
to maximize their benefits and interests within firms. The increase in employee right is at expense
of shareholders and agency costs of employees arise due to this reason. Constrained by a country’s
labor regulatory regime, shareholders will use firm behaviors to mitigate employees bargaining
power so as to reduce the agency costs of employees. Paying cash dividends is one of such
behaviors. Using labor right index as a proxy for agency costs of employees, we test the association
between labor rights and dividend policies across countries.
Our empirical results reveal that labor rights are negatively related to firms’ decision to pay
dividends and dividend payment amounts. This relationship is reinforced to be more salient in civil
countries where shareholder rights are weak.
The empirical results are robust by controlling for test model specification, and a series of
country-level control variables. This is the first study that examines agency costs of employees in
dividend policy explicitly.
This paper makes contributions to the literature on agency problems. It sheds light on the
interaction relationship among shareholders, creditors, and employees. By testing the impact of
agency costs of equity, agency costs of debt, and agency costs of labors on dividend policy, it
suggests a new standpoint to study the agency costs of stakeholder. The empirical results of this
study provide a new perspective to interpret international variation in dividend policies across
countries.
References
Aivazian, Varouj, Laurence Booth, and Sean Cleary, 2003a, Do Emerging Market Firms Follow
Different Dividend Policies from U.S. Firms?, Journal of Financial Research 26, 371-
387.
Aivazian, Varouj, Laurence Booth, and Sean Cleary, 2003b, Dividend Policy and the
Organization of Capital Markets, Journal of Multinational Financial Management 13,
101-121.
Allen, Franklin, and Roni Michaely, 2003, Payout Policy, in Milton Harris George
Constantinides, and Rene Stulz, ed.: North-Holland Handbook of Economics (North-
Holland, Amsterdam).
Allen, Franklin, 2005, Corporate Governance in Emerging Economies, Oxford Review of
Economic Policy 21, 164-177.
Allen, Franklin, E., Carletti, and R., Marquez, 2009, Stakeholder Capitalism, Corporate
Governance and Firm Value, the University of Pennsylvania Working Paper No. 09-28
Alonso, Pablo de Andres, Felix J. Lopez, Iturriaga, and Juan A. Rodriguez Sanz, 2005, Financial
Decisions and Growth Opportunities: A Spanish Firm’s Panel Data Analysis, Applied
Financial Economics 15, 391-407.
Arellano, Manuel, and Olympia Bover, 1997, Estimating Limited Dependent Variables Model
from Panel Data, Investigaciones Economicas 21, 141-166.
Asli Demirguc-Kunt, and Vojislav Maksimovic, 1998, Law, Finance, and Firm Growth, Journal
of Finance 53, 2107-2137.
Asli Demirguc-Kunt, and Vojislav Maksimovic, 1999, Institutions, Financial Markets and Firm
Debt Maturity, Journal of Financial Economics 54, 295-336.
Baker, M., and J. Wurgler, 2004, A Catering Theory of Dividends, Journal of Finance 59, 1125-
1166
Bebckuk, Lucian Arye, and Mark Roe, 2004, The End of History for Corporate Law in
Convergence and Persistence in Corporate Governance edited by Jeffrey Gordon and
Mark Roe (Cambridge University Press, Cambridge)
Beck, Thorsten, Asli Demirguc-Kunt, and Ross Levine, 2001, Legal Theories of Financial
Development, Oxford Review of Economic Policy 17, 438-501.
Benartzi, S., Roni Michaely, and R.H. Thaler, 1997, Do Changes in Dividends Signal the Future
or the Past? Journal of Finance 52, 1007-1034.
Bhagat, Sanjai R., and Richard H. Jefferis Jr., 2002. The Econometrics of Corporate Governance
Studies (MIT Press, Cambridge).
Bhattacharya, Sudipto, 1979, Imperfect Information, Dividend Policy, and the "Bird-in-Hand"
Fallacy, Bell Journal of Economics 10, 259-270.
Blair, Margaret, 1999, Firm-specific Human Capital and Theories of the Firm, in Employees and
Corporate Governance, Brookings Institution
Blair, Margaret, and Mark Roe, 1999, Employees and Corporate Governance, Brookings
Institution
Botero, Juan C., Simeon Djankov, Rafael La Porta, Florencio Lopez-de-Dilanes, and Andrei
Shleifer, 2004, The Regulation of Labor, The Quarterly Journal of Economics, 1339-
1382
Brockman, Paul, and Emre Unlu, 2009, Dividend Policy, Creditor Rights, and the Agency Costs
of Debt, Journal of Financial Economics 92, 276-299
Charny, David, 1999, Workers and Corporate Governance: The Role of Political Culture, in
Employees and Corporate Governance, Brookings Institution
Chen, Zhilan, Yan-Leung Cheung, Aris Stouraitis, and Anita W.S. Wong, 2005, Ownership
Concentration, Firm Performance, and Dividend Policy in Hong Kong, Pacific-Basin
Finance Journal 13, 431-449.
Chui, Andy C.W, Alison E. Lloyd, and Chuck C.Y Kwok, 2002, The Determination of Capital
Structure: Is National Culture a Missing Piece to the Puzzle?, Journal of International
Business Studies 33, 99-127.
DeAngelo, Harry, Linda DeAngelo, and Rene M. Stulz, 2005, Dividend Policy and the
Earned/Contributed Capital Mix: A Test of Life-Cycle Theory, Journal of Financial
Economics 81, 227-254.
Demsetz, Harold, and K. Lehn, 1985, The Structure of Corporate Ownership: Causes and
Consequences, Journal of Political Economy 93, 1155-1177.
Demsetz, Harold, and Belen Villalonge, 2001, Ownership Structure and Corporate Performance,
Journal of Corporate Finance 7, 209-233.
Dewenter, Kathryn L., and Vincent A. Warther, 1998, Dividend Asymmetry Information, and
Agency Conflicts: Evidence from a Comparison of the Dividend Policies of Japanese and
US Firms, Journal of Finance 53, 879-904.
Djankov, Simeon, and Andrei Shleifer, 2007, Private Credit in 129 Countries, Journal of
Financial Economics 84, 299-329
Djankov, Simeon, La Porta, Rafael, Florencio Lopez-de-Silanes, and Andrei Shleifer, 2008, The
Law and Economics of Self-Dealing, Journal of Financial Economics 88, 430-465
Durnev, Art, and E. Han Kim, 2005, To Steal of Not to Steal: Firm Attributes, Legal
Environment, and Valuation, Journal of Finance 60, 1461-1493.
Easterbrook, Frank, 1984, Two Agency Cost Explanations of Dividends, American Economic
Review 74, 605-659.
Faccio, Mara, Larry Lang, and Leslie Young, 2001, Dividends and Expropriation, American
Economic Review 91, 54-78.
Fama, Eugene, and Harvey Babiak, 1968, Dividend Policy: An Empirical Analysis, Journal of the
American Statistical Association 63, 607-636.
Fama, Eugene, and Kenneth French, 2001, Disappearing Dividends: Changing Firm
Characteristics or Lower Propensity to Pay?, Journal of Financial Economics 60, 3-43.
Fama, Eugene, and Kenneth French, 2002, Testing Trade-off and Pecking Order Predictions
about Dividends and Debt, Review of Financial Studies 15, 1-33.
Fazzari, S., R. Hubbard, and B. Petersen, 1988, Financing Constraints and Corporate Investment,
Brookings Papers on Economic Activity 1, 141-195.
Ferris, Stephen, Nilanjan Sen, and Emre Unlu, 2009, An International Analysis of Dividend
Payment Behavior, Journal of Business Finance and Accounting 36, 496-522
Fudenberg, Drew, and Jean Tirole, 1990, Moral Hazard and Renegotiation in Agency Contracts,
Econometrica 58, 1279-1320.
Glaeser, Edward, Rafael La Porta, Florencio Lopez-de-Silanes, and Andrei Shleifer, 2004, Do
Institutions Cause Growth?, Journal of Economic Growth 9, 271-303.
Gilson, Ronald, and Mark Roe, 1999, The Political Economy of Japanese Lifetime Employment,
in Employees and Corporate Governance edited by Blair, Margret and Mark Roe,
Brooking Institution
Goergen, Marc, Luc Renneboog, and Luis Correia da Silva, 2004, Dividend Policy of German
Firms, in Marc Goergen, Luc Renneboog, and Luis Correia da Silva, ed.: Dividend Policy
and Corporate Governance (Oxford University Press, Oxford).
Gordon, Jeffrey, 2004, The International Relations Wedge in the Corporate Convergence Debate,
in Convergence and Persistence in Corporate Governance edited by Jeffrey Gordon and
Mark Roe (Cambridge University Press, Cambridge)
Gourevitch, Peter Alexis, and James Shinn, 2005, Political Power and Corporate Control,
(Princeton University Press, Princeton)
Grullon, Gustavo, Roni Michaely, and Bhaskaran Swaminathan, 2002, Are Dividend Changes a
Sign of Firm Maturity? Journal of Business 75, 387-424.
Guedhami, Omrane, Chuck C.Y. Kwok, Liang Shao, 2009, Dividend Policy: Balanceing Interests
between Shareholders and Creditors, the University of South Carolina working paper
Hail, Luzi, and Christian Leuz, 2006, International Differences in the Cost of Equity Capital: Do
Legal Institutions and Securities Regulation Matter? Journal of Accounting Research 44,
485-531
Hansmann, Henry, and Reinier Kraakman, 2004, The End of History for Corporate Law, in
Convergence and Persistence in Corporate Governance edited by Jeffrey Gordon and
Mark Roe (Cambridge University Press, Cambridge)
Heckman, James, and Carmen Pages-Serra, 2000, The Cost of Job Security regulation: Evidence
from Latin American Labor Markets, Economia 2, 109-154
Higgins, R, 1972, The Corporate Dividend-Saving Decision, Journal of Financial and
Quantitative Analysis 1527-1541.
Hiwatari, Nobuhiro, 1999, Employment Practices and Enterprise Unionism in Japan, in
Employees and Corporate Governance edited by Blair, Margret and Mark Roe, Brooking
Institution
Hoeffler, Anke E., 2002, The Augmented Solow Model and the African Growth Debate, Bulletin
of Economics and Statistics 64, 135-158.
Jensen, Michael, and William Meckling, 1976, Theory of the Firm: Managerial Behavior, Agency
Costs, and Ownership Structure, Journal of Financial and Quantitative Analysis 3, 305-
360.
Jensen, Michael, 1986, Agency Cost of Free Cash Flow, Corporate Finance, and Takeovers,
American Economic Review 76, 323-329.
John, Kose, and Joseph. Williams, 1985, Dividends, Dilution, and Taxes: A Signaling
Equilibrium, Journal of Finance 40, 1053-1070.
Judge, G.G., Hill, R.C., Griffiths, W.E., Lutkepohl, H., and Lee, T.C., 1988, Introduction to the
Theory and Practice of Econometrics, 2nd edition, Wiley, New York, NY.
Kaufmann, Daniel, Aart Kraay, and Massimo Mastruzzl, 2007, Governance Matters VI:
Governance Indicators for 1996-2004, World Bank Policy Research Department Working
Paper.
Koch, Paul D., and Catherine Shenoy, 1999, The Information Content of Dividend and Capital
Structure Policies, Financial Management 28, 16-35.
La Porta, Rafael, Florencio Lopez-de-Silanes, Andrei Shleifer, and Robert W. Vishny, 1997,
Legal Determinants of External Finance, Journal of Finance 52, 1131-1150.
La Porta, Rafael, Florencio Lopez-de-Silanes, Andrei Shleifer, and Robert W. Vishny, 1998, Law
and Finance, Journal of Political Economy 106, 1113-1155.
La Porta, Rafael, Florencio Lopez-de-Silanes, Andrei Shleifer, and Robert W. Vishny, 1999,
Corporate Ownership around the World, Journal of Finance 54, 471-517.
La Porta, Rafael, Florencio Lopez-de-Silanes, Andrei Shleifer, and Robert W. Vishny, 2000a,
Agency Problems and Dividend Policies around the World, Journal of Finance 55, 1-33.
La Porta, Rafael, Florencio Lopez-de-Silanes, Andrei Shleifer, and Robert W. Vishny, 2000b,
Investor Protection and Corporate Governance, Journal of Financial Economics 58, 3-27.
La Porta, Rafael, Florencio Lopez-de-Silanes, and Andrei Shleifer, 2006, What Works in
Securities Laws, Journal of Finance 61, 1-33.
Lazear, Edward, 1990, Job Security Provisions and Employment, Quarterly Journal of
Economics 105, 699-726
Li, Kai, J., Harford, and Xinlei Zhao, 2008, Corporate Boards and Leverage and Debt Maturity
Choices, International Journal of Corporate Governance 1, 3-27
Li, Kai, and Xinlei Zhao, 2008, Asymmetry Information and Dividend Policy, Financial
Management 37, 673-694
Litzenberger, R., and K. Ramaswamy, 1982, The Effect of Dividends on Common Stock Prices:
Tax Effects or Information Effects, Journal of Finance 37, 429-443.
Marsh, T., and Merton R., 1987, Dividend Behavior for the Aggregate Stock Market, Journal of
Business 60, 1-40.
Miller, Merton and Franco Modigliani, 1961, Dividend Policy, Growth and the Valuation of
Shares, Journal of Business 34, 411-433.
Miller, Merton and Kevin Rock, 1985, Dividend Policy under Asymmetric Information, Journal
of Finance 40, 1031-1051.
Mitton, Todd, 2004, Corporate Governance and Dividend Policy in Emerging Markets, Emerging
Markets Review 5, 409-426.
North, D., 1990. Institutions, Institutional Changes and Economic Performance (North, New
York).
Pagano, Marco, and Paolo Volpin, 2001, The Political Economy of Finance, Oxford Review of
Economic Policy 17, 502-519.
Pagano, Marco, and Paolo Volpin, 2005, The Political Economy of Corporate Governance,
American Economic Review 95, 1005-1030.
Pagano, Marco, and Paolo Volpin, 2006, Shareholder Protection, Stock Market Development, and
Politics, Journal of European Economic Association 4, 315-341.
Pinkowitz, Lee, Rohan Williamson, and Rene Stulz, 2006, Does the Contribution of Corporate
Cash Holdings and Dividends to Firm Value Depend on Governance? A Cross-Country
Aanlysis, Journal of Finance 61, 2725-2751.
Pistor, Katharina, 1999, Codetermination: A Sociopolitical Model with Governance Externalities,
in Employees and Corporate Governance edited by Blair, Margret and Mark Roe,
Brooking Institution
Rajan, Raghuram, and Luigi Zingales, 1995, What Do We Know about Capital Structure? Some
Evidence from International Data, Journal of Finance 50, 1421-1460.
Rajan, Raghuram, and Luigi Zingales, 2001, Financial Systems, Industrial Structure, and Growth,
Oxford Review of Economic Policy 17, 467-482.
Rajan, Raghuram, and Luigi Zingales, 2003, The Great Reversals: The Politics of Financial
Development in the 20th Century, Journal of Financial Economics 69, 5-50.
Roe, Mark J., 2003. Political Determinants of Corporate Governance (Oxford University Press,
Oxford).
Roe, Mark J., 2004, Explaining Western Securities Markets, in Anna Grandori, ed.: Corporate
Governance and Firm Ogranization: Microfoundations and Structure Forms (Oxford
University Press, Oxford).
Roe, Mark J., 2005. Corporate Governance: Political and Legal Perspectives (Oxford University
Press, Oxford).
Rozeff, M., 1982, Growth, Beta and Agency Costs as Determinants of Dividend Payout Ratios,
Journal of Financial Research 5, 249-259.
Smith, C., and R. Watts, 1992, The Investment Opportunity Set and Corporate Financing,
Dividend, and Compensation Policies, Journal of Financial Economics 3, 263-292.
Tirole, Jean, 2001, Corporate Governance, Econometrica 69, 1-35.
Tirole, Jean, 2006. The Theory of Corporate Finance (Princeton University Press, Princeton).
Waller, Jr. W.T., 1989, The Concept of Habit in Economic Analysis, Journal of Economic Issues
22, 113-126.
Watts, Ross, 1977, The Information Content of Dividends, Journal of Business 46, 191-211.
Wooldridge, Jeffrey M., 2002. Econometric Analysis of Cross-Section and Panel Data (MIT
Press, Cambridge).
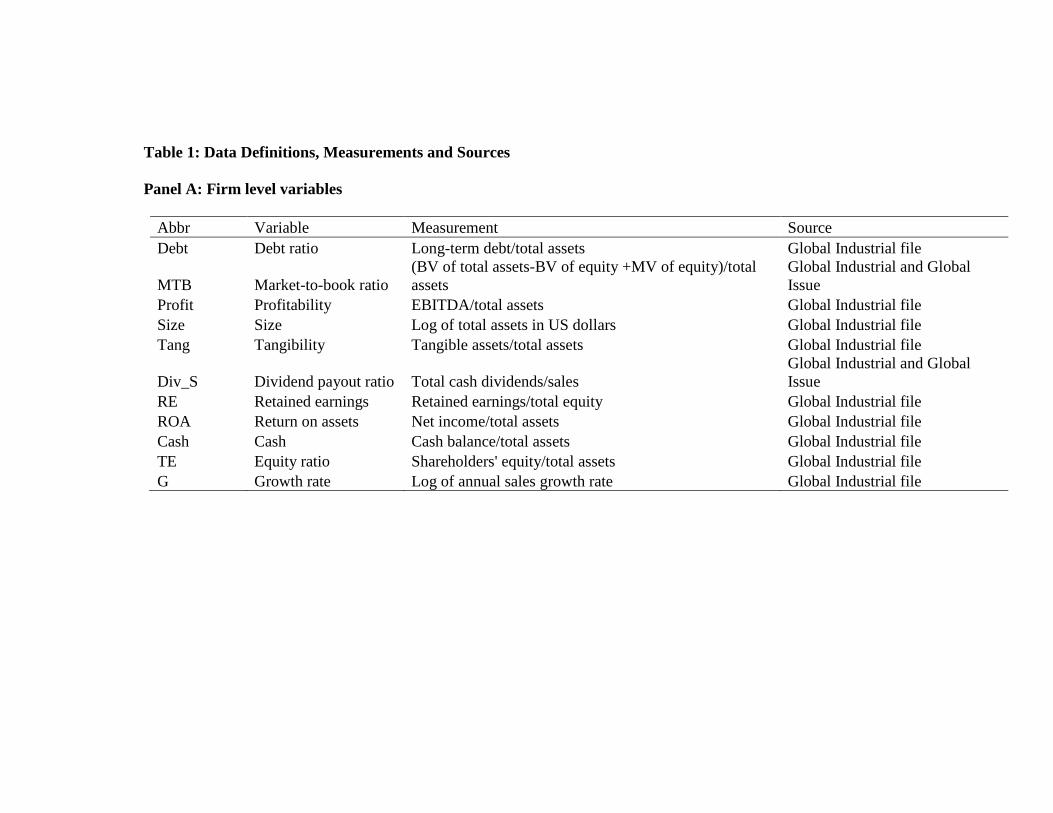
Table 1: Data Definitions, Measurements and Sources
Panel A: Firm level variables
Abbr Variable Measurement Source
Debt Debt ratio Long-term debt/total assets Global Industrial file
MTB Market-to-book ratio
(BV of total assets-BV of equity +MV of equity)/total
assets
Global Industrial and Global
Issue
Profit Profitability EBITDA/total assets Global Industrial file
Size Size Log of total assets in US dollars Global Industrial file
Tang Tangibility Tangible assets/total assets Global Industrial file
Div_S Dividend payout ratio Total cash dividends/sales
Global Industrial and Global
Issue
RE Retained earnings Retained earnings/total equity Global Industrial file
ROA Return on assets Net income/total assets Global Industrial file
Cash Cash Cash balance/total assets Global Industrial file
TE Equity ratio Shareholders' equity/total assets Global Industrial file
G Growth rate Log of annual sales growth rate Global Industrial file
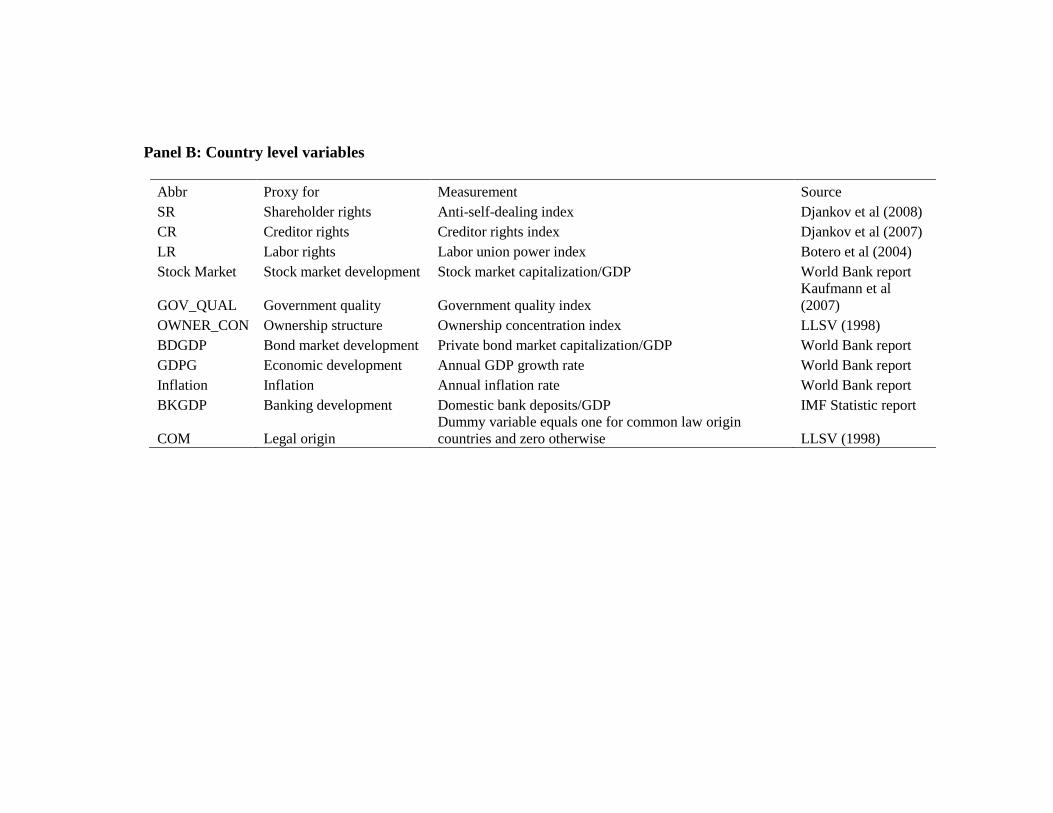
Panel B: Country level variables
Abbr Proxy for Measurement Source
SR Shareholder rights Anti-self-dealing index Djankov et al (2008)
CR Creditor rights Creditor rights index Djankov et al (2007)
LR Labor rights Labor union power index Botero et al (2004)
Stock Market Stock market development Stock market capitalization/GDP World Bank report
GOV_QUAL Government quality Government quality index Kaufmann et al
(2007)
OWNER_CON Ownership structure Ownership concentration index LLSV (1998)
BDGDP Bond market development Private bond market capitalization/GDP World Bank report
GDPG Economic development Annual GDP growth rate World Bank report
Inflation Inflation Annual inflation rate World Bank report
BKGDP Banking development Domestic bank deposits/GDP IMF Statistic report
COM Legal origin Dummy variable equals one for common law origin
countries and zero otherwise LLSV (1998)

Table 2 Sample Description
Country Primary Manufacturing Advanced manufacturing Services Total
N N N N N
Argentina 5 81 65 45 196
Australia 1535 854 856 3338 6583
Austria 106 233 293 156 788
Belgium 108 319 330 361 1118
Canada 1371 828 763 2469 5431
Switzerland 46 436 954 735 2171
China 298 2389 3069 4453 10209
Czech Republic 10 13 15 30 68
Germany 186 1194 2307 2215 5902
Denmark 91 457 464 581 1593
Egypt 0 2 27 9 38
Spain 194 405 339 499 1437
Finland 45 345 528 421 1339
France 360 1448 1992 3094 6894
United Kingdom 1224 2523 2872 7491 14110
Hong Kong 55 233 302 598 1188
Hungary 6 51 46 44 147
Indonesia 118 609 358 498 1583
India 3 367 323 207 900
Ireland 52 184 98 299 633
Israel 8 113 103 116 340
Italy 110 583 857 599 2149
Japan 1995 5274 9885 14419 31573
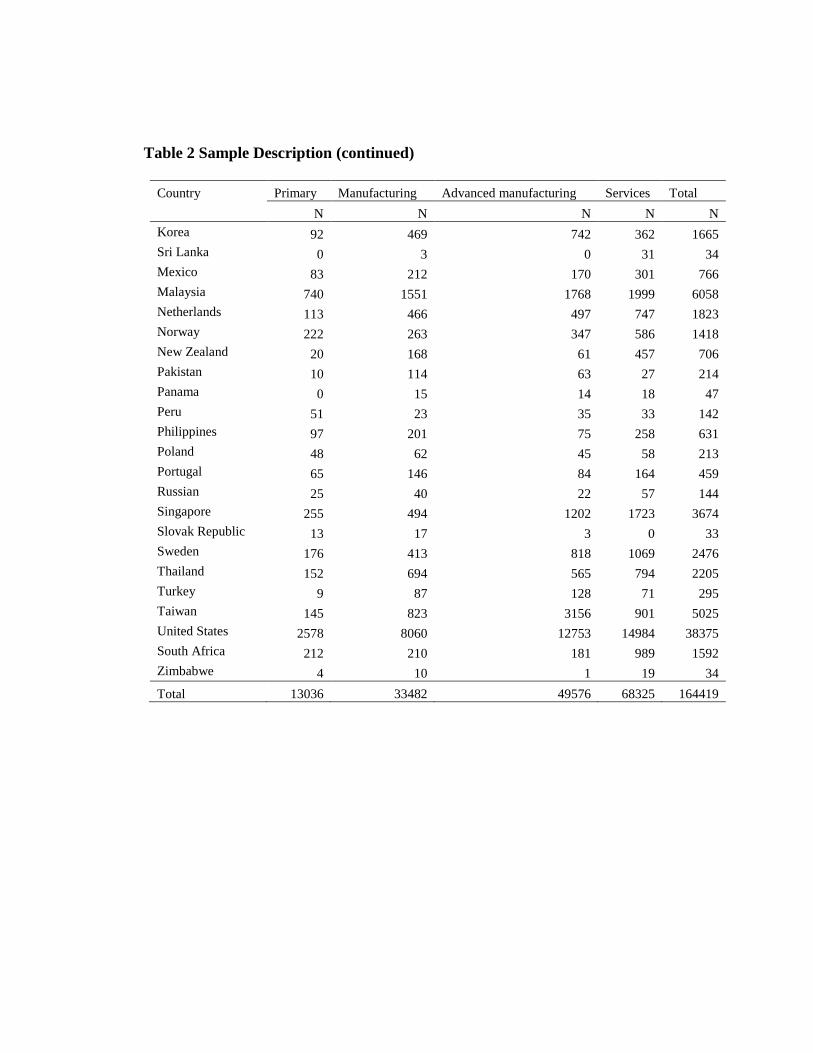
Table 2 Sample Description (continued)
Country Primary Manufacturing Advanced manufacturing Services Total
N N N N N
Korea 92 469 742 362 1665
Sri Lanka 0 3 0 31 34
Mexico 83 212 170 301 766
Malaysia 740 1551 1768 1999 6058
Netherlands 113 466 497 747 1823
Norway 222 263 347 586 1418
New Zealand 20 168 61 457 706
Pakistan 10 114 63 27 214
Panama 0 15 14 18 47
Peru 51 23 35 33 142
Philippines 97 201 75 258 631
Poland 48 62 45 58 213
Portugal 65 146 84 164 459
Russian 25 40 22 57 144
Singapore 255 494 1202 1723 3674
Slovak Republic 13 17 3 0 33
Sweden 176 413 818 1069 2476
Thailand 152 694 565 794 2205
Turkey 9 87 128 71 295
Taiwan 145 823 3156 901 5025
United States 2578 8060 12753 14984 38375
South Africa 212 210 181 989 1592
Zimbabwe 4 10 1 19 34
Total 13036 33482 49576 68325 164419
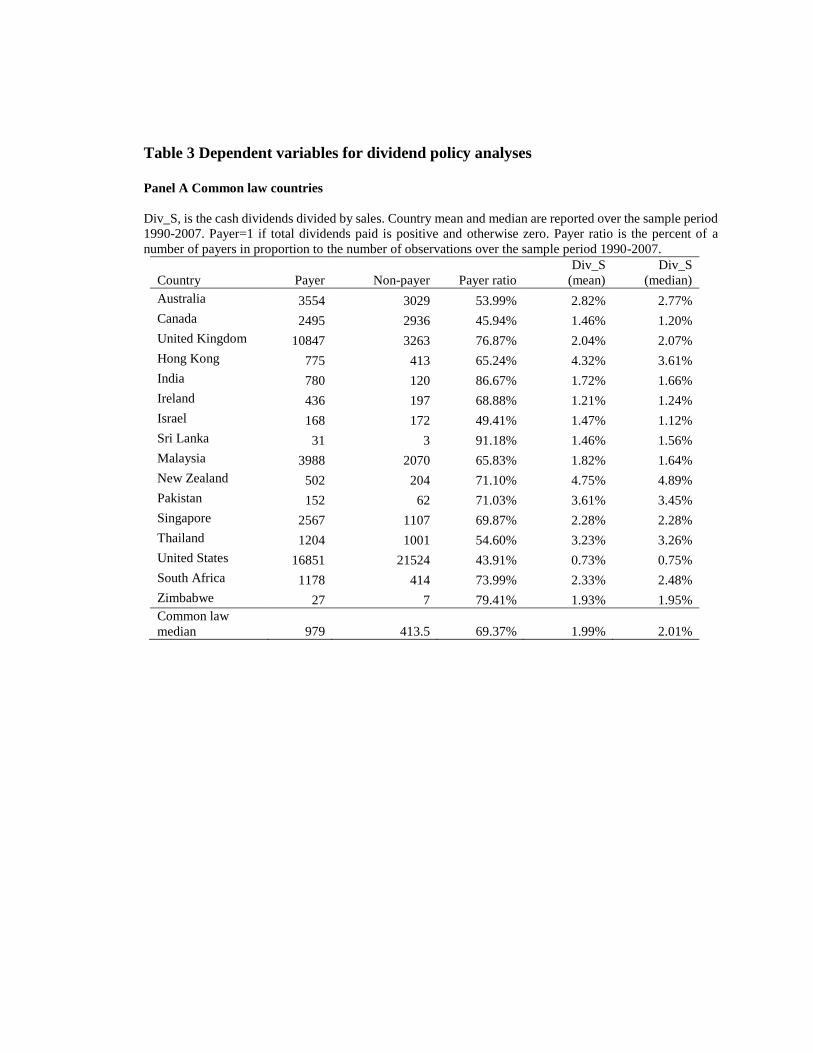
Table 3 Dependent variables for dividend policy analyses
Panel A Common law countries
Div_S, is the cash dividends divided by sales. Country mean and median are reported over the sample period
1990-2007. Payer=1 if total dividends paid is positive and otherwise zero. Payer ratio is the percent of a
number of payers in proportion to the number of observations over the sample period 1990-2007.
Country Payer Non-payer Payer ratio
Div_S
(mean)
Div_S
(median)
Australia 3554 3029 53.99% 2.82% 2.77%
Canada 2495 2936 45.94% 1.46% 1.20%
United Kingdom 10847 3263 76.87% 2.04% 2.07%
Hong Kong 775 413 65.24% 4.32% 3.61%
India 780 120 86.67% 1.72% 1.66%
Ireland 436 197 68.88% 1.21% 1.24%
Israel 168 172 49.41% 1.47% 1.12%
Sri Lanka 31 3 91.18% 1.46% 1.56%
Malaysia 3988 2070 65.83% 1.82% 1.64%
New Zealand 502 204 71.10% 4.75% 4.89%
Pakistan 152 62 71.03% 3.61% 3.45%
Singapore 2567 1107 69.87% 2.28% 2.28%
Thailand 1204 1001 54.60% 3.23% 3.26%
United States 16851 21524 43.91% 0.73% 0.75%
South Africa 1178 414 73.99% 2.33% 2.48%
Zimbabwe 27 7 79.41% 1.93% 1.95%
Common law
median 979 413.5 69.37% 1.99% 2.01%
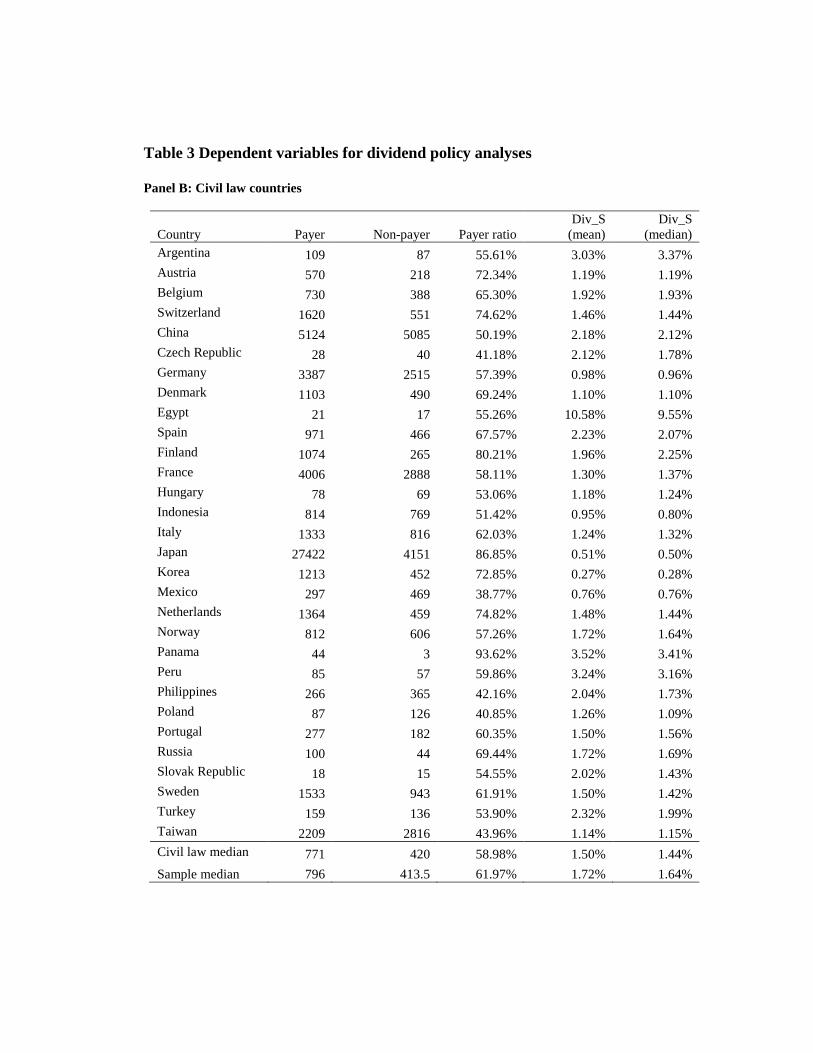
Table 3 Dependent variables for dividend policy analyses
Panel B: Civil law countries
Country Payer Non-payer Payer ratio
Div_S
(mean)
Div_S
(median)
Argentina 109 87 55.61% 3.03% 3.37%
Austria 570 218 72.34% 1.19% 1.19%
Belgium 730 388 65.30% 1.92% 1.93%
Switzerland 1620 551 74.62% 1.46% 1.44%
China 5124 5085 50.19% 2.18% 2.12%
Czech Republic 28 40 41.18% 2.12% 1.78%
Germany 3387 2515 57.39% 0.98% 0.96%
Denmark 1103 490 69.24% 1.10% 1.10%
Egypt 21 17 55.26% 10.58% 9.55%
Spain 971 466 67.57% 2.23% 2.07%
Finland 1074 265 80.21% 1.96% 2.25%
France 4006 2888 58.11% 1.30% 1.37%
Hungary 78 69 53.06% 1.18% 1.24%
Indonesia 814 769 51.42% 0.95% 0.80%
Italy 1333 816 62.03% 1.24% 1.32%
Japan 27422 4151 86.85% 0.51% 0.50%
Korea 1213 452 72.85% 0.27% 0.28%
Mexico 297 469 38.77% 0.76% 0.76%
Netherlands 1364 459 74.82% 1.48% 1.44%
Norway 812 606 57.26% 1.72% 1.64%
Panama 44 3 93.62% 3.52% 3.41%
Peru 85 57 59.86% 3.24% 3.16%
Philippines 266 365 42.16% 2.04% 1.73%
Poland 87 126 40.85% 1.26% 1.09%
Portugal 277 182 60.35% 1.50% 1.56%
Russia 100 44 69.44% 1.72% 1.69%
Slovak Republic 18 15 54.55% 2.02% 1.43%
Sweden 1533 943 61.91% 1.50% 1.42%
Turkey 159 136 53.90% 2.32% 1.99%
Taiwan 2209 2816 43.96% 1.14% 1.15%
Civil law median 771 420 58.98% 1.50% 1.44%
Sample median 796 413.5 61.97% 1.72% 1.64%
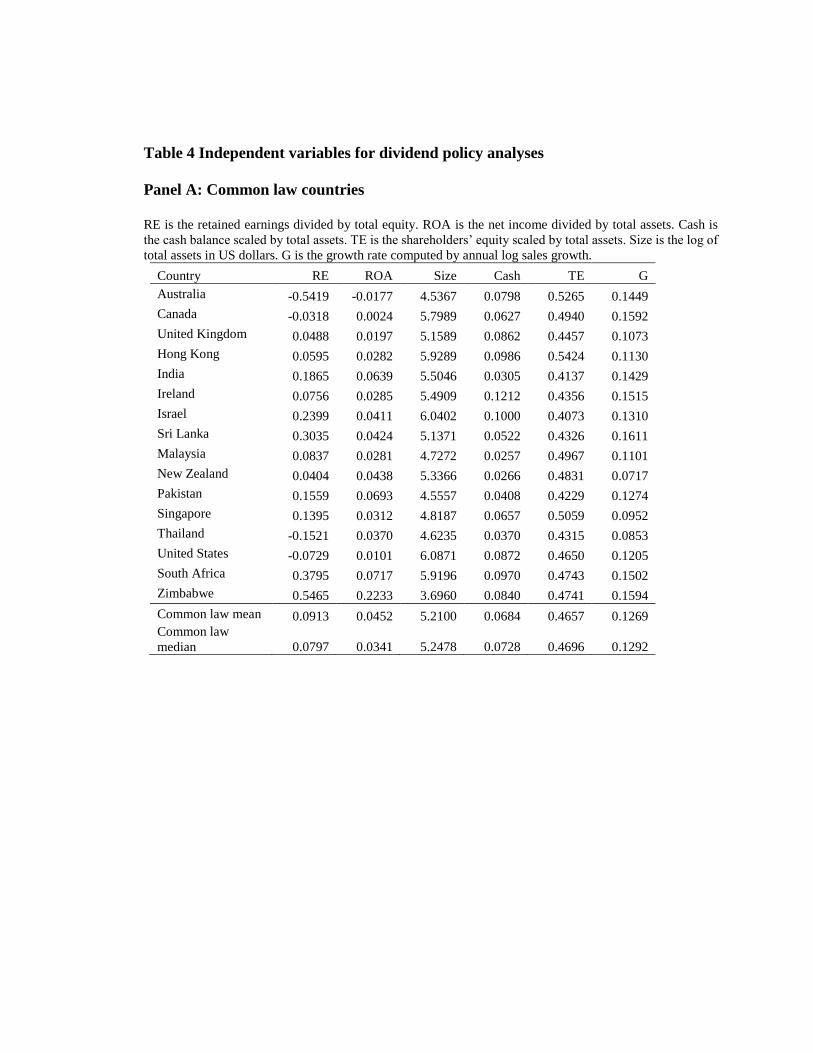
Table 4 Independent variables for dividend policy analyses
Panel A: Common law countries
RE is the retained earnings divided by total equity. ROA is the net income divided by total assets. Cash is
the cash balance scaled by total assets. TE is the shareholders’ equity scaled by total assets. Size is the log of
total assets in US dollars. G is the growth rate computed by annual log sales growth.
Country RE ROA Size Cash TE G
Australia -0.5419 -0.0177 4.5367 0.0798 0.5265 0.1449
Canada -0.0318 0.0024 5.7989 0.0627 0.4940 0.1592
United Kingdom 0.0488 0.0197 5.1589 0.0862 0.4457 0.1073
Hong Kong 0.0595 0.0282 5.9289 0.0986 0.5424 0.1130
India 0.1865 0.0639 5.5046 0.0305 0.4137 0.1429
Ireland 0.0756 0.0285 5.4909 0.1212 0.4356 0.1515
Israel 0.2399 0.0411 6.0402 0.1000 0.4073 0.1310
Sri Lanka 0.3035 0.0424 5.1371 0.0522 0.4326 0.1611
Malaysia 0.0837 0.0281 4.7272 0.0257 0.4967 0.1101
New Zealand 0.0404 0.0438 5.3366 0.0266 0.4831 0.0717
Pakistan 0.1559 0.0693 4.5557 0.0408 0.4229 0.1274
Singapore 0.1395 0.0312 4.8187 0.0657 0.5059 0.0952
Thailand -0.1521 0.0370 4.6235 0.0370 0.4315 0.0853
United States -0.0729 0.0101 6.0871 0.0872 0.4650 0.1205
South Africa 0.3795 0.0717 5.9196 0.0970 0.4743 0.1502
Zimbabwe 0.5465 0.2233 3.6960 0.0840 0.4741 0.1594
Common law mean 0.0913 0.0452 5.2100 0.0684 0.4657 0.1269
Common law
median 0.0797 0.0341 5.2478 0.0728 0.4696 0.1292
Panel B: Civil law countries
Country RE ROA Size Cash TE G
Argentina 0.0635 0.0395 7.0774 0.0101 0.4890 0.1037
Austria 0.2247 0.0251 5.9047 0.0680 0.3282 -0.0608
Belgium 0.0859 0.0289 5.5705 0.0471 0.3650 -0.1577
Switzerland 0.2770 0.0382 6.2431 0.0955 0.4328 0.0420
China 0.0819 0.0486 4.7718 0.1077 0.4648 0.2233
Czech Republic 0.2237 0.0314 6.8873 0.0350 0.5758 -0.0039
Germany 0.1060 0.0120 5.8442 0.0853 0.3448 0.0435
Denmark 0.4029 0.0339 5.2921 0.0822 0.4338 0.0611
Egypt 0.1640 0.0982 6.7457 0.0668 0.2953 0.1582
Spain 0.0748 0.0377 5.4422 0.0278 0.3965 -0.1918
Finland 0.3058 0.0384 6.0320 0.0692 0.3836 -0.0293
France 0.0399 0.0287 5.7792 0.0626 0.3557 -0.0239
Hungary 0.3714 0.0504 4.5444 0.0574 0.5752 0.1013
Indonesia -0.1178 0.0353 -0.0870 0.0435 0.4311 -0.1699
Italy 0.0915 0.0187 3.1783 0.0226 0.3407 0.0225
Japan 0.4084 0.0143 5.4882 0.1215 0.3800 0.0210
Korea 0.0838 0.0242 1.7822 0.0477 0.3697 0.1365
Netherlands 0.1017 0.0449 6.2297 0.0605 0.3665 0.0419
Norway 0.2673 0.0148 5.4755 0.1039 0.3752 0.1142
Panama 0.3376 0.0641 8.6039 0.0592 0.4382 0.1025
Peru 0.1255 0.0678 5.9179 0.0321 0.5806 0.1287
Philippines 0.1235 0.0254 5.5990 0.0654 0.4477 0.0819
Poland 0.1361 0.0438 5.6376 0.0603 0.5174 0.1531
Portugal -0.0812 0.0193 5.5266 0.0149 0.3609 -0.1989
Russia 0.3867 0.0793 6.6182 0.0414 0.5761 0.0029
Slovak Republic 0.1924 0.0287 6.1052 0.0704 0.5744 -0.0131
Sweden 0.2130 0.0109 5.6835 0.0769 0.4021 0.0945
Turkey 0.1732 0.0701 0.2060 0.0557 0.4484 -0.5101
Taiwan 0.0709 0.0402 5.9185 0.0935 0.4944 0.1443
Civil law mean 0.1701 0.0384 5.3110 0.0615 0.4325 0.0144
Civil law median 0.1361 0.0353 5.6835 0.0605 0.4311 0.0420
Sample mean 0.1417 0.0407 5.2815 0.0640 0.4441 0.0554
Sample median 0.1255 0.0353 5.5705 0.0627 0.4356 0.1013
115
Table 5 Shareholder rights, creditor rights, and labor rights indices and country-level control variables
Panel A: Common law countries All variables are defined in table 1. SR, CR, and LR are the shareholder rights, creditor rights, and labor rights indices, respectively. GOV_GUL is
government quality index. ECO_GLB is the economy globalization index. GDPG is the average GDP growth rate. Inflation is the average inflation rate.
Bank is domestic bank deposits/GDP. Bond is the private bond market capitalization/GDP. Stock Market is the stock market capitalization/GDP
Country SR CR LR
GOV_QU
L
ECO_GL
B GDPG Inflation Bank Bond Stock Market
Australia 0.76 3 0.26 1.67 4.33 2.079 3.01 0.835 0.263 0.865
Canada 0.64 1 0.3 1.53 4.69 1.702 2.24 1.037 0.210 0.853
United Kingdom 0.95 4 0.3 1.76 4.5 2.112 2.48 1.267 0.156 1.312
Hong Kong 0.96 4 0.22 1.95 6.93 4.062 -4.73 1.575 0.123 2.803
India 0.58 2 0.03 -0.15 2.71 3.167 3.67 0.413 0.009 0.383
Ireland 0.79 1 0.65 1.75 6.15 4.587 4.03 0.961 0.111 0.602
Israel 0.73 3 0.3 0.91 4.87 2.17 2.88 0.899 . 0.534
Sri Lanka 0.39 2 0.7 -0.11 4.13 3.273 7.67 0.299 . 0.151
Malaysia 0.95 3 0.1 0.67 4.15 3.725 1.85 1.205 0.399 1.651
New Zealand 0.95 4 0.24 1.68 4.91 1.291 2.17 1.075 0.000 0.411
Pakistan 0.41 1 0.1 -0.39 3.48 2.559 8.85 0.356 0.000 0.183
Singapore 1 3 0.24 1.85 5.51 4.673 -0.44 1.116 0.159 1.640
Thailand 0.81 2 0.1 0.37 3.37 4.657 0.4 1.190 0.102 0.531
United States 0.65 1 0.139 1.47 4.44 1.927 1.87 0.578 0.949 1.132
South Africa 0.81 3 0.3 0.68 3.89 -0.021 7.67 0.673 0.144 1.640
Zimbabwe 0.39 4 0.2 -2.21 2.93 -0.305 131.23 . . 0.417
Common law mean 0.736 2.563 0.261 0.839 4.437 2.604 10.928 0.899 0.202 0.944
Median 0.775 3.000 0.240 1.190 4.385 2.365 2.680 0.961 0.144 0.728
Table 5 Shareholder rights, creditor rights, and labor rights indices and country-level control variables
Panel B: Civil law countries
Country SR CR LR
GOV_QU
L
ECO_GL
B GDPG Inflation Bank Bond Stock Market
Argentina 0.34 1 0.3 -0.74 3.24 -0.284 7.83 0.274 0.047 0.316
Austria 0.21 3 0.52 1.53 5.13 1.945 1.5 1.230 0.328 0.196
Belgium 0.54 2 0.6 1.32 5.5 1.945 1.58 1.172 0.449 0.570
Brazil 0.27 1 0.25 0 3.44 0.87 9.33 0.577 0.087 0.310
Switzerland 0.27 1 0.25 1.45 5.16 0.98 0.86 1.716 0.439 1.891
Chile 0.63 2 0.12 1.41 4.63 3.779 4.1 0.546 0.159 0.865
China 0.76 2 0.14 -0.19 3.16 8.156 0.37 . 0.063 0.315
Colombia 0.57 0 0.078 0.1 3.41 1.244 9.12 0.353 0.005 0.178
Czech Republic 0.33 3 0.3 0.95 4.41 0.742 2.88 0.589 0.046 0.233
Germany 0.28 3 0.38 1.39 4.35 1.698 0.82 1.346 0.461 0.385
Denmark 0.46 3 0.8 1.81 4.42 1.618 2.13 0.962 1.099 0.486
Egypt 0.2 2 0.27 -0.44 3.41 2.74 3.41 0.709 . 0.300
Spain 0.37 2 0.13 1.06 4.81 2.068 3.81 1.172 0.228 0.566
Finland 0.46 1 0.84 1.7 5.15 2.424 1.52 0.714 0.284 0.902
France 0.38 0 0.09 1.06 4.79 1.728 1.41 1.040 0.450 0.606
Greece 0.22 1 0.354 0.79 4.65 1.451 3.45 0.738 0.023 0.389
Hungary 0.18 1 0.66 1.1 4.58 1.565 8.69 0.447 0.020 0.192
Indonesia 0.65 2 0.012 -0.26 3.54 3.853 12.4 0.446 0.014 0.223
Italy 0.42 2 0.4 0.84 3.64 1.99 2.48 0.870 0.358 0.340
Japan 0.5 2 0.24 1.27 4.16 2.247 -1.73 2.070 0.439 0.787
Panel B: Civil law countries (continued)
Country SR CR LR
GOV_QU
L
ECO_GL
B GDPG Inflation Bank Bond Stock Market
Korea 0.47 3 0.138 0.7 3.64 5.763 1.94 0.712 0.465 0.477
Morocco 0.56 1 . -0.15 3.14 1.4 0.87 0.528 . 0.278
Mexico 0.17 0 0.4 0.43 3.55 1.335 9.7 0.314 0.074 0.282
Netherlands 0.2 3 0.28 1.65 5.57 1.726 3.42 1.339 0.416 0.946
Norway 0.42 2 0.8 1.34 4.64 2.489 4.86 0.716 0.215 0.378
Panama 0.16 4 0.12 0.33 4.35 1.358 0.55 0.710 . 0.215
Peru 0.45 0 0.05 0.11 3.85 -0.037 2.36 0.195 0.024 0.240
Philippines 0.22 1 0.12 -0.06 3.17 0.443 5.59 0.429 0.003 0.491
Poland 0.29 1 0.13 0.64 3.67 3.18 3.8 0.322 0.000 0.145
Portugal 0.44 1 0.35 1 4.86 2.787 3.7 1.144 0.188 0.312
Russia 0.44 2 0.63 -0.45 3.07 -0.063 31.22 0.220 0.000 0.293
Slovak Republic 0.29 2 0.5 1.08 4.22 1.063 5.55 0.565 0.000 0.074
Sweden 0.33 1 0.9 1.44 5.05 1.689 1.61 0.721 0.476 0.895
Turkey 0.43 2 0.12 0.21 3.75 1.429 45.38 0.289 0.002 0.189
Taiwan 0.56 2 0.35 0.94 . 5.691 -1.11 . 0.218 1.013
Venezuela 0.09 3 0.28 -1.35 3.13 -1.5 26.31 0.144 0.004 0.091
Civil law mean 0.377 1.722 0.340 0.667 4.150 1.986 6.159 0.745 0.215 0.455
Civil law median 0.375 2.000 0.280 0.890 4.220 1.694 3.415 0.710 0.159 0.316
Sample mean 0.487 1.981 0.315 0.720 4.240 2.176 7.626 0.792 0.211 0.605
Sample median 0.440 2.000 0.270 0.925 4.330 1.936 2.945 0.714 0.150 0.400

115
Table 6 Firm determinants of decision to pay dividends
This table presents the regression results of the Logit model, where the dependent variable, Payer, equals
one if the firm pays dividends, otherwise equals zero. RE is the retained earnings divided by total equity.
ROA is the net income divided by total assets. Cash is the cash balance scaled by total assets. TE is the
shareholders’ equity scaled by total assets. Size is the log of total assets in US dollars. G is the growth rate
computed by annual log sales growth. Industry segment is defined by SIC code as in Table 2. Standard
errors are estimated by controlling for firm clustering effects.
Dependent Variable Payer
Primary Manufacture Advanced
Manufacture
Services Pooled
RE 1.2098*** 1.2689*** 1.5355*** 1.1573*** 1.3022***
(9.47) (11.24) (17.16) (19.52) (29.21)
ROA 6.5990*** 8.2283*** 6.2202*** 5.8567*** 6.4623***
(10.94) (17.25) (18.89) (22.81) (35.74)
Cash 0.4398 -0.8161** -1.0764*** 0.1378 -0.435***
(0.93) (2.26) (3.89) (0.63) (2.91)
TE -1.516*** -0.2926 -0.9985*** -0.995*** -0.898***
(6.41) (1.49) (6.85) (9.09) (11.79)
Size 0.1664*** 0.1599*** 0.1416*** 0.1159*** 0.1359***
(6.12) (10.79) (10.32) (9.74) (18.15)
Growth -1.237*** -0.4690*** -0.6419*** -0.678*** -0.714***
(8.06) (6.05) (9.07) (11.42) (17.02)
Constant 0.2742 0.1580 -0.0687 0.2918*** 0.2083***
(1.23) (1.09) (0.60) (3.06) (3.31)
Observations 11782 30478 44971 58648 145879 Robust z statistics in parentheses
* significant at 10%; ** significant at 5%; *** significant at 1%
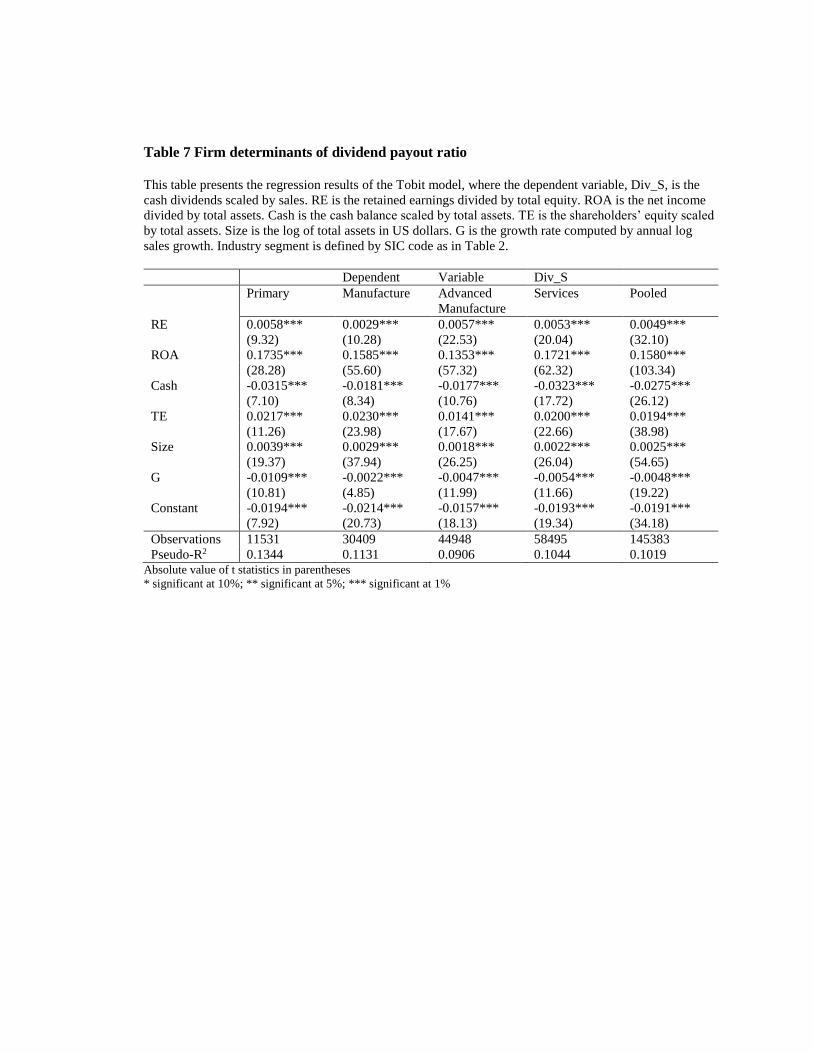
Table 7 Firm determinants of dividend payout ratio
This table presents the regression results of the Tobit model, where the dependent variable, Div_S, is the
cash dividends scaled by sales. RE is the retained earnings divided by total equity. ROA is the net income
divided by total assets. Cash is the cash balance scaled by total assets. TE is the shareholders’ equity scaled
by total assets. Size is the log of total assets in US dollars. G is the growth rate computed by annual log
sales growth. Industry segment is defined by SIC code as in Table 2.
Dependent Variable Div_S
Primary Manufacture Advanced
Manufacture
Services Pooled
RE 0.0058*** 0.0029*** 0.0057*** 0.0053*** 0.0049***
(9.32) (10.28) (22.53) (20.04) (32.10)
ROA 0.1735*** 0.1585*** 0.1353*** 0.1721*** 0.1580***
(28.28) (55.60) (57.32) (62.32) (103.34)
Cash -0.0315*** -0.0181*** -0.0177*** -0.0323*** -0.0275***
(7.10) (8.34) (10.76) (17.72) (26.12)
TE 0.0217*** 0.0230*** 0.0141*** 0.0200*** 0.0194***
(11.26) (23.98) (17.67) (22.66) (38.98)
Size 0.0039*** 0.0029*** 0.0018*** 0.0022*** 0.0025***
(19.37) (37.94) (26.25) (26.04) (54.65)
G -0.0109*** -0.0022*** -0.0047*** -0.0054*** -0.0048***
(10.81) (4.85) (11.99) (11.66) (19.22)
Constant -0.0194*** -0.0214*** -0.0157*** -0.0193*** -0.0191***
(7.92) (20.73) (18.13) (19.34) (34.18)
Observations 11531 30409 44948 58495 145383
Pseudo-R2 0.1344 0.1131 0.0906 0.1044 0.1019 Absolute value of t statistics in parentheses
* significant at 10%; ** significant at 5%; *** significant at 1%
Table 8 Labor rights and Decision to Pay Dividends This table presents the regression results of pooled fixed-effect Logit model as the following (with firm
subscription suppressed):
Where the dependent variable, Payer, equals 1 if the firm pays dividends, otherwise equals zero. RE is the
retained earnings divided by total equity. ROA is the net income divided by total assets. Cash is the cash
balance scaled by total assets. TE is the shareholders’ equity scaled by total assets. Size is the log of total
assets in US dollars. G is the growth rate computed by annual log sales growth. SR, and CR are shareholder
rights and creditor rights from Djankov et al. (2008) and Djankov et al. (2007), respectively. LR is the labor
rights from Botero et al. (2004). The sample period is 1990-2007. Standard errors are estimated by
controlling for firm clustering effects.
Payer
Full sample Full sample Common law
countries
Civil law
countries
RE 1.3208*** 1.2435*** 0.8386*** 3.4291***
(28.73) (27.02) (19.02) (36.71)
ROA 7.1445*** 7.4904*** 6.7300*** 10.3439***
(37.34) (37.29) (27.11) (30.15)
Cash -0.7523*** -0.6156*** -2.9419*** 0.1837
(5.04) (3.93) (12.25) (0.78)
TE -0.6202*** -0.7307*** -0.8857*** -0.0380
(7.89) (8.86) (7.11) (0.32)
Size 0.2124*** 0.2016*** 0.3755*** 0.1643***
(26.07) (24.59) (22.26) (17.34)
G -0.7057*** -0.6472*** -1.1441*** -0.3326***
(18.61) (17.28) (20.00) (9.72)
SR -1.4585*** -1.2890*** 0.0874 -0.6381***
(13.71) (12.00) (0.27) (4.05)
CR 0.7338*** 0.7266*** 0.8690*** 0.2293***
(33.75) (33.00) (19.18) (8.56)
LR -0.2547*** -0.1647* 1.7862*** -0.9253***
(2.67) (1.70) (6.19) (8.82)
Constant -0.5990*** -0.8393*** -3.0674*** -0.2240
(7.06) (8.21) (12.22) (1.46) Observations 145879 135349 68243 67106 Year fixed effects Yes Yes Yes Yes Industry fixed effects No Yes Yes Yes Pseudo-R squared 0.2289 0.2311 0.3213 0.2517
Robust z statistics in parentheses
* significant at 10%; ** significant at 5%; *** significant at 1%
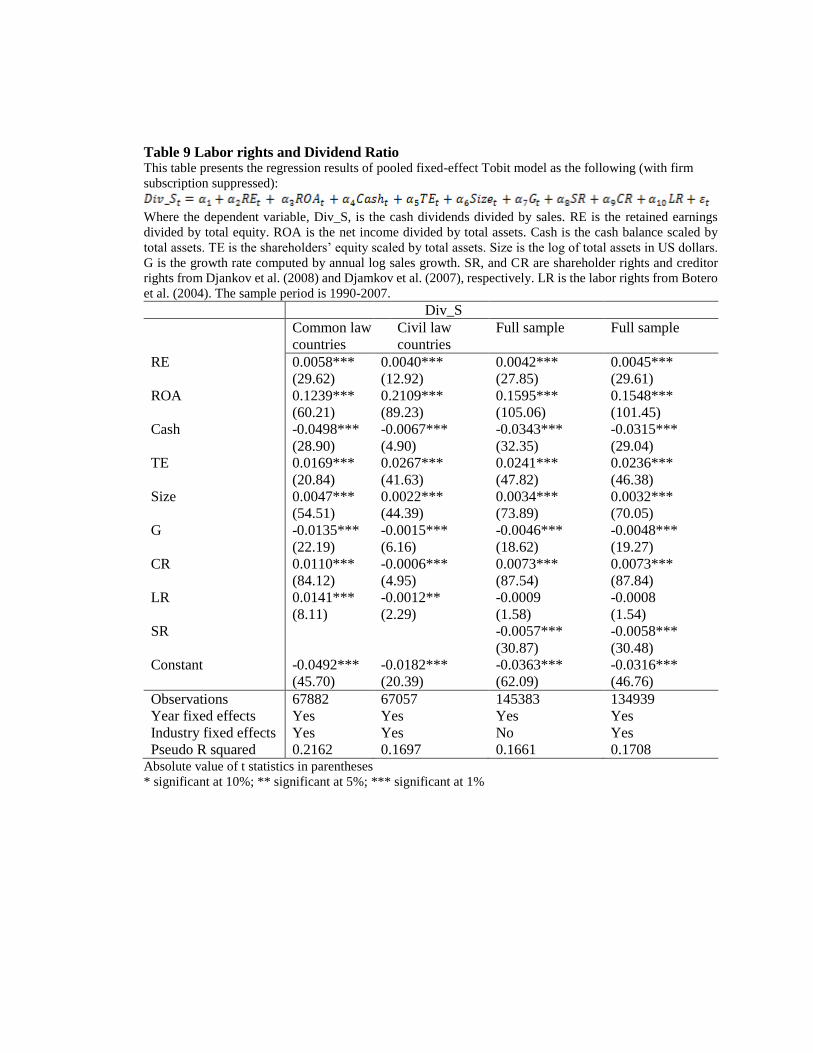
Table 9 Labor rights and Dividend Ratio This table presents the regression results of pooled fixed-effect Tobit model as the following (with firm
subscription suppressed):
Where the dependent variable, Div_S, is the cash dividends divided by sales. RE is the retained earnings
divided by total equity. ROA is the net income divided by total assets. Cash is the cash balance scaled by
total assets. TE is the shareholders’ equity scaled by total assets. Size is the log of total assets in US dollars.
G is the growth rate computed by annual log sales growth. SR, and CR are shareholder rights and creditor
rights from Djankov et al. (2008) and Djamkov et al. (2007), respectively. LR is the labor rights from Botero
et al. (2004). The sample period is 1990-2007.
Div_S
Common law
countries
Civil law
countries
Full sample Full sample
RE 0.0058*** 0.0040*** 0.0042*** 0.0045***
(29.62) (12.92) (27.85) (29.61)
ROA 0.1239*** 0.2109*** 0.1595*** 0.1548***
(60.21) (89.23) (105.06) (101.45)
Cash -0.0498*** -0.0067*** -0.0343*** -0.0315***
(28.90) (4.90) (32.35) (29.04)
TE 0.0169*** 0.0267*** 0.0241*** 0.0236***
(20.84) (41.63) (47.82) (46.38)
Size 0.0047*** 0.0022*** 0.0034*** 0.0032***
(54.51) (44.39) (73.89) (70.05)
G -0.0135*** -0.0015*** -0.0046*** -0.0048***
(22.19) (6.16) (18.62) (19.27)
CR 0.0110*** -0.0006*** 0.0073*** 0.0073***
(84.12) (4.95) (87.54) (87.84)
LR 0.0141*** -0.0012** -0.0009 -0.0008
(8.11) (2.29) (1.58) (1.54)
SR -0.0057*** -0.0058***
(30.87) (30.48)
Constant -0.0492*** -0.0182*** -0.0363*** -0.0316***
(45.70) (20.39) (62.09) (46.76)
Observations 67882 67057 145383 134939
Year fixed effects Yes Yes Yes Yes
Industry fixed effects Yes Yes No Yes
Pseudo R squared 0.2162 0.1697 0.1661 0.1708 Absolute value of t statistics in parentheses
* significant at 10%; ** significant at 5%; *** significant at 1%

Table 10 Variance Inflation factors (VIF) of Tobit model
Variable VIF Tolerance R-squared
SR 1.59 0.6306 0.3694
CR 1.53 0.6515 0.3485
LR 1.28 0.7826 0.2174
Mean
VIF 1.47
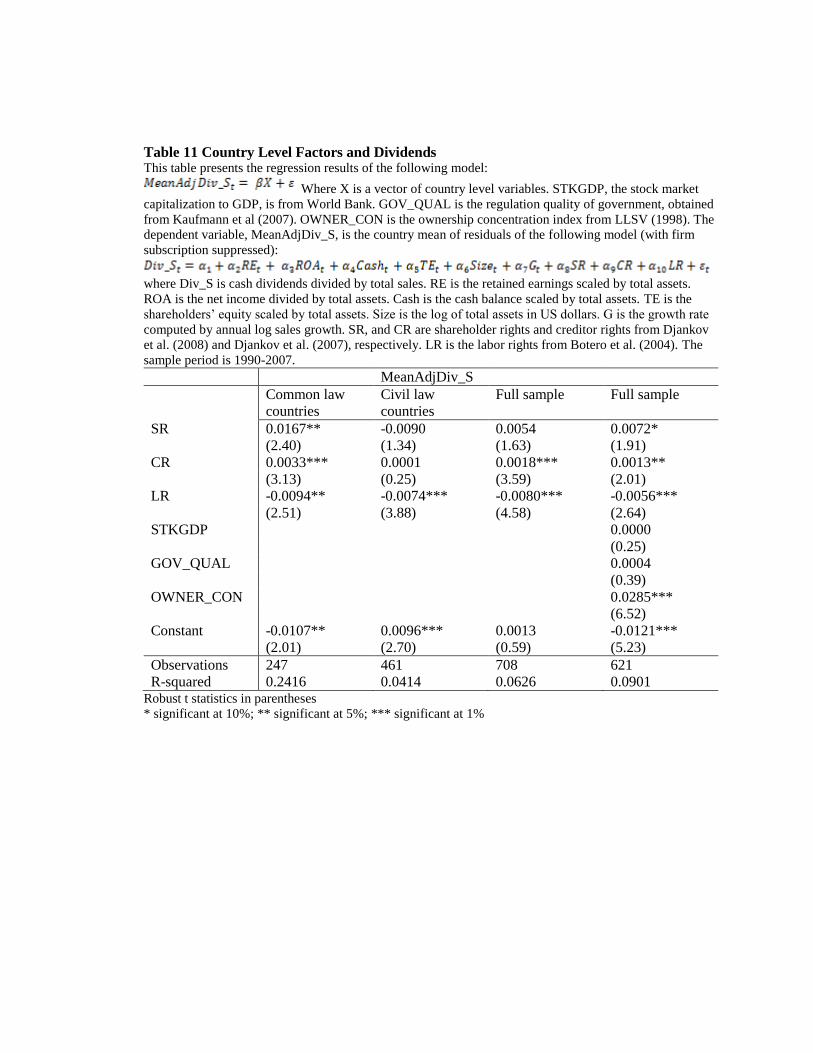
Table 11 Country Level Factors and Dividends This table presents the regression results of the following model:
Where X is a vector of country level variables. STKGDP, the stock market
capitalization to GDP, is from World Bank. GOV_QUAL is the regulation quality of government, obtained
from Kaufmann et al (2007). OWNER_CON is the ownership concentration index from LLSV (1998). The
dependent variable, MeanAdjDiv_S, is the country mean of residuals of the following model (with firm
subscription suppressed):
where Div_S is cash dividends divided by total sales. RE is the retained earnings scaled by total assets.
ROA is the net income divided by total assets. Cash is the cash balance scaled by total assets. TE is the
shareholders’ equity scaled by total assets. Size is the log of total assets in US dollars. G is the growth rate
computed by annual log sales growth. SR, and CR are shareholder rights and creditor rights from Djankov
et al. (2008) and Djankov et al. (2007), respectively. LR is the labor rights from Botero et al. (2004). The
sample period is 1990-2007.
MeanAdjDiv_S
Common law
countries
Civil law
countries
Full sample Full sample
SR 0.0167** -0.0090 0.0054 0.0072*
(2.40) (1.34) (1.63) (1.91)
CR 0.0033*** 0.0001 0.0018*** 0.0013**
(3.13) (0.25) (3.59) (2.01)
LR -0.0094** -0.0074*** -0.0080*** -0.0056***
(2.51) (3.88) (4.58) (2.64)
STKGDP 0.0000
(0.25)
GOV_QUAL 0.0004
(0.39)
OWNER_CON 0.0285***
(6.52)
Constant -0.0107** 0.0096*** 0.0013 -0.0121***
(2.01) (2.70) (0.59) (5.23)
Observations 247 461 708 621
R-squared 0.2416 0.0414 0.0626 0.0901 Robust t statistics in parentheses
* significant at 10%; ** significant at 5%; *** significant at 1%