Embed Size (px)
DESCRIPTION
an overview about the satisfaction level of the mcdonalds
Citation preview
EMPLOYEE SATISFACTION IN
Sonal Jain Pranika Gupta Abhimanyu Sharma
INTRODUCTION ABOUT THE STUDY
Job satisfaction refers to a person’s feeling of satisfaction on the job,
which acts as a motivation to work.
DETERMINANTS OF JOB SATISFACTIONORGANIZATIONAL VARIABLES, • Occupational level• Job content• Considerate leadership• Pay and promotional
opportunities• Interaction in the workgroup
PERSONAL VARIABLES• Age• Educational levels• Sex• Role perception
The scope of this study is to understand the satisfaction of the delivery staffs in the McDonald. The study is useful to the McDonald to know the level of satisfaction and needs of the employees.
SCOPE OF STUDY
OBJECTIVES OF STUDYThe following are the objectives of the present study.To determine the level of satisfaction of the
respondents regarding their job.To study and understand the job satisfaction
among the employees of McDonald.To study the various factors which influencing
job satisfaction.To study the relationship between the personal
factors of the employee (Income, Designation, Educational qualification, Gender, etc.,)
To offer suggestions to the McDonald to improve their employee’s satisfactory level
RESEARCH METHODOLOGY
The methodology this study consists of both primary and secondary data.
These dates collected from the respondents were through questionnaires. The primary data were collected from the respondents;
The secondary data were collected from the books

SAMPLE SIZE
• The items selected constitute what is technically called a sample.
• Here out sample size is 150 employees from the total population in the delivery peoples.
• The samples are selected on the basis of convenient.
QUESTIONNAIRE SCHEDULE
Questions are framed in such a way that the answers reflect the ideas and thoughts of the respondents with regard to level of satisfaction of various factors of job satisfaction. The following scaling techniques have been used for each question in the interviews schedule. A = AgreeDA = Dis AgreeUD = UndecidedSA = Strongly agreeSDA = Strongly Dis agree
TOOLS OF ANALYSIS
Simple percentage analysis:
Here the simple percentage analysis is used for calculating the percentage of satisfaction level in
the total respondents.
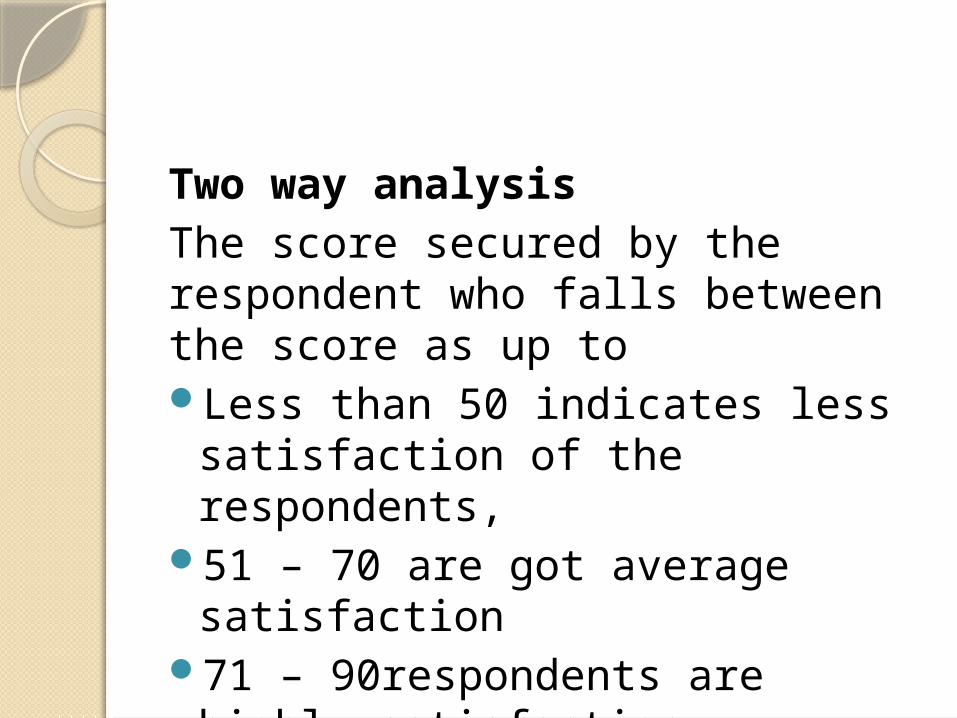
Two way analysisThe score secured by the respondent who falls between the score as up toLess than 50 indicates less
satisfaction of the respondents, 51 – 70 are got average
satisfaction71 – 90respondents are highly
satisfaction

Limitation of study The research was conducted within a limited duration. So a
detailed and comprehensive study could not be made. The sample was confined to 150 respondents. So this
study cannot be regarded as “full – proof” one. Some respondents hesitated to give the actual situation;
they feared that management would take any action against them.
There was a fear of reprisal among the employees to reveal their personal feelings and the result may not reflect the actual satisfactions.
The research was conducted within delivery staffs only. So it is not reflect the other official employee’s job satisfaction.
The findings and conclusions are based on knowledge and experience of the respondents sometime may subject to bias.
ANALYSIS AND INTERPRETATIONPreparing percentage analysis, test does the
analysis of job satisfaction, which is directly extracted from the questionnaire.
The variations in the extent of the employee satisfaction can be measured with the variables such as job secured, promotional opportunity, relationship with management, and satisfaction factors of the respondents
Calculation of Satisfactory Scores
The Respondents were asked to state their level of Satisfaction relating to twenty factors.
Based on their responses the Satisfaction score obtained by each respondent was found out. Points or scores were allocated based on the response.
For each of the factor three levels of satisfaction were assigned namely high, medium and low.
For high satisfaction three points were given, for Medium two and for low satisfaction one point was given.
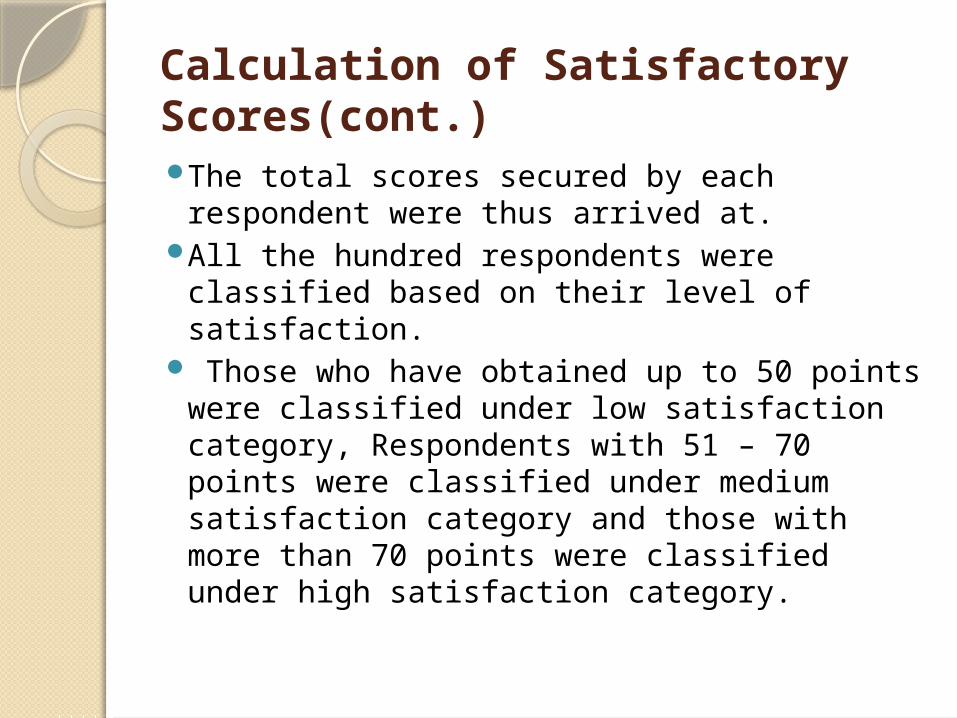
Calculation of Satisfactory Scores(cont.)The total scores secured by each
respondent were thus arrived at. All the hundred respondents were
classified based on their level of satisfaction.
Those who have obtained up to 50 points were classified under low satisfaction category, Respondents with 51 – 70 points were classified under medium satisfaction category and those with more than 70 points were classified under high satisfaction category.
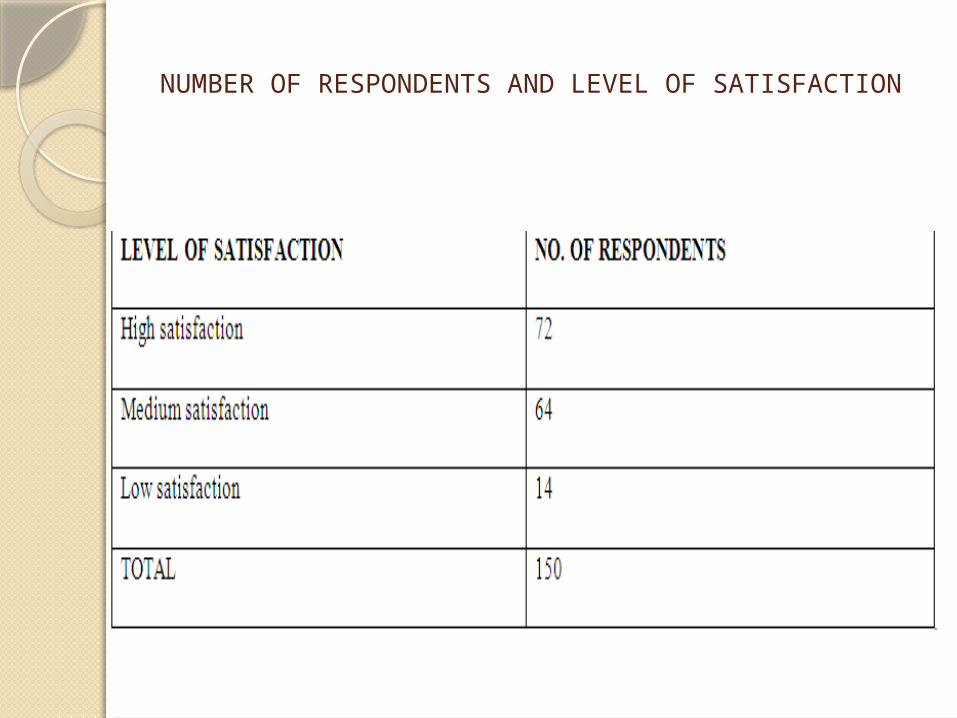
NUMBER OF RESPONDENTS AND LEVEL OF SATISFACTION
SIMPLE PERCENTAGE TABLES
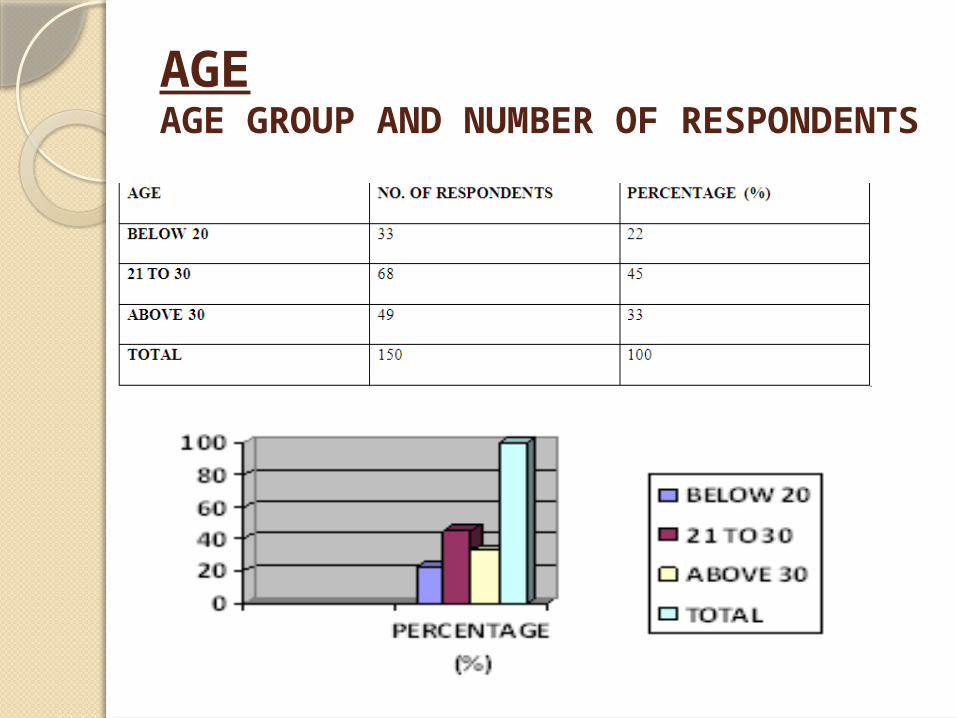
AGEAGE GROUP AND NUMBER OF RESPONDENTS
INTERPRETATION
Majority of the respondents (45%) are in 21 to 30 years age group and 33% of the respondents are above 30 years age group and 22% of the respondents are below 20 years age group.

GENDERGENDER AND NUMBER OF RESPONDENTS
:
INTERPRETATION
Majority of the respondents (82%) are male and 18% of the respondents are female
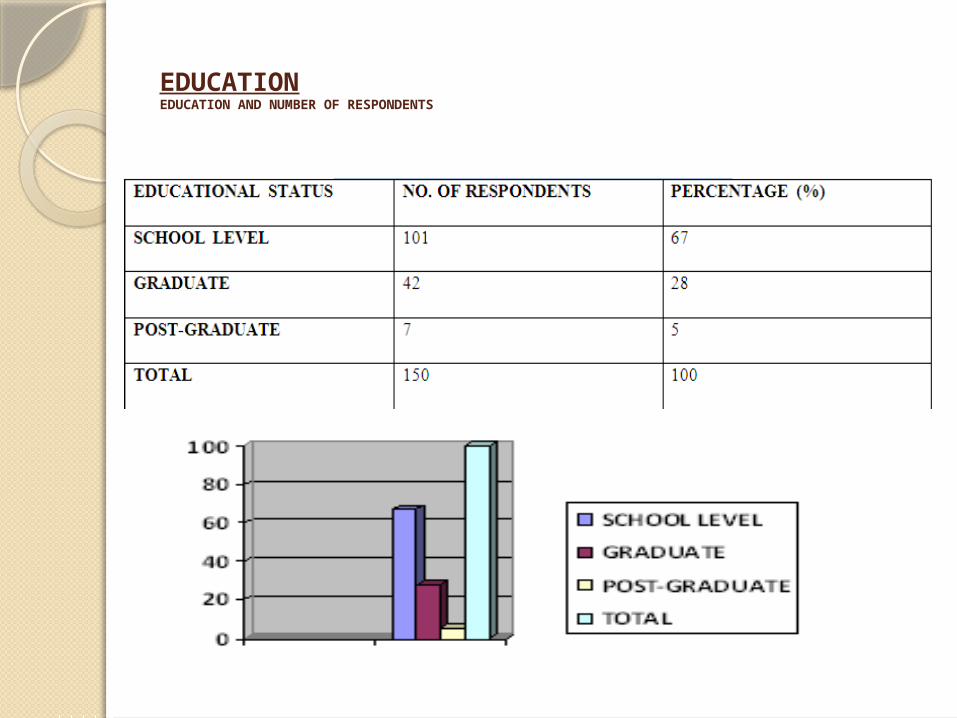
EDUCATIONEDUCATION AND NUMBER OF RESPONDENTS

INTERPRETATION
Majority of the respondents (67%) are school level and 28% of the respondents are graduate and 5% of the respondents are post graduate.
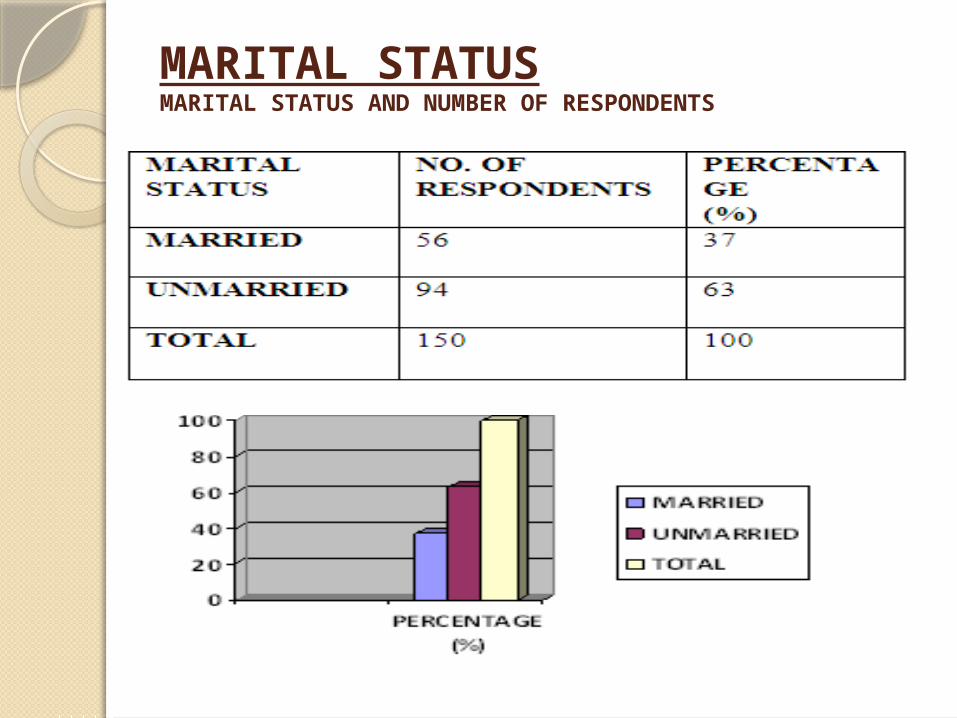
MARITAL STATUSMARITAL STATUS AND NUMBER OF RESPONDENTS
INTERPRETATION
Majority of the respondents (63%) are unmarried and 37% of the respondents are married.
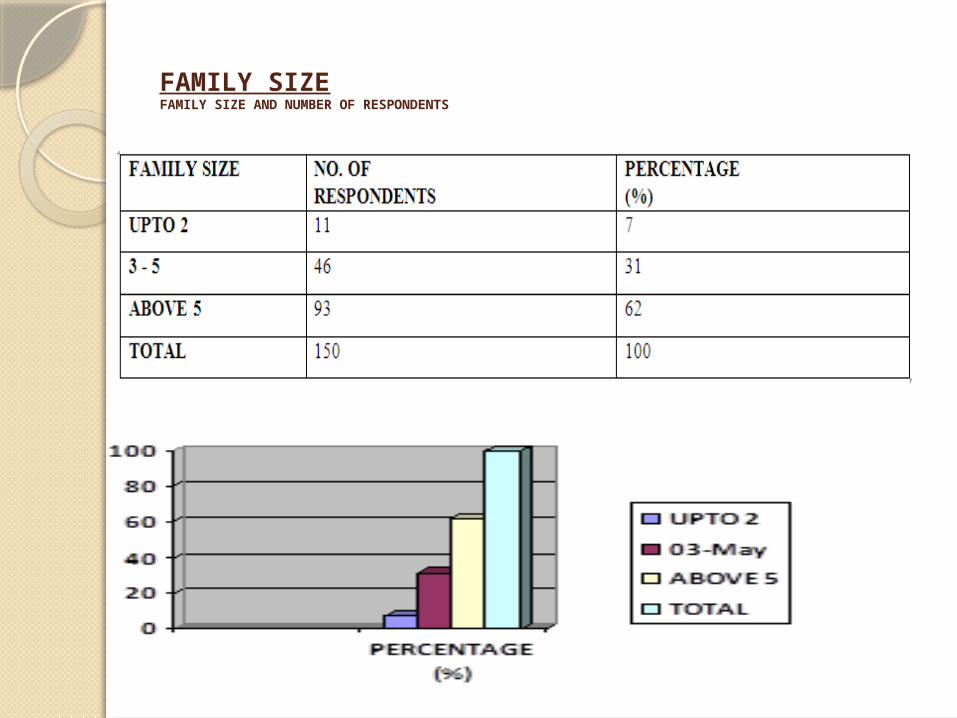
FAMILY SIZEFAMILY SIZE AND NUMBER OF RESPONDENTS

INTERPRETATION
Majority of the respondents (62%) are above 5 members in a family and 31% of the respondents are 3 to 5 members and 7% of the respondents are up to 2 members
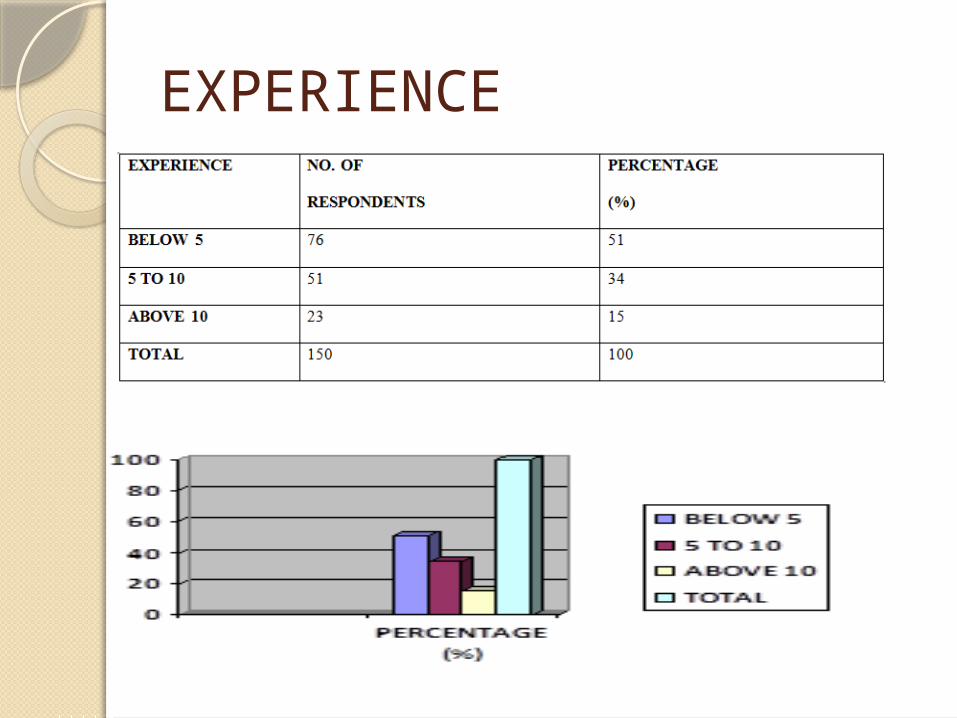
EXPERIENCE

INTERPRETATION
Majority of the respondents (51%) are below 5 years and 34% of the respondents are 5 – 10 years and 15% of the respondents are above 10 years.
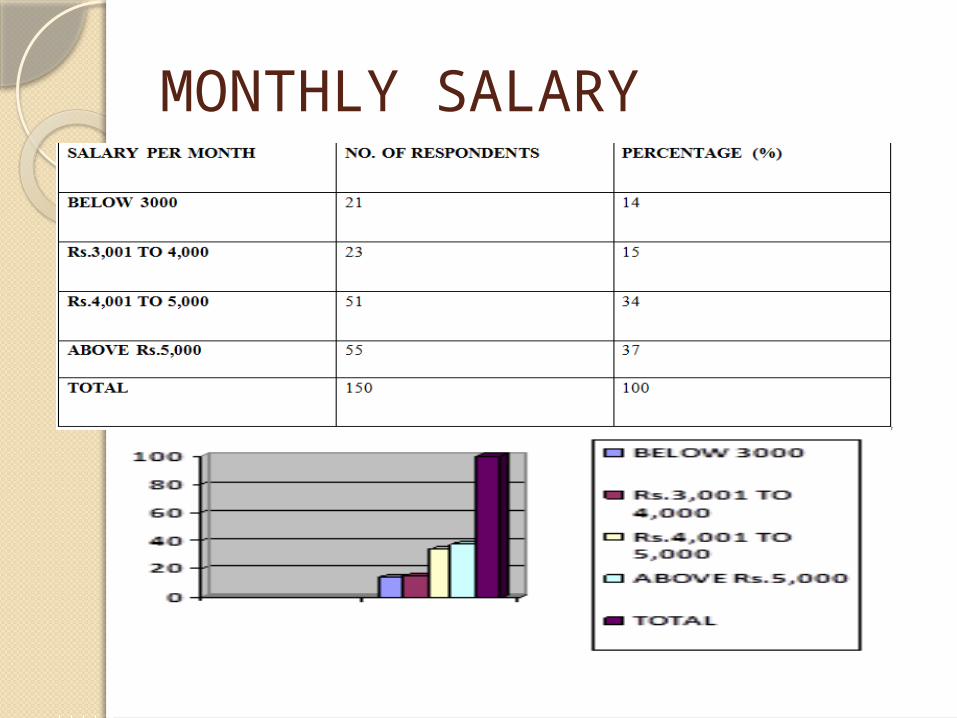
MONTHLY SALARY
INTERPRETATION
Majority of the respondents (37%) are above Rs.5, 000 and 34% of the respondents are4,001 – 5,000 and 15% of the respondents are 3,001 – 4,000 and the remaining 14% ofRespondents are below 3,000
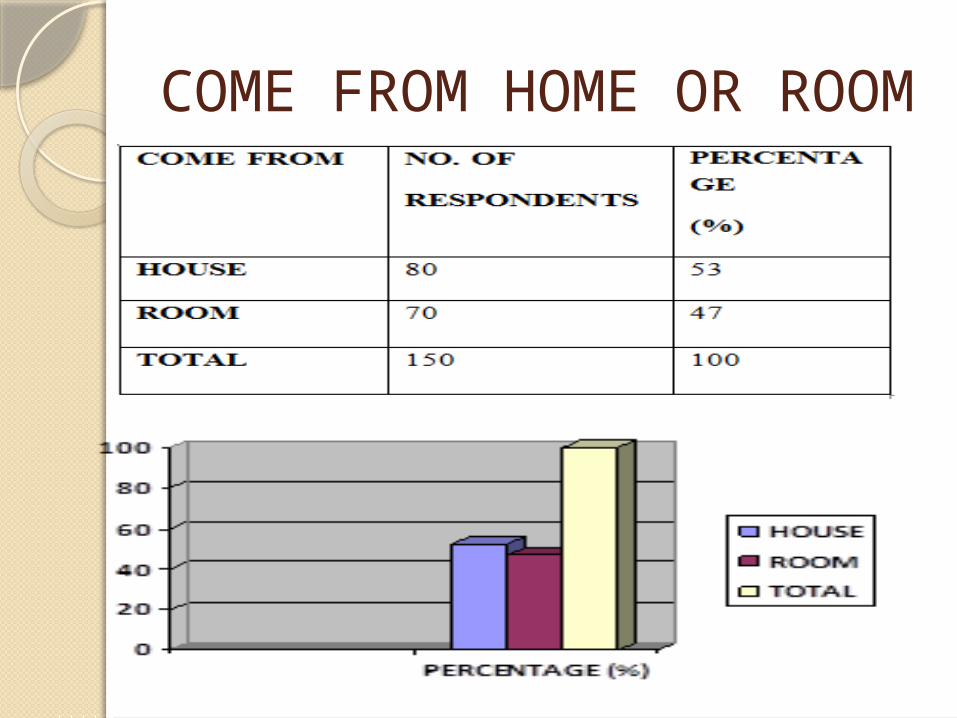
COME FROM HOME OR ROOM
INTERPRETATION
There is no high deviation in the number of respondents from room and from house. 53% of respondents are come from their house and the 47% of respondents are come from room provided by the courier.
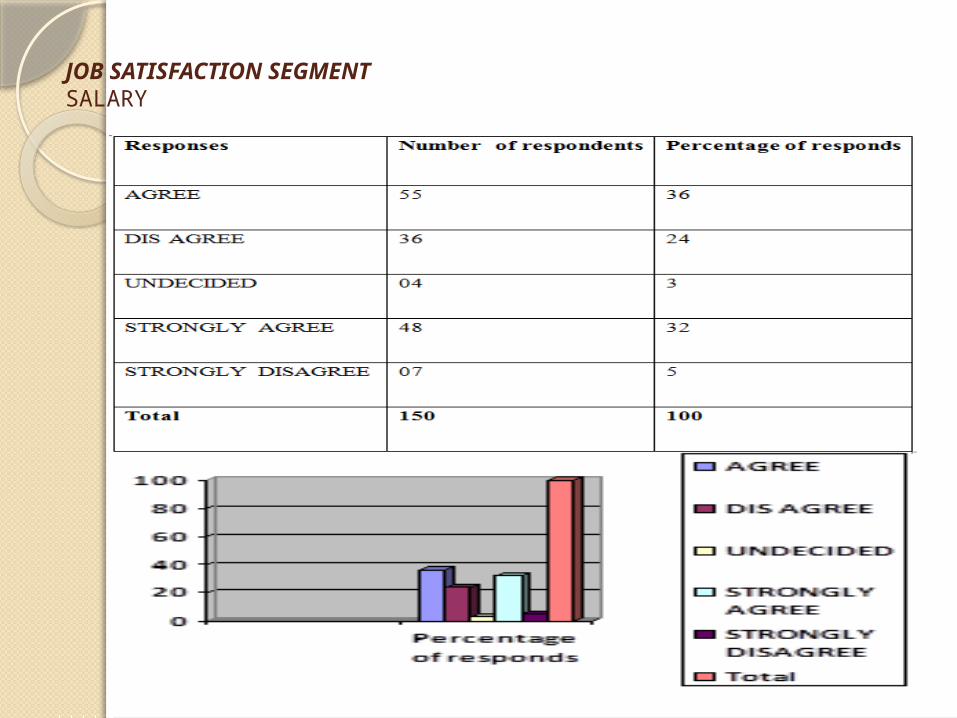
JOB SATISFACTION SEGMENT SALARY
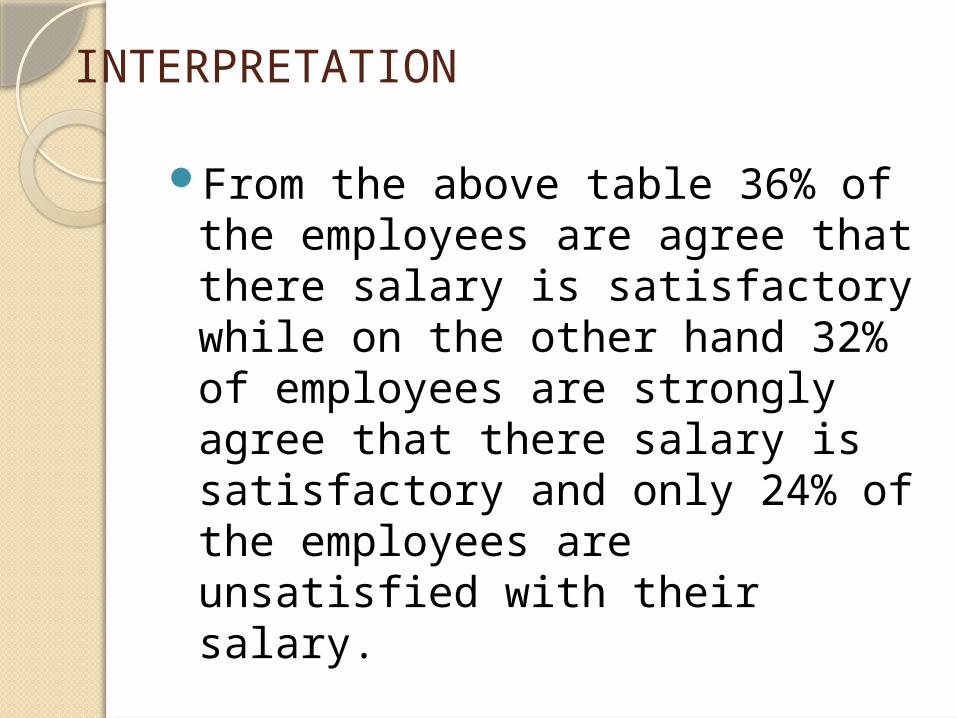
INTERPRETATION
From the above table 36% of the employees are agree that there salary is satisfactory while on the other hand 32% of employees are strongly agree that there salary is satisfactory and only 24% of the employees are unsatisfied with their salary.
FINDINGS, SUGGESTIONS AND CONCLUSION
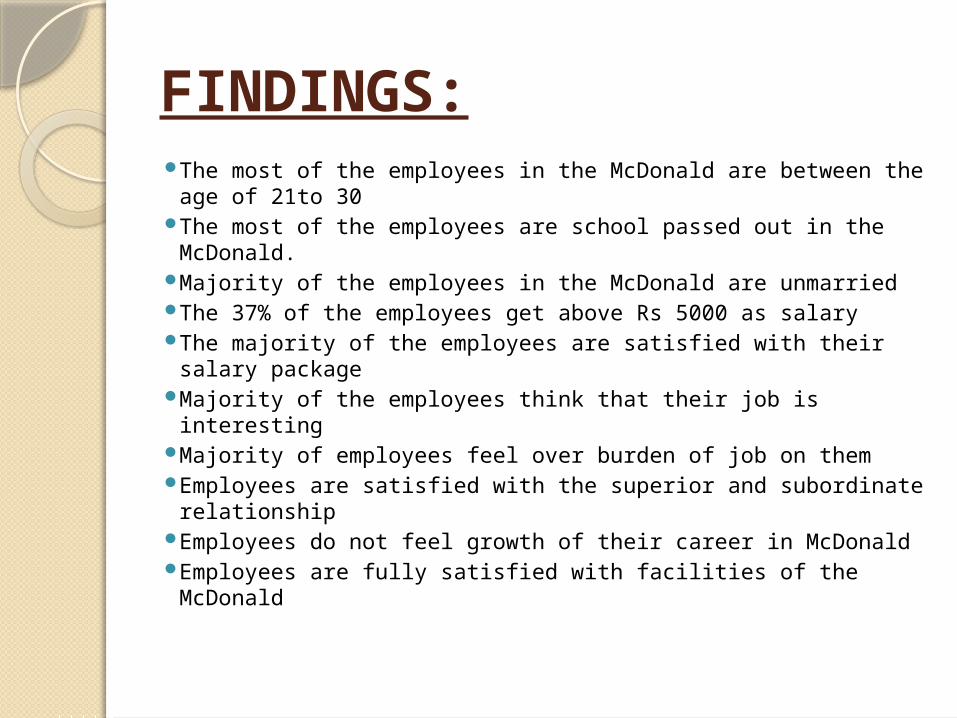
FINDINGS: The most of the employees in the McDonald are between
the age of 21to 30 The most of the employees are school passed out in the
McDonald. Majority of the employees in the McDonald are unmarried The 37% of the employees get above Rs 5000 as salary The majority of the employees are satisfied with their
salary package Majority of the employees think that their job is interesting Majority of employees feel over burden of job on them Employees are satisfied with the superior and subordinate
relationship Employees do not feel growth of their career in McDonald Employees are fully satisfied with facilities of the McDonald
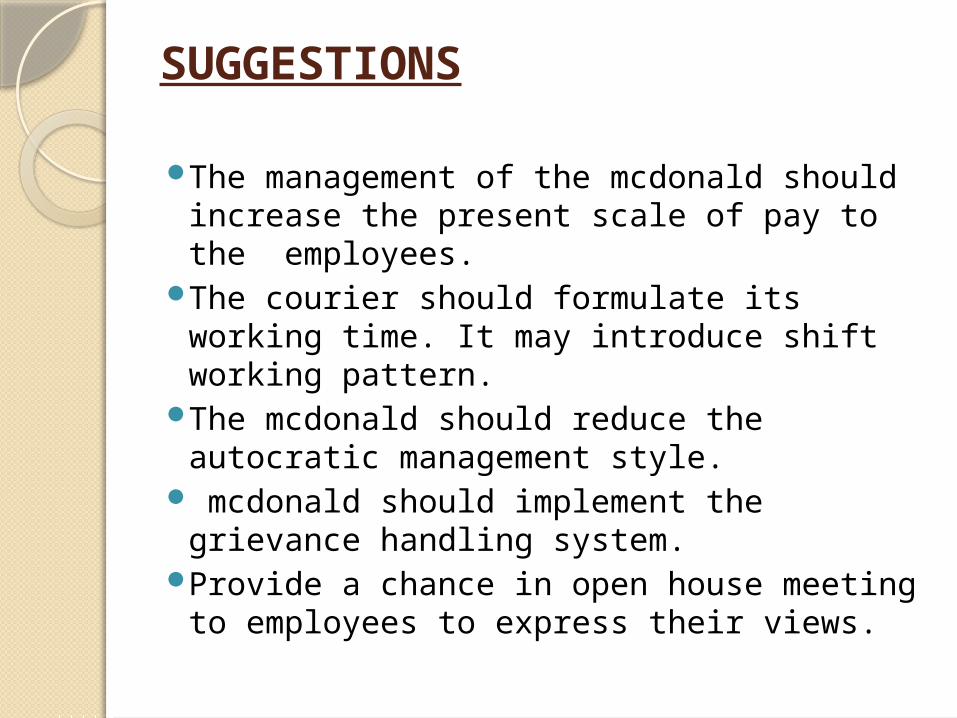
SUGGESTIONS
The management of the mcdonald should increase the present scale of pay to the employees.
The courier should formulate its working time. It may introduce shift working pattern.
The mcdonald should reduce the autocratic management style.
mcdonald should implement the grievance handling system.
Provide a chance in open house meeting to employees to express their views.
CONCLUSION
The study on employee’s satisfaction at McDonald is cased out with full co-operation of the employees and management.
As far as possible with in the given limits the study is completed with the satisfaction of many peoples.
The data collected are analyzed scientifically and the results obtained are free to nearly 80%.
It is assured that the company may got high boosted moral in the organization provided some of the suggestions made in the report in carried out