Embed Size (px)
Citation preview
Saïd Business SchoolResearch Papers
Saïd Business School WP 2019-04
The Saïd Business School’s working paper series aims to provide early access to high-quality and rigorous academic research. Oxford Saïd’sworking papers reflect a commitment to excellence, and an interdisciplinary scope that is appropriate to a business school embedded in one of theworld’s major research universities.
This paper is authored or co-authored by Oxford Saïd faculty. It is circulated for comment and discussion only. Contents should be consideredpreliminary, and are not to be quoted or reproduced without the author’s permission.
Employee Wellbeing, Productivity, and FirmPerformance
Christian KrekelLondon School of Economics
George WardMIT Sloan
Jan-Emmanuel De NeveSaïd Business School, University of Oxford
March 2019
Employee Wellbeing, Productivity, and Firm Performance1
Christian KrekelLondon School of Economics
George WardMIT Sloan
Jan-Emmanuel De NeveUniversity of Oxford
3 March 2019
1 This paper was reviewed by the members of the Workplace Wellbeing Committee on the Global Hap-piness Council and published as part of the 2019 Global Happiness and Wellbeing Policy Report. Thefeedback and comments by Council members have much improved the quality of this chapter. We areparticularly grateful to James Harter and the research team at Gallup for their help with the meta-anal-yses on employee wellbeing and firm performance. De Neve serves as a research advisor to ButterflyAI, Psychological Technologies, and the Gallup Organization.
2
Abstract
Does higher employee wellbeing lead to higher productivity, and, ultimately, to tangible bene-
fits to the bottom line of businesses? We survey the evidence and study this question in a meta-
analysis of 339 independent research studies, including the wellbeing of 1,882,131 employees
and the performance of 82,248 business units, originating from 230 independent organisations
across 49 industries in the Gallup client database. We find a significant, strong positive corre-
lation between employees' satisfaction with their company and employee productivity and cus-
tomer loyalty, and a strong negative correlation with staff turnover. Ultimately, higher wellbe-
ing at work is positively correlated with more business-unit level profitability.
3
1. Introduction
The wellbeing of employees is a good in itself. But an important question frequently arises as
to whether there are any objective benefits to making the subjective wellbeing of workers a
priority. Clearly, implementing policies that promote worker wellbeing can be resource-inten-
sive. And in times of limited budgets and competing priorities, the issue often boils down to the
question: is it worth it? Ultimately, businesses and policy-makers alike want to know: are there
any objective returns to – or, more generally, is there a compelling business case for – spending
scarce resources to ensure and enhance wellbeing in the workplace?
It is on this key question that this paper is focused. We attempt to shed light on the issue in
different ways: first, we review the most recent and robust empirical evidence from the aca-
demic literature on the links between wellbeing and performance. Second, as the main contri-
bution of this paper, we conducted a meta-analysis of research studies done by the Gallup Or-
ganization for their clients investigating the nexus between employee satisfaction and various
firm performance outcomes. Taken together, the evidence very much suggests the answer to
the overarching question is "yes" – there is a strong business case for promoting the wellbeing
of workers.2
The data accumulated by Gallup in their client work over the past few decades yields a rich
seam of data on employee wellbeing and firm performance. In total, we study 339 independent
research studies that have been accumulated by Gallup, including the wellbeing of 1,882,131
employees and the performance of 82,248 business units, originating from 230 independent
organisations across 49 industries in 73 countries. We tabulate the correlations between em-
ployee wellbeing and various firm performance outcomes at the business-unit level, and then
apply meta-analytic methods to obtain average correlations across studies, adjusted for differ-
ences in sample size, measurement error, and other statistical idiosyncrasies between the 339
original research studies.
2 We focus, in particular, on the direct returns to workplace wellbeing in terms of employee productivityand aggregate firm performance – arguably the most relevant outcomes for business. There are, ofcourse, many other positive returns to workplace wellbeing such as better health and longevity (De Neveet al., 2013; Graham, 2017) or improved job finding and future (non-pecuniary) job prospects (Akerlofet al., 1988; Krause, 2013; Gielen and van Ours, 2014; see Walsh et al. 2018 for a review), which indi-rectly contribute to more efficient labour markets and a more productive workforce. The returns pre-sented here can thus be seen as lower bounds to investments into workplace wellbeing.
4
Of course, correlation does not imply causation. The breadth and depth of the Gallup data
provide us with unique insights into the relationship between employee wellbeing and firm
performance. But we also seek to enrich this evidence with supporting, complementary empir-
ical evidence from the academic literature. In doing so, we focus on the "causal-design" litera-
ture, and in particular, identify studies using laboratory or field experiments as well as those
exploiting 'natural' experiments occurring in the real business world. Our aim is to bring to-
gether the most recent and robust studies that credibly certify (or at least strongly suggest) cau-
sality of the effect of happiness on productivity, while paying attention at the specific mecha-
nisms through which happiness may affect productivity.
This paper is structured as follows. In Section 2, we review the theoretical as well as empir-
ical literature on the relationship between employee wellbeing and productivity at the individual
level. We ask the question: do happier workers work better? Then, in Section 3, we move on to
the firm-level, and attempt to assess the relationship between aggregate-level wellbeing and
firm performance. Here, the key question is: do the insights at the individual-level translate into
tangible benefits on the bottom line of business? We first leverage the Gallup client data to
provide a correlational meta-analysis, and then supplement that evidence with more causal re-
search designs from the academic literature. Finally, in Section 4, we conclude by providing an
outlook on likely future developments in the area, by identifying key gaps to date, as well as
fascinating research opportunities in the future.
2. Individual-Level Wellbeing and Productivity
2.1 Theoretical Background
Before assessing the evidence on the relationship between employee wellbeing and productiv-
ity, it is useful to first take one step back and reflect on why we might expect employee well-
being to affect productivity in the first place.
5
Several different theories have been studied in the literature.3 Perhaps the most long-running
and widely-known is Human Relations Theory. Going back nearly a century, the human rela-
tions movement has hypothesised that higher employee wellbeing – typically measured in terms
of job satisfaction (a cognitive, evaluative judgement) – is associated with higher morale,
which, in turn, leads to higher productivity (see Strauss (1968), for example). This framework
is in line with research showing that positive attitudes towards a particular life domain carry
with them positive behavioural implications (Fishbein and Ajzen, 1975). Following this rea-
soning, higher job satisfaction, with presumably more favourable attitudes towards work and
the workplace, should be associated with less absenteeism or staff turnover, among other im-
portant outcomes.4
More recently, there has been a more "emotional turn" to the research. Emotion Theory pos-
tulates that employees' emotional states can affect and drive their performance (see Staw et al.
(1994), for example).5 There are several different channels through which this may take place.
First, positive affect – or "mood" – may itself lead to heightened motivation, and hence better
job outcomes and organisational citizenship (Isen and Baron, 1991). A further channel is
through positive, stimulating arousal, either directly (Russell, 2003) or indirectly via changes
in attitudes or behaviour (Baumeister et al., 2007).6
A related stream of work stresses the positive effect of emotions on creativity, arguing that
positive affect leads to what psychologists call cognitive variation (Clore et al., 1994). Here,
three mechanisms are proposed in the psychological literature: first, positive affect increases
the number of cognitive elements available for association. Second, it increases – through de-
focused attention – the breadth of these elements. Finally, it increases cognitive flexibility, and
hence the probability that cognitive elements become associated with each other (Isen, 1999) –
for example, helping people make connections between ideas for a new project. In other words,
3 See Judge et al. (2001) for a review of theories on the wellbeing-productivity nexus and Tenney et al.(2016) for a review of the literature more generally.4 Conversely, expectancy-based theories of motivation postulate that employee productivity followsfrom the (expectation of) rewards (which may include higher wellbeing) generated by eliciting effort(Lawler and Porter, 1967; Schwab and Cummings, 1970). Although there is no consensus about thedirection of causality, empirical evidence is mounting that causality runs from employee wellbeing toproductivity rather than the other way around.5 See Lerner et al. (2015) for a more detailed overview of the effects of emotions on decision-making.6 There is also a growing body of literature documenting the importance of emotions for risk attitudesand patience (see Meier (2018), for example), through changing the risk or temporal appraisal of situa-tions (Lerner and Keltner, 2000, 2001), which constitutes another, indirect attitudinal channel.
6
positive affect increases the number and diversity of our thoughts, helps us muse about them
more intensively, and in doing so, helps us build relationships between thoughts that have pre-
viously been disconnected from each other – a perpetual, creative process bearing new thoughts
and ideas.
2.2 Empirical Evidence
The nature, form, and temporal dynamics of the relationship between positive affect and crea-
tivity at work was studied by Amabile et al. (2005). The authors employed experience sampling
methods to collect – for several months – daily and monthly reports of affect and creativity
from 222 employees in seven companies and three industries (chemicals, high-tech, and con-
sumer products) working on 26 organisational projects that called for creativity. Using 11,471
daily reports of employees and peer ratings, and controlling for education level and company
tenure, amongst other factors, the authors found that positive affect has a positive relationship
with creativity, defined as production of novel and useful ideas and measured by asking peers
to assess the creativity of employees' work.7
Is this just a case of 'reverse causality'? Amabile et al. (2005) showed that positive affect is
an antecedent of creativity with an incubation period of up to two days.8 Perhaps even more
convincingly, the causal effect of affective states on creativity has been shown in the laboratory.
Isen et al. (1987), for example, induced positive affect in participants – by showing them a few
minutes of a comedy film or by giving them a small bag of candy – and then administered tasks
generally regarded as requiring creative ingenuity. They found that participants in the experi-
mental condition (i.e. those with more positive affect) performed better in creative tasks than
participants in the control condition.9 Interestingly, negative affect did not produce comparable
improvements in creative performance.
7 Affect measures included peer ratings covering items on happiness, team satisfaction, enjoyment ofwork, personal frustration, and frustration with the team.8 In complementary, qualitative analyses, the authors show that positive affect is both a consequence ofcreative thought events and a by-product of the creative thought process itself.9 The control conditions watched a documentary film about math as a placebo or did not receive candy.Creativity tasks included the candle game, which requires participants to affix a candle to a corkboardin such a way that wax does not drip on the floor using various tools, and a Remote Association Test,which requires participants to think of words related to three other words presented to them.
7
Besides creativity, how do emotions relate to productivity more generally? Oswald et al.
(2015) conducted a series of lab experiments that randomly allocated students into either an
experimental condition in which they received a happiness-enhancing treatment (like watching
a ten-minute comedy clip or receiving free chocolate, fruits, and non-alcoholic drinks) or a
control condition (in which they watched a calm placebo clip or received nothing at all). The
participants then performed a real effort task for which they were paid a piece-rate. Increases
in happiness were strongly associated with increases in productivity of up to 12% on the task
(they were asked to correctly sum up numbers for ten minutes). This is a large effect that can –
due to the randomised experimental nature of the study – be interpreted as causal. Importantly,
the authors showed that the happiness-productivity relationship goes beyond the artificial lab
setting, by exploiting randomly occurring real-life shocks to wellbeing (bereavement or family
illness): students who reported such shocks performed systematically worse on the task than
their peers who did not.
Another piece of real-life evidence comes from De Neve and Oswald (2012). Using data on
more than 10,000 young adults in the US, and comparing siblings from the same family while
also controlling for a wide range of observables including education, intelligence, physical
health, and self-esteem, the authors found that individuals who reported higher levels of positive
affect and life satisfaction at ages 16, 18, and 22 have significantly higher levels of earnings
later in life.10 Important pathways were a higher probability of obtaining a college degree, get-
ting hired and promoted, and higher levels of non-cognitive skills (more optimism and extra-
version, less neuroticism).11
Interestingly, a significant stream of research on individual wellbeing and workplace perfor-
mance has focused on call centres. This is perhaps unsurprising, given that many tasks in this
setting can be easily quantified at high-frequency intervals, for example, the number of calls or
sales per hour or day. This is not true of many other professions, where researchers are forced
to instead study outcomes like quarterly or annual managerial reviews (which are more prob-
lematic to interpret).
10 More specifically, a one-point difference in life satisfaction – measured by a standard five-point scaleasking respondents "How satisfied are you with your life as a whole?" – at age 22 was associated witha difference in earnings of about USD 4,000 at age 29, relative to the family mean.11 See also Clark et al. (2018) for a more comprehensive account of the predictive effects of wellbeingin early life on later-life outcomes.
8
Rothbard and Wilk (2011) studied affect and productivity of call centre agents in two call
centres of a large insurance company. The authors were particularly interested in how start-of-
workday mood affects how call centre agents see interactions with customers, how they feel
subsequent to them, and how these feelings affect their (objective) work productivity and qual-
ity of work. Employing experience sampling methods, the authors recorded affect – covering
positive mood such as being excited, enthusiastic, upset, or irritable – daily over a period of
three weeks, at the start of the workday and subsequent to calls. The authors showed that start-
of-workday mood, or mood before calls more generally, did indeed affect the productivity of
call centre agents: positive affect subsequent to calls related to better quality of work, whereas
negative affect was positively associated with quantity – that is, more calls in total.12
Coviello et al. (2017), using a simple daily questionnaire, tracked the mood of more than
2,700 call centre agents located in nine different call centres for over a year.13 The authors found
that better mood decreases the number of calls per hour, or average call duration in minutes.
This finding held even after controlling for individual fixed effects (including, for example, the
innate ability of call centre agents) as well as leveraging variation in local weather patterns that
may affect mood. A potential mechanism they discuss is that better mood may lead to a height-
ened vulnerability to social distractions, i.e. call centre agents in better mood may talk more
with each other than clients on the phone (Cunningham, 1988; Pacheco-Unguetti and Parmen-
tier, 2016).14
12 Productivity was measured as the availability of call centre agents to callers, the average duration withwhich call centre agents handled calls, and the extent to which they resolved calls on their own withoutescalating them; quality of work was measured as the verbal fluency of call centre agents. A caveat ofthis study is that the sample size is small (only 29 call centre agents), and that it relied on the self-selection of participants into the study, which could bias results if such self-selection is correlated withproductivity outcomes.13 The question asked respondents "How are you feeling today?", with answer possibilities ranging fromone ("frustrated") to five ("unstoppable").14 Coviello et al. (2017) also show that extrinsic motivation matters for the mood-productivity relation-ship: for call centre agents whose compensation actually depends on productivity (e.g. who face mone-tary incentives), the negative effect of positive mood on productivity – measured as the number of callsin total – is moderated if not, in specifications in which item non-response is interpreted as bad mood,even reversed, leading to a positive relationship between better mood and higher productivity. This is inline with recent evidence by Oishi et al. (2007) who show that the association between wellbeing andvarious performance outcomes is not linear, for example, people who are at the highest level of wellbe-ing perform better when it comes to social relationships, whereas people at slightly lower levels performbetter when it comes to income.
9
Although call centres offer an interesting real-world laboratory to study wellbeing and per-
formance, some of the performance metrics are difficult to interpret. This is especially true for
the number of calls. In particular, Coviello et al. (2017) rightly note that the number of calls is
not necessarily a good measure of productivity: to the extent that an increase in the number of
calls comes at the expense of actual call quality (which may be the case for a call centre agent
in bad mood), it is difficult to interpret an increase in the number of calls as an increase in
productivity per se (in fact, it could be interpreted as a decrease).
Staw and Barsade (1993) tested the question of whether positive or negative affect leads to
better performance at the management level. Contrary to call centre agents, the work of man-
agers is less structured, and when it comes to decision-making, potentially more influenced by
affect than routine tasks. The authors conducted managerial simulations (in which 111 first-
year MBA students were required to run a fictitious production plant) as part of a weekend
assessment centre, including a three-hour in-basket exercise (an exercise in which participants
have to work themselves through a simulated inbox under time pressure) with 21 different de-
cision items. They found that management students with higher levels of positive affect did
perform better in terms of interpersonal tasks (within-group discussions) and overall decision-
making. Zelenski et al. (2008) confirm this result in a study of 75 directors employed in the
private sector and the Canadian federal government: managers with higher levels of positive
affect rated their productivity higher than their peers.
Overall, the literature at the individual level suggests a positive impact of mood on perfor-
mance. However, the sign (and to some extent size) of the impact of positive affect on perfor-
mance seems to be context-specific. It depends, in particular, on the tasks being completed and
the working environment. Applying meta-analytical methods, and hence averaging across many
studies, Lyubomirsky et al. (2005) conclude that this impact is, on average, positive.
3. Employee Wellbeing and Firm Performance
Having looked at the relationship between wellbeing and productivity at the individual level,
we now zoom out, and look at this relationship at the firm level. We first present results from
novel empirical analyses in collaboration with the Gallup Organization, analysing its extensive
10
client database to study the relationship between employee wellbeing and various firm perfor-
mance outcomes. We then supplement this analysis with other, supporting evidence from the
literature.
In general, we expect the direct effects of "happier workers working better" identified pre-
viously to translate into positive impacts at the aggregate firm level. But beyond immediate,
direct effects of mood on motivation and productivity, we also expect there to be more slowly
moving and indirect effects. We thus look additionally at employee recruitment and turnover –
the extent to which more satisfied workplaces are more likely to attract and retain talented
workers – and at customer loyalty and satisfaction, which are particularly relevant in service
industries where employees are in direct contact with customers.
3.1 Meta-Analysis of the Gallup Employee Wellbeing Database
Over the years, Gallup has accumulated 339 independent research studies – conducted as pro-
prietary research for clients – that include data on employee wellbeing as well as firm perfor-
mance. In total, these studies include (partly repeated) observations on the wellbeing of
1,882,131 employees and performance of 82,248 business units, originating from 230 inde-
pendent organisations across 49 industries in 73 countries. We calculated, for each of the 82,248
business units, the correlation between employee wellbeing and various firm performance out-
comes.15 This gives us a unique, rich (yet diverse) source of data to study the relationship be-
tween employee wellbeing and firm performance in the field.
The 339 research studies are largely context-specific, varying not only with respect to or-
ganisation and industry but also with respect to geographical location and observation period.
We therefore employ meta-analytic methods that enable us to integrate the findings accumu-
15 If there were two studies for the same organisation and these studies were conducted in the same year,the weighted average correlation across the studies is used in our analysis. If the two studies were notconducted in the same year, for example, if data on employee wellbeing were collected before data onperformance outcomes, the data that are more recent are used (or the mean in case of repeated data).Finally, if there were multiple studies for the same organisation that varied substantially in terms ofsample size, as a rule of thumb, the study with the largest sample size is used.
11
lated across the different studies and produce generalisable insights, by controlling for differ-
ences between studies resulting from sample size, measurement error, or other artefacts, to
eliminate biases (Schmidt and Hunter, 2015).16
Our approach involved three steps: first, we aggregated employee wellbeing and the respec-
tive (context-specific) performance outcome at the business-unit level for each of the 339 re-
search studies. Second, we calculated the business-unit-level correlation between employee
wellbeing and performance outcomes for each study. Finally, we applied our meta-analytical
toolkit to obtain a single, adjusted (i.e. non-context-specific) average correlation between em-
ployee wellbeing and the respective performance outcome.17
Employee Wellbeing Measures. Gallup has been including wellbeing measures routinely
in all of its studies since 1997 (Harter and Schmidt, 2008; Harter and Agrawal, 2011).18 Our
primary measure is satisfaction with the organisation as a place to work, which is obtained
from a single-item five-point Likert scale question asking respondents: "How satisfied are you
with your organisation as a place to work?" Answer possibilities range from one ("extremely
dissatisfied") to five ("extremely satisfied"). For simplicity, we refer to this measure as em-
ployee satisfaction.19
Besides employee satisfaction, the Gallup survey instrument – referred to as Q12 – also in-
cluded a measure of employee engagement: it asks employees about twelve (hence the name)
different dimensions of engagement, reflected in formative workplace conditions (such as
whether there is the opportunity for employees to do what they do best, whether there is some-
one encouraging their development, or whether their opinions count) which are related to a
16 We corrected, amongst others, for sampling error, measurement error in the dependent variables (i.e.performance outcomes), and measurement error and statistical artefacts such as range restriction in theindependent variable (i.e. employee wellbeing).17 See Harter et al. (2002, 2016) for a detailed description of the meta-analytic methods used.18 See Table A6 in the Appendix for the different items that are included in the Gallup survey instrument.19 There is a conceptual difference between employee satisfaction and job satisfaction, the latter of whichis the more frequently used measure in business economics (see Spector (1997) or Cooper and Robertson(2003), for example). Job satisfaction only asks respondents about their job, abstracting from the organ-isation. We argue, however, that – in our context – employee and job satisfaction are closely related, asthe Gallup survey instrument does not ask respondents about their overall satisfaction with the organi-sation but about their satisfaction with the organisation as a place to work. Respondents are thus likelyto report about their own, personal job experience.
12
wide range of business outcomes across organisations.20 Engagement is a psychological con-
struct that goes well beyond satisfaction: employees who are engaged with their job are posi-
tively absorbed by what they do and committed to advancing their organisation's interests; they
identify themselves with their organisation's mission and values, and represent it even outside
formal working hours.
Performance Outcomes. We studied four outcomes, arguably the most important key per-
formance indicators from a business perspective:21
Customer Loyalty. Measures of customer loyalty varied across the 339 research studies.
Most studies included fairly standard customer loyalty metrics such as the likelihood to recom-
mend or repurchase a product or service, the "net promoter score", or simply the number of
repeated transactions.22 Other studies also included measures of customer satisfaction, service
excellence, or customer evaluation of the quality of claims.
Employee Productivity. Measures of employee productivity included mostly financial
measures such as revenue or sales per person, growth in revenue or sales over time, quantity
per time period, enrolments in programs, labour hours, costs to the budget, cross-sells, or per-
formance ratings.
Profitability. Measures of profitability included the percentage profit of revenue or
sales, or the difference between current profit and budgeted profit or profit in the previous time
period.23
20 Aggregating over the twelve five-point scales yields an overall measure of engagement. We use em-ployee engagement for sensitivity analyses, expecting to find effects of employee engagement on firmperformance that are similar if not stronger than those of employee satisfaction.21 Not every study in the Gallup client database includes every business-unit-level performance outcome:for 94 organisations, there are studies on customer loyalty, for 140 on employee productivity, for 85 onprofitability, and for 106 on staff turnover.22 The net promoter score is a customer-satisfaction benchmark commonly used in market research toprovide insight into market growth prospects based on participant satisfaction, with scores ranging from-100 to +100 (Reichheld, 2003).23 Whenever necessary, we controlled for geographical location (i.e. local market characteristics) whencalculating business-unit-level correlations between employee wellbeing and profitability, in order tomake profitability figures more comparable.
13
Staff Turnover. Staff turnover was defined as the percentage of (voluntary) turnover
per business unit.
Methods. Our meta-analytical methods (see Schmidt and Hunter (2015) for more details)
corrected for heterogeneity within each category of performance outcome. After calculating the
correlation between employee wellbeing and the respective performance outcome at the level
of each business unit, correlations were aggregated and adjusted for differences in sample size,
measurement error, and other statistical artefacts or idiosyncrasies between the 339 original
research studies, to obtain true score correlations.
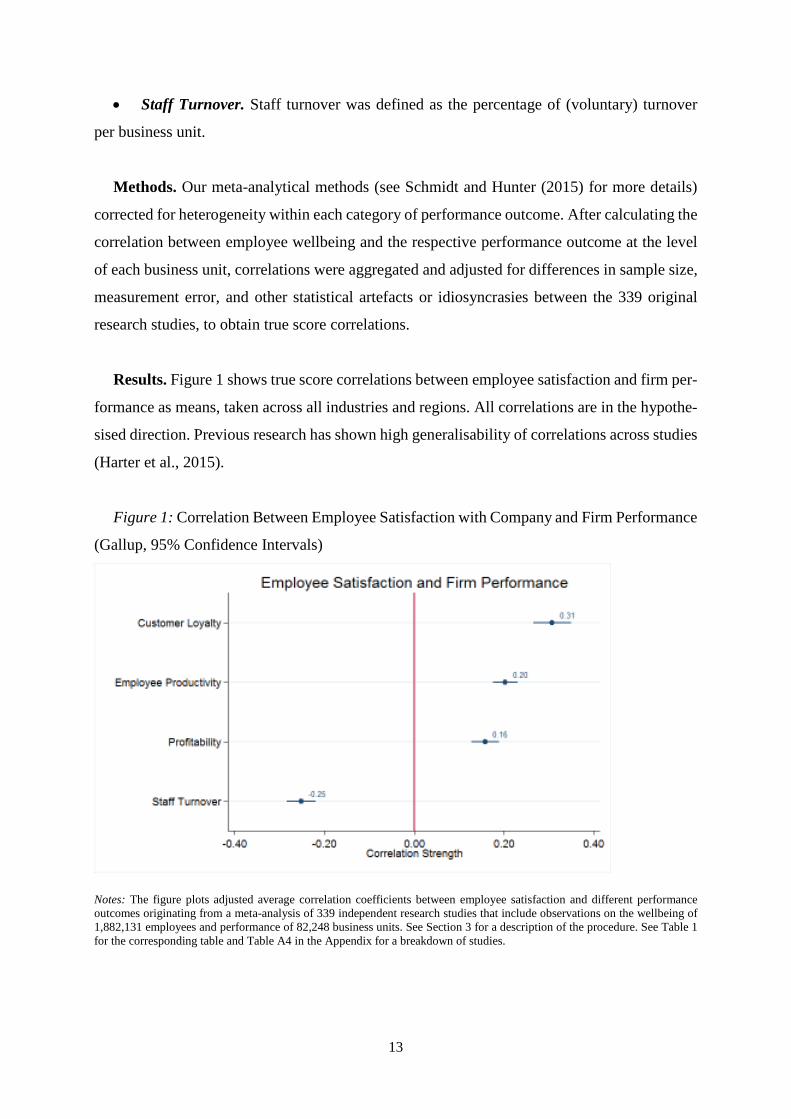
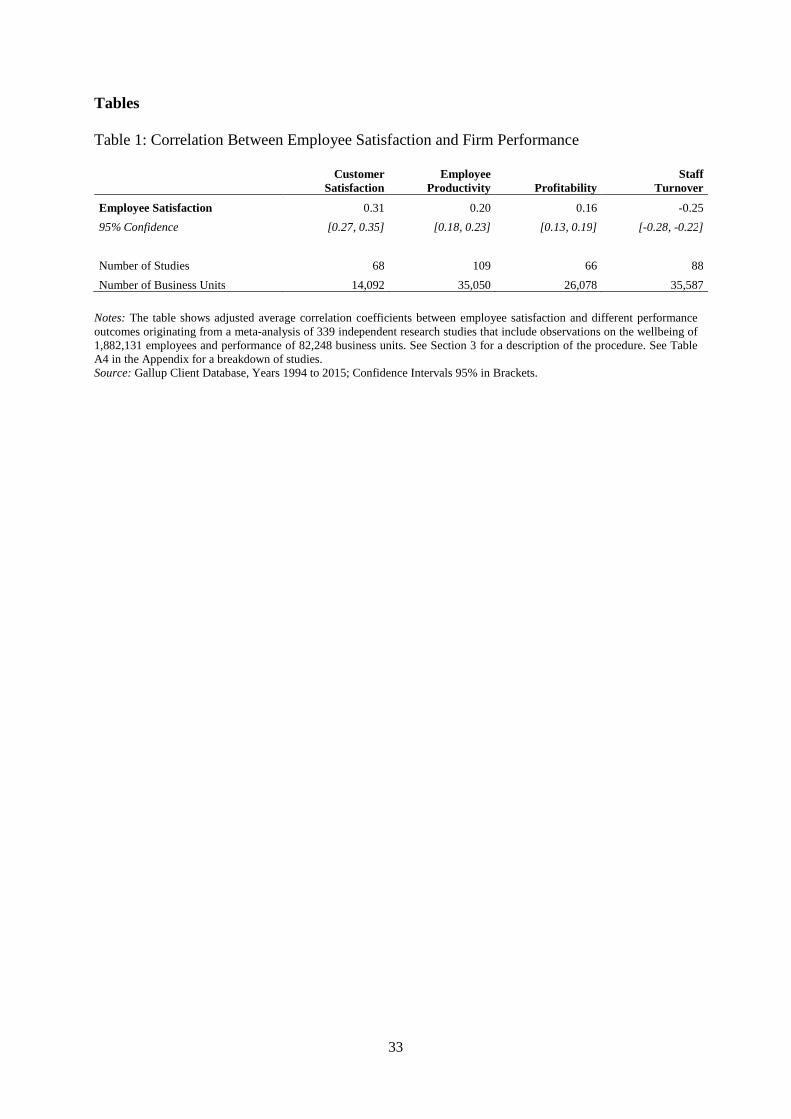
Results. Figure 1 shows true score correlations between employee satisfaction and firm per-
formance as means, taken across all industries and regions. All correlations are in the hypothe-
sised direction. Previous research has shown high generalisability of correlations across studies
(Harter et al., 2015).
Figure 1: Correlation Between Employee Satisfaction with Company and Firm Performance
(Gallup, 95% Confidence Intervals)
Notes: The figure plots adjusted average correlation coefficients between employee satisfaction and different performanceoutcomes originating from a meta-analysis of 339 independent research studies that include observations on the wellbeing of1,882,131 employees and performance of 82,248 business units. See Section 3 for a description of the procedure. See Table 1for the corresponding table and Table A4 in the Appendix for a breakdown of studies.
14
As can be seen, employee satisfaction has a substantial positive correlation with customer
loyalty and a substantial negative correlation with staff turnover. The correlation between em-
ployee satisfaction and productivity is positive (0.2). Importantly, higher customer loyalty and
employee productivity, as well as lower staff turnover, are also reflected in higher profitability,
as evidenced by a positive correlation between employee satisfaction and profitability (0.16).
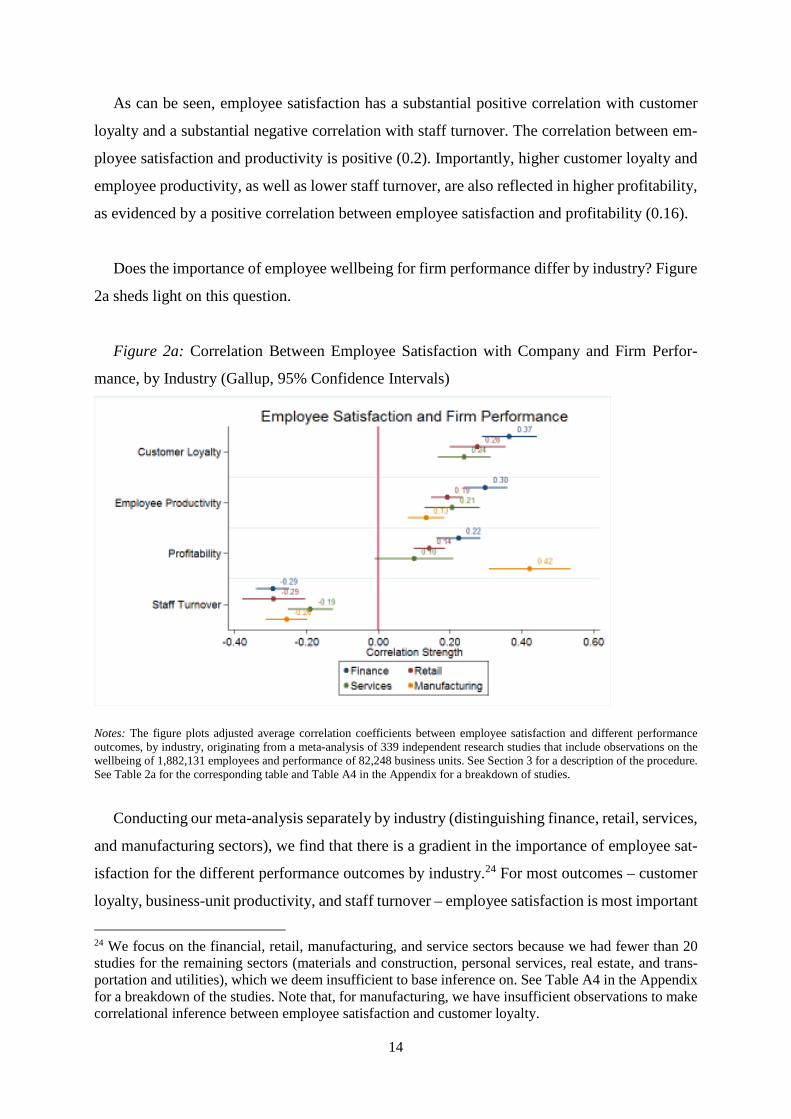
Does the importance of employee wellbeing for firm performance differ by industry? Figure
2a sheds light on this question.
Figure 2a: Correlation Between Employee Satisfaction with Company and Firm Perfor-
mance, by Industry (Gallup, 95% Confidence Intervals)
Notes: The figure plots adjusted average correlation coefficients between employee satisfaction and different performanceoutcomes, by industry, originating from a meta-analysis of 339 independent research studies that include observations on thewellbeing of 1,882,131 employees and performance of 82,248 business units. See Section 3 for a description of the procedure.See Table 2a for the corresponding table and Table A4 in the Appendix for a breakdown of studies.
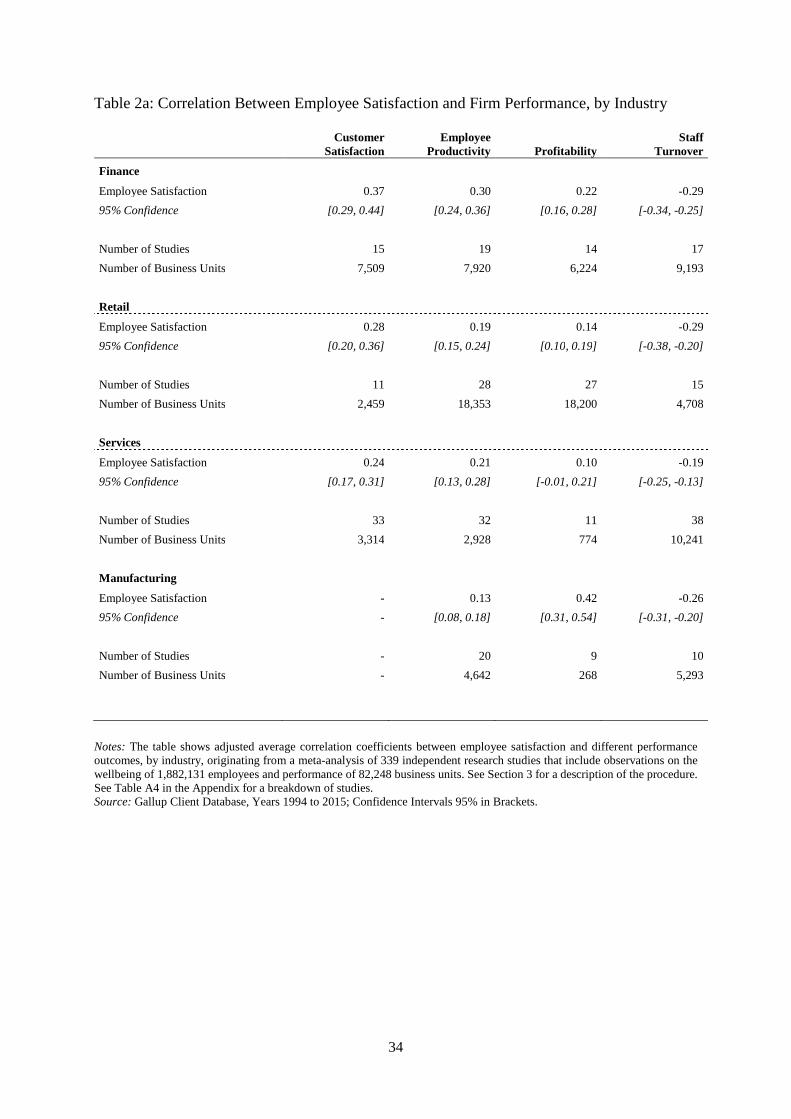
Conducting our meta-analysis separately by industry (distinguishing finance, retail, services,
and manufacturing sectors), we find that there is a gradient in the importance of employee sat-
isfaction for the different performance outcomes by industry.24 For most outcomes – customer
loyalty, business-unit productivity, and staff turnover – employee satisfaction is most important
24 We focus on the financial, retail, manufacturing, and service sectors because we had fewer than 20studies for the remaining sectors (materials and construction, personal services, real estate, and trans-portation and utilities), which we deem insufficient to base inference on. See Table A4 in the Appendixfor a breakdown of the studies. Note that, for manufacturing, we have insufficient observations to makecorrelational inference between employee satisfaction and customer loyalty.
15
in finance, followed by retail, and then closely, by services.25 However, these industry differ-
ences in correlations have highly overlapping 95% confidence intervals on nearly all outcomes.
The correlation between employee satisfaction and productivity appears to be somewhat
stronger in the finance industry than in other industries. Perhaps surprisingly, for services and
retail, employee satisfaction has a positive but lower relationship with profitability. Even so,
the 95% confidence intervals fall almost entirely in the positive range and overlap with the
finance industry interval. For manufacturing, we find that employee satisfaction has the lowest
correlation with productivity but the strongest with profitability amongst all industry sectors.
Further research will likely be focused on identifying why such differences exist across in-
dustries. One reason for the particularly strong link between wellbeing and productivity in the
finance industry might have something to do with working conditions in that sector. Although
employees in finance have, on average, a higher pay than those in retail, services, and manu-
facturing, income is not the only – or perhaps even the most important – determinant of em-
ployee wellbeing. In fact, workplace characteristics such as little stress at work or work-life
balance have been shown to be equally, if not more, important for employee wellbeing than pay
(Krekel et al., 2018). Such characteristics, however, may be relatively less dominant in the fi-
nance industry than in other industries, suggesting that there is potentially more room in the
financial sector for employee wellbeing to unlock positive productivity outcomes. Manufactur-
ing organisations are often highly focused on process efficiency and safety as primary metrics
within plants. Process efficiency and safety relate directly to the bottom line as they relate to
costs. Job attitudes are likely to relate to discretionary effort that then impacts quality, effi-
ciency, and safety within manufacturing plants and teams, possibly explaining the higher cor-
relation between employee satisfaction and profitability.
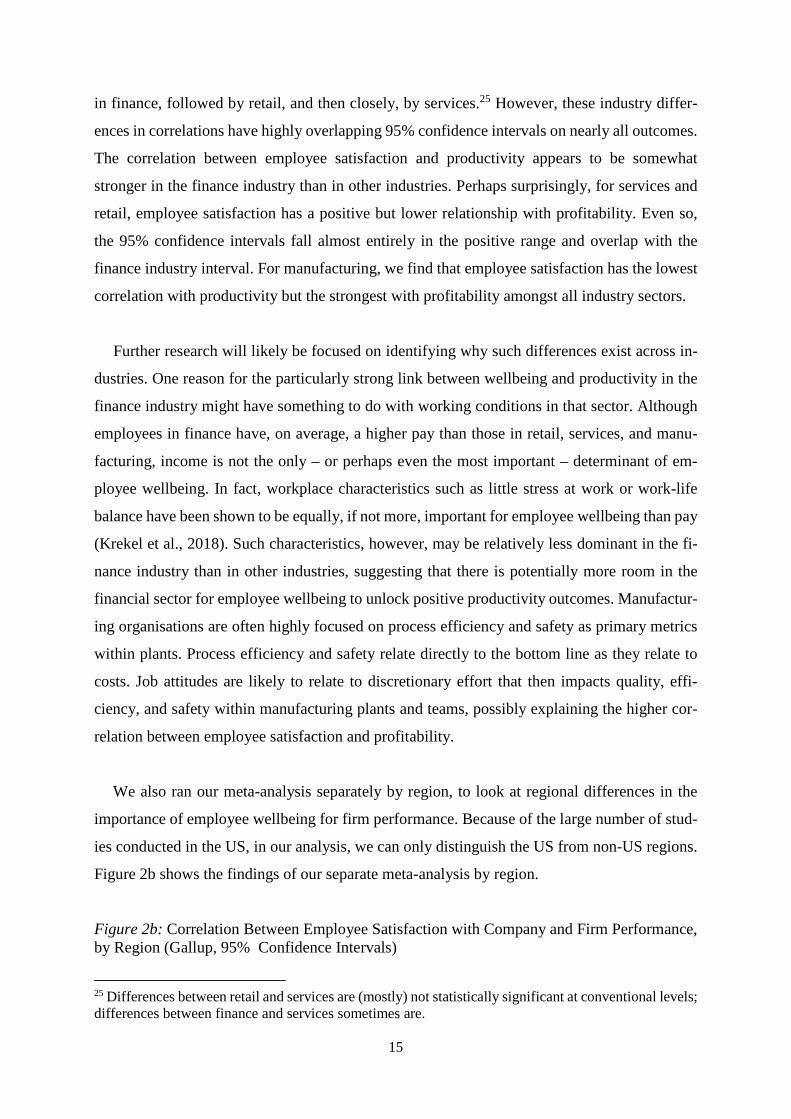
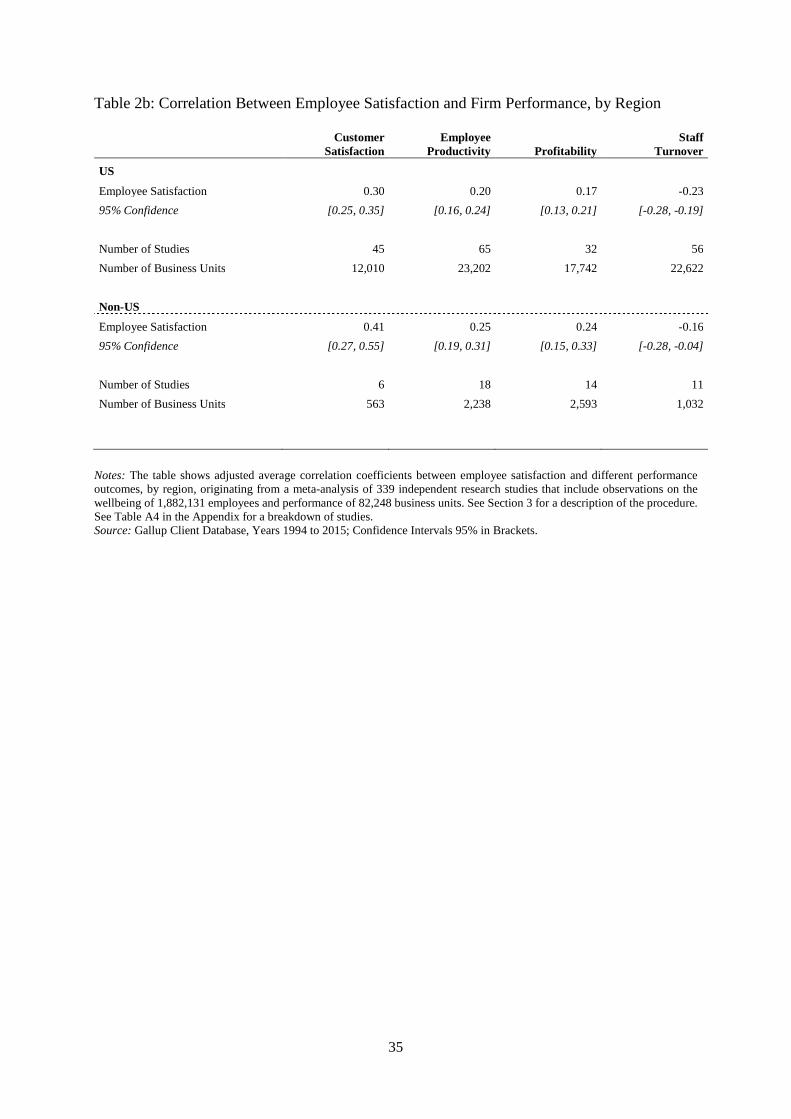
We also ran our meta-analysis separately by region, to look at regional differences in the
importance of employee wellbeing for firm performance. Because of the large number of stud-
ies conducted in the US, in our analysis, we can only distinguish the US from non-US regions.
Figure 2b shows the findings of our separate meta-analysis by region.
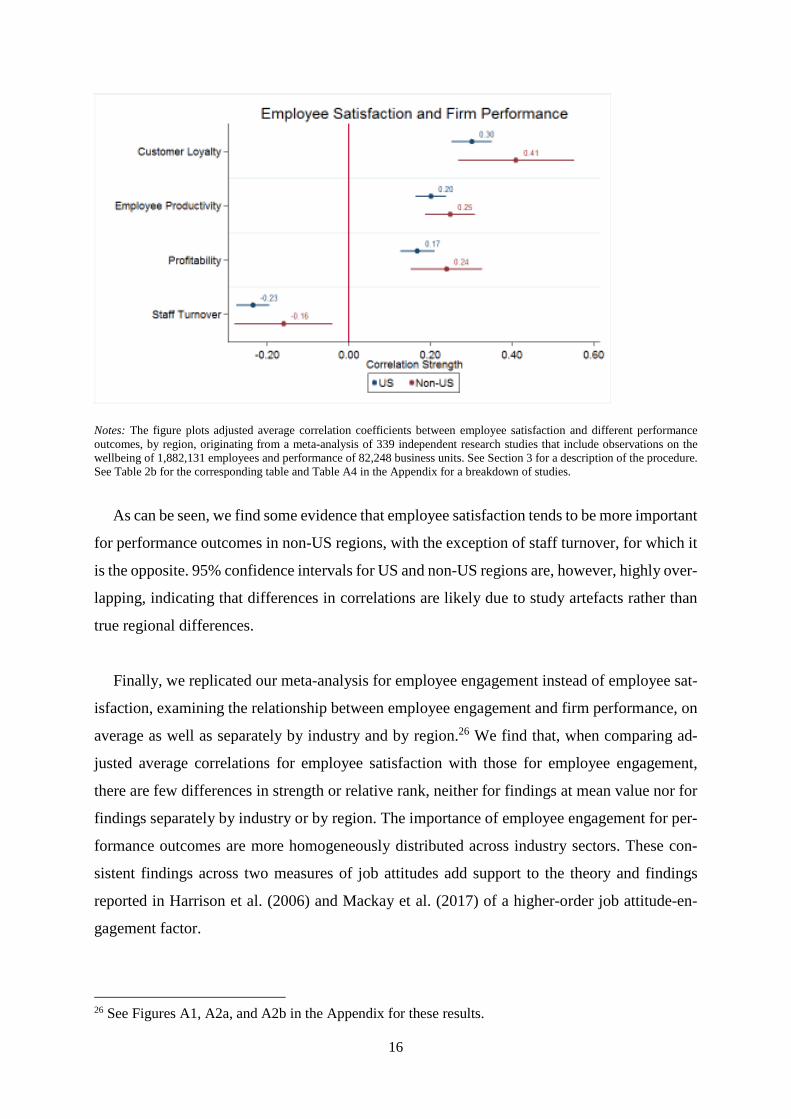
Figure 2b: Correlation Between Employee Satisfaction with Company and Firm Performance,by Region (Gallup, 95% Confidence Intervals)
25 Differences between retail and services are (mostly) not statistically significant at conventional levels;differences between finance and services sometimes are.
16
Notes: The figure plots adjusted average correlation coefficients between employee satisfaction and different performanceoutcomes, by region, originating from a meta-analysis of 339 independent research studies that include observations on thewellbeing of 1,882,131 employees and performance of 82,248 business units. See Section 3 for a description of the procedure.See Table 2b for the corresponding table and Table A4 in the Appendix for a breakdown of studies.
As can be seen, we find some evidence that employee satisfaction tends to be more important
for performance outcomes in non-US regions, with the exception of staff turnover, for which it
is the opposite. 95% confidence intervals for US and non-US regions are, however, highly over-
lapping, indicating that differences in correlations are likely due to study artefacts rather than
true regional differences.
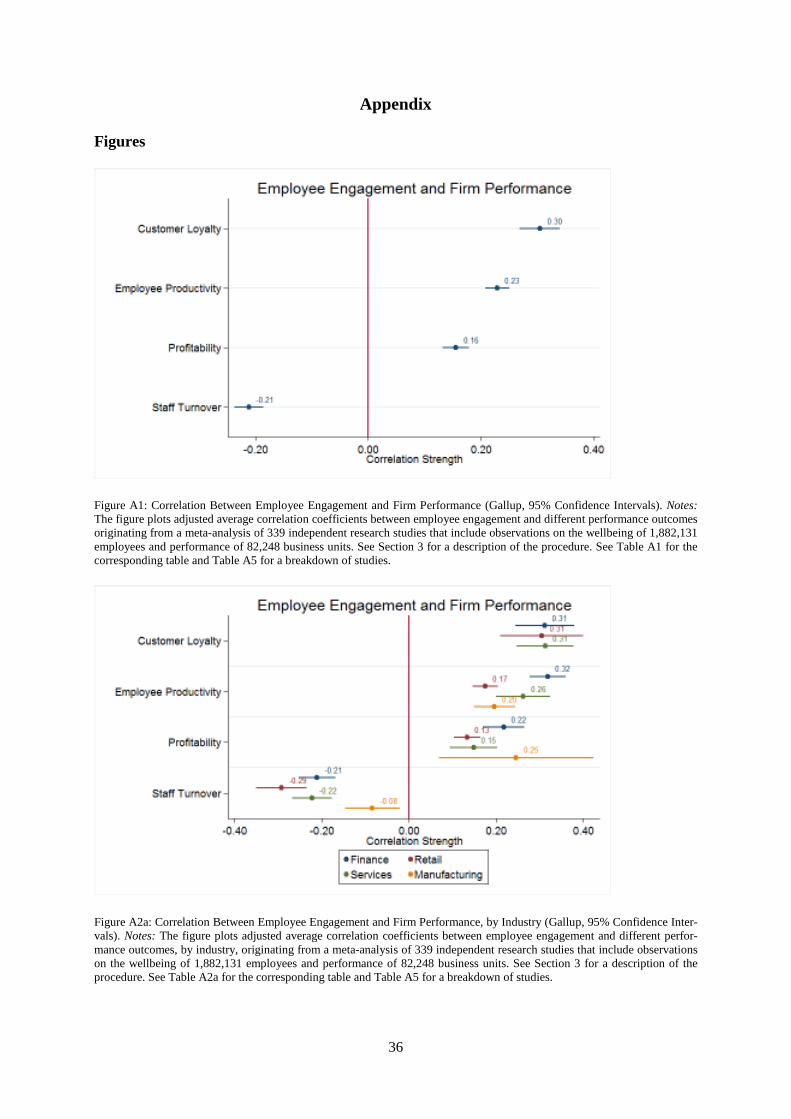
Finally, we replicated our meta-analysis for employee engagement instead of employee sat-
isfaction, examining the relationship between employee engagement and firm performance, on
average as well as separately by industry and by region.26 We find that, when comparing ad-
justed average correlations for employee satisfaction with those for employee engagement,
there are few differences in strength or relative rank, neither for findings at mean value nor for
findings separately by industry or by region. The importance of employee engagement for per-
formance outcomes are more homogeneously distributed across industry sectors. These con-
sistent findings across two measures of job attitudes add support to the theory and findings
reported in Harrison et al. (2006) and Mackay et al. (2017) of a higher-order job attitude-en-
gagement factor.
26 See Figures A1, A2a, and A2b in the Appendix for these results.
17
In sum, aggregating data from 339 independent research studies that include observations
on the wellbeing of 1,882,131 employees and performance of 82,248 business units, from 230
independent organisations across 49 industries in 73 countries, we find that employee wellbeing
is consistently positively correlated with firm performance.
Wellbeing has a substantial positive correlation with customer loyalty and a substantial, neg-
ative correlation with staff turnover. That is, in addition to the individual-level evidence – based
largely on Emotion Theory – focusing on affective states and showing immediate effects of
mood on productivity, there also seems to be strong evidence – more in line with Human Rela-
tions Theory – that employee satisfaction plays a significant role in retaining and motivating
the workforce.
Employee wellbeing in the Gallup data is positively correlated with employee productivity,
and ultimately, profitability. The relative strength of the correlation with profitability is some-
what weaker, but this is expected given that profit is a downstream outcome in the hypothesised
causal chain from job attitudes to operational outcomes to financial outcomes. Utility analysis
of the practical value of the correlation between employee engagement and profitability sug-
gests a 21% difference in profit between top and bottom quartile business units on employee
engagement (Harter et al., 2015). The practical value of the size of correlations depicted in this
meta-analysis has been calculated in previous studies as non-trivial (Harter et al., 2002, 2015).
Although there is – depending on how employee wellbeing is measured – evidence of some
differences by industry, the overall importance of employee wellbeing for key firm performance
outcomes seems largely universal.
3.2 Literature on the Causal Effect of Employee Wellbeing on Firm Performance
From this correlational meta-analysis, we are unable to make any strong causal claim about the
relationship between employee wellbeing and firm performance.27 To make such claims, we
need longitudinal data – repeated observations of employee wellbeing and firm performance
over time – and some sort of randomised experimental intervention or policy change as a source
27 Note, however, that many of the studies in the meta-analysis, by design, include performance measuresthat trail employee satisfaction or engagement measures, suggesting some predictive evidence.
18
of exogenous variation (which affects employee wellbeing without directly affecting firm per-
formance), to reduce concerns about omitted variables that may be simultaneously driving em-
ployee wellbeing and firm performance.
Evidence from Within Firms over Time
One initial piece of longitudinal evidence comes from Harter et al. (2010) who studied the re-
lationship between employee engagement and financial performance by exploiting temporal
variation in the Gallup client database. The authors found that employee engagement and prof-
itability are reciprocally related (i.e. they influence each other over time).28 However, employee
engagement at time t is a stronger predictor of profitability at time t+1 than vice versa, whereby
(short-term) outcomes such as customer loyalty and staff turnover are important mediators of
this relationship.29 Although establishing this temporal-causal (also referred to as Granger-
causal) relationship between employee engagement and financial performance does not solve
issues of omitted or "third" variables, it is yet another piece of evidence for a causal effect of
employee wellbeing on firm performance.
Bloom et al. (2015) conducted an experiment on flexible work practices at a NASDAQ-
listed Chinese travel agency with more than 16,000 employees, in which call centre agents (who
volunteered to participate in the experiment) were randomly assigned to either working from
home (the treatment group) or working in the office (the business-as-usual control group) for a
period of nine months. The authors found that, at the end of the experiment, call centre agents
who were working from home experienced fewer negative and more positive emotions, less
exhaustion, and reported a higher overall life satisfaction compared to call centre agents who
were working in the office.
28 In a similar longitudinal analysis using the same data source, Agrawal and Harter (2010) study thepropagation of employee engagement along the organisational hierarchy over time. The authors findthat executive engagement at time t affects middle-management engagement at time t+1 and front-lineengagement at time t+2, i.e. engagement cascades from leadership to middle management and then tothe front line.29 This finding is somewhat different from Koys (2001), who shows that employee attitudes and behav-iour (measured in terms of employee satisfaction and organisational citizenship related to conscientious-ness, altruism, sportsmanship, and courtesy) at time t are predictive of organisational effectiveness(measured in terms of profitability and customer satisfaction) at time t+1, but organisational effective-ness at time t is not predictive of employee attitudes and behaviour at time t+1. The context of this study,however, is quite specific: the author studies the relationship between employee wellbeing and firmperformance at a regional restaurant chain.
19
Importantly, working from home also led to a 13% increase in performance, of which 9%
was due to working more minutes per shift (attributed to fewer breaks and sick days) and 4%
due to taking more calls per minute (attributed to a quieter working environment); staff turnover
halved.30 After the success of the experiment (the company estimated to save about USD 2,000
annually per call centre agent working from home), the scheme was rolled out for the entire
workforce (including giving workers who participated in the experiment the opportunity to
change their working location again). This change almost doubled performance gains, to 22%,
stressing the importance of selection and learning of workers about their own working prefer-
ences and styles.
Two other studies on flexible work practices stand out. Moen et al. (2011) examined the
causal effect of switching from standard to more flexible, results-oriented working time at Best
Buy, a large US retailer. By exploiting the staggered implementation of the scheme in its cor-
porate headquarters, the authors found that staff turnover amongst employees who were ex-
posed to the scheme dropped by 45.5% eight months after implementation. More flexible work
practices also moderated turnover effects of negative home-to-work spillovers (i.e. when re-
sponsibilities at home reduce the effort employees can devote to their jobs).
In a related study, however, Moen et al. (2016) showed that a similar organisational inter-
vention – aimed at promoting greater employee control over working time at an IT company –
reduced burnout, perceived stress, and psychological distress, while raising job satisfaction
(with benefits larger for women) twelve months after the intervention. Taken together, both
studies suggest that organisational interventions aimed at raising employee wellbeing, for ex-
ample, through raising employees' autonomy over their working time, bear positively upon per-
formance outcomes at the aggregate firm level – a win-win situation for both employees and
employers.
30 As a possible side effect, the authors document that participants in the treatment group were less likelyto get promoted conditional on performance. Leslie et al. (2012) show, in both a field study at a Fortune500 company and a lab experiment, that flexible work practices may result in a career penalty in casethat managers attribute their use as being motivated by reasons related to personal lives (as may havebeen the case for call centre agents who volunteered to participate in the experiment). However, to theextent that mangers attribute the use of flexible work practices to reasons related to efficiency or organ-isational needs, their use may actually result in a career premium.
20
A final example comes from the National Health Service (NHS) in the UK. Powell et al.
(2014) used a large-scale longitudinal dataset generated from NHS staff surveys in 2009, 2010,
and 2010. The authors found that better staff experience is associated with better outcomes for
both employees and patients, and in particular, that higher wellbeing – measured, amongst oth-
ers, in terms of job satisfaction – and better job design are linked to lower levels of absenteeism
and higher levels of patient satisfaction.31
Evidence from Between Firms
We now move from studies looking at single companies and organisational interventions to
studies examining several companies pooled together. Böckerman and Ilmakunnas (2012) ex-
amined the relationship between employee wellbeing and firm performance in Finnish manu-
facturing plants over the period 1996 to 2001. The authors linked individual-level data on job
satisfaction from the European Community Household Panel with establishment-level data on
employer characteristics and performance. The authors found that job satisfaction has a signif-
icant, positive effect on value-added per hours worked: a one standard deviation increase in job
satisfaction at the plant level increases valued-added per hours worked by 6.6%.32 In other
words, increasing job satisfaction by one point, say, from four to five (out of six), would in-
crease value-added per hours worked by almost 20% – a large effect.
A similar study was conducted by Bryson et al. (2017) in Britain. Using employer-employee
data from the Workplace Employment Relations Survey – a nationally representative dataset
on more than 2,000 workplaces covering all sectors of the economy except agriculture and
mining – for the years 2004 and 2011, the authors found a strong link between wellbeing and
performance.33 They document a clear, statistically significant, positive relationship between
31 Powell et al. (2014) study the links between staff experience and intermediate (staff) and final (patientand organisational) outcomes. The measure of job satisfaction used was a multi-item summed scale,including items on support from immediate managers and colleagues, freedom to choose methods ofworking, amount of responsibility, opportunities to use skills, the extent to which trust is seen as to valuethe work of staff, and recognition for good work.32 Böckerman and Ilmakunnas (2012) estimated production function specifications in which job satis-faction – lagged to reduce concerns about reverse causality – is regressed on value added per hoursworked at the plant level alongside controls for establishment and employer characteristics. The authorsdo not find a significant effect of job satisfaction on sales per employee as an alternative measure ofproductivity. However, this may have been an artefact of the manufacturing sector.33 Job satisfaction was measured asking employees about nine aspects of their job, including pay, senseof achievement, scope for using initiative, influence over their job, training, opportunity to develop their
21
average job satisfaction and performance outcomes at the establishment level (but not for job-
related affect), in both cross-section (using the year 2011 only) and two-period panel with es-
tablishment fixed effects (using both the years 2004 and 2011).34 Wellbeing had an impact on
financial performance, labour productivity, quality of product or service, and an aggregated
performance measure combining all other performance outcomes, even when controlling for
establishment, industry, and regional characteristics as well as when looking longitudinally at
firms over time. Although it is difficult to assess the exact size of these effects (performance
measures are subjective scores reported by managers), the fact that job satisfaction affects all
performance outcomes (with the exception of labour productivity in the two-period panel)
across workplaces is strong evidence for a positive impact of employee wellbeing on firm per-
formance.
Finally, the findings above match those of Green (2010), who found that job satisfaction is
a better predictor for quits than job-related affect (see also Lévy-Garboua et al. (2007) on the
predictive power of job satisfaction for quits).
Evidence from Stock Market Performance
Do firms with higher levels of employee wellbeing perform better on the stock market? To
answer this question, Edmans (2011) studied the relationship between employee satisfaction
and long-run stock returns using a value-weighted portfolio of the "100 Best Companies to
Work for in America".35 The ratings are based on survey responses from a randomly chosen
250 employees per company (asking about areas such as job satisfaction and attitudes towards
management) and publicly available information (demographic make-up, pay and benefits pro-
grammes, and culture). The data show that, during the period 1984 to 2009, the "100 Best Com-
panies to Work for in America" had an annual four-factor alpha – a measure of excess stock
skills, job security, involvement in decisions, and the work itself, which, when combined, yield an ag-gregate score of job satisfaction. Job-related affect was constructed similarly, asking employees whetherthey felt tense, uneasy, worried, gloomy, depressed, or miserable over the past few weeks.34 Interestingly, Bryson et al. (2017) also test for reverse causality in their two-period panel, by regress-ing employee wellbeing in 2011 on firm performance in 2004. They do not find evidence for causalityrunning from firm performance to employee wellbeing, suggesting – in line with Harter et al. (2010) –that causality runs rather the other way around, from employee wellbeing to firm performance.35 The annual ranking is compiled by the Great Places to Work Institute in San Francisco, which ratesorganisations on four domains, including credibility, respect, fairness, and pride and camaraderie.
22
market return – of 3.5%. Furthermore, they earned 2.1% higher stock returns than the industry
average and had more positive earnings surprises and announcement returns.36
The relationship between employee wellbeing and stock market returns can also be repli-
cated for the "Gallup Great Workplace Award" winners. In a recent study, the organisation
compared the earnings per share of seventeen award winners, covering six industries and rang-
ing in size between 800 and 250,000 employees, with their industry equivalents during the pe-
riod 2011 to 2015 (Gallup, 2017). The data show that winners grew about 4.3 times faster during
that period than their equivalents.37
Goetzel et al. (2016) study the stock-market performance of companies winning the "C. Ev-
erett Koop National Health Award" – an award conferred annually to firms investing in cost-
effective health and wellbeing programmes for their workers – relative to the average perfor-
mance in the Standard and Poor's (S&P) 500 Index. The authors arrived at a similar conclusion:
over a period of fourteen years (2000 to 2014), winners experienced a 325% growth in stock
values, whereas their equivalents experienced growth of only 105%.
These findings are consistent with our results above, and more generally with Human Rela-
tions Theory, which argues that higher employee wellbeing causes better firm performance
through better recruitment, higher employee motivation, and lower staff turnover. The im-
portance of human resource management, however, may differ around the world, depending on
the complementarity of labour market institutions. Indeed, in a recent paper, Edmans et al.
(2017) extended the "100 Best Companies to Work For" analysis beyond the US, covering
fourteen countries with different institutional settings. The authors found that higher job satis-
faction was associated with superior long-run returns, current valuation ratios, future profita-
bility, and earnings surprises only in flexible labour markets such as the US or the UK. Results
for more rigid labour markets as in the Scandinavian countries or in Germany, however, were
not statistically significant.38 This suggests that in contexts where firms face lower barriers to
36 Edmans (2012) shows that returns even range between 2.3% and 3.8% if the years 2010 and 2011 arealso included.37 The winners experienced a 115% growth in earnings per share during that period, whereas their equiv-alents experienced growth of only 27%.38 A sharper theoretical distinction is the difference between liberal and coordinated market economies(Hall and Soskice, 2001): in coordinated market economics, where state-facilitated, top-down coordi-nation in employer-employee relations already ensures minimum standards for worker welfare, the mar-ginal cost of spending on additional welfare may be higher than its marginal benefit, or in other words,
23
hiring and firing and where worker welfare is not outsourced to "cushioning" labour market
institutions, corporate social responsibility may yield higher returns.
4. Outlook
At the outset of this paper, we posed a relatively simple question: is there a compelling business
case for promoting worker wellbeing? Overall, the balance of the evidence – both the old and
the new that we have presented here – is very much in favour that there are measurable, objec-
tive benefits to wellbeing in terms of employee productivity and firm performance.
We began by looking at the relationship between wellbeing and productivity at the individual
level and showed – by discussing findings from both field and lab – how higher levels of well-
being are associated with more creativity and better task performance. Whether it is an effort
task in a university lab or the real-life setting of a call centre, wellbeing is positively correlated
with productivity. The evidence base is steadily mounting that this correlation is in fact a causal
relationship (running from wellbeing to productivity).
We then panned away from the individual-level and looked at this relationship at the aggre-
gate firm level. Conducting a meta-analysis of the extensive client database of the Gallup Or-
ganization, we showed that higher levels of employee wellbeing also manifest themselves in
improved key firm performance outcomes, including customer loyalty, profitability, and staff
turnover (although to a different degree depending on industry sector, an interesting area of
future research).
Finally, we complemented our own analysis with empirical evidence at the firm-level from
the wider, causal-design literature. We looked, in particular, at interventions targeting flexible
work practices and studies linking employer and employee data. Again, a clear positive rela-
tionship can be seen between employee wellbeing and various measures of performance. Firms
with higher levels of employee wellbeing also tend to do better in terms of stock market per-
formance and growth.
spending on worker welfare may already be in the range of diminishing returns. In liberal market econ-omies, however, corporate social responsibility may have more benefits to workers and firms.
24
There are a number of limitations and exciting avenues for future research. First and fore-
most, we did not (and could not) present here a full account of the benefits of wellbeing at work:
besides direct benefits in terms of employee productivity (and ultimately, firm performance),
there are, of course, many other benefits to wellbeing at work such as better health and longevity
(De Neve et al., 2013; Graham, 2017), which do not only indirectly contribute to employee
productivity but also have wider, society-wide benefits beyond the world of work. Benefits
presented here should thus be interpreted as a lower bound.
Second, although we studied the returns to employee wellbeing in terms of employee
productivity and firm performance, we did not study which workplace wellbeing investments
(i.e. investing, say, into more flexible work practices versus investing into higher pay) are most
cost-effective from a business or policy perspective. This is partly because there are not many
interventions in the first place (notable exceptions that directly target employee wellbeing in-
clude Proudfoot et al. (2009) and Jones et al. (2018), for example) and partly because interven-
tions that do exist hardly report costs. It is thus difficult, given the current evidence base, to
benchmark different interventions against each other in terms of cost-effectiveness. Across the
board, more interventions are needed, and they need to be more transparent. Policy can play a
vital role in encouraging experimentation, by providing monetary or non-monetary incentives
for firms to conduct interventions and for sharing their impact evaluation results as a public
good.
The evidence we have presented here is suggestive of a strong, positive relationship between
employee wellbeing, employee productivity, and firm performance. Raising the wellbeing of
society is a central goal for policy-makers, and it is a goal that is not in opposition to the interests
of the business community. There is an important role for business leaders to play in being a
strong positive force for raising the wellbeing of society.
25
References
Achor, S., "Positive Intelligence," Harvard Business Review, Jan-Feb, 2012.
Agrawal, S., and J. K. Harter, The Cascade Effect of Employee Engagement: A Longitudinal
Study, Washington, DC: Gallup Organization, 2010.
Amabile, T. M., S. G. Barsade, J. S. Mueller, and B. M. Staw, "Affect and Creativity at Work,"
Administrative Science Quarterly, 50, 367-403, 2005.
Akerlof, G. A., A. K. Rose, and J. L. Yellen, "Job Switching and Job Satisfaction in the U.S.
Labor Market," Brookings Papers on Economic Activity, 2, 495-594, 1988.
Baumeister, R. F., K. D. Vohs, C. N. DeWall, and L. Zhang, "How Emotion Shapes Behavior:
Feedback, Anticipation, and Reflection, Rather Than Direct Causation," Personality and Social
Psychology Review, 11(2), 167-203, 2007.
Bloom, N., J. Liang, J. Roberts, and Z. J. Ying, "Does Working from Home Work? Evidence
from a Chinese Experiment," Quarterly Journal of Economics, 130, 165-218, 2015.
Böckerman, P., and P. Ilmakunnas, "The Job Satisfaction-Productivity Nexus: A Study Using
Matched Survey and Register Data," Industrial and Labor Relations Review, 65(2), 244-262,
2012.
Bryson, A., J. Forth, and L. Stokes, "Does employees' subjective wellbeing affect workplace
performance?," Human Relations, 70(8), 1017-1037, 2017.
Clark, A. E., "Unemployment as a Social Norm: Psychological Evidence from Panel Data,"
Journal of Labor Economics, 21(2), 323-351, 2003.
Clark, A. E., and A. J. Oswald, "Unhappiness and Unemployment," Economic Journal,
104(424), 648-659, 1994.
26
Clark, A. E., and Y. Georgellis, "Back to Baseline in Britain: Adaptation in the British House-
hold Panel Survey," Economica, 80(319), 496-512, 2013.
Clark, A. E., E. Diener, Y. Georgellis, and R. Lucas, "Lags and Leads in Life Satisfaction: A
Test of the Baseline Hypothesis," Economic Journal, 118(529), F222-F243, 2008.
Clark, A. E., S. Flèche, R. Layard, N. Powdthavee, and G. Ward, The Origins of Happiness:
The Science of Wellbeing Over the Life Course, Princeton, NJ: Princeton University Press,
2018.
Clark, A. E., Y. Georgellis, and P. Sanfey, "Scarring: The Psychological Impact of Past Unem-
ployment," Economica, 68(270), 221-241, 2001.
Clore, G. L., N. Schwarz, and M. Conway, "Cognitive causes and consequences of emotion,"
in Wyer, R. S., and T. K. Srull (eds), Handbook of Social Cognition, Hillsdale, NJ: Lawrence
Erlbaum, 1994.
Cooper, C., and I. T. Robertson, Management and Happiness, Cheltenham: Edward Elgar,
2013.
Coviello, D., E. Deserranno, N. Persico, and P. Sapienza, "Effect of Mood on Workplace
Productivity," mimeo, 2017.
Cunningham, M. R., "What do you do when you're happy or blue? Mood, expectancies, and
behavioral interest," Motivation and Emotion, 12(4), 309-331, 1988.
De Neve, J.-E., and A. J. Oswald, "Estimating the influence of life satisfaction and positive
affect on later income using sibling fixed effects," Proceedings of the National Academy of
Sciences, 109(49), 19953-19958, 2012.
De Neve, J.-E., and G. Ward, "Happiness at Work," in: Helliwell, J., R. Layard, and J. Sachs
(eds), World Happiness Report, 2017.
27
De Neve, J.-E., E. Diener, L. Tay, and C. Xuereb, "The Objective Benefits of Subjective Well-
being," in: Helliwell, J., R. Layard, and S. Sachs (eds), World Happiness Report, 2013.
Edmans, A., "Does the stock market fully value intangibles? Employee satisfaction and equity
prices," Journal of Financial Economics, 101, 621-640, 2011.
Edmans, A., "The Link Between Job Satisfaction and Firm Value With Implications for Cor-
porate Social Responsibility," Academy of Management Perspectives, 26(4), 1-19, 2012.
Edmans, A., L. Li, and C. Zhang, "Employee Satisfaction, Labor Market Flexibility, and Stock
Returns Around the World," European Corporate Governance Institute Finance Working Pa-
per, 433/2014, 2018.
Fishbein, M., and I. Ajzen, Belief, attitude, intention, and behavior: An introduction to theory
and research, Reading, MA: Addison-Wesley, 1975.
Gallup, Employee Engagement and Earnings per Share, Washington, DC: Gallup Organiza-
tion, 2017.
Gielen, A. C., and J. C. van Ours, "Unhappiness and Job Finding," Economica, 81(323), 544-
565, 2014.
Goetzel, R. Z., R. Fabius, D. Fabius, E. C. Roemer, N. Thornton, R. K. Kelly, and K. R. Pelle-
tier, "The Stock Performance of C. Everett Koop Award Winners Compared With the Standard
& Poor's 500 Index," Journal of Occupational and Environmental Medicine, 58(1), 9-15, 2016.
Green, F., "Wellbeing, job satisfaction and labour mobility," Labour Economics, 17(6), 897-
903, 2010.
Hall, P. A., and D. Soskice, Varieties of Capitalism: The Institutional Foundations of Compar-
ative Advantage, Oxford: Oxford University Press, 2011.
28
Harrison, D. A., D. A. Newman, and P. L. Roth, "How Important are Job Attitudes? Meta-
Analytic Comparisons of Integrative Behavioral Outcomes and Time Sequences," Academy of
Management Journal, 49(2), 305-325, 2006.
Harter, J. K., and A. A. Stone, "Engaging and disengaging work conditions, momentary expe-
riences and cortisol response," Motivation and Emotion, 36(2), 104-113, 2012.
Harter, J. K., and F. L. Schmidt, "Conceptual versus empirical distinctions among constructs:
Implications for discriminant validity," Industrial and Organizational Psychology, 1, 37-40,
2008.
Harter, J. K., and S. Agrawal, Cross-cultural analysis of Gallup's Q12 employee engagement
instrument, Omaha, NE: Gallup, 2011.
Harter, J. K., F. L. Schmidt, and T. L. Hayes, "Business-Unit-Level Relationship Between Em-
ployee Satisfaction, Employee Engagement, and Business Outcomes: A Meta-Analysis," Jour-
nal of Applied Psychology, 87(2), 268-279, 2002.
Harter, J. K., F. L. Schmidt, S. Agrawal, S. K. Plowman, and A. Blue, The Relationship Between
Engagement at Work and Organizational Outcomes. 2016 Q12 Meta-Analysis: Ninth Edition,
Washington, DC: Gallup Organization, 2016.
Harter, J. K., F. K. Schmidt, J. W. Asplund, E. A. Killham, and S. Agrawal, "Causal impact of
employee work perceptions on the bottom line of organizations," Perspectives on Psychological
Science, 5(4), 378-389, 2010.
Hunter, J. E., and F. L. Schmidt, Methods of meta-analysis: Correcting error and bias in re-
search findings, 3rd edn, Newbury Park, CA: Sage, 2015.
Isen, A., "On the relationship between affect and creative problem solving," in: Russ, S. W.
(ed), Affect, Creative Experience and Psychological Adjustment, Philadelphia: Brunner/Mazel,
1999.
29
Isen, A. M., and R. A. Baron, "Positive affect as a factor in organizational behavior," Research
in Organizational Behavior, 13, 1-53, 1991.
Isen, A. M., K. A. Daubman, and G. P. Nowicki, "Positive Affect Facilitates Creative Problem
Solving," Journal of Personality and Social Psychology, 52(6), 1122-1131, 1987.
Jones, D., D. Molitor, and J. Reif, "What Do Workplace Wellness Programs Do? Evidence from
the Illinois Workplace Wellness Study," NBER Working Paper, 24229, 2018.
Judge, T. A., C. J. Thoresen, J. E. Bono, and G. K. Patton, "The Job Satisfaction-Job Perfor-
mance Relationship: A Qualitative and Quantitative Review," Psychological Bulletin, 127(3),
376-407, 2001.
Koys, D. J., "The Effects of Employee Satisfaction, Organizational Citizenship Behavior, and
Turnover on Organizational Effectiveness: A Unit-Level, Longitudinal Study," Personnel Psy-
chology, 54, 101-114, 2001.
Krause, A., "Don't worry, be happy? Happiness and reemployment," Journal of Economic Be-
havior & Organization, 96, 1-20, 2013.
Krekel, C., G. Ward, and J.-E. De Neve, "Work and Wellbeing: A Global Perspective," in:
Sachs, J. (ed), Global Happiness Policy Report, 2018.
Kunze, L., and N. Suppa, "Bowling alone or bowling at all? The effect of unemployment on
social participation," Journal of Economic Behavior & Organization, 133, 213-235, 2017.
Lawler, E. E. III, and L. W. Porter, "The effect of performance on job satisfaction," Industrial
Relations, 7, 20-28, 1967.
Leslie, L. M., C. Flaherty Manchester, T.-Y. Park, and S. Ahn Meng, "Flexible Work Practices:
A Source of Career Premiums or Penalties?," Academy of Management Journal, 55(6), 1407-
1428, 2012.
30
Lerner, J. S., and D. Keltner, "Beyond Valence: Toward a Model of Emotion-Specific Influ-
ences on Judgement and Choice," Cognition & Emotion, 4(14), 473-493, 2000.
Lerner, J. S., and D. Keltner, "Fear, Anger, and Risk," Journal of Personality and Social Psy-
chology, 81(1), 146-159, 2001.
Lerner, J. S., Y. Li, P. Valdesolo, and K. S. Kassam, "Emotion and Decision Making," Annual
Review of Psychology, 66, 799-823, 2015.
Lévy-Garboua, L., C. Montmarquette, and V. Simmonet, "Job satisfaction and quits," Labour
Economics, 14, 251-268, 2007.
Lyubomirsky, S., L. King, and E. Diener, "The Benefits of Frequent Positive Affect: Does Hap-
piness Lead to Success?," Psychological Bulletin, 131(6), 803-855, 2005.
Mackay, M. M., J. A. Allen, and R. S. Landis, "Investigating the incremental validity of em-
ployee engagement in the prediction of employee effectiveness: A meta-analytic path analysis,"
Human Resource Management Review, 27(1), 108-120, 2017.
Meier, A., "Emotions, Risk Attitudes, and Patience," mimeo, 2018.
Moen, P., E. L. Kelly, and R. Hill, "Does Enhancing Work-Time Control and Flexibility Reduce
Turnover? A Naturally Occurring Experiment," Social Problems, 58(1), 69-98, 2011.
Moen, P., E. L. Kelly, W. Fan, S.-R. Lee, D. Almeida, E. E. Kossek, and O. Buxto, "Does a
Flexibility/Support Organizational Initiative Improve High-Tech Employees' Wellbeing? Evi-
dence from the Work, Family, and Health Network," American Sociological Review, 81(1),
134-164, 2016.
OECD, "Balancing paid work, unpaid work and leisure," Online: http://www.oecd.org/gen-
der/data/balancingpaidworkunpaidworkandleisure.htm, accessed 26/10/2018, 2014.
Oishi, S., E. Diener, and R. E. Lucas, "The Optimum Level of Wellbeing: Can People Be Too
Happy?," Perspectives on Psychological Science, 2(4), 346-360, 2007.
31
Oswald, A. J., E. Proto, and D. Sgroi, "Happiness and Productivity," Journal of Labor Econom-
ics, 33(4), 789-822, 2015.
Pacheco-Unguetti, A. P., and B. R. Fabrice, "Happiness increases distraction by auditory devi-
ant stimuli," British Journal of Psychology, 107(3), 419-433, 2016.
Powell, M., J. Dawson, A. Topakas, J. Durose, and C. Fewtrell, "Staff satisfaction and organi-
sational performance: evidence from a longitudinal secondary analysis of the NHS staff survey
and outcome data," Health Services and Delivery Research, 2(50), 2014.
Proudfoot, J. G., P. J. Corr, D. E. Guest, and G. Dunn, "Cognitive-behavioural training to
change attributional style improves employee wellbeing, job satisfaction, productivity, and
turnover," Personality and Individual Differences, 46, 147-153, 2009.
Reichheld, F. F., "The One Number You Need to Grow," Harvard Business Review, 12, 47-54,
2003.
Rothbard, N. P., and S. L. Wilk, "Waking Up on the Right or Wrong Side of the Bed: Start-of-
Workday Mood, Work Events, Employee Affect, and Performance," Academy of Management
Journal, 54(5), 959-980, 2011.
Russell, J. A., "Core affect and the psychological construction of emotion," Psychological Re-
view, 110, 145-172, 2003.
Schwab, D. P., and L. L. Cummings, "Theories of performance and satisfaction: A review,"
Industrial Relations, 9, 408-430, 1970.
Spector, P. E., Job Satisfaction: Application, Assessment, Causes, and Consequences, Thou-
sand Oaks: Sage, 1997.
Staw, B. M., and S. G. Barsade, "Affect and Managerial Performance: A Test of the Sadder-
but-Wiser vs. Happier-and-Smarter Hypotheses," Administrative Science Quarterly, 38, 304-
331, 1993.
32
Staw, B. M., R. I. Sutton, and L. H. Pelled, "Employee positive emotion and favorable outcomes
in the workplace," Organisational Science, 5, 51-71, 1994.
Strauss, G., "Human relations – 1968 style," Industrial Relations, 7, 262-276, 1968.
Tenney, E. R., J. M. Poole, and E. Diener, "Does positivity enhance work performance?: Why,
when, and what we don't know," Research in Organizational Behavior, 36, 27-46, 2016.
Wash, L. C., J. K. Boehm, and S. Lyubomirsky, "Does happiness promote career success? Re-
visiting the evidence," Journal of Career Assessment, 26, 199-219, 2018.
Winkelmann, L., and R. Winkelmann, "Why are the Unemployed So Unhappy? Evidence from
Panel Data," Economica, 65(257), 1-15, 1998.
Wooden, M., D. Warren, and R. Drago, "Working Time Mismatch and Subjective Wellbeing,"
British Journal of Industrial Relations, 47(1), 147-179, 2009.
Wunder, C., and G. Heineck, "Working time preferences, hours mismatch and wellbeing of
couples: Are there spillovers?," Labour Economics, 24, 244-252, 2013.
Zelenski, J. M., S. A. Murphy, and D. A. Jenkins, "The Happy-Productive Worker Thesis Re-
visited," Journal of Happiness Studies, 9, 521-537, 2008.
33
Tables
Table 1: Correlation Between Employee Satisfaction and Firm Performance
CustomerSatisfaction
EmployeeProductivity Profitability
StaffTurnover
Employee Satisfaction 0.31 0.20 0.16 -0.25
95% Confidence [0.27, 0.35] [0.18, 0.23] [0.13, 0.19] [-0.28, -0.22]
Number of Studies 68 109 66 88
Number of Business Units 14,092 35,050 26,078 35,587
Notes: The table shows adjusted average correlation coefficients between employee satisfaction and different performanceoutcomes originating from a meta-analysis of 339 independent research studies that include observations on the wellbeing of1,882,131 employees and performance of 82,248 business units. See Section 3 for a description of the procedure. See TableA4 in the Appendix for a breakdown of studies.Source: Gallup Client Database, Years 1994 to 2015; Confidence Intervals 95% in Brackets.
34
Table 2a: Correlation Between Employee Satisfaction and Firm Performance, by Industry
CustomerSatisfaction
EmployeeProductivity Profitability
StaffTurnover
Finance
Employee Satisfaction 0.37 0.30 0.22 -0.29
95% Confidence [0.29, 0.44] [0.24, 0.36] [0.16, 0.28] [-0.34, -0.25]
Number of Studies 15 19 14 17
Number of Business Units 7,509 7,920 6,224 9,193
Retail
Employee Satisfaction 0.28 0.19 0.14 -0.29
95% Confidence [0.20, 0.36] [0.15, 0.24] [0.10, 0.19] [-0.38, -0.20]
Number of Studies 11 28 27 15
Number of Business Units 2,459 18,353 18,200 4,708
Services
Employee Satisfaction 0.24 0.21 0.10 -0.19
95% Confidence [0.17, 0.31] [0.13, 0.28] [-0.01, 0.21] [-0.25, -0.13]
Number of Studies 33 32 11 38
Number of Business Units 3,314 2,928 774 10,241
Manufacturing
Employee Satisfaction - 0.13 0.42 -0.26
95% Confidence - [0.08, 0.18] [0.31, 0.54] [-0.31, -0.20]
Number of Studies - 20 9 10
Number of Business Units - 4,642 268 5,293
Notes: The table shows adjusted average correlation coefficients between employee satisfaction and different performanceoutcomes, by industry, originating from a meta-analysis of 339 independent research studies that include observations on thewellbeing of 1,882,131 employees and performance of 82,248 business units. See Section 3 for a description of the procedure.See Table A4 in the Appendix for a breakdown of studies.Source: Gallup Client Database, Years 1994 to 2015; Confidence Intervals 95% in Brackets.
35
Table 2b: Correlation Between Employee Satisfaction and Firm Performance, by Region
CustomerSatisfaction
EmployeeProductivity Profitability
StaffTurnover
US
Employee Satisfaction 0.30 0.20 0.17 -0.23
95% Confidence [0.25, 0.35] [0.16, 0.24] [0.13, 0.21] [-0.28, -0.19]
Number of Studies 45 65 32 56
Number of Business Units 12,010 23,202 17,742 22,622
Non-US
Employee Satisfaction 0.41 0.25 0.24 -0.16
95% Confidence [0.27, 0.55] [0.19, 0.31] [0.15, 0.33] [-0.28, -0.04]
Number of Studies 6 18 14 11
Number of Business Units 563 2,238 2,593 1,032
Notes: The table shows adjusted average correlation coefficients between employee satisfaction and different performanceoutcomes, by region, originating from a meta-analysis of 339 independent research studies that include observations on thewellbeing of 1,882,131 employees and performance of 82,248 business units. See Section 3 for a description of the procedure.See Table A4 in the Appendix for a breakdown of studies.Source: Gallup Client Database, Years 1994 to 2015; Confidence Intervals 95% in Brackets.
36
Appendix
Figures
Figure A1: Correlation Between Employee Engagement and Firm Performance (Gallup, 95% Confidence Intervals). Notes:The figure plots adjusted average correlation coefficients between employee engagement and different performance outcomesoriginating from a meta-analysis of 339 independent research studies that include observations on the wellbeing of 1,882,131employees and performance of 82,248 business units. See Section 3 for a description of the procedure. See Table A1 for thecorresponding table and Table A5 for a breakdown of studies.
Figure A2a: Correlation Between Employee Engagement and Firm Performance, by Industry (Gallup, 95% Confidence Inter-vals). Notes: The figure plots adjusted average correlation coefficients between employee engagement and different perfor-mance outcomes, by industry, originating from a meta-analysis of 339 independent research studies that include observationson the wellbeing of 1,882,131 employees and performance of 82,248 business units. See Section 3 for a description of theprocedure. See Table A2a for the corresponding table and Table A5 for a breakdown of studies.
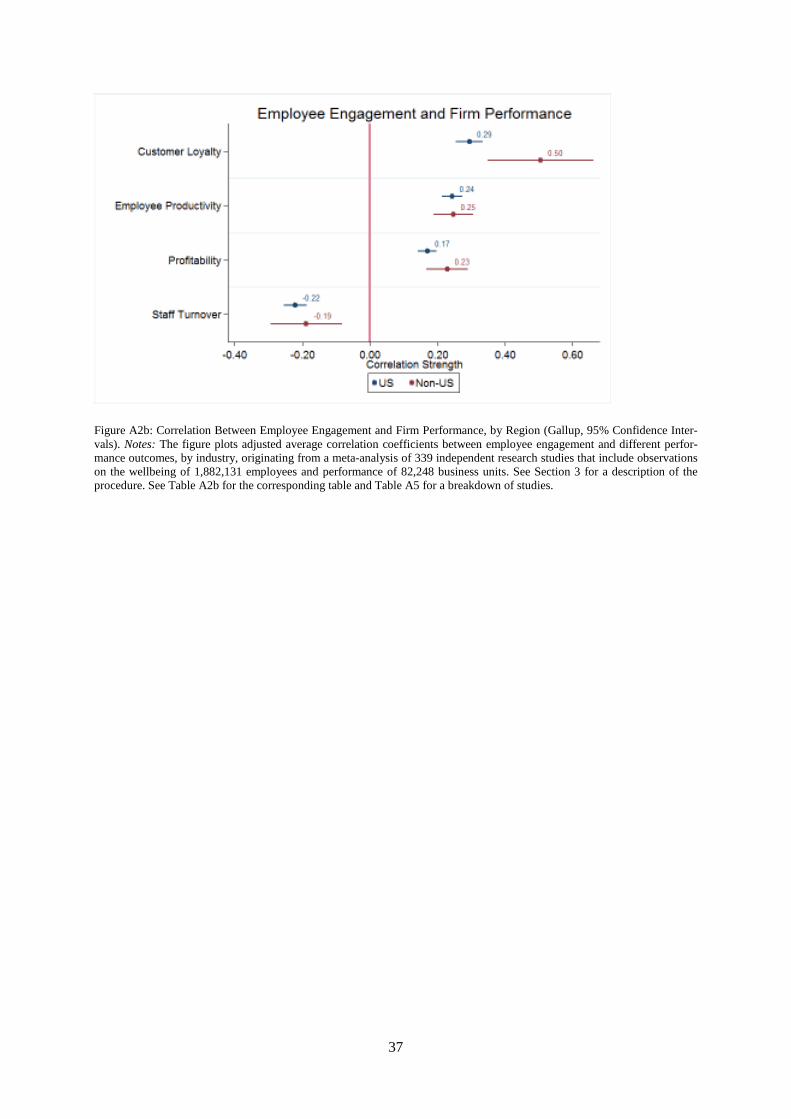
37
Figure A2b: Correlation Between Employee Engagement and Firm Performance, by Region (Gallup, 95% Confidence Inter-vals). Notes: The figure plots adjusted average correlation coefficients between employee engagement and different perfor-mance outcomes, by industry, originating from a meta-analysis of 339 independent research studies that include observationson the wellbeing of 1,882,131 employees and performance of 82,248 business units. See Section 3 for a description of theprocedure. See Table A2b for the corresponding table and Table A5 for a breakdown of studies.
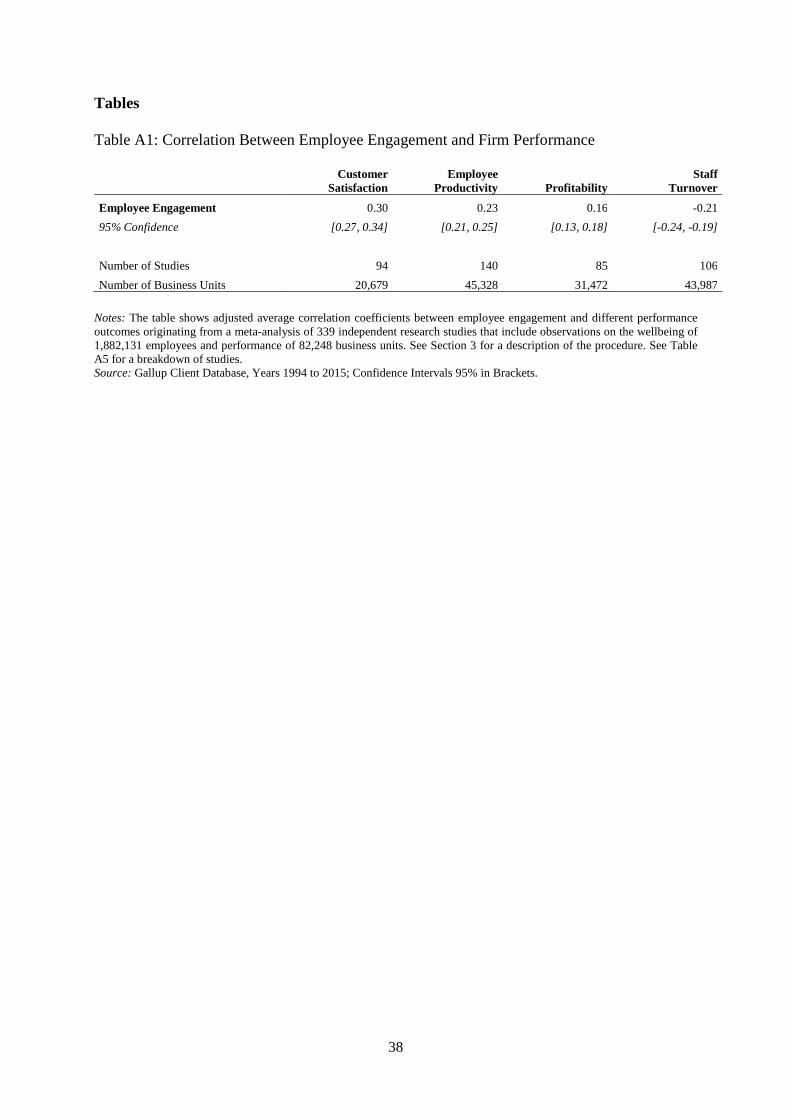
38
Tables
Table A1: Correlation Between Employee Engagement and Firm Performance
CustomerSatisfaction
EmployeeProductivity Profitability
StaffTurnover
Employee Engagement 0.30 0.23 0.16 -0.21
95% Confidence [0.27, 0.34] [0.21, 0.25] [0.13, 0.18] [-0.24, -0.19]
Number of Studies 94 140 85 106
Number of Business Units 20,679 45,328 31,472 43,987
Notes: The table shows adjusted average correlation coefficients between employee engagement and different performanceoutcomes originating from a meta-analysis of 339 independent research studies that include observations on the wellbeing of1,882,131 employees and performance of 82,248 business units. See Section 3 for a description of the procedure. See TableA5 for a breakdown of studies.Source: Gallup Client Database, Years 1994 to 2015; Confidence Intervals 95% in Brackets.
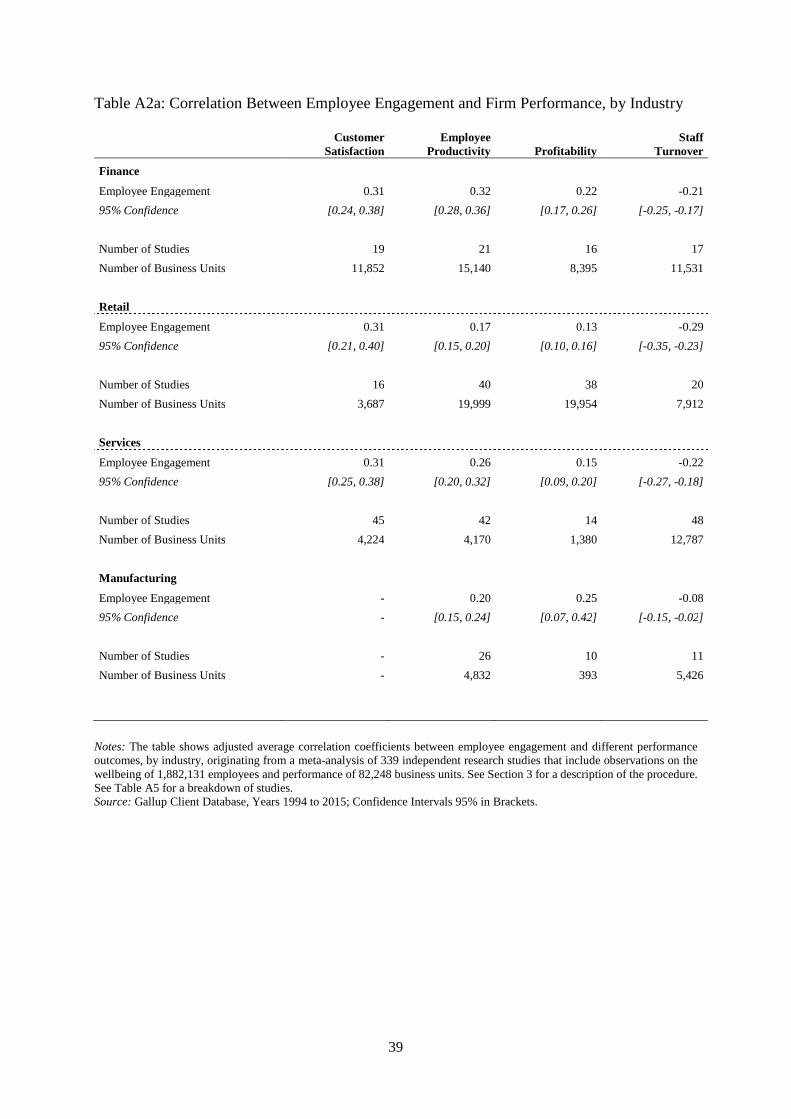
39
Table A2a: Correlation Between Employee Engagement and Firm Performance, by Industry
CustomerSatisfaction
EmployeeProductivity Profitability
StaffTurnover
Finance
Employee Engagement 0.31 0.32 0.22 -0.21
95% Confidence [0.24, 0.38] [0.28, 0.36] [0.17, 0.26] [-0.25, -0.17]
Number of Studies 19 21 16 17
Number of Business Units 11,852 15,140 8,395 11,531
Retail
Employee Engagement 0.31 0.17 0.13 -0.29
95% Confidence [0.21, 0.40] [0.15, 0.20] [0.10, 0.16] [-0.35, -0.23]
Number of Studies 16 40 38 20
Number of Business Units 3,687 19,999 19,954 7,912
Services
Employee Engagement 0.31 0.26 0.15 -0.22
95% Confidence [0.25, 0.38] [0.20, 0.32] [0.09, 0.20] [-0.27, -0.18]
Number of Studies 45 42 14 48
Number of Business Units 4,224 4,170 1,380 12,787
Manufacturing
Employee Engagement - 0.20 0.25 -0.08
95% Confidence - [0.15, 0.24] [0.07, 0.42] [-0.15, -0.02]
Number of Studies - 26 10 11
Number of Business Units - 4,832 393 5,426
Notes: The table shows adjusted average correlation coefficients between employee engagement and different performanceoutcomes, by industry, originating from a meta-analysis of 339 independent research studies that include observations on thewellbeing of 1,882,131 employees and performance of 82,248 business units. See Section 3 for a description of the procedure.See Table A5 for a breakdown of studies.Source: Gallup Client Database, Years 1994 to 2015; Confidence Intervals 95% in Brackets.
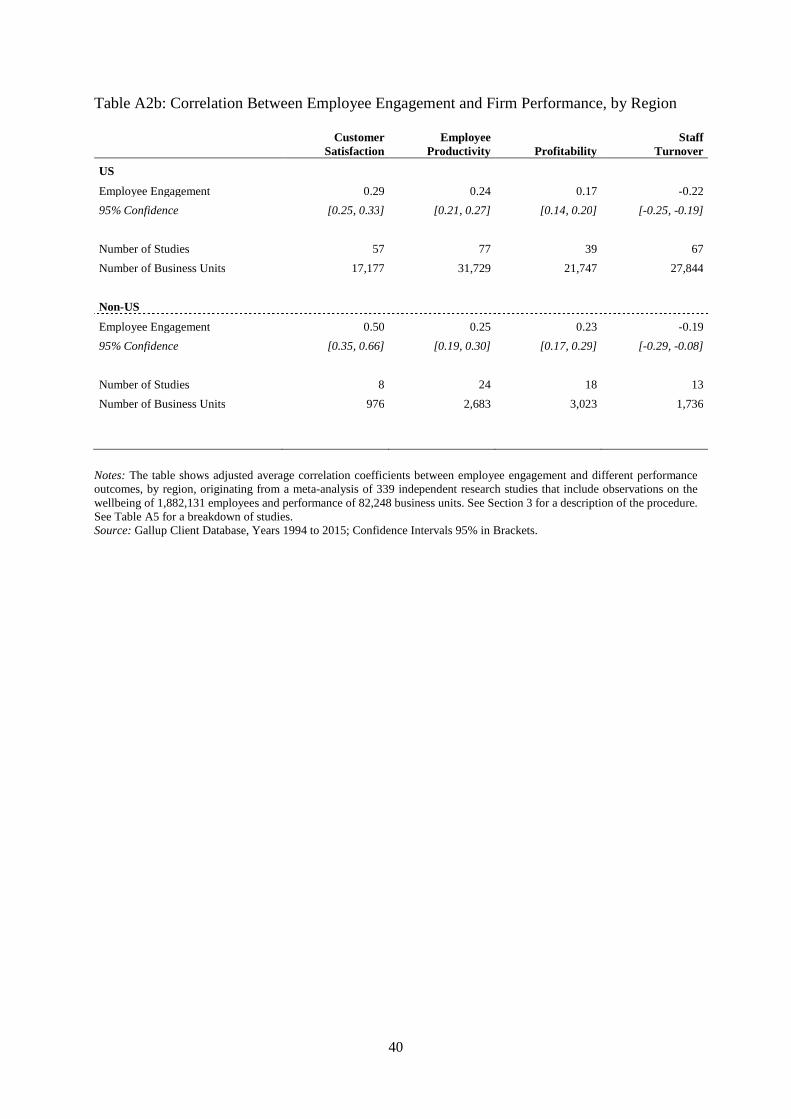
40
Table A2b: Correlation Between Employee Engagement and Firm Performance, by Region
CustomerSatisfaction
EmployeeProductivity Profitability
StaffTurnover
US
Employee Engagement 0.29 0.24 0.17 -0.22
95% Confidence [0.25, 0.33] [0.21, 0.27] [0.14, 0.20] [-0.25, -0.19]
Number of Studies 57 77 39 67
Number of Business Units 17,177 31,729 21,747 27,844
Non-US
Employee Engagement 0.50 0.25 0.23 -0.19
95% Confidence [0.35, 0.66] [0.19, 0.30] [0.17, 0.29] [-0.29, -0.08]
Number of Studies 8 24 18 13
Number of Business Units 976 2,683 3,023 1,736
Notes: The table shows adjusted average correlation coefficients between employee engagement and different performanceoutcomes, by region, originating from a meta-analysis of 339 independent research studies that include observations on thewellbeing of 1,882,131 employees and performance of 82,248 business units. See Section 3 for a description of the procedure.See Table A5 for a breakdown of studies.Source: Gallup Client Database, Years 1994 to 2015; Confidence Intervals 95% in Brackets.
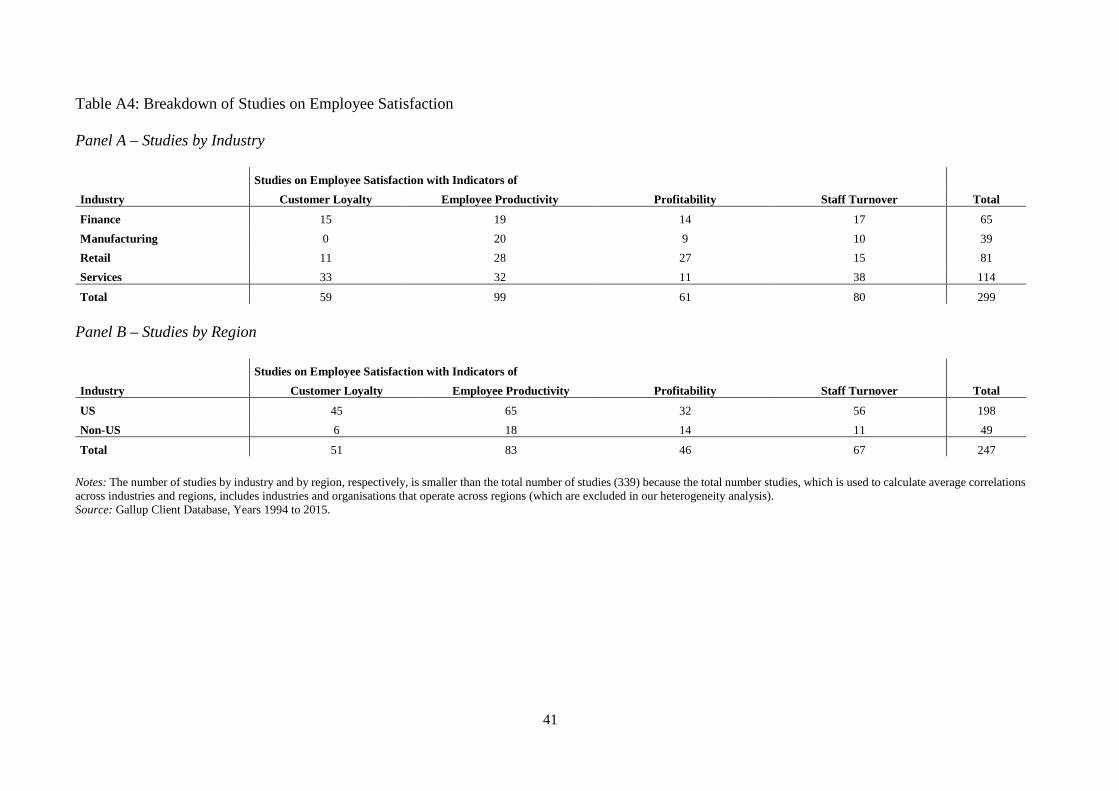
41
Table A4: Breakdown of Studies on Employee Satisfaction
Panel A – Studies by Industry
Studies on Employee Satisfaction with Indicators of
Industry Customer Loyalty Employee Productivity Profitability Staff Turnover Total
Finance 15 19 14 17 65
Manufacturing 0 20 9 10 39
Retail 11 28 27 15 81
Services 33 32 11 38 114
Total 59 99 61 80 299
Panel B – Studies by Region
Studies on Employee Satisfaction with Indicators of
Industry Customer Loyalty Employee Productivity Profitability Staff Turnover Total
US 45 65 32 56 198
Non-US 6 18 14 11 49
Total 51 83 46 67 247
Notes: The number of studies by industry and by region, respectively, is smaller than the total number of studies (339) because the total number studies, which is used to calculate average correlationsacross industries and regions, includes industries and organisations that operate across regions (which are excluded in our heterogeneity analysis).Source: Gallup Client Database, Years 1994 to 2015.
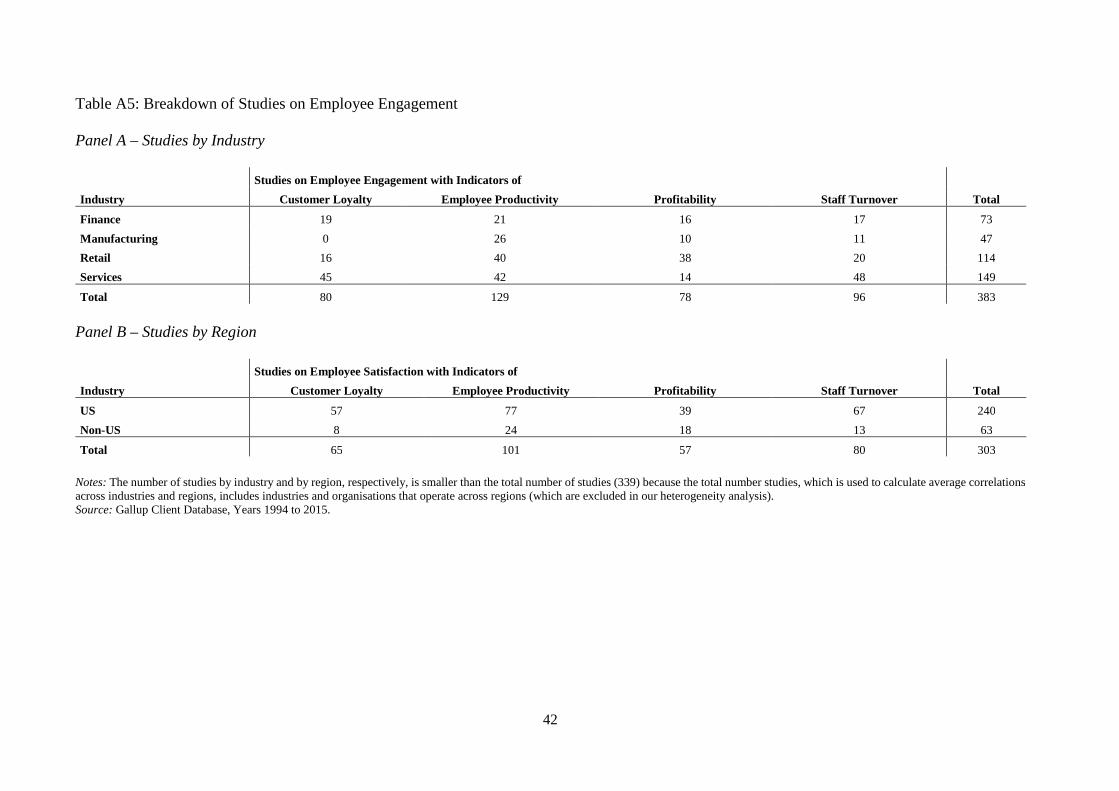
42
Table A5: Breakdown of Studies on Employee Engagement
Panel A – Studies by Industry
Studies on Employee Engagement with Indicators of
Industry Customer Loyalty Employee Productivity Profitability Staff Turnover Total
Finance 19 21 16 17 73
Manufacturing 0 26 10 11 47
Retail 16 40 38 20 114
Services 45 42 14 48 149
Total 80 129 78 96 383
Panel B – Studies by Region
Studies on Employee Satisfaction with Indicators of
Industry Customer Loyalty Employee Productivity Profitability Staff Turnover Total
US 57 77 39 67 240
Non-US 8 24 18 13 63
Total 65 101 57 80 303
Notes: The number of studies by industry and by region, respectively, is smaller than the total number of studies (339) because the total number studies, which is used to calculate average correlationsacross industries and regions, includes industries and organisations that operate across regions (which are excluded in our heterogeneity analysis).Source: Gallup Client Database, Years 1994 to 2015.
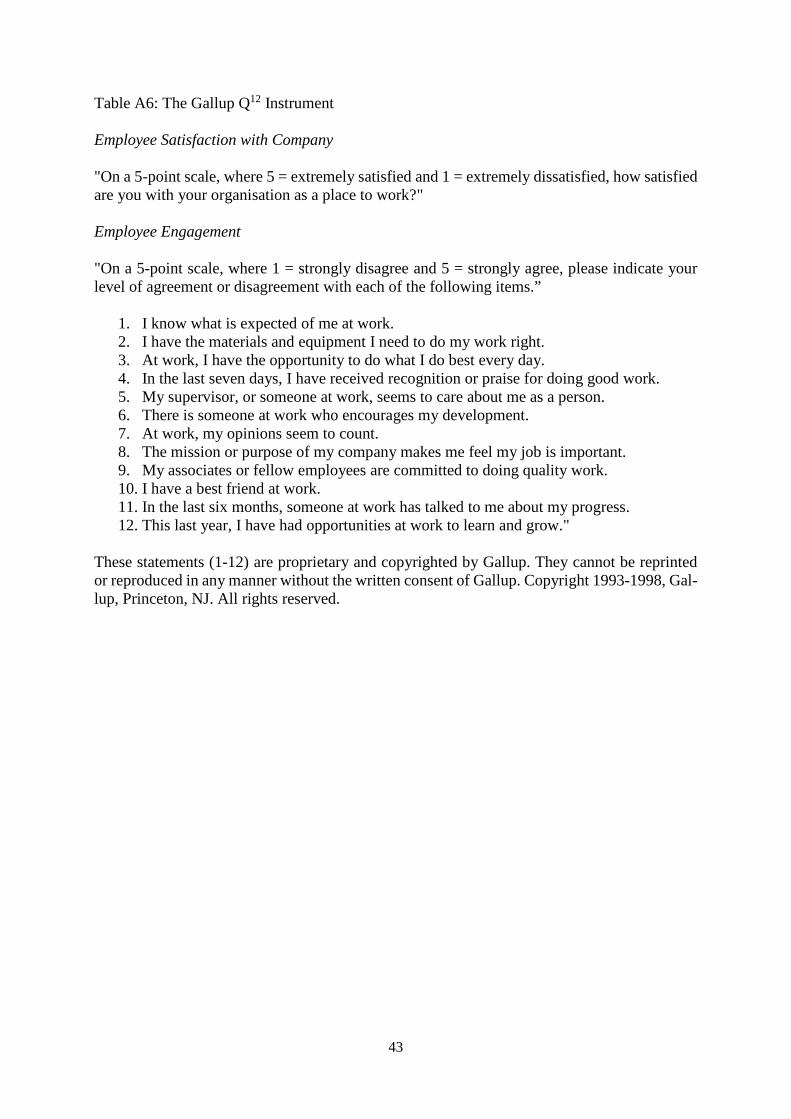
43
Table A6: The Gallup Q12 Instrument
Employee Satisfaction with Company
"On a 5-point scale, where 5 = extremely satisfied and 1 = extremely dissatisfied, how satisfiedare you with your organisation as a place to work?"
Employee Engagement
"On a 5-point scale, where 1 = strongly disagree and 5 = strongly agree, please indicate yourlevel of agreement or disagreement with each of the following items.”
1. I know what is expected of me at work.2. I have the materials and equipment I need to do my work right.3. At work, I have the opportunity to do what I do best every day.4. In the last seven days, I have received recognition or praise for doing good work.5. My supervisor, or someone at work, seems to care about me as a person.6. There is someone at work who encourages my development.7. At work, my opinions seem to count.8. The mission or purpose of my company makes me feel my job is important.9. My associates or fellow employees are committed to doing quality work.10. I have a best friend at work.11. In the last six months, someone at work has talked to me about my progress.12. This last year, I have had opportunities at work to learn and grow."
These statements (1-12) are proprietary and copyrighted by Gallup. They cannot be reprintedor reproduced in any manner without the written consent of Gallup. Copyright 1993-1998, Gal-lup, Princeton, NJ. All rights reserved.