Embed Size (px)
Citation preview

63%$12,6
80
$4,7
04
2008-and-
T h e K a i s e r F a m i l y F o u n d a T i o n
- A N D -
h e a l T h r e s e a r c h &
e d u c a T i o n a l T r u s T
2 0 0 8A n n u a l S u r v e y
EmployerHeal th
Benef i t s

The Kaiser Family Foundation is a non-profit private operating foundation, based in menlo Park, california, dedicated to producing and communicating the best possible information, research and analysis on health issues.
Founded in 1944, the Health Research & Educational Trust (HRET) is a private, not-for-profit organization involved in research, education, and demonstration programs addressing health management and policy issues. an affiliate of the american hospital association (aha), hreT collaborates with health care, government, academic, business, and community organizations across the united states to conduct research and disseminate findings that shape the future of health care. For more information about hreT, visit www.hret.org.
The National Opinion Research Center (NORC), headquartered at The university of chicago, conducts high quality social science research in economics, demographics, education and child development, health, substance abuse, mental health, justice and survey quality both in the u.s. and internationally. norc supports the research needs of government in the u.s. and abroad, international donor agencies, foundations, academic researchers, and private organizations. researchers at norc work on the survey under subcontract with hreT.
copyright © 2008 henry J. Kaiser Family Foundation, menlo Park, california, and health research & educational Trust, chicago, illinois. all rights reserved.
Printed in the united states of america.
isBn: 978-0-87258-847-9
american hospital association/health research & educational Trust catalog number 097519
Primary Authors:
KAISER FAMILY FOUNDATIONGary ClaxtonBianca DiJulioBenjamin FinderMarian Jarlenski
HEALTH RESEARCH & EDUCATIONAL TRUSTMegan McHugh Samantha Hawkins
NATIONAL OpINION RESEARCH CENTERJeremy pickreign
Heidi Whitmore
Jon Gabel
-and-
t h e k a i s e r f a m i l y f o u n d a t i o n - A N D -
h e a l t h r e s e a r C h & e d u C a t i o n a l t r u s t
Employer Health
Benefits
2 0 0 8A n n u a l S u r v e y

iii
t h e k a i s e r fa m i ly f o u n d at i o n - a n d - h e a lt h r e s e a r C h & e d u C at i o n a l t r u s t
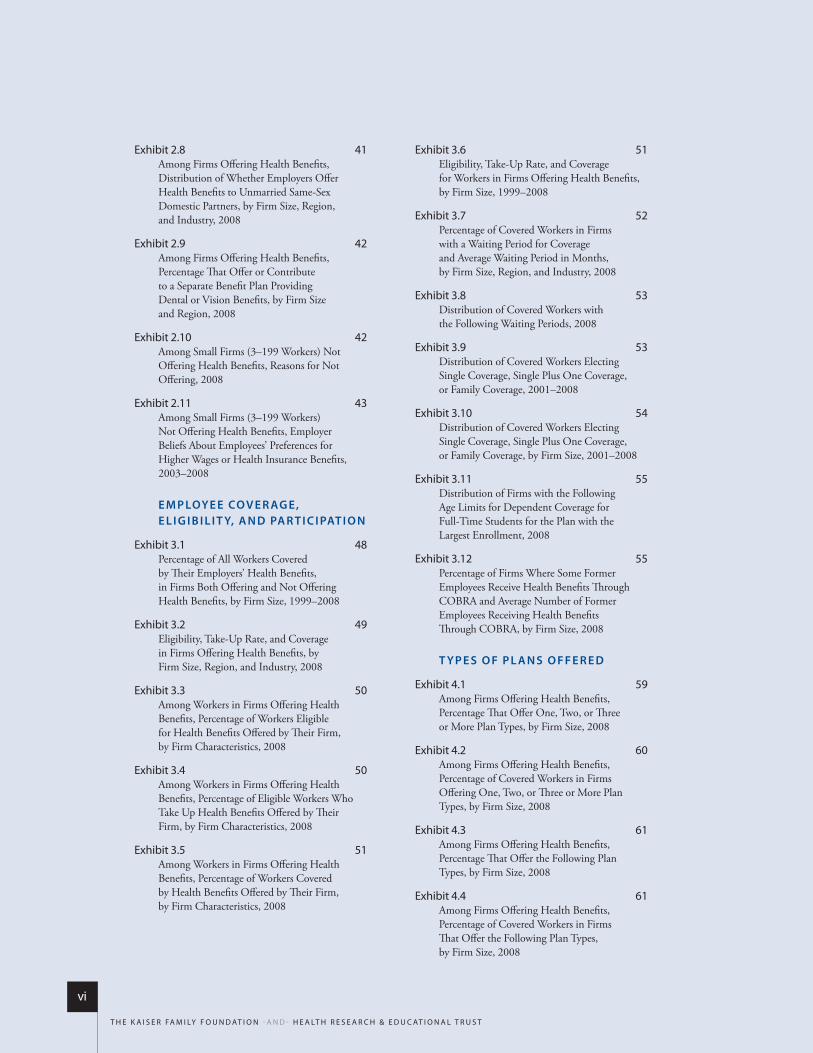
T A b l e o f C o N T e N T s
l i s T o f e x h i b i T s v
s u m m A ry o f f i N D i N g s 1
s u r v e y D e s i g N A N D m e T h o D s 9
s e C T i o N 1
Cost of Health Insurance 19
s e C T i o N 2
Health Benefits Offer Rates 33
s e C T i o N 3
Employee Coverage, Eligibility, and Participation 45
s e C T i o N 4
Types of Plans Offered 57
s e C T i o N 5
Market Shares of Health Plans 63
s e C T i o N 6
Worker and Employer Contributions for Premiums 67
s e C T i o N 7
Employee Cost Sharing 91
s e C T i o N 8
High-Deductible Health Plans with Savings Option 119
s e C T i o N 9
Prescription Drug and Mental Health Benefits 139
s e C T i o N 10
Plan Funding 153
s e C T i o N 11
Retiree Health Benefits 161
s e C T i o N 12
Wellness Programs and Employer Opinions 171

v
t h e k a i s e r fa m i ly f o u n d at i o n - a n d - h e a lt h r e s e a r C h & e d u C at i o n a l t r u s t
s u r v e y D e s i g N A N D m e T h o D s
exhibit m.1 15Selected Characteristics of Firms in the Survey Sample, 2008
exhibit m.2 16Distribution of Employers, Workers, and Workers Covered by Health Benefits, by Firm Size, 2008
exhibit m.3 17States by Region, 2008
Co s T o f h e A lT h i N s u r A N C e
exhibit 1.1 22Average Monthly and Annual Premiums for Covered Workers, Single and Family Coverage, by Plan Type, 2008
exhibit 1.2 23Average Monthly and Annual Premiums for Covered Workers, by Plan Type and Firm Size, 2008
exhibit 1.3 24Average Monthly and Annual Premiums for Covered Workers, by Plan Type and Region, 2008
exhibit 1.4 25Average Monthly and Annual Premiums for Covered Workers, by Plan Type and Industry, 2008
exhibit 1.5 27Average Annual Premiums for Single Coverage, by Firm Characteristics, 2008
exhibit 1.6 27Average Annual Premiums for Family Coverage, by Firm Characteristics, 2008
exhibit 1.7 28Distribution of Premiums for Single and Family Coverage Relative to the Average Annual Single or Family Premium, 2008
exhibit 1.8 29Average Annual Premiums for Single and Family Coverage, by Whether or Not Firm Offered the Same Plan Last Year and by Firm Size, 2008
exhibit 1.9 30Average Annual Premiums for Single and Family Coverage, 1999–2008
exhibit 1.10 30Average Annual Premiums for Covered Workers with Family Coverage, by Firm Size, 1999–2008
exhibit 1.11 31Average Annual Premiums for Covered Workers with Family Coverage, by Firm Size, 1999–2008
exhibit 1.12 32Average Health Insurance Premiums for Family Coverage, by Funding Arrangement, 1999–2008
h e A lT h b e N e f i T s o f f e r r AT e s
exhibit 2.1 36Percentage of Firms Offering Health Benefits, 1999–2008
exhibit 2.2 36Percentage of Firms Offering Health Benefits, by Firm Size, 1999–2008
exhibit 2.3 37Percentage of Firms Offering Health Benefits, by Firm Size, Region, and Industry, 2008
exhibit 2.4 38Percentage of Firms Offering Health Benefits, by Firm Characteristics, 2008
exhibit 2.5 39Among Firms Offering Health Benefits, Percentage That Offer Health Benefits to Part-Time Workers, by Firm Size, 1999–2008
exhibit 2.6 39Among Firms Offering Health Benefits, Percentage That Offer Health Benefits to Temporary Workers, by Firm Size, 1999–2008
exhibit 2.7 40Among Firms Offering Health Benefits, Distribution of Whether Employers Offer Health Benefits to Unmarried Opposite-Sex Domestic Partners, by Firm Size, Region, and Industry, 2008
l i s T o f e x h i b i T s
t h e k a i s e r fa m i ly f o u n d at i o n - a n d - h e a lt h r e s e a r C h & e d u C at i o n a l t r u s t
vi
exhibit 2.8 41Among Firms Offering Health Benefits, Distribution of Whether Employers Offer Health Benefits to Unmarried Same-Sex Domestic Partners, by Firm Size, Region, and Industry, 2008
exhibit 2.9 42Among Firms Offering Health Benefits, Percentage That Offer or Contribute to a Separate Benefit Plan Providing Dental or Vision Benefits, by Firm Size and Region, 2008
exhibit 2.10 42Among Small Firms (3–199 Workers) Not Offering Health Benefits, Reasons for Not Offering, 2008
exhibit 2.11 43Among Small Firms (3–199 Workers) Not Offering Health Benefits, Employer Beliefs About Employees’ Preferences for Higher Wages or Health Insurance Benefits, 2003–2008
e m p loye e Co v e r Ag e, e l i g i b i l i T y, A N D pA r T i C i pAT i o N
exhibit 3.1 48Percentage of All Workers Covered by Their Employers’ Health Benefits, in Firms Both Offering and Not Offering Health Benefits, by Firm Size, 1999–2008
exhibit 3.2 49Eligibility, Take-Up Rate, and Coverage in Firms Offering Health Benefits, by Firm Size, Region, and Industry, 2008
exhibit 3.3 50Among Workers in Firms Offering Health Benefits, Percentage of Workers Eligible for Health Benefits Offered by Their Firm, by Firm Characteristics, 2008
exhibit 3.4 50Among Workers in Firms Offering Health Benefits, Percentage of Eligible Workers Who Take Up Health Benefits Offered by Their Firm, by Firm Characteristics, 2008
exhibit 3.5 51Among Workers in Firms Offering Health Benefits, Percentage of Workers Covered by Health Benefits Offered by Their Firm, by Firm Characteristics, 2008
exhibit 3.6 51Eligibility, Take-Up Rate, and Coverage for Workers in Firms Offering Health Benefits, by Firm Size, 1999–2008
exhibit 3.7 52Percentage of Covered Workers in Firms with a Waiting Period for Coverage and Average Waiting Period in Months, by Firm Size, Region, and Industry, 2008
exhibit 3.8 53Distribution of Covered Workers with the Following Waiting Periods, 2008
exhibit 3.9 53Distribution of Covered Workers Electing Single Coverage, Single Plus One Coverage, or Family Coverage, 2001–2008
exhibit 3.10 54Distribution of Covered Workers Electing Single Coverage, Single Plus One Coverage, or Family Coverage, by Firm Size, 2001–2008
exhibit 3.11 55Distribution of Firms with the Following Age Limits for Dependent Coverage for Full-Time Students for the Plan with the Largest Enrollment, 2008
exhibit 3.12 55Percentage of Firms Where Some Former Employees Receive Health Benefits Through COBRA and Average Number of Former Employees Receiving Health Benefits Through COBRA, by Firm Size, 2008
T yp e s o f p l A N s o f f e r e D
exhibit 4.1 59Among Firms Offering Health Benefits, Percentage That Offer One, Two, or Three or More Plan Types, by Firm Size, 2008
exhibit 4.2 60Among Firms Offering Health Benefits, Percentage of Covered Workers in Firms Offering One, Two, or Three or More Plan Types, by Firm Size, 2008
exhibit 4.3 61Among Firms Offering Health Benefits, Percentage That Offer the Following Plan Types, by Firm Size, 2008
exhibit 4.4 61Among Firms Offering Health Benefits, Percentage of Covered Workers in Firms That Offer the Following Plan Types, by Firm Size, 2008

vii
t h e k a i s e r fa m i ly f o u n d at i o n - a n d - h e a lt h r e s e a r C h & e d u C at i o n a l t r u s t
m A r k e T s h A r e s o f h e A lT h p l A N s
exhibit 5.1 65Distribution of Health Plan Enrollment for Covered Workers, by Plan Type, 1988–2008
exhibit 5.2 66Health Plan Enrollment, by Firm Size, Region, and Industry, 2008
W o r k e r A N D e m p loye r Co N T r i b u T i o N s f o r p r e m i u m s
exhibit 6.1 70Average Percentage of Premium Paid by Covered Workers for Single and Family Coverage, 1999–2008
exhibit 6.2 71Average Monthly Worker Premium Contributions Paid by Covered Workers for Single and Family Coverage, 1999–2008
exhibit 6.3 72Average Annual Worker and Employer Contributions to Premiums and Total Premiums for Single Coverage, 1999–2008
exhibit 6.4 73Average Annual Worker and Employer Contributions to Premiums and Total Premiums for Family Coverage, 1999–2008
exhibit 6.5 74 Average Annual Firm and Worker Premium Contributions and Total Premiums for Covered Workers for Single and Family Coverage, by Plan Type, 2008
exhibit 6.6 75Average Annual Firm and Worker Premium Contributions and Total Premiums for Covered Workers for Single Coverage, by Plan Type and Firm Size, 2008
exhibit 6.7 76Average Annual Firm and Worker Premium Contributions and Total Premiums for Covered Workers for Family Coverage, by Plan Type and Firm Size, 2008
exhibit 6.8 77Average Monthly and Annual Worker Premium Contributions Paid by Covered Workers for Single and Family Coverage, by Plan Type and Firm Size, 2008
exhibit 6.9 78Average Monthly and Annual Worker Premium Contributions Paid by Covered Workers for Single and Family Coverage, by Plan Type and Region, 2008
exhibit 6.10 79Average Monthly Worker Premium Contributions Paid by Covered Workers for Single and Family Coverage, by Plan Type, 1999–2008
exhibit 6.11 80Distribution of Percentage of Premium Paid by Covered Workers for Single and Family Coverage, 2001–2008
exhibit 6.12 81Distribution of Percentage of Premium Paid by Covered Workers for Single Coverage, by Firm Size, 2001–2008
exhibit 6.13 82Distribution of Percentage of Premium Paid by Covered Workers for Family Coverage, by Firm Size, 2001–2008
exhibit 6.14 83Average Percentage of Premiums Paid by Covered Workers for Single Coverage, by Firm Characteristics, 2008
exhibit 6.15 84Average Percentage of Premiums Paid by Covered Workers for Family Coverage, by Firm Characteristics, 2008
exhibit 6.16 85Average Percentage of Premium Paid by Covered Workers for Single and Family Coverage, by Plan Type and Firm Size, 2008
exhibit 6.17 86Average Percentage of Premium Paid by Covered Workers for Single and Family Coverage, by Plan Type, 1999–2008
exhibit 6.18 87Average Percentage of Premium Paid by Covered Workers for Single and Family Coverage, by Plan Type and Region, 2008
exhibit 6.19 88Average Percentage of Premium Paid by Covered Workers, by Plan Type and Industry, 2008
exhibit 6.20 90Percentage of Covered Workers in Firms That Vary Worker Premium Contributions by Wage, by Firm Size and Region, 2008
t h e k a i s e r fa m i ly f o u n d at i o n - a n d - h e a lt h r e s e a r C h & e d u C at i o n a l t r u s t
viii
e m p loye e Co s T s h A r i N g
exhibit 7.1 96Percentage of Covered Workers with No General Annual Health Plan Deductible for Single and Family Coverage, by Plan Type and Firm Size, 2008
exhibit 7.2 97Among Covered Workers with No General Annual Health Plan Deductible for Single and Family Coverage, Percentage Who Have the Following Types of Cost Sharing, by Plan Type, 2008
exhibit 7.3 98Among Covered Workers with a General Annual Health Plan Deductible for Single Coverage, Average Deductible, by Plan Type and Firm Size, 2008
exhibit 7.4 99Among Covered Workers with a General Annual Health Plan Deductible for Single Coverage, Average Deductible, by Plan Type and Region, 2008
exhibit 7.5 100Among Covered Workers with a General Annual Health Plan Deductible for Single Coverage, Average Deductible, by Plan Type, 2006–2008
exhibit 7.6 101Percentage of Covered Workers Enrolled in a Plan with a General Annual Deductible of $1,000 or More for Single Coverage, By Firm Size, 2006–2008
exhibit 7.7 102Among Covered Workers with a General Annual Health Plan Deductible for Single PPO Coverage, Distribution of Deductibles, 2006–2008
exhibit 7.8 102Among Covered Workers with a General Annual Health Plan Deductible for Single POS Coverage, Distribution of Deductibles, 2006–2008
exhibit 7.9 103Distribution of Type of General Annual Deductible for Covered Workers with Family Coverage, by Plan Type and Firm Size, 2008
exhibit 7.10 104Among Covered Workers with a General Annual Health Plan Deductible, Average Deductibles for Family Coverage, by Deductible Type, Plan Type, and Firm Size, 2008
exhibit 7.11 105Among Covered Workers with a General Annual Health Plan Deductible for Family Coverage, Average Aggregate Deductible, by Plan Type, 2006–2008
exhibit 7.12 106Among Covered Workers with a General Annual Health Plan Deductible for Family Coverage, Distribution of Deductibles, by Plan Type and Deductible Type, 2008
exhibit 7.13 106Among Covered Workers with a Separate per Person General Annual Health Plan Deductible for Family Coverage, Distribution of Maximum Number of Family Members Required to Meet the Deductible, by Plan Type, 2008
exhibit 7.14 107Among Covered Workers with a General Annual Health Plan Deductible, Percentage with Coverage for the Following Services Without Having to First Meet the Deductible, by Plan Type, 2008
exhibit 7.15 107Distribution of Covered Workers with Separate Cost Sharing for Each Hospital Admission in Addition to Any General Annual Deductible, by Plan Type, 2008
exhibit 7.16 108Distribution of Covered Workers with Separate Cost Sharing for Each Outpatient Surgery in Addition to Any General Annual Deductible, by Plan Type, 2008
exhibit 7.17 109Among Covered Workers with Separate Cost Sharing for Each Hospital Admission or Each Outpatient Surgery in Addition to Any Plan Deductible, Average Cost Sharing, by Plan Type, 2008
exhibit 7.18 110In Addition to Any Plan Deductible, Percentage of Covered Workers with the Following Types of Cost Sharing for Physician Office Visits, by Plan Type, 2008
exhibit 7.19 110Among Covered Workers with Copayments for In-Network Physician Office Visits, Average Copayments, by Plan Type, 2008
exhibit 7.20 111Among Covered Workers with Copayments for a Physician Office Visit with a Primary Care Physician, Distribution of Copayments, by Plan Type, 2004–2008

ix
t h e k a i s e r fa m i ly f o u n d at i o n - a n d - h e a lt h r e s e a r C h & e d u C at i o n a l t r u s t
exhibit 7.21 112Among Covered Workers with Copayments for a Physician Office Visit with a Specialty Care Physician, Distribution of Copayments, by Plan Type, 2006–2008
exhibit 7.22 113Among Covered Workers in HMOs with a Copayment for a Physician Office Visit, Percentage with Various Copayments, 1999–2008
exhibit 7.23 113Among Covered Workers with Coinsurance for Physician Office Visits, Distribution of Average Coinsurance Rates, by Plan Type, 2008
exhibit 7.24 114Percentage of Covered Workers Without an Annual Out-of-Pocket Maximum for Single and Family Coverage, by Plan Type, 2008
exhibit 7.25 114Among Covered Workers with an Annual Out-of-Pocket Maximum, Percentage Whose Spending for Various Services Does Not Count Towards the Out-of-Pocket Maximum, 2008
exhibit 7.26 115Among Covered Workers with an Out- of-Pocket Maximum for Single Coverage, Distribution of Out-of-Pocket Maximums, by Plan Type, 2008
exhibit 7.27 116Distribution of Type of Out-of-Pocket Maximum for Covered Workers with Family Coverage, by Plan Type and Firm Size, 2008
exhibit 7.28 117Among Covered Workers with an Aggregate Out-of-Pocket Maximum for Family Coverage, Distribution of Out-of-Pocket Maximums, by Plan Type, 2008
exhibit 7.29 118Among Covered Workers with a Separate per Person Out-of-Pocket Maximum for Family Coverage, Distribution of Out-of-Pocket Maximums, by Plan Type, 2008
exhibit 7.30 118Among Covered Workers with a Separate per Person Out-of-Pocket Maximum for Family Coverage, Distribution of Maximum Number of Family Members Required to Meet the Maximum, by Plan Type, 2008
h i g h - D e D u C T i b l e h e A lT h p l A N s W i T h s Av i N g s o p T i o N
exhibit 8.1 126Among Firms Offering Health Benefits, Percentage That Offer an HDHP/HRA and/or an HSA-Qualified HDHP, 2005–2008
exhibit 8.2 126Among Firms Offering Health Benefits, Percentage That Offer an HDHP/SO, by Firm Size, 2008
exhibit 8.3 127Among Firms Offering Health Benefits, Percentage That Offer an HDHP/SO, by Firm Size, 2005–2008
exhibit 8.4 127Percentage of Workers Enrolled in an HDHP/HRA or HSA-Qualified HDHP, 2006–2008
exhibit 8.5 128Percentage of Workers Enrolled in an HDHP/HRA or HSA-Qualified HDHP, by Firm Size, 2008
exhibit 8.6 128HDHP/HRA and HSA-Qualified HDHP Features, 2008
exhibit 8.7 129HSA-Qualified HDHP Features, by Firm Size, 2008
exhibit 8.8 130Average Annual Premiums and Contributions to Savings Accounts for Covered Workers in HDHP/HRAs or HSA-Qualified HDHPs, Compared to All Non-HDHP/SO Plans, 2008
exhibit 8.9 131Distribution of Covered Workers with the Following General Annual Deductible Amounts for Single Coverage, HDHP/HRAs and HSA-Qualified HDHPs, 2008
exhibit 8.10 131Among Covered Workers, Distribution of Type of General Annual Deductible for Family Coverage, HDHP/HRAs and HSA-Qualified HDHPs, 2008
exhibit 8.11 132Distribution of Covered Workers with the Following Aggregate Family Deductible Amounts, HDHP/HRAs and HSA-Qualified HDHPs, 2008
t h e k a i s e r fa m i ly f o u n d at i o n - a n d - h e a lt h r e s e a r C h & e d u C at i o n a l t r u s t
x
exhibit 8.12 132Percentage of Covered Workers with Benefits Paid for by the Plan Without Having to First Meet the Deductible, HDHP/HRAs and HSA-Qualified HDHPs, by Benefit Type, 2008
exhibit 8.13 133Percentage of Covered Workers in Partially or Completely Self-Funded HDHP/HRAs and HSA-Qualified HDHPs, 2008
exhibit 8.14 133Distribution of Covered Workers with the Following Annual Employer Contributions to their HRA or HSA, for Single Coverage, 2008
exhibit 8.15 134Distribution of Covered Workers with the Following Annual Employer Contributions to their HRA or HSA, for Family Coverage, 2008
exhibit 8.16 135Distribution of Covered Workers in HDHP/HRAs and HSA-Qualified HDHPs with the Following Types of Cost Sharing in Addition to the General Annual Deductible, 2008
exhibit 8.17 136Among Firms Offering HDHP/SOs, Opinions on Outcomes and Reasons for Offering HDHP/SOs, 2008
exhibit 8.18 137Among Firms Not Currently Offering an HDHP/HRA, Percentage That Say They Are “Very Likely” or “Somewhat Likely” to Offer an HDHP/HRA in the Next Year, 2005–2008
exhibit 8.19 138Among Firms Not Currently Offering an HSA-Qualified HDHP, Percentage That Say They Are “Very Likely” or “Somewhat Likely” to Offer an HSA-Qualified HDHP in the Next Year, 2005–2008
p r e s C r i p T i o N D r u g A N D m e N TA l h e A lT h b e N e f i T s
exhibit 9.1 142Distribution of Covered Workers Facing Different Cost-Sharing Formulas for Prescription Drug Benefits, 2000–2008
exhibit 9.2 143Distribution of Covered Workers Facing Different Cost-Sharing Formulas for Prescription Drug Benefits, by Plan Type, 2008
exhibit 9.3 144Among Workers with Three, Four, or More Tiers of Cost Sharing, Distribution of Covered Workers with the Following Types of Cost Sharing for Prescription Drugs, by Drug and Plan Type, 2008
exhibit 9.4 145Among Covered Workers with Three, Four, or More Tiers of Prescription Cost Sharing, Average Copayments and Average Coinsurance, 2000-2008
exhibit 9.5 146Among Workers with Two Tiers of Cost Sharing for Prescription Drugs, Distribution of Covered Workers with the Following Types of Cost Sharing for Prescription Drugs, by Drug and Plan Type, 2008
exhibit 9.6 147Among Covered Workers with Two Tiers of Prescription Cost Sharing, Average Copayments and Average Coinsurance, 2000-2008
exhibit 9.7 147Among Workers with the Same Cost Sharing Regardless of Type of Drug, Distribution of Covered Workers with the Following Types of Cost Sharing for Prescription Drugs, by Plan Type, 2008
exhibit 9.8 148Among Covered Workers with the Same Cost Sharing Regardless of Type of Drug, Average Copayments and Average Coinsurance, 2000–2008
exhibit 9.9 148 Percentage of Covered Workers with Drug Coverage Who Face a Separate Drug Deductible, by Plan Type, 2005–2008
exhibit 9.10 149Percentage of Covered Workers with Drug Coverage with a Separate Annual Out-of-Pocket Limit That Applies to Prescription Drugs, by Plan Type, 2007–2008
exhibit 9.11 150Among Covered Workers with Outpatient Mental Health Coverage, Distribution of Number of Annual Outpatient Visits Covered, by Plan Type, 2008
exhibit 9.12 151Among Covered Workers with Inpatient Mental Health Coverage, Distribution of Number of Annual Inpatient Days Covered, by Plan Type, 2008

xi
t h e k a i s e r fa m i ly f o u n d at i o n - a n d - h e a lt h r e s e a r C h & e d u C at i o n a l t r u s t
p l A N f u N D i N g
exhibit 10.1 155Percentage of Covered Workers in Partially or Completely Self-Funded Plans, by Firm Size, 1999–2008
exhibit 10.2 155Percentage of Covered Workers in Partially or Completely Self-Funded Plans, by Plan Type, 1999–2008
exhibit 10.3 156Percentage of Covered Workers in Partially or Completely Self-Funded Plans, by Firm Size, Region, and Industry, 2008
exhibit 10.4 157Percentage of Covered Workers in Partially or Completely Self-Funded Plans, by Plan Type and Firm Size, 2008
exhibit 10.5 157Percentage of Covered Workers in Partially or Completely Self-Funded Conventional Plans, by Firm Size, 1999–2008
exhibit 10.6 158Percentage of Covered Workers in Partially or Completely Self-Funded HMO Plans, by Firm Size, 1999–2008
exhibit 10.7 158Percentage of Covered Workers in Partially or Completely Self-Funded PPO Plans, by Firm Size, 1999–2008
exhibit 10.8 159Percentage of Covered Workers in Partially or Completely Self-Funded POS Plans, by Firm Size, 1999–2008
exhibit 10.9 159Percentage of Covered Workers in Partially or Completely Self-Funded HDHP/SOs, by Firm Size, 2006–2008
r e T i r e e h e A lT h b e N e f i T s
exhibit 11.1 163Among All Large Firms (200 or More Workers) Offering Health Benefits to Active Workers, Percentage of Firms Offering Retiree Health Benefits, 1988–2008
exhibit 11.2 164Among Firms Offering Health Benefits to Active Workers, Percentage of Firms Offering Retiree Health Benefits, by Firm Size, Region, and Industry, 2008
exhibit 11.3 165Among All Large Firms (200 or More Workers) Offering Health Benefits to Active Workers, Percentage of Firms Offering Retiree Health Benefits, by Firm Characteristics, 2008
exhibit 11.4 165Among All Large Firms (200 or More Workers) Offering Health Benefits to Active Workers and Offering Retiree Coverage, Percentage of Firms Offering Health Benefits to Early and Medicare-Age Retirees, 1999–2008
exhibit 11.5 166Among All Large Firms (200 or More Workers) Offering Health Benefits to Active Workers and Offering Retiree Coverage, Percentage of Firms Offering Retiree Health Benefits to Early and Medicare-Age Retirees, by Firm Size, Region, and Industry, 2008
exhibit 11.6 167Among All Large Firms (200 or More Workers) Offering Health Benefits to Active Workers and Offering Retiree Health Benefits, Percentage of Firms in Which at Least Some Active Employees are Eligible for Retiree Health Benefits, by Firm Size, 2008
exhibit 11.7 168Among All Large Firms (200 or More Workers) Offering Health Benefits to Active Workers and Offering Retiree Health Benefits in Which at Least Some Active Employees are Eligible for Retiree Health Benefits, Percentage of Active Employees That Will Be Eligible for Retiree Benefits, by Firm Size, 2008
exhibit 11.8 169 Among All Large Firms (200 or More Workers) Offering Health Benefits to Active Workers and Offering Retiree Health Benefits, Percentage of Firms in Which at Least Some Workers Hired in the Past 12 Months are Eligible for Retiree Health Benefits, by Firm Size, 2008
W e l l N e s s p r o g r A m s A N D e m p loye r o p i N i o N s
exhibit 12.1 175Among Firms Offering Health Benefits, Percentage Offering a Particular Wellness Program to Their Employees, by Firm Size, Region, and Industry, 2008
exhibit 12.2 176Among Firms Offering Health Benefits, Percentage Offering a Particular Wellness Program to Their Employees, by Firm Size, Region, and Industry, 2008
xii
t h e k a i s e r fa m i ly f o u n d at i o n - a n d - h e a lt h r e s e a r C h & e d u C at i o n a l t r u s t
exhibit 12.3 177Among Firms Offering Health Benefits, Percentage of Firms with the Following Features of Wellness Benefits, by Firm Size and Region, 2008
exhibit 12.4 178Among Firms Offering Health and Wellness Benefits, Percentage of Firms That Offer Specific Incentives to Employees Who Participate in Wellness Programs, by Firm Size and Region, 2008
exhibit 12.5 179Among Firms Offering Health Benefits and Wellness Programs, Percentage That Use Specific Methods to Identify Individuals and Encourage Participation in Wellness Programs, by Firm Size, Region, and Industry, 2008
exhibit 12.6 180Among Firms Offering Health Benefits and Wellness Programs, Percentage of Firms Reporting the Following as the Firm’s Primary Reason for Offering Wellness Programs, by Firm Size, 2008
exhibit 12.7 180Among Firms Offering Health Benefits and Wellness Programs, Percentage of Firms That Think Offering Wellness Programs is Effective in Improving Health or Reducing Costs, 2008
exhibit 12.8 181Among Firms Offering Health Benefits, Percentage of Firms That Offer Employees Health Risk Assessments, Offer Incentives to Complete Assessments, and Use Assessments to Increase Wellness Participation, by Firm Size and Region, 2008
exhibit 12.9 182Among Firms Offering Health Benefits, Percentage of Firms That Offer a Disease Management Program for Their Plan with the Largest Enrollment and Percentage of Firms with Disease Management Offering Financial Incentives to Participate, by Firm Size, 2008
exhibit 12.10 183Among Firms Offering Health Benefits That Have a Disease Management Program for Their Plan with the Largest Enrollment, Percentage with a Particular Program, by Firm Size, Region, and Industry, 2008
exhibit 12.11 184Among Firms Offering Health Benefits That Have a Disease Management Program for Their Plan with the Largest Enrollment, Percentage with a Particular Program, by Firm Size, Region, and Industry, 2008
exhibit 12.12 185Among Both Firms Offering and Not Offering Health Benefits, Distribution of Firms’ Opinions on the Effectiveness of the Following Strategies to Contain Health Insurance Costs, by Firm Size, 2008
exhibit 12.13 186Among Firms Offering Health Benefits, Distribution of Firms Reporting the Likelihood of Making the Following Changes in the Next Year, by Firm Size, 2008

t h e k a i s e r fa m i ly f o u n d at i o n - a n d - h e a lt h r e s e a r C h & e d u C at i o n a l t r u s t
1
The key findings from the 2008 survey include increases in the average single and family premiums and an increase in the percentage of workers enrolled in high-deductible health plans with a savings option (HDHP/SO). Cost sharing for medical services has also increased in recent years. The percentage of employers sponsoring insurance and the percentage of workers covered by employer-sponsored insurance remained stable over the past year.
Fifty-four percent of firms offering health benefits offer at least one wellness program. Among large firms offering retiree health benefits, a large percentage report that some current workers would be eligible for health benefits when they retire.
H E A L T H I N S U R A N C E P R E M I U M S
In 2008, the average annual premiums for employer-sponsored health insurance are $4,704 for single coverage and $12,680 for family coverage, up about 5% from the 2007 average premiums.2 Since 1999, average premiums for family coverage have increased 119% (Exhibit A). Average premiums for family coverage are lower for workers in small firms (3–199 workers) than for workers in large firms (200 or more workers). Premiums are higher in self-funded plans than fully insured plans for single and family coverage. Average premiums for HDHP/SOs are lower than the overall average for all plan types for both single and family coverage (Exhibit B).
As a result of factors such as benefit differences and geographical location, there is significant variation around the average annual premium (Exhibit C). For family coverage averaging $12,680, 18% of covered workers are in plans with an annual total premium greater than 120% of the
average, and 20% of covered workers are in plans where premiums are less than 80% of the average.
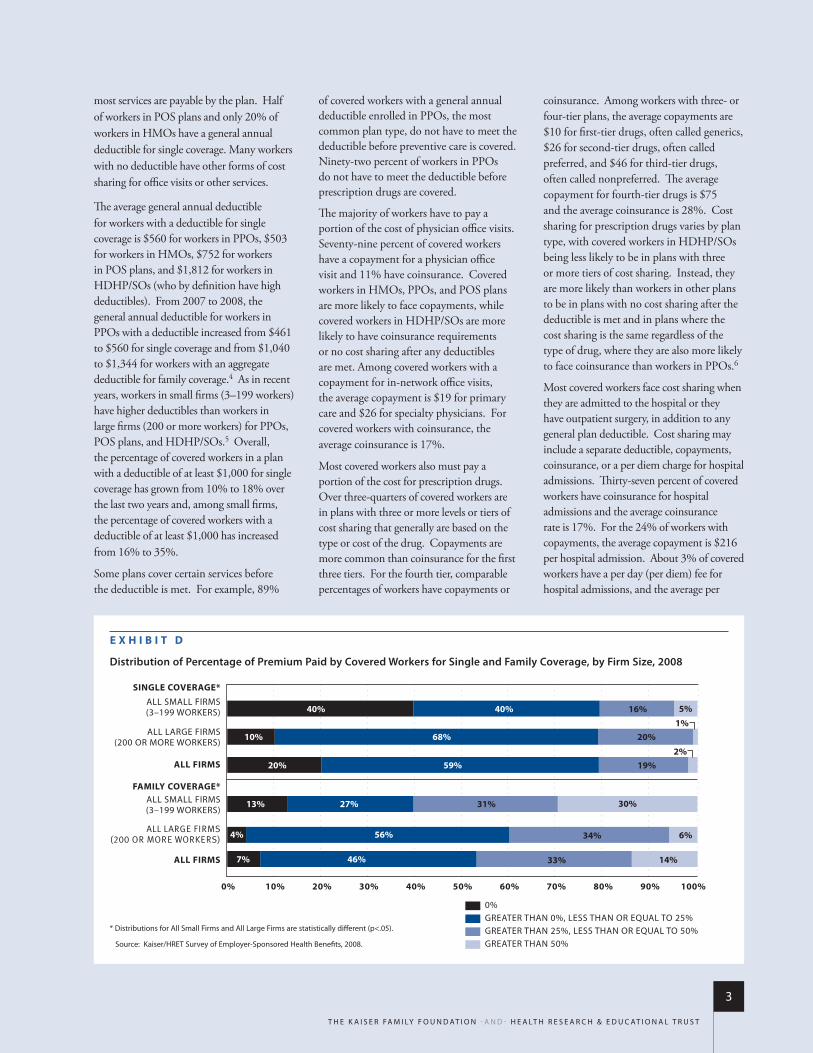
About 80% of workers with single coverage and 93% of workers with family coverage contribute to the total premium for their coverage (Exhibit D). The average annual worker contributions for single and family coverage are $721 and $3,354,3 respectively, which are not significantly different from the amounts reported in 2007. For single coverage, workers in small firms (3–199 workers) contribute less on average than workers in large firms (200 or more workers) ($624 vs. $769), but for family coverage, workers in small firms contribute significantly more than workers in large firms ($4,101 vs. $2,982). The average percentage of the premium paid by covered workers is 16% for single coverage and 27% for family coverage, similar to
the percentages reported for the last several years. For single coverage, over one-fifth of workers pay greater than 25% of the total premium while another fifth make no contribution. For family coverage, 47% pay greater than 25% of the total premium and only 7% have no contribution.
The majority (58%) of covered workers are enrolled in preferred provider organizations (PPOs). Health maintenance organizations (HMOs) cover 20%, followed by point-of-service (POS) plans (12%), HDHP/SOs (8%), and conventional plans (2%).
E M P L O Y E E C O S T S H A R I N G
In addition to any premium contributions they may have, most covered workers face additional payments when they use health care services. Most (68%) workers in PPO plans have a general annual deductible for single coverage that must be met before all or
S u m m a r y o f F i n d i n g s
EmployEr-sponsorEd insurancE is thE lEading sourcE of hEalth insurancE, covEring about 158 million nonEldErly
pEoplE in amErica.1 to providE currEnt information about thE naturE of EmployEr-sponsorEd hEalth bEnEfits,
thE KaisEr family foundation (KaisEr) and thE hEalth rEsEarch & Educational trust (hrEt) conduct an annual
national survEy of nonfEdEral privatE and public EmployErs with thrEE or morE worKErs.
EMPLOYER CONTRIBUTION WORKER CONTRIBUTION
20081999
$3,354
$9,325
$12,680
$1,543
$4,247
$5,791
119%Increase
117%Increase
E x h i b i t A
Average health insurance premiums and Worker Contributions for family Coverage, 1999–2008
note: the average worker contribution and the average employer contribution do not add to the average total premium due to rounding.
source: kaiser/hret survey of employer-sponsored health Benefits, 1999–2008.

2
t h e k a i s e r fa m i ly f o u n d at i o n - a n d - h e a lt h r e s e a r C h & e d u C at i o n a l t r u s t
E x h i b i t b
Average Annual firm and Worker premium Contributions and Total premiums for Covered Workers for single and family Coverage, by plan Type, 2008
$0 $2,000 $4,000 $6,000 $8,000 $10,000 $12,000 $14,000
SINGLEHMO
FAMILY
ALL PLANS
HDHP/SO
SINGLE
FAMILY
PPOSINGLE
FAMILY
POS
SINGLE
SINGLE
FAMILY
FAMILY
$705 $4,049 $4,754
$3,380 $13,122$9,742
$721 $3,983
$731
$865
$3,730
$3,783
$8,600
$4,071
$12,937
$12,330
$10,121*
$12,680
$3,922*
$3,354 $9,325
$3,344
$4,802
$4,647
$9,593
$468
$2,813
$3,454
$7,309
$4,704
WORKER CONTRIBUTION
EMPLOYER CONTRIBUTION* estimate of total Premium is statistically different from all Plans estimate by coverage type (p<.05).
source: kaiser/hret survey of employer-sponsored health Benefits, 2008.
Family Coverage
Single Coverage 22% 13% 20% 17% 10% 18%
20% 15% 16% 18% 12% 18%
$4,704
$12,680
LESS THAN 80% OF AVERAGE
80% TO LESS THAN 90% OF AVERAGE
90% TO LESS THAN AVERAGE
AVERAGE TO 110% OF AVERAGE
GREATER THAN 110% OF AVERAGE TO 120% OF AVERAGE
GREATER THAN 120% OF AVERAGE
>$5,645<$3,763
>$15,216<$10,144
E x h i b i t C
Distribution of premiums for single and family Coverage relative to the Average Annual single or family premium, 2008
source: kaiser/hret survey of employer-sponsored health Benefits, 2008.
t h e k a i s e r fa m i ly f o u n d at i o n - a n d - h e a lt h r e s e a r C h & e d u C at i o n a l t r u s t
3
most services are payable by the plan. Half of workers in POS plans and only 20% of workers in HMOs have a general annual deductible for single coverage. Many workers with no deductible have other forms of cost sharing for office visits or other services.
The average general annual deductible for workers with a deductible for single coverage is $560 for workers in PPOs, $503 for workers in HMOs, $752 for workers in POS plans, and $1,812 for workers in HDHP/SOs (who by definition have high deductibles). From 2007 to 2008, the general annual deductible for workers in PPOs with a deductible increased from $461 to $560 for single coverage and from $1,040 to $1,344 for workers with an aggregate deductible for family coverage.4 As in recent years, workers in small firms (3–199 workers) have higher deductibles than workers in large firms (200 or more workers) for PPOs, POS plans, and HDHP/SOs.5 Overall, the percentage of covered workers in a plan with a deductible of at least $1,000 for single coverage has grown from 10% to 18% over the last two years and, among small firms, the percentage of covered workers with a deductible of at least $1,000 has increased from 16% to 35%.
Some plans cover certain services before the deductible is met. For example, 89%
of covered workers with a general annual deductible enrolled in PPOs, the most common plan type, do not have to meet the deductible before preventive care is covered. Ninety-two percent of workers in PPOs do not have to meet the deductible before prescription drugs are covered.
The majority of workers have to pay a portion of the cost of physician office visits. Seventy-nine percent of covered workers have a copayment for a physician office visit and 11% have coinsurance. Covered workers in HMOs, PPOs, and POS plans are more likely to face copayments, while covered workers in HDHP/SOs are more likely to have coinsurance requirements or no cost sharing after any deductibles are met. Among covered workers with a copayment for in-network office visits, the average copayment is $19 for primary care and $26 for specialty physicians. For covered workers with coinsurance, the average coinsurance is 17%.
Most covered workers also must pay a portion of the cost for prescription drugs. Over three-quarters of covered workers are in plans with three or more levels or tiers of cost sharing that generally are based on the type or cost of the drug. Copayments are more common than coinsurance for the first three tiers. For the fourth tier, comparable percentages of workers have copayments or
coinsurance. Among workers with three- or four-tier plans, the average copayments are $10 for first-tier drugs, often called generics, $26 for second-tier drugs, often called preferred, and $46 for third-tier drugs, often called nonpreferred. The average copayment for fourth-tier drugs is $75 and the average coinsurance is 28%. Cost sharing for prescription drugs varies by plan type, with covered workers in HDHP/SOs being less likely to be in plans with three or more tiers of cost sharing. Instead, they are more likely than workers in other plans to be in plans with no cost sharing after the deductible is met and in plans where the cost sharing is the same regardless of the type of drug, where they are also more likely to face coinsurance than workers in PPOs.6
Most covered workers face cost sharing when they are admitted to the hospital or they have outpatient surgery, in addition to any general plan deductible. Cost sharing may include a separate deductible, copayments, coinsurance, or a per diem charge for hospital admissions. Thirty-seven percent of covered workers have coinsurance for hospital admissions and the average coinsurance rate is 17%. For the 24% of workers with copayments, the average copayment is $216 per hospital admission. About 3% of covered workers have a per day (per diem) fee for hospital admissions, and the average per
E x h i b i t D
Distribution of percentage of premium paid by Covered Workers for single and family Coverage, by firm size, 2008
* distributions for all small firms and all large firms are statistically different (p<.05).
source: kaiser/hret survey of employer-sponsored health Benefits, 2008.
0% 10% 20% 30% 40% 50% 60% 70% 80% 90% 100%
40% 40% 16% 5%
10% 68% 20%1%
SINGLE COVERAGE*
FAMILY COVERAGE*
ALL SMALL FIRMS(3–199 WORKERS)
ALL LARGE FIRMS(200 OR MORE WORKERS)
ALL FIRMS
ALL SMALL FIRMS(3–199 WORKERS)
ALL LARGE FIRMS(200 OR MORE WORKERS)
ALL FIRMS
20% 59% 19%2%
13% 27% 31% 30%
4% 56% 34% 6%
7% 46% 33% 14%
0%GREATER THAN 0%, LESS THAN OR EQUAL TO 25%GREATER THAN 25%, LESS THAN OR EQUAL TO 50%GREATER THAN 50%
4
t h e k a i s e r fa m i ly f o u n d at i o n - a n d - h e a lt h r e s e a r C h & e d u C at i o n a l t r u s t
diem charge is $193. Another 3% of covered workers have a separate annual hospital deductible, and the average separate annual hospital deductible is $401.7
While covered workers are responsible for a variety of forms of cost sharing, often there are limits to the amount of cost sharing workers must pay under their health plan each year, generally referred to as an out-of-pocket maximum. Eighty percent of covered workers with single coverage and 79% of covered workers with family coverage have an out-of-pocket maximum. However, it should be noted that some workers with no out-of-pocket maximum may have low cost sharing. For example, of the 44% of workers in HMOs with no out-of-pocket maximum for single coverage, 89% have no general annual deductible. Out-of-pocket maximums vary considerably; for example, among covered workers in plans that have an out-of-pocket maximum for single coverage, 23% are in plans with an annual out-of-pocket maximum of $3,000 or more, and 29% are in plans with an out-of-pocket maximum of less than $1,500. However, not all spending counts toward the out-of-pocket maximum. For example, among workers in PPOs with an out-of-pocket maximum, 77% are in plans that do not count office visit copayments and 33% are in plans that do not count spending for the general annual deductible when determining if an enrollee has reached the out-of-pocket limit.
A V A I L A B I L I T Y O F E M P L O Y E R -S P O N S O R E D C O V E R A G E
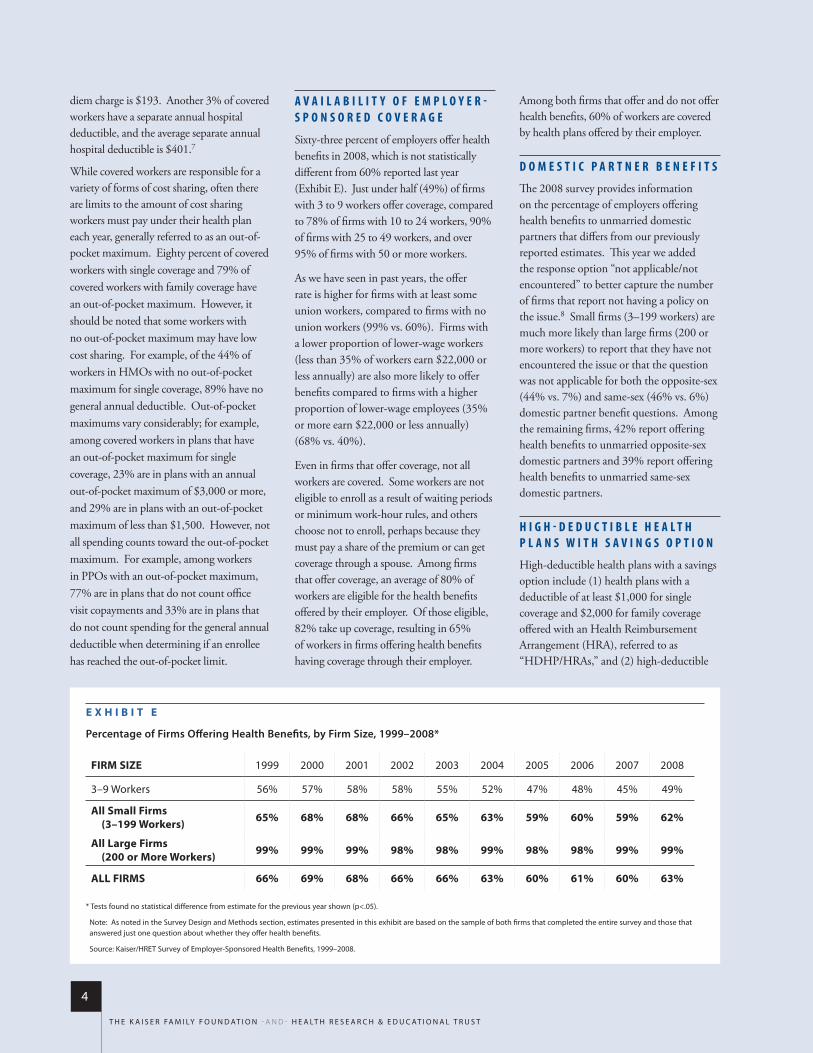
Sixty-three percent of employers offer health benefits in 2008, which is not statistically different from 60% reported last year (Exhibit E). Just under half (49%) of firms with 3 to 9 workers offer coverage, compared to 78% of firms with 10 to 24 workers, 90% of firms with 25 to 49 workers, and over 95% of firms with 50 or more workers.
As we have seen in past years, the offer rate is higher for firms with at least some union workers, compared to firms with no union workers (99% vs. 60%). Firms with a lower proportion of lower-wage workers (less than 35% of workers earn $22,000 or less annually) are also more likely to offer benefits compared to firms with a higher proportion of lower-wage employees (35% or more earn $22,000 or less annually) (68% vs. 40%).
Even in firms that offer coverage, not all workers are covered. Some workers are not eligible to enroll as a result of waiting periods or minimum work-hour rules, and others choose not to enroll, perhaps because they must pay a share of the premium or can get coverage through a spouse. Among firms that offer coverage, an average of 80% of workers are eligible for the health benefits offered by their employer. Of those eligible, 82% take up coverage, resulting in 65% of workers in firms offering health benefits having coverage through their employer.
Among both firms that offer and do not offer health benefits, 60% of workers are covered by health plans offered by their employer.
D O M E S T I C P A R T N E R B E N E F I T S
The 2008 survey provides information on the percentage of employers offering health benefits to unmarried domestic partners that differs from our previously reported estimates. This year we added the response option “not applicable/not encountered” to better capture the number of firms that report not having a policy on the issue.8 Small firms (3–199 workers) are much more likely than large firms (200 or more workers) to report that they have not encountered the issue or that the question was not applicable for both the opposite-sex (44% vs. 7%) and same-sex (46% vs. 6%) domestic partner benefit questions. Among the remaining firms, 42% report offering health benefits to unmarried opposite-sex domestic partners and 39% report offering health benefits to unmarried same-sex domestic partners.
H I G H - D E D U C T I B L E H E A L T H P L A N S W I T H S A V I N G S O P T I O N
High-deductible health plans with a savings option include (1) health plans with a deductible of at least $1,000 for single coverage and $2,000 for family coverage offered with an Health Reimbursement Arrangement (HRA), referred to as “HDHP/HRAs,” and (2) high-deductible
E x h i b i t E
percentage of firms offering health benefits, by firm size, 1999–2008*
* tests found no statistical difference from estimate for the previous year shown (p<.05).
note: as noted in the survey design and methods section, estimates presented in this exhibit are based on the sample of both firms that completed the entire survey and those that answered just one question about whether they offer health benefits.
source: kaiser/hret survey of employer-sponsored health Benefits, 1999–2008.
FiRM SiZE 1999 2000 2001 2002 2003 2004 2005 2006 2007 2008
3–9 Workers 56% 57% 58% 58% 55% 52% 47% 48% 45% 49%
All Small Firms (3–199 Workers) 65% 68% 68% 66% 65% 63% 59% 60% 59% 62%
All Large Firms (200 or More Workers) 99% 99% 99% 98% 98% 99% 98% 98% 99% 99%
ALL FiRMS 66% 69% 68% 66% 66% 63% 60% 61% 60% 63%
t h e k a i s e r fa m i ly f o u n d at i o n - a n d - h e a lt h r e s e a r C h & e d u C at i o n a l t r u s t
5
health plans that meet the federal legal requirements to permit an enrollee to establish and contribute to a Health Savings Account (HSA), referred to as “HSA-qualified HDHPs.”
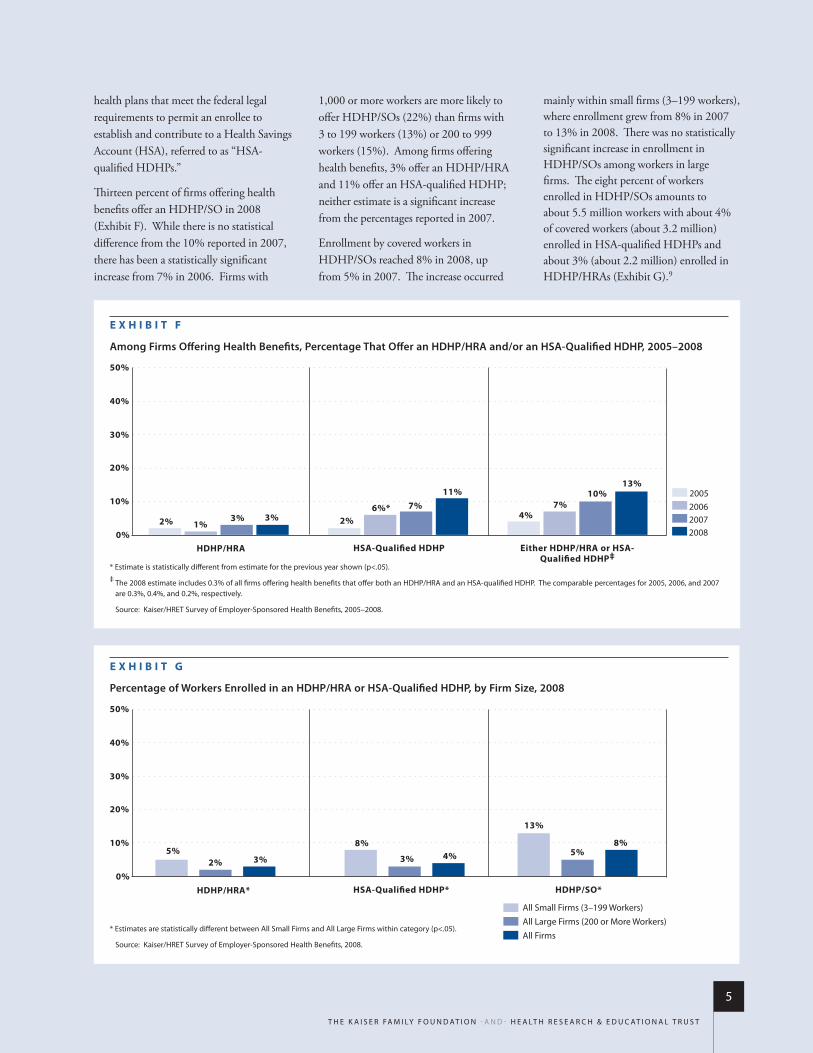
Thirteen percent of firms offering health benefits offer an HDHP/SO in 2008 (Exhibit F). While there is no statistical difference from the 10% reported in 2007, there has been a statistically significant increase from 7% in 2006. Firms with
1,000 or more workers are more likely to offer HDHP/SOs (22%) than firms with 3 to 199 workers (13%) or 200 to 999 workers (15%). Among firms offering health benefits, 3% offer an HDHP/HRA and 11% offer an HSA-qualified HDHP; neither estimate is a significant increase from the percentages reported in 2007.
Enrollment by covered workers in HDHP/SOs reached 8% in 2008, up from 5% in 2007. The increase occurred
mainly within small firms (3–199 workers), where enrollment grew from 8% in 2007 to 13% in 2008. There was no statistically significant increase in enrollment in HDHP/SOs among workers in large firms. The eight percent of workers enrolled in HDHP/SOs amounts to about 5.5 million workers with about 4% of covered workers (about 3.2 million) enrolled in HSA-qualified HDHPs and about 3% (about 2.2 million) enrolled in HDHP/HRAs (Exhibit G).9
E x h i b i t F
Among firms offering health benefits, percentage That offer an hDhp/hrA and/or an hsA-Qualified hDhp, 2005–2008
* estimate is statistically different from estimate for the previous year shown (p<.05).
‡ the 2008 estimate includes 0.3% of all firms offering health benefits that offer both an hdhP/hra and an hsa-qualified hdhP. the comparable percentages for 2005, 2006, and 2007 are 0.3%, 0.4%, and 0.2%, respectively.
source: kaiser/hret survey of employer-sponsored health Benefits, 2005–2008.
HDHP/HRA HSA-Qualified HDHP Either HDHP/HRA or HSA-Qualified HDHP‡
200520062007
0%
10%
20%
30%
40%
50%
20082% 1%
3% 3% 2%6%* 7%
11%
4%7%
10%13%
E x h i b i t G
percentage of Workers enrolled in an hDhp/hrA or hsA-Qualified hDhp, by firm size, 2008
0%
10%
20%
30%
40%
50%
HDHP/SO*HSA-Quali�ed HDHP*HDHP/HRA*
5%2% 3%
8%
3% 4%
13%
5%8%
All Small Firms (3–199 Workers)All Large Firms (200 or More Workers)All Firms
* estimates are statistically different between all small firms and all large firms within category (p<.05).
source: kaiser/hret survey of employer-sponsored health Benefits, 2008.
6
t h e k a i s e r fa m i ly f o u n d at i o n - a n d - h e a lt h r e s e a r C h & e d u C at i o n a l t r u s t
Annual deductibles for single coverage for HDHP/HRAs and HSA-qualified HDHPs average $1,552 and $2,010, respectively. However these deductibles vary considerably; for example, 33% of workers enrolled in an HSA-qualified HDHP for single coverage have a deductible between $1,100 and $1,499, while 11% have a deductible of $3,000 or more. The average aggregate annual deductible for family coverage for HDHP/HRAs is $3,057 and $3,911 for HSA-qualified HDHPs. Similar to the other plan types, many HDHP/SOs cover preventive services before the deductible is met: 97% of workers in HDHP/HRAs and 86% of workers in HSA-qualified HDHPs have preventive care covered before having to meet the deductible.
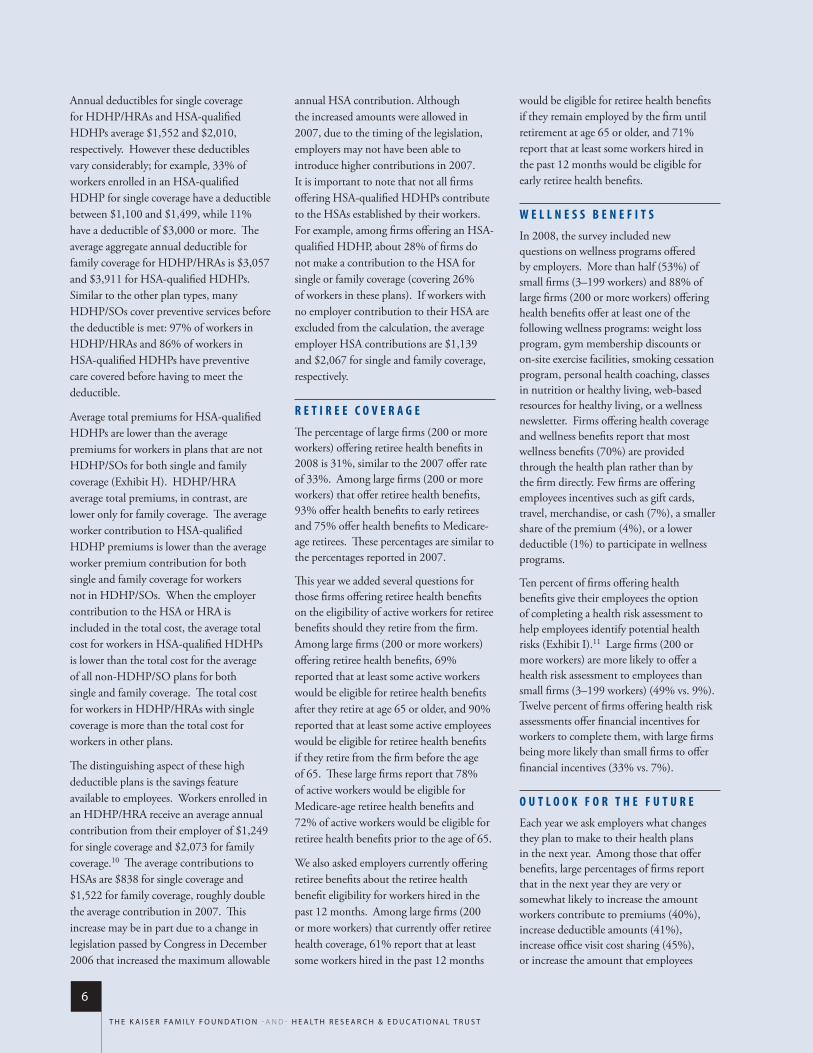
Average total premiums for HSA-qualified HDHPs are lower than the average premiums for workers in plans that are not HDHP/SOs for both single and family coverage (Exhibit H). HDHP/HRA average total premiums, in contrast, are lower only for family coverage. The average worker contribution to HSA-qualified HDHP premiums is lower than the average worker premium contribution for both single and family coverage for workers not in HDHP/SOs. When the employer contribution to the HSA or HRA is included in the total cost, the average total cost for workers in HSA-qualified HDHPs is lower than the total cost for the average of all non-HDHP/SO plans for both single and family coverage. The total cost for workers in HDHP/HRAs with single coverage is more than the total cost for workers in other plans.
The distinguishing aspect of these high deductible plans is the savings feature available to employees. Workers enrolled in an HDHP/HRA receive an average annual contribution from their employer of $1,249 for single coverage and $2,073 for family coverage.10 The average contributions to HSAs are $838 for single coverage and $1,522 for family coverage, roughly double the average contribution in 2007. This increase may be in part due to a change in legislation passed by Congress in December 2006 that increased the maximum allowable
annual HSA contribution. Although the increased amounts were allowed in 2007, due to the timing of the legislation, employers may not have been able to introduce higher contributions in 2007. It is important to note that not all firms offering HSA-qualified HDHPs contribute to the HSAs established by their workers. For example, among firms offering an HSA-qualified HDHP, about 28% of firms do not make a contribution to the HSA for single or family coverage (covering 26% of workers in these plans). If workers with no employer contribution to their HSA are excluded from the calculation, the average employer HSA contributions are $1,139 and $2,067 for single and family coverage, respectively.
R E T I R E E C O V E R A G E
The percentage of large firms (200 or more workers) offering retiree health benefits in 2008 is 31%, similar to the 2007 offer rate of 33%. Among large firms (200 or more workers) that offer retiree health benefits, 93% offer health benefits to early retirees and 75% offer health benefits to Medicare-age retirees. These percentages are similar to the percentages reported in 2007.
This year we added several questions for those firms offering retiree health benefits on the eligibility of active workers for retiree benefits should they retire from the firm. Among large firms (200 or more workers) offering retiree health benefits, 69% reported that at least some active workers would be eligible for retiree health benefits after they retire at age 65 or older, and 90% reported that at least some active employees would be eligible for retiree health benefits if they retire from the firm before the age of 65. These large firms report that 78% of active workers would be eligible for Medicare-age retiree health benefits and 72% of active workers would be eligible for retiree health benefits prior to the age of 65.
We also asked employers currently offering retiree benefits about the retiree health benefit eligibility for workers hired in the past 12 months. Among large firms (200 or more workers) that currently offer retiree health coverage, 61% report that at least some workers hired in the past 12 months
would be eligible for retiree health benefits if they remain employed by the firm until retirement at age 65 or older, and 71% report that at least some workers hired in the past 12 months would be eligible for early retiree health benefits.
W E L L N E S S B E N E F I T S
In 2008, the survey included new questions on wellness programs offered by employers. More than half (53%) of small firms (3–199 workers) and 88% of large firms (200 or more workers) offering health benefits offer at least one of the following wellness programs: weight loss program, gym membership discounts or on-site exercise facilities, smoking cessation program, personal health coaching, classes in nutrition or healthy living, web-based resources for healthy living, or a wellness newsletter. Firms offering health coverage and wellness benefits report that most wellness benefits (70%) are provided through the health plan rather than by the firm directly. Few firms are offering employees incentives such as gift cards, travel, merchandise, or cash (7%), a smaller share of the premium (4%), or a lower deductible (1%) to participate in wellness programs.
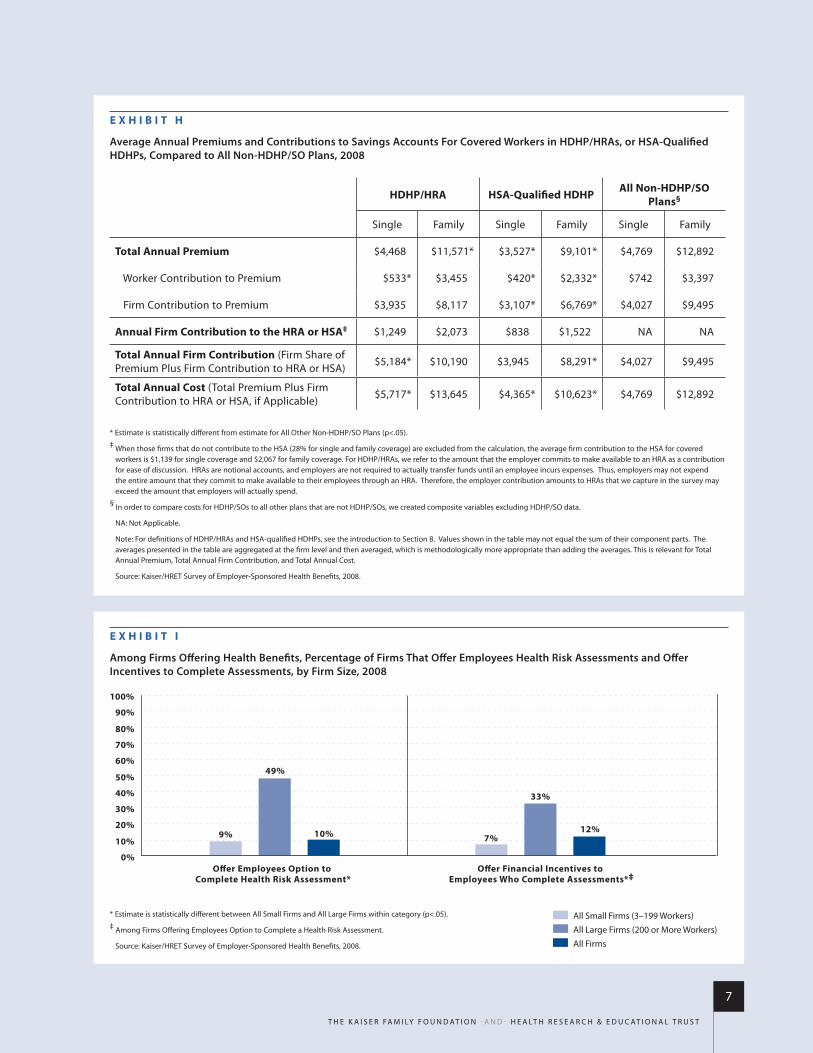
Ten percent of firms offering health benefits give their employees the option of completing a health risk assessment to help employees identify potential health risks (Exhibit I).11 Large firms (200 or more workers) are more likely to offer a health risk assessment to employees than small firms (3–199 workers) (49% vs. 9%). Twelve percent of firms offering health risk assessments offer financial incentives for workers to complete them, with large firms being more likely than small firms to offer financial incentives (33% vs. 7%).
O U T L O O K F O R T H E F U T U R E
Each year we ask employers what changes they plan to make to their health plans in the next year. Among those that offer benefits, large percentages of firms report that in the next year they are very or somewhat likely to increase the amount workers contribute to premiums (40%), increase deductible amounts (41%), increase office visit cost sharing (45%), or increase the amount that employees
t h e k a i s e r fa m i ly f o u n d at i o n - a n d - h e a lt h r e s e a r C h & e d u C at i o n a l t r u s t
7
0%
10%
20%
30%
40%
50%
60%
70%
80%
90%
100%
O�er Financial Incentives to Employees Who Complete Assessments*‡
O�er Employees Option to Complete Health Risk Assessment*
9%
49%
10% 7%
33%
12%
All Small Firms (3–199 Workers)All Large Firms (200 or More Workers)All Firms
E x h i b i t i
Among firms offering health benefits, percentage of firms That offer employees health risk Assessments and offer incentives to Complete Assessments, by firm size, 2008
* estimate is statistically different between all small firms and all large firms within category (p<.05).
‡ among firms offering employees option to Complete a health risk assessment.
source: kaiser/hret survey of employer-sponsored health Benefits, 2008.
E x h i b i t h
Average Annual premiums and Contributions to savings Accounts for Covered Workers in hDhp/hrAs, or hsA-Qualified hDhps, Compared to All Non-hDhp/so plans, 2008
* estimate is statistically different from estimate for all other non-hdhP/so Plans (p<.05).
‡ When those firms that do not contribute to the hsa (28% for single and family coverage) are excluded from the calculation, the average firm contribution to the hsa for covered workers is $1,139 for single coverage and $2,067 for family coverage. for hdhP/hras, we refer to the amount that the employer commits to make available to an hra as a contribution for ease of discussion. hras are notional accounts, and employers are not required to actually transfer funds until an employee incurs expenses. thus, employers may not expend the entire amount that they commit to make available to their employees through an hra. therefore, the employer contribution amounts to hras that we capture in the survey may exceed the amount that employers will actually spend.
§ in order to compare costs for hdhP/sos to all other plans that are not hdhP/sos, we created composite variables excluding hdhP/so data.
na: not applicable.
note: for definitions of hdhP/hras and hsa-qualified hdhPs, see the introduction to section 8. Values shown in the table may not equal the sum of their component parts. the averages presented in the table are aggregated at the firm level and then averaged, which is methodologically more appropriate than adding the averages. this is relevant for total annual Premium, total annual firm Contribution, and total annual Cost.
source: kaiser/hret survey of employer-sponsored health Benefits, 2008.
hDhP/hRA hSA-Qualified hDhP All Non-hDhP/SO Plans§
single family single family single family
total Annual Premium $4,468 $11,571* $3,527* $9,101* $4,769 $12,892
Worker Contribution to Premium $533* $3,455 $420* $2,332* $742 $3,397
firm Contribution to Premium $3,935 $8,117 $3,107* $6,769* $4,027 $9,495
Annual Firm Contribution to the hRA or hSA‡ $1,249 $2,073 $838 $1,522 na na
total Annual Firm Contribution (firm share of Premium Plus firm Contribution to hra or hsa) $5,184* $10,190 $3,945 $8,291* $4,027 $9,495
total Annual Cost (total Premium Plus firm Contribution to hra or hsa, if applicable) $5,717* $13,645 $4,365* $10,623* $4,769 $12,892

8
t h e k a i s e r fa m i ly f o u n d at i o n - a n d - h e a lt h r e s e a r C h & e d u C at i o n a l t r u s t
have to pay for prescription drugs (41%). Although firms report planning to increase the amount employees have to pay when they have insurance, few firms report they are very likely or somewhat likely to drop coverage (6%). One percent of firms offering coverage say that they are very likely to restrict eligibility for coverage next year, and an additional 12% say that they are somewhat likely to do so. About one in four firms offering health benefits but not offering an HSA-qualified HDHP say that they are very likely (4%) or somewhat likely
(21%) to do so. A similar share of offering firms not currently offering an HDHP/HRA report that they are very likely (5%) or somewhat likely (21%) to offer that plan type next year.
In 2008, the survey finds that premiums increased only moderately for both single and family coverage, and that most employees continue to have PPO coverage. The percentage of covered workers in HDHP/SOs rose, particularly among workers in small firms (3–199 workers), where 13% of covered workers are now
enrolled in these arrangements. The percentage of covered workers in larger firms enrolled in HDHP/SOs is much lower at 5%, similar to the percentage enrolled last year. Larger firms are more likely to offer HDHP/SOs, but their workers are less likely to be enrolled in them. Since a significant majority of covered workers are employed in large firms, tracking future enrollment within larger firms will be important to understanding the potential impact that these arrangements may have in the health care marketplace.
________________________________
1 kaiser family foundation, kaiser Commission on medicaid and the uninsured, Health Insurance Coverage in America, 2006 Data Update, october 2007.2 in 2007, the average annual premiums were $4,479 for single coverage and $12,106 for family coverage. 3 the average worker contributions include those workers with no contribution. 4 data presented are for workers with a family aggregate deductible where spending by any covered person in the family counts toward the deductible.5 for hmo coverage, there are insufficient data to report the result. 6 for hmos and Pos plans, there are insufficient data for the percentage of workers with coinsurance to make the comparison.7 in 2008, we changed the structure of the hospital and outpatient surgery cost-sharing questions. see the introduction to section 7 for more information, available at
http://www.kff.org/insurance/7790.8 in an effort to improve the quality of information collected, this question has undergone many changes in the past several years. see the introduction to section 2 for more information, available at
http://www.kff.org/insurance/7790.9 the percentage of workers enrolled in hdhP/hra or hsa-qualified hdhP do not add to the percentage of workers enrolled in hdhP/so due to rounding. these estimates include workers enrolled in the plans
offered by their employer and do not include any dependents that may be covered by the plan. the survey is based on a sample of non federal firms with 3 or more workers. 10 in 2007, some firms with hra contributions were inadvertently reduced to the 2007 annual limit for hsas. this affected 2 observations for single coverage (out of 91 total) and 3 observations for family coverage
(out of 88 total). removing the cap from these observations resulted in increased average hra contribution estimates for 2007. the average annual hra contribution for workers with single coverage increased from a reported $915 to a corrected $964, while family contributions increased from a reported $1,800 to a corrected $1,934. neither of these increases are statistically significant. using the corrected hra contribution estimates, there is no statistical difference between the 2007 and 2008 average hra contributions for single and family coverage.
11 health risk assessments generally include questions on medical history, health status, and lifestyle.

63%$12,6
80
$4,7
04
2008
Employer Health Benefits2 0 0 8 a n n u a l s u r V e y
Survey Design
and Methods
Employer Health Benefits 2 0 0 8 An n u a l s u r vey
10
t h e k a i s e r fa m i ly f o u n d at i o n - a n d - h e a lt h r e s e a r C h & e d u C at i o n a l t r u s t
Survey Design and M
ethods
S u r v e y D e S i g n a n D M e t h o D S
thE KaisEr family foundation and thE hEalth rEsEarch & Educational trust (KaisEr/hrEt) conduct
this annual sur vEy of EmployEr-sponsorEd hEalth bEnEfits. for many yEars thE intErnational
consulting and accounting firm Kpmg consulting, inc. (now bEaring point) supportEd thE study. in
1998, Kpmg divEstEd itsElf of its compEnsation and bEnEfits practicE, and part of that divEstiturE
includEd donating thE annual survEy of hEalth bEnEfits to hrEt. hrEt, a nonprofit rEsEarch
organization, is an affiliatE of thE amErican hospital association. thE KaisEr family foundation
dEsigns, analyzEs, and conducts this survEy in partnErship with hrEt, and also pays for thE cost of
thE survEy. hrEt subcontracts with rEsEarchErs at national opinion rEsEarch cEntEr (norc) at thE
univErsity of chicago, who worK with foundation and hrEt rEsEarchErs in conducting thE study.
KaisEr/hrEt rEtainEd national rEsEarch, llc (nr), a washington, d.c.-basEd survEy rEsEarch firm,
to conduct tElEphonE intErviEws with human rEsourcE and bEnEfits managErs using thE KaisEr/hrEt
survEy instrumEnt. from January to may 2008 nr complEtEd full intErviEws with 1,927 firms.
NR introduced a new CATI (Computer Assisted Telephone Interview) system at the end of 2007, and, due to several delays in the field, obtained fewer responses than expected. As a result, an incentive of $50 was offered during the final two and a half weeks the survey was in the field. Kaiser/HRET compared the distribution of key variables between firms receiving the incentive and firms not receiving the incentive to determine any potential bias. Chi-square test results were not significant, suggesting minimal to no bias.
s u r v e y T o p i C s
As in past years, Kaiser/HRET asked each participating firm as many as 400 questions about its largest health maintenance organization (HMO), preferred provider organization (PPO), point-of-service (POS) plan, and high-deductible health plan with a savings option (HDHP/SO).1 We continue to ask firms whether or not they offer a conventional health plan and, if so, how much their premium for conventional coverage increased in the last year. However, we do not ask respondents additional questions about the attributes of the conventional plans they offer. These
1 hdhP/so includes high-deductible health plans offered with either a health reimbursement arrangement (hra) or a health savings account (hsa). although hras can be offered along with a health plan that is not an hdhP, the survey collected information only on hras that are offered along with hdhPs. for specific definitions of hdhPs, hras, and hsas, see the introduction to section 8.
n o t E :
questions were eliminated in 2006 due to declining market share and to reduce survey burden. Because we have limited information about conventional health plans, we must make adjustments in calculating all plan averages or distributions. In cases where a firm offers only conventional health plans, no information from that respondent is included in all plan averages. The exception is for whether or not the plan is self-funded, for which we have information. If a firm offers a conventional health plan and at least one other plan type, for categorical variables we assign the values from the health plan with the largest enrollment (other than the conventional plan) to the workers in the conventional plan. In the case of continuous variables, covered workers in conventional plans are assigned the weighted average value of the other plan types in the firm.
In 2006, Kaiser/HRET began asking employers if they had a health plan that was an exclusive provider organization (EPO). We treat EPOs and HMOs together as one plan type and report the information under the banner of “HMO”; if an employer sponsors both an HMO and an EPO, they are asked about the attributes of the plan with the larger enrollment.

Employer Health Benefits 2 0 0 8 An n u a l s u r vey
11
t h e k a i s e r fa m i ly f o u n d at i o n - a n d - h e a lt h r e s e a r C h & e d u C at i o n a l t r u s t
Survey Design and M
ethods
New topics in the 2008 survey include additional questions on wellness programs and retiree health benefits, as well as on eligibility for dependent coverage for full-time students and COBRA enrollment. As in past years, this year’s survey included questions on the cost of health insurance, offer rates, coverage, eligibility, enrollment patterns, premiums,2 employee cost sharing, covered benefits, prescription drug benefits, retiree health benefits, and employer opinions. Throughout this report, we use the term “in-network” to refer to services received from a preferred provider. Family coverage is defined as health coverage for a family of four.
C h A N g e s T o 2 0 0 8 s u r v e y
Each year we examine ways to improve the survey and respond to changes in the health insurance market. Throughout the past, many changes have been made in an attempt to ensure the survey reflects current market trends, such as the introduction of questions on emerging plan types. We also reexamine the questions asked and the analytic methods used to determine if there are ways to better and more accurately convey the information obtained from respondents. For example, in 2003 we changed the basis for the post stratification to the U.S. Census in order to address concerns about the volatility of Dun and Bradstreet firm and industry counts.
This year we changed the method used to report the annual percentage premium increase. In prior years, the reported percentage was based on a series of questions that asked responding firms the percentage increase or decrease in premiums from the previous year to the current year for a family of four in the largest plan of each plan type (e.g., HMO, PPO). The reported premium increase was the average of the reported percentage changes (i.e., 6.1% for 2007) weighted by covered workers. This year, we calculate the overall percentage increase in premiums from year to year for family coverage using the average of the premium dollar amounts for a family of four in the largest plan of each plan type reported by respondents and weighted by covered workers (i.e., $12,106 for 2007 and $12,680 for 2008, an increase of 5%).
A principal advantage of using the premium dollar amounts to calculate the annual change in premiums is that we are better able to capture changes in the cost of health insurance for those firms that are newly in the
market or that change plan types, especially those that move to plans with very different premium levels. For example, in the first year that a firm offers a plan of a new plan type, such as a consumer-directed plan, the firm can report the level of the premium they paid, but using the previous method would be unable to report the rate of change from the previous year since the plan was not previously offered. If the premium for the new plan is relatively low compared to other premiums in the market, the relatively low premium amount that the firm reports will tend to lower the weighted average premium dollar amount reported in the survey, but the firm responses would not provide any information to the percentage premium increase question.
Another advantage of using premium dollar amounts to examine trends is that these data directly relate to the other findings in the survey and better address a principal public policy issue (i.e., what was the change in the cost of insurance over some past period). Many users noted, for example, that the percentage change calculated from the reported premium dollar amounts between two years did not directly match the reported average premium increase for the same period. There are several reasons why we would not expect these questions to produce identical results: 1) they are separate questions subject to varying degrees of reporting error, 2) firms could report a premium dollar amount for a plan type they might not have offered in the previous year, therefore, contributing information to one measure but not the other, or 3) firms could report a premium dollar amount for a plan that was not the largest plan of that type in the previous year. Although the two approaches have generated similar results in terms of the long-term growth rate of overall family premiums, there are greater discrepancies in trends for subgroups like small employers and self-funded firms. Focusing on the dollar amount changes over time will provide a more reliable and consistent measure of premium change that also is more sensitive to firms offering new plan options.
As we have in past years, this year we collected information on the cost-sharing provisions for hospital admissions and outpatient surgery that is in addition to any general annual plan deductible. However, for the 2008 survey, we changed the structure of the question and now include “separate annual deductible
2 hdhP/so premium estimates do not include contributions made by the employer to health savings accounts or health reimbursement arrangements.
n o t E :
Employer Health Benefits 2 0 0 8 An n u a l s u r vey
12
t h e k a i s e r fa m i ly f o u n d at i o n - a n d - h e a lt h r e s e a r C h & e d u C at i o n a l t r u s t
Survey Design and M
ethods
for hospital admissions” as a response option rather than collecting the information through a separate question. We continue to examine and sometimes modify the questions on hospital and outpatient surgery cost sharing because this can be a complex component of health benefit plans. For example, for some plans it is difficult to distinguish a separate hospital deductible from one categorized as a general annual deductible, where office visits and preventive care are covered and the deductible only applies to hospital use. Because this continues to be a point of confusion, we continue to refine the series of questions in order to clearly convey the information we are attempting to collect from respondents.
As in 2007, we asked firms if they offer health benefits to opposite-sex or same-sex domestic partners. However, this year, we changed the response options because during early tests of the 2008 survey, several firms noted that they had not encountered the issue yet, indicating that the responses of “yes,” “no,” and “don’t know” were insufficient. Therefore, this year we added the response option “not applicable/not encountered” to better capture the number of firms that report not having a policy on the issue.
Each year, the survey asks firms for the percentage of their employees that earn less than a specified amount. This year, the income threshold increased from $21,000 per year in 2007 to $22,000 per year. This threshold is based on the 25th percentile of workers’ earnings as reported by the Bureau of Labor Statistics using data from the National Compensation Survey (2006), the most current data available at the time of the survey design. The threshold is then adjusted to account for the change in workers’ earnings from 2006 to 2007.
r e s p o N s e r AT e
Kaiser/HRET drew its sample from a Survey Sampling Incorporated list (based on an original Dun and Bradstreet list) of the nation’s private and public employers with three or more workers. To increase precision, Kaiser/HRET stratified the sample by industry and the number of workers in the firm. Kaiser/HRET attempted to repeat interviews with prior years’ survey respondents (with at least ten employees) who also participated in 2006, 2007, or
both. As a result, 1,421 firms in this year’s total sample of 1,927 firms participated in either the 2006, 2007, or both surveys.3 The overall response rate is 48%.
The vast majority of questions are asked only of firms that offer health benefits. A total of 1,776 responding firms indicated that they offered health benefits. The overall response rate of firms that offer health benefits is 50%.
From previous years’ experience, we have learned that firms that decline to participate in the study are less likely to offer health benefits. Therefore, we asked one question of all firms in the study with which we made phone contact where the firm declined to participate. The question was, “Does your company offer or contribute to a health insurance program as a benefit to your employees?” A total of 2,832 firms responded to this question (including 1,927 who responded to the full survey and 905 who responded to this one question). Their responses are included in our estimates of the percentage of firms offering health benefits.4 The response rate for this question is 71%.
f i r m s i z e A N D i N D u s T r y D e f i N i T i o N s ,
r o u N D i N g , A N D i m p u TAT i o N
Throughout the report, exhibits categorize data by size of firm, region, and industry. Firm size definitions are as follows: All Small, 3 to 199 workers; and All Large, 200 or more workers. Occasionally, firm size categories will be broken into smaller groups. The All Small group may be categorized by: 3 to 24 workers, and 25 to 199 workers; or 3 to 9 workers, 10 to 24 workers, 25 to 49 workers, and 50 to 199 workers. The All Large group may be categorized by: 200 to 999 workers, 1,000 to 4,999 workers, and 5,000 or more workers. Exhibit M.1 shows selected characteristics of the survey sample. Exhibit M.3 identifies which states are in each region.
Exhibit M.2 displays the distribution of the nation’s firms, workers, and covered workers (employees receiving coverage from their employer). Among the over three million firms nationally, approximately 60.0% are firms employing 3 to 9 workers; such firms employ 8.5% of workers and 4.4% of covered workers. In contrast, less than one percent of firms are firms employing 5,000 or more workers; these firms employ 34.2% of workers and 36.5%
3 in total, 218 firms participated in 2006 and 2008, 356 firms participated in 2007 and 2008, and 858 firms participated in 2006, 2007, and 2008.
4 estimates presented in exhibits 2.1 and 2.2 are based on the sample of both firms that completed the entire survey and those that answered just one question about whether they offer health benefits.
n o t E :
Employer Health Benefits 2 0 0 8 An n u a l s u r vey
13
t h e k a i s e r fa m i ly f o u n d at i o n - a n d - h e a lt h r e s e a r C h & e d u C at i o n a l t r u s t
Survey Design and M
ethods
of covered workers. Therefore, the smallest firms dominate any national statistics about what employers in general are doing. In contrast, firms with 5,000 or more workers are the most important employer group in calculating statistics regarding covered workers, since they employ the largest percentage of the nation’s workforce.
Some exhibits in the report do not sum to totals due to rounding effects. In a few cases, numbers from distribution exhibits may not add to equal numbers referenced in the text due to rounding effects. Although overall totals and totals for size and industry are statistically valid, some breakdowns may not be available due to limited sample sizes. Where the unweighted sample size is fewer than 30, exhibits include the notation “NSD” (Not Sufficient Data).
To control for item nonresponse bias, Kaiser/HRET imputes values that are missing for most variables in the survey. In general, less than 5% of observations are imputed for any given variable. All variables are imputed following a hotdeck approach. This imputation method does not rely on a normal distribution assumption and replaces missing values with observed values from a firm with similar characteristics, in this case, size and industry. In 2008, there were four variables where the imputation rate exceeded 20% but was less than 30%. For these cases, the unimputed variable was compared with the imputed variable and there is no statistically significant difference. There are a few variables that Kaiser/HRET has decided should not be imputed; these are typically variables where “don’t know” is considered a valid response option (for example, firms’ opinions about effectiveness of various strategies to control health insurance costs).
W e i g h T i N g A N D s TAT i s T i C A l s i g N i f i C A N C e
Because Kaiser/HRET selects firms randomly, it is possible through the use of statistical weights to extrapolate the results to national (as well as firm size, regional, and industry) averages. These weights allow Kaiser/HRET to present findings based on the number of workers covered by health plans, the number of total workers, and the number of firms. In general, findings in dollar amounts (such as premiums, worker contributions, and cost sharing) are weighted
by covered workers. Other estimates, such as the offer rate, are weighted by firms. Specific weights were created to analyze the HDHP/SO plans that are offered with an HRA or that are HSA qualified. These weights represent the proportion of employees enrolled in each of these arrangements.
Calculation of the weights follows a common approach. First, the basic weight is determined, followed by a nonresponse adjustment. As part of this nonresponse adjustment, Kaiser/HRET conducted a small follow-up survey of those firms with 3 to 49 workers that refused to participate in the full survey. We applied an additional nonresponse adjustment to the weight to reflect the findings of this survey.
Next, we trimmed the weights in order to reduce the influence of weight outliers. First, we identified common groups of observations. Within each group, we identified the median and the interquartile range of the weights and calculated the trimming cut point as the median plus six times the interquartile range (M + [6 * IQR]). Weight values larger than this cut point are trimmed to the cut point. In all instances, less than one percent of the weight values were trimmed.
Finally, we applied a post-stratification adjustment. We used the U.S. Census Bureau’s 2005 Statistics of U.S. Businesses as the basis for the stratification and the post-stratification adjustment for firms in the private sector, and we used the 2002 Census of Governments as the basis for post-stratification for public sector firms.
The survey contains a few questions on employee cost sharing that are asked only of firms that indicate in a previous question that they have a certain cost-sharing provision. For example, the copayment amount for prescription drugs is asked only of those that report they have copayments for prescription drugs. Because the composite variables are reflective of only those plans with the provision, separate weights for the relevant variables were created in order to account for the fact that not all covered workers have such provisions.
The data are analyzed with SUDAAN,5 which computes appropriate standard error estimates by controlling for the complex design of the survey. All statistical tests are performed at the .05 level unless
5 research triangle institute (2005). sudaan software for the statistical analysis of Correlated data, release 9.0.1, research triangle Park, nC: research triangle institute.
n o t E :
Employer Health Benefits 2 0 0 8 An n u a l s u r vey
14
t h e k a i s e r fa m i ly f o u n d at i o n - a n d - h e a lt h r e s e a r C h & e d u C at i o n a l t r u s t
Survey Design and M
ethods
otherwise noted. For figures with multiple years, statistical tests are conducted for each year against the previous year shown, unless otherwise noted. No statistical tests are conducted for years prior to 1999.
Statistical tests for a given subgroup (firms with 25–49 workers, for instance) are tested against all other firm sizes not included in that subgroup (all firm sizes NOT including firms with 25–49 workers, in this example). Tests are done similarly for region and industry; for example, Northeast is compared to all firms NOT in the Northeast (an aggregate of firms in the Midwest, South, and West). However, statistical tests for estimates compared across plan types (for example, average premiums in PPOs) are tested against the “All Plans” estimate. In some cases, we also test plan-specific estimates against similar estimates for other plan types (for example, single and family premiums for HDHP/SOs against single and family premiums for HMO, PPO, and POS plans); these are noted specifically in the text. The two types of statistical tests performed are the t-test and the Pearson Chi-square test.
The small number of observations for some variables, particularly variables specific to plans with Health Savings Accounts or Health Reimbursement Arrangements, resulted in large variability around the point estimates. These observations sometimes carry large weights, primarily for small firms. The reader should be cautioned that these influential weights
may result in large movements in point estimates from year to year; however, often these movements are not statistically significant.
h i s T o r i C A l D ATA
Data in this report focus primarily on findings from surveys jointly authored by the Kaiser Family Foundation and the Health Research & Educational Trust, which have been conducted since 1999. Prior to 1999, the survey was conducted by the Health Insurance Association of America (HIAA) and KPMG using a similar survey instrument, but data are not available for all the intervening years. Following the survey’s introduction in 1987, the HIAA conducted the survey through 1990, but some data are not available for analysis. KPMG conducted the survey from 1991-1998. However, in 1991, 1992, 1994, and 1997, only larger firms were sampled. In 1993, 1995, 1996, and 1998, KPMG interviewed both large and small firms.
This report uses historical data from the 1993, 1996, and 1998 KPMG Surveys of Employer-Sponsored Health Benefits and the 1999-2008 Kaiser/HRET Survey of Employer-Sponsored Health Benefits. For a longer-term perspective, we also use the 1988 survey of the nation’s employers conducted by the HIAA, on which the KPMG and Kaiser/HRET surveys are based. The survey designs among the three surveys are also similar.

Survey Design and M
ethodsEmployer Health Benefits 2 0 0 8 An n u a l s u r vey
15
t h e k a i s e r fa m i ly f o u n d at i o n - a n d - h e a lt h r e s e a r C h & e d u C at i o n a l t r u s t
kaiser/hret survey of employer-sponsored health Benefits, 2008.
s o u r c E :
e x h i B i t m .1
selec ted Charac ter ist ics of fi rms in the sur vey sample, 2008
sample sizesample distribution
after WeightingPercentage of total
for Weighted sample
firm size
3–9 Workers 100 2,018,378 60.0%
10–24 Workers 190 777,250 23.1
25–49 Workers 161 276,451 8.2
50–199 Workers 284 206,337 6.1
200–999 Workers 450 59,196 1.8
1,000–4,999 Workers 446 16,776 0.5
5,000 or more Workers 296 8,086 0.2
All firm sizes 1,927 3,362,474 100%
regioNnortheast 386 662,024 19.7%midwest 566 785,610 23.4south 630 1,143,308 34.0West 345 771,532 22.9
All regioNs 1,927 3,362,474 100%
iNDusTryagriculture/mining/Construction 108 411,609 12.2%manufacturing 240 211,722 6.3transportation/Communications/utilities 95 127,510 3.8Wholesale 103 196,445 5.8retail 140 436,016 13.0finance 140 233,194 6.9service 741 1,444,767 43.0state/local Government 186 48,453 1.4health Care 174 252,758 7.5
All iNDusTries 1,927 3,362,474 100%
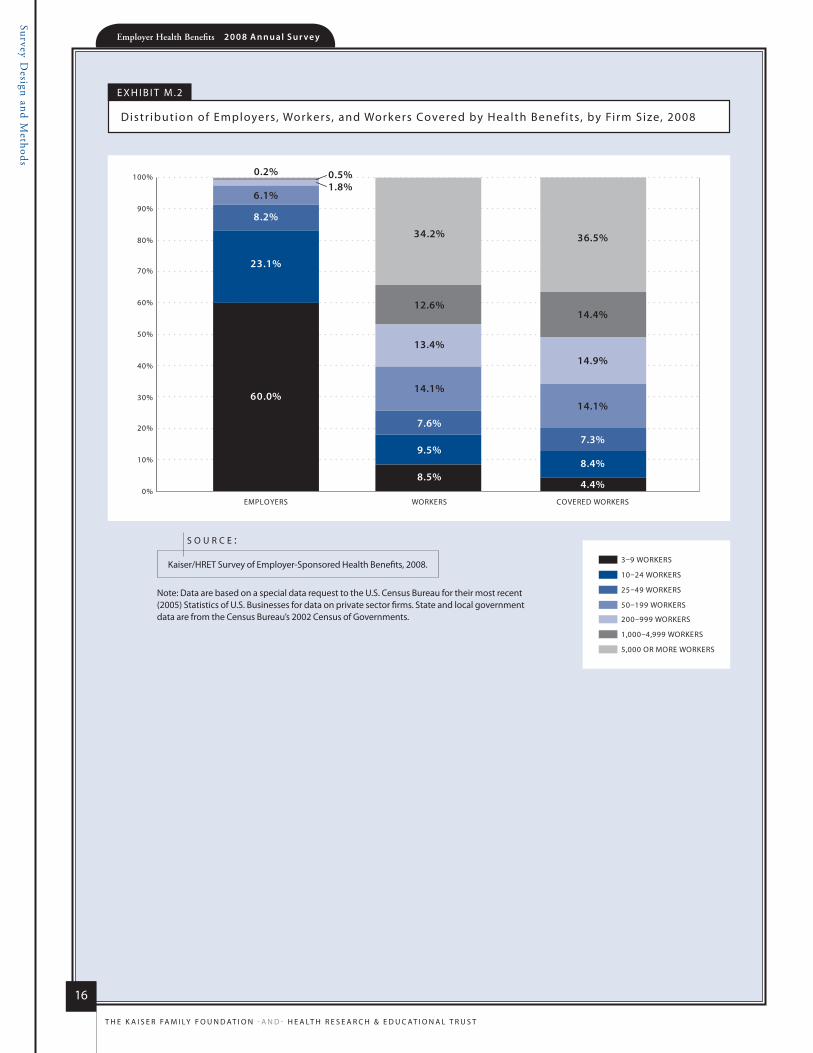
Survey Design and M
ethods
Employer Health Benefits 2 0 0 8 An n u a l s u r vey
16
t h e k a i s e r fa m i ly f o u n d at i o n - a n d - h e a lt h r e s e a r C h & e d u C at i o n a l t r u s t
e x h i B i t m .2
distr ibution of employers, Workers, and Workers Covered by health Benef its, by firm size, 2008
0%
10%
20%
30%
40%
50%
60%
70%
80%
90%
100%
EMPLOYERS WORKERS COVERED WORKERS
3–9 WORKERS
10–24 WORKERS
25–49 WORKERS
50–199 WORKERS
200–999 WORKERS
1,000–4,999 WORKERS
5,000 OR MORE WORKERS
60.0%
8.5%4.4%
8.2%
23.1%
7.6%
9.5%7.3%
8.4%
0.2% 0.5%
6.1%1.8%
34.2%
12.6%
13.4%
14.1%
36.5%
14.4%
14.9%
14.1%
note: data are based on a special data request to the u.s. Census Bureau for their most recent (2005) statistics of u.s. Businesses for data on private sector firms. state and local government data are from the Census Bureau’s 2002 Census of Governments.
kaiser/hret survey of employer-sponsored health Benefits, 2008.
s o u r c E :
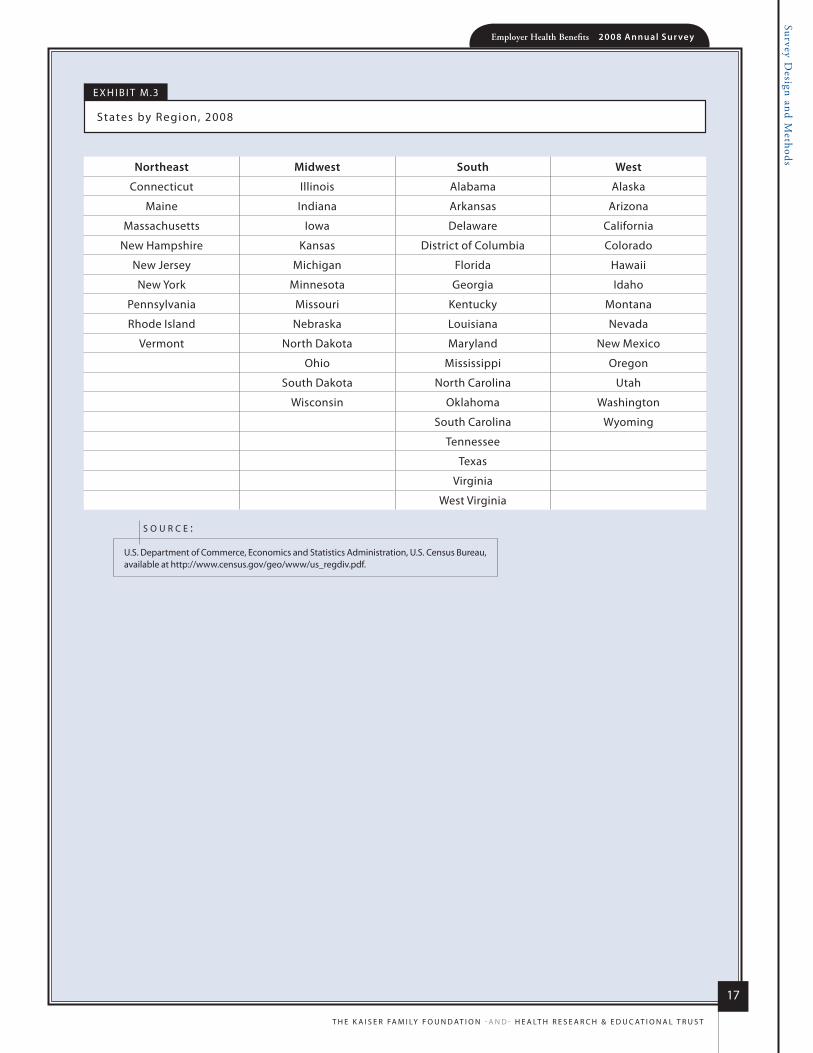
Survey Design and M
ethodsEmployer Health Benefits 2 0 0 8 An n u a l s u r vey
17
t h e k a i s e r fa m i ly f o u n d at i o n - a n d - h e a lt h r e s e a r C h & e d u C at i o n a l t r u s t
Northeast midwest south West
Connecticut illinois alabama alaska
maine indiana arkansas arizona
massachusetts iowa delaware California
new hampshire kansas district of Columbia Colorado
new Jersey michigan florida hawaii
new york minnesota Georgia idaho
Pennsylvania missouri kentucky montana
rhode island nebraska louisiana nevada
Vermont north dakota maryland new mexico
ohio mississippi oregon
south dakota north Carolina utah
Wisconsin oklahoma Washington
south Carolina Wyoming
tennessee
texas
Virginia
West Virginia
e x h i B i t m .3
states by region, 2008
u.s. department of Commerce, economics and statistics administration, u.s. Census Bureau, available at http://www.census.gov/geo/www/us_regdiv.pdf.
s o u r c E :
63%$12,6
80
$4,7
04
2008
Employer Health Benefits2 0 0 8 a n n u a l s u r V e y
s ect ion
Cost of Health
Insurance
1
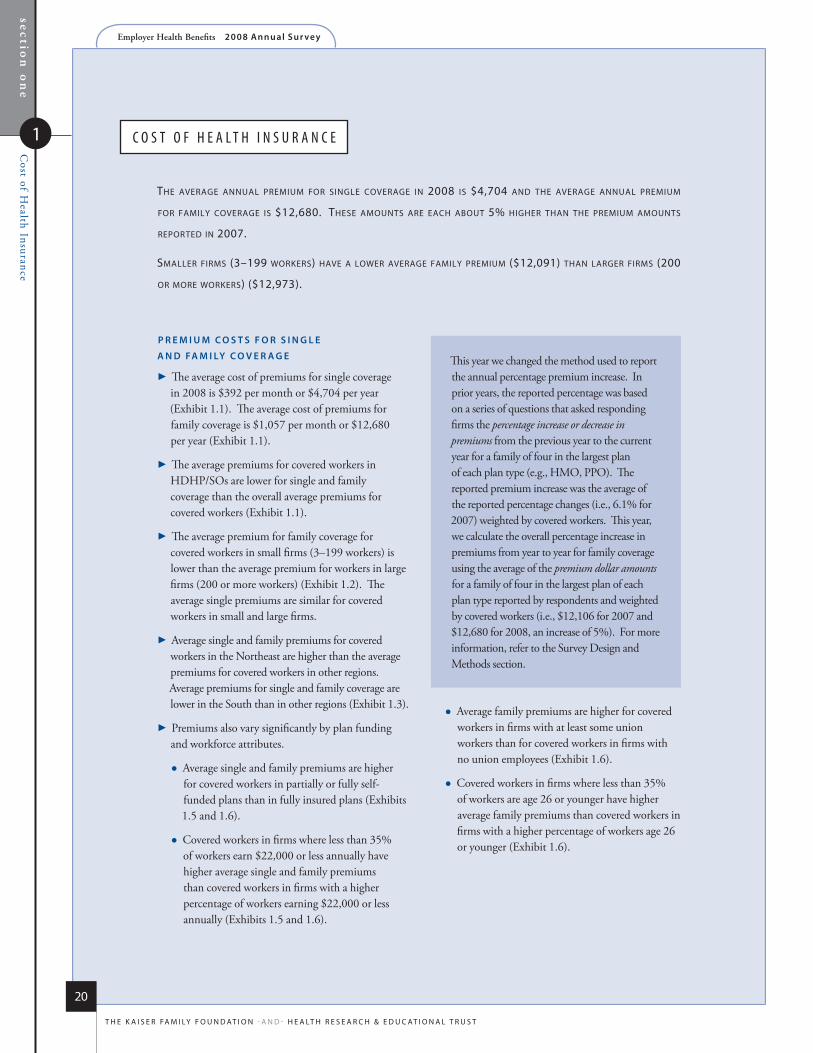
section
on
eC
ost of Health Insurance
1
Employer Health Benefits 2 0 0 8 An n u a l s u r vey
20
t h e k a i s e r fa m i ly f o u n d at i o n - a n d - h e a lt h r e s e a r C h & e d u C at i o n a l t r u s t
C o S t o f h e a l t h i n S u r a n C e
The average annual premium for single coverage in 2008 is $4,704 and The average annual premium
for family coverage is $12,680. These amounTs are each abouT 5% higher Than The premium amounTs
reporTed in 2007.
smaller firms (3–199 workers) have a lower average family premium ($12,091) Than larger firms (200
or more workers) ($12,973).
p r e m i u m C o s T s f o r s i N g l e
A N D fA m i ly C o v e r A g e
�The average cost of premiums for single coverage in 2008 is $392 per month or $4,704 per year (Exhibit 1.1). The average cost of premiums for family coverage is $1,057 per month or $12,680 per year (Exhibit 1.1).
�The average premiums for covered workers in HDHP/SOs are lower for single and family coverage than the overall average premiums for covered workers (Exhibit 1.1).
�The average premium for family coverage for covered workers in small firms (3–199 workers) is lower than the average premium for workers in large firms (200 or more workers) (Exhibit 1.2). The average single premiums are similar for covered workers in small and large firms.
�Average single and family premiums for covered workers in the Northeast are higher than the average premiums for covered workers in other regions. Average premiums for single and family coverage are lower in the South than in other regions (Exhibit 1.3).
�Premiums also vary significantly by plan funding and workforce attributes.
Average single and family premiums are higher for covered workers in partially or fully self-funded plans than in fully insured plans (Exhibits 1.5 and 1.6).
Covered workers in firms where less than 35% of workers earn $22,000 or less annually have higher average single and family premiums than covered workers in firms with a higher percentage of workers earning $22,000 or less annually (Exhibits 1.5 and 1.6).
Average family premiums are higher for covered workers in firms with at least some union workers than for covered workers in firms with no union employees (Exhibit 1.6).
Covered workers in firms where less than 35% of workers are age 26 or younger have higher average family premiums than covered workers in firms with a higher percentage of workers age 26 or younger (Exhibit 1.6).
This year we changed the method used to report the annual percentage premium increase. In prior years, the reported percentage was based on a series of questions that asked responding firms the percentage increase or decrease in premiums from the previous year to the current year for a family of four in the largest plan of each plan type (e.g., HMO, PPO). The reported premium increase was the average of the reported percentage changes (i.e., 6.1% for 2007) weighted by covered workers. This year, we calculate the overall percentage increase in premiums from year to year for family coverage using the average of the premium dollar amounts for a family of four in the largest plan of each plan type reported by respondents and weighted by covered workers (i.e., $12,106 for 2007 and $12,680 for 2008, an increase of 5%). For more information, refer to the Survey Design and Methods section.
section
on
e
1
Cost of H
ealth InsuranceEmployer Health Benefits 2 0 0 8 An n u a l s u r vey
21
t h e k a i s e r fa m i ly f o u n d at i o n - a n d - h e a lt h r e s e a r C h & e d u C at i o n a l t r u s t
1 the differences between the 2007 and 2008 premium values for both single and family coverage are significant (p <.05).
n o T e :
�There is a great deal of variation in premiums across workers and firms for both single and family coverage.
Eighteen percent of covered workers are employed in firms that have a single premium that is more than 20% higher than the average single premium of $4,704, and another 22% of covered workers are in firms that have a single premium that is more than 20% less than the average single premium (Exhibit 1.7).
For family coverage, 18% of covered workers are employed in a firm that have a family premium that is more than 20% higher than the average family premium of $12,680, and another 20% of covered workers are in firms that have a family premium that is more than 20% less than the average family premium (Exhibit 1.7).
�Firms offering a plan that they did not offer last year report significantly lower premiums on average for several plan types than firms that report offering the same plan last year.
The survey asks employers to provide information about their largest plan of each plan type (i.e., HMO, PPO, POS, HDHP/SO) that they offer. This year we asked employers to tell us whether the plans that they were reporting on were also offered last year. We do not know whether this was their largest plan of that plan type last year, and we also do not know if they modified the benefits within the plan between last year and this year.
Employers that did not offer the same plan last year reported lower single and family premiums on average for HMO and PPO coverage and lower family premiums on average for HDHP/SOs (Exhibit 1.8). In several cases these differences are
quite large. It appears that employers moving to new plans or newly offering coverage are choosing plans with premiums meaningfully below the market average. This is an area that may warrant additional attention in future surveys.
p r e m i u m C h A N g e s o v e r T i m e
�The average single and family premiums in 2008 ($4,704 and $12,680) are about 5% higher than the average single and family premiums we reported last year ($4,479 and $12,106).1
The $12,680 average annual family premium in 2008 is 27% higher than the average family premium in 2004 and 119% higher than the average family premium in 1999 (Exhibit 1.9).
�Although the 2008 average annual family premium for covered workers in small firms (3-199 workers) is significantly lower than the average annual family premium for covered workers in large firms (200 or more workers), the average family premiums for covered workers in small and large firms have been similar in most other years (Exhibit 1.10).
The average family premiums for covered workers in small and large firms have grown at similar rates since 2004 (24% in small firms vs. 29% in large firms) and since 1999 (113% in small firms vs. 122% in large firms) (Exhibit 1.11).
�The average family premium for covered workers in firms that fully or partially self-fund has risen faster than the average premium for covered workers in fully insured firms since 2004 (31% in self-funded firms vs. 23% in fully insured firms). Since 1999, family premiums have grown at similar rates for covered workers in fully or partially self-funded firms and in insured firms (121% in self-funded firms vs. 115% in fully insured firms) (Exhibit 1.12).

section
on
eC
ost of Health Insurance
1
Employer Health Benefits 2 0 0 8 An n u a l s u r vey
22
t h e k a i s e r fa m i ly f o u n d at i o n - a n d - h e a lt h r e s e a r C h & e d u C at i o n a l t r u s t
monthly annual
hmo
single Coverage $396 $4,754
family Coverage $1,093 $13,122
pposingle Coverage $400 $4,802family Coverage $1,078 $12,937
possingle Coverage $387 $4,647family Coverage $1,028 $12,330
hDhp/so
single Coverage $327* $3,922*
family Coverage $843* $10,121*
All plAN Types
single Coverage $392 $4,704family Coverage $1,057 $12,680
e x h i B i t 1 .1
average monthly and annual Premiums for Covered Workers, s ingle and family Coverage, by Plan type, 2008
* estimate is statistically different from all Plans estimate (p<.05).
kaiser/hret survey of employer-sponsored health Benefits, 2008.
s o u r c e :

section
on
e
1
Cost of H
ealth InsuranceEmployer Health Benefits 2 0 0 8 An n u a l s u r vey
23
t h e k a i s e r fa m i ly f o u n d at i o n - a n d - h e a lt h r e s e a r C h & e d u C at i o n a l t r u s t
e x h i B i t 1 .2
average monthly and annual Premiums for Covered Workers, by Plan type and firm size, 2008
monthly annual
single Coverage family Coverage single Coverage family Coverage
hmo
all small firms (3–199 Workers) $381 $1,086 $4,570 $13,031
all large firms (200 or more Workers) 404 1,097 4,847 13,167
All firm sizes $396 $1,093 $4,754 $13,122
ppo
all small firms (3–199 Workers) $402 $1,042 $4,826 $12,508
all large firms (200 or more Workers) 399 1,091 4,793 13,096
All firm sizes $400 $1,078 $4,802 $12,937
pos all small firms (3–199 Workers) $372 $972 $4,469 $11,662 all large firms (200 or more Workers) 402 1,081 4,819 12,969
All firm sizes $387 $1,028 $4,647 $12,330
hDhp/so
all small firms (3–199 Workers) $326 $816 $3,915 $9,794
all large firms (200 or more Workers) 328 882 3,932 10,588 All firm sizes $327 $843 $3,922 $10,121
All plANsall small firms (3–199 Workers) $382 $1,008* $4,586 $12,091*all large firms (200 or more Workers) 397 1,081* 4,763 12,973*
All firm sizes $392 $1,057 $4,704 $12,680
* estimates are statistically different within plan type between all small firms and all large firms (p<.05).
kaiser/hret survey of employer-sponsored health Benefits, 2008.
s o u r c e :

section
on
eC
ost of Health Insurance
1
Employer Health Benefits 2 0 0 8 An n u a l s u r vey
24
t h e k a i s e r fa m i ly f o u n d at i o n - a n d - h e a lt h r e s e a r C h & e d u C at i o n a l t r u s t
e x h i B i t 1 .3
average monthly and annual Premiums for Covered Workers, by Plan type and region, 2008
monthly annual
single Coverage family Coverage single Coverage family Coverage
hmo
northeast $434* $1,175 $5,206* $14,097
midwest 402 1,059 4,822 12,708
south 389 1,098 4,668 13,171
West 369* 1,036 4,427* 12,427
All regioNs $396 $1,093 $4,754 $13,122
pponortheast $419 $1,145* $5,033 $13,740*midwest 402 1,105 4,824 13,255south 383* 1,026* 4,590* 12,311*West 416 1,083 4,995 13,002
All regioNs $400 $1,078 $4,802 $12,937
pos northeast $427* $1,113 $5,125* $13,355midwest 389 1,014 4,666 12,162south 356* 991 4,274* 11,896West 394 1,007 4,729 12,089
All regioNs $387 $1,028 $4,647 $12,330
hDhp/so
northeast $326 $870 $3,909 $10,441
midwest 326 869 3,910 10,425
south 322 859 3,868 10,306
West 333 797 3,996 9,562All regioNs $327 $843 $3,922 $10,121
All plANsnortheast $421* $1,138* $5,052* $13,656*midwest 394 1,067 4,723 12,809south 376* 1,021* 4,509* 12,252*West 390 1,029 4,683 12,351
All regioNs $392 $1,057 $4,704 $12,680
* estimate is statistically different within plan type from estimate for all firms not in the indicated region (p<.05).
kaiser/hret survey of employer-sponsored health Benefits, 2008.
s o u r c e :

section
on
e
1
Cost of H
ealth InsuranceEmployer Health Benefits 2 0 0 8 An n u a l s u r vey
25
t h e k a i s e r fa m i ly f o u n d at i o n - a n d - h e a lt h r e s e a r C h & e d u C at i o n a l t r u s t
e x h i B i t 1 .4
average monthly and annual Premiums for Covered Workers, by Plan type and industr y, 2008
monthly annual
single Coverage family Coverage single Coverage family Coverage
hmoagriculture/mining/Construction nsd nsd nsd nsdmanufacturing $374 $1,047 $4,490 $12,559transportation/Communications/ utilities
nsd nsd nsd nsd
Wholesale nsd nsd nsd nsdretail 381 1,041 4,576 12,494finance 390 1,073 4,679 12,873service 393 1,122 4,713 13,469state/local Government 419 1,086 5,031 13,034health Care 403 1,105 4,841 13,256
All iNDusTries $396 $1,093 $4,754 $13,122
ppoagriculture/mining/Construction $342* $998 $4,100* $11,978manufacturing 375* 1,045 4,501* 12,543transportation/Communications/ utilities
392 1,051 4,705 12,608
Wholesale 383 1,130 4,600 13,560retail 359* 1,002* 4,311* 12,030*finance 424 1,158* 5,088 13,893*service 408 1,104 4,897 13,249state/local Government 462* 1,070 5,547* 12,843health Care 430* 1,108 5,161* 13,296
All iNDusTries $400 $1,078 $4,802 $12,937
pos agriculture/mining/Construction nsd nsd nsd nsdmanufacturing $385 $943 $4,626 $11,315transportation/Communications/ utilities
nsd nsd nsd nsd
Wholesale nsd nsd nsd nsdretail nsd nsd nsd nsdfinance 462* 1,109 5,543* 13,302service 370 1,020 4,437 12,241state/local Government 510* 1,239* 6,122* 14,870*health Care nsd nsd nsd nsd
All iNDusTries $387 $1,028 $4,647 $12,330
Continued on next page
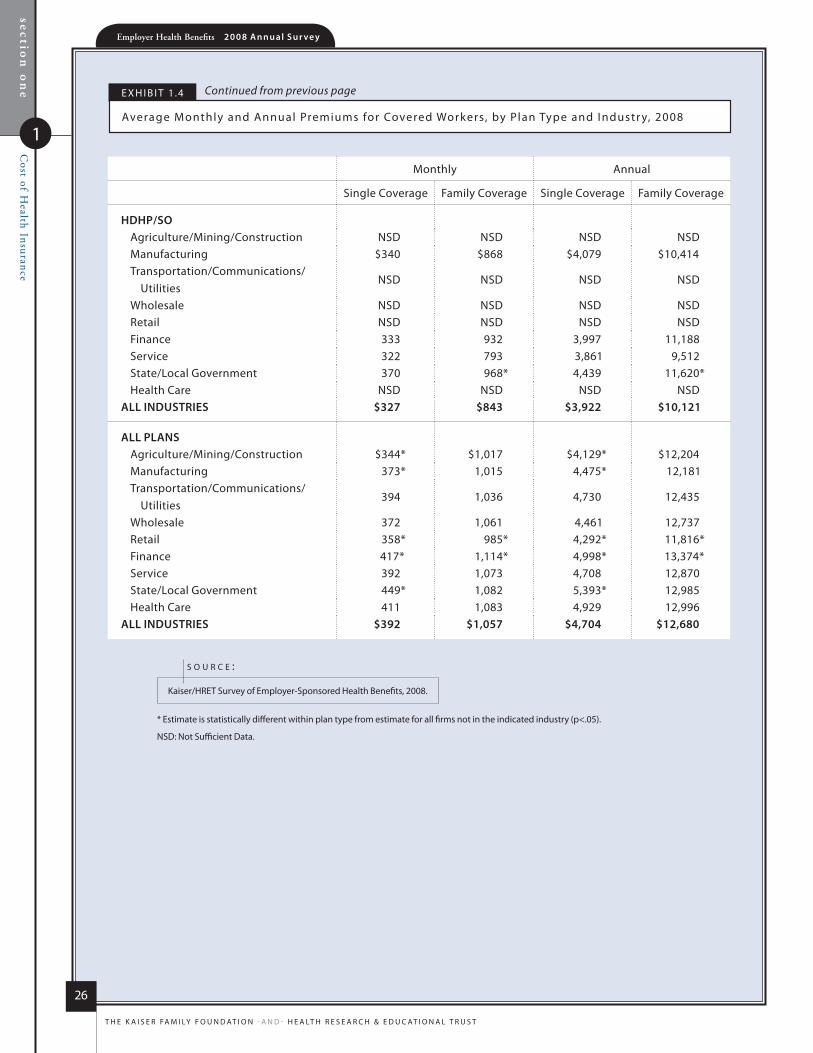
section
on
eC
ost of Health Insurance
1
Employer Health Benefits 2 0 0 8 An n u a l s u r vey
26
t h e k a i s e r fa m i ly f o u n d at i o n - a n d - h e a lt h r e s e a r C h & e d u C at i o n a l t r u s t
e x h i B i t 1 .4
average monthly and annual Premiums for Covered Workers, by Plan type and industr y, 2008
monthly annual
single Coverage family Coverage single Coverage family Coverage
hDhp/soagriculture/mining/Construction nsd nsd nsd nsdmanufacturing $340 $868 $4,079 $10,414transportation/Communications/ utilities
nsd nsd nsd nsd
Wholesale nsd nsd nsd nsdretail nsd nsd nsd nsdfinance 333 932 3,997 11,188service 322 793 3,861 9,512state/local Government 370 968* 4,439 11,620*health Care nsd nsd nsd nsd
All iNDusTries $327 $843 $3,922 $10,121
All plANsagriculture/mining/Construction $344* $1,017 $4,129* $12,204manufacturing 373* 1,015 4,475* 12,181transportation/Communications/ utilities
394 1,036 4,730 12,435
Wholesale 372 1,061 4,461 12,737retail 358* 985* 4,292* 11,816*finance 417* 1,114* 4,998* 13,374*service 392 1,073 4,708 12,870state/local Government 449* 1,082 5,393* 12,985health Care 411 1,083 4,929 12,996
All iNDusTries $392 $1,057 $4,704 $12,680
* estimate is statistically different within plan type from estimate for all firms not in the indicated industry (p<.05).
nsd: not sufficient data.
kaiser/hret survey of employer-sponsored health Benefits, 2008.
s o u r c e :
Continued from previous page
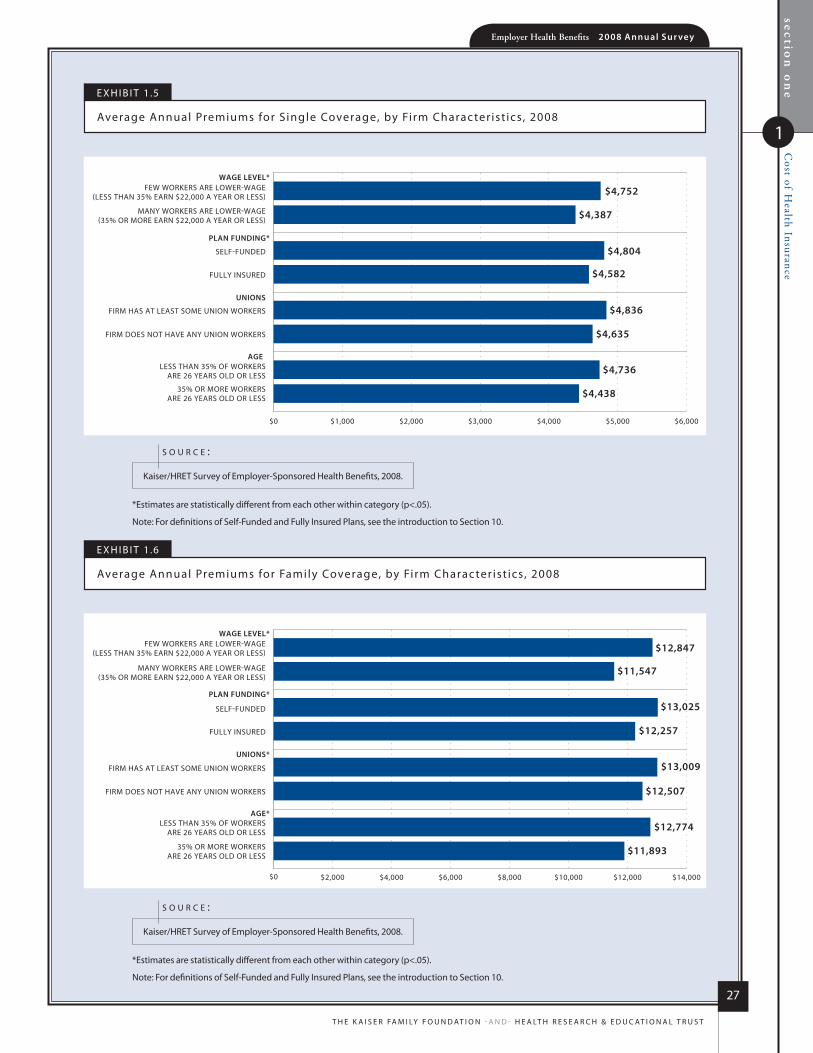
section
on
e
1
Cost of H
ealth InsuranceEmployer Health Benefits 2 0 0 8 An n u a l s u r vey
27
t h e k a i s e r fa m i ly f o u n d at i o n - a n d - h e a lt h r e s e a r C h & e d u C at i o n a l t r u s t
e x h i B i t 1 .5
average annual Premiums for s ingle Coverage, by firm Charac ter ist ics, 2008
*estimates are statistically different from each other within category (p<.05).
note: for definitions of self-funded and fully insured Plans, see the introduction to section 10.
kaiser/hret survey of employer-sponsored health Benefits, 2008.
s o u r c e :
FIRM DOES NOT HAVE ANY UNION WORKERS
FIRM HAS AT LEAST SOME UNION WORKERS
FEW WORKERS ARE LOWER-WAGE(LESS THAN 35% EARN $22,000 A YEAR OR LESS)
MANY WORKERS ARE LOWER-WAGE(35% OR MORE EARN $22,000 A YEAR OR LESS)
SELF-FUNDED
FULLY INSURED
WAGE LEVEL*
PLAN FUNDING*
UNIONS
35% OR MORE WORKERS ARE 26 YEARS OLD OR LESS
LESS THAN 35% OF WORKERS ARE 26 YEARS OLD OR LESS
AGE
$0 $1,000 $2,000 $3,000 $4,000 $5,000 $6,000
$4,635
$4,736
$4,438
$4,836
$4,582
$4,804
$4,387
$4,752
e x h i B i t 1 .6
average annual Premiums for family Coverage, by firm Charac ter ist ics, 2008
*estimates are statistically different from each other within category (p<.05).
note: for definitions of self-funded and fully insured Plans, see the introduction to section 10.
kaiser/hret survey of employer-sponsored health Benefits, 2008.
s o u r c e :
FIRM DOES NOT HAVE ANY UNION WORKERS
FIRM HAS AT LEAST SOME UNION WORKERS
FEW WORKERS ARE LOWER-WAGE(LESS THAN 35% EARN $22,000 A YEAR OR LESS)
MANY WORKERS ARE LOWER-WAGE(35% OR MORE EARN $22,000 A YEAR OR LESS)
SELF-FUNDED
FULLY INSURED
WAGE LEVEL*
PLAN FUNDING*
UNIONS*
35% OR MORE WORKERS ARE 26 YEARS OLD OR LESS
LESS THAN 35% OF WORKERS ARE 26 YEARS OLD OR LESS
AGE*
$0 $2,000 $4,000 $6,000 $8,000 $10,000 $12,000 $14,000
$12,507
$12,774
$11,893
$13,009
$12,257
$13,025
$11,547
$12,847
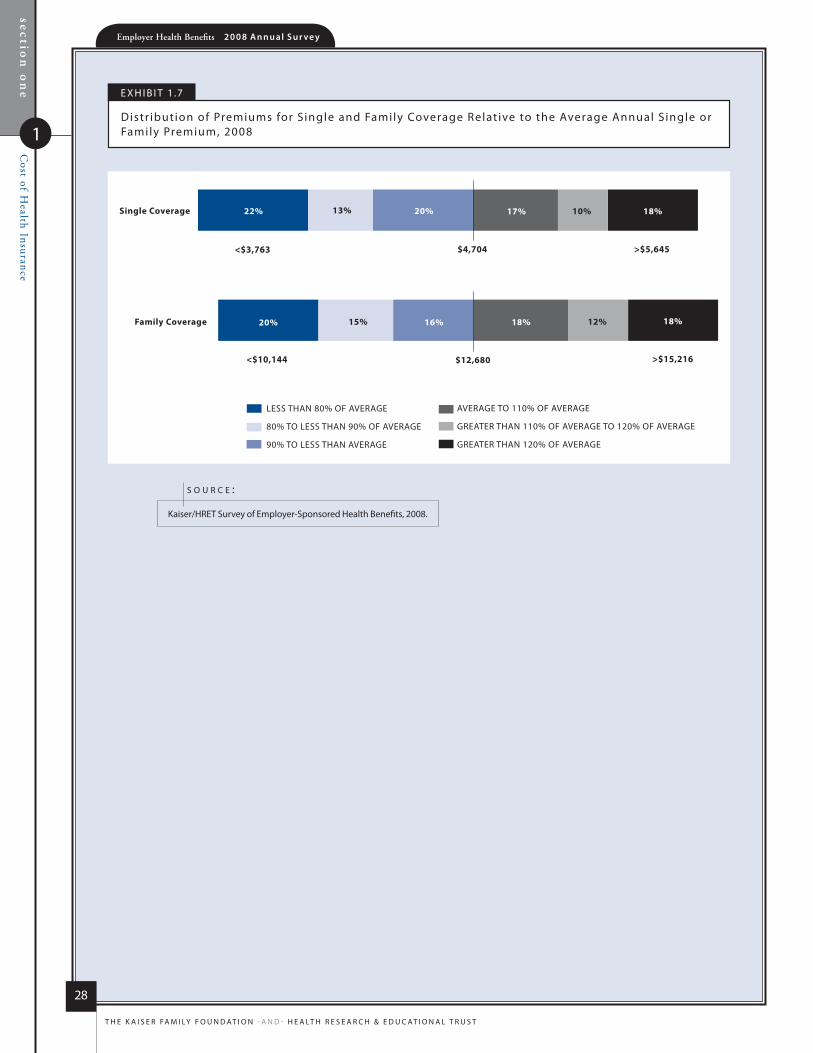
section
on
eC
ost of Health Insurance
1
Employer Health Benefits 2 0 0 8 An n u a l s u r vey
28
t h e k a i s e r fa m i ly f o u n d at i o n - a n d - h e a lt h r e s e a r C h & e d u C at i o n a l t r u s t
e x h i B i t 1 .7
distr ibution of Premiums for s ingle and family Coverage relat ive to the average annual s ingle or family Premium, 2008
Family Coverage
Single Coverage 22% 13% 20% 17% 10% 18%
20% 15% 16% 18% 12% 18%
$4,704
$12,680
LESS THAN 80% OF AVERAGE
80% TO LESS THAN 90% OF AVERAGE
90% TO LESS THAN AVERAGE
AVERAGE TO 110% OF AVERAGE
GREATER THAN 110% OF AVERAGE TO 120% OF AVERAGE
GREATER THAN 120% OF AVERAGE
>$5,645<$3,763
>$15,216<$10,144
kaiser/hret survey of employer-sponsored health Benefits, 2008.
s o u r c e :
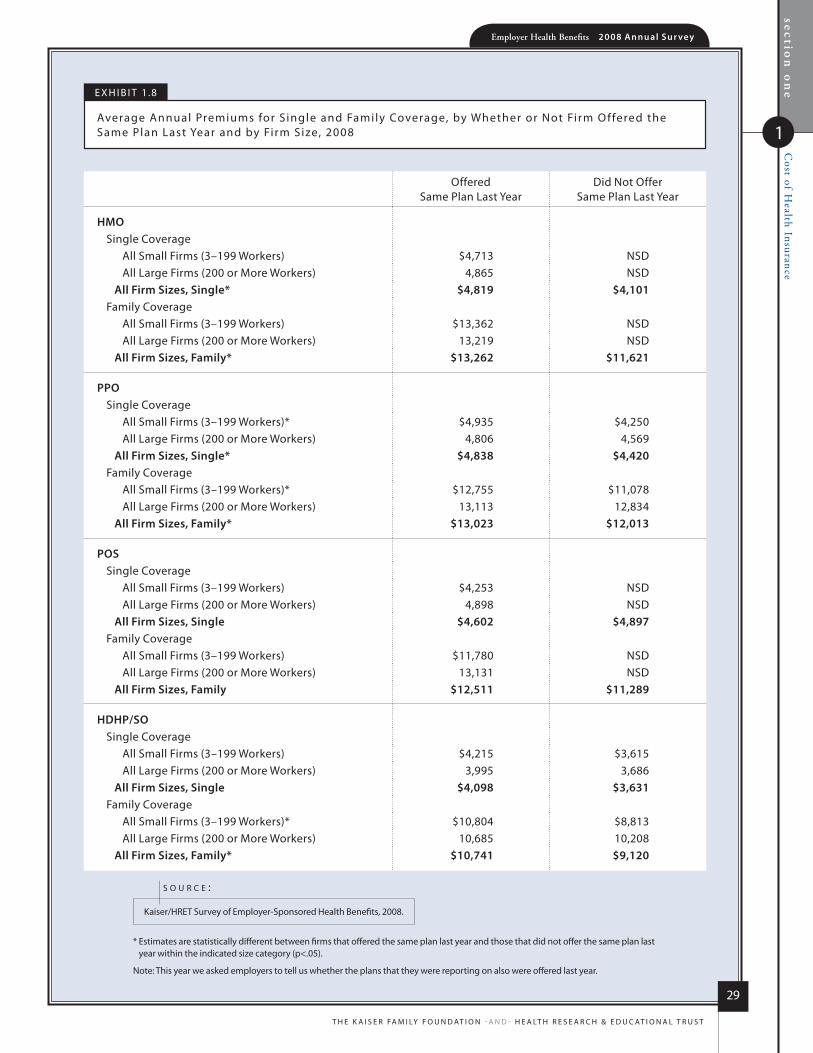
section
on
e
1
Cost of H
ealth InsuranceEmployer Health Benefits 2 0 0 8 An n u a l s u r vey
29
t h e k a i s e r fa m i ly f o u n d at i o n - a n d - h e a lt h r e s e a r C h & e d u C at i o n a l t r u s t
e x h i B i t 1 .8
average annual Premiums for s ingle and family Coverage, by Whether or not firm o ffered the same Plan last year and by firm size, 2008
* estimates are statistically different between firms that offered the same plan last year and those that did not offer the same plan last year within the indicated size category (p<.05).
note: this year we asked employers to tell us whether the plans that they were reporting on also were offered last year.
kaiser/hret survey of employer-sponsored health Benefits, 2008.
s o u r c e :
offered same Plan last year
did not offer same Plan last year
hmosingle Coverage
all small firms (3–199 Workers) $4,713 nsdall large firms (200 or more Workers) 4,865 nsd
All firm sizes, single* $4,819 $4,101family Coverage
all small firms (3–199 Workers) $13,362 nsdall large firms (200 or more Workers) 13,219 nsd
All firm sizes, family* $13,262 $11,621
pposingle Coverage
all small firms (3–199 Workers)* $4,935 $4,250all large firms (200 or more Workers) 4,806 4,569
All firm sizes, single* $4,838 $4,420family Coverage
all small firms (3–199 Workers)* $12,755 $11,078all large firms (200 or more Workers) 13,113 12,834
All firm sizes, family* $13,023 $12,013
possingle Coverage
all small firms (3–199 Workers) $4,253 nsdall large firms (200 or more Workers) 4,898 nsd
All firm sizes, single $4,602 $4,897family Coverage
all small firms (3–199 Workers) $11,780 nsdall large firms (200 or more Workers) 13,131 nsd
All firm sizes, family $12,511 $11,289
hDhp/sosingle Coverage
all small firms (3–199 Workers) $4,215 $3,615all large firms (200 or more Workers) 3,995 3,686
All firm sizes, single $4,098 $3,631family Coverage
all small firms (3–199 Workers)* $10,804 $8,813all large firms (200 or more Workers) 10,685 10,208
All firm sizes, family* $10,741 $9,120
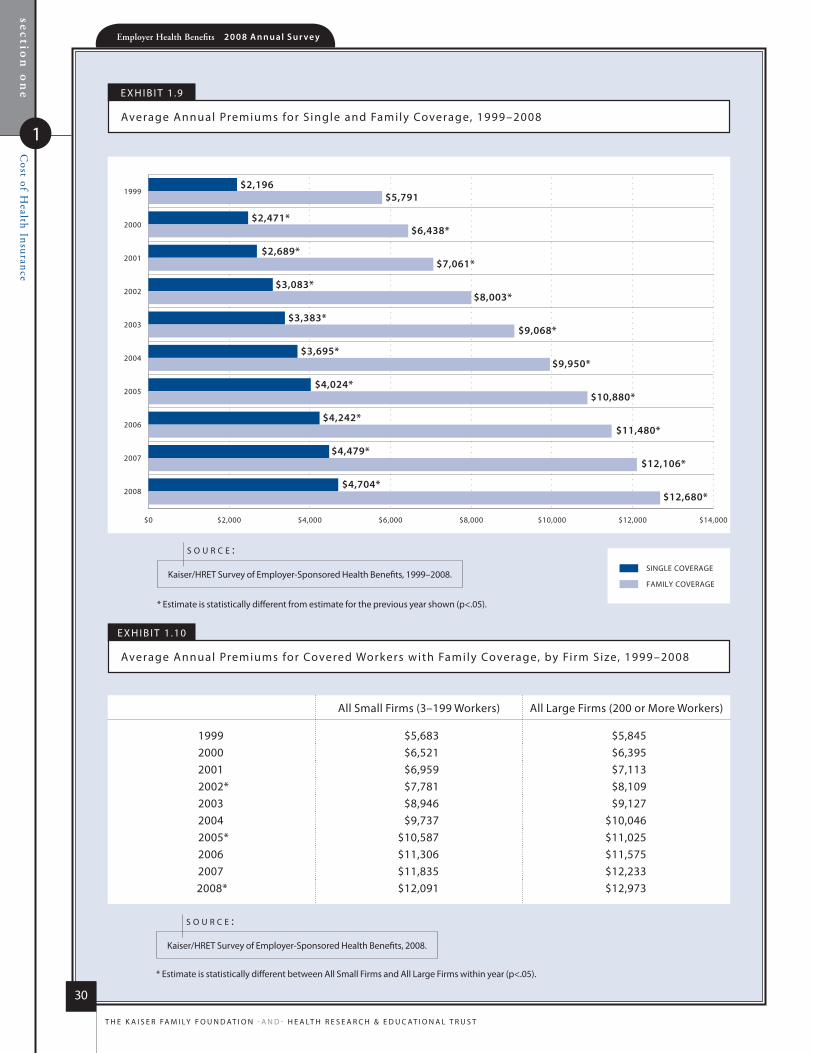
section
on
eC
ost of Health Insurance
1
Employer Health Benefits 2 0 0 8 An n u a l s u r vey
30
t h e k a i s e r fa m i ly f o u n d at i o n - a n d - h e a lt h r e s e a r C h & e d u C at i o n a l t r u s t
e x h i B i t 1 .9
average annual Premiums for s ingle and family Coverage, 1999–2008
* estimate is statistically different from estimate for the previous year shown (p<.05).
kaiser/hret survey of employer-sponsored health Benefits, 1999-2008.
s o u r c e :
SINGLE COVERAGE
FAMILY COVERAGE
1999
2000
2001
2002
2003
2004
2005
2006
2007
2008
$2,196$5,791
$2,471*$6,438*
$2,689*$7,061*
$3,083*$8,003*
$3,383*$9,068*
$3,695*$9,950*
$4,024*$10,880*
$4,242*$11,480*
$4,479*$12,106*
$4,704*$12,680*
$0 $2,000 $4,000 $6,000 $8,000 $10,000 $12,000 $14,000
* estimate is statistically different from estimate for the previous year shown (p<.05).
kaiser/hret survey of employer-sponsored health Benefits, 1999–2008.
s o u r c e :
e x h i B i t 1 .10
average annual Premiums for Covered Workers with family Coverage, by firm size, 1999–2008
* estimate is statistically different between all small firms and all large firms within year (p<.05).
kaiser/hret survey of employer-sponsored health Benefits, 2008.
s o u r c e :
all small firms (3–199 Workers) all large firms (200 or more Workers)
1999 $5,683 $5,8452000 $6,521 $6,3952001 $6,959 $7,1132002* $7,781 $8,1092003 $8,946 $9,1272004 $9,737 $10,0462005* $10,587 $11,0252006 $11,306 $11,5752007 $11,835 $12,2332008* $12,091 $12,973
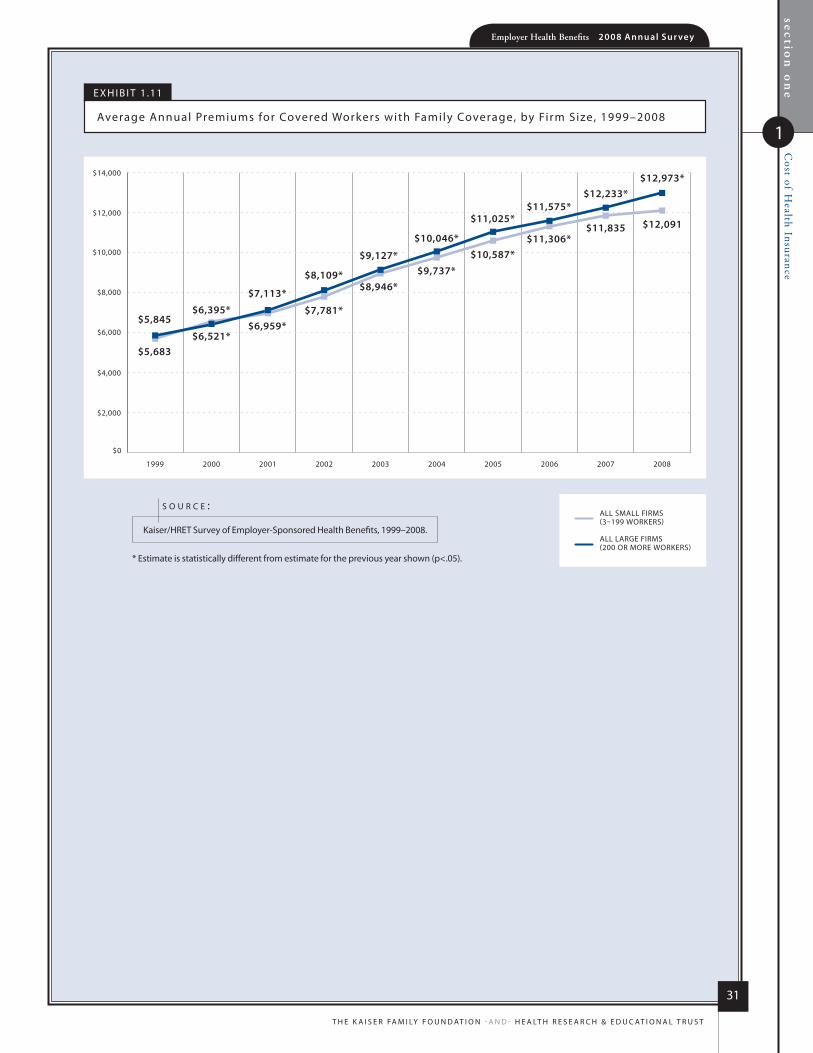
section
on
e
1
Cost of H
ealth InsuranceEmployer Health Benefits 2 0 0 8 An n u a l s u r vey
31
t h e k a i s e r fa m i ly f o u n d at i o n - a n d - h e a lt h r e s e a r C h & e d u C at i o n a l t r u s t
ALL LARGE FIRMS (200 OR MORE WORKERS)
ALL SMALL FIRMS (3–199 WORKERS)
1999 2000 2001 2002 2003 2004 2005 2006 2007 2008
$0
$2,000
$4,000
$6,000
$8,000
$10,000
$12,000
$14,000
$5,845
$5,683$6,521*
$6,395*
$7,113*
$6,959*
$8,109*
$7,781*
$9,127*
$8,946*
$10,046*
$9,737*
$11,025*
$10,587*
$11,575*
$11,306*
$12,233*
$11,835
$12,973*
$12,091
e x h i B i t 1 .11
average annual Premiums for Covered Workers with family Coverage, by firm size, 1999–2008
* estimate is statistically different from estimate for the previous year shown (p<.05).
kaiser/hret survey of employer-sponsored health Benefits, 1999–2008.
s o u r c e :
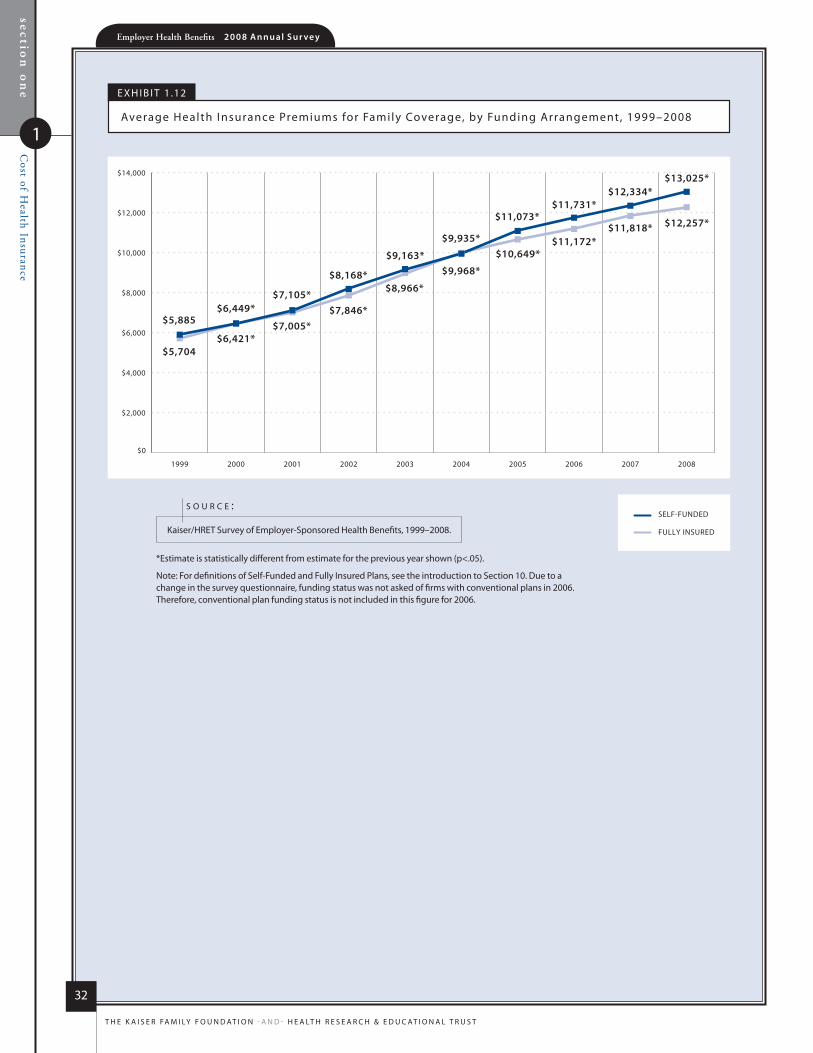
section
on
eC
ost of Health Insurance
1
Employer Health Benefits 2 0 0 8 An n u a l s u r vey
32
t h e k a i s e r fa m i ly f o u n d at i o n - a n d - h e a lt h r e s e a r C h & e d u C at i o n a l t r u s t
e x h i B i t 1 .12
average health insurance Premiums for family Coverage, by funding arrangement, 1999–2008
1999 2000 2001 2002 2003 2004 2005 2006 2007 2008
SELF-FUNDED
FULLY INSURED
$0
$2,000
$4,000
$6,000
$8,000
$10,000
$12,000
$14,000
$5,885
$5,704
$6,449*
$6,421*
$7,105*
$7,005*
$8,168*
$7,846*
$9,163*
$8,966*
$9,935*
$9,968*
$11,073*
$10,649*
$11,731*
$11,172*
$12,334*
$11,818*
$13,025*
$12,257*
*estimate is statistically different from estimate for the previous year shown (p<.05).
note: for definitions of self-funded and fully insured Plans, see the introduction to section 10. due to a change in the survey questionnaire, funding status was not asked of firms with conventional plans in 2006. therefore, conventional plan funding status is not included in this figure for 2006.
kaiser/hret survey of employer-sponsored health Benefits, 1999–2008.
s o u r c e :
63%$12,6
80
$4,7
04
2008
Employer Health Benefits2 0 0 8 a n n u a l s u r V e y
s ect ion
2
HealthBenefits
Offer Rates
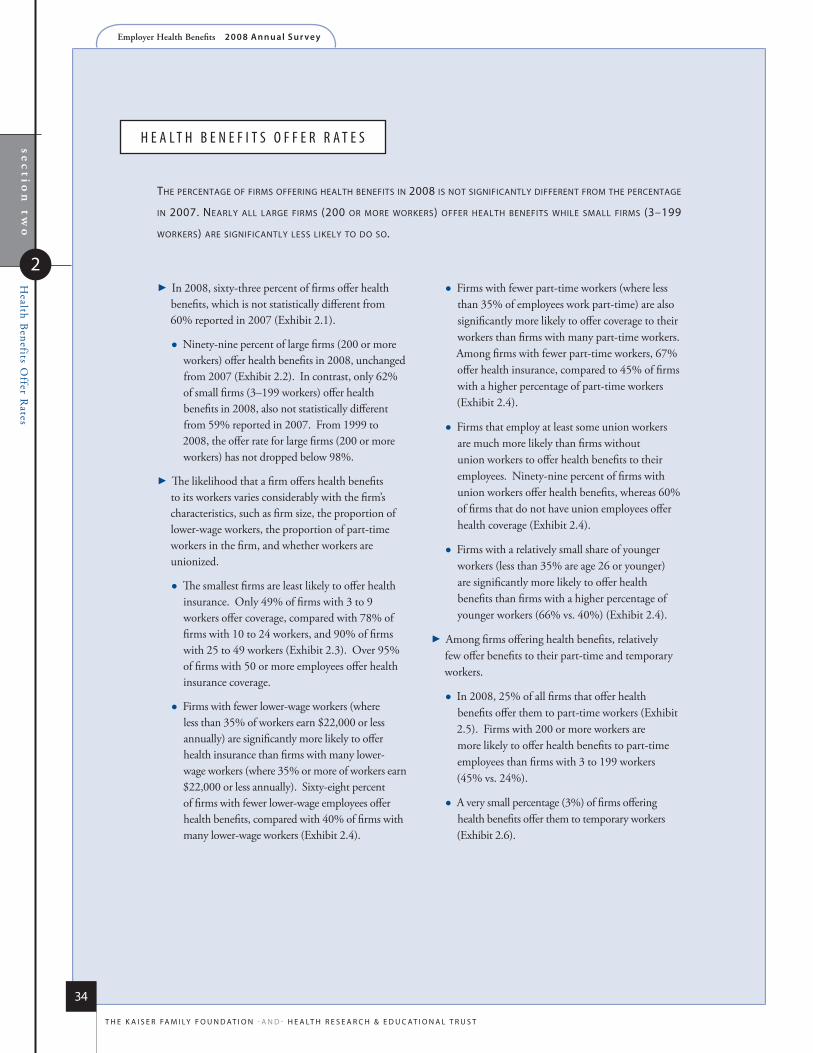
sec
tion
two
Health B
enefits Offer R
ates
2
Employer Health Benefits 2 0 0 8 An n u a l s u r vey
34
t h e k a i s e r fa m i ly f o u n d at i o n - a n d - h e a lt h r e s e a r C h & e d u C at i o n a l t r u s t
h e a l t h B e n e f i t S o f f e r r a t e S
The percenTage of firms offering healTh benefiTs in 2008 is noT significanTly differenT from The percenTage
in 2007. nearly all large firms (200 or more workers) offer healTh benefiTs while small firms (3–199
workers) are significanTly less likely To do so.
�In 2008, sixty-three percent of firms offer health benefits, which is not statistically different from 60% reported in 2007 (Exhibit 2.1).
Ninety-nine percent of large firms (200 or more workers) offer health benefits in 2008, unchanged from 2007 (Exhibit 2.2). In contrast, only 62% of small firms (3–199 workers) offer health benefits in 2008, also not statistically different from 59% reported in 2007. From 1999 to 2008, the offer rate for large firms (200 or more workers) has not dropped below 98%.
�The likelihood that a firm offers health benefits to its workers varies considerably with the firm’s characteristics, such as firm size, the proportion of lower-wage workers, the proportion of part-time workers in the firm, and whether workers are unionized.
The smallest firms are least likely to offer health insurance. Only 49% of firms with 3 to 9 workers offer coverage, compared with 78% of firms with 10 to 24 workers, and 90% of firms with 25 to 49 workers (Exhibit 2.3). Over 95% of firms with 50 or more employees offer health insurance coverage.
Firms with fewer lower-wage workers (where less than 35% of workers earn $22,000 or less annually) are significantly more likely to offer health insurance than firms with many lower-wage workers (where 35% or more of workers earn $22,000 or less annually). Sixty-eight percent of firms with fewer lower-wage employees offer health benefits, compared with 40% of firms with many lower-wage workers (Exhibit 2.4).
Firms with fewer part-time workers (where less than 35% of employees work part-time) are also significantly more likely to offer coverage to their workers than firms with many part-time workers. Among firms with fewer part-time workers, 67% offer health insurance, compared to 45% of firms with a higher percentage of part-time workers (Exhibit 2.4).
Firms that employ at least some union workers are much more likely than firms without union workers to offer health benefits to their employees. Ninety-nine percent of firms with union workers offer health benefits, whereas 60% of firms that do not have union employees offer health coverage (Exhibit 2.4).
Firms with a relatively small share of younger workers (less than 35% are age 26 or younger) are significantly more likely to offer health benefits than firms with a higher percentage of younger workers (66% vs. 40%) (Exhibit 2.4).
�Among firms offering health benefits, relatively few offer benefits to their part-time and temporary workers.
In 2008, 25% of all firms that offer health benefits offer them to part-time workers (Exhibit 2.5). Firms with 200 or more workers are more likely to offer health benefits to part-time employees than firms with 3 to 199 workers (45% vs. 24%).
A very small percentage (3%) of firms offering health benefits offer them to temporary workers (Exhibit 2.6).
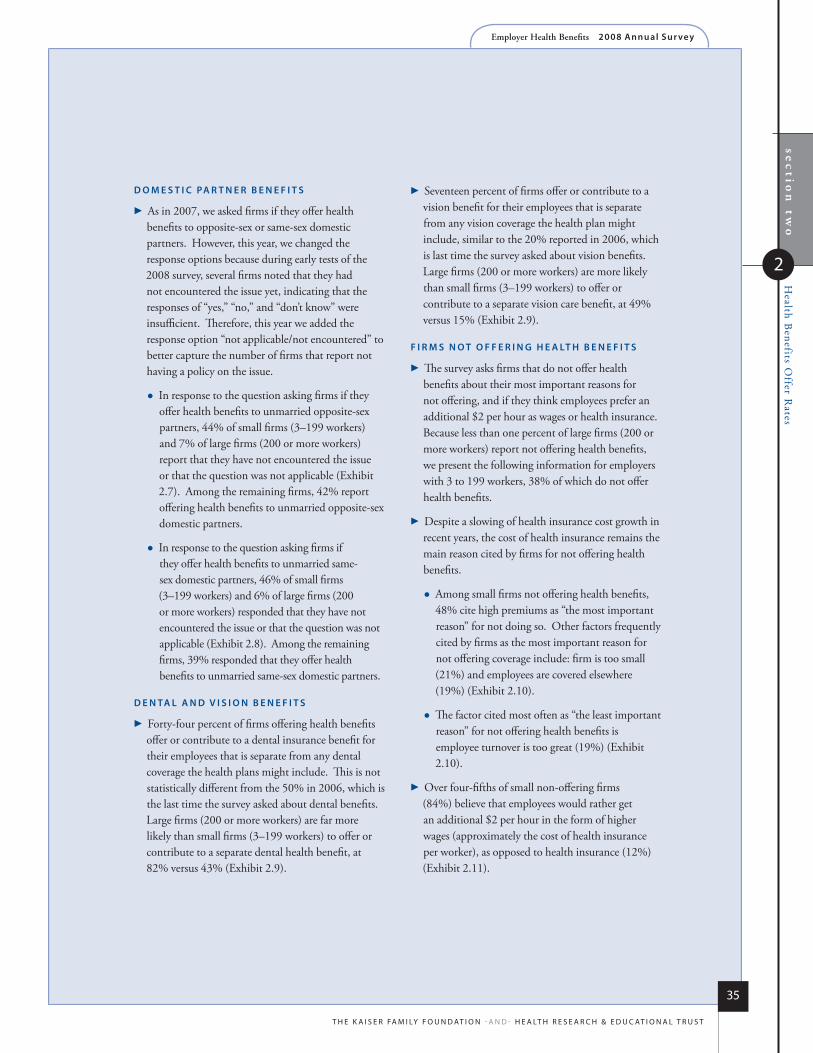
sec
tion
two
Health B
enefits Offer R
ates
2
Employer Health Benefits 2 0 0 8 An n u a l s u r vey
35
t h e k a i s e r fa m i ly f o u n d at i o n - a n d - h e a lt h r e s e a r C h & e d u C at i o n a l t r u s t
D o m e s T i C pA r T N e r b e N e f i T s
�As in 2007, we asked firms if they offer health benefits to opposite-sex or same-sex domestic partners. However, this year, we changed the response options because during early tests of the 2008 survey, several firms noted that they had not encountered the issue yet, indicating that the responses of “yes,” “no,” and “don’t know” were insufficient. Therefore, this year we added the response option “not applicable/not encountered” to better capture the number of firms that report not having a policy on the issue.
In response to the question asking firms if they offer health benefits to unmarried opposite-sex partners, 44% of small firms (3–199 workers) and 7% of large firms (200 or more workers) report that they have not encountered the issue or that the question was not applicable (Exhibit 2.7). Among the remaining firms, 42% report offering health benefits to unmarried opposite-sex domestic partners.
In response to the question asking firms if they offer health benefits to unmarried same-sex domestic partners, 46% of small firms (3–199 workers) and 6% of large firms (200 or more workers) responded that they have not encountered the issue or that the question was not applicable (Exhibit 2.8). Among the remaining firms, 39% responded that they offer health benefits to unmarried same-sex domestic partners.
D e N TA l A N D v i s i o N b e N e f i T s
�Forty-four percent of firms offering health benefits offer or contribute to a dental insurance benefit for their employees that is separate from any dental coverage the health plans might include. This is not statistically different from the 50% in 2006, which is the last time the survey asked about dental benefits. Large firms (200 or more workers) are far more likely than small firms (3–199 workers) to offer or contribute to a separate dental health benefit, at 82% versus 43% (Exhibit 2.9).
�Seventeen percent of firms offer or contribute to a vision benefit for their employees that is separate from any vision coverage the health plan might include, similar to the 20% reported in 2006, which is last time the survey asked about vision benefits. Large firms (200 or more workers) are more likely than small firms (3–199 workers) to offer or contribute to a separate vision care benefit, at 49% versus 15% (Exhibit 2.9).
f i r m s N o T o f f e r i N g h e A lT h b e N e f i T s
�The survey asks firms that do not offer health benefits about their most important reasons for not offering, and if they think employees prefer an additional $2 per hour as wages or health insurance. Because less than one percent of large firms (200 or more workers) report not offering health benefits, we present the following information for employers with 3 to 199 workers, 38% of which do not offer health benefits.
�Despite a slowing of health insurance cost growth in recent years, the cost of health insurance remains the main reason cited by firms for not offering health benefits.
Among small firms not offering health benefits, 48% cite high premiums as “the most important reason” for not doing so. Other factors frequently cited by firms as the most important reason for not offering coverage include: firm is too small (21%) and employees are covered elsewhere (19%) (Exhibit 2.10).
The factor cited most often as “the least important reason” for not offering health benefits is employee turnover is too great (19%) (Exhibit 2.10).
�Over four-fifths of small non-offering firms (84%) believe that employees would rather get an additional $2 per hour in the form of higher wages (approximately the cost of health insurance per worker), as opposed to health insurance (12%) (Exhibit 2.11).
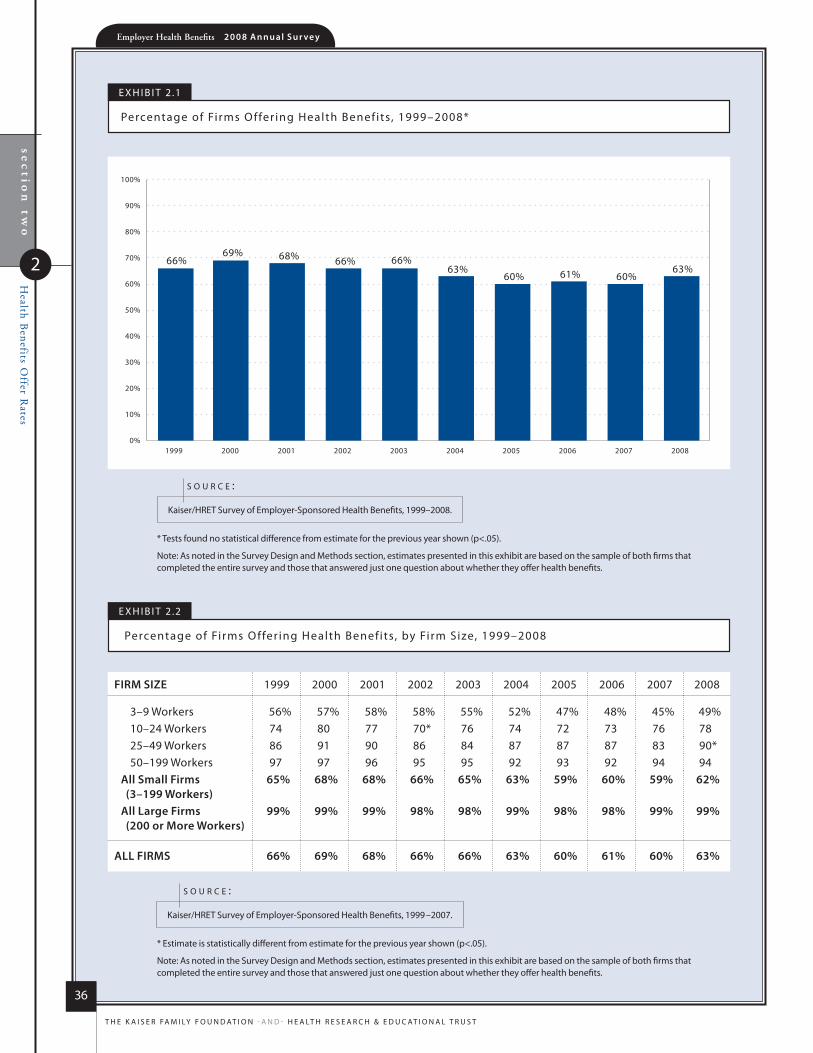
sec
tion
two
Health B
enefits Offer R
ates
2
Employer Health Benefits 2 0 0 8 An n u a l s u r vey
36
t h e k a i s e r fa m i ly f o u n d at i o n - a n d - h e a lt h r e s e a r C h & e d u C at i o n a l t r u s t
e x h i B i t 2 .1
Percentage of fi rms o ffer ing health Benef its, 1999–2008*
* tests found no statistical difference from estimate for the previous year shown (p<.05).
note: as noted in the survey design and methods section, estimates presented in this exhibit are based on the sample of both firms that completed the entire survey and those that answered just one question about whether they offer health benefits.
kaiser/hret survey of employer-sponsored health Benefits, 1999–2008.
s o u r c e :
* estimate is statistically different from estimate for the previous year shown (p<.05).
note: as noted in the survey design and methods section, estimates presented in this exhibit are based on the sample of both firms that completed the entire survey and those that answered just one question about whether they offer health benefits.
kaiser/hret survey of employer-sponsored health Benefits, 1999 –2007.
s o u r c e :
1999 2000 2001 2002 2003 2004 2005 2006 200820070%
10%
20%
30%
40%
50%
60%
70%
80%
90%
100%
66%69% 68% 66% 66%
63%60% 61% 63%
60%
e x h i B i t 2 .2
Percentage of fi rms o ffer ing health Benef its, by firm size, 1999–2008
firm size 1999 2000 2001 2002 2003 2004 2005 2006 2007 2008
3–9 Workers 56% 57% 58% 58% 55% 52% 47% 48% 45% 49%10–24 Workers 74 80 77 70* 76 74 72 73 76 7825–49 Workers 86 91 90 86 84 87 87 87 83 90*50–199 Workers 97 97 96 95 95 92 93 92 94 94
All small firms (3–199 Workers)
65% 68% 68% 66% 65% 63% 59% 60% 59% 62%
All large firms (200 or more Workers)
99% 99% 99% 98% 98% 99% 98% 98% 99% 99%
All firms 66% 69% 68% 66% 66% 63% 60% 61% 60% 63%

sec
tion
two
Health B
enefits Offer R
ates
2
Employer Health Benefits 2 0 0 8 An n u a l s u r vey
37
t h e k a i s e r fa m i ly f o u n d at i o n - a n d - h e a lt h r e s e a r C h & e d u C at i o n a l t r u s t
e x h i B i t 2 .3
Percentage of fi rms o ffer ing health Benef its, by firm size, region, and industr y, 2008
Percentage of firms offering health Benefits
firm size 3–9 Workers 49%*10–24 Workers 78*25–49 Workers 90*50–199 Workers 94*200–999 Workers 99*1,000–4,999 Workers 100*5,000 or more Workers 100*
All small firms (3–199 Workers) 62%*All large firms (200 or more Workers) 99%*
regioNnortheast 78%*midwest 60south 59West 60
iNDusTryagriculture/mining/Construction 67%manufacturing 73transportation/Communications/utilities 89*Wholesale 74retail 40*finance 81*service 58state/local Government 97*health Care 71
All firms 63%
* estimate is statistically different from estimate for all other firms not in the indicated size, region, or industry category (p<.05).
note: as noted in the survey design and methods section, estimates presented in this exhibit are based on the sample of both firms that completed the entire survey and those that answered just one question about whether they offer health benefits.
kaiser/hret survey of employer-sponsored health Benefits, 2008.
s o u r c e :
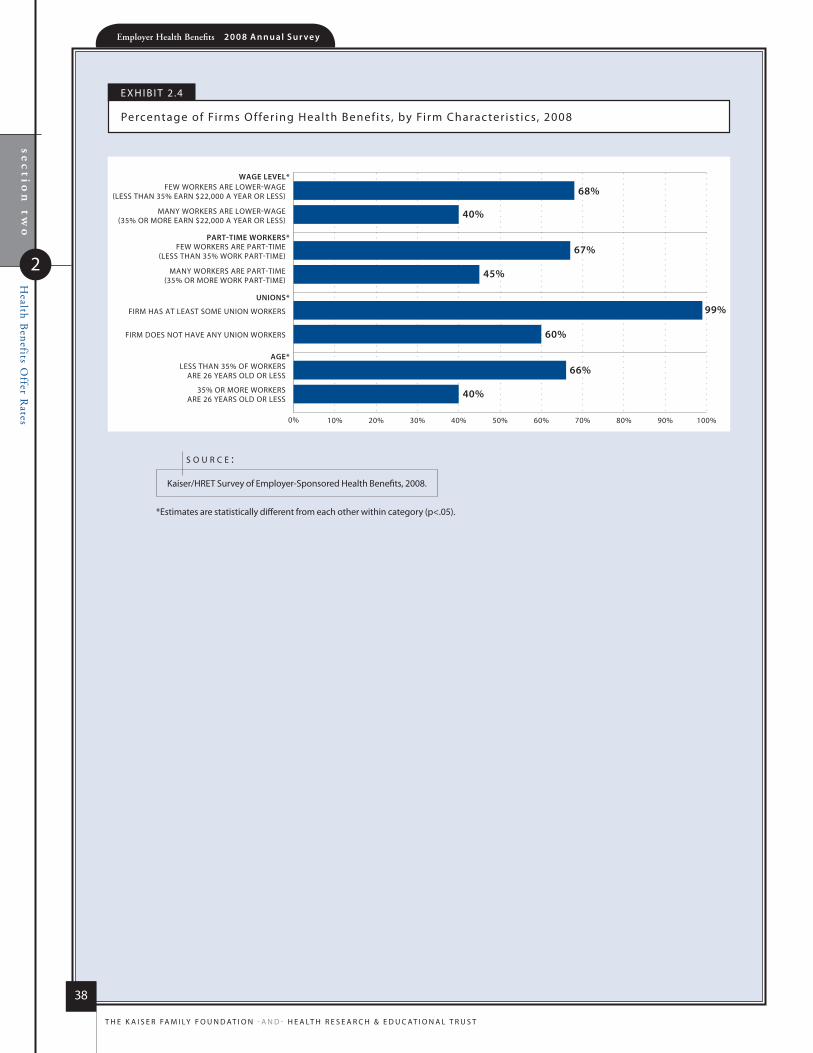
sec
tion
two
Health B
enefits Offer R
ates
2
Employer Health Benefits 2 0 0 8 An n u a l s u r vey
38
t h e k a i s e r fa m i ly f o u n d at i o n - a n d - h e a lt h r e s e a r C h & e d u C at i o n a l t r u s t
e x h i B i t 2 .4
Percentage of fi rms o ffer ing health Benef its, by firm Charac ter ist ics, 2008
*estimates are statistically different from each other within category (p<.05).
kaiser/hret survey of employer-sponsored health Benefits, 2008.
s o u r c e :
FIRM DOES NOT HAVE ANY UNION WORKERS
FIRM HAS AT LEAST SOME UNION WORKERS
FEW WORKERS ARE LOWER-WAGE(LESS THAN 35% EARN $22,000 A YEAR OR LESS)
MANY WORKERS ARE LOWER-WAGE(35% OR MORE EARN $22,000 A YEAR OR LESS)
FEW WORKERS ARE PART-TIME(LESS THAN 35% WORK PART-TIME)
MANY WORKERS ARE PART-TIME(35% OR MORE WORK PART-TIME)
WAGE LEVEL*
PART-TIME WORKERS*
UNIONS*
35% OR MORE WORKERS ARE 26 YEARS OLD OR LESS
LESS THAN 35% OF WORKERS ARE 26 YEARS OLD OR LESS
AGE*
0% 10% 20% 30% 40% 50% 60% 70% 80% 90% 100%
60%
66%
40%
99%
45%
67%
40%
68%
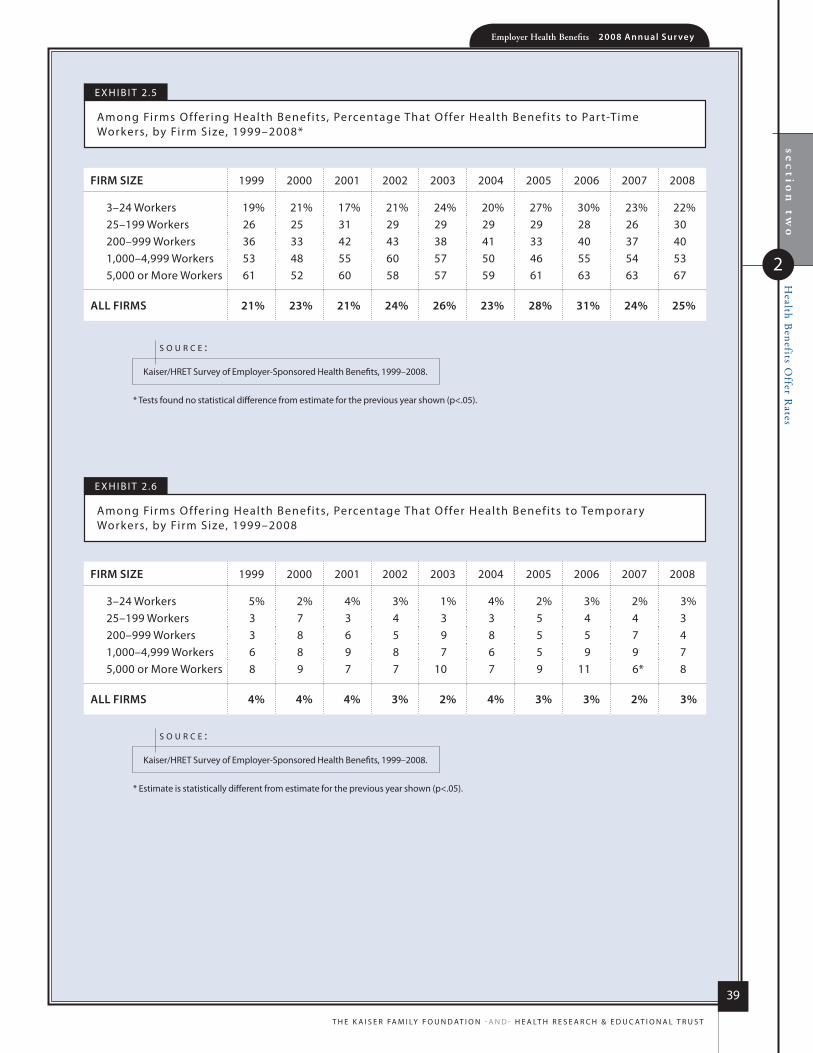
sec
tion
two
Health B
enefits Offer R
ates
2
Employer Health Benefits 2 0 0 8 An n u a l s u r vey
39
t h e k a i s e r fa m i ly f o u n d at i o n - a n d - h e a lt h r e s e a r C h & e d u C at i o n a l t r u s t
* tests found no statistical difference from estimate for the previous year shown (p<.05).
kaiser/hret survey of employer-sponsored health Benefits, 1999–2008.
s o u r c e :
* estimate is statistically different from estimate for the previous year shown (p<.05).
kaiser/hret survey of employer-sponsored health Benefits, 1999–2008.
s o u r c e :
e x h i B i t 2 .5
among firms o ffer ing health Benef its, Percentage that o ffer health Benef its to Par t-time Workers, by firm size, 1999–2008*
e x h i B i t 2 .6
among firms o ffer ing health Benef its, Percentage that o ffer health Benef its to temporar y Workers, by firm size, 1999–2008
firm size 1999 2000 2001 2002 2003 2004 2005 2006 2007 2008
3–24 Workers 19% 21% 17% 21% 24% 20% 27% 30% 23% 22%25–199 Workers 26 25 31 29 29 29 29 28 26 30200–999 Workers 36 33 42 43 38 41 33 40 37 401,000–4,999 Workers 53 48 55 60 57 50 46 55 54 535,000 or more Workers 61 52 60 58 57 59 61 63 63 67
All firms 21% 23% 21% 24% 26% 23% 28% 31% 24% 25%
firm size 1999 2000 2001 2002 2003 2004 2005 2006 2007 2008
3–24 Workers 5% 2% 4% 3% 1% 4% 2% 3% 2% 3%25–199 Workers 3 7 3 4 3 3 5 4 4 3200–999 Workers 3 8 6 5 9 8 5 5 7 41,000–4,999 Workers 6 8 9 8 7 6 5 9 9 75,000 or more Workers 8 9 7 7 10 7 9 11 6* 8
All firms 4% 4% 4% 3% 2% 4% 3% 3% 2% 3%
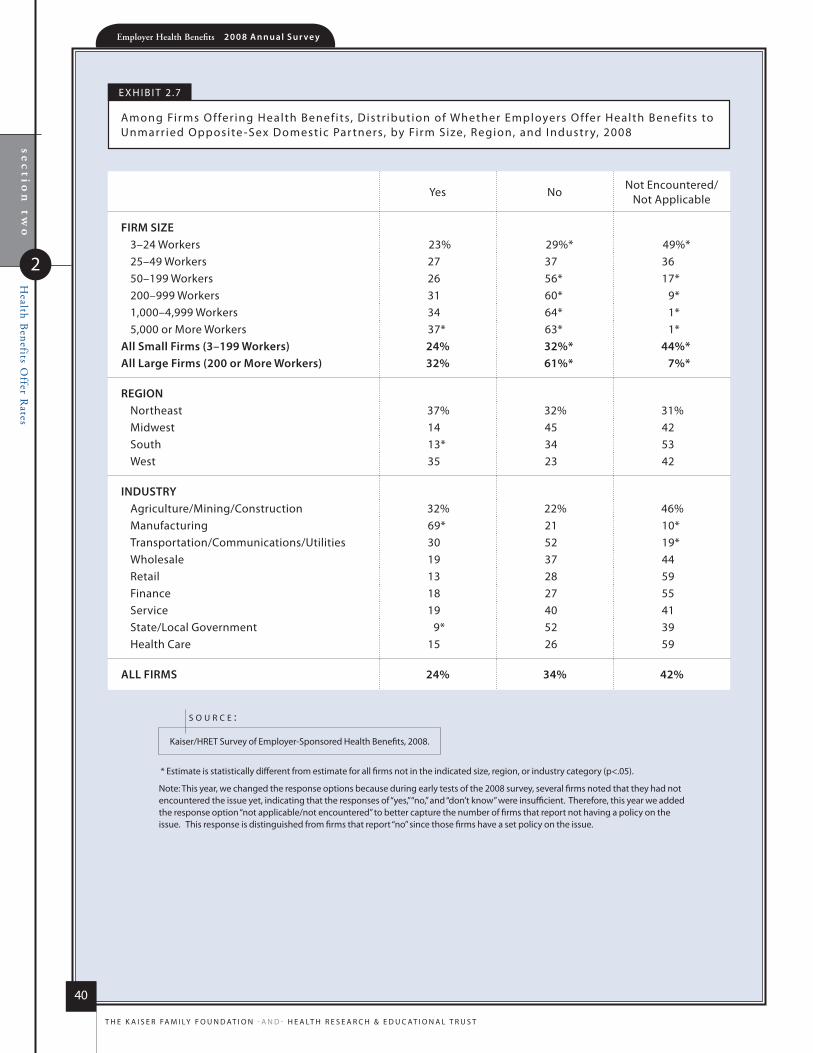
sec
tion
two
Health B
enefits Offer R
ates
2
Employer Health Benefits 2 0 0 8 An n u a l s u r vey
40
t h e k a i s e r fa m i ly f o u n d at i o n - a n d - h e a lt h r e s e a r C h & e d u C at i o n a l t r u s t
e x h i B i t 2 .7
among firms o ffer ing health Benef its, distr ibution of Whether employers o ffer health Benef its to unmarr ied opposite -sex domestic Par tners, by firm size, region, and industr y, 2008
* estimate is statistically different from estimate for all firms not in the indicated size, region, or industry category (p<.05).
note: this year, we changed the response options because during early tests of the 2008 survey, several firms noted that they had not encountered the issue yet, indicating that the responses of “yes,” “no,” and “don’t know” were insufficient. therefore, this year we added the response option “not applicable/not encountered” to better capture the number of firms that report not having a policy on the issue. this response is distinguished from firms that report “no” since those firms have a set policy on the issue.
kaiser/hret survey of employer-sponsored health Benefits, 2008.
s o u r c e :
yes nonot encountered/
not applicable
firm size3–24 Workers 23% 29%* 49%*25–49 Workers 27 37 3650–199 Workers 26 56* 17*200–999 Workers 31 60* 9*1,000–4,999 Workers 34 64* 1*5,000 or more Workers 37* 63* 1*
All small firms (3–199 Workers) 24% 32%* 44%*All large firms (200 or more Workers) 32% 61%* 7%*
regioNnortheast 37% 32% 31%midwest 14 45 42south 13* 34 53West 35 23 42
iNDusTryagriculture/mining/Construction 32% 22% 46%manufacturing 69* 21 10*transportation/Communications/utilities 30 52 19*Wholesale 19 37 44retail 13 28 59finance 18 27 55service 19 40 41state/local Government 9* 52 39health Care 15 26 59
All firms 24% 34% 42%

sec
tion
two
Health B
enefits Offer R
ates
2
Employer Health Benefits 2 0 0 8 An n u a l s u r vey
41
t h e k a i s e r fa m i ly f o u n d at i o n - a n d - h e a lt h r e s e a r C h & e d u C at i o n a l t r u s t
e x h i B i t 2 .8
among firms o ffer ing health Benef its, distr ibution of Whether employers o ffer health Benef its to unmarr ied same -sex domestic Par tners, by firm size, region, and industr y, 2008
* estimate is statistically different from estimate for all firms not in the indicated size, region, or industry category (p<.05).
note: this year, we changed the response options because during early tests of the 2008 survey, several firms noted that they had not encountered the issue yet, indicating that the responses of “yes,” “no,” and “don’t know” were insufficient. therefore, this year we added the response option “not applicable/not encountered” to better capture the number of firms that report not having a policy on the issue. this response is distinguished from firms that report “no” since those firms have a set policy on the issue.
kaiser/hret survey of employer-sponsored health Benefits, 2008.
s o u r c e :
yes nonot encountered/
not applicable
firm size3–24 Workers 21% 28%* 51%*25–49 Workers 21 44 3550–199 Workers 24 59* 17*200–999 Workers 30 61* 8*1,000–4,999 Workers 37* 61* 2*5,000 or more Workers 50* 49* 1*
All small firms (3–199 Workers) 21%* 33%* 46%*All large firms (200 or more Workers) 34%* 60%* 6%*
regioNnortheast 23% 35% 42%midwest 12* 47 42south 16 36 49West 40* 18* 41
iNDusTryagriculture/mining/Construction 40% 28% 32%manufacturing 9 20 71transportation/Communications/utilities 21 50 29Wholesale 20 47 33retail 7* 28 64finance 41 26 32service 21 38 41state/local Government 7* 53 40health Care 13 28 59
All firms 22% 34% 44%
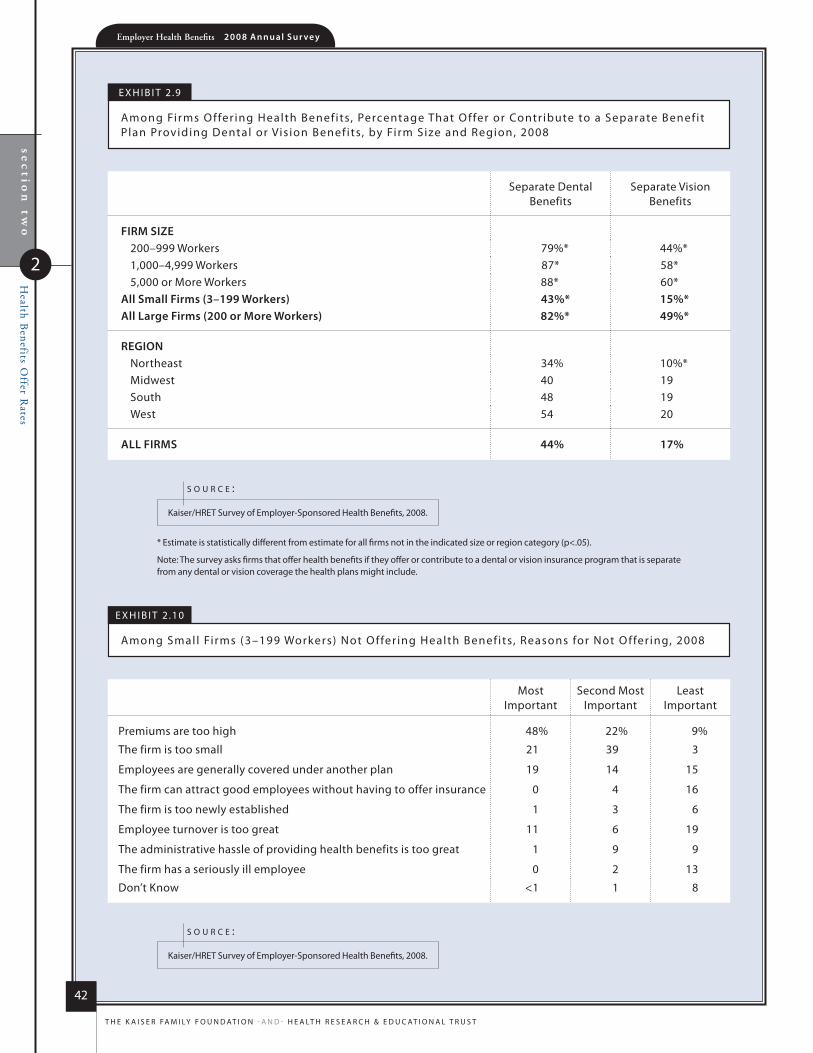
sec
tion
two
Health B
enefits Offer R
ates
2
Employer Health Benefits 2 0 0 8 An n u a l s u r vey
42
t h e k a i s e r fa m i ly f o u n d at i o n - a n d - h e a lt h r e s e a r C h & e d u C at i o n a l t r u s t
e x h i B i t 2 .9
among firms o ffer ing health Benef its, Percentage that o ffer or Contr ibute to a separate Benef it Plan Providing dental or Vis ion Benef its, by firm size and region, 2008
* estimate is statistically different from estimate for all firms not in the indicated size or region category (p<.05).
note: the survey asks firms that offer health benefits if they offer or contribute to a dental or vision insurance program that is separate from any dental or vision coverage the health plans might include.
kaiser/hret survey of employer-sponsored health Benefits, 2008.
s o u r c e :
kaiser/hret survey of employer-sponsored health Benefits, 2008.
s o u r c e :
separate dental Benefits
separate Vision Benefits
firm size200–999 Workers 79%* 44%*1,000–4,999 Workers 87* 58*5,000 or more Workers 88* 60*
All small firms (3–199 Workers) 43%* 15%*All large firms (200 or more Workers) 82%* 49%*
regioNnortheast 34% 10%*midwest 40 19south 48 19West 54 20
All firms 44% 17%
e x h i B i t 2 .10
among smal l fi rms (3–199 Workers) not o ffer ing health Benef its, reasons for not o ffer ing, 2008
most important
second most important
least important
Premiums are too high 48% 22% 9%
the firm is too small 21 39 3
employees are generally covered under another plan 19 14 15
the firm can attract good employees without having to offer insurance 0 4 16
the firm is too newly established 1 3 6
employee turnover is too great 11 6 19
the administrative hassle of providing health benefits is too great 1 9 9
the firm has a seriously ill employee 0 2 13
don’t know <1 1 8
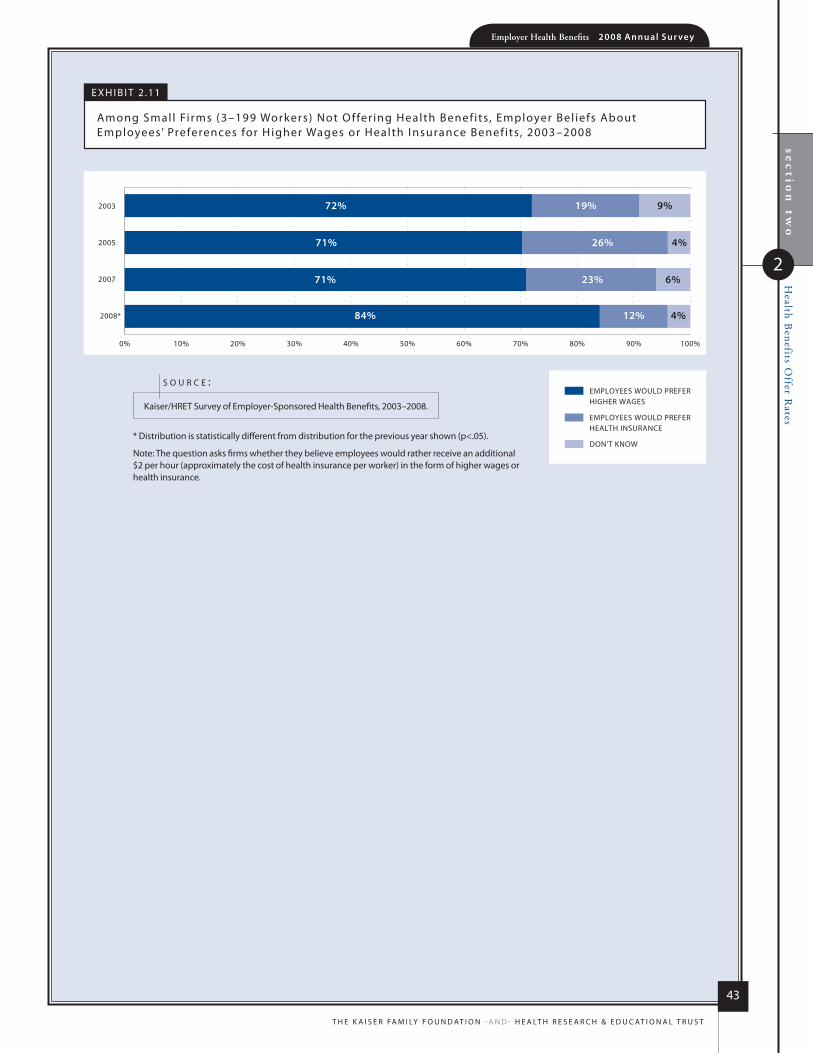
sec
tion
two
Health B
enefits Offer R
ates
2
Employer Health Benefits 2 0 0 8 An n u a l s u r vey
43
t h e k a i s e r fa m i ly f o u n d at i o n - a n d - h e a lt h r e s e a r C h & e d u C at i o n a l t r u s t
e x h i B i t 2 .11
among smal l fi rms (3–199 Workers) not o ffer ing health Benef its, employer Bel iefs about employees’ Preferences for h igher Wages or health insurance Benef its, 2003–2008
2007
2008*
2005
2003
EMPLOYEES WOULD PREFER HIGHER WAGES
EMPLOYEES WOULD PREFER HEALTH INSURANCE
DON’T KNOW
0% 10% 20% 30% 40% 50% 60% 70% 80% 90% 100%
26%71%
72% 19%
71% 23%
4%
9%
6%
84% 12% 4%
* distribution is statistically different from distribution for the previous year shown (p<.05).
note: the question asks firms whether they believe employees would rather receive an additional $2 per hour (approximately the cost of health insurance per worker) in the form of higher wages or health insurance.
kaiser/hret survey of employer-sponsored health Benefits, 2003–2008.
s o u r c e :

63%$12,6
80
$4,7
04
2008
Employer Health Benefits2 0 0 8 a n n u a l s u r V e y
s ect ion
Employee Coverage,
Eligibility, and Participation
3

Employer Health Benefits 2 0 0 8 An n u a l s u r vey
section
three
Em
ployee Coverage, E
ligibility, and Participation
3
46
t h e k a i s e r fa m i ly f o u n d at i o n - a n d - h e a lt h r e s e a r C h & e d u C at i o n a l t r u s t
e M p l o y e e C o v e r a g e , e l i g i B i l i t y , a n D p a r t i C i p a t i o n
employers are The principal source of healTh insurance in The uniTed sTaTes, providing healTh benefiTs
for abouT 158 million nonelderly people in america.1 among firms ThaT offer and do noT offer healTh
benefiTs, 60% of workers are covered by healTh benefiTs offered by The firm ThaT They work for. mosT
workers are offered healTh coverage aT work, and The vasT majoriTy of workers who are offered coverage
Take iT. workers may noT be covered by Their own employer for several reasons: Their employer may noT
offer coverage, They may be ineligible for benefiTs offered by Their firm, They may choose To elecT coverage
Through Their spouse’s employer, or They may refuse an offer of coverage from Their firm.
�Sixty percent of workers in both firms offering and not offering health benefits are covered by health benefits offered by their own employer (Exhibit 3.1). Looking only at workers in firms that offer health benefits, 65% percent are covered by health benefits offered by their own employer (Exhibit 3.2).
�The rate of coverage varies by certain characteristics of the firm, such as industry, and the percentage of part-time and lower-wage employees.
There is significant variation in the coverage rate across industry groups. Forty-five percent of workers in retail firms are covered by health benefits offered by their firm, compared to 81% of workers in state and local government, and 79% of workers in the manufacturing industry (Exhibit 3.2).
Among workers in firms offering health benefits, those in firms with relatively few part-time workers (where fewer than 35% of workers are part-time) are much more likely to be covered by their own firm than workers in firms with a greater percentage of part-time workers. Seventy-one percent of workers in firms with relatively few part-time workers are covered by their own employer, compared to 35% in firms with higher percentages of part-time workers (Exhibit 3.5).
Also, among workers in firms offering health benefits, those in firms with fewer lower-wage workers (where fewer than 35% of workers earn $22,000 or less annually) are more likely to be covered by their own firm than workers in firms with many lower-wage workers (where 35% or more of workers earn $22,000 or less annually). Sixty-eight percent of workers in higher-wage firms are covered by their own employer, compared to 52% of workers in lower-wage firms (Exhibit 3.5).
�Even in firms that offer coverage, not all employees are eligible for the health benefits offered by their firm. Additionally, not all eligible employees who are offered health coverage take the offer of coverage. The number of workers covered is a product of both the percentage of workers who are actually eligible for the firm’s health insurance and the percentage who choose to “take up” (i.e., elect to participate in) the benefit.
Eighty percent of workers in firms offering health benefits are eligible for the coverage offered by their employer in 2008, similar to the percentage (79%) reported last year (Exhibit 3.6). The average eligibility rate is significantly higher for workers in firms with 3 to 24 workers (86%) than the eligibility rates in firms of other sizes (Exhibit 3.2).
1 kaiser family foundation, kaiser Commission on medicaid and the uninsured, Health Insurance Coverage in America, 2006 Data Update, october 2007.
n o T e :
Employer Health Benefits 2 0 0 8 An n u a l s u r veysectio
n th
ree
3
Em
ployee Coverage, E
ligibility, and Participation
47
t h e k a i s e r fa m i ly f o u n d at i o n - a n d - h e a lt h r e s e a r C h & e d u C at i o n a l t r u s t
Employees who are offered coverage through their employer generally elect to take the offer. Eighty-two percent of eligible workers take up coverage when it is offered to them, the same percentage as last year (Exhibit 3.6).
The likelihood of a worker accepting a firm’s offer of coverage varies by firm wage level. Eligible employees in firms with a lower proportion of lower-wage workers (firms where fewer than 35% of workers earn $22,000 or less annually) are more likely to take up coverage (83%) than eligible employees in firms with a higher proportion of lower-wage workers (where 35% or more of workers earn $22,000 or less annually) (74%) (Exhibit 3.4).
�Seventy-five percent of covered workers face a waiting period before coverage is available. Covered workers in the Northeast are less likely (65%) and covered workers in the West are more likely (83%) than workers in other regions to face a waiting period before coverage becomes effective. Covered workers in retail firms are much more likely (92%) than workers in other industries to face a waiting period. The average waiting period among covered workers who face a waiting period is 2.1 months (Exhibit 3.7).
�The distribution of covered workers electing single coverage, single plus one coverage, or family coverage is 46%, 19%, and 36% respectively in 2008 (Exhibit 3.9). Workers in small firms (3–199 workers) are significantly less likely to enroll in family coverage than are workers in large firms (200 or more workers), at 32% versus 38% (Exhibit 3.10).
�For the first time the survey asked firms about the age at which dependents who are full-time students are no longer eligible for coverage in the plan with the largest enrollment. Forty-two percent of firms limit the age at which full-time students are no longer eligible for dependent coverage to 24 or 25 years old (Exhibit 3.11).
�Slightly less than half of firms (46%) have some former employees currently receiving health benefits through COBRA2 (Exhibit 3.12). Among firms with some former employees currently receiving COBRA coverage, firms with 20 to 49 workers have an average of one former employee receiving health benefits, while firms with 5,000 or more workers have an average of 284 former employees with COBRA coverage.
2 the Consolidated omnibus Budget reconciliation act of 1985 (CoBra) allows qualified beneficiaries to continue coverage after termination of employment, divorce, legal separation, or death of an employee. for more information, see “how Private health Coverage Works: a Primer 2008 update,” by the kaiser family foundation, available at http://www.kff.org/insurance/upload/7766.pdf.
n o T e :

Employer Health Benefits 2 0 0 8 An n u a l s u r vey
48
t h e k a i s e r fa m i ly f o u n d at i o n - a n d - h e a lt h r e s e a r C h & e d u C at i o n a l t r u s t
section
three
Em
ployee Coverage, E
ligibility, and Participation
3
* tests found no statistical difference from estimate for the previous year shown (p<.05).
kaiser/hret survey of employer-sponsored health Benefits, 1999–2008.
s o u r c e :
e x h i B i t 3 .1
Percentage of al l Workers Covered by their employers’ health Benef its, in firms Both o ffer ing and not o ffer ing health Benef its, by firm size, 1999–2008*
firm size 1999 2000 2001 2002 2003 2004 2005 2006 2007 2008
3–24 Workers 50% 50% 49% 45% 44% 43% 41% 45% 42% 43%25–49 Workers 56 63 62 57 59 56 55 55 51 5750–199 Workers 61 62 67 64 61 56 59 62 59 60200–999 Workers 69 69 71 69 68 69 65 66 65 671,000–4,999 Workers 68 68 69 70 69 68 69 68 69 695,000 or more Workers 64 66 69 68 68 67 66 60 63 64
All small firms (3–199 Workers) 55% 57% 58% 54% 53% 50% 50% 53% 50% 52%All large firms (200 or more Workers) 66% 67% 69% 69% 68% 68% 66% 63% 65% 66%
All firms 62% 63% 65% 63% 62% 61% 60% 59% 59% 60%
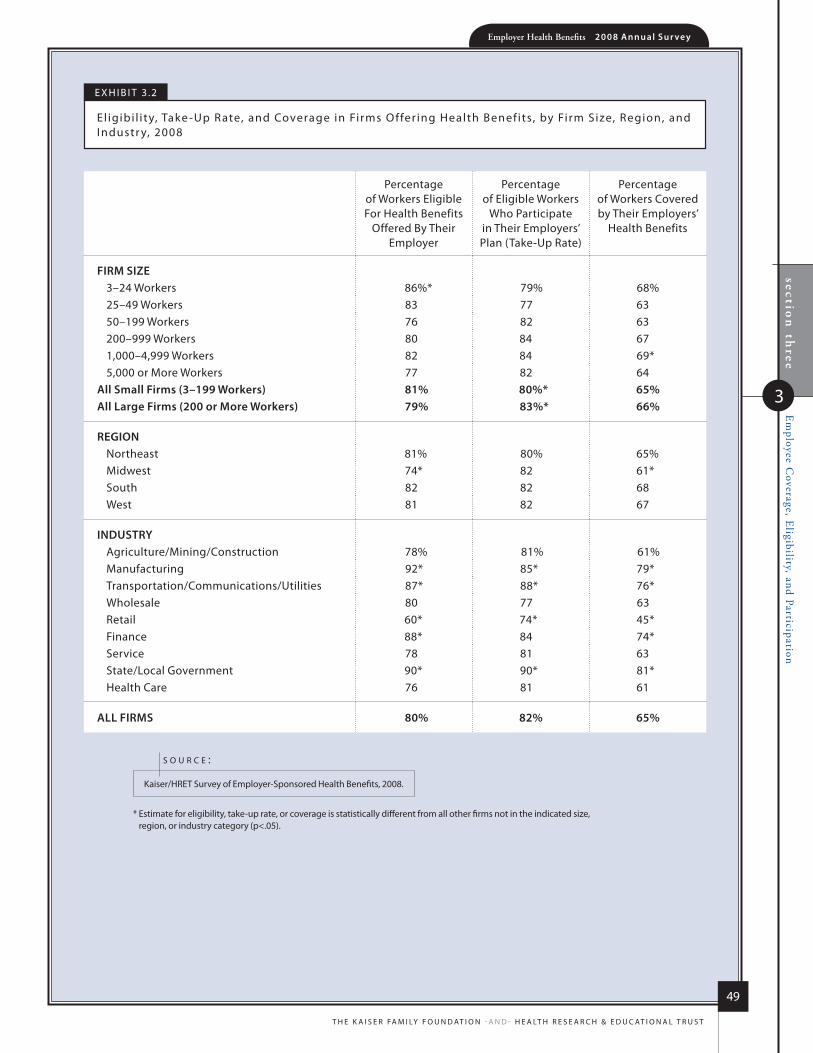
Employer Health Benefits 2 0 0 8 An n u a l s u r vey
49
t h e k a i s e r fa m i ly f o u n d at i o n - a n d - h e a lt h r e s e a r C h & e d u C at i o n a l t r u s t
section
three
Em
ployee Coverage, E
ligibility, and Participation
3
e x h i B i t 3 .2
el igibi l i ty, take -up r ate, and Coverage in firms o ffer ing health Benef its, by firm size, region, and industr y, 2008
* estimate for eligibility, take-up rate, or coverage is statistically different from all other firms not in the indicated size, region, or industry category (p<.05).
kaiser/hret survey of employer-sponsored health Benefits, 2008.
s o u r c e :
Percentage of Workers eligible for health Benefits
offered By their employer
Percentage of eligible Workers
Who Participate in their employers’ Plan (take-up rate)
Percentage of Workers Covered by their employers’
health Benefits
firm size3–24 Workers 86%* 79% 68%25–49 Workers 83 77 6350–199 Workers 76 82 63200–999 Workers 80 84 671,000–4,999 Workers 82 84 69*5,000 or more Workers 77 82 64
All small firms (3–199 Workers) 81% 80%* 65%All large firms (200 or more Workers) 79% 83%* 66%
regioNnortheast 81% 80% 65%midwest 74* 82 61*south 82 82 68West 81 82 67
iNDusTryagriculture/mining/Construction 78% 81% 61%manufacturing 92* 85* 79*transportation/Communications/utilities 87* 88* 76*Wholesale 80 77 63retail 60* 74* 45*finance 88* 84 74*service 78 81 63state/local Government 90* 90* 81*health Care 76 81 61
All firms 80% 82% 65%

Employer Health Benefits 2 0 0 8 An n u a l s u r vey
50
t h e k a i s e r fa m i ly f o u n d at i o n - a n d - h e a lt h r e s e a r C h & e d u C at i o n a l t r u s t
section
three
Em
ployee Coverage, E
ligibility, and Participation
3
e x h i B i t 3 .3
among Workers in firms o ffer ing health Benef its, Percentage of Workers e l igible for health Benef its o ffered by their fi rm, by firm Charac ter ist ics, 2008
e x h i B i t 3 .4
among Workers in firms o ffer ing health Benef its, Percentage of e l igible Workers Who take up health Benef its o ffered by their fi rm, by firm Charac ter ist ics, 2008
*estimates are statistically different from each other within category (p<.05).
kaiser/hret survey of employer-sponsored health Benefits, 2008.
s o u r c e :
*estimates are statistically different from each other within category (p<.05).
kaiser/hret survey of employer-sponsored health Benefits, 2008.
s o u r c e :
FIRM DOES NOT HAVE ANY UNION WORKERS
FIRM HAS AT LEAST SOME UNION WORKERS
FEW WORKERS ARE LOWER-WAGE(LESS THAN 35% EARN $22,000 A YEAR OR LESS)
MANY WORKERS ARE LOWER-WAGE (35% OR MORE EARN $22,000 A YEAR OR LESS)
FEW WORKERS ARE PART-TIME(LESS THAN 35% WORK PART-TIME)
MANY WORKERS ARE PART-TIME(35% OR MORE WORK PART-TIME)
WAGE LEVEL*
PART-TIME WORKERS*
UNIONS
35% OR MORE WORKERS ARE 26 YEARS OLD OR LESS
LESS THAN 35% OF WORKERS ARE 26 YEARS OLD OR LESS
AGE*
0% 10% 20% 30% 40% 50% 60% 70% 80% 90% 100%
81%
82%
65%
78%
49%
85%
71%
81%
FIRM DOES NOT HAVE ANY UNION WORKERS
FIRM HAS AT LEAST SOME UNION WORKERS
FEW WORKERS ARE LOWER-WAGE(LESS THAN 35% EARN $22,000 A YEAR OR LESS)
MANY WORKERS ARE LOWER-WAGE (35% OR MORE EARN $22,000 A YEAR OR LESS)
FEW WORKERS ARE PART-TIME(LESS THAN 35% WORK PART-TIME)
MANY WORKERS ARE PART-TIME(35% OR MORE WORK PART-TIME)
WAGE LEVEL*
PART-TIME WORKERS*
UNIONS*
35% OR MORE WORKERS ARE 26 YEARS OLD OR LESS
LESS THAN 35% OF WORKERS ARE 26 YEARS OLD OR LESS
AGE
0% 10% 20% 30% 40% 50% 60% 70% 80% 90% 100%
80%
82%
78%
85%
74%
83%
74%
83%
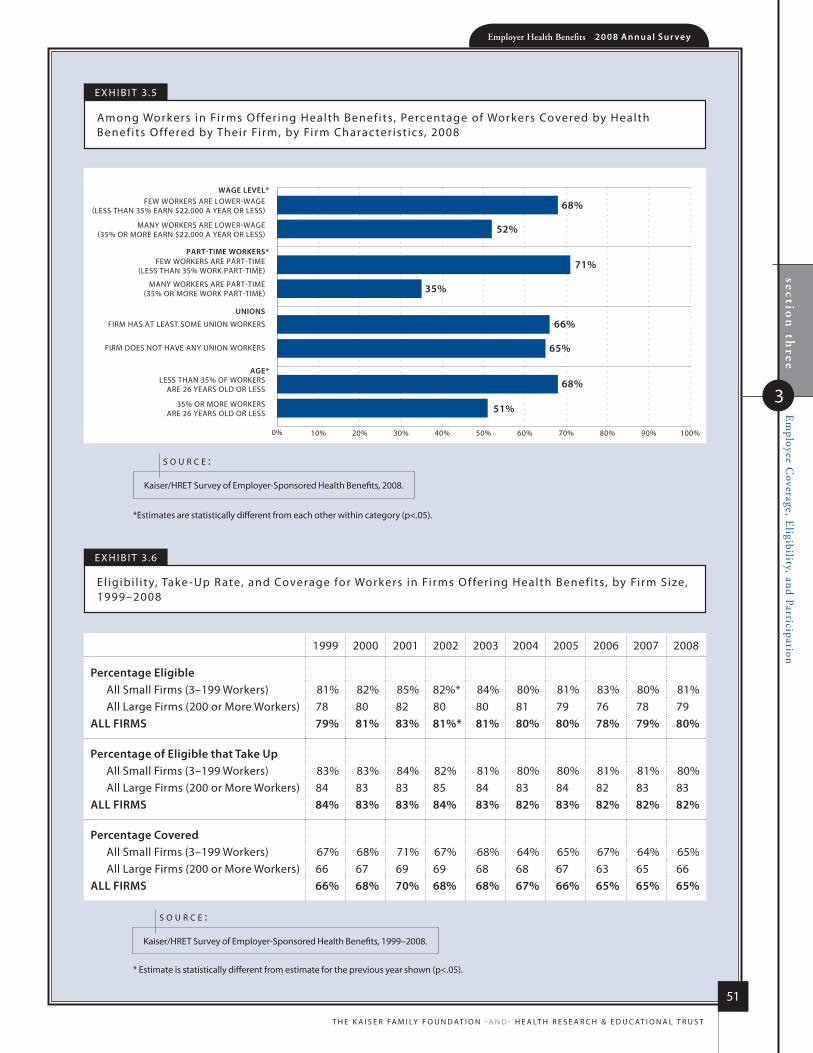
Employer Health Benefits 2 0 0 8 An n u a l s u r vey
51
t h e k a i s e r fa m i ly f o u n d at i o n - a n d - h e a lt h r e s e a r C h & e d u C at i o n a l t r u s t
section
three
Em
ployee Coverage, E
ligibility, and Participation
3
e x h i B i t 3 .5
among Workers in firms o ffer ing health Benef its, Percentage of Workers Covered by health Benef its o ffered by their fi rm, by firm Charac ter ist ics, 2008
*estimates are statistically different from each other within category (p<.05).
kaiser/hret survey of employer-sponsored health Benefits, 2008.
s o u r c e :
* estimate is statistically different from estimate for the previous year shown (p<.05).
kaiser/hret survey of employer-sponsored health Benefits, 1999–2008.
s o u r c e :
e x h i B i t 3 .6
el igibi l i ty, take -up r ate, and Coverage for Workers in firms o ffer ing health Benef its, by firm size, 1999–2008
1999 2000 2001 2002 2003 2004 2005 2006 2007 2008
percentage eligible all small firms (3–199 Workers) 81% 82% 85% 82%* 84% 80% 81% 83% 80% 81%all large firms (200 or more Workers) 78 80 82 80 80 81 79 76 78 79
All firms 79% 81% 83% 81%* 81% 80% 80% 78% 79% 80%
percentage of eligible that Take up all small firms (3–199 Workers) 83% 83% 84% 82% 81% 80% 80% 81% 81% 80%all large firms (200 or more Workers) 84 83 83 85 84 83 84 82 83 83
All firms 84% 83% 83% 84% 83% 82% 83% 82% 82% 82%
percentage Covered all small firms (3–199 Workers) 67% 68% 71% 67% 68% 64% 65% 67% 64% 65%all large firms (200 or more Workers) 66 67 69 69 68 68 67 63 65 66
All firms 66% 68% 70% 68% 68% 67% 66% 65% 65% 65%
FIRM DOES NOT HAVE ANY UNION WORKERS
FIRM HAS AT LEAST SOME UNION WORKERS
FEW WORKERS ARE LOWER-WAGE(LESS THAN 35% EARN $22,000 A YEAR OR LESS)
MANY WORKERS ARE LOWER-WAGE (35% OR MORE EARN $22,000 A YEAR OR LESS)
FEW WORKERS ARE PART-TIME(LESS THAN 35% WORK PART-TIME)
MANY WORKERS ARE PART-TIME(35% OR MORE WORK PART-TIME)
WAGE LEVEL*
PART-TIME WORKERS*
UNIONS
35% OR MORE WORKERS ARE 26 YEARS OLD OR LESS
LESS THAN 35% OF WORKERS ARE 26 YEARS OLD OR LESS
AGE*
0% 10% 20% 30% 40% 50% 60% 70% 80% 90% 100%
65%
68%
51%
66%
35%
71%
52%
68%
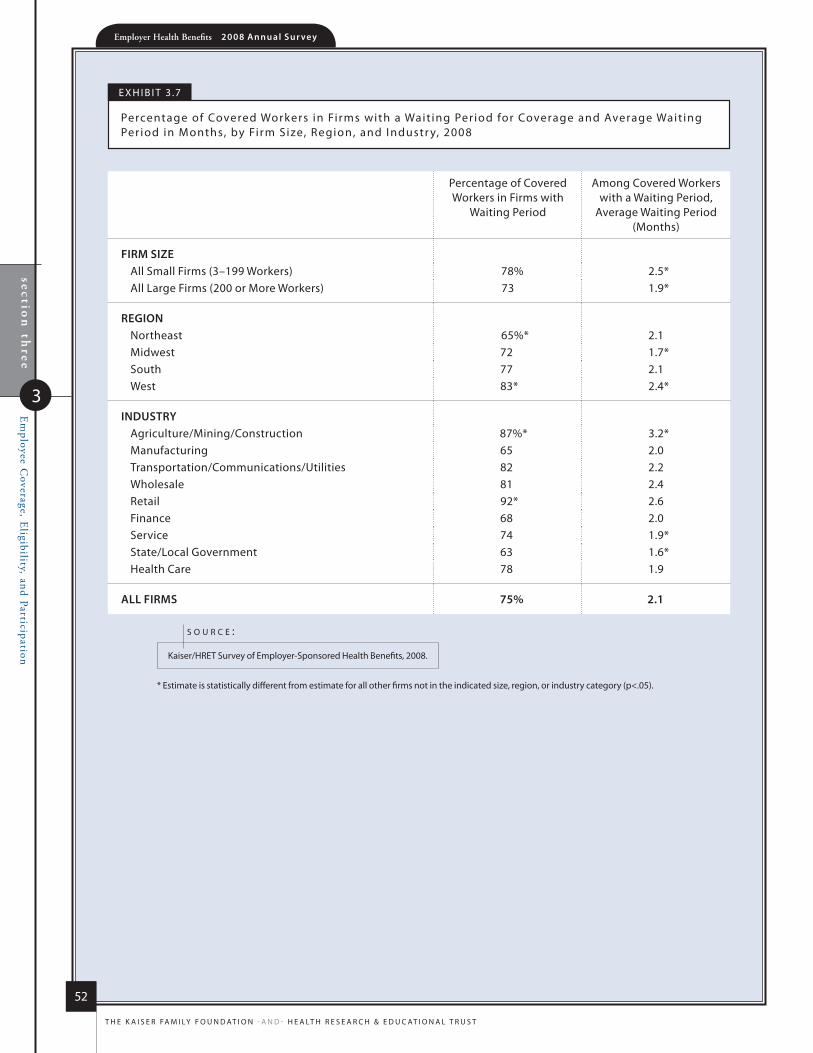
Employer Health Benefits 2 0 0 8 An n u a l s u r vey
52
t h e k a i s e r fa m i ly f o u n d at i o n - a n d - h e a lt h r e s e a r C h & e d u C at i o n a l t r u s t
section
three
Em
ployee Coverage, E
ligibility, and Participation
3
e x h i B i t 3 .7
Percentage of Covered Workers in firms with a Wait ing Per iod for Coverage and average Wait ing Per iod in months, by firm size, region, and industr y, 2008
* estimate is statistically different from estimate for all other firms not in the indicated size, region, or industry category (p<.05).
kaiser/hret survey of employer-sponsored health Benefits, 2008.
s o u r c e :
Percentage of Covered Workers in firms with
Waiting Period
among Covered Workers with a Waiting Period,
average Waiting Period (months)
firm size all small firms (3–199 Workers) 78% 2.5*all large firms (200 or more Workers) 73 1.9*
regioNnortheast 65%* 2.1midwest 72 1.7*south 77 2.1West 83* 2.4*
iNDusTry agriculture/mining/Construction 87%* 3.2*manufacturing 65 2.0transportation/Communications/utilities 82 2.2Wholesale 81 2.4retail 92* 2.6finance 68 2.0service 74 1.9*state/local Government 63 1.6*health Care 78 1.9
All firms 75% 2.1

Employer Health Benefits 2 0 0 8 An n u a l s u r vey
53
t h e k a i s e r fa m i ly f o u n d at i o n - a n d - h e a lt h r e s e a r C h & e d u C at i o n a l t r u s t
section
three
Em
ployee Coverage, E
ligibility, and Participation
3
e x h i B i t 3 .8
distr ibution of Covered Workers with the fol lowing Wait ing Per iods, 2008
*distributions are statistically different between all large firms and all small firms (p<.05).
kaiser/hret survey of employer-sponsored health Benefits, 2008.
s o u r c e :NO WAITING PERIOD
1 MONTH
2 MONTHS
3 MONTHS
4 OR MORE MONTHS
ALL LARGE FIRMS(200 OR MORE
WORKERS)*
ALL SMALL FIRMS(3−199 WORKERS)*
ALL FIRMS
0% 10% 20% 30% 40% 50% 60% 70% 80% 90% 100%
6%
4%
5%
26% 10% 35%
39% 11% 20%
34% 11% 25%
22%
27%
25%
e x h i B i t 3 .9
distr ibution of Covered Workers e lec t ing single Coverage, s ingle Plus one Coverage, or family Coverage, 2001–2008*
SINGLE COVERAGE
SINGLE PLUS ONE COVERAGE
FAMILY COVERAGE
2003
2005
2006
2008
2001
0% 10% 20% 30% 40% 50% 60% 70% 80% 90% 100%
41%14%45%
38%17%45%
39%16%45%
36%19%46%
38%18%44%
*tests found no statistical difference from distribution for previous year shown (p<.05).
note: single Plus one coverage includes either an employee plus a spouse or an employee plus a child.
kaiser/hret survey of employer-sponsored health Benefits, 2001–2008.
s o u r c e :
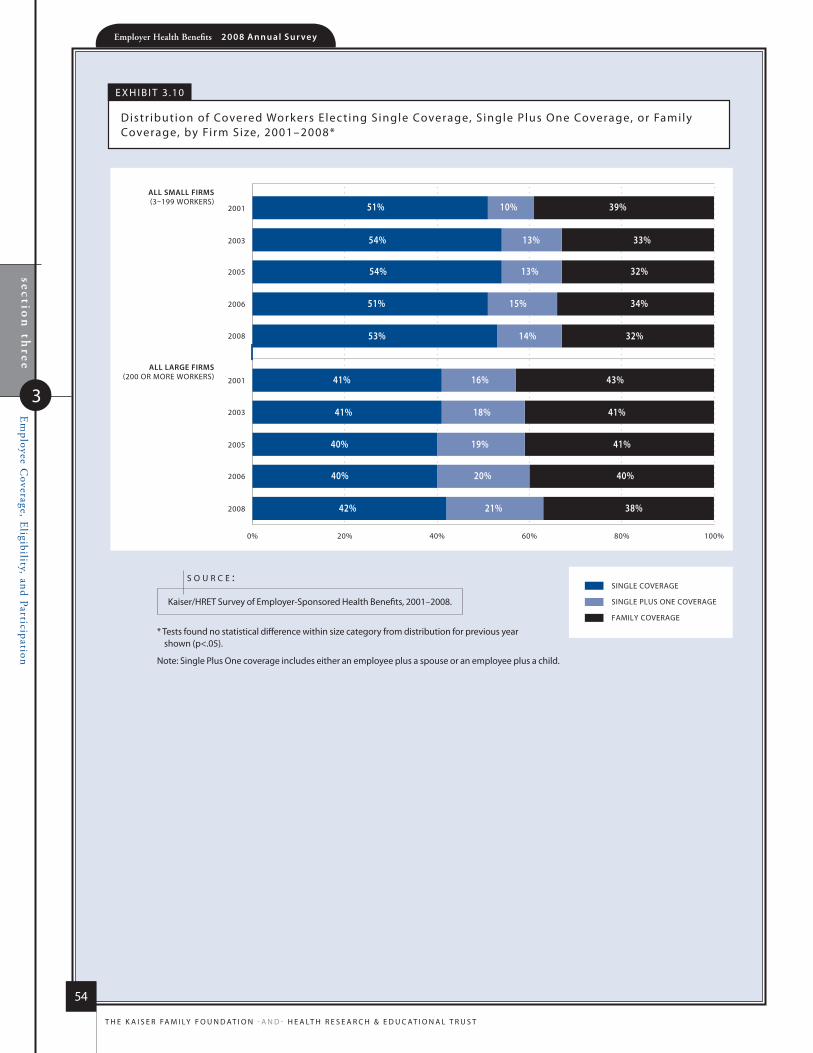
Employer Health Benefits 2 0 0 8 An n u a l s u r vey
54
t h e k a i s e r fa m i ly f o u n d at i o n - a n d - h e a lt h r e s e a r C h & e d u C at i o n a l t r u s t
section
three
Em
ployee Coverage, E
ligibility, and Participation
3
e x h i B i t 3 .10
distr ibution of Covered Workers e lec t ing single Coverage, s ingle Plus one Coverage, or family Coverage, by firm size, 2001–2008*
SINGLE COVERAGE
SINGLE PLUS ONE COVERAGE
FAMILY COVERAGE
2003
2005
2006
2008
2001
2003
2005
2006
2008
2001
ALL SMALL FIRMS (3–199 WORKERS)
ALL LARGE FIRMS (200 OR MORE WORKERS)
0% 20% 40% 60% 80% 100%
39%10%51%
32%13%54%
33%13%54%
32%14%53%
34%15%51%
43%16%41%
41%19%40%
41%18%41%
38%21%42%
40%20%40%
* tests found no statistical difference within size category from distribution for previous year shown (p<.05).
note: single Plus one coverage includes either an employee plus a spouse or an employee plus a child.
kaiser/hret survey of employer-sponsored health Benefits, 2001–2008.
s o u r c e :
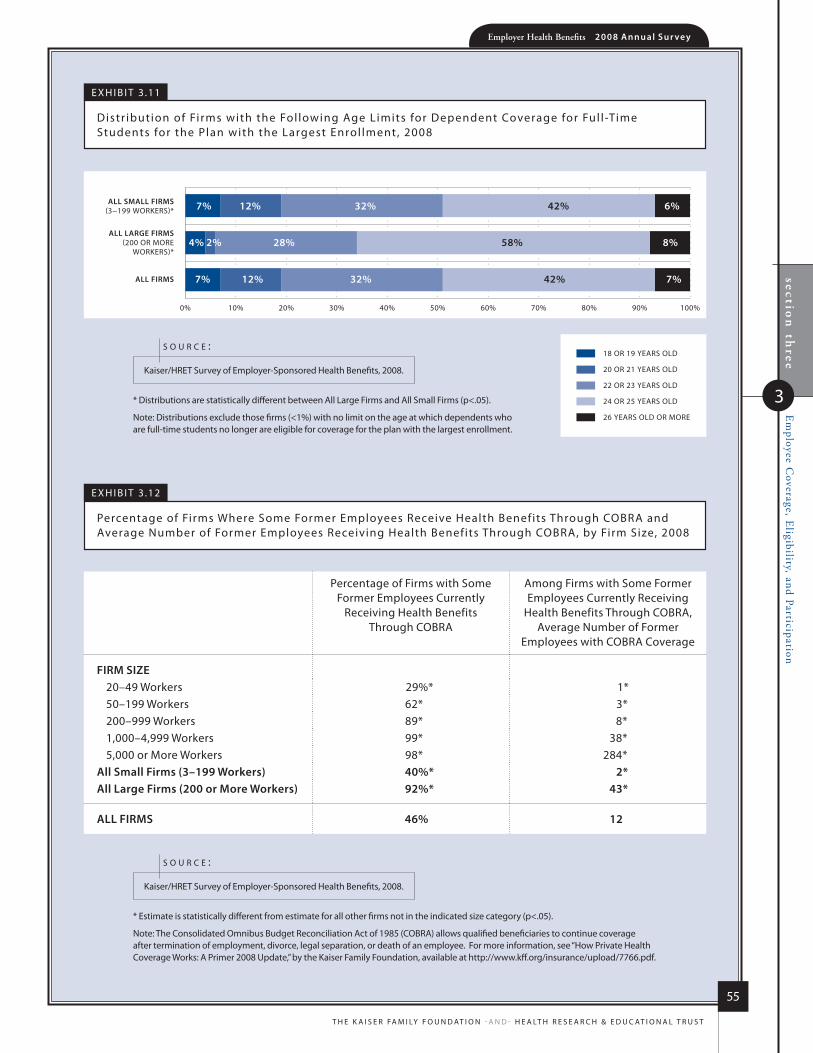
Employer Health Benefits 2 0 0 8 An n u a l s u r vey
55
t h e k a i s e r fa m i ly f o u n d at i o n - a n d - h e a lt h r e s e a r C h & e d u C at i o n a l t r u s t
section
three
Em
ployee Coverage, E
ligibility, and Participation
3
e x h i B i t 3 .11
distr ibution of fi rms with the fol lowing age limits for dependent Coverage for ful l -time students for the Plan with the largest enrol lment, 2008
e x h i B i t 3 .12
Percentage of firms Where some former employees receive health Benefits through CoBra and average number of former employees receiving health Benefits through CoBra, by firm size, 2008
* estimate is statistically different from estimate for all other firms not in the indicated size category (p<.05).
note: the Consolidated omnibus Budget reconciliation act of 1985 (CoBra) allows qualified beneficiaries to continue coverage after termination of employment, divorce, legal separation, or death of an employee. for more information, see “how Private health Coverage Works: a Primer 2008 update,” by the kaiser family foundation, available at http://www.kff.org/insurance/upload/7766.pdf.
kaiser/hret survey of employer-sponsored health Benefits, 2008.
s o u r c e :
Percentage of firms with some former employees Currently
receiving health Benefits through CoBra
among firms with some former employees Currently receiving
health Benefits through CoBra, average number of former
employees with CoBra Coverage
firm size20–49 Workers 29%* 1*50–199 Workers 62* 3*200–999 Workers 89* 8*1,000–4,999 Workers 99* 38*5,000 or more Workers 98* 284*
All small firms (3–199 Workers) 40%* 2*All large firms (200 or more Workers) 92%* 43*
All firms 46% 12
18 OR 19 YEARS OLD
20 OR 21 YEARS OLD
22 OR 23 YEARS OLD
24 OR 25 YEARS OLD
26 YEARS OLD OR MORE
ALL LARGE FIRMS(200 OR MORE
WORKERS)*
ALL SMALL FIRMS(3−199 WORKERS)*
ALL FIRMS
0% 10% 20% 30% 40% 50% 60% 70% 80% 90% 100%
6%
8%
7%
12% 32% 42%
2% 28% 58%
12% 32% 42%
7%
4%
7%
* distributions are statistically different between all large firms and all small firms (p<.05).
note: distributions exclude those firms (<1%) with no limit on the age at which dependents who are full-time students no longer are eligible for coverage for the plan with the largest enrollment.
kaiser/hret survey of employer-sponsored health Benefits, 2008.
s o u r c e :

63%$12,6
80
$4,7
04
2008
Employer Health Benefits2 0 0 8 a n n u a l s u r V e y
s ect ion
Types ofPlans
Offered
4
Employer Health Benefits 2 0 0 8 An n u a l s u r vey
sec
tion
fou
rTypes of Plans O
ffered
4
58
t h e k a i s e r fa m i ly f o u n d at i o n - a n d - h e a lt h r e s e a r C h & e d u C at i o n a l t r u s t
t y p e S o f p l a n S o f f e r e D
mosT firms ThaT offer healTh benefiTs offer only one Type of healTh plan (85%) (see TexT box). larger
firms are more likely To offer more Than one Type of healTh plan. employers are mosT likely To offer
Their workers a ppo and are leasT likely To offer a convenTional plan or an hdhp/so.
�Eighty-five percent of firms offering health benefits offer only one health plan type. Large firms (200 or more workers) are more likely to offer more than one plan type than small firms (3–199 workers): 44% of large firms do so, compared with 14% of small firms (Exhibit 4.1).
�Just over half (51%) of covered workers are employed in a firm that offers more than one health plan type. Sixty-four percent of covered workers in large firms (200 or more workers) are employed by a firm that offers more than one plan type; the comparable percentage for covered workers employed in small firms (3–199 workers) is 28% (Exhibit 4.2).
�More than three in four (77%) covered workers in firms offering health benefits work in a firm that offers one or more PPOs, 41% work in firms that offer one or more HMOs, 25% work in firms that offer one or more HDHP/SOs, 24% work in firms that offer one or more POS plans, and 8% work in firms that offer one or more conventional plans (Exhibit 4.4).
The survey asks firms how many plans of each given type they offer. However, we do not know if each plan type is offered to all covered workers at the firm. For example, some workers might be offered one type of plan at one location, while workers at another location are offered a different type of plan.
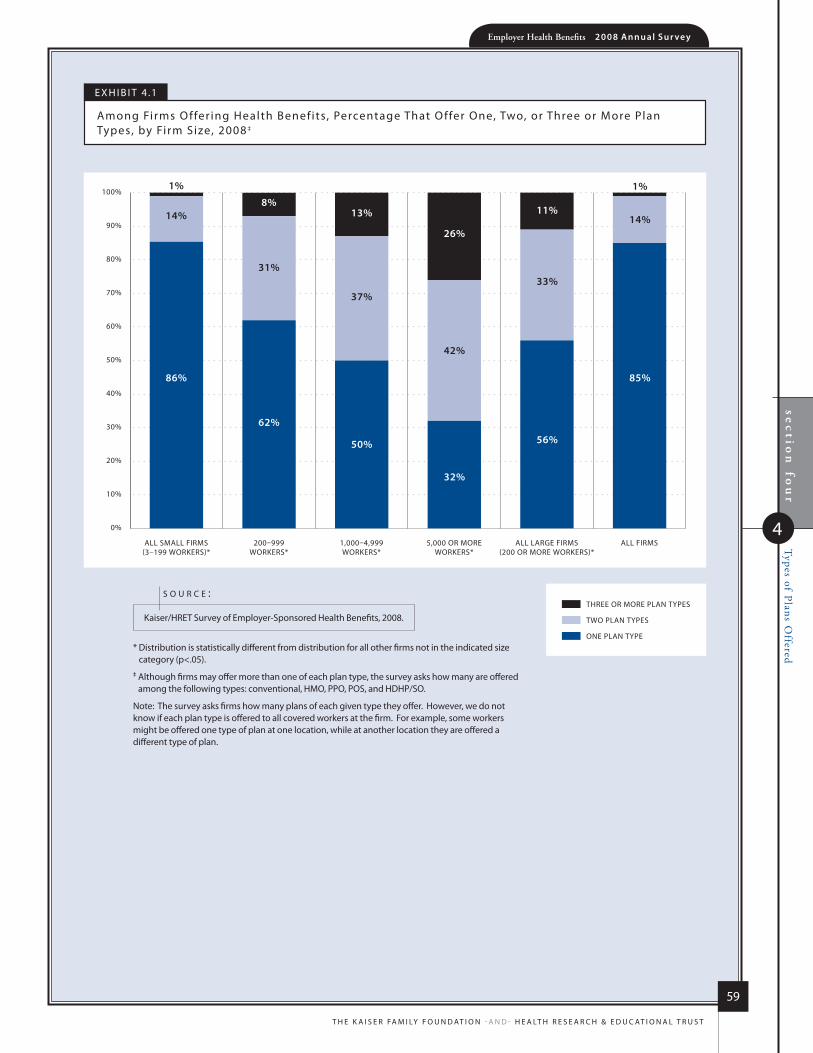
sec
tion
fou
rTypes of Plans O
fferedEmployer Health Benefits 2 0 0 8 An n u a l s u r vey
59
t h e k a i s e r fa m i ly f o u n d at i o n - a n d - h e a lt h r e s e a r C h & e d u C at i o n a l t r u s t
4
e x h i B i t 4 .1
among firms o ffer ing health Benef its, Percentage that o ffer one, two, or three or more Plan types, by firm size, 2008 ‡
200–999WORKERS*
ALL SMALL FIRMS(3–199 WORKERS)*
1,000–4,999WORKERS*
5,000 OR MOREWORKERS*
ALL LARGE FIRMS(200 OR MORE WORKERS)*
ALL FIRMS
THREE OR MORE PLAN TYPES
TWO PLAN TYPES
ONE PLAN TYPE
0%
10%
20%
30%
40%
50%
60%
70%
80%
90%
100%1%
8%13%
26%
11%
1%
14%
31%
37%
42%
33%
14%
86%
62%
50%
32%
56%
85%
* distribution is statistically different from distribution for all other firms not in the indicated size category (p<.05).
‡ although firms may offer more than one of each plan type, the survey asks how many are offered among the following types: conventional, hmo, PPo, Pos, and hdhP/so.
note: the survey asks firms how many plans of each given type they offer. however, we do not know if each plan type is offered to all covered workers at the firm. for example, some workers might be offered one type of plan at one location, while at another location they are offered a different type of plan.
kaiser/hret survey of employer-sponsored health Benefits, 2008.
s o u r c e :

Employer Health Benefits 2 0 0 8 An n u a l s u r vey
60
t h e k a i s e r fa m i ly f o u n d at i o n - a n d - h e a lt h r e s e a r C h & e d u C at i o n a l t r u s t
sec
tion
fou
rTypes of Plans O
ffered
4
e x h i B i t 4 .2
among firms o ffer ing health Benef its, Percentage of Covered Workers in firms o ffer ing one, two, or three or more Plan types, by firm size, 2008 ‡
200–999WORKERS*
ALL SMALL FIRMS(3–199 WORKERS)*
1,000–4,999WORKERS
5,000 OR MOREWORKERS*
ALL LARGE FIRMS(200 OR MORE WORKERS)*
ALL FIRMS
THREE OR MORE PLAN TYPES
TWO PLAN TYPES
ONE PLAN TYPE
0%
10%
20%
30%
40%
50%
60%
70%
80%
90%
100%3%
9%16%
36%25%
18%
25%
31%
36%
42%
38%
34%
72%
59%48%
23%
36%
49%
* distribution is statistically different from distribution for all other firms not in the indicated size category (p<.05).
‡ although firms may offer more than one of each plan type, the survey asks how many are offered among the following types: conventional, hmo, PPo, Pos, and hdhP/so.
note: the survey asks firms how many plans of each given type they offer. however, we do not know if each plan type is offered to all covered workers at the firm. for example, some workers might be offered one type of plan at one location, while at another location they are offered a different type of plan.
kaiser/hret survey of employer-sponsored health Benefits, 2008.
s o u r c e :

sec
tion
fou
rTypes of Plans O
fferedEmployer Health Benefits 2 0 0 8 An n u a l s u r vey
61
t h e k a i s e r fa m i ly f o u n d at i o n - a n d - h e a lt h r e s e a r C h & e d u C at i o n a l t r u s t
4
e x h i B i t 4 .3
among firms o ffer ing health Benef its, Percentage that o ffer the fol lowing Plan types, by firm size, 2008
e x h i B i t 4 .4
among firms o ffer ing health Benef its, Percentage of Covered Workers in firms that o ffer the fol lowing Plan types, by firm size, 2008
* estimate is statistically different within plan type from estimate for all other firms not in the indicated size category (p<.05).
note: the survey asks firms how many plans of each given type they offer. however, we do not know if each plan type is offered to all covered workers at the firm. for example, some workers might be offered one type of plan at one location, while workers at another location are offered a different type of plan.
kaiser/hret survey of employer-sponsored health Benefits, 2008.
s o u r c e :
Conventional hmo PPo Pos hdhP/so
firm sizes200–999 Workers 7% 27% 75%* 23% 15%1,000–4,999 Workers 7 35* 85* 20 20*5,000 or more Workers 8 56* 93* 17 26*
All small firms (3–199 Workers) 7% 23% 49%* 22% 13%All large firms (200 or more Workers) 7% 31% 79%* 22% 17%
All firms 7% 23% 51% 22% 13%
Conventional hmo PPo Pos hdhP/so
firm sizes200–999 Workers 5% 29%* 81% 19% 16%*1,000–4,999 Workers 6 38 87* 16* 235,000 or more Workers 14* 63* 91* 29 32*
All small firms (3–199 Workers) 3%* 26%* 58%* 23% 22%All large firms (200 or more Workers) 10%* 50%* 88%* 24% 27%
All firms 8% 41% 77% 24% 25%
63%$12,6
80
$4,7
04
2008
Employer Health Benefits2 0 0 8 a n n u a l s u r V e y
s ect ion
MarketShares of
Health Plans
5
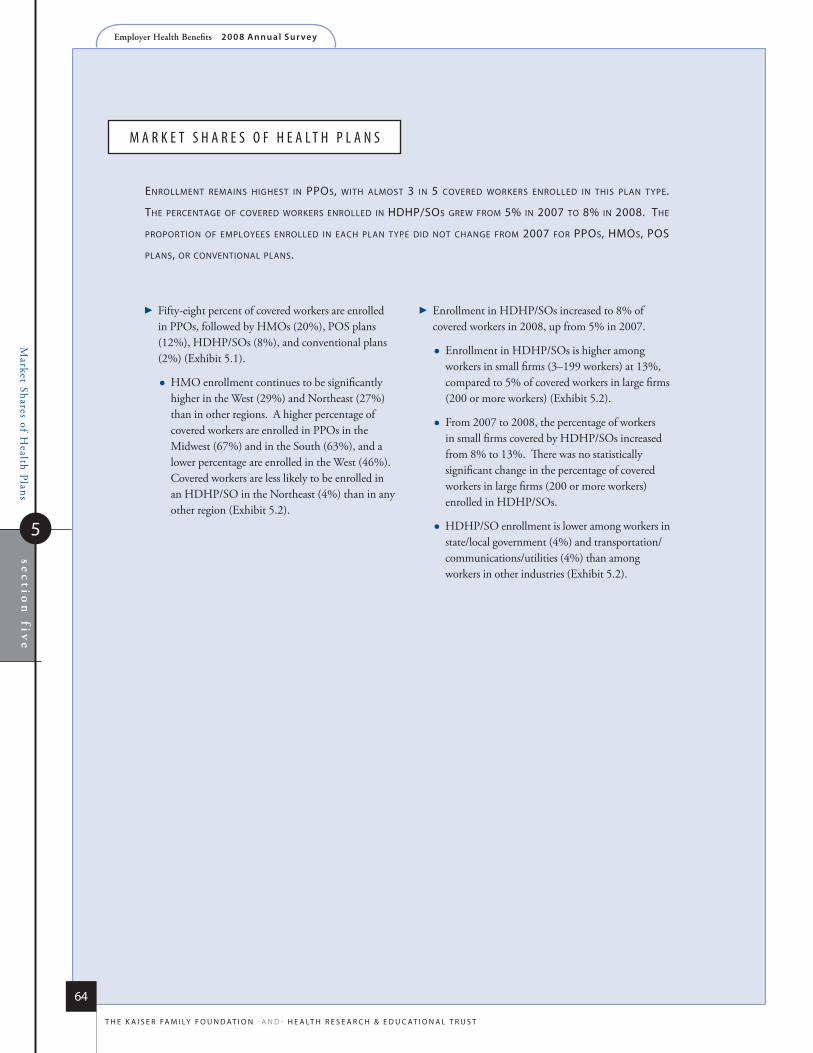
Employer Health Benefits 2 0 0 8 An n u a l s u r vey
Market Shares of H
ealth Plansse
ctio
n fiv
e
5
64
t h e k a i s e r fa m i ly f o u n d at i o n - a n d - h e a lt h r e s e a r C h & e d u C at i o n a l t r u s t
M a r k e t S h a r e S o f h e a l t h p l a n S
enrollmenT remains highesT in ppos, wiTh almosT 3 in 5 covered workers enrolled in This plan Type.
The percenTage of covered workers enrolled in hdhp/sos grew from 5% in 2007 To 8% in 2008. The
proporTion of employees enrolled in each plan Type did noT change from 2007 for ppos, hmos, pos
plans, or convenTional plans.
�Fifty-eight percent of covered workers are enrolled in PPOs, followed by HMOs (20%), POS plans (12%), HDHP/SOs (8%), and conventional plans (2%) (Exhibit 5.1).
HMO enrollment continues to be significantly higher in the West (29%) and Northeast (27%) than in other regions. A higher percentage of covered workers are enrolled in PPOs in the Midwest (67%) and in the South (63%), and a lower percentage are enrolled in the West (46%). Covered workers are less likely to be enrolled in an HDHP/SO in the Northeast (4%) than in any other region (Exhibit 5.2).
�Enrollment in HDHP/SOs increased to 8% of covered workers in 2008, up from 5% in 2007.
Enrollment in HDHP/SOs is higher among workers in small firms (3–199 workers) at 13%, compared to 5% of covered workers in large firms (200 or more workers) (Exhibit 5.2).
From 2007 to 2008, the percentage of workers in small firms covered by HDHP/SOs increased from 8% to 13%. There was no statistically significant change in the percentage of covered workers in large firms (200 or more workers) enrolled in HDHP/SOs.
HDHP/SO enrollment is lower among workers in state/local government (4%) and transportation/communications/utilities (4%) than among workers in other industries (Exhibit 5.2).
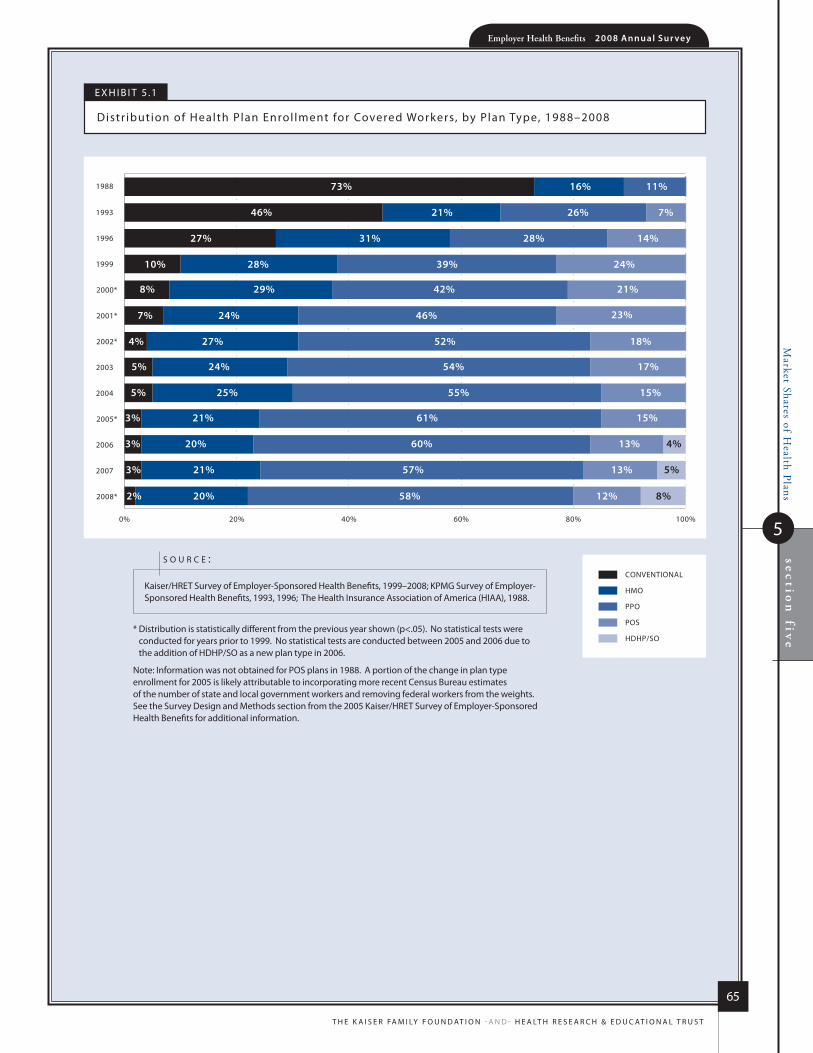
Market Shares of H
ealth PlansEmployer Health Benefits 2 0 0 8 An n u a l s u r vey
65
t h e k a i s e r fa m i ly f o u n d at i o n - a n d - h e a lt h r e s e a r C h & e d u C at i o n a l t r u s t
sec
tion
five
5
e x h i B i t 5 .1
distr ibution of health Plan enrol lment for Covered Workers, by Plan type, 1988–2008
CONVENTIONAL
HMO
PPO
POS
HDHP/SO
0% 20% 40% 60% 80% 100%
1988
1993
1996
1999
2000*
2001*
2002*
2003
2004
2005*
2006
2007
2008*
31% 28% 14%
73%
46%
27%
10%
8%
7%
4%
5% 24% 54% 17%
5% 25% 55% 15%
3% 21% 61% 15%
3% 20% 60% 13% 4%
3% 21% 57% 13% 5%
2% 20% 58% 12% 8%
27% 52% 18%
24% 46% 23%
29% 42% 21%
28% 39% 24%
21% 26% 7%
16% 11%
* distribution is statistically different from the previous year shown (p<.05). no statistical tests were conducted for years prior to 1999. no statistical tests are conducted between 2005 and 2006 due to the addition of hdhP/so as a new plan type in 2006.
note: information was not obtained for Pos plans in 1988. a portion of the change in plan type enrollment for 2005 is likely attributable to incorporating more recent Census Bureau estimates of the number of state and local government workers and removing federal workers from the weights. see the survey design and methods section from the 2005 kaiser/hret survey of employer-sponsored health Benefits for additional information.
kaiser/hret survey of employer-sponsored health Benefits, 1999–2008; kPmG survey of employer-sponsored health Benefits, 1993, 1996; the health insurance association of america (hiaa), 1988.
s o u r c e :
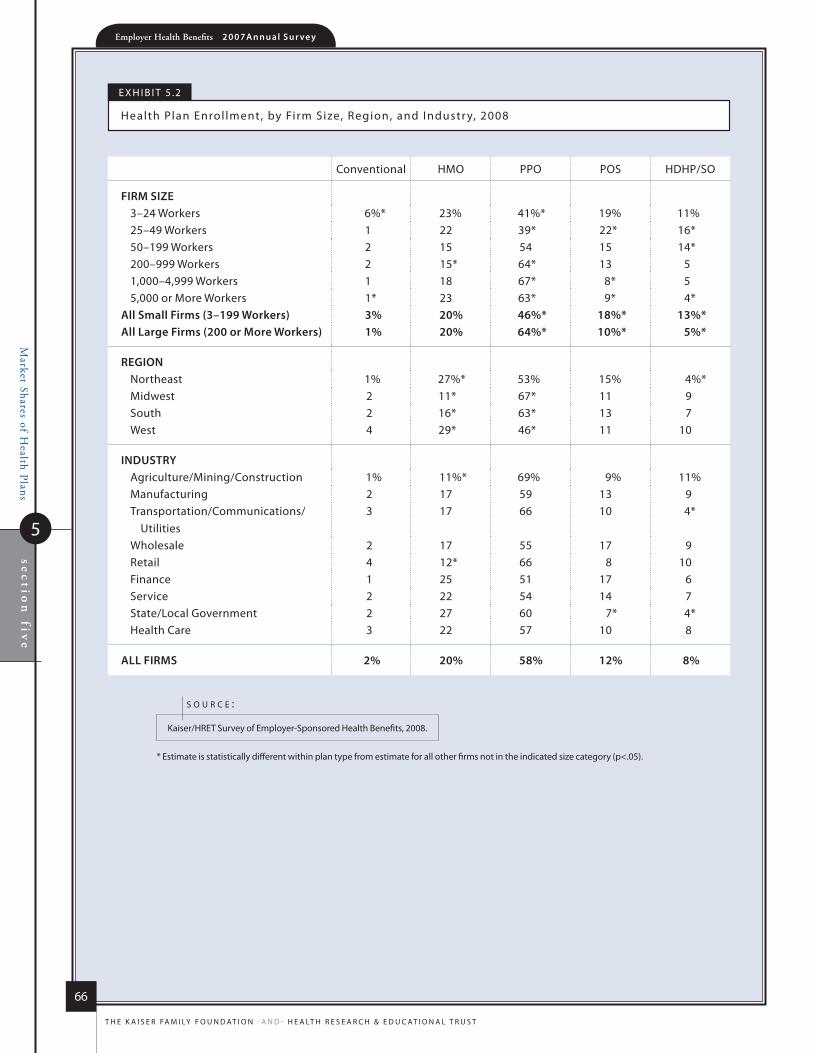
Market Shares of H
ealth Plans
Employer Health Benefits 2 0 0 7 An n u a l s u r vey
66
t h e k a i s e r fa m i ly f o u n d at i o n - a n d - h e a lt h r e s e a r C h & e d u C at i o n a l t r u s t
sec
tion
five
5
e x h i B i t 5 .2
health Plan enrol lment, by firm size, region, and industr y, 2008
* estimate is statistically different within plan type from estimate for all other firms not in the indicated size category (p<.05).
kaiser/hret survey of employer-sponsored health Benefits, 2008.
s o u r c e :
Conventional hmo PPo Pos hdhP/so
firm size 3–24 Workers 6%* 23% 41%* 19% 11%25–49 Workers 1 22 39* 22* 16*50–199 Workers 2 15 54 15 14*200–999 Workers 2 15* 64* 13 51,000–4,999 Workers 1 18 67* 8* 55,000 or more Workers 1* 23 63* 9* 4*
All small firms (3–199 Workers) 3% 20% 46%* 18%* 13%*All large firms (200 or more Workers) 1% 20% 64%* 10%* 5%*
regioNnortheast 1% 27%* 53% 15% 4%*midwest 2 11* 67* 11 9south 2 16* 63* 13 7West 4 29* 46* 11 10
iNDusTry agriculture/mining/Construction 1% 11%* 69% 9% 11%manufacturing 2 17 59 13 9transportation/Communications/ utilities
3 17 66 10 4*
Wholesale 2 17 55 17 9retail 4 12* 66 8 10finance 1 25 51 17 6service 2 22 54 14 7state/local Government 2 27 60 7* 4*health Care 3 22 57 10 8
All firms 2% 20% 58% 12% 8%

63%$12,6
80
$4,7
04
2008
Employer Health Benefits2 0 0 8 a n n u a l s u r V e y
s ect ion
Worker and Employer
Contributions for Premiums
6

Worker and E
mployer C
ontributions for Premium
sse
ctio
n six
6
Employer Health Benefits 2 0 0 8 An n u a l s u r vey
68
t h e k a i s e r fa m i ly f o u n d at i o n - a n d - h e a lt h r e s e a r C h & e d u C at i o n a l t r u s t
W o r k e r a n D e M p l o y e r C o n t r i B u t i o n S f o r p r e M i u M S
The percenTage of The premium paid by workers wiTh healTh insurance remains similar To The percenTages
reporTed in 2007 for boTh single and family coverage.1 The average monThly worker conTribuTions are
$60 for single coverage and $280 for family coverage.
In 2008, covered workers on average contribute 16% of the premium for single coverage and 27% of the premium for family coverage (Exhibit 6.1). These percentages have remained stable over the last several years.
The average monthly worker contributions for single and family coverage were similar to the amounts reported in 2007.
On average, workers with single coverage contribute $60 per month to the cost of their health insurance premiums and workers with family coverage contribute $280 per month in 2008. These contributions are statistically unchanged from the $58 and $273 reported in 2007 (Exhibit 6.2). However, since 1999, the average worker contribution has more than doubled for both single and family coverage.
Annually, the average worker contribution is $721 for single coverage and $3,354 for family coverage (Exhibit 6.5). Workers enrolled in HDHP/SOs for single coverage contribute a lower amount annually ($468) than the overall average worker contribution ($721). The difference between the average contribution for those enrolled in HDHP/SOs for family coverage and the overall average family contribution is not statistically different (Exhibit 6.5).
For single coverage, workers in small firms (3–199 workers) contribute an annual amount of $624, which is significantly less than the $769 contributed by workers in large firms (200 or more workers) (Exhibit 6.6). In contrast, workers with family coverage in small firms contribute
significantly more annually than workers with family coverage in large firms, at $4,101 and $2,982, respectively (Exhibit 6.7).
The majority of covered workers are employed by a firm that contributes at least half of the premium (Exhibit 6.11).
Twenty percent of workers with single coverage and 7% of workers with family coverage work for a firm that pays 100% of the premium (Exhibit 6.11).
Like last year, covered workers in small firms (3–199 workers) are more likely to work for a firm that pays 100% of the premium than workers in large firms (200 or more workers). In small firms, 40% of covered workers have an employer that pays the full premium for single coverage, compared to 10% of covered workers in large firms (Exhibit 6.12). For family coverage, 13% percent of covered workers in small firms have an employer that pays the full premium for family coverage, compared to 4% of covered workers in large firms (Exhibit 6.13).
For those workers who are responsible for a portion of the premium, covered workers in small firms (3–199 workers) are more likely to have to pay more than 50% of the premium than workers in large firms (200 or more workers). For single coverage, 5% of workers in small firms contribute more than 50% of the premium, compared to 1% in large firms (Exhibit 6.12). The disparity is greater for family coverage with 30% of workers in small firms contributing more than 50% of the premium, compared to 6% in large firms (Exhibit 6.13).
1 estimates for premiums, worker contributions to premiums, and employer contributions to premiums presented in section 6 do not include contributions made by the employer to health savings accounts or health reimbursement arrangements. see section 8 for estimates of employer contributions to hsas and hras.
n o T e :
sec
tion
sixW
orker and Em
ployer Contributions for Prem
iums
6
Employer Health Benefits 2 0 0 8 An n u a l s u r vey
69
t h e k a i s e r fa m i ly f o u n d at i o n - a n d - h e a lt h r e s e a r C h & e d u C at i o n a l t r u s t
2 for definitions of self-funded and fully insured plans, see the introduction to section 10.
n o T e :
The percentage of the premium paid by covered workers varies by several firm characteristics.
For single coverage, workers in firms that are partially or completely self-funded contribute a greater percentage of the premium than those in firms that are fully insured (17% vs. 14%) (Exhibit 6.14). In contrast, workers with family coverage in firms that are partially or completely self-funded contribute a significantly lower percentage of the premium than those in firms that are fully insured (23% vs. 33%) (Exhibit 6.15).2
For family coverage, workers in firms with a higher proportion of lower-wage workers (where 35% or more earn $22,000 or less annually) contribute a greater percentage of the premium than those in firms with a lower proportion of lower-wage workers (where fewer than 35% earn $22,000 or less annually) (34% vs. 26%) (Exhibit 6.15).
Workers with family coverage in firms that have at least some union workers contribute a significantly lower percentage of the premium than those in firms without any union workers (20% vs. 31%) (Exhibit 6.15).
Some workers are employed by firms that vary premium contributions by workers’ wages.
Ten percent of covered workers are in firms that vary worker premium contributions by wage level, the same percentage as in 2007. Workers in large firms (200 or more workers) are more likely to be employed by a firm that varies contributions by wage than workers in small firms (3–199 workers) (14% vs. 2%) (Exhibit 6.20).
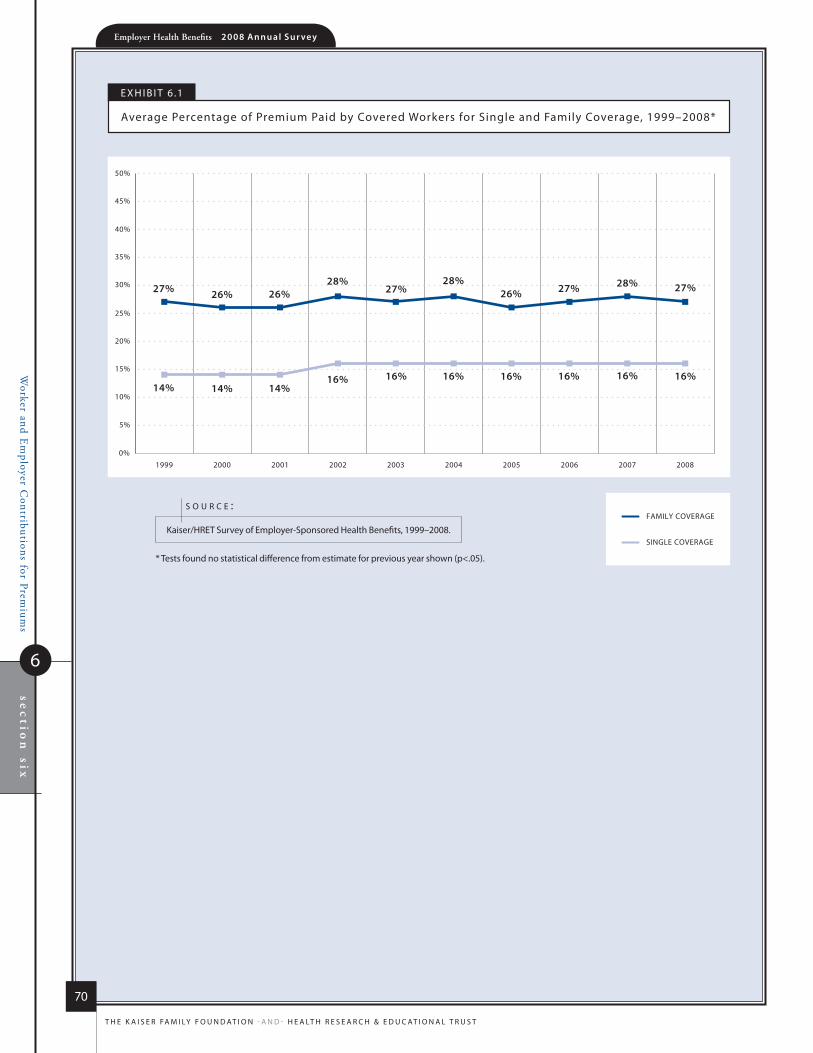
Worker and E
mployer C
ontributions for Premium
sse
ctio
n six
6
Employer Health Benefits 2 0 0 8 An n u a l s u r vey
70
t h e k a i s e r fa m i ly f o u n d at i o n - a n d - h e a lt h r e s e a r C h & e d u C at i o n a l t r u s t
FAMILY COVERAGE
SINGLE COVERAGE
1999 2000 2001 2002 2003 2004 2005 2006 2007 20080%
5%
10%
15%
20%
25%
30%
35%
40%
45%
50%
27%
14%
26%
14%
26%
14%
28%
16%
27%
16%
28%
16%
26%
16%
27%
16%
28%
16%
27%
16%
e x h i B i t 6 .1
average Percentage of Premium Paid by Covered Workers for single and family Coverage, 1999–2008*
* tests found no statistical difference from estimate for previous year shown (p<.05).
kaiser/hret survey of employer-sponsored health Benefits, 1999–2008.
s o u r c e :
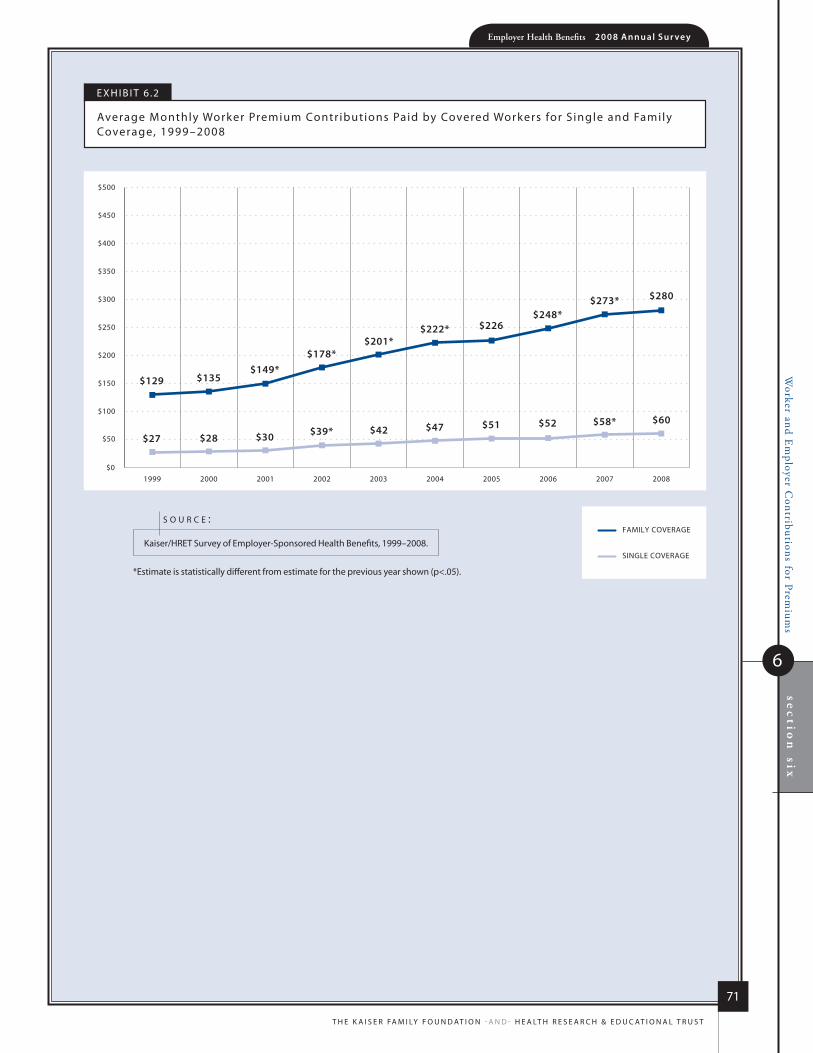
sec
tion
sixW
orker and Em
ployer Contributions for Prem
iums
6
Employer Health Benefits 2 0 0 8 An n u a l s u r vey
71
t h e k a i s e r fa m i ly f o u n d at i o n - a n d - h e a lt h r e s e a r C h & e d u C at i o n a l t r u s t
FAMILY COVERAGE
SINGLE COVERAGE
1999 2000 2001 2002 2003 2004 2005 2006 2007 2008$0
$50
$100
$150
$200
$250
$300
$350
$400
$450
$500
$129
$27
$135
$28
$149*
$30
$178*
$39*
$201*
$42
$222*
$47
$226
$51
$248*
$52
$273*
$58*
$280
$60
e x h i B i t 6 .2
average monthly Worker Premium Contr ibutions Paid by Covered Workers for s ingle and family Coverage, 1999–2008
*estimate is statistically different from estimate for the previous year shown (p<.05).
kaiser/hret survey of employer-sponsored health Benefits, 1999–2008.
s o u r c e :
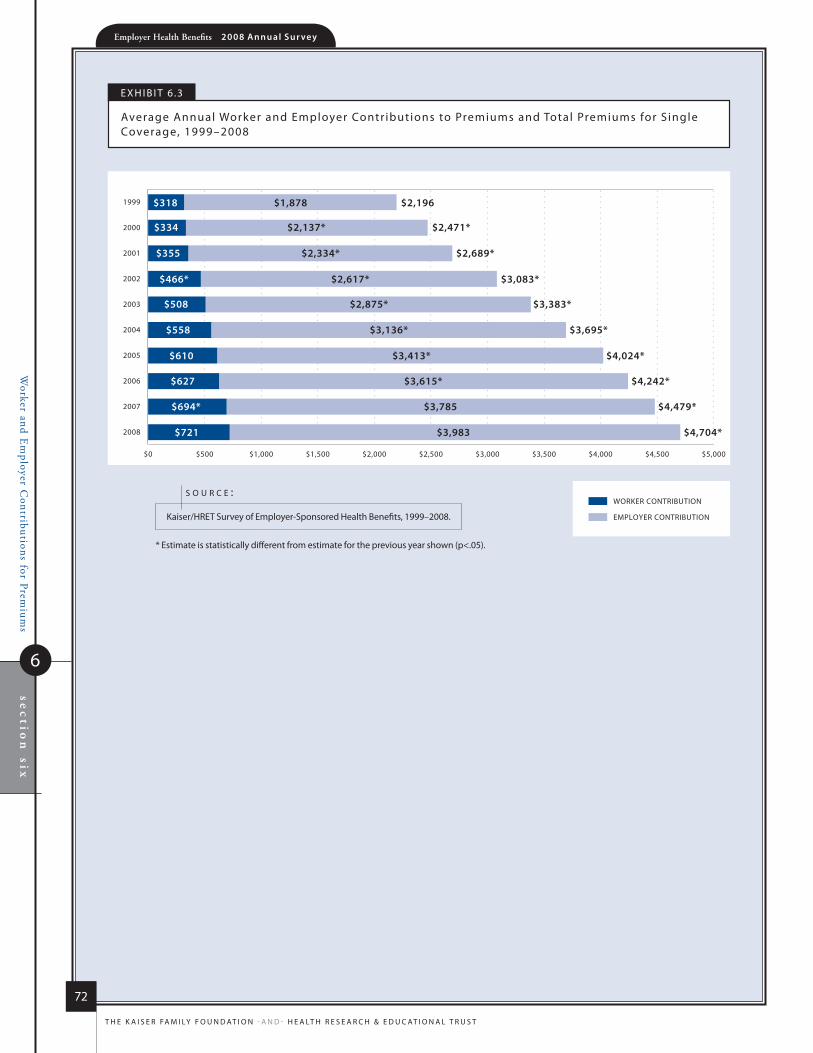
Worker and E
mployer C
ontributions for Premium
sse
ctio
n six
6
Employer Health Benefits 2 0 0 8 An n u a l s u r vey
72
t h e k a i s e r fa m i ly f o u n d at i o n - a n d - h e a lt h r e s e a r C h & e d u C at i o n a l t r u s t
2004
2007
2008
2000
2001
2002
2003
2005
2006
1999
WORKER CONTRIBUTION
EMPLOYER CONTRIBUTION
$0 $500 $1,000 $1,500 $2,000 $2,500 $3,000 $3,500 $4,000 $4,500 $5,000
$318 $1,878 $2,196
$334 $2,137* $2,471*
$355 $2,334* $2,689*
$466* $2,617* $3,083*
$508 $2,875* $3,383*
$558 $3,136* $3,695*
$610 $3,413* $4,024*
$627 $3,615* $4,242*
$694* $3,785 $4,479*
$721 $3,983 $4,704*
e x h i B i t 6 .3
average annual Worker and employer Contr ibutions to Premiums and total Premiums for s ingle Coverage, 1999–2008
* estimate is statistically different from estimate for the previous year shown (p<.05).
kaiser/hret survey of employer-sponsored health Benefits, 1999–2008.
s o u r c e :

sec
tion
sixW
orker and Em
ployer Contributions for Prem
iums
6
Employer Health Benefits 2 0 0 8 An n u a l s u r vey
73
t h e k a i s e r fa m i ly f o u n d at i o n - a n d - h e a lt h r e s e a r C h & e d u C at i o n a l t r u s t
2004
2007
2008
2000
2001
2002
2003
2005
2006
1999
WORKER CONTRIBUTION
EMPLOYER CONTRIBUTION
$0 $2,000 $4,000 $6,000 $8,000 $10,000 $12,000 $14,000
$1,543 $4,247 $5,791
$1,619 $4,819* $6,438*
$1,787* $5,269* $7,061*
$2,137* $5,866* $8,003*
$2,412* $6,657* $9,068*
$2,661* $7,289* $9,950*
$2,713 $8,167* $10,880*
$2,973* $8,508* $11,480*
$3,281* $8,824 $12,106*
$3,354 $9,325* $12,680*
e x h i B i t 6 .4
average annual Worker and employer Contr ibutions to Premiums and total Premiums for family Coverage, 1999–2008
* estimate is statistically different from estimate for the previous year shown (p<.05).
kaiser/hret survey of employer-sponsored health Benefits, 1999–2008.
s o u r c e :

Worker and E
mployer C
ontributions for Premium
sse
ctio
n six
6
Employer Health Benefits 2 0 0 8 An n u a l S u r vey
74
T h e K a i s e r Fa m i ly F o u n d aT i o n - a n d - h e a lT h r e s e a r c h & e d u c aT i o n a l T r u s T
$0 $2,000 $4,000 $6,000 $8,000 $10,000 $12,000 $14,000
SINGLEHMO
FAMILY
ALL PLANS
HDHP/SO
SINGLE
FAMILY
PPOSINGLE
FAMILY
POS
SINGLE
SINGLE
FAMILY
FAMILY
$705 $4,049 $4,754
$3,380 $13,122$9,742
$721 $3,983
$731
$865
$3,730
$3,783
$8,600
$4,071
$12,937
$12,330
$10,121*
$12,680
$3,922*
$3,354 $9,325
$3,344
$4,802
$4,647
$9,593
$468*
$2,813 $7,309*
$4,704
WORKER CONTRIBUTION
EMPLOYER CONTRIBUTION
$3,454*
e x h i b i T 6 .5
average annual Fi rm and Worker Premium contr ibutions and Total Premiums for covered Workers for s ingle and Family coverage, by Plan Type, 2008
* estimate is statistically different from all Plans estimate by coverage type (p<.05).
Kaiser/hreT survey of employer-sponsored health benefits, 2008.
s o u r c e :
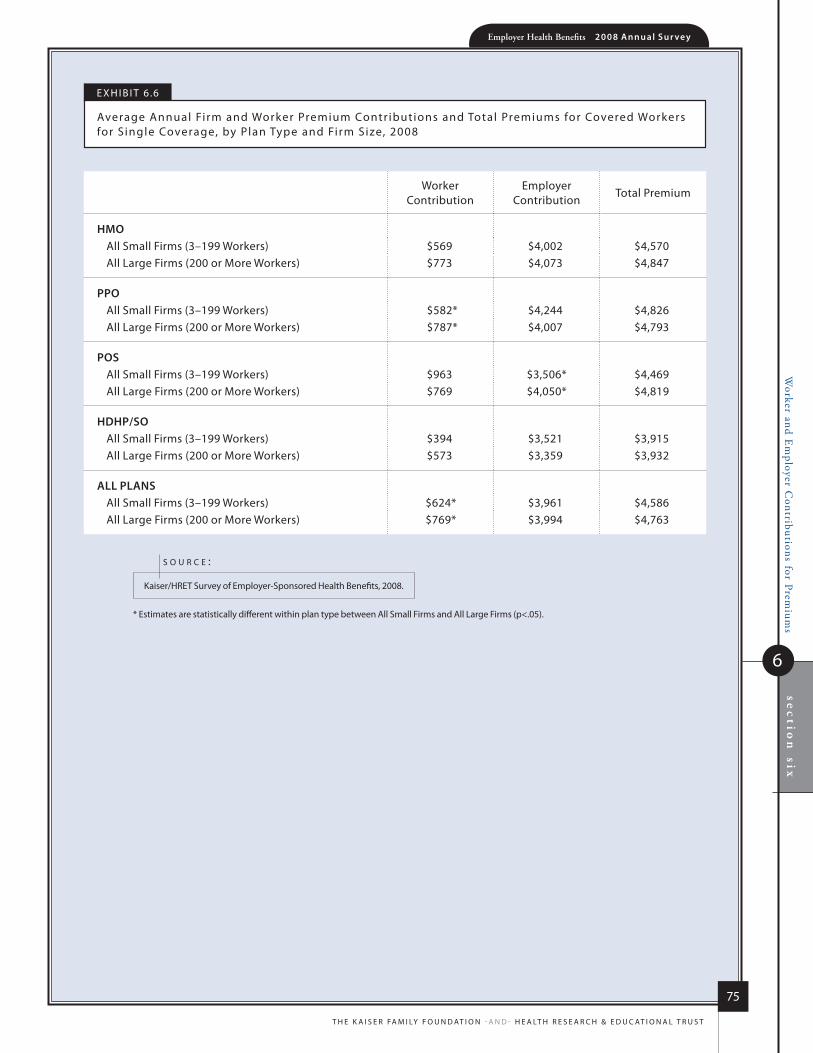
sec
tion
sixW
orker and Em
ployer Contributions for Prem
iums
6
Employer Health Benefits 2 0 0 8 An n u a l s u r vey
75
t h e k a i s e r fa m i ly f o u n d at i o n - a n d - h e a lt h r e s e a r C h & e d u C at i o n a l t r u s t
Worker
Contributionemployer
Contributiontotal Premium
hmoall small firms (3–199 Workers) $569 $4,002 $4,570 all large firms (200 or more Workers) $773 $4,073 $4,847
ppoall small firms (3–199 Workers) $582* $4,244 $4,826 all large firms (200 or more Workers) $787* $4,007 $4,793
posall small firms (3–199 Workers) $963 $3,506* $4,469 all large firms (200 or more Workers) $769 $4,050* $4,819
hDhp/soall small firms (3–199 Workers) $394 $3,521 $3,915 all large firms (200 or more Workers) $573 $3,359 $3,932
All plANsall small firms (3–199 Workers) $624* $3,961 $4,586 all large firms (200 or more Workers) $769* $3,994 $4,763
e x h i B i t 6 .6
average annual fi rm and Worker Premium Contr ibutions and total Premiums for Covered Workers for s ingle Coverage, by Plan type and firm size, 2008
* estimates are statistically different within plan type between all small firms and all large firms (p<.05).
kaiser/hret survey of employer-sponsored health Benefits, 2008.
s o u r c e :
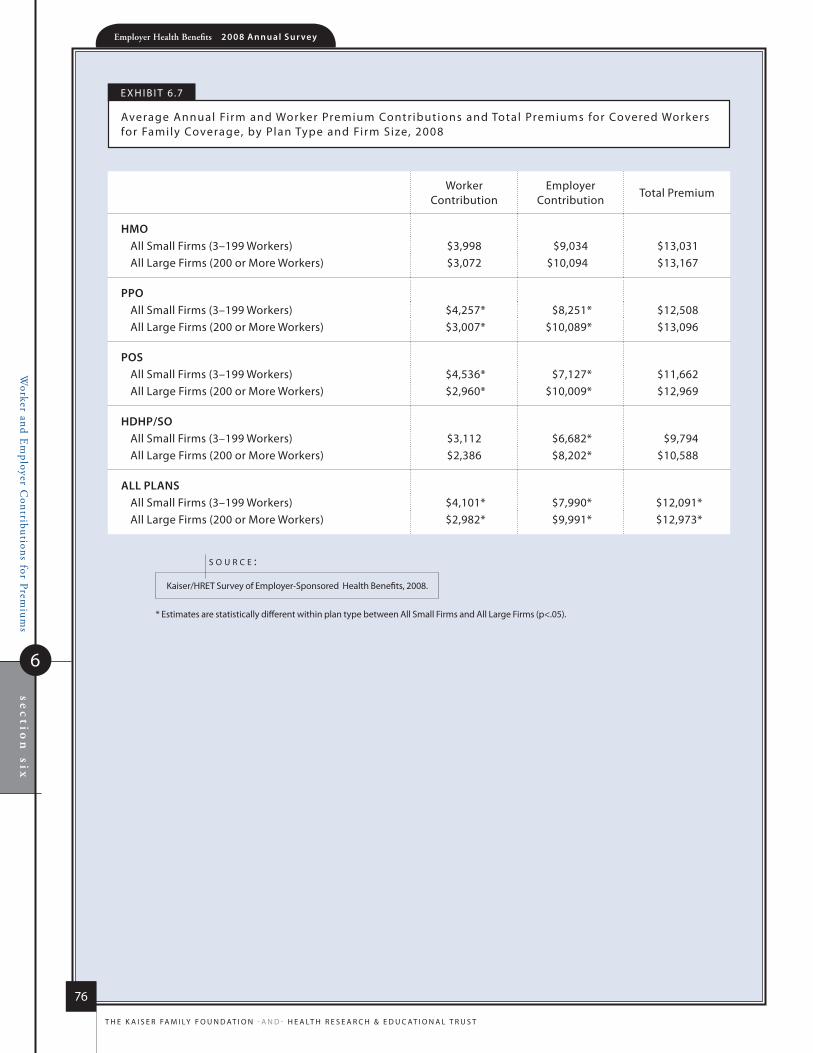
Worker and E
mployer C
ontributions for Premium
sse
ctio
n six
6
Employer Health Benefits 2 0 0 8 An n u a l s u r vey
76
t h e k a i s e r fa m i ly f o u n d at i o n - a n d - h e a lt h r e s e a r C h & e d u C at i o n a l t r u s t
Worker
Contributionemployer
Contributiontotal Premium
hmoall small firms (3–199 Workers) $3,998 $9,034 $13,031 all large firms (200 or more Workers) $3,072 $10,094 $13,167
ppoall small firms (3–199 Workers) $4,257* $8,251* $12,508 all large firms (200 or more Workers) $3,007* $10,089* $13,096
posall small firms (3–199 Workers) $4,536* $7,127* $11,662 all large firms (200 or more Workers) $2,960* $10,009* $12,969
hDhp/soall small firms (3–199 Workers) $3,112 $6,682* $9,794 all large firms (200 or more Workers) $2,386 $8,202* $10,588
All plANsall small firms (3–199 Workers) $4,101* $7,990* $12,091*all large firms (200 or more Workers) $2,982* $9,991* $12,973*
e x h i B i t 6 .7
average annual fi rm and Worker Premium Contr ibutions and total Premiums for Covered Workers for family Coverage, by Plan type and firm size, 2008
* estimates are statistically different within plan type between all small firms and all large firms (p<.05).
kaiser/hret survey of employer-sponsored health Benefits, 2008.
s o u r c e :
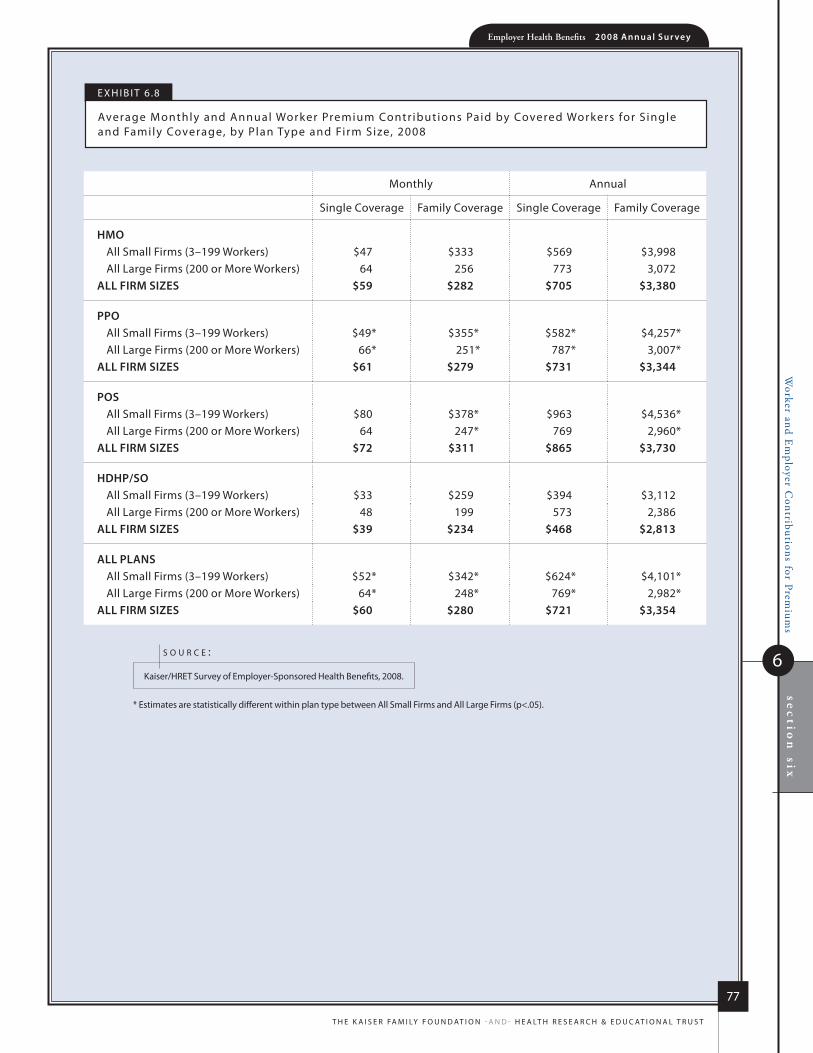
sec
tion
sixW
orker and Em
ployer Contributions for Prem
iums
6
Employer Health Benefits 2 0 0 8 An n u a l s u r vey
77
t h e k a i s e r fa m i ly f o u n d at i o n - a n d - h e a lt h r e s e a r C h & e d u C at i o n a l t r u s t
e x h i B i t 6 .8
average monthly and annual Worker Premium Contr ibutions Paid by Covered Workers for s ingle and family Coverage, by Plan type and firm size, 2008
monthly annual
single Coverage family Coverage single Coverage family Coverage
hmo all small firms (3–199 Workers) $47 $333 $569 $3,998 all large firms (200 or more Workers) 64 256 773 3,072
All firm sizes $59 $282 $705 $3,380
ppo all small firms (3–199 Workers) $49* $355* $582* $4,257*all large firms (200 or more Workers) 66* 251* 787* 3,007*
All firm sizes $61 $279 $731 $3,344
pos all small firms (3–199 Workers) $80 $378* $963 $4,536*all large firms (200 or more Workers) 64 247* 769 2,960*
All firm sizes $72 $311 $865 $3,730
hDhp/soall small firms (3–199 Workers) $33 $259 $394 $3,112 all large firms (200 or more Workers) 48 199 573 2,386
All firm sizes $39 $234 $468 $2,813
All plANsall small firms (3–199 Workers) $52* $342* $624* $4,101*all large firms (200 or more Workers) 64* 248* 769* 2,982*
All firm sizes $60 $280 $721 $3,354
* estimates are statistically different within plan type between all small firms and all large firms (p<.05).
kaiser/hret survey of employer-sponsored health Benefits, 2008.
s o u r c e :
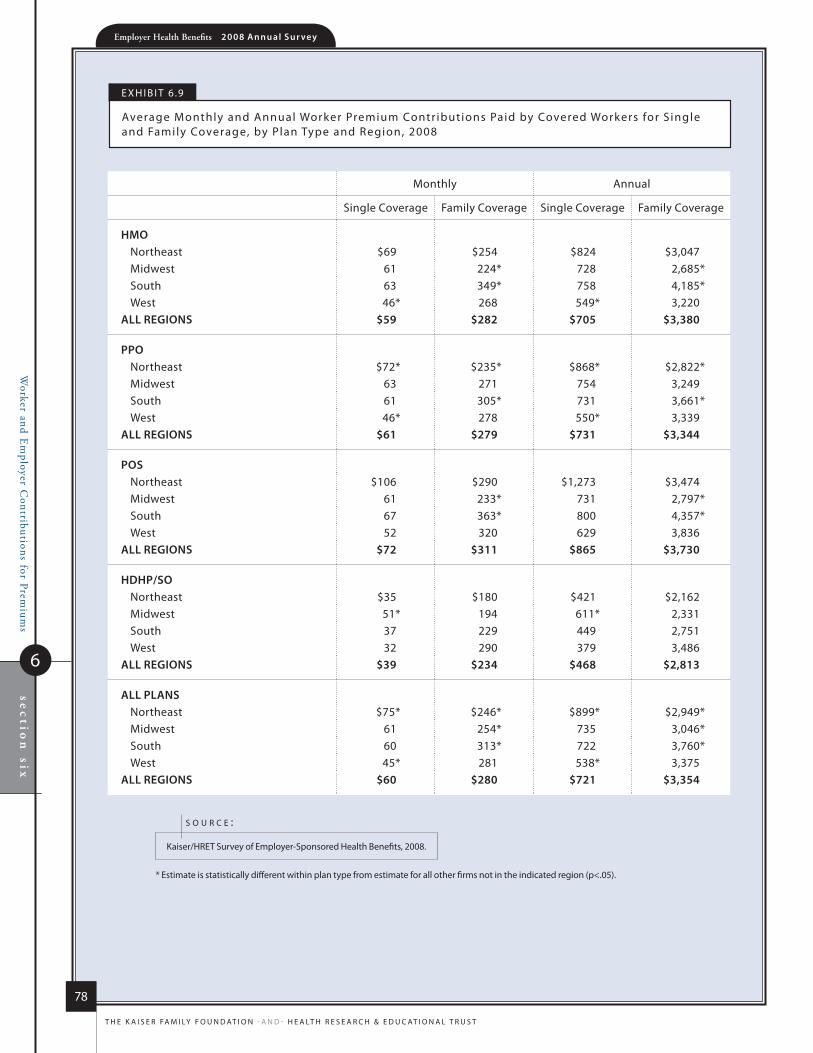
Worker and E
mployer C
ontributions for Premium
sse
ctio
n six
6
Employer Health Benefits 2 0 0 8 An n u a l s u r vey
78
t h e k a i s e r fa m i ly f o u n d at i o n - a n d - h e a lt h r e s e a r C h & e d u C at i o n a l t r u s t
e x h i B i t 6 .9
average monthly and annual Worker Premium Contr ibutions Paid by Covered Workers for s ingle and family Coverage, by Plan type and region, 2008
monthly annual
single Coverage family Coverage single Coverage family Coverage
hmonortheast $69 $254 $824 $3,047 midwest 61 224* 728 2,685*south 63 349* 758 4,185*West 46* 268 549* 3,220
All regioNs $59 $282 $705 $3,380
pponortheast $72* $235* $868* $2,822*midwest 63 271 754 3,249south 61 305* 731 3,661*West 46* 278 550* 3,339
All regioNs $61 $279 $731 $3,344
posnortheast $106 $290 $1,273 $3,474 midwest 61 233* 731 2,797*south 67 363* 800 4,357*West 52 320 629 3,836
All regioNs $72 $311 $865 $3,730
hDhp/sonortheast $35 $180 $421 $2,162 midwest 51* 194 611* 2,331south 37 229 449 2,751West 32 290 379 3,486
All regioNs $39 $234 $468 $2,813
All plANsnortheast $75* $246* $899* $2,949*midwest 61 254* 735 3,046*south 60 313* 722 3,760*West 45* 281 538* 3,375
All regioNs $60 $280 $721 $3,354
* estimate is statistically different within plan type from estimate for all other firms not in the indicated region (p<.05).
kaiser/hret survey of employer-sponsored health Benefits, 2008.
s o u r c e :

sec
tion
sixW
orker and Em
ployer Contributions for Prem
iums
6
Employer Health Benefits 2 0 0 8 An n u a l s u r vey
79
t h e k a i s e r fa m i ly f o u n d at i o n - a n d - h e a lt h r e s e a r C h & e d u C at i o n a l t r u s t
* estimate is statistically different from estimate for the previous year shown (p<.05).^ information was not obtained for hdhP/sos prior to 2006.
kaiser/hret survey of employer-sponsored health Benefits, 1999–2008.
s o u r c e :
e x h i B i t 6 .10
average monthly Worker Premium Contr ibutions Paid by Covered Workers for s ingle and family Coverage, by Plan type, 1999–2008
1999 2000 2001 2002 2003 2004 2005 2006 2007 2008
single Coverage hmo $28 $26 $32 $38 $42 $46 $47 $49 $59 $59 PPo 27 29 29 39* 44 48 50 53 60* 61Pos 27 28 29 40* 41 45 61* 53 52 72hdhP/so ^ ^ ^ ^ ^ ^ ^ 47 43 39
All plANs $27 $28 $30 $39* $42 $47 $51 $52 $58* $60
family Coveragehmo $124 $131 $150 $164 $179 $223* $217 $257* $276 $282 PPo 128 141 153 188* 210* 224 220 243* 270* 279Pos 141 136 143 180* 206 218 271* 269 305 311hdhP/so ^ ^ ^ ^ ^ ^ ^ 187 238 234
All plANs $129 $135 $149* $178* $201* $222* $226 $248* $273* $280
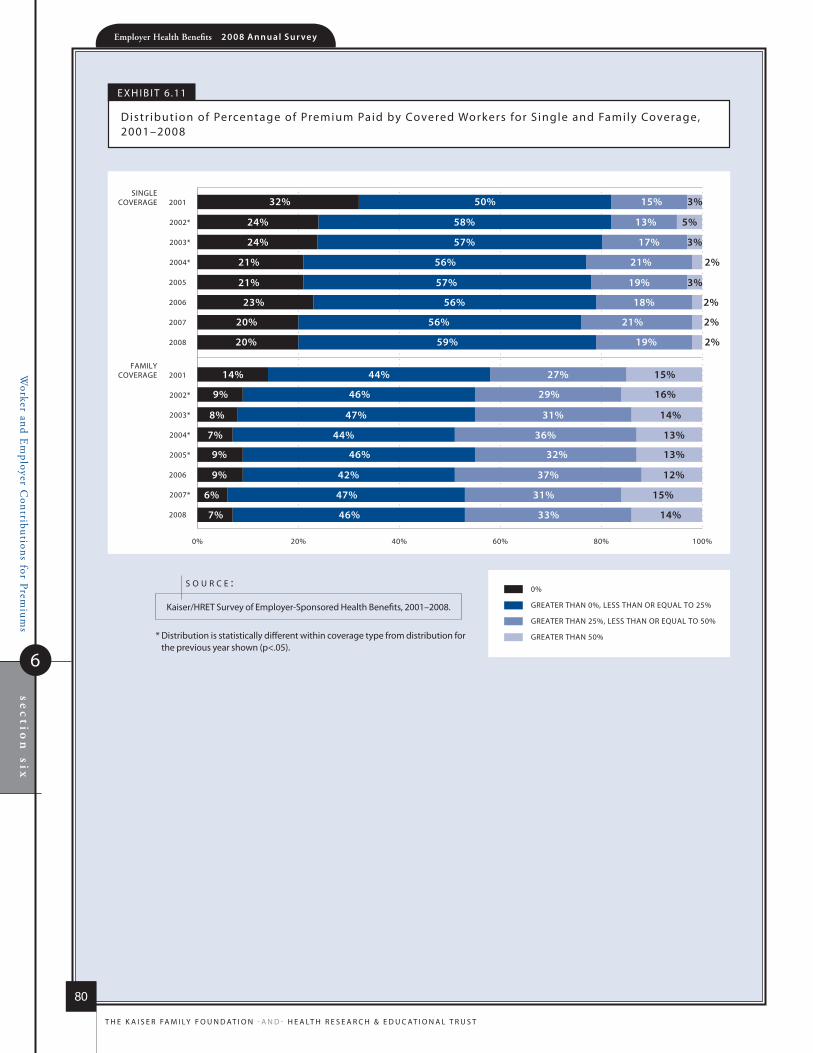
Worker and E
mployer C
ontributions for Premium
sse
ctio
n six
6
Employer Health Benefits 2 0 0 8 An n u a l s u r vey
80
t h e k a i s e r fa m i ly f o u n d at i o n - a n d - h e a lt h r e s e a r C h & e d u C at i o n a l t r u s t
0%
GREATER THAN 0%, LESS THAN OR EQUAL TO 25%
GREATER THAN 25%, LESS THAN OR EQUAL TO 50%
GREATER THAN 50%
2003*
2005
2007
2008
2001
2002*
2004*
2006
2003*
2005*
2007*
2008
2001
2002*
2004*
2006
SINGLECOVERAGE
FAMILYCOVERAGE
0% 20% 40% 60% 80% 100%
15% 3%50%32%
13% 5%58%24%
17% 3%57%24%
21% 2%56%21%
19% 3%57%21%
18% 2%56%23%
21% 2%56%20%
19% 2%59%20%
27% 15%44%14%
29% 16%46%9%
31% 14%47%8%
36% 13%44%7%
32% 13%46%9%
37% 12%42%9%
31% 15%47%6%
33% 14%46%7%
e x h i B i t 6 .11
distr ibution of Percentage of Premium Paid by Covered Workers for s ingle and family Coverage, 2001–2008
* distribution is statistically different within coverage type from distribution for the previous year shown (p<.05).
kaiser/hret survey of employer-sponsored health Benefits, 2001–2008.
s o u r c e :
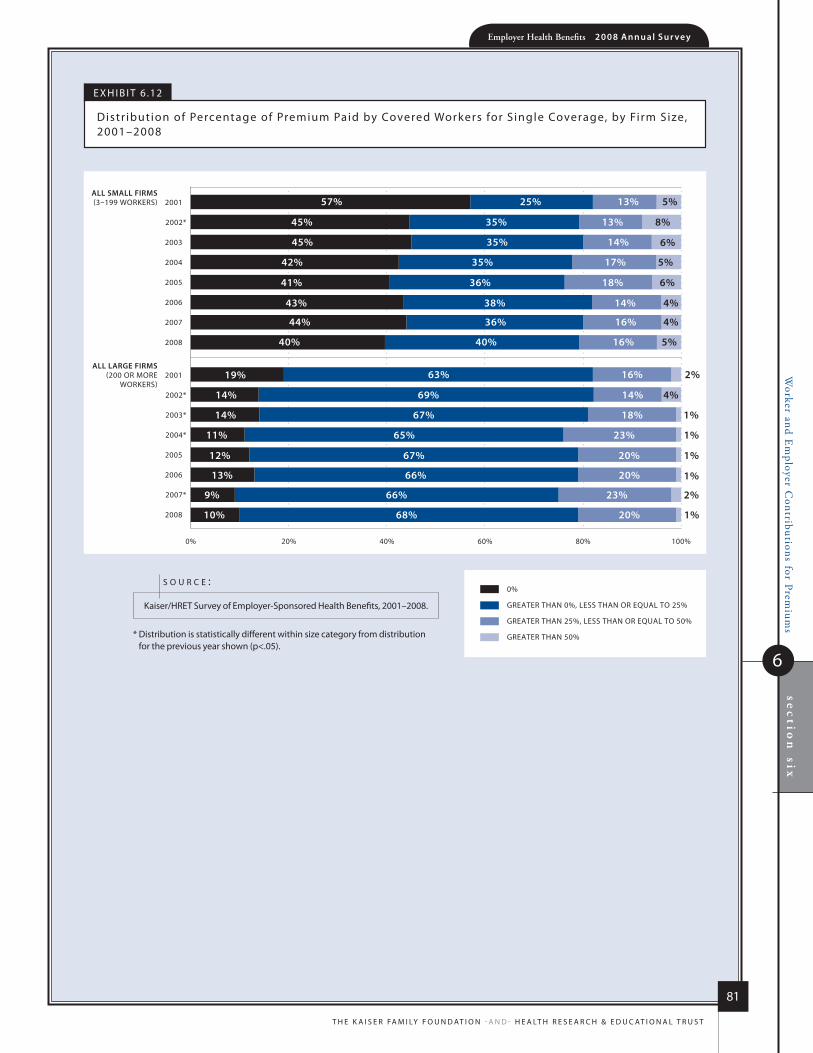
sec
tion
sixW
orker and Em
ployer Contributions for Prem
iums
6
Employer Health Benefits 2 0 0 8 An n u a l s u r vey
81
t h e k a i s e r fa m i ly f o u n d at i o n - a n d - h e a lt h r e s e a r C h & e d u C at i o n a l t r u s t
0%
GREATER THAN 0%, LESS THAN OR EQUAL TO 25%
GREATER THAN 25%, LESS THAN OR EQUAL TO 50%
GREATER THAN 50%
2003
2005
2007
2008
2001
2002*
2004
2006
2003*
2005
2007*
2008
2001
2002*
2004*
2006
ALL SMALL FIRMS(3–199 WORKERS)
ALL LARGE FIRMS(200 OR MORE
WORKERS)
0% 20% 40% 60% 80% 100%
13% 5%25%57%
13% 8%35%45%
14% 6%35%45%
17% 5%35%42%
18% 6%36%41%
14% 4%38%43%
16% 4%36%44%
16% 5%40%40%
2%16%63%19%
4%14%69%14%
1%18%67%14%
1%23%65%11%
1%20%67%12%
1%20%66%13%
2%23%66%9%
1%20%68%10%
e x h i B i t 6 .12
distr ibution of Percentage of Premium Paid by Covered Workers for s ingle Coverage, by firm size, 2001–2008
* distribution is statistically different within size category from distribution for the previous year shown (p<.05).
kaiser/hret survey of employer-sponsored health Benefits, 2001–2008.
s o u r c e :
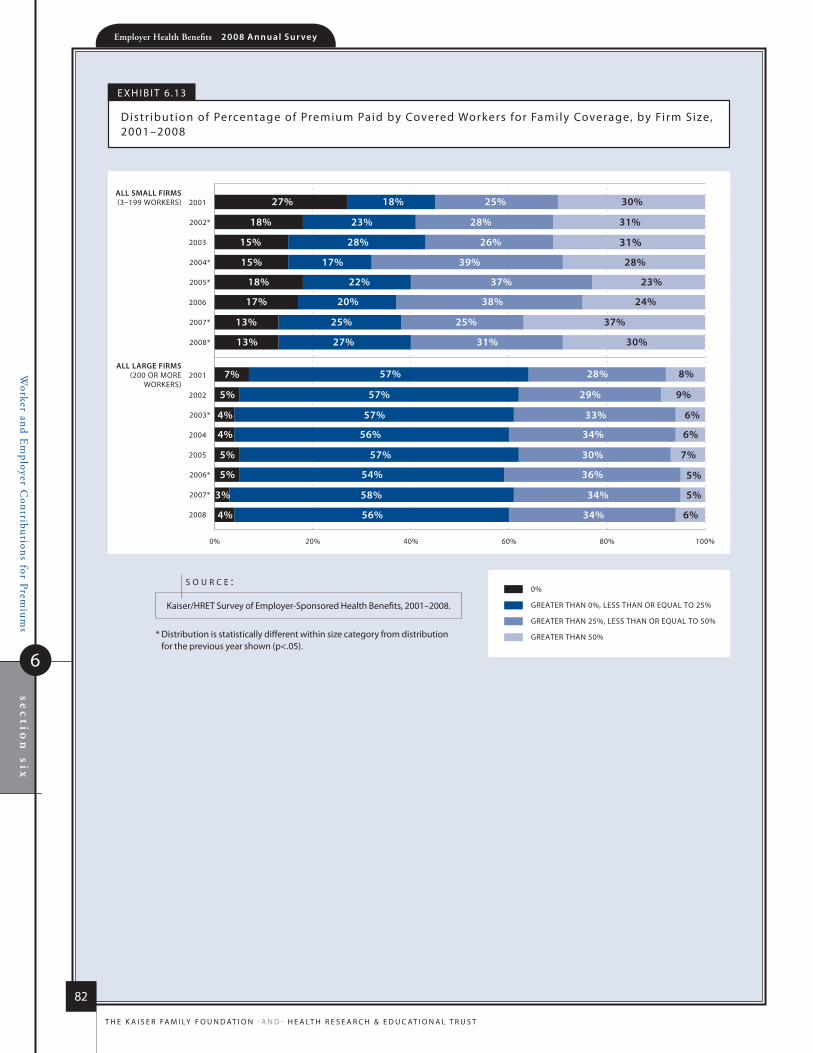
Worker and E
mployer C
ontributions for Premium
sse
ctio
n six
6
Employer Health Benefits 2 0 0 8 An n u a l s u r vey
82
t h e k a i s e r fa m i ly f o u n d at i o n - a n d - h e a lt h r e s e a r C h & e d u C at i o n a l t r u s t
0%
GREATER THAN 0%, LESS THAN OR EQUAL TO 25%
GREATER THAN 25%, LESS THAN OR EQUAL TO 50%
GREATER THAN 50%
2003
2005*
2007*
2008*
2001
2002*
2004*
2006
2003*
2005
2007*
2008
2001
2002
2004
2006*
ALL SMALL FIRMS(3–199 WORKERS)
ALL LARGE FIRMS(200 OR MORE
WORKERS)
0% 20% 40% 60% 80% 100%
25% 30%18%27%
28% 31%23%18%
26% 31%28%15%
39% 28%17%15%
37% 23%22%18%
38% 24%20%17%
25% 37%25%13%
31% 30%27%13%
8%28%57%7%
9%29%57%5%
6%33%57%4%
6%34%56%4%
7%30%57%5%
5%36%54%5%
5%34%58%3%
6%34%56%4%
e x h i B i t 6 .13
distr ibution of Percentage of Premium Paid by Covered Workers for family Coverage, by firm size, 2001–2008
* distribution is statistically different within size category from distribution for the previous year shown (p<.05).
kaiser/hret survey of employer-sponsored health Benefits, 2001–2008.
s o u r c e :

sec
tion
sixW
orker and Em
ployer Contributions for Prem
iums
6
Employer Health Benefits 2 0 0 8 An n u a l s u r vey
83
t h e k a i s e r fa m i ly f o u n d at i o n - a n d - h e a lt h r e s e a r C h & e d u C at i o n a l t r u s t
FIRM DOES NOT HAVE ANY UNION WORKERS
FIRM HAS AT LEAST SOME UNION WORKERS
FEW WORKERS ARE LOWER-WAGE(LESS THAN 35% EARN $22,000 A YEAR OR LESS)
MANY WORKERS ARE LOWER-WAGE (35% OR MORE EARN $22,000 A YEAR OR LESS)
SELF-FUNDED
FULLY INSURED
WAGE LEVEL
PLAN FUNDING*
UNIONS
35% OR MORE WORKERS ARE 26 YEARS OLD OR LESS
LESS THAN 35% OF WORKERS ARE 26 YEARS OLD OR LESS
AGE
0% 2% 4% 6% 8% 10% 12% 14% 16% 18%
16%
16%
17%
15%
14%
17%
17%
16%
e x h i B i t 6 .14
average Percentage of Premiums Paid by Covered Workers for s ingle Coverage, by firm Charac ter ist ics, 2008
* estimates are statistically different from each other within category (p<.05).
note: for definitions of self-funded and fully insured Plans, see the introduction to section 10.
kaiser/hret survey of employer-sponsored health Benefits, 2008.
s o u r c e :
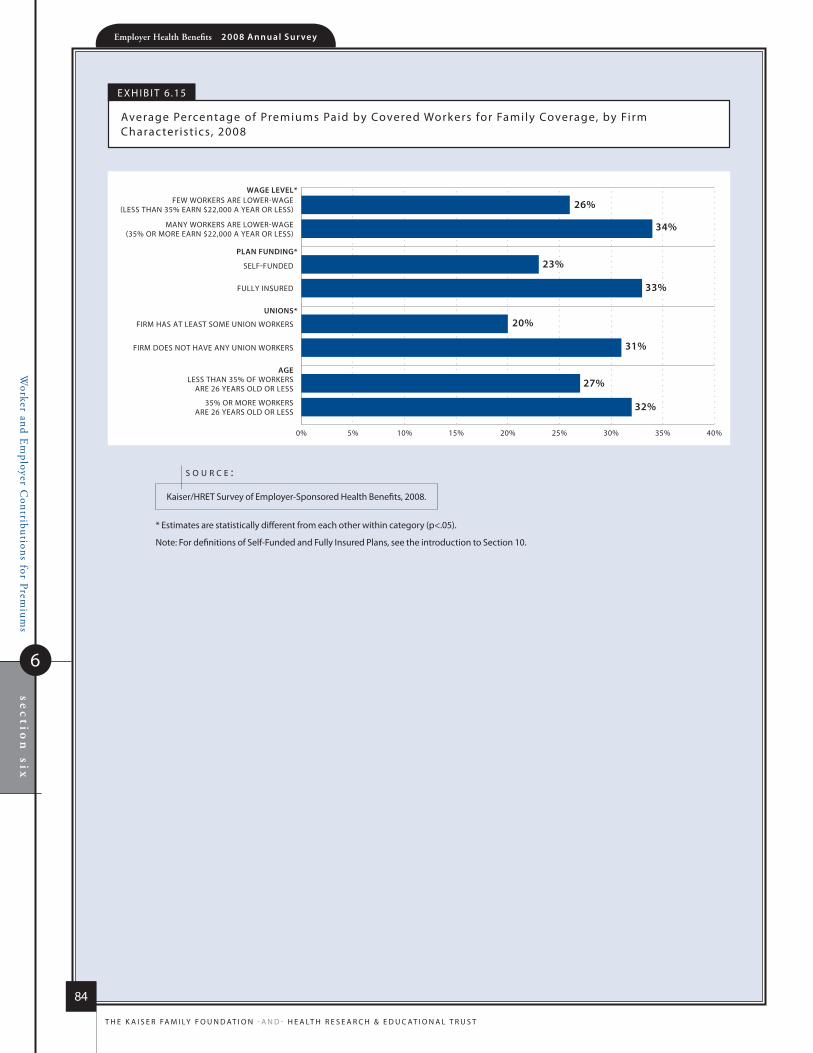
Worker and E
mployer C
ontributions for Premium
sse
ctio
n six
6
Employer Health Benefits 2 0 0 8 An n u a l s u r vey
84
t h e k a i s e r fa m i ly f o u n d at i o n - a n d - h e a lt h r e s e a r C h & e d u C at i o n a l t r u s t
FIRM DOES NOT HAVE ANY UNION WORKERS
FIRM HAS AT LEAST SOME UNION WORKERS
FEW WORKERS ARE LOWER-WAGE(LESS THAN 35% EARN $22,000 A YEAR OR LESS)
MANY WORKERS ARE LOWER-WAGE (35% OR MORE EARN $22,000 A YEAR OR LESS)
SELF-FUNDED
FULLY INSURED
WAGE LEVEL*
PLAN FUNDING*
UNIONS*
35% OR MORE WORKERS ARE 26 YEARS OLD OR LESS
LESS THAN 35% OF WORKERS ARE 26 YEARS OLD OR LESS
AGE
0% 5% 10% 15% 20% 25% 30% 35% 40%
31%
27%
32%
20%
33%
23%
34%
26%
e x h i B i t 6 .15
average Percentage of Premiums Paid by Covered Workers for family Coverage, by firm Charac ter ist ics, 2008
* estimates are statistically different from each other within category (p<.05).
note: for definitions of self-funded and fully insured Plans, see the introduction to section 10.
kaiser/hret survey of employer-sponsored health Benefits, 2008.
s o u r c e :

sec
tion
sixW
orker and Em
ployer Contributions for Prem
iums
6
Employer Health Benefits 2 0 0 8 An n u a l s u r vey
85
t h e k a i s e r fa m i ly f o u n d at i o n - a n d - h e a lt h r e s e a r C h & e d u C at i o n a l t r u s t
e x h i B i t 6 .16
average Percentage of Premium Paid by Covered Workers for s ingle and family Coverage, by Plan type and firm size, 2008
* estimates are statistically different within plan type between all small firms and all large firms (p<.05).
kaiser/hret survey of employer-sponsored health Benefits, 2008.
s o u r c e :
single Coverage family Coverage
hmoall small firms (3–199 Workers) 14% 31%*all large firms (200 or more Workers) 16 24*
All firm sizes 16% 26%
ppoall small firms (3–199 Workers) 13%* 36%*all large firms (200 or more Workers) 17* 24*
All firm sizes 16% 27%
posall small firms (3–199 Workers) 20% 39%*all large firms (200 or more Workers) 16 24*
All firm sizes 18% 31%
hDhp/soall small firms (3–199 Workers) 9%* 33%*all large firms (200 or more Workers) 15* 22*
All firm sizes 11% 29%
All plANsall small firms (3–199 Workers) 14%* 35%*all large firms (200 or more Workers) 17* 24*
All firm sizes 16% 27%
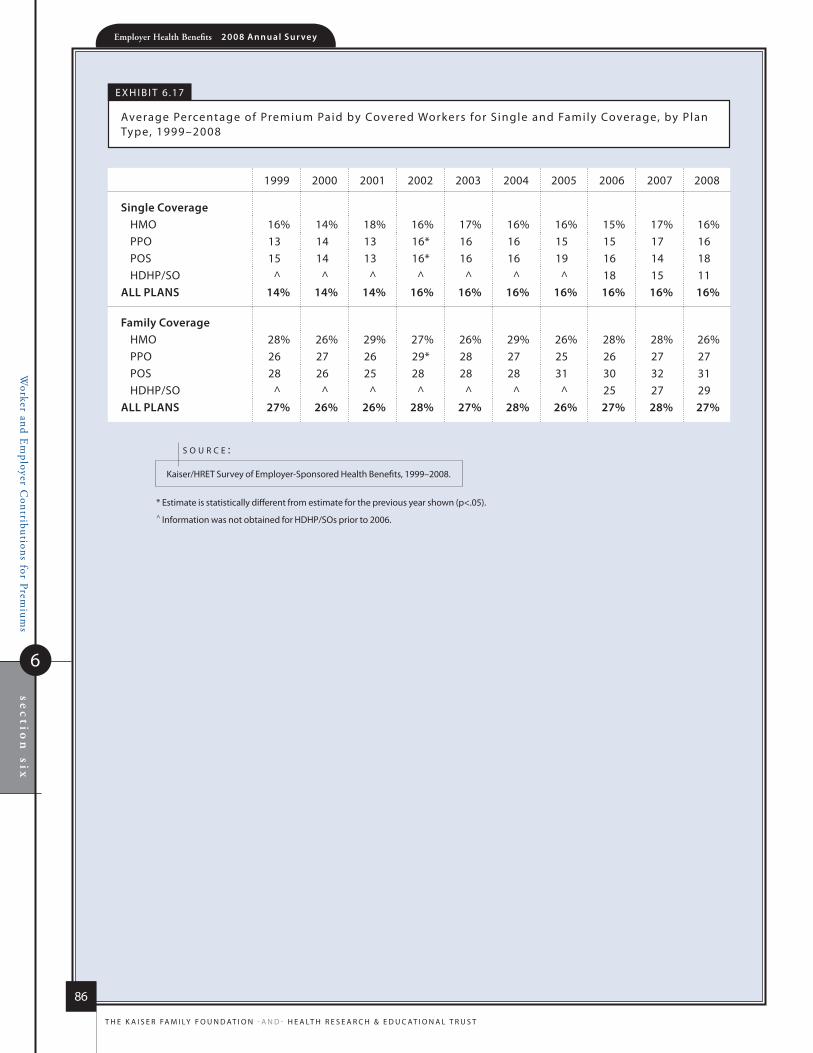
Worker and E
mployer C
ontributions for Premium
sse
ctio
n six
6
Employer Health Benefits 2 0 0 8 An n u a l s u r vey
86
t h e k a i s e r fa m i ly f o u n d at i o n - a n d - h e a lt h r e s e a r C h & e d u C at i o n a l t r u s t
* estimate is statistically different from estimate for the previous year shown (p<.05). ^ information was not obtained for hdhP/sos prior to 2006.
kaiser/hret survey of employer-sponsored health Benefits, 1999–2008.
s o u r c e :
e x h i B i t 6 .17
average Percentage of Premium Paid by Covered Workers for s ingle and family Coverage, by Plan type, 1999–2008
1999 2000 2001 2002 2003 2004 2005 2006 2007 2008
single Coverage hmo 16% 14% 18% 16% 17% 16% 16% 15% 17% 16%PPo 13 14 13 16* 16 16 15 15 17 16Pos 15 14 13 16* 16 16 19 16 14 18hdhP/so ^ ^ ^ ^ ^ ^ ^ 18 15 11
All plANs 14% 14% 14% 16% 16% 16% 16% 16% 16% 16%
family Coveragehmo 28% 26% 29% 27% 26% 29% 26% 28% 28% 26%PPo 26 27 26 29* 28 27 25 26 27 27Pos 28 26 25 28 28 28 31 30 32 31hdhP/so ^ ^ ^ ^ ^ ^ ^ 25 27 29
All plANs 27% 26% 26% 28% 27% 28% 26% 27% 28% 27%
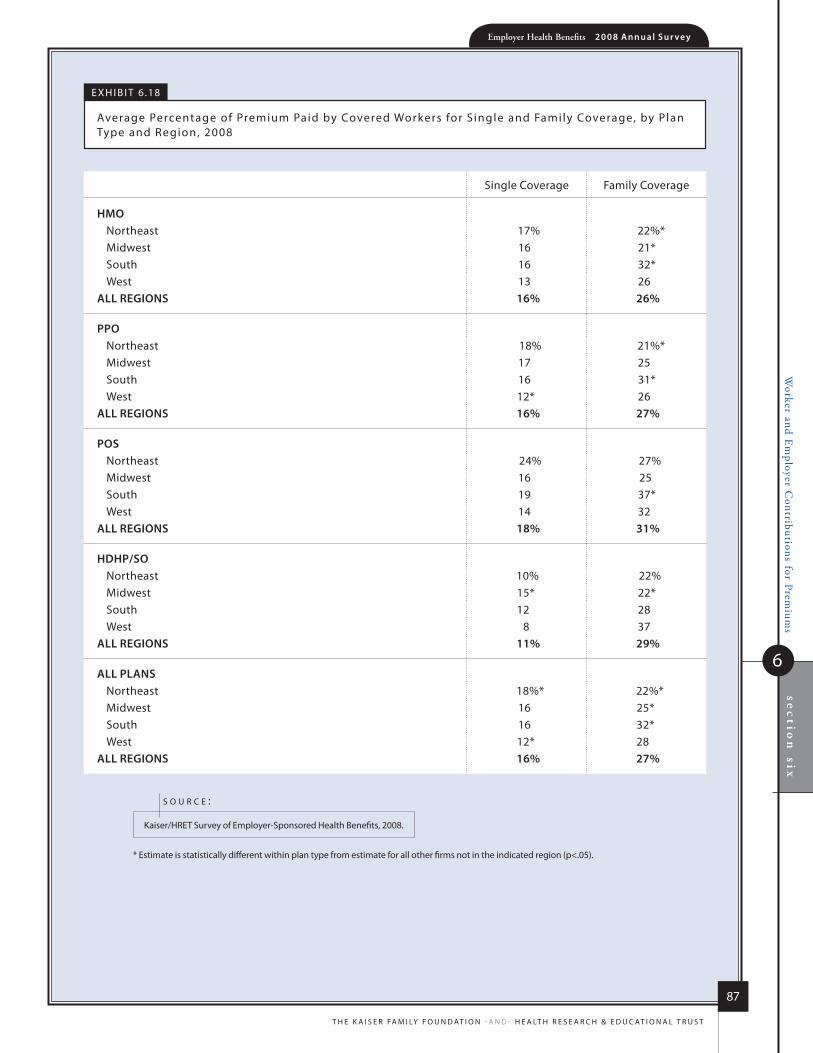
sec
tion
sixW
orker and Em
ployer Contributions for Prem
iums
6
Employer Health Benefits 2 0 0 8 An n u a l s u r vey
87
t h e k a i s e r fa m i ly f o u n d at i o n - a n d - h e a lt h r e s e a r C h & e d u C at i o n a l t r u s t
e x h i B i t 6 .18
average Percentage of Premium Paid by Covered Workers for s ingle and family Coverage, by Plan type and region, 2008
* estimate is statistically different within plan type from estimate for all other firms not in the indicated region (p<.05).
kaiser/hret survey of employer-sponsored health Benefits, 2008.
s o u r c e :
single Coverage family Coverage
hmonortheast 17% 22%*midwest 16 21*south 16 32*West 13 26
All regioNs 16% 26%
pponortheast 18% 21%*midwest 17 25south 16 31*West 12* 26
All regioNs 16% 27%
posnortheast 24% 27%midwest 16 25south 19 37*West 14 32
All regioNs 18% 31%
hDhp/sonortheast 10% 22%midwest 15* 22*south 12 28West 8 37
All regioNs 11% 29%
All plANsnortheast 18%* 22%*midwest 16 25*south 16 32*West 12* 28
All regioNs 16% 27%

Worker and E
mployer C
ontributions for Premium
sse
ctio
n six
6
Employer Health Benefits 2 0 0 8 An n u a l s u r vey
88
t h e k a i s e r fa m i ly f o u n d at i o n - a n d - h e a lt h r e s e a r C h & e d u C at i o n a l t r u s t
e x h i B i t 6 .19
average Percentage of Premium Paid by Covered Workers, by Plan type and industr y, 2008
single Coverage family Coverage
hmoagriculture/mining/Construction nsd nsdmanufacturing 17% 25%transportation/Communications/utilities nsd nsdWholesale nsd nsdretail 20 25finance 23 26service 15 29*state/local Government 12 19*health Care 11* 23
All iNDusTries 16% 26%
ppoagriculture/mining/Construction 13% 35%*manufacturing 19* 22*transportation/Communications/utilities 14 24Wholesale 26* 34retail 18 28finance 15 24service 16 30*state/local Government 12 22health Care 14 27
All iNDusTries 16% 27%
posagriculture/mining/Construction nsd nsdmanufacturing 20% 34%transportation/Communications/utilities nsd nsdWholesale nsd nsdretail nsd nsdfinance 27 36service 12* 28state/local Government 12 18*health Care nsd nsd
All iNDusTries 18% 31%
Continued on next page
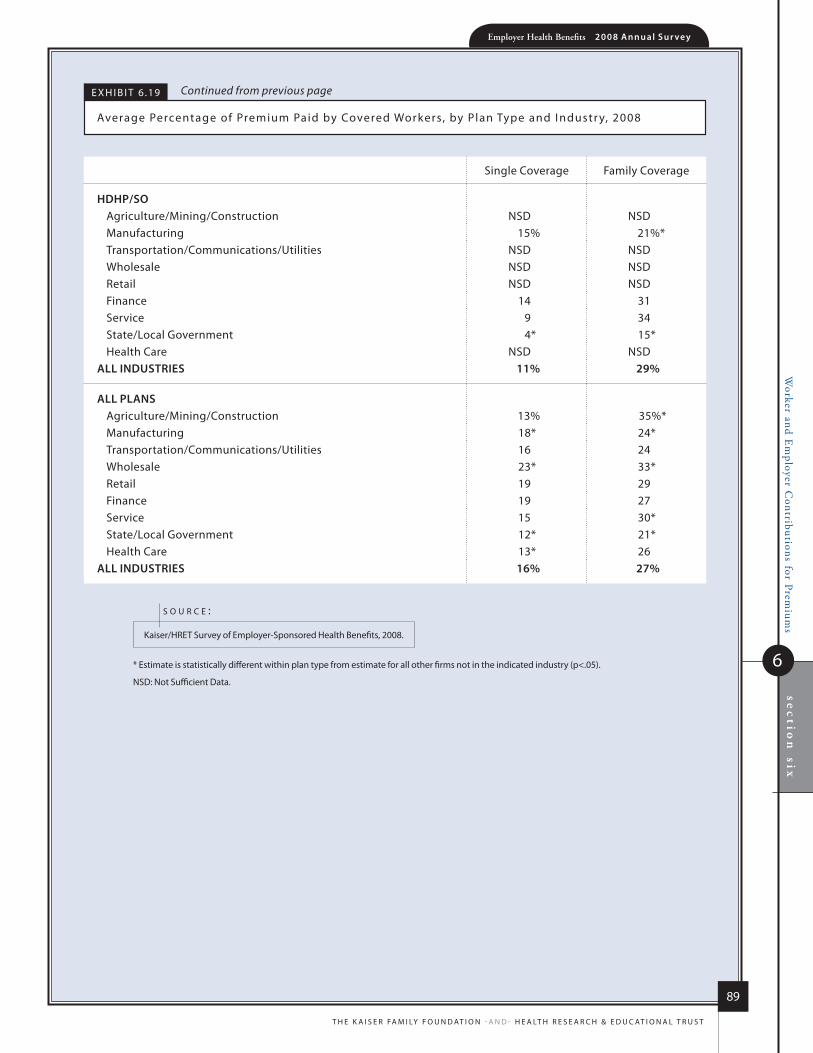
sec
tion
sixW
orker and Em
ployer Contributions for Prem
iums
6
Employer Health Benefits 2 0 0 8 An n u a l s u r vey
89
t h e k a i s e r fa m i ly f o u n d at i o n - a n d - h e a lt h r e s e a r C h & e d u C at i o n a l t r u s t
e x h i B i t 6 .19
average Percentage of Premium Paid by Covered Workers, by Plan type and industr y, 2008
* estimate is statistically different within plan type from estimate for all other firms not in the indicated industry (p<.05).
nsd: not sufficient data.
kaiser/hret survey of employer-sponsored health Benefits, 2008.
s o u r c e :
single Coverage family Coverage
hDhp/soagriculture/mining/Construction nsd nsdmanufacturing 15% 21%*transportation/Communications/utilities nsd nsdWholesale nsd nsdretail nsd nsdfinance 14 31service 9 34state/local Government 4* 15*health Care nsd nsd
All iNDusTries 11% 29%
All plANsagriculture/mining/Construction 13% 35%*manufacturing 18* 24*transportation/Communications/utilities 16 24Wholesale 23* 33*retail 19 29finance 19 27service 15 30*state/local Government 12* 21*health Care 13* 26
All iNDusTries 16% 27%
Continued from previous page
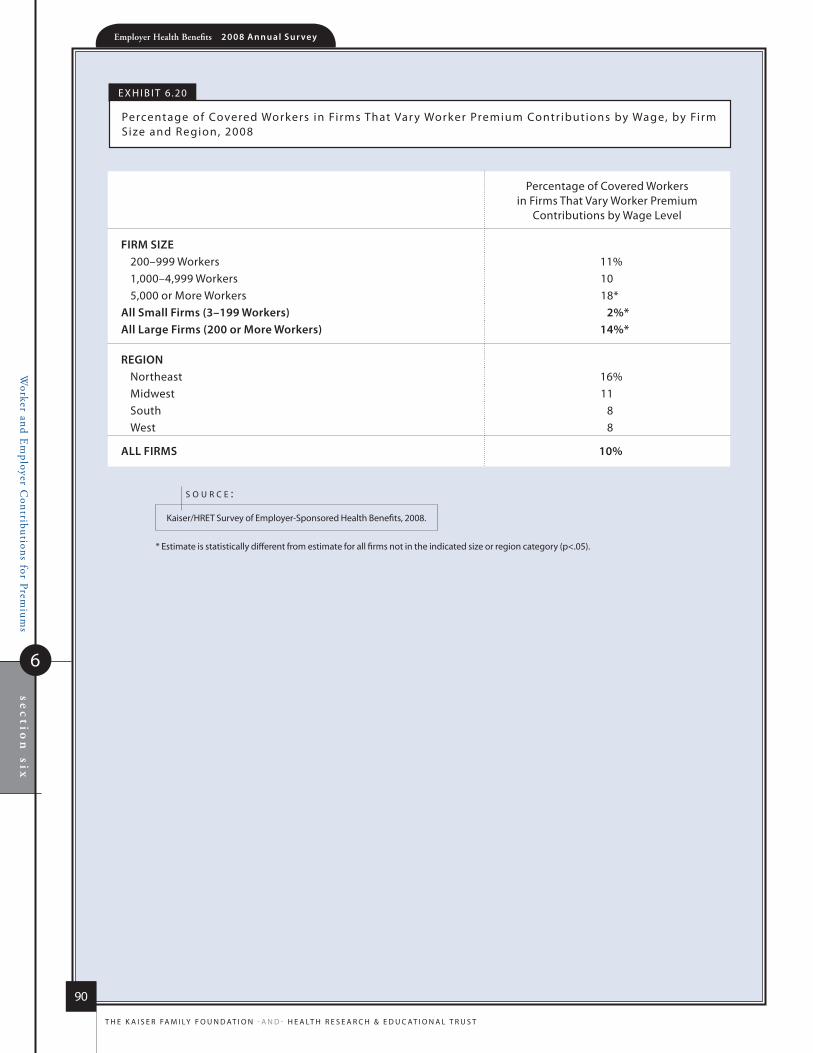
Worker and E
mployer C
ontributions for Premium
sse
ctio
n six
6
Employer Health Benefits 2 0 0 8 An n u a l s u r vey
90
t h e k a i s e r fa m i ly f o u n d at i o n - a n d - h e a lt h r e s e a r C h & e d u C at i o n a l t r u s t
e x h i B i t 6 .20
Percentage of Covered Workers in firms that Var y Worker Premium Contr ibutions by Wage, by firm size and region, 2008
Percentage of Covered Workers in firms that Vary Worker Premium
Contributions by Wage level
firm size200–999 Workers 11%1,000–4,999 Workers 105,000 or more Workers 18*
All small firms (3–199 Workers) 2%*All large firms (200 or more Workers) 14%*
regioNnortheast 16%midwest 11south 8West 8
All firms 10%
* estimate is statistically different from estimate for all firms not in the indicated size or region category (p<.05).
kaiser/hret survey of employer-sponsored health Benefits, 2008.
s o u r c e :
63%$12,6
80
$4,7
04
2008
Employer Health Benefits2 0 0 8 a n n u a l s u r V e y
s ect ion
Employee Cost Sharing
7
Em
ployee Cost Sharing
7sectio
n seven
Employer Health Benefits 2 0 0 8 An n u a l s u r vey
92
t h e k a i s e r fa m i ly f o u n d at i o n - a n d - h e a lt h r e s e a r C h & e d u C at i o n a l t r u s t
e M p l o y e e C o S t S h a r i n g
cosT sharing for medical ser vices Takes a varieTy of forms. in addiTion To any required premium
conTribuTions, covered workers may be responsible for a general annual deducTible before some or all
services are covered, and may have To pay copaymenTs (fixed dollar amounTs), and/or coinsurance (a
percenTage of The charge for services) when They receive services. The Type and level of cosT sharing
ofTen varies by The Type of plan in which The worker is enrolled. cosT sharing may also vary by The Type
of service received such as office visiTs, hospiTalizaTions, or prescripTion drugs.
unless oTherwise noTed, The cosT sharing amounTs reporTed here are for covered workers using services
provided wiThin plan neTworks by par TicipaTing providers. plan enrollees receiving ser vices from
providers ThaT do noT parTicipaTe in plan neTworks ofTen musT pay higher deducTibles, copaymenTs or
coinsurance, and may be responsible for charges ThaT exceed plan allowable amounTs. we also would
noTe ThaT we do noT collecT informaTion on all of The plan provisions and limiTs ThaT affecT enrollee
ouT-of-pockeT liabiliTy. alThough we have increased The number of survey quesTions direcTed aT cosT
sharing liabiliTy, we cannoT reasonably wiTh The framework of This survey capTure all of The complex
cosT-sharing requiremenTs in modern plans, parTicularly Those for ancillary services (such as durable
medical equipmenT or physical Therapy) or ThaT vary across differenT seTTings (such as Tiered neTworks).
g e N e r A l A N N u A l D e D u C T i b l e s
�Some workers must meet a general annual deductible before all or most services are covered by their health plan.
Deductibles vary significantly by plan type. Eighty percent of workers in HMOs with single coverage do not have a general annual deductible, compared to 50% of workers in POS plans and 32% of workers in PPOs (Exhibit 7.1). The percentages are similar for family coverage. There has been no change in the percentage of workers without a general annual deductible since 2007; however, since 2006, the percentage of workers without a deductible decreased from 88% to 80% for HMO single coverage and from 68% to 50% for POS single coverage. There were similar declines among workers enrolled in HMOs or POS plans for family coverage.
Those workers with no general annual plan deductible often have another form of cost sharing. For workers without a general annual deductible for single coverage, 69% of workers
in HMOs, 68% of workers in POS plans, and 71% of workers in PPOs are in plans that require cost sharing for hospital admissions (Exhibit 7.2). The percentages are similar for family coverage.
�The average annual deductibles for workers in PPOs increased for both single and family coverage from 2007 to 2008. Deductibles vary greatly by plan type and firm size.
For workers in PPOs with a general annual deductible for single coverage, the average annual deductible increased from $461 in 2007 to $560 in 2008 (Exhibit 7.5). For workers in PPOs with a general annual deductible for family coverage, the average general annual aggregate deductible increased from $1,040 in 2007 to $1,344 in 2008 (Exhibit 7.11). For each of the other plan types, there is no statistically significant increase from 2007 to 2008 for single or family coverage.
For HMOs, POS plans, and HDHP/SOs, the average annual deductibles among those workers with a deductible for single coverage are $503, $752, and $1,812, respectively (Exhibit 7.3).
Em
ployee Cost Sharing
7
section
sevenEmployer Health Benefits 2 0 0 8 An n u a l s u r vey
93
t h e k a i s e r fa m i ly f o u n d at i o n - a n d - h e a lt h r e s e a r C h & e d u C at i o n a l t r u s t
1 there is insufficient data to report the average separate per-person general annual deductible for workers in hmos with family coverage.
2 among covered workers in plans that limit the number of family members required to meet the separate deductible amounts there are insufficient data to report the average number of family members required to meet the amount for hmos and Pos plans.
n o T e :
As we have seen in previous years, covered workers in plans sponsored by small firms (3–199 workers) have significantly higher general annual deductibles than covered workers in large firms (200 or more workers) (Exhibit 7.3).
Workers in small firms (3–199 workers) are more likely to have a general annual deductible of $1,000 or more for single coverage than workers in large firms (200 or more workers) (35% vs. 9%). From 2006 to 2008, the percentage of workers with a deductible of $1,000 or more for single coverage has increased from 10% to 18%. For workers in small firms (3–199 workers), the percentage has grown from 16% in 2006 to 35% in 2008, while there has been no significant increase in the percentage of workers in large firms (200 or more workers) with high deductibles (Exhibit 7.6).
For family coverage, the majority of workers with general annual deductibles have an aggregate deductible, meaning all covered expenses from family members count toward meeting the deductible amount. Among those with a general annual deductible for family coverage, the percentage of covered workers with an aggregate general annual deductible ranges from 70% for PPO plans to 93% for HDHP/SOs.
The average amounts for workers with an aggregate deductible for family coverage are $1,053 for HMOs, $1,344 for PPOs, $1,860 for POS plans, and $3,559 for HDHP/SOs (Exhibit 7.10).
The other type of family deductible, a separate per-person deductible, requires each family member to meet a separate per-person deductible amount before the plan covers expenses for that member. Most plans with separate per-person family deductibles consider the deductible met if a prescribed number of family members each reach their separate deductible amounts.
For covered workers in health plans that have separate per-person general annual deductible amounts for family coverage, the average plan deductible amounts are $514 for PPOs, $778 for POS plans, and $2,334 for HDHP/SOs1 (Exhibit 7.10). Most covered workers in plans with a separate general annual deductible for family coverage have a limit to the number of family members required to meet the separate deductible amounts (Exhibit 7.13). Among those workers in plans with a limit on the number of family members, the average number of family members required to meet the separate deductible amounts is three for PPOs and two for HDHP/SOs.2
�The majority of covered workers with a deductible are in plans where the deductible does not have to be met before certain services are covered.
Over three-quarters of covered workers in HMOs, PPOs and POS plans with general plan deductibles are enrolled in plans where the general plan deductible does not have to be met before physician office visits are covered (Exhibit 7.14).
More than five out of six covered workers in HMOs, PPOs, POS plans, and HDHP/SOs with general annual plan deductibles are enrolled in plans where the general plan deductible does not have to be met before preventive care is covered (Exhibit 7.14).
Similarly, among workers with a general annual deductible, over 80% of covered workers in HMOs and HDHP/SOs and over 90% of workers in PPOs and POS plans are enrolled in plans where the general annual deductible does not have to be met before prescription drugs are covered (Exhibit 7.14).

Em
ployee Cost Sharing
7sectio
n seven
Employer Health Benefits 2 0 0 8 An n u a l s u r vey
94
t h e k a i s e r fa m i ly f o u n d at i o n - a n d - h e a lt h r e s e a r C h & e d u C at i o n a l t r u s t
C o s T s h A r i N g f o r p h y s i C i A N o f f i C e v i s i T s
�The majority of covered workers are enrolled in health plans that require cost sharing for an in-network physician office visit, in addition to any general annual deductible.3
Seventy-nine percent of covered workers have a copayment for a physician office visit and 11% have coinsurance. Workers in HMOs, PPOs, and POS plans are more likely to have copayments than workers in HDHP/SOs (Exhibit 7.18). The majority of workers in HDHP/SOs have no physician office visit cost sharing after the deductible is met (43%) or coinsurance (41%) (Exhibit 7.18).
Among covered workers with a copayment for in-network physician office visits, the average copayment is $19 for primary care and $26 for specialty physicians (Exhibit 7.19). Fifty-five percent of covered workers have a copayment of $15 or $20 for a primary care office visit (Exhibit 7.20). For specialty care office visits, 36% of covered workers have copayments of $20 or $25 (Exhibit 7.21).
Among the 11% of covered workers with coinsurance only for a physician office visit (Exhibit 7.18), the average coinsurance rate for a visit with a primary care physician is 17% (Exhibit 7.19).
h o s p i TA l C o s T s h A r i N g
�As in past years, this year we collected information on the cost-sharing provisions for hospital admissions and outpatient surgery that is in addition to any general annual plan deductible. However, for the 2008 survey, we changed the structure of the hospital cost-sharing question and now include “separate annual deductible for hospital admissions” as a response option rather than collecting the information through a separate question. We also added “separate annual deductible for outpatient surgeries” as a response option to the question on the type of cost sharing required for outpatient surgeries. We continue to examine and sometimes modify the questions on hospital and outpatient surgery cost sharing because this can be a complex component of health benefit plans. For example, for some plans it is
difficult to distinguish a separate hospital deductible from a general annual deductible that applies only to hospital use and where office visits and preventive care are covered before the deductible has been met. Because this continues to be a point of confusion, we continue to refine the series of questions in order to clearly convey the information we are attempting to collect from respondents.
�Whether or not a worker has a general annual deductible, most workers face additional types of cost sharing when admitted to a hospital, such as a copayment, coinsurance, or a per diem charge.
Whether or not the worker has a general annual deductible, the majority of workers have copayments or coinsurance when they are admitted to a hospital (Exhibit 7.15). Thirty-seven percent of covered workers have coinsurance only for hospital admissions and the average coinsurance rate is 17%. For the 24% of workers with copayments only, the average copayment is $216 per hospital admission. About 3% of covered workers have a per day (per diem) fee for hospital admissions and the average per diem charge is $193 (Exhibit 7.17).
The cost-sharing provisions for outpatient surgery are similar to those for hospital admissions, where most workers have coinsurance or copayments. Coinsurance is most prevalent with 41% of workers facing coinsurance, compared to 21% of workers with copayments (Exhibit 7.16). For covered workers with coinsurance for each outpatient surgery episode, the average coinsurance is 17% and for those workers with copayments, the average copayment is $121 (Exhibit 7.17).
Small percentages of workers have separate annual hospital or outpatient surgery deductibles. For workers enrolled in HMOs, PPOs, and POS plans, 3% of workers in each plan type have a separate annual deductible for hospital admissions (Exhibit 7.15). These percentages may be lower in 2008 than in 2007 due to the change in the question format. For outpatient surgery, 4% of workers in HMOs, 1% of workers in PPOs, and 3% of workers in POS plans have a separate annual deductible for outpatient surgery (Exhibit 7.16).
3 in 2008, the survey includes cost sharing for in-network services only. see the 2007 survey for information on out-of-network office visit cost sharing.
n o T e :

Em
ployee Cost Sharing
7
section
sevenEmployer Health Benefits 2 0 0 8 An n u a l s u r vey
95
t h e k a i s e r fa m i ly f o u n d at i o n - a n d - h e a lt h r e s e a r C h & e d u C at i o n a l t r u s t
o u T - o f - p o C k e T m A x i m u m A m o u N T s
�Most covered workers are in a plan that partially or totally limits the cost sharing that a plan enrollee must pay in a year. These limits are generally referred to as out-of-pocket maximum amounts. Enrollee cost sharing such as deductibles, office visit cost sharing, or spending on prescription drugs may or may not apply to the out-of-pocket maximum. Therefore, the survey asks what types of out-of-pocket expenses plans count when determining whether a covered worker has met the plan out-of-pocket maximum. When a plan does not count certain types of spending, it effectively increases the amount a worker may pay out-of-pocket.
�Twenty percent of workers enrolled in single coverage and 21% of workers enrolled in family coverage are in a plan that does not limit the amount of cost sharing enrollees have to pay (Exhibit 7.24).
Covered workers with no out-of-pocket maximum, however, may not have large cost-sharing responsibilities. For example, 89% of covered workers in HMOs with no out-of-pocket maximum for single coverage have no general annual deductible, and only 4% have coinsurance for hospital admission and only 2% have coinsurance for each outpatient surgery episode. Similarly, 76% of covered workers in POS plans with no out-of-pocket maximum for single coverage have no general annual plan deductible, and only 6% have coinsurance for hospital admissions, and only 8% have coinsurance for each outpatient surgery episode.
In 2008, HSA-qualified HDHPs are required by law to have an out-of-pocket maximum of no more than $5,600 for single coverage and $11,200 for family coverage. HDHP/HRAs have no such requirement, and among workers enrolled in these plans, 9% have no out-of-pocket maximum for single coverage and 9% have no out-of-pocket maximum for family coverage.
�For workers with out-of-pocket maximums, there is wide variation in spending limits.
About 50% of workers with an out-of-pocket maximum for single coverage have an out-of-pocket maximum of less than $2,000 (Exhibit 7.26).
Like deductibles, some plans have an aggregate out-of-pocket maximum amount for family coverage that applies to cost sharing for all family members, while others have a per-person out-of-pocket maximum that limits the amount of cost sharing that the family must pay on behalf of each family member. For covered workers with an aggregate out-of-pocket maximum for family coverage, 46% have an out-of-pocket maximum of less than $4,000 (Exhibit 7.28). Among workers with separate per-person out-of-pocket limits for family coverage, 89% have out-of-pocket maximums of less than $4,000 (Exhibit 7.29). As noted above, these limits may not apply to all required cost sharing under the plan, including plan deductibles.
�Workers with an out-of-pocket maximum may be enrolled in a plan where not all spending counts toward the out-of-pocket maximum, potentially exposing workers to higher spending.
Among workers enrolled in PPO plans with an out-of-pocket maximum for single or family coverage, 33% are in plans that do not count spending for the general annual deductible toward the out-of-pocket limit (Exhibit 7.25).
The percentage of workers with an out-of-pocket maximum in HMOs, PPOs, and POS plans where spending on prescription drugs does not count towards the out-of-pocket maximum has increased since 2007. In 2008, 77% of workers in HMOs, 86% of workers in PPOs, and 82% of workers in POS plans are in plans that do not count prescription drug spending towards the out-of-pocket maximum (Exhibit 7.25). In 2007, these percentages were 61%, 79% and 60%, respectively.

Em
ployee Cost Sharing
7sectio
n seven
Employer Health Benefits 2 0 0 8 An n u a l s u r vey
96
t h e k a i s e r fa m i ly f o u n d at i o n - a n d - h e a lt h r e s e a r C h & e d u C at i o n a l t r u s t
single Coverage family Coverage
hmo200–999 Workers 85% 85%1,000–4,999 Workers 84 845,000 or more Workers 80 80All small firms (3–199 Workers) 75% 74%All large firms (200 or more Workers) 82% 82%
All firm sizes 80% 79%
ppo200–999 Workers 29% 29%1,000–4,999 Workers 32 315,000 or more Workers 37 37All small firms (3–199 Workers) 27% 26%All large firms (200 or more Workers) 34% 34%
All firm sizes 32% 32%
pos200–999 Workers 48% 48%1,000–4,999 Workers 57 575,000 or more Workers 66 65All small firms (3–199 Workers) 41% 40%*All large firms (200 or more Workers) 59% 58%*
All firm sizes 50% 49%
e x h i B i t 7 .1
Percentage of Covered Workers with no General annual health Plan deduc tible for s ingle and family Coverage, by Plan type and firm size, 2008
* estimate is statistically different within plan type from estimate for all other firms not in the indicated size category (p<.05).
note: hdhP/sos are not shown because all covered workers in these plans face a minimum deductible. in hdhP/hra plans, as defined by the survey, the minimum deductible is $1,000 for single coverage and $2,000 for family coverage. in hsa-qualified hdhPs, the legal minimum deductible for 2008 is $1,100 for single coverage and $2,200 for family coverage.
kaiser/hret survey of employer-sponsored health Benefits, 2008.
s o u r c e :
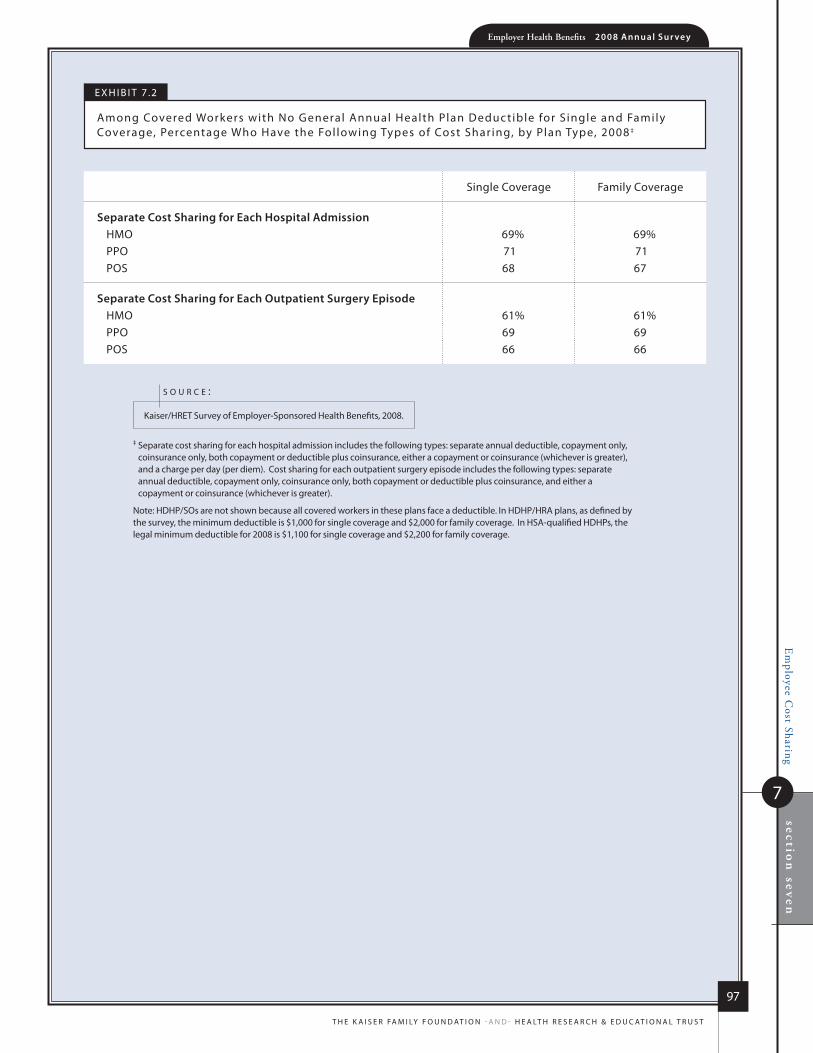
Em
ployee Cost Sharing
7
section
sevenEmployer Health Benefits 2 0 0 8 An n u a l s u r vey
97
t h e k a i s e r fa m i ly f o u n d at i o n - a n d - h e a lt h r e s e a r C h & e d u C at i o n a l t r u s t
single Coverage family Coverage
separate Cost sharing for each hospital Admissionhmo 69% 69%PPo 71 71Pos 68 67
separate Cost sharing for each outpatient surgery episodehmo 61% 61%PPo 69 69Pos 66 66
e x h i B i t 7 .2
among Covered Workers with no General annual health Plan deduc tible for s ingle and family Coverage, Percentage Who have the fol lowing types of Cost shar ing, by Plan type, 2008 ‡
‡ separate cost sharing for each hospital admission includes the following types: separate annual deductible, copayment only, coinsurance only, both copayment or deductible plus coinsurance, either a copayment or coinsurance (whichever is greater), and a charge per day (per diem). Cost sharing for each outpatient surgery episode includes the following types: separate annual deductible, copayment only, coinsurance only, both copayment or deductible plus coinsurance, and either a copayment or coinsurance (whichever is greater).
note: hdhP/sos are not shown because all covered workers in these plans face a deductible. in hdhP/hra plans, as defined by the survey, the minimum deductible is $1,000 for single coverage and $2,000 for family coverage. in hsa-qualified hdhPs, the legal minimum deductible for 2008 is $1,100 for single coverage and $2,200 for family coverage.
kaiser/hret survey of employer-sponsored health Benefits, 2008.
s o u r c e :

Em
ployee Cost Sharing
7sectio
n seven
Employer Health Benefits 2 0 0 8 An n u a l s u r vey
98
t h e k a i s e r fa m i ly f o u n d at i o n - a n d - h e a lt h r e s e a r C h & e d u C at i o n a l t r u s t
single Coverage
hmoall small firms (3–199 Workers) nsdall large firms (200 or more Workers) $307
All firm sizes $503
ppoall small firms (3–199 Workers) $917*all large firms (200 or more Workers) 413*
All firm sizes $560
posall small firms (3–199 Workers) $960*all large firms (200 or more Workers) 461*
All firm sizes $752
hDhp/soall small firms (3–199 Workers) $1,959*all large firms (200 or more Workers) 1,599*
All firm sizes $1,812
e x h i B i t 7 .3
among Covered Workers with a General annual health Plan deduc tible for s ingle Coverage, average deduc tible, by Plan type and firm size, 2008
* estimates are statistically different within plan type between all small firms and all large firms (p<.05).
nsd: not sufficient data.
note: average general annual health plan deductibles for PPos, Pos plans, and hdhP/sos are for in-network services.
kaiser/hret survey of employer-sponsored health Benefits, 2008.
s o u r c e :
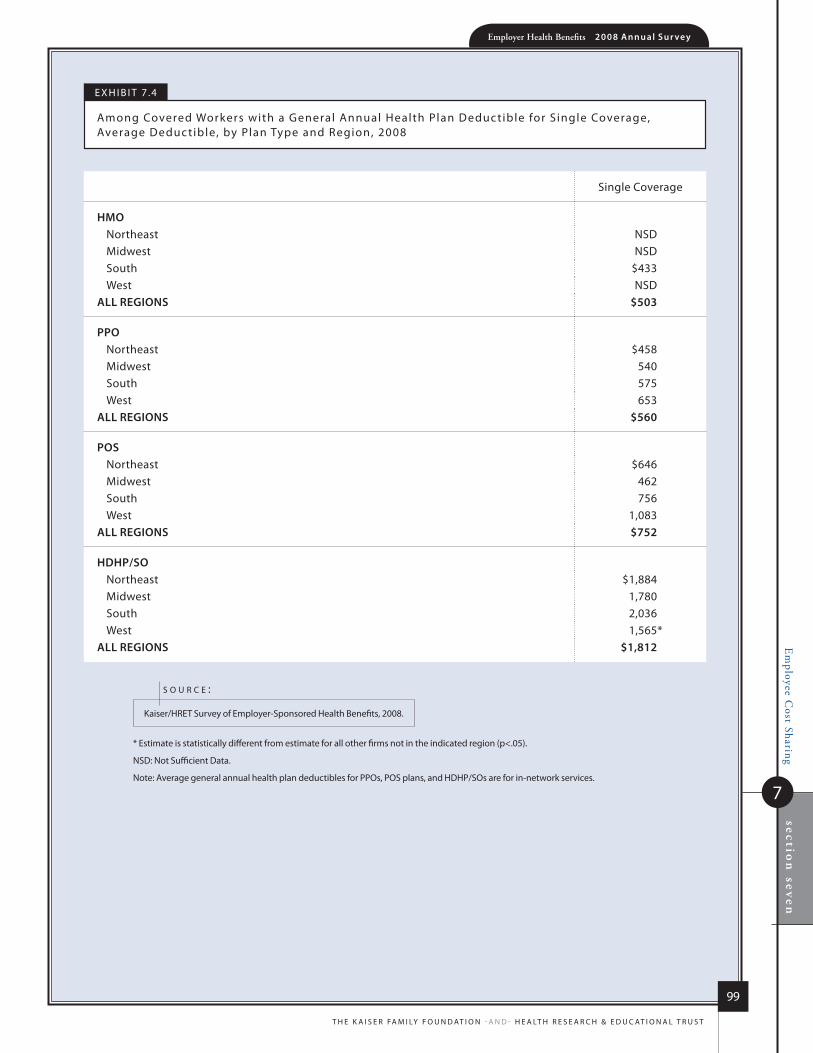
Em
ployee Cost Sharing
7
section
sevenEmployer Health Benefits 2 0 0 8 An n u a l s u r vey
99
t h e k a i s e r fa m i ly f o u n d at i o n - a n d - h e a lt h r e s e a r C h & e d u C at i o n a l t r u s t
single Coverage
hmonortheast nsdmidwest nsdsouth $433West nsd
All regioNs $503
pponortheast $458 midwest 540south 575West 653
All regioNs $560
pos northeast $646 midwest 462 south 756West 1,083
All regioNs $752
hDhp/sonortheast $1,884 midwest 1,780south 2,036West 1,565*
All regioNs $1,812
e x h i B i t 7 .4
among Covered Workers with a General annual health Plan deduc tible for s ingle Coverage, average deduc tible, by Plan type and region, 2008
* estimate is statistically different from estimate for all other firms not in the indicated region (p<.05).
nsd: not sufficient data.
note: average general annual health plan deductibles for PPos, Pos plans, and hdhP/sos are for in-network services.
kaiser/hret survey of employer-sponsored health Benefits, 2008.
s o u r c e :
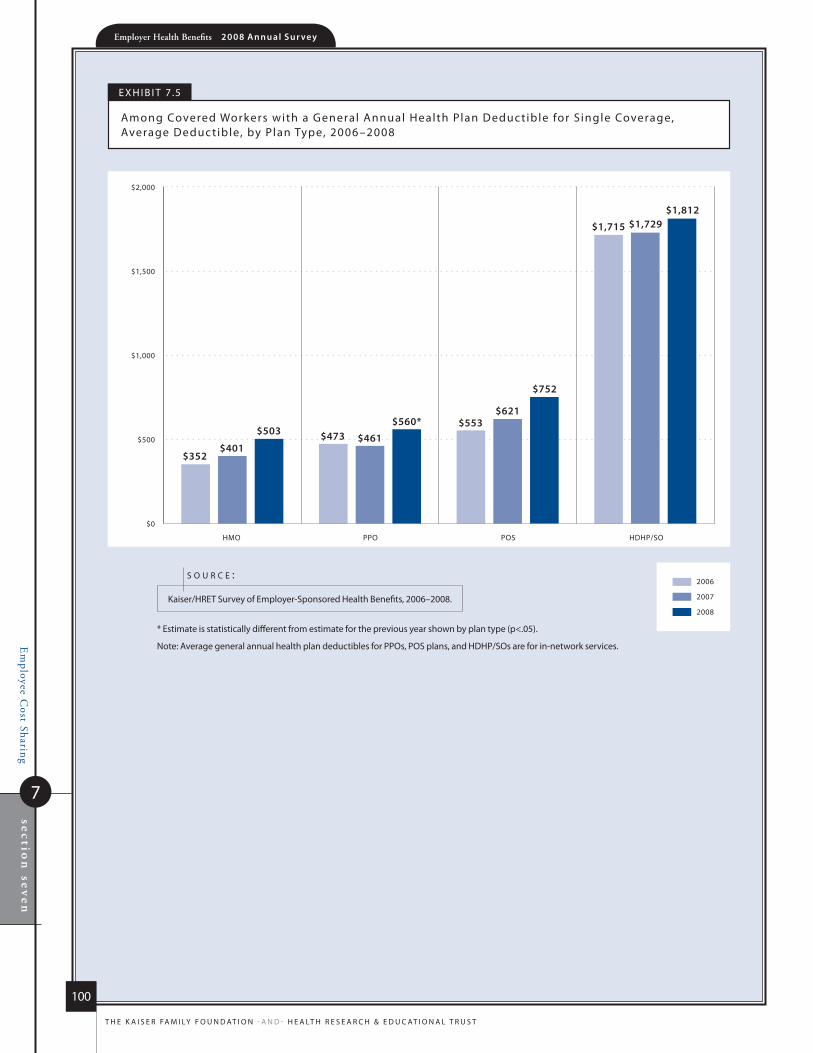
Em
ployee Cost Sharing
7sectio
n seven
Employer Health Benefits 2 0 0 8 An n u a l s u r vey
100
t h e k a i s e r fa m i ly f o u n d at i o n - a n d - h e a lt h r e s e a r C h & e d u C at i o n a l t r u s t
HMO PPO POS HDHP/SO
2007
2008
2006
$0
$500
$1,000
$1,500
$2,000
$352$401
$503 $473 $461
$560* $553$621
$752
$1,715 $1,729$1,812
e x h i B i t 7 .5
among Covered Workers with a General annual health Plan deduc tible for s ingle Coverage, average deduc tible, by Plan type, 2006–2008
* estimate is statistically different from estimate for the previous year shown by plan type (p<.05).
note: average general annual health plan deductibles for PPos, Pos plans, and hdhP/sos are for in-network services.
kaiser/hret survey of employer-sponsored health Benefits, 2006–2008.
s o u r c e :
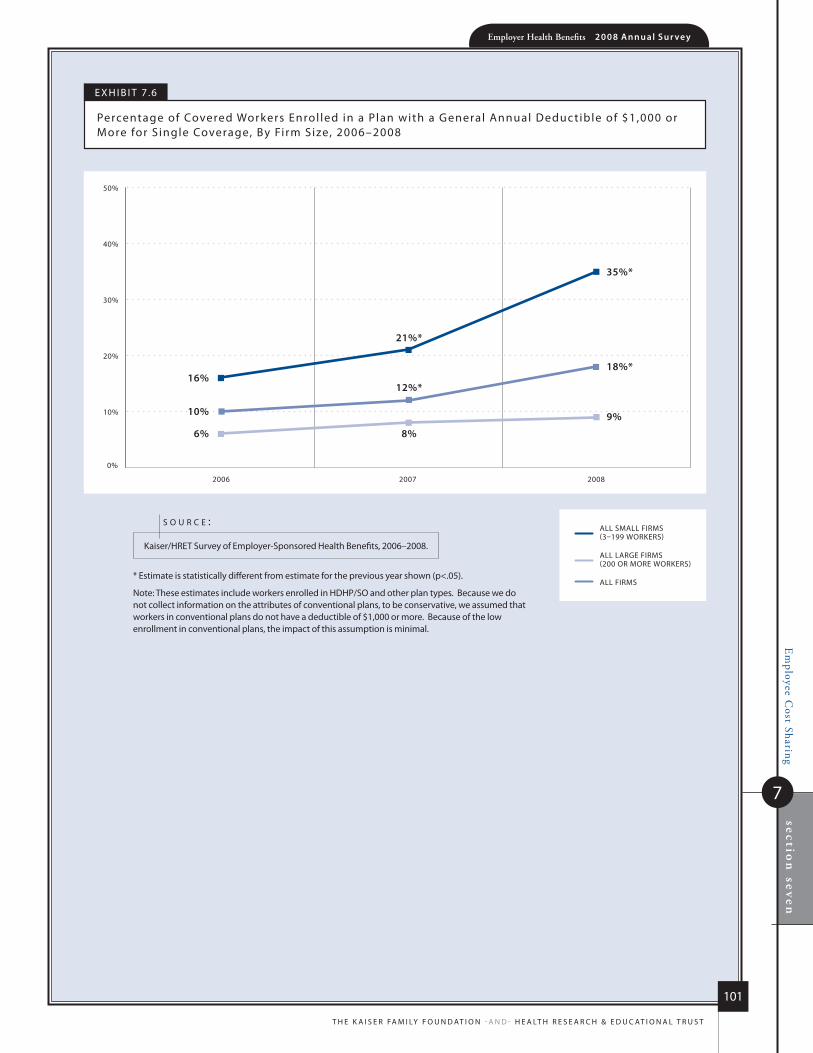
Em
ployee Cost Sharing
7
section
sevenEmployer Health Benefits 2 0 0 8 An n u a l s u r vey
101
t h e k a i s e r fa m i ly f o u n d at i o n - a n d - h e a lt h r e s e a r C h & e d u C at i o n a l t r u s t
2006 2007 2008
ALL LARGE FIRMS (200 OR MORE WORKERS)
ALL FIRMS
ALL SMALL FIRMS (3–199 WORKERS)
0%
10%
20%
30%
40%
50%
16%
6%
10%
21%*
8%
12%*
35%*
9%
18%*
e x h i B i t 7 .6
Percentage of Covered Workers enrol led in a Plan with a General annual deduc tible of $1,000 or more for s ingle Coverage, By firm size, 2006–2008
* estimate is statistically different from estimate for the previous year shown (p<.05).
note: these estimates include workers enrolled in hdhP/so and other plan types. Because we do not collect information on the attributes of conventional plans, to be conservative, we assumed that workers in conventional plans do not have a deductible of $1,000 or more. Because of the low enrollment in conventional plans, the impact of this assumption is minimal.
kaiser/hret survey of employer-sponsored health Benefits, 2006–2008.
s o u r c e :
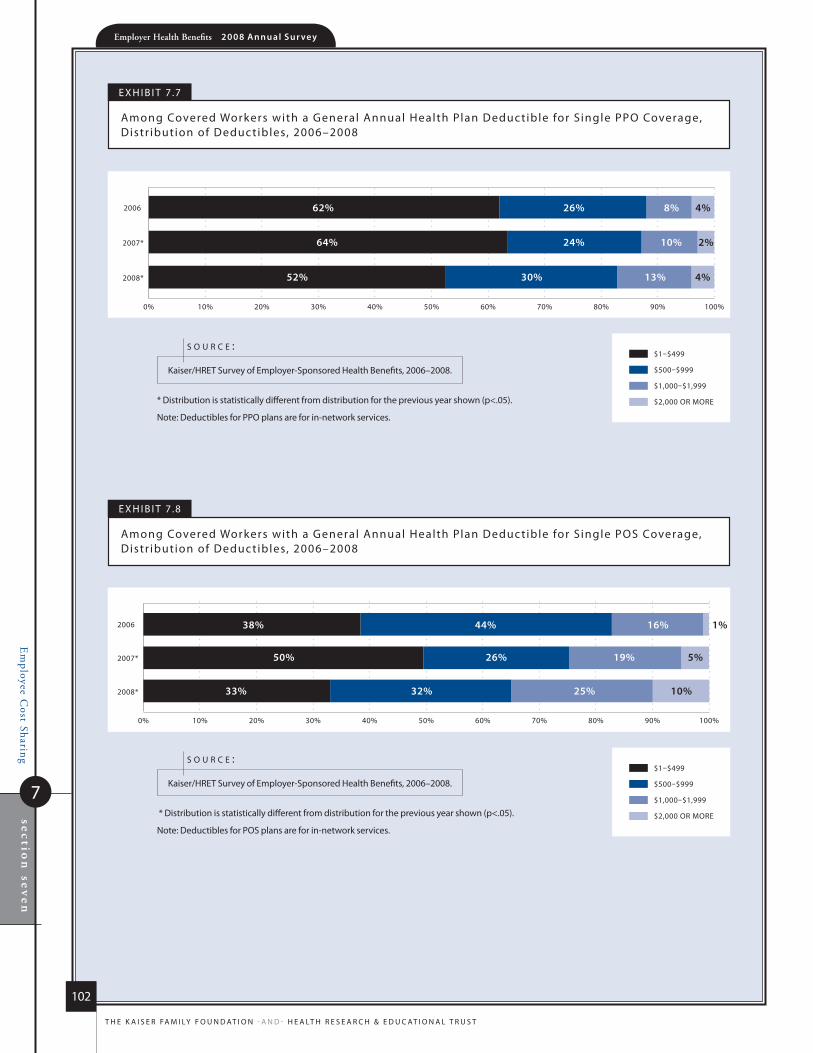
Em
ployee Cost Sharing
7sectio
n seven
Employer Health Benefits 2 0 0 8 An n u a l s u r vey
102
t h e k a i s e r fa m i ly f o u n d at i o n - a n d - h e a lt h r e s e a r C h & e d u C at i o n a l t r u s t
2008*
2007*
2006
$1–$499
$500–$999
$1,000–$1,999
$2,000 OR MORE
0% 10% 20% 30% 40% 50% 60% 70% 80% 90% 100%
26%50%
38% 44%
33% 32%
19%
16%
25%
5%
1%
10%
2008*
2007*
2006
$1–$499
$500–$999
$1,000–$1,999
$2,000 OR MORE
0% 10% 20% 30% 40% 50% 60% 70% 80% 90% 100%
24%64%
62% 26%
52% 30%
10%
8%
13%
2%
4%
4%
e x h i B i t 7 .7
among Covered Workers with a General annual health Plan deduc tible for s ingle PPo Coverage, distr ibution of deduc tibles, 2006–2008
e x h i B i t 7 .8
among Covered Workers with a General annual health Plan deduc tible for s ingle Pos Coverage, distr ibution of deduc tibles, 2006–2008
* distribution is statistically different from distribution for the previous year shown (p<.05).
note: deductibles for PPo plans are for in-network services.
kaiser/hret survey of employer-sponsored health Benefits, 2006–2008.
s o u r c e :
* distribution is statistically different from distribution for the previous year shown (p<.05).
note: deductibles for Pos plans are for in-network services.
kaiser/hret survey of employer-sponsored health Benefits, 2006–2008.
s o u r c e :
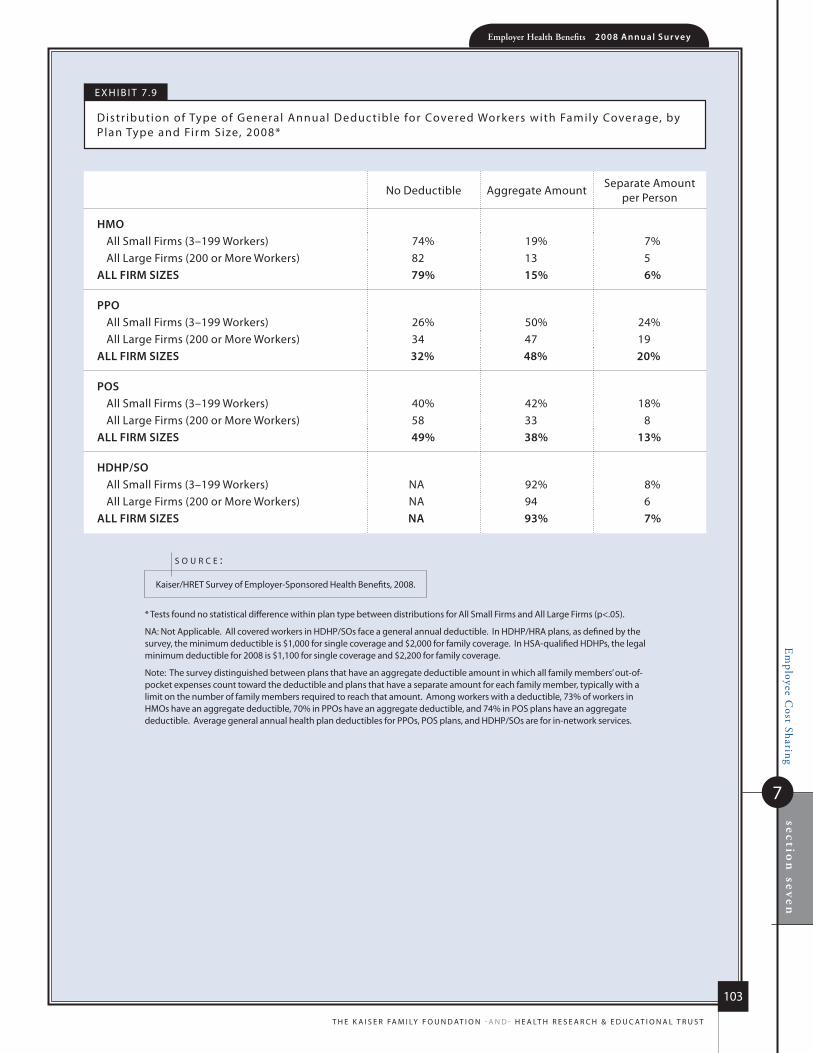
Em
ployee Cost Sharing
7
section
sevenEmployer Health Benefits 2 0 0 8 An n u a l s u r vey
103
t h e k a i s e r fa m i ly f o u n d at i o n - a n d - h e a lt h r e s e a r C h & e d u C at i o n a l t r u s t
no deductible aggregate amountseparate amount
per Person
hmoall small firms (3–199 Workers) 74% 19% 7%all large firms (200 or more Workers) 82 13 5
All firm sizes 79% 15% 6%
ppoall small firms (3–199 Workers) 26% 50% 24%all large firms (200 or more Workers) 34 47 19
All firm sizes 32% 48% 20%
posall small firms (3–199 Workers) 40% 42% 18%all large firms (200 or more Workers) 58 33 8
All firm sizes 49% 38% 13%
hDhp/soall small firms (3–199 Workers) na 92% 8%all large firms (200 or more Workers) na 94 6
All firm sizes NA 93% 7%
e x h i B i t 7 .9
distr ibution of type of General annual deduc tible for Covered Workers with family Coverage, by Plan type and firm size, 2008*
* tests found no statistical difference within plan type between distributions for all small firms and all large firms (p<.05).
na: not applicable. all covered workers in hdhP/sos face a general annual deductible. in hdhP/hra plans, as defined by the survey, the minimum deductible is $1,000 for single coverage and $2,000 for family coverage. in hsa-qualified hdhPs, the legal minimum deductible for 2008 is $1,100 for single coverage and $2,200 for family coverage.
note: the survey distinguished between plans that have an aggregate deductible amount in which all family members’ out-of-pocket expenses count toward the deductible and plans that have a separate amount for each family member, typically with a limit on the number of family members required to reach that amount. among workers with a deductible, 73% of workers in hmos have an aggregate deductible, 70% in PPos have an aggregate deductible, and 74% in Pos plans have an aggregate deductible. average general annual health plan deductibles for PPos, Pos plans, and hdhP/sos are for in-network services.
kaiser/hret survey of employer-sponsored health Benefits, 2008.
s o u r c e :
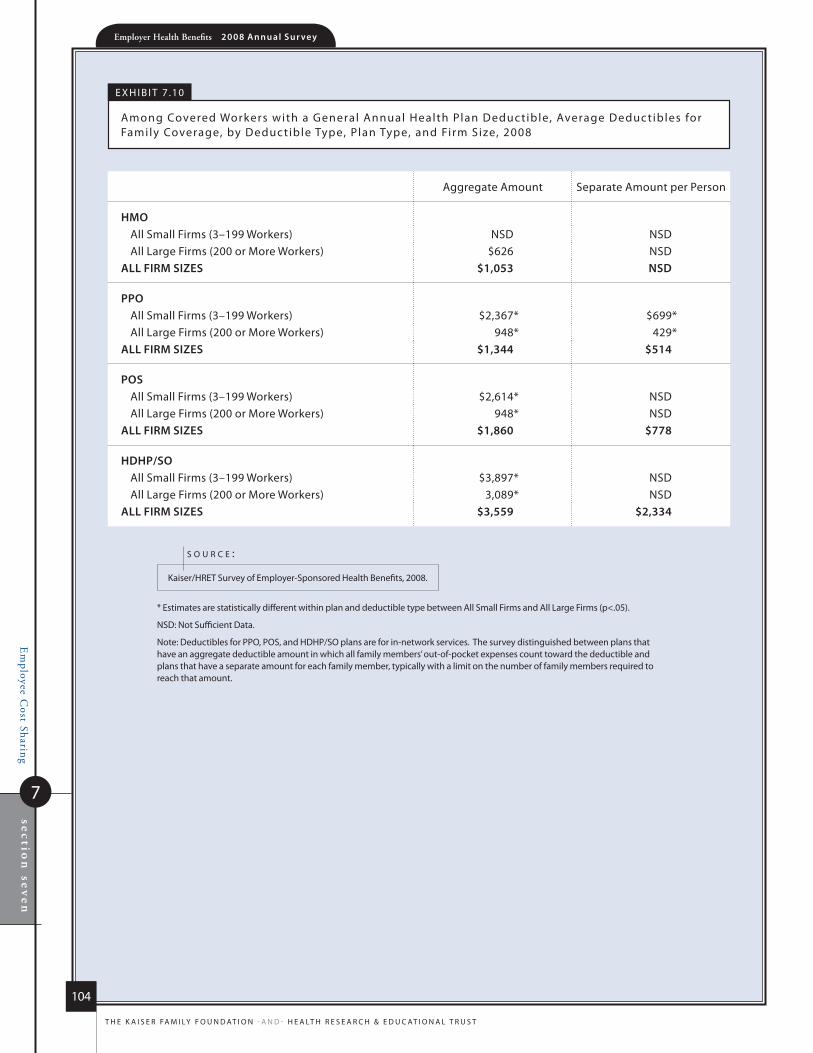
Em
ployee Cost Sharing
7sectio
n seven
Employer Health Benefits 2 0 0 8 An n u a l s u r vey
104
t h e k a i s e r fa m i ly f o u n d at i o n - a n d - h e a lt h r e s e a r C h & e d u C at i o n a l t r u s t
aggregate amount separate amount per Person
hmoall small firms (3–199 Workers) nsd nsdall large firms (200 or more Workers) $626 nsd
All firm sizes $1,053 NsD
ppoall small firms (3–199 Workers) $2,367* $699*all large firms (200 or more Workers) 948* 429*
All firm sizes $1,344 $514
posall small firms (3–199 Workers) $2,614* nsdall large firms (200 or more Workers) 948* nsd
All firm sizes $1,860 $778
hDhp/soall small firms (3–199 Workers) $3,897* nsdall large firms (200 or more Workers) 3,089* nsd
All firm sizes $3,559 $2,334
e x h i B i t 7 .10
among Covered Workers with a General annual health Plan deduc tible, average deduc tibles for family Coverage, by deduc tible type, Plan type, and firm size, 2008
* estimates are statistically different within plan and deductible type between all small firms and all large firms (p<.05).
nsd: not sufficient data.
note: deductibles for PPo, Pos, and hdhP/so plans are for in-network services. the survey distinguished between plans that have an aggregate deductible amount in which all family members’ out-of-pocket expenses count toward the deductible and plans that have a separate amount for each family member, typically with a limit on the number of family members required to reach that amount.
kaiser/hret survey of employer-sponsored health Benefits, 2008.
s o u r c e :
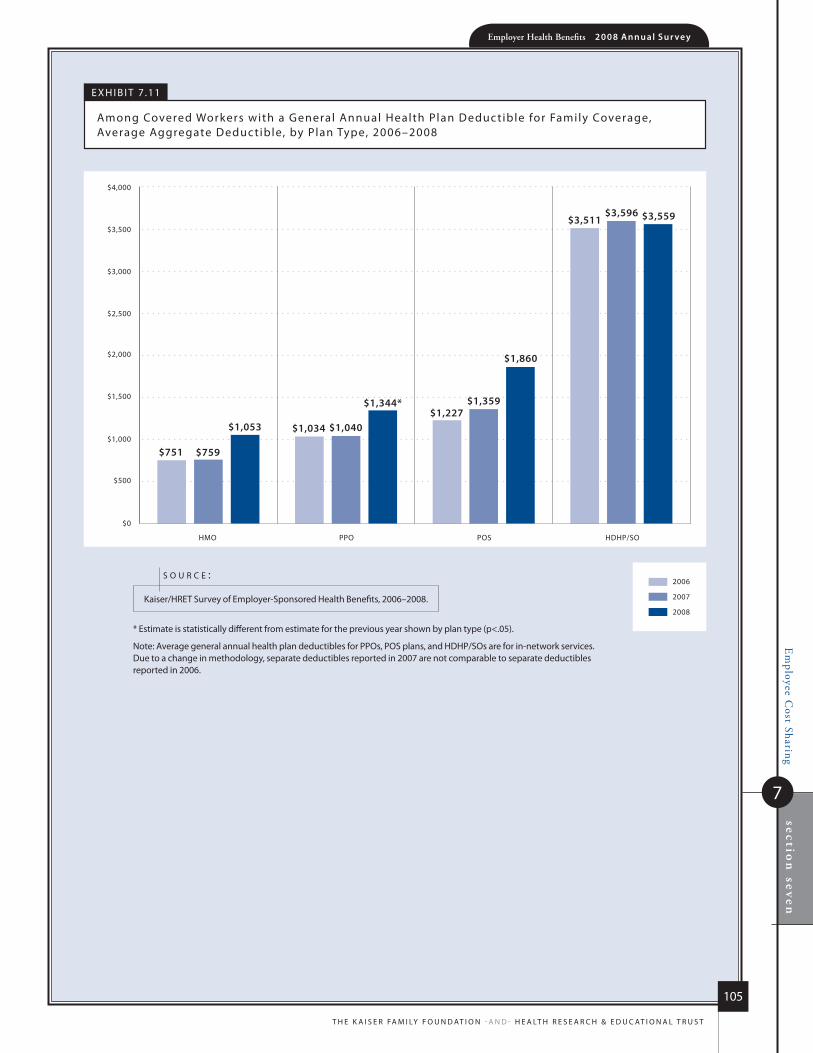
Em
ployee Cost Sharing
7
section
sevenEmployer Health Benefits 2 0 0 8 An n u a l s u r vey
105
t h e k a i s e r fa m i ly f o u n d at i o n - a n d - h e a lt h r e s e a r C h & e d u C at i o n a l t r u s t
HMO PPO POS HDHP/SO
2007
2008
2006
$0
$500
$1,000
$1,500
$2,000
$2,500
$3,000
$3,500
$4,000
$751 $759
$1,053 $1,034 $1,040
$1,344*$1,227
$1,359
$1,860
$3,511$3,596 $3,559
e x h i B i t 7 .11
among Covered Workers with a General annual health Plan deduc tible for family Coverage, average aggregate deduc tible, by Plan type, 2006–2008
* estimate is statistically different from estimate for the previous year shown by plan type (p<.05).
note: average general annual health plan deductibles for PPos, Pos plans, and hdhP/sos are for in-network services. due to a change in methodology, separate deductibles reported in 2007 are not comparable to separate deductibles reported in 2006.
kaiser/hret survey of employer-sponsored health Benefits, 2006–2008.
s o u r c e :
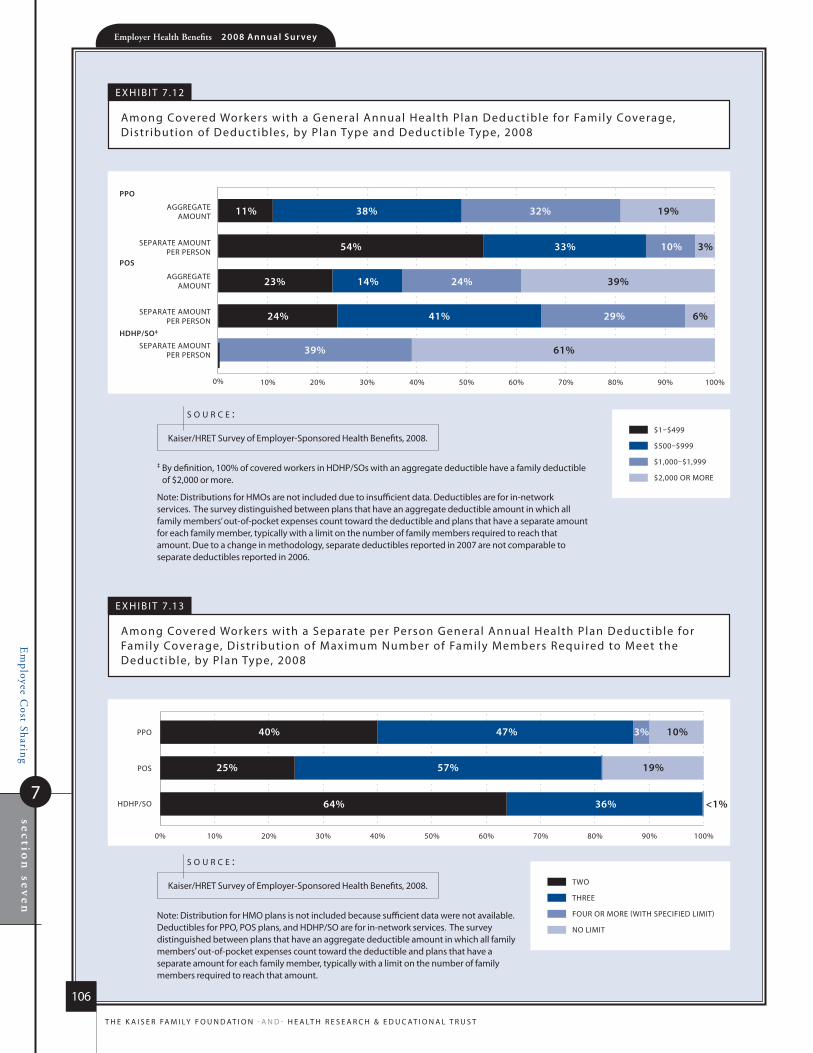
Em
ployee Cost Sharing
7sectio
n seven
Employer Health Benefits 2 0 0 8 An n u a l S u r vey
106
T h e K a i s e r Fa m i ly F o u n d aT i o n - a n d - h e a lT h r e s e a r c h & e d u c aT i o n a l T r u s T
HDHP/SO
POS
PPO
TWO
THREE
FOUR OR MORE (WITH SPECIFIED LIMIT)
NO LIMIT
0% 10% 20% 30% 40% 50% 60% 70% 80% 90% 100%
57%25%
40% 47%
64% 36%
3%
19%
10%
<1%
AGGREGATEAMOUNT
SEPARATE AMOUNTPER PERSON
AGGREGATEAMOUNT
PPO
POS
HDHP/SO‡
$1–$499
$500–$999
$1,000–$1,999
$2,000 OR MORE
SEPARATE AMOUNTPER PERSON
SEPARATE AMOUNTPER PERSON
0% 10% 20% 30% 40% 50% 60% 70% 80% 90% 100%
33%54%
11% 38%
23% 14%
10%
32%
24%
3%
19%
39%
24% 41% 29% 6%
39% 61%
e x h i b i T 7 .12
among covered Workers with a General annual health Plan deduc tible for Family coverage, distr ibution of deduc tibles, by Plan Type and deduc tible Type, 2008
‡ by definition, 100% of covered workers in hdhP/sos with an aggregate deductible have a family deductible of $2,000 or more.
note: distributions for hmos are not included due to insufficient data. deductibles are for in-network services. The survey distinguished between plans that have an aggregate deductible amount in which all family members’ out-of-pocket expenses count toward the deductible and plans that have a separate amount for each family member, typically with a limit on the number of family members required to reach that amount. due to a change in methodology, separate deductibles reported in 2007 are not comparable to separate deductibles reported in 2006.
Kaiser/hreT survey of employer-sponsored health benefits, 2008.
s o u r c e :
e x h i b i T 7 .13
among covered Workers with a separate per Person General annual health Plan deduc tible for Family coverage, distr ibution of maximum number of Family members required to meet the deduc tible, by Plan Type, 2008
note: distribution for hmo plans is not included because sufficient data were not available. deductibles for PPo, Pos plans, and hdhP/so are for in-network services. The survey distinguished between plans that have an aggregate deductible amount in which all family members’ out-of-pocket expenses count toward the deductible and plans that have a separate amount for each family member, typically with a limit on the number of family members required to reach that amount.
Kaiser/hreT survey of employer-sponsored health benefits, 2008.
s o u r c e :
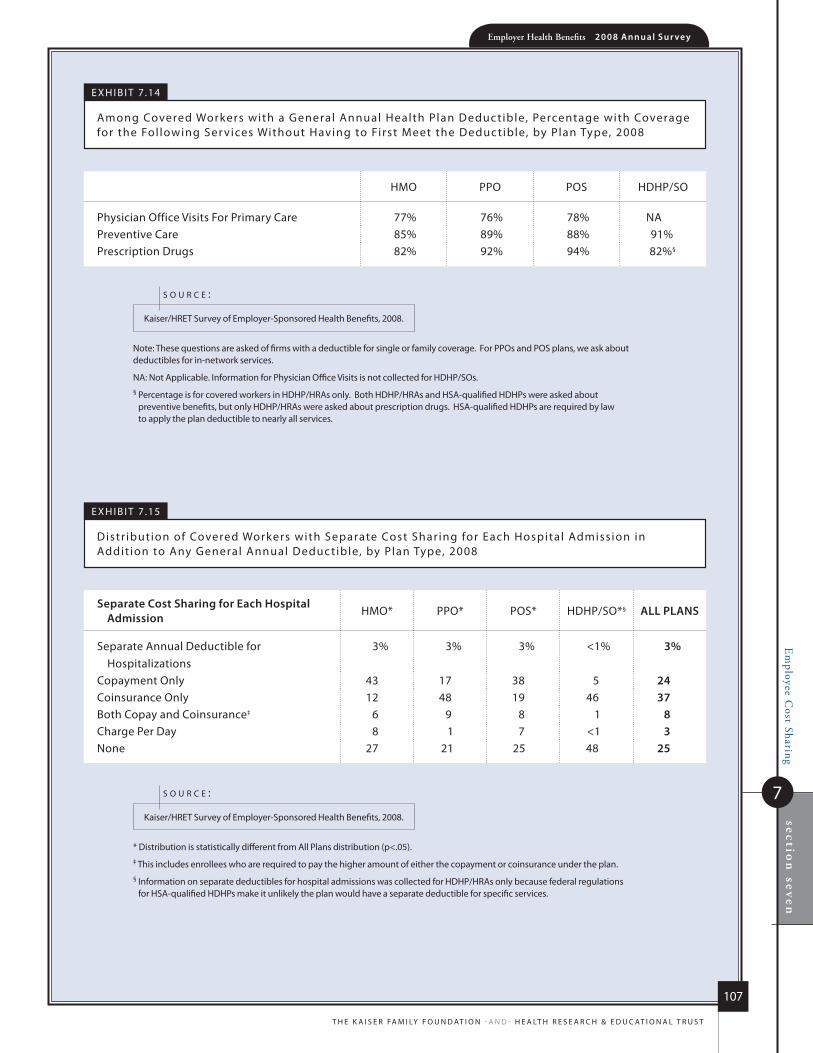
Em
ployee Cost Sharing
7
section
sevenEmployer Health Benefits 2 0 0 8 An n u a l s u r vey
107
t h e k a i s e r fa m i ly f o u n d at i o n - a n d - h e a lt h r e s e a r C h & e d u C at i o n a l t r u s t
hmo PPo Pos hdhP/so
Physician office Visits for Primary Care 77% 76% 78% naPreventive Care 85% 89% 88% 91%Prescription drugs 82% 92% 94% 82%§
separate Cost sharing for each hospital Admission hmo* PPo* Pos* hdhP/so*§ All plANs
separate annual deductible for hospitalizations
3% 3% 3% <1% 3%
Copayment only 43 17 38 5 24Coinsurance only 12 48 19 46 37Both Copay and Coinsurance‡ 6 9 8 1 8Charge Per day 8 1 7 <1 3none 27 21 25 48 25
e x h i B i t 7 .14
among Covered Workers with a General annual health Plan deduc tible, Percentage with Coverage for the fol lowing ser vices Without having to first meet the deduc tible, by Plan type, 2008
e x h i B i t 7 .15
distr ibution of Covered Workers with separate Cost shar ing for each hospital admission in addit ion to any General annual deduc tible, by Plan type, 2008
note: these questions are asked of firms with a deductible for single or family coverage. for PPos and Pos plans, we ask about deductibles for in-network services.
na: not applicable. information for Physician office Visits is not collected for hdhP/sos.§ Percentage is for covered workers in hdhP/hras only. Both hdhP/hras and hsa-qualified hdhPs were asked about
preventive benefits, but only hdhP/hras were asked about prescription drugs. hsa-qualified hdhPs are required by law to apply the plan deductible to nearly all services.
kaiser/hret survey of employer-sponsored health Benefits, 2008.
s o u r c e :
* distribution is statistically different from all Plans distribution (p<.05).‡ this includes enrollees who are required to pay the higher amount of either the copayment or coinsurance under the plan.§ information on separate deductibles for hospital admissions was collected for hdhP/hras only because federal regulations
for hsa-qualified hdhPs make it unlikely the plan would have a separate deductible for specific services.
kaiser/hret survey of employer-sponsored health Benefits, 2008.
s o u r c e :
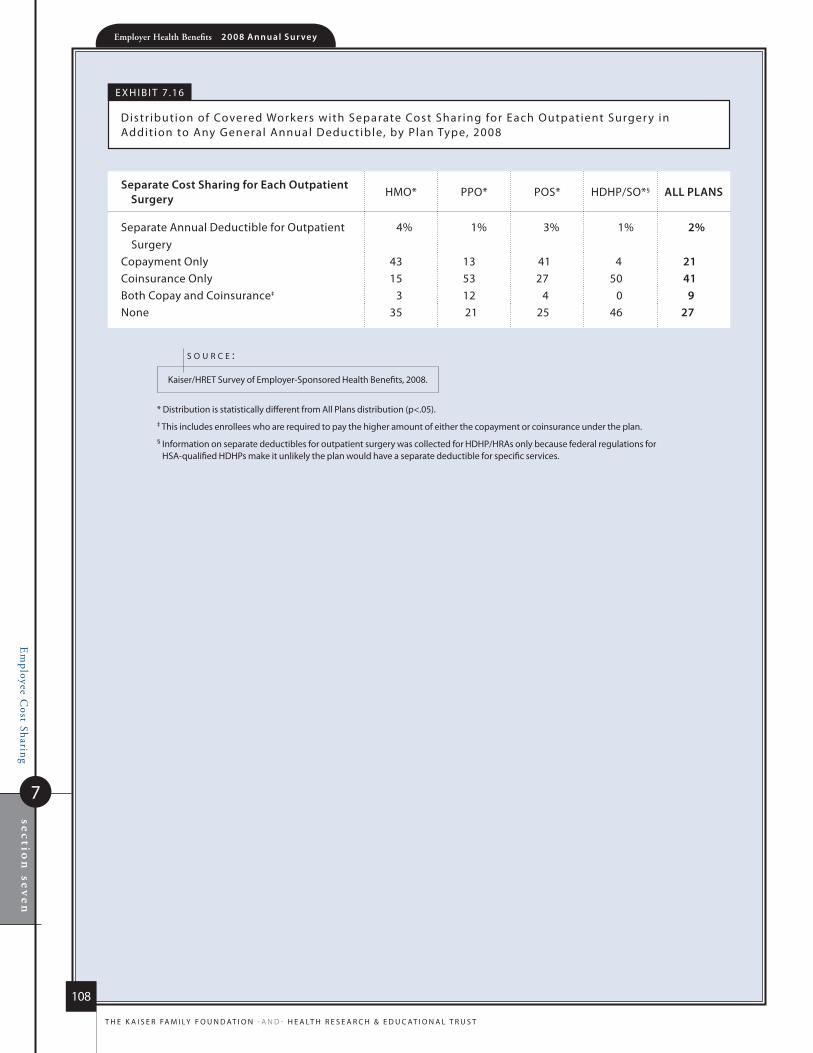
Em
ployee Cost Sharing
7sectio
n seven
Employer Health Benefits 2 0 0 8 An n u a l s u r vey
108
t h e k a i s e r fa m i ly f o u n d at i o n - a n d - h e a lt h r e s e a r C h & e d u C at i o n a l t r u s t
separate Cost sharing for each outpatient surgery
hmo* PPo* Pos* hdhP/so*§ All plANs
separate annual deductible for outpatient surgery
4% 1% 3% 1% 2%
Copayment only 43 13 41 4 21Coinsurance only 15 53 27 50 41Both Copay and Coinsurance‡ 3 12 4 0 9none 35 21 25 46 27
e x h i B i t 7 .16
distr ibution of Covered Workers with separate Cost shar ing for each outpatient surger y in addit ion to any General annual deduc tible, by Plan type, 2008
* distribution is statistically different from all Plans distribution (p<.05).‡ this includes enrollees who are required to pay the higher amount of either the copayment or coinsurance under the plan. § information on separate deductibles for outpatient surgery was collected for hdhP/hras only because federal regulations for
hsa-qualified hdhPs make it unlikely the plan would have a separate deductible for specific services.
kaiser/hret survey of employer-sponsored health Benefits, 2008.
s o u r c e :
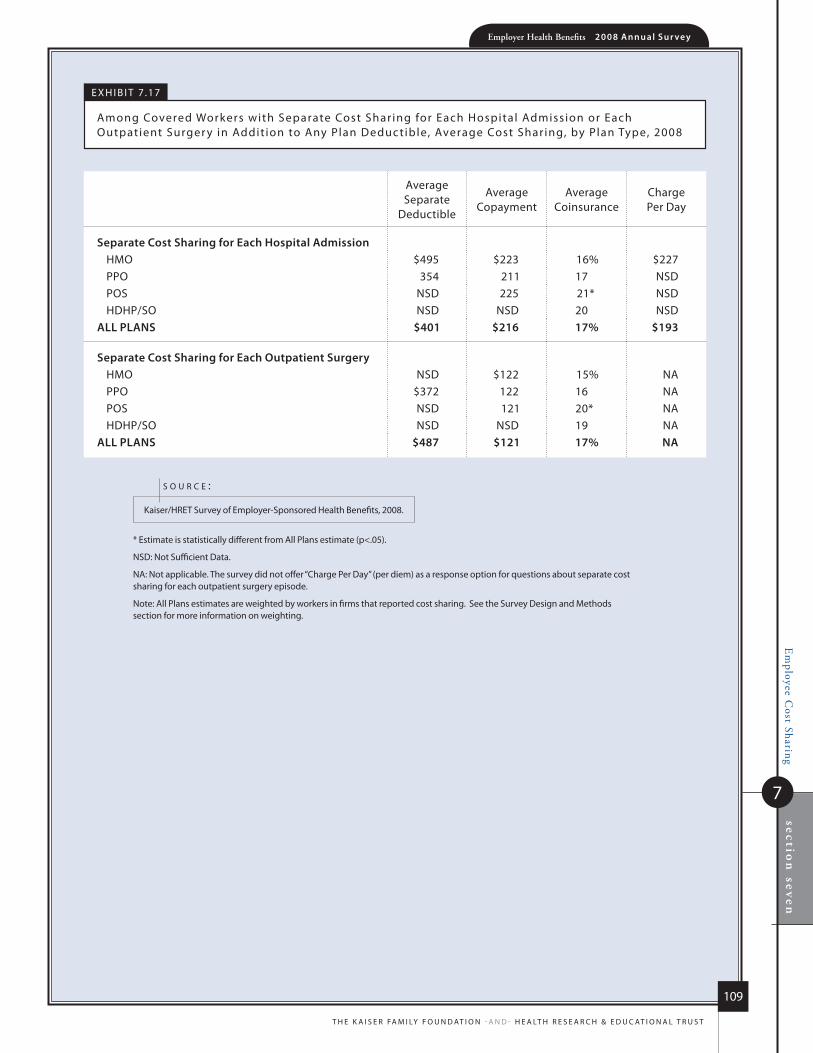
Em
ployee Cost Sharing
7
section
sevenEmployer Health Benefits 2 0 0 8 An n u a l s u r vey
109
t h e k a i s e r fa m i ly f o u n d at i o n - a n d - h e a lt h r e s e a r C h & e d u C at i o n a l t r u s t
average separate
deductible
average Copayment
average Coinsurance
Charge Per day
separate Cost sharing for each hospital Admissionhmo $495 $223 16% $227PPo 354 211 17 nsdPos nsd 225 21* nsdhdhP/so nsd nsd 20 nsd
All plANs $401 $216 17% $193
separate Cost sharing for each outpatient surgeryhmo nsd $122 15% naPPo $372 122 16 naPos nsd 121 20* nahdhP/so nsd nsd 19 na
All plANs $487 $121 17% NA
e x h i B i t 7 .17
among Covered Workers with separate Cost shar ing for each hospital admission or each outpatient surger y in addit ion to any Plan deduc tible, average Cost shar ing, by Plan type, 2008
* estimate is statistically different from all Plans estimate (p<.05).
nsd: not sufficient data.
na: not applicable. the survey did not offer “Charge Per day” (per diem) as a response option for questions about separate cost sharing for each outpatient surgery episode.
note: all Plans estimates are weighted by workers in firms that reported cost sharing. see the survey design and methods section for more information on weighting.
kaiser/hret survey of employer-sponsored health Benefits, 2008.
s o u r c e :
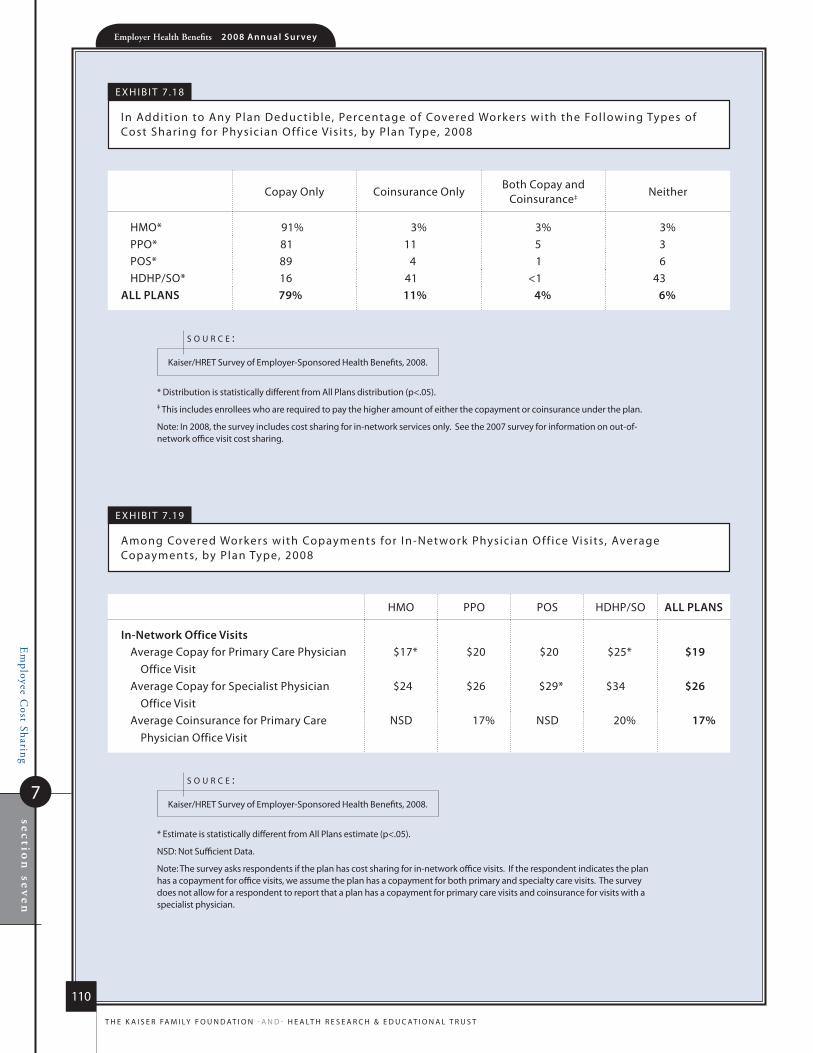
Em
ployee Cost Sharing
7sectio
n seven
Employer Health Benefits 2 0 0 8 An n u a l s u r vey
110
t h e k a i s e r fa m i ly f o u n d at i o n - a n d - h e a lt h r e s e a r C h & e d u C at i o n a l t r u s t
hmo PPo Pos hdhP/so All plANs
in-Network office visitsaverage Copay for Primary Care Physician office Visit
$17* $20 $20 $25* $19
average Copay for specialist Physician office Visit
$24 $26 $29* $34 $26
average Coinsurance for Primary Care Physician office Visit
nsd 17% nsd 20% 17%
Copay only Coinsurance onlyBoth Copay and
Coinsurance‡ neither
hmo* 91% 3% 3% 3%PPo* 81 11 5 3Pos* 89 4 1 6hdhP/so* 16 41 <1 43
All plANs 79% 11% 4% 6%
e x h i B i t 7 .19
among Covered Workers with Copayments for in-network Physic ian o ff ice Vis i ts , average Copayments, by Plan type, 2008
e x h i B i t 7 .18
in addit ion to any Plan deduc tible, Percentage of Covered Workers with the fol lowing types of Cost shar ing for Physic ian o ff ice Vis i ts , by Plan type, 2008
* estimate is statistically different from all Plans estimate (p<.05).
nsd: not sufficient data.
note: the survey asks respondents if the plan has cost sharing for in-network office visits. if the respondent indicates the plan has a copayment for office visits, we assume the plan has a copayment for both primary and specialty care visits. the survey does not allow for a respondent to report that a plan has a copayment for primary care visits and coinsurance for visits with a specialist physician.
kaiser/hret survey of employer-sponsored health Benefits, 2008.
s o u r c e :
* distribution is statistically different from all Plans distribution (p<.05).‡ this includes enrollees who are required to pay the higher amount of either the copayment or coinsurance under the plan.
note: in 2008, the survey includes cost sharing for in-network services only. see the 2007 survey for information on out-of-network office visit cost sharing.
kaiser/hret survey of employer-sponsored health Benefits, 2008.
s o u r c e :
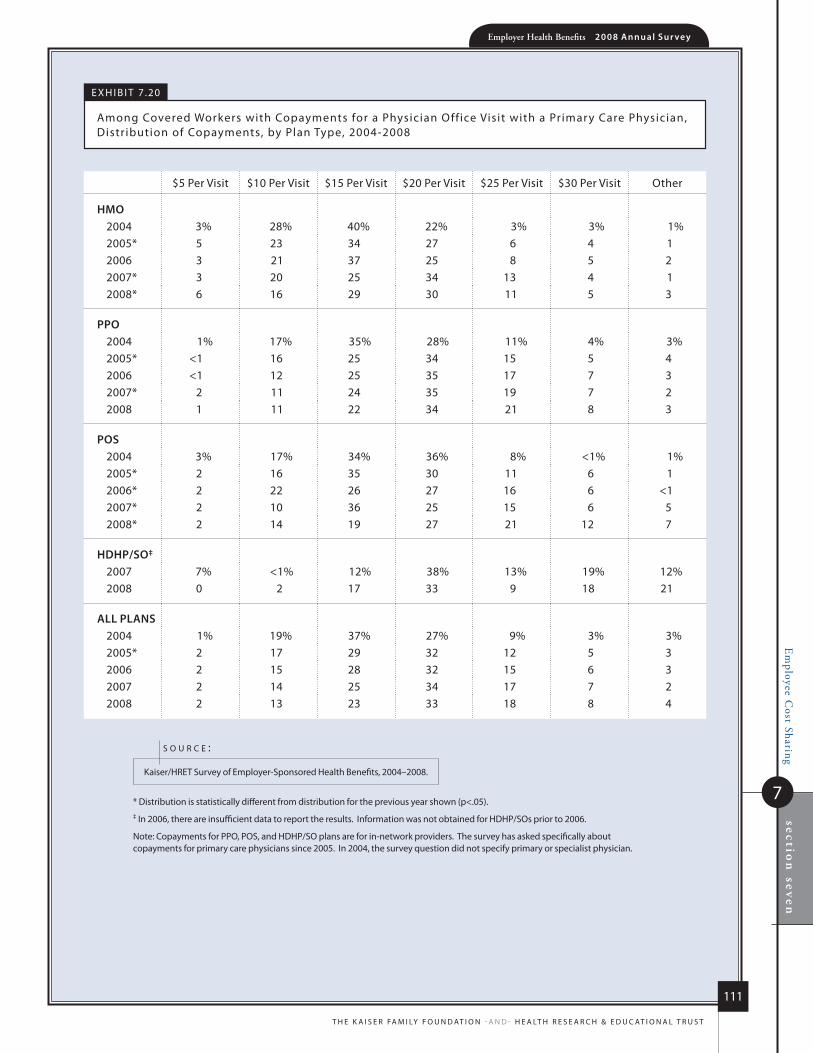
Em
ployee Cost Sharing
7
section
sevenEmployer Health Benefits 2 0 0 8 An n u a l s u r vey
111
t h e k a i s e r fa m i ly f o u n d at i o n - a n d - h e a lt h r e s e a r C h & e d u C at i o n a l t r u s t
$5 Per Visit $10 Per Visit $15 Per Visit $20 Per Visit $25 Per Visit $30 Per Visit other
hmo2004 3% 28% 40% 22% 3% 3% 1%2005* 5 23 34 27 6 4 12006 3 21 37 25 8 5 22007* 3 20 25 34 13 4 12008* 6 16 29 30 11 5 3
ppo2004 1% 17% 35% 28% 11% 4% 3%2005* <1 16 25 34 15 5 42006 <1 12 25 35 17 7 32007* 2 11 24 35 19 7 22008 1 11 22 34 21 8 3
pos2004 3% 17% 34% 36% 8% <1% 1%2005* 2 16 35 30 11 6 12006* 2 22 26 27 16 6 <12007* 2 10 36 25 15 6 52008* 2 14 19 27 21 12 7
hDhp/so‡
2007 7% <1% 12% 38% 13% 19% 12%2008 0 2 17 33 9 18 21
All plANs2004 1% 19% 37% 27% 9% 3% 3%2005* 2 17 29 32 12 5 32006 2 15 28 32 15 6 32007 2 14 25 34 17 7 22008 2 13 23 33 18 8 4
e x h i B i t 7 .20
among Covered Workers with Copayments for a Physician office Visit with a Primar y Care Physician, distr ibution of Copayments, by Plan type, 2004-2008
* distribution is statistically different from distribution for the previous year shown (p<.05).‡ in 2006, there are insufficient data to report the results. information was not obtained for hdhP/sos prior to 2006.
note: Copayments for PPo, Pos, and hdhP/so plans are for in-network providers. the survey has asked specifically about copayments for primary care physicians since 2005. in 2004, the survey question did not specify primary or specialist physician.
kaiser/hret survey of employer-sponsored health Benefits, 2004–2008.
s o u r c e :
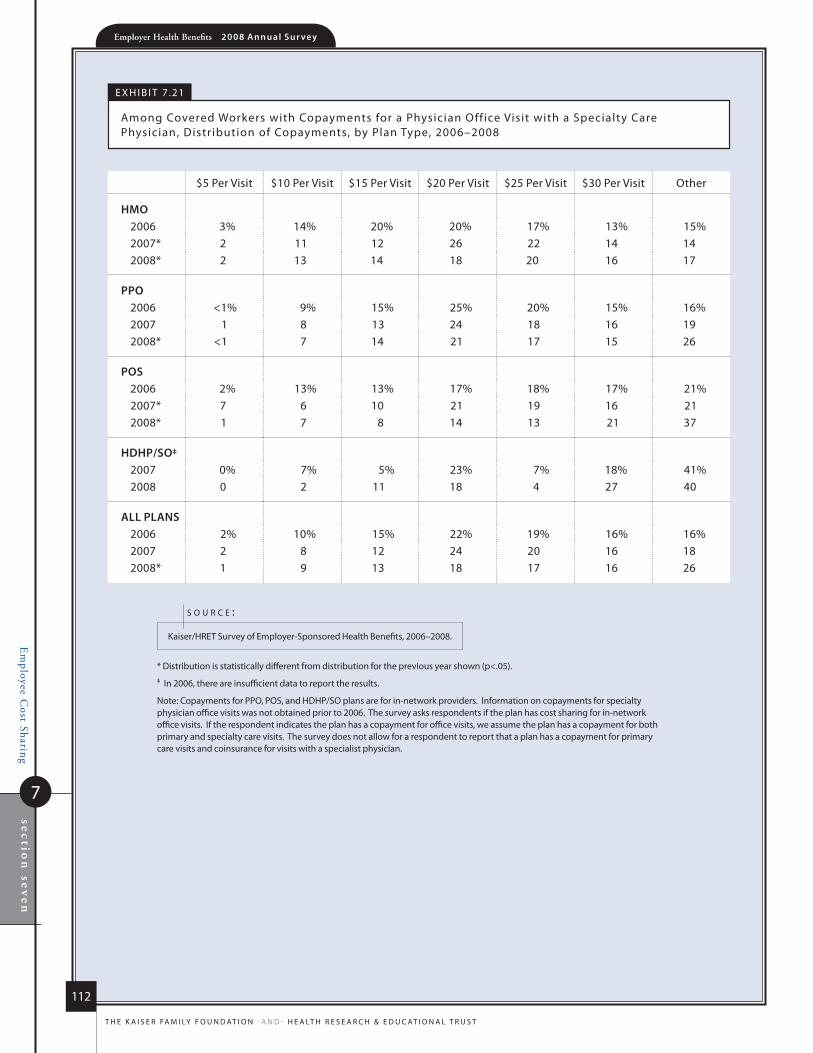
Em
ployee Cost Sharing
7sectio
n seven
Employer Health Benefits 2 0 0 8 An n u a l s u r vey
112
t h e k a i s e r fa m i ly f o u n d at i o n - a n d - h e a lt h r e s e a r C h & e d u C at i o n a l t r u s t
$5 Per Visit $10 Per Visit $15 Per Visit $20 Per Visit $25 Per Visit $30 Per Visit other
hmo2006 3% 14% 20% 20% 17% 13% 15%2007* 2 11 12 26 22 14 142008* 2 13 14 18 20 16 17
ppo2006 <1% 9% 15% 25% 20% 15% 16%2007 1 8 13 24 18 16 192008* <1 7 14 21 17 15 26
pos2006 2% 13% 13% 17% 18% 17% 21%2007* 7 6 10 21 19 16 212008* 1 7 8 14 13 21 37
hDhp/so‡
2007 0% 7% 5% 23% 7% 18% 41%2008 0 2 11 18 4 27 40
All plANs2006 2% 10% 15% 22% 19% 16% 16%2007 2 8 12 24 20 16 182008* 1 9 13 18 17 16 26
e x h i B i t 7 .21
among Covered Workers with Copayments for a Physician office Visit with a specialty Care Physician, distr ibution of Copayments, by Plan type, 2006–2008
* distribution is statistically different from distribution for the previous year shown (p<.05).‡ in 2006, there are insufficient data to report the results.
note: Copayments for PPo, Pos, and hdhP/so plans are for in-network providers. information on copayments for specialty physician office visits was not obtained prior to 2006. the survey asks respondents if the plan has cost sharing for in-network office visits. if the respondent indicates the plan has a copayment for office visits, we assume the plan has a copayment for both primary and specialty care visits. the survey does not allow for a respondent to report that a plan has a copayment for primary care visits and coinsurance for visits with a specialist physician.
kaiser/hret survey of employer-sponsored health Benefits, 2006–2008.
s o u r c e :

Em
ployee Cost Sharing
7
section
sevenEmployer Health Benefits 2 0 0 8 An n u a l s u r vey
113
t h e k a i s e r fa m i ly f o u n d at i o n - a n d - h e a lt h r e s e a r C h & e d u C at i o n a l t r u s t
$5 Per Visit $10 Per Visit $15 Per Visit $20 Per Visit other
1999 23% 60% 12% 1% 3%2000* 22 54 16 3 62001* 15 56 22 3 42002* 7 52 27 11 32003* 4 35 37 12 122004* 3 28 40 22 72005* 5 23 34 27 112006 3 21 37 25 152007* 3 20 25 34 182008* 6 16 29 30 19
Coinsurance rates 10% or 15% 20% or 25% 30% or 35% 40% or 45% other
PPo 35% 63% 1% <1% 1%hdhP/so* 24 65 6 0 5
All plANs 38% 59% 1% <1% 1%
e x h i B i t 7 .22
among Covered Workers in hmos with a Copayment for a Physic ian o ff ice Vis i t , Percentage with Var ious Copayments, 1999–2008
e x h i B i t 7 .23
among Covered Workers with Coinsurance for Physic ian o ff ice Vis i ts , distr ibution of average Coinsurance r ates, by Plan type, 2008
* distribution is statistically different from distribution for the previous year shown (p<.05).
note: the survey has asked specifically about copayments for primary care physicians since 2005. Prior to 2005, the survey question did not specify primary or specialist physician.
kaiser/hret survey of employer-sponsored health Benefits, 1999–2008.
s o u r c e :
* distribution is statistically different from all Plans distribution (p<.05).
note: Coinsurance rates for hmo and Pos plans are not shown because there is not sufficient data as only 3% or 4% of covered workers, respectively, face coinsurance for office visits.
kaiser/hret survey of employer-sponsored health Benefits, 2008.
s o u r c e :
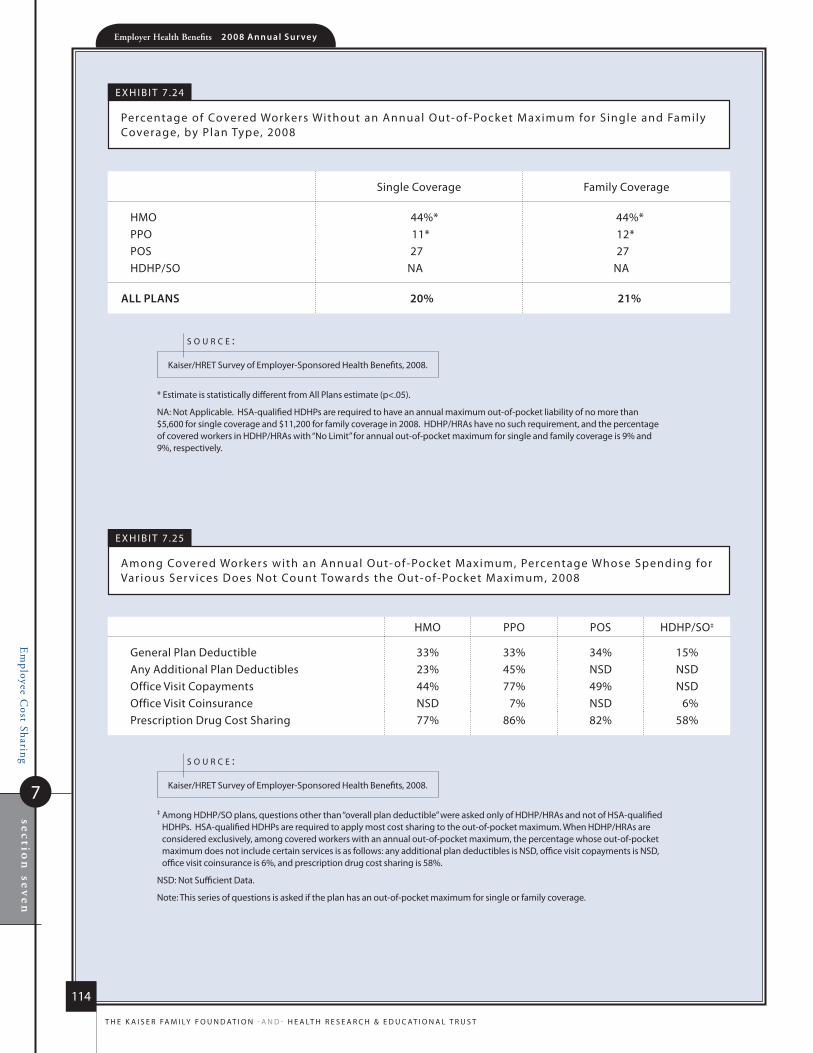
Em
ployee Cost Sharing
7sectio
n seven
Employer Health Benefits 2 0 0 8 An n u a l s u r vey
114
t h e k a i s e r fa m i ly f o u n d at i o n - a n d - h e a lt h r e s e a r C h & e d u C at i o n a l t r u s t
single Coverage family Coverage
hmo 44%* 44%*PPo 11* 12*Pos 27 27hdhP/so na na
All plANs 20% 21%
e x h i B i t 7 .24
Percentage of Covered Workers Without an annual out- of-Pocket maximum for s ingle and family Coverage, by Plan type, 2008
* estimate is statistically different from all Plans estimate (p<.05).
na: not applicable. hsa-qualified hdhPs are required to have an annual maximum out-of-pocket liability of no more than $5,600 for single coverage and $11,200 for family coverage in 2008. hdhP/hras have no such requirement, and the percentage of covered workers in hdhP/hras with “no limit” for annual out-of-pocket maximum for single and family coverage is 9% and 9%, respectively.
kaiser/hret survey of employer-sponsored health Benefits, 2008.
s o u r c e :
hmo PPo Pos hdhP/so‡
General Plan deductible 33% 33% 34% 15%any additional Plan deductibles 23% 45% nsd nsdoffice Visit Copayments 44% 77% 49% nsdoffice Visit Coinsurance nsd 7% nsd 6%Prescription drug Cost sharing 77% 86% 82% 58%
e x h i B i t 7 .25
among Covered Workers with an annual out- of-Pocket maximum, Percentage Whose spending for Var ious ser vices does not Count towards the out- of-Pocket maximum, 2008
‡ among hdhP/so plans, questions other than “overall plan deductible” were asked only of hdhP/hras and not of hsa-qualified hdhPs. hsa-qualified hdhPs are required to apply most cost sharing to the out-of-pocket maximum. When hdhP/hras are considered exclusively, among covered workers with an annual out-of-pocket maximum, the percentage whose out-of-pocket maximum does not include certain services is as follows: any additional plan deductibles is nsd, office visit copayments is nsd, office visit coinsurance is 6%, and prescription drug cost sharing is 58%.
nsd: not sufficient data.
note: this series of questions is asked if the plan has an out-of-pocket maximum for single or family coverage.
kaiser/hret survey of employer-sponsored health Benefits, 2008.
s o u r c e :
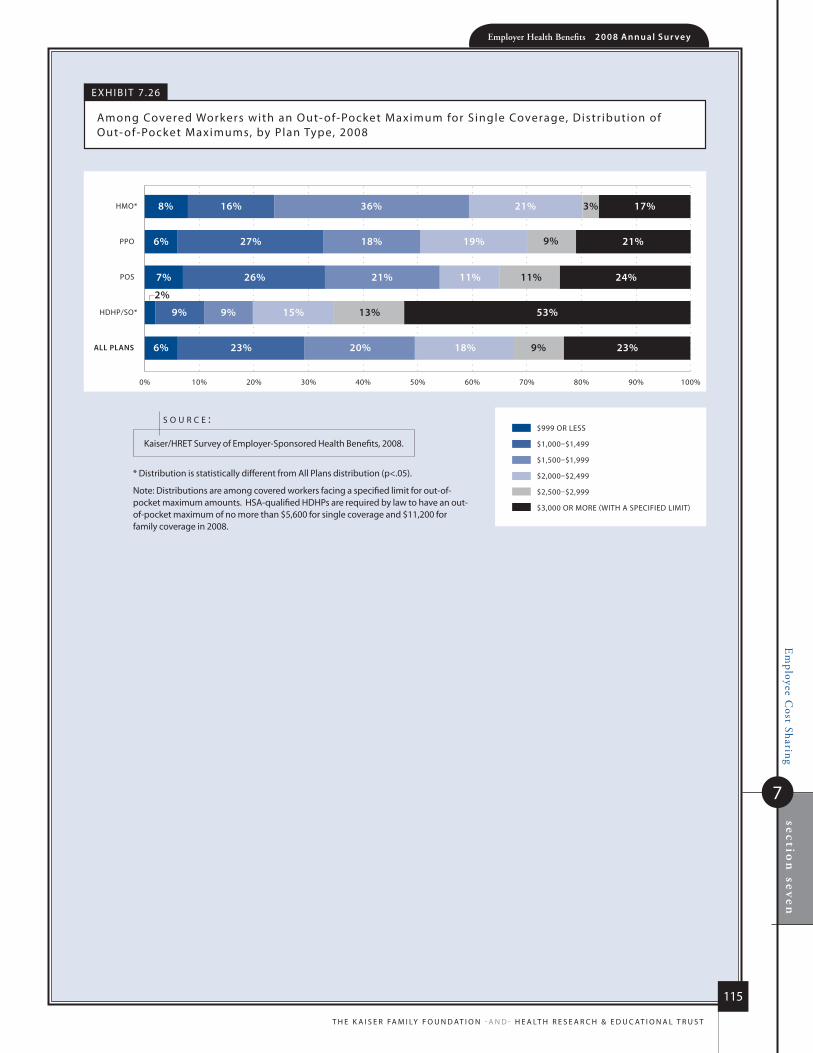
Em
ployee Cost Sharing
7
section
sevenEmployer Health Benefits 2 0 0 8 An n u a l s u r vey
115
t h e k a i s e r fa m i ly f o u n d at i o n - a n d - h e a lt h r e s e a r C h & e d u C at i o n a l t r u s t
POS
PPO
HMO*
$999 OR LESS
$1,000–$1,499
$1,500–$1,999
$2,000–$2,499
$2,500–$2,999
$3,000 OR MORE (WITH A SPECIFIED LIMIT)
0% 10% 20% 30% 40% 50% 60% 70% 80% 90% 100%
18% 19%6% 27%
8% 16%
26%7% 21%
9%
36%
11%
21%
3% 17%21%
11% 24%
HDHP/SO* 9%
2%
9% 13%15% 53%
ALL PLANS 6% 23% 20% 18% 9% 23%
e x h i B i t 7 .26
among Covered Workers with an out- of-Pocket maximum for s ingle Coverage, distr ibution of out- of-Pocket maximums, by Plan type, 2008
* distribution is statistically different from all Plans distribution (p<.05).
note: distributions are among covered workers facing a specified limit for out-of-pocket maximum amounts. hsa-qualified hdhPs are required by law to have an out-of-pocket maximum of no more than $5,600 for single coverage and $11,200 for family coverage in 2008.
kaiser/hret survey of employer-sponsored health Benefits, 2008.
s o u r c e :
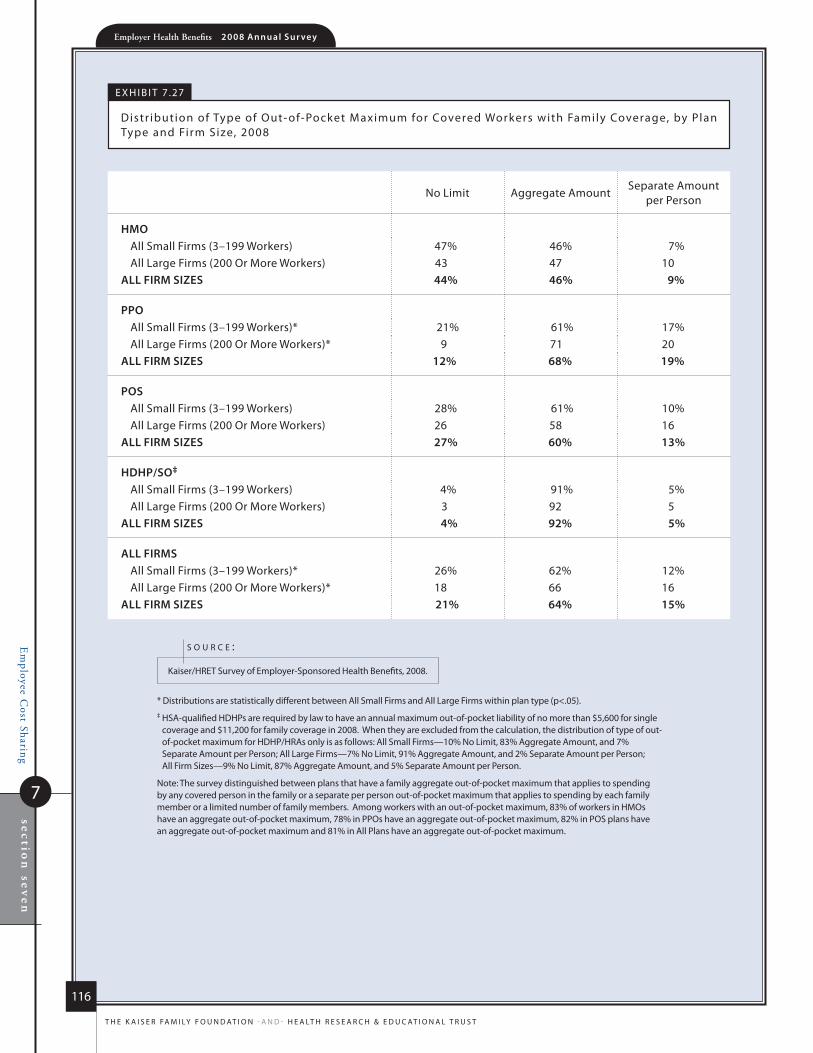
Em
ployee Cost Sharing
7sectio
n seven
Employer Health Benefits 2 0 0 8 An n u a l s u r vey
116
t h e k a i s e r fa m i ly f o u n d at i o n - a n d - h e a lt h r e s e a r C h & e d u C at i o n a l t r u s t
no limit aggregate amountseparate amount
per Person
hmoall small firms (3–199 Workers) 47% 46% 7%all large firms (200 or more Workers) 43 47 10
All firm sizes 44% 46% 9%
ppoall small firms (3–199 Workers)* 21% 61% 17%all large firms (200 or more Workers)* 9 71 20
All firm sizes 12% 68% 19%
posall small firms (3–199 Workers) 28% 61% 10%all large firms (200 or more Workers) 26 58 16
All firm sizes 27% 60% 13%
hDhp/so‡ all small firms (3–199 Workers) 4% 91% 5%all large firms (200 or more Workers) 3 92 5
All firm sizes 4% 92% 5%
All firmsall small firms (3–199 Workers)* 26% 62% 12%all large firms (200 or more Workers)* 18 66 16
All firm sizes 21% 64% 15%
e x h i B i t 7 .27
distr ibution of type of out- of-Pocket maximum for Covered Workers with family Coverage, by Plan type and firm size, 2008
* distributions are statistically different between all small firms and all large firms within plan type (p<.05).‡ hsa-qualified hdhPs are required by law to have an annual maximum out-of-pocket liability of no more than $5,600 for single
coverage and $11,200 for family coverage in 2008. When they are excluded from the calculation, the distribution of type of out-of-pocket maximum for hdhP/hras only is as follows: all small firms—10% no limit, 83% aggregate amount, and 7% separate amount per Person; all large firms—7% no limit, 91% aggregate amount, and 2% separate amount per Person; all firm sizes—9% no limit, 87% aggregate amount, and 5% separate amount per Person.
note: the survey distinguished between plans that have a family aggregate out-of-pocket maximum that applies to spending by any covered person in the family or a separate per person out-of-pocket maximum that applies to spending by each family member or a limited number of family members. among workers with an out-of-pocket maximum, 83% of workers in hmos have an aggregate out-of-pocket maximum, 78% in PPos have an aggregate out-of-pocket maximum, 82% in Pos plans have an aggregate out-of-pocket maximum and 81% in all Plans have an aggregate out-of-pocket maximum.
kaiser/hret survey of employer-sponsored health Benefits, 2008.
s o u r c e :
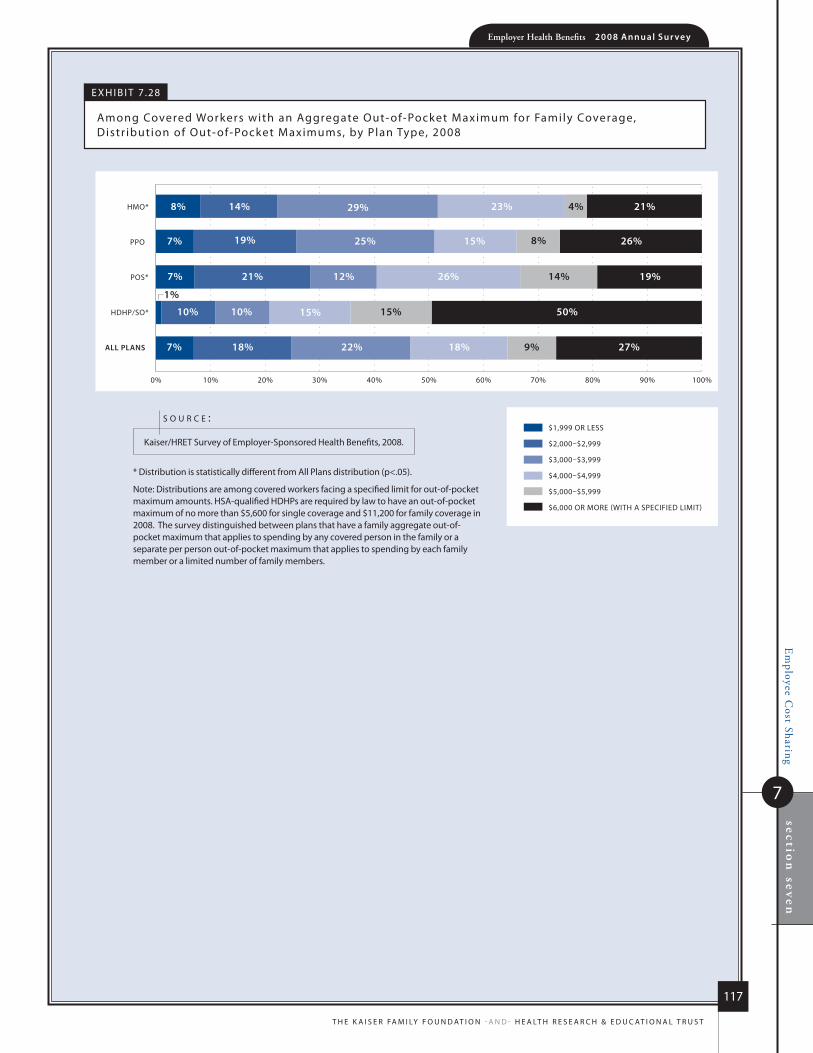
Em
ployee Cost Sharing
7
section
sevenEmployer Health Benefits 2 0 0 8 An n u a l s u r vey
117
t h e k a i s e r fa m i ly f o u n d at i o n - a n d - h e a lt h r e s e a r C h & e d u C at i o n a l t r u s t
POS*
PPO
HMO*
$1,999 OR LESS
$2,000–$2,999
$3,000–$3,999
$4,000–$4,999
$5,000–$5,999
$6,000 OR MORE (WITH A SPECIFIED LIMIT)
0% 10% 20% 30% 40% 50% 60% 70% 80% 90% 100%
25% 15%7% 19%
8% 14%
21%7% 12%
8%
29%
26%
26%
4% 21%23%
14% 19%
HDHP/SO* 10% 10% 15%15% 50%
ALL PLANS 7% 18% 22% 18% 9% 27%
1%
e x h i B i t 7 .28
among Covered Workers with an aggregate out- of-Pocket maximum for family Coverage, distr ibution of out- of-Pocket maximums, by Plan type, 2008
* distribution is statistically different from all Plans distribution (p<.05).
note: distributions are among covered workers facing a specified limit for out-of-pocket maximum amounts. hsa-qualified hdhPs are required by law to have an out-of-pocket maximum of no more than $5,600 for single coverage and $11,200 for family coverage in 2008. the survey distinguished between plans that have a family aggregate out-of-pocket maximum that applies to spending by any covered person in the family or a separate per person out-of-pocket maximum that applies to spending by each family member or a limited number of family members.
kaiser/hret survey of employer-sponsored health Benefits, 2008.
s o u r c e :
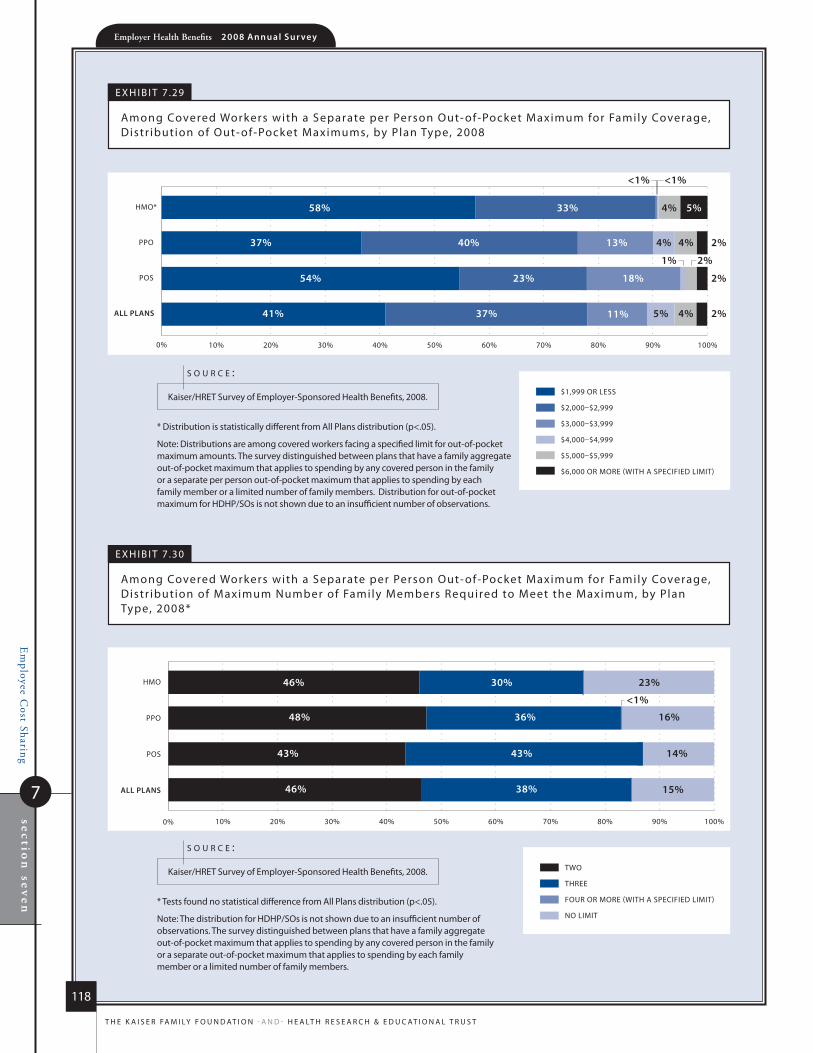
Em
ployee Cost Sharing
7sectio
n seven
Employer Health Benefits 2 0 0 8 An n u a l s u r vey
118
t h e k a i s e r fa m i ly f o u n d at i o n - a n d - h e a lt h r e s e a r C h & e d u C at i o n a l t r u s t
POS
PPO
HMO*
$1,999 OR LESS
$2,000–$2,999
$3,000–$3,999
$4,000–$4,999
$5,000–$5,999
$6,000 OR MORE (WITH A SPECIFIED LIMIT)
0% 10% 20% 30% 40% 50% 60% 70% 80% 90% 100%
13% 4%37% 40%
58% 33%
23%54% 18%
4% 2%
4% 5%
2%
ALL PLANS 41% 37% 5%11% 4% 2%
<1%<1%
2%1%
e x h i B i t 7 .29
among Covered Workers with a separate per Person out- of-Pocket maximum for family Coverage, distr ibution of out- of-Pocket maximums, by Plan type, 2008
* distribution is statistically different from all Plans distribution (p<.05).
note: distributions are among covered workers facing a specified limit for out-of-pocket maximum amounts. the survey distinguished between plans that have a family aggregate out-of-pocket maximum that applies to spending by any covered person in the family or a separate per person out-of-pocket maximum that applies to spending by each family member or a limited number of family members. distribution for out-of-pocket maximum for hdhP/sos is not shown due to an insufficient number of observations.
kaiser/hret survey of employer-sponsored health Benefits, 2008.
s o u r c e :
POS
PPO
HMO
TWO
THREE
FOUR OR MORE (WITH A SPECIFIED LIMIT)
NO LIMIT
0% 10% 20% 30% 40% 50% 60% 70% 80% 90% 100%
16%48% 36%
46% 30%
43%43% 14%
23%
ALL PLANS 46% 38% 15%
<1%
e x h i B i t 7 .30
among Covered Workers with a separate per Person out- of-Pocket maximum for family Coverage, distr ibution of maximum number of family members required to meet the maximum, by Plan type, 2008*
* tests found no statistical difference from all Plans distribution (p<.05).
note: the distribution for hdhP/sos is not shown due to an insufficient number of observations. the survey distinguished between plans that have a family aggregate out-of-pocket maximum that applies to spending by any covered person in the family or a separate out-of-pocket maximum that applies to spending by each family member or a limited number of family members.
kaiser/hret survey of employer-sponsored health Benefits, 2008.
s o u r c e :
63%$12,6
80
$4,7
04
2008
Employer Health Benefits2 0 0 8 a n n u a l s u r V e y
s ect ion
High-Deductible Health Plans with Savings
Option
8
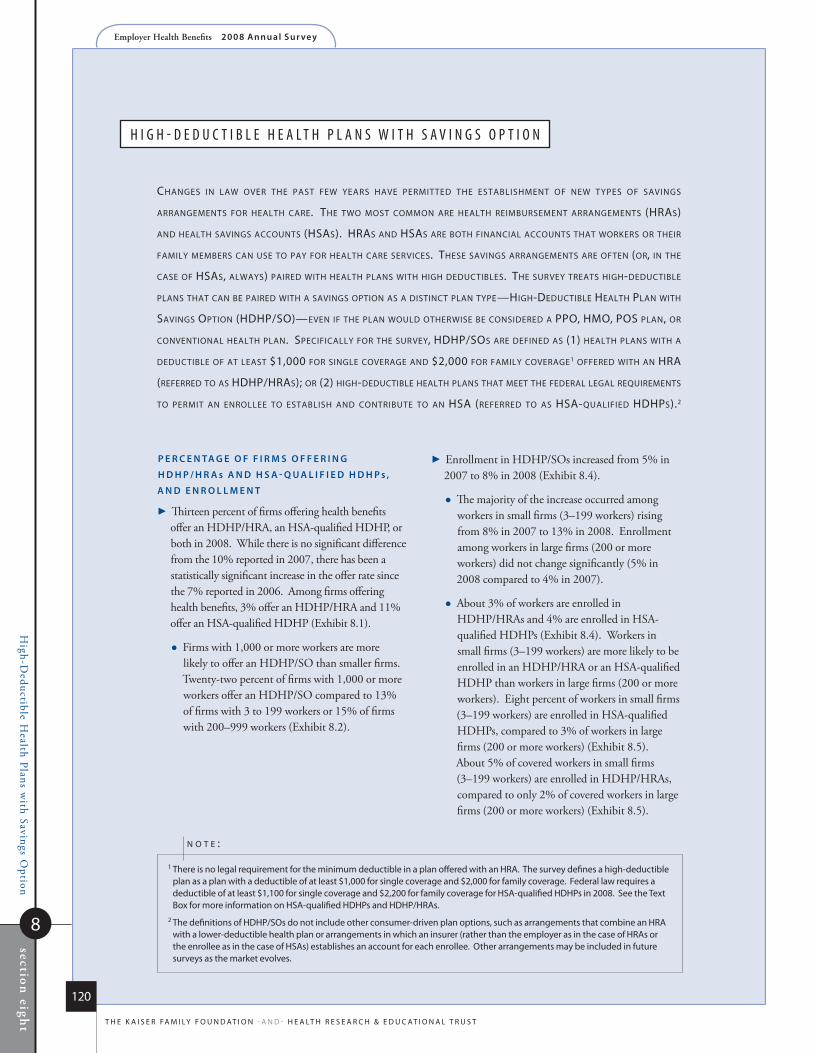
High-D
eductible Health Plans w
ith Savings Option
8
section
eight
Employer Health Benefits 2 0 0 8 An n u a l s u r vey
120
t h e k a i s e r fa m i ly f o u n d at i o n - a n d - h e a lt h r e s e a r C h & e d u C at i o n a l t r u s t
h i g h - D e D u C t i B l e h e a l t h p l a n S W i t h S a v i n g S o p t i o n
changes in law over The pasT few years have permiTTed The esTablishmenT of new Types of savings
arrangemenTs for healTh care. The Two mosT common are healTh reimbursemenT arrangemenTs (hras)
and healTh savings accounTs (hsas). hras and hsas are boTh financial accounTs ThaT workers or Their
family members can use To pay for healTh care services. These savings arrangemenTs are ofTen (or, in The
case of hsas, always) paired wiTh healTh plans wiTh high deducTibles. The survey TreaTs high-deducTible
plans ThaT can be paired wiTh a savings opTion as a disTincT plan Type—high-deducTible healTh plan wiTh
savings opTion (hdhp/so)—even if The plan would oTherwise be considered a ppo, hmo, pos plan, or
convenTional healTh plan. specifically for The survey, hdhp/sos are defined as (1) healTh plans wiTh a
deducTible of aT leasT $1,000 for single coverage and $2,000 for family coverage1 offered wiTh an hra
(referred To as hdhp/hras); or (2) high-deducTible healTh plans ThaT meeT The federal legal requiremenTs
To permiT an enrollee To esTablish and conTribuTe To an hsa (referred To as hsa-qualified hdhps).2
1 there is no legal requirement for the minimum deductible in a plan offered with an hra. the survey defines a high-deductible plan as a plan with a deductible of at least $1,000 for single coverage and $2,000 for family coverage. federal law requires a deductible of at least $1,100 for single coverage and $2,200 for family coverage for hsa-qualified hdhPs in 2008. see the text Box for more information on hsa-qualified hdhPs and hdhP/hras.
2 the definitions of hdhP/sos do not include other consumer-driven plan options, such as arrangements that combine an hra with a lower-deductible health plan or arrangements in which an insurer (rather than the employer as in the case of hras or the enrollee as in the case of hsas) establishes an account for each enrollee. other arrangements may be included in future surveys as the market evolves.
n o T e :
p e r C e N TA g e o f f i r m s o f f e r i N g
h D h p / h r A s A N D h s A - Q u A l i f i e D h D h p s ,
A N D e N r o l l m e N T
�Thirteen percent of firms offering health benefits offer an HDHP/HRA, an HSA-qualified HDHP, or both in 2008. While there is no significant difference from the 10% reported in 2007, there has been a statistically significant increase in the offer rate since the 7% reported in 2006. Among firms offering health benefits, 3% offer an HDHP/HRA and 11% offer an HSA-qualified HDHP (Exhibit 8.1).
Firms with 1,000 or more workers are more likely to offer an HDHP/SO than smaller firms. Twenty-two percent of firms with 1,000 or more workers offer an HDHP/SO compared to 13% of firms with 3 to 199 workers or 15% of firms with 200–999 workers (Exhibit 8.2).
�Enrollment in HDHP/SOs increased from 5% in 2007 to 8% in 2008 (Exhibit 8.4).
The majority of the increase occurred among workers in small firms (3–199 workers) rising from 8% in 2007 to 13% in 2008. Enrollment among workers in large firms (200 or more workers) did not change significantly (5% in 2008 compared to 4% in 2007).
About 3% of workers are enrolled in HDHP/HRAs and 4% are enrolled in HSA-qualified HDHPs (Exhibit 8.4). Workers in small firms (3–199 workers) are more likely to be enrolled in an HDHP/HRA or an HSA-qualified HDHP than workers in large firms (200 or more workers). Eight percent of workers in small firms (3–199 workers) are enrolled in HSA-qualified HDHPs, compared to 3% of workers in large firms (200 or more workers) (Exhibit 8.5). About 5% of covered workers in small firms (3–199 workers) are enrolled in HDHP/HRAs, compared to only 2% of covered workers in large firms (200 or more workers) (Exhibit 8.5).

High-D
eductible Health Plans w
ith Savings Option
8
section
eight
Employer Health Benefits 2 0 0 8 An n u a l s u r vey
121
t h e k a i s e r fa m i ly f o u n d at i o n - a n d - h e a lt h r e s e a r C h & e d u C at i o n a l t r u s t
p l A N D e D u C T i b l e s
�As expected, workers enrolled in HDHP/SOs have higher deductibles than workers enrolled in HMOs, PPOs, or POS plans.
The average general annual deductible for single coverage is $1,552 for HDHP/HRAs and $2,010 for HSA-qualified HDHPs (Exhibit 8.6). These averages are similar to the amounts reported in 2007.
There is wide variation in the average general annual deductible amounts for single coverage. Forty-four percent of workers with single coverage in HDHP/HRAs have a deductible between $1,000 and $1,499, and 6% have a deductible of $3,000 or more. For workers with single coverage in HSA-qualified plans, 33% of workers have a deductible between $1,100 and $1,499, and 11% are in a plan with a deductible of $3,000 or more (Exhibit 8.9).
The majority of workers in HDHP/HRAs (97%) and HSA-qualified plans (86%) do not have to meet the general annual deductible before preventive care is covered (Exhibit 8.12).
�Since 2006, the survey has collected information on two types of family deductibles. The survey asks employers whether the family deductible amount is (1) an aggregate amount (i.e., the out-of-pocket expenses of all family members are counted until the deductible is satisfied), or (2) a per-person amount that applies to each family member (typically with a limit on the number of family members that would be required to meet the deductible amount).
The average aggregate deductibles for workers with family coverage are $3,057 for HDHP/HRAs and $3,911 for HSA-qualified HDHPs (Exhibit 8.6). Thirty percent of workers in HSA-qualified
Health Reimbursement Arrangements (HRAs) are medical care reimbursement plans established by employers that can be used by employees to pay for health care. HRAs are funded solely by employers. Employers typically commit to make a specified amount of money available in the HRA for premiums and medical expenses incurred by employees or their dependents. HRAs are accounting devices, and employers are not required to expend funds until an employee incurs expenses that would be covered by the HRA. Unspent funds in the HRA usually can be carried over to the next year (sometimes with a limit). Employees cannot take their HRA balances with them if they leave their job, although an employer can choose to make the remaining balance available to former employees to pay for health care.
HRAs often are offered along with a high-deductible health plan (HDHP). In such cases, the employee pays for health care first from his or her HRA and then out-of-pocket until the health plan deductible is met. Sometimes certain preventive services or other services such as prescription drugs are paid for by the plan before the employee meets the deductible.
Health Savings Accounts (HSAs) are savings accounts created by individuals to pay for health
care. An individual may establish an HSA if he or she is covered by a “qualified health plan” which is a plan with a high deductible (i.e., a deductible of at least $1,100 for single coverage and $2,200 for family coverage in 2008) that also meets other requirements.1 Employers can encourage their employees to create HSAs by offering an HDHP that meets the federal requirements. Employers in some cases also may assist their employees by identifying HSA options, facilitating applications, or negotiating favorable fees from HSA vendors.
Both employers and employees can contribute to an HSA, up to the statutory cap of $2,900 for single coverage and $5,800 for family coverage in 2008. Employee contributions to the HSA are made on a pre-income tax basis, and some employers arrange for their employees to fund their HSAs through payroll deductions. Employers are not required to contribute to HSAs established by their employees, but if they elect to do so, their contributions are not taxable to the employee. Interest and other earnings on amounts in an HSA are not taxable. Withdrawals from the HSA by the account owner to pay for qualified health care expenses are not taxed. The savings account is owned by the individual who creates the account, so employees retain their HSA balances if they leave their job.
1 see u.s. department of the treasury, Health Savings Accounts, available at http://www.treas.gov/offices/public-affairs/hsa/pdf/hsa-tri-fold-english-07.pdf.

High-D
eductible Health Plans w
ith Savings Option
8
section
eight
Employer Health Benefits 2 0 0 8 An n u a l s u r vey
122
t h e k a i s e r fa m i ly f o u n d at i o n - a n d - h e a lt h r e s e a r C h & e d u C at i o n a l t r u s t
HDHPs are in plans with an aggregate family deductible between $2,100 and $2,999, while 32% are enrolled in plans with an aggregate family deductible of $5,000 or more (Exhibit 8.11).
o u T - o f - p o C k e T m A x i m u m A m o u N T s
�HSA-qualified HDHPs are legally required to have a maximum annual out-of-pocket liability of no more than $5,600 for single coverage and $11,200 for family coverage in 2008, while HDHP/HRAs have no similar requirement.
The average annual out-of-pocket maximum for single coverage is $2,543 for HDHP/HRAs3 and $3,292 for HSA-qualified HDHPs (Exhibit 8.6).
As with deductibles, the survey asks employers whether the family out-of-pocket maximum liability is (1) an aggregate amount that applies to spending by any covered person in the family, or (2) a separate per person amount that applies to spending by each family member or a limited number of family members. The survey also asks whether spending by enrollees on various services counts towards meeting the plan out-of-pocket maximum.
Among covered workers with family coverage whose out-of-pocket maximum is an aggregate amount that applies to spending by any covered person in the family, the average annual amounts are $5,331 for HDHP/HRAs and $6,280 for HSA-qualified HDHPs (Exhibit 8.6).
p r e m i u m s
�In 2008, the average annual premiums for HDHP/HRAs are $4,468 for single coverage and $11,571 for family coverage. The HDHP/HRA premium amount for covered workers with family coverage is lower than the average premium for family coverage for workers in plans that are not HDHP/SOs (Exhibit 8.8).
�The average annual premium for workers in HSA-qualified HDHPs is $3,527 for single coverage and $9,101 for family coverage. These amounts are lower than the average single and family premium for workers in plans that are not HDHP/SOs (Exhibit 8.8).
W o r k e r C o N T r i b u T i o N s T o p r e m i u m s
�The average annual worker contributions to premiums for workers enrolled in HDHP/HRAs are $533 for single coverage and $3,455 for family coverage. Workers in HDHP/HRAs with single coverage contribute significantly less than workers with single coverage in plans that are not HDHP/SOs (Exhibit 8.8).
�The average annual worker contributions to premiums for workers in HSA-qualified plans are $420 for single coverage and $2,332 for family coverage. The average contributions for single and family coverage for workers in HSA-qualified HDHPs are significantly less than the average premium contributions made by covered workers in plans that are not HDHP/SOs (Exhibit 8.8).
e m p l o y e r C o N T r i b u T i o N s T o p r e m i u m s
A N D s A v i N g s o p T i o N s
�Employers contribute to HDHP/SOs in two ways: through their contributions toward the premium for the health plan and through their contributions (if any, in the case of HSAs) to the savings account option (i.e., the HRAs or HSAs themselves).
Looking just at the annual employer contributions to premiums, covered workers in HDHP/HRAs on average receive employer contributions of $3,935 for single coverage and $8,117 for family coverage. These amounts are not statistically different from the average amounts contributed by employers for single or family coverage for workers who are not enrolled in HDHP/SOs (Exhibit 8.8).
The average annual employer contributions to premiums for workers in HSA-qualified HDHPs are $3,107 for single coverage and $6,769 for family coverage. These amounts are lower than the average contributions for single or family coverage for workers in plans that are not HDHP/SOs (Exhibit 8.8).
�When looking at employer contributions to the savings option, on average, workers enrolled in HDHP/HRAs receive an annual employer contribution to their HRA of $1,249 for single coverage and $2,073 for family coverage (Exhibit 8.6).
3 the average out-of-pocket maximum for hdhP/hras is calculated for plans with an out-of-pocket maximum. about 9% of covered workers in hdhP/hras with single coverage and 9% of covered workers in hdhP/hras for family coverage are in plans that reported having no limit on out-of-pocket expenses.
n o T e :
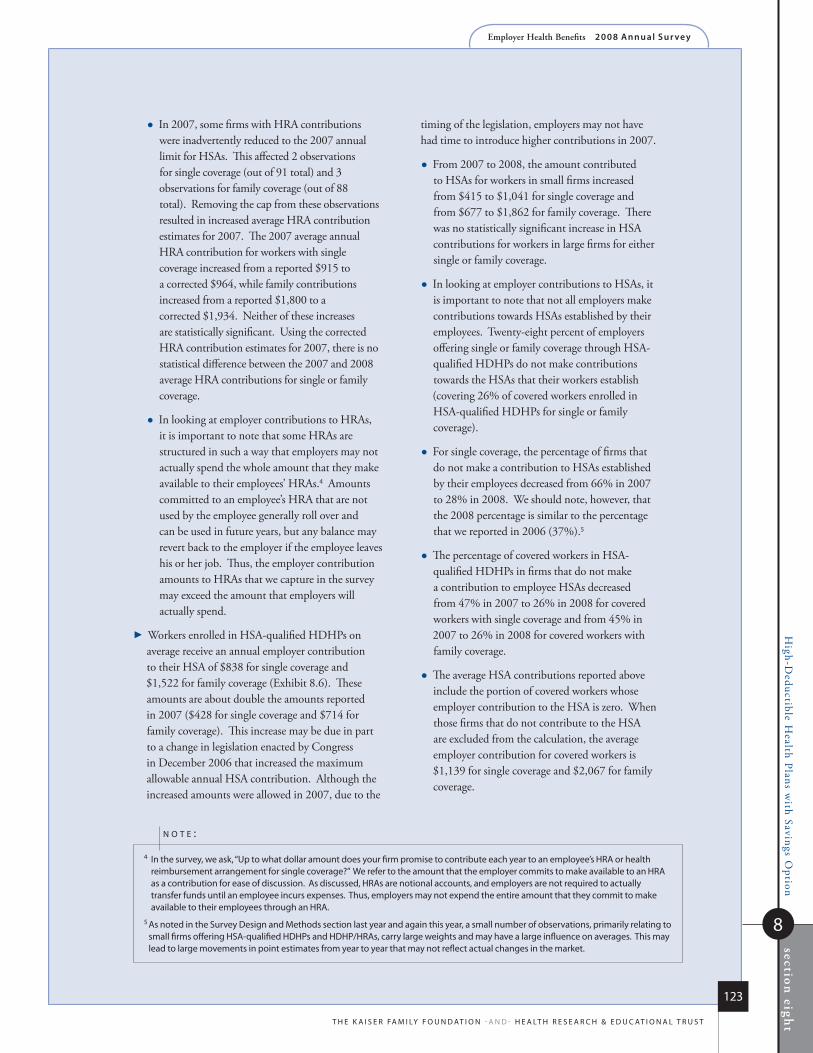
High-D
eductible Health Plans w
ith Savings Option
8
section
eight
Employer Health Benefits 2 0 0 8 An n u a l s u r vey
123
t h e k a i s e r fa m i ly f o u n d at i o n - a n d - h e a lt h r e s e a r C h & e d u C at i o n a l t r u s t
In 2007, some firms with HRA contributions were inadvertently reduced to the 2007 annual limit for HSAs. This affected 2 observations for single coverage (out of 91 total) and 3 observations for family coverage (out of 88 total). Removing the cap from these observations resulted in increased average HRA contribution estimates for 2007. The 2007 average annual HRA contribution for workers with single coverage increased from a reported $915 to a corrected $964, while family contributions increased from a reported $1,800 to a corrected $1,934. Neither of these increases are statistically significant. Using the corrected HRA contribution estimates for 2007, there is no statistical difference between the 2007 and 2008 average HRA contributions for single or family coverage.
In looking at employer contributions to HRAs, it is important to note that some HRAs are structured in such a way that employers may not actually spend the whole amount that they make available to their employees’ HRAs.4 Amounts committed to an employee’s HRA that are not used by the employee generally roll over and can be used in future years, but any balance may revert back to the employer if the employee leaves his or her job. Thus, the employer contribution amounts to HRAs that we capture in the survey may exceed the amount that employers will actually spend.
�Workers enrolled in HSA-qualified HDHPs on average receive an annual employer contribution to their HSA of $838 for single coverage and $1,522 for family coverage (Exhibit 8.6). These amounts are about double the amounts reported in 2007 ($428 for single coverage and $714 for family coverage). This increase may be due in part to a change in legislation enacted by Congress in December 2006 that increased the maximum allowable annual HSA contribution. Although the increased amounts were allowed in 2007, due to the
timing of the legislation, employers may not have had time to introduce higher contributions in 2007.
From 2007 to 2008, the amount contributed to HSAs for workers in small firms increased from $415 to $1,041 for single coverage and from $677 to $1,862 for family coverage. There was no statistically significant increase in HSA contributions for workers in large firms for either single or family coverage.
In looking at employer contributions to HSAs, it is important to note that not all employers make contributions towards HSAs established by their employees. Twenty-eight percent of employers offering single or family coverage through HSA-qualified HDHPs do not make contributions towards the HSAs that their workers establish (covering 26% of covered workers enrolled in HSA-qualified HDHPs for single or family coverage).
For single coverage, the percentage of firms that do not make a contribution to HSAs established by their employees decreased from 66% in 2007 to 28% in 2008. We should note, however, that the 2008 percentage is similar to the percentage that we reported in 2006 (37%).5
The percentage of covered workers in HSA-qualified HDHPs in firms that do not make a contribution to employee HSAs decreased from 47% in 2007 to 26% in 2008 for covered workers with single coverage and from 45% in 2007 to 26% in 2008 for covered workers with family coverage.
The average HSA contributions reported above include the portion of covered workers whose employer contribution to the HSA is zero. When those firms that do not contribute to the HSA are excluded from the calculation, the average employer contribution for covered workers is $1,139 for single coverage and $2,067 for family coverage.
4 in the survey, we ask, “up to what dollar amount does your firm promise to contribute each year to an employee’s hra or health reimbursement arrangement for single coverage?” We refer to the amount that the employer commits to make available to an hra as a contribution for ease of discussion. as discussed, hras are notional accounts, and employers are not required to actually transfer funds until an employee incurs expenses. thus, employers may not expend the entire amount that they commit to make available to their employees through an hra.
5 as noted in the survey design and methods section last year and again this year, a small number of observations, primarily relating to small firms offering hsa-qualified hdhPs and hdhP/hras, carry large weights and may have a large influence on averages. this may lead to large movements in point estimates from year to year that may not reflect actual changes in the market.
n o T e :
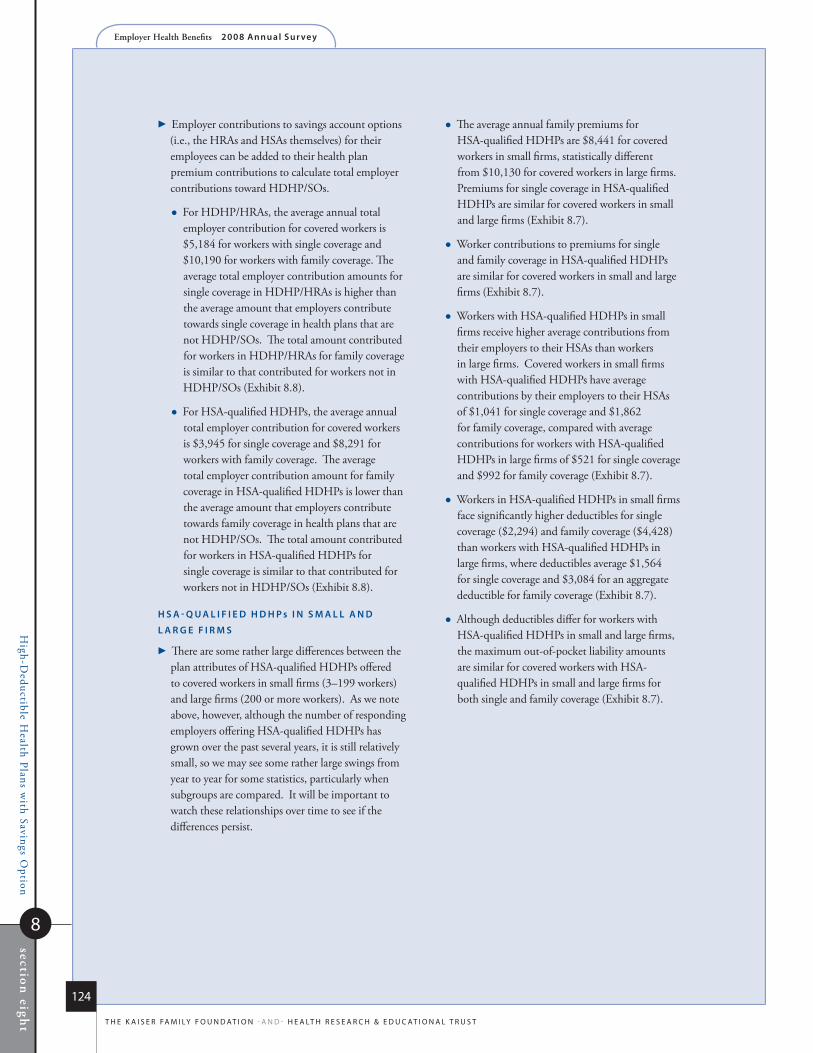
High-D
eductible Health Plans w
ith Savings Option
8
section
eight
Employer Health Benefits 2 0 0 8 An n u a l s u r vey
124
t h e k a i s e r fa m i ly f o u n d at i o n - a n d - h e a lt h r e s e a r C h & e d u C at i o n a l t r u s t
�Employer contributions to savings account options (i.e., the HRAs and HSAs themselves) for their employees can be added to their health plan premium contributions to calculate total employer contributions toward HDHP/SOs.
For HDHP/HRAs, the average annual total employer contribution for covered workers is $5,184 for workers with single coverage and $10,190 for workers with family coverage. The average total employer contribution amounts for single coverage in HDHP/HRAs is higher than the average amount that employers contribute towards single coverage in health plans that are not HDHP/SOs. The total amount contributed for workers in HDHP/HRAs for family coverage is similar to that contributed for workers not in HDHP/SOs (Exhibit 8.8).
For HSA-qualified HDHPs, the average annual total employer contribution for covered workers is $3,945 for single coverage and $8,291 for workers with family coverage. The average total employer contribution amount for family coverage in HSA-qualified HDHPs is lower than the average amount that employers contribute towards family coverage in health plans that are not HDHP/SOs. The total amount contributed for workers in HSA-qualified HDHPs for single coverage is similar to that contributed for workers not in HDHP/SOs (Exhibit 8.8).
h s A - Q u A l i f i e D h D h p s i N s m A l l A N D
l A r g e f i r m s
�There are some rather large differences between the plan attributes of HSA-qualified HDHPs offered to covered workers in small firms (3–199 workers) and large firms (200 or more workers). As we note above, however, although the number of responding employers offering HSA-qualified HDHPs has grown over the past several years, it is still relatively small, so we may see some rather large swings from year to year for some statistics, particularly when subgroups are compared. It will be important to watch these relationships over time to see if the differences persist.
The average annual family premiums for HSA-qualified HDHPs are $8,441 for covered workers in small firms, statistically different from $10,130 for covered workers in large firms. Premiums for single coverage in HSA-qualified HDHPs are similar for covered workers in small and large firms (Exhibit 8.7).
Worker contributions to premiums for single and family coverage in HSA-qualified HDHPs are similar for covered workers in small and large firms (Exhibit 8.7).
Workers with HSA-qualified HDHPs in small firms receive higher average contributions from their employers to their HSAs than workers in large firms. Covered workers in small firms with HSA-qualified HDHPs have average contributions by their employers to their HSAs of $1,041 for single coverage and $1,862 for family coverage, compared with average contributions for workers with HSA-qualified HDHPs in large firms of $521 for single coverage and $992 for family coverage (Exhibit 8.7).
Workers in HSA-qualified HDHPs in small firms face significantly higher deductibles for single coverage ($2,294) and family coverage ($4,428) than workers with HSA-qualified HDHPs in large firms, where deductibles average $1,564 for single coverage and $3,084 for an aggregate deductible for family coverage (Exhibit 8.7).
Although deductibles differ for workers with HSA-qualified HDHPs in small and large firms, the maximum out-of-pocket liability amounts are similar for covered workers with HSA-qualified HDHPs in small and large firms for both single and family coverage (Exhibit 8.7).

High-D
eductible Health Plans w
ith Savings Option
8
section
eight
Employer Health Benefits 2 0 0 8 An n u a l s u r vey
125
t h e k a i s e r fa m i ly f o u n d at i o n - a n d - h e a lt h r e s e a r C h & e d u C at i o n a l t r u s t
e m p l o y e r o p i N i o N s
�This year, the survey included questions for those employers offering HDHP/SOs on their opinions of the most successful outcome, biggest challenge, employee satisfaction, and primary reason for offering an HDHP/SO.
Forty-two percent of firms report that in their opinion, lower costs as the most successful outcome from offering a HDHP/SO (Exhibit 8.17).
Thirty-nine percent of firms offering HDHP/SOs report that educating and communicating the change in benefit has been the biggest challenge in offering an HDHP/SO (Exhibit 8.17). Large firms (200 or more workers) are more likely to report this as the biggest challenge (71%) than small firms (3–199 workers) (37%).
The majority of employers offering HDHP/SOs report costs were the primary reason for offering an HDHP/SO (60%) (Exhibit 8.17). Eighteen percent of firms reported helping employees engage in their health care as the primary reason for offering an HDHP/SO, with small firms (3–199 workers) being less likely (17%) than large firms (200 or more workers) (33%) to report this as their primary reason for doing so.
f u T u r e p l A N s
�Firms indicate some interest in offering HDHP/HRAs and HSA-qualified HDHPs in the next year.
Five percent of firms not currently offering an HDHP/HRA report that they are “very likely” to offer an HDHP/HRA in the next year, and another 21% of such firms report they are “somewhat likely” to do so (Exhibit 8.18). Among firms not currently offering an HSA-qualified HDHP, 4% report that they are “very likely” to do so in the next year and another 21% of such firms report they are “somewhat likely” to do so (Exhibit 8.19).

High-D
eductible Health Plans w
ith Savings Option
8
section
eight
Employer Health Benefits 2 0 0 8 An n u a l s u r vey
126
t h e k a i s e r fa m i ly f o u n d at i o n - a n d - h e a lt h r e s e a r C h & e d u C at i o n a l t r u s t
3–199 WORKERS 200–999 WORKERS 1,000 OR MORE WORKERS
0%
10%
20%
30%
40%
50%
13% 15%
22%*
HDHP/HRA HSA-QUALIFIED HDHP EITHER HDHP/HRA OR HSA-QUALIFIED HDHP‡
2005
2006
2007
2008
0%
10%
20%
30%
40%
50%
2% 1% 3% 3% 2%6%* 7%
11%
4%7%
10%13%
e x h i B i t 8 .1
among firms o ffer ing health Benef its, Percentage that o ffer an hdhP/hra and/or an hsa-Qual i f ied hdhP, 2005–2008
e x h i B i t 8 .2
among firms o ffer ing health Benef its, Percentage that o ffer an hdhP/so, by firm size, 2008
* estimate is statistically different from estimate for the previous year shown (p<.05).‡ the 2008 estimate includes 0.3% of all firms offering health benefits that offer both an hdhP/hra and an hsa-qualified
hdhP. the comparable percentages for 2005, 2006, and 2007 are 0.3%, 0.4%, and 0.2%, respectively.
kaiser/hret survey of employer-sponsored health Benefits, 2005–2008.
s o u r c e :
* estimate is statistically different from estimate for all other firms not in the indicated size category (p<.05).
note: the 2008 estimates include 0.3% of all firms offering health benefits that offer both an hdhP/hra and an hsa-qualified hdhP.
kaiser/hret survey of employer-sponsored health Benefits, 2008.
s o u r c e :
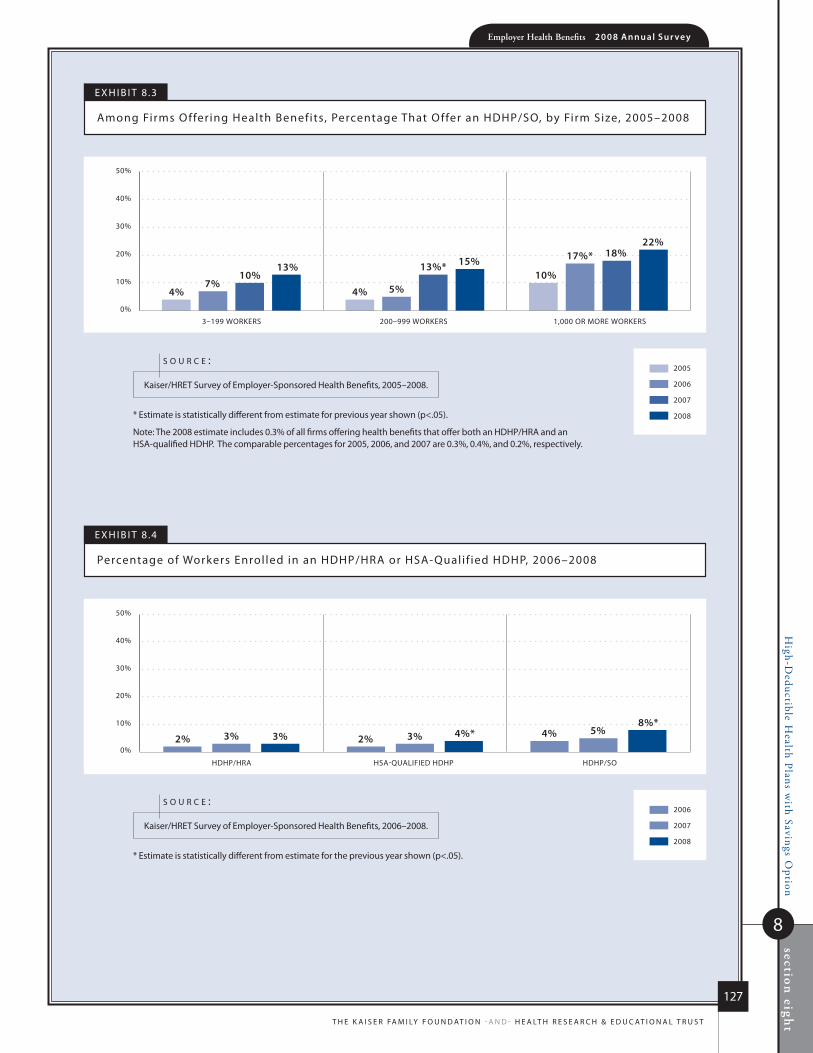
High-D
eductible Health Plans w
ith Savings Option
8
section
eight
Employer Health Benefits 2 0 0 8 An n u a l s u r vey
127
t h e k a i s e r fa m i ly f o u n d at i o n - a n d - h e a lt h r e s e a r C h & e d u C at i o n a l t r u s t
3–199 WORKERS 200–999 WORKERS 1,000 OR MORE WORKERS
2005
2006
2007
2008
0%
10%
20%
30%
40%
50%
4%7%
10%13%
4% 5%
13%* 15%10%
17%* 18%22%
e x h i B i t 8 .3
among firms o ffer ing health Benefits, Percentage that o ffer an hdhP/so, by firm size, 2005–2008
* estimate is statistically different from estimate for previous year shown (p<.05).
note: the 2008 estimate includes 0.3% of all firms offering health benefits that offer both an hdhP/hra and an hsa-qualified hdhP. the comparable percentages for 2005, 2006, and 2007 are 0.3%, 0.4%, and 0.2%, respectively.
kaiser/hret survey of employer-sponsored health Benefits, 2005–2008.
s o u r c e :
HDHP/HRA HSA-QUALIFIED HDHP HDHP/SO
2006
2007
2008
0%
10%
20%
30%
40%
50%
2% 3% 3% 2% 3% 4%* 4% 5%8%*
e x h i B i t 8 .4
Percentage of Workers enrol led in an hdhP/hra or hsa-Quali f ied hdhP, 2006–2008
* estimate is statistically different from estimate for the previous year shown (p<.05).
kaiser/hret survey of employer-sponsored health Benefits, 2006–2008.
s o u r c e :

High-D
eductible Health Plans w
ith Savings Option
8
section
eight
Employer Health Benefits 2 0 0 8 An n u a l s u r vey
128
t h e k a i s e r fa m i ly f o u n d at i o n - a n d - h e a lt h r e s e a r C h & e d u C at i o n a l t r u s t
HDHP/HRA* HSA-QUALIFIED HDHP* HDHP/SO*
ALL SMALL FIRMS (3–199 WORKERS)
ALL LARGE FIRMS (200 OR MORE WORKERS)
ALL FIRMS
0%
10%
20%
30%
40%
50%
5%2% 3%
8%3% 4%
13%
5%8%
e x h i B i t 8 .5
Percentage of Workers enrol led in an hdhP/hra or hsa-Quali f ied hdhP, by firm size, 2008
* estimates are statistically different between all small firms and all large firms within category (p<.05).
kaiser/hret survey of employer-sponsored health Benefits, 2008.
s o u r c e :
e x h i B i t 8 .6
hdhP/hra and hsa- Qual i f ied hdhP features, 2008
hDhp/hrA hsA-Qualified hDhp
Annual plan Averages for: single family single family
Premium $4,468 $11,571 $3,527 $9,101 Worker Contribution to Premium $533 $3,455 $420 $2,332 deductible‡ $1,552 $3,057 $2,010 $3,911
out-of-Pocket maximum liability‡ $2,543 $5,331 $3,292 $6,280
firm Contribution to the hra or hsa§ $1,249 $2,073 $838 $1,522
‡ nine percent of workers enrolled in hdhP/hras have employers that reported no out-of-pocket maximum for single coverage and family coverage. these workers are excluded from the hdhP/hra out-of-pocket maximum liability calculation. the deductible and out-of-pocket maximum averages shown for both hdhP/hras and hsa-qualified hdhPs for family coverage are for covered workers whose firms report that they face an aggregate amount. among covered workers in hdhP/hras, 11% are in plans whose family deductible is a separate per person amount and 5% are in a plan where the family out-of-pocket maximum is a separate per person amount. among covered workers in hsa-qualified hdhPs, the percentages are 4% for deductibles and 4% for out-of-pocket maximums.
§ When those firms that do not contribute to the hsa (28% for single and family coverage) are excluded from the calculation, the average firm contribution to the hsa for covered workers is $1,139 for single coverage and $2,067 for family coverage. for hdhP/hras, we refer to the amount that the employer commits to make available to an hra as a contribution for ease of discussion. hras are notional accounts, and employers are not required to actually transfer funds until an employee incurs expenses. thus, employers may not expend the entire amount that they commit to make available to their employees through an hra. therefore, the employer contribution amounts to hras that we capture in the survey may exceed the amount that employers will actually spend.
kaiser/hret survey of employer-sponsored health Benefits, 2008.
s o u r c e :
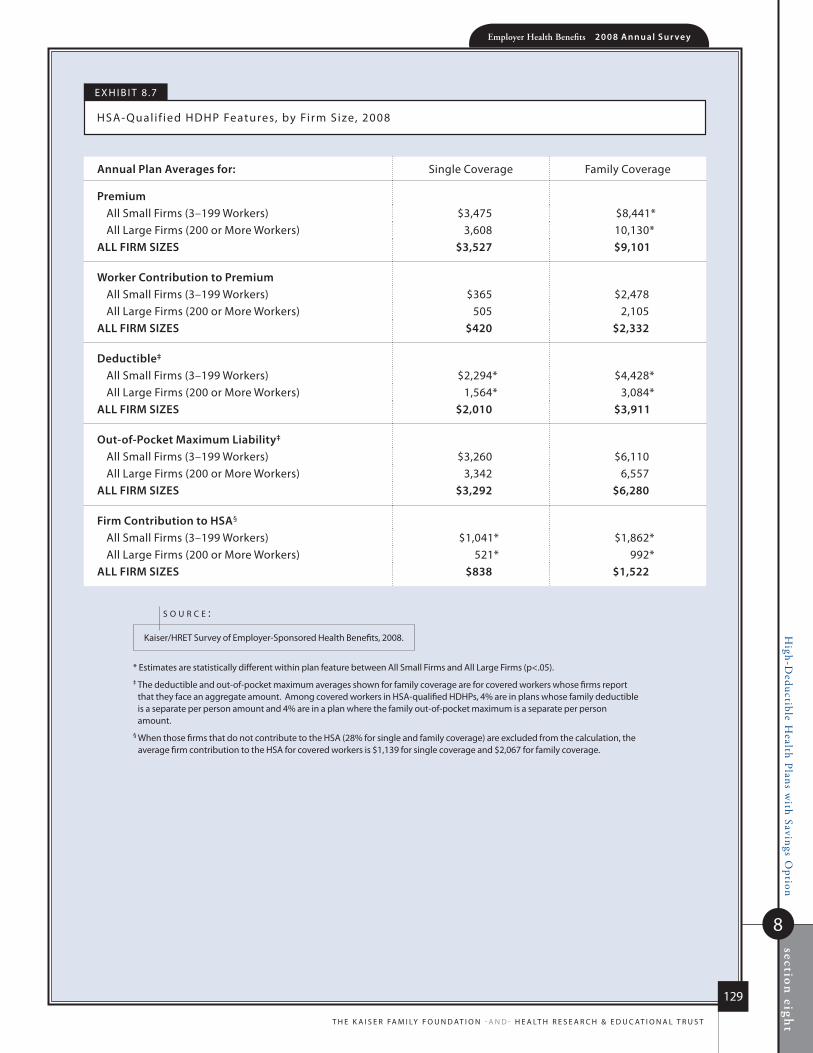
High-D
eductible Health Plans w
ith Savings Option
8
section
eight
Employer Health Benefits 2 0 0 8 An n u a l s u r vey
129
t h e k a i s e r fa m i ly f o u n d at i o n - a n d - h e a lt h r e s e a r C h & e d u C at i o n a l t r u s t
Annual plan Averages for: single Coverage family Coverage
premiumall small firms (3–199 Workers) $3,475 $8,441*all large firms (200 or more Workers) 3,608 10,130*
All firm sizes $3,527 $9,101
Worker Contribution to premiumall small firms (3–199 Workers) $365 $2,478 all large firms (200 or more Workers) 505 2,105
All firm sizes $420 $2,332
Deductible‡
all small firms (3–199 Workers) $2,294* $4,428*all large firms (200 or more Workers) 1,564* 3,084*
All firm sizes $2,010 $3,911
out-of-pocket maximum liability‡
all small firms (3–199 Workers) $3,260 $6,110 all large firms (200 or more Workers) 3,342 6,557
All firm sizes $3,292 $6,280
firm Contribution to hsA§
all small firms (3–199 Workers) $1,041* $1,862*all large firms (200 or more Workers) 521* 992*
All firm sizes $838 $1,522
e x h i B i t 8 .7
hsa- Qual i f ied hdhP features, by firm size, 2008
* estimates are statistically different within plan feature between all small firms and all large firms (p<.05).‡ the deductible and out-of-pocket maximum averages shown for family coverage are for covered workers whose firms report
that they face an aggregate amount. among covered workers in hsa-qualified hdhPs, 4% are in plans whose family deductible is a separate per person amount and 4% are in a plan where the family out-of-pocket maximum is a separate per person amount.
§ When those firms that do not contribute to the hsa (28% for single and family coverage) are excluded from the calculation, the average firm contribution to the hsa for covered workers is $1,139 for single coverage and $2,067 for family coverage.
kaiser/hret survey of employer-sponsored health Benefits, 2008.
s o u r c e :

High-D
eductible Health Plans w
ith Savings Option
8
section
eight
Employer Health Benefits 2 0 0 8 An n u a l s u r vey
130
t h e k a i s e r fa m i ly f o u n d at i o n - a n d - h e a lt h r e s e a r C h & e d u C at i o n a l t r u s t
e x h i B i t 8 .8
average annual Premiums and Contr ibutions to savings accounts for Covered Workers in hdhP/hras or hsa- Qual i f ied hdhPs, Compared to al l non-hdhP/so Plans, 2008
hDhp/hrA hsA-Qualified hDhp Non-hDhp/so plans§
single family single family single family
Total Annual premium $4,468 $11,571* $3,527* $9,101* $4,769 $12,892Worker Contribution to Premium $533* $3,455 $420* $2,332* $742 $3,397firm Contribution to Premium $3,935 $8,117 $3,107* $6,769* $4,027 $9,495
Annual firm Contribution to the hrA or hsA‡
$1,249 $2,073 $838 $1,522 na na
Total Annual firm Contribution (firm share of Premium Plus firm Contribution to hra or hsa)
$5,184* $10,190 $3,945 $8,291* $4,027 $9,495
Total Annual Cost (total Premium Plus firm Contribution to hra or hsa, if applicable)
$5,717* $13,645 $4,365* $10,623* $4,769 $12,892
* estimate is statistically different from estimate for all non-hdhP/so Plans (p<.05).‡ When those firms that do not contribute to the hsa (28% for single and family coverage) are excluded from the calculation,
the average firm contribution to the hsa for covered workers is $1,139 for single coverage and $2,067 for family coverage. for hdhP/hras, we refer to the amount that the employer commits to make available to an hra as a contribution for ease of discussion. hras are notional accounts, and employers are not required to actually transfer funds until an employee incurs expenses. thus, employers may not expend the entire amount that they commit to make available to their employees through an hra. therefore, the employer contribution amounts to hras that we capture in the survey may exceed the amount that employers will actually spend.
§ in order to compare costs for hdhP/sos to all other plans that are not hdhP/sos, we created composite variables excluding hdhP/so data.
na: not applicable.
note: Values shown in the table may not equal the sum of their component parts. the averages presented in the table are aggregated at the firm level and then averaged, which is methodologically more appropriate than adding the averages. this is relevant for total annual Premium, total annual firm Contribution, and total annual Cost.
kaiser/hret survey of employer-sponsored health Benefits, 2008.
s o u r c e :
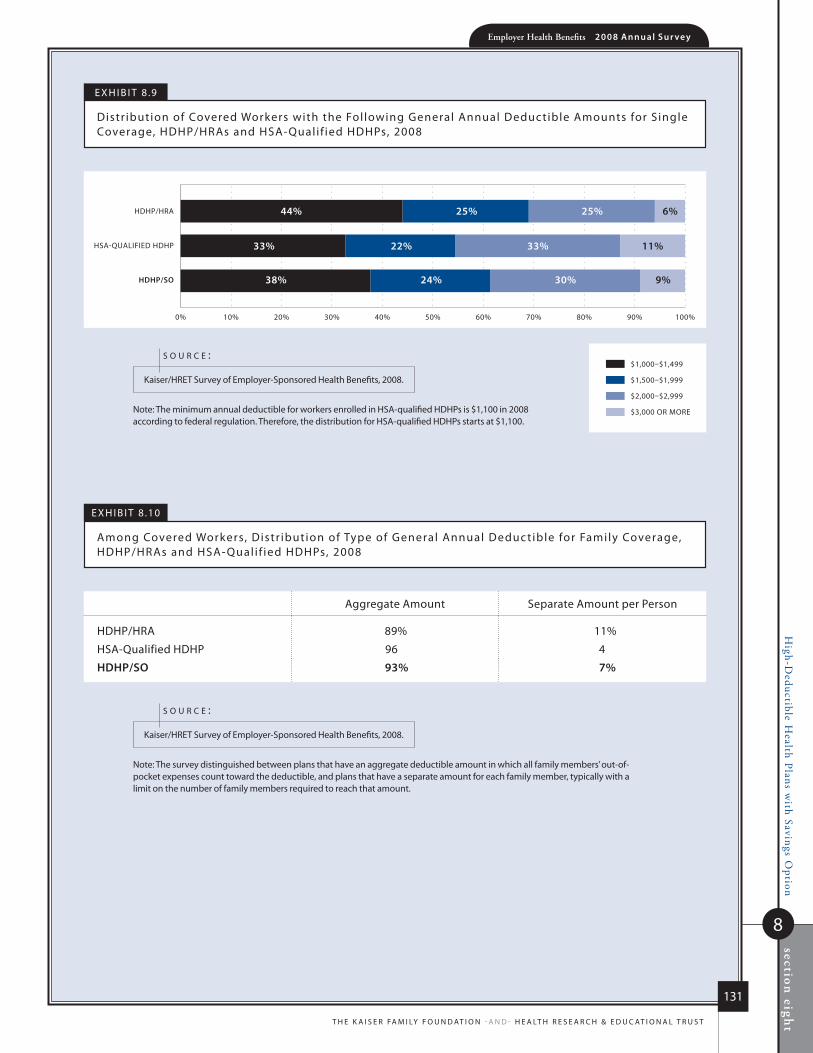
High-D
eductible Health Plans w
ith Savings Option
8
section
eight
Employer Health Benefits 2 0 0 8 An n u a l s u r vey
131
t h e k a i s e r fa m i ly f o u n d at i o n - a n d - h e a lt h r e s e a r C h & e d u C at i o n a l t r u s t
HDHP/SO
HSA-QUALIFIED HDHP
HDHP/HRA
$1,000–$1,499
$1,500–$1,999
$2,000–$2,999
$3,000 OR MORE
0% 10% 20% 30% 40% 50% 60% 70% 80% 90% 100%
22%33%
44% 25%
38% 24%
33%
25%
30%
11%
6%
9%
e x h i B i t 8 .9
distr ibution of Covered Workers with the fol lowing General annual deductible amounts for single Coverage, hdhP/hras and hsa-Quali f ied hdhPs, 2008
note: the minimum annual deductible for workers enrolled in hsa-qualified hdhPs is $1,100 in 2008 according to federal regulation. therefore, the distribution for hsa-qualified hdhPs starts at $1,100.
kaiser/hret survey of employer-sponsored health Benefits, 2008.
s o u r c e :
aggregate amount separate amount per Person
hdhP/hra 89% 11%
hsa-Qualified hdhP 96 4
hDhp/so 93% 7%
e x h i B i t 8 .10
among Covered Workers, distr ibution of type of General annual deduc tible for family Coverage, hdhP/hras and hsa- Qual i f ied hdhPs, 2008
note: the survey distinguished between plans that have an aggregate deductible amount in which all family members’ out-of-pocket expenses count toward the deductible, and plans that have a separate amount for each family member, typically with a limit on the number of family members required to reach that amount.
kaiser/hret survey of employer-sponsored health Benefits, 2008.
s o u r c e :
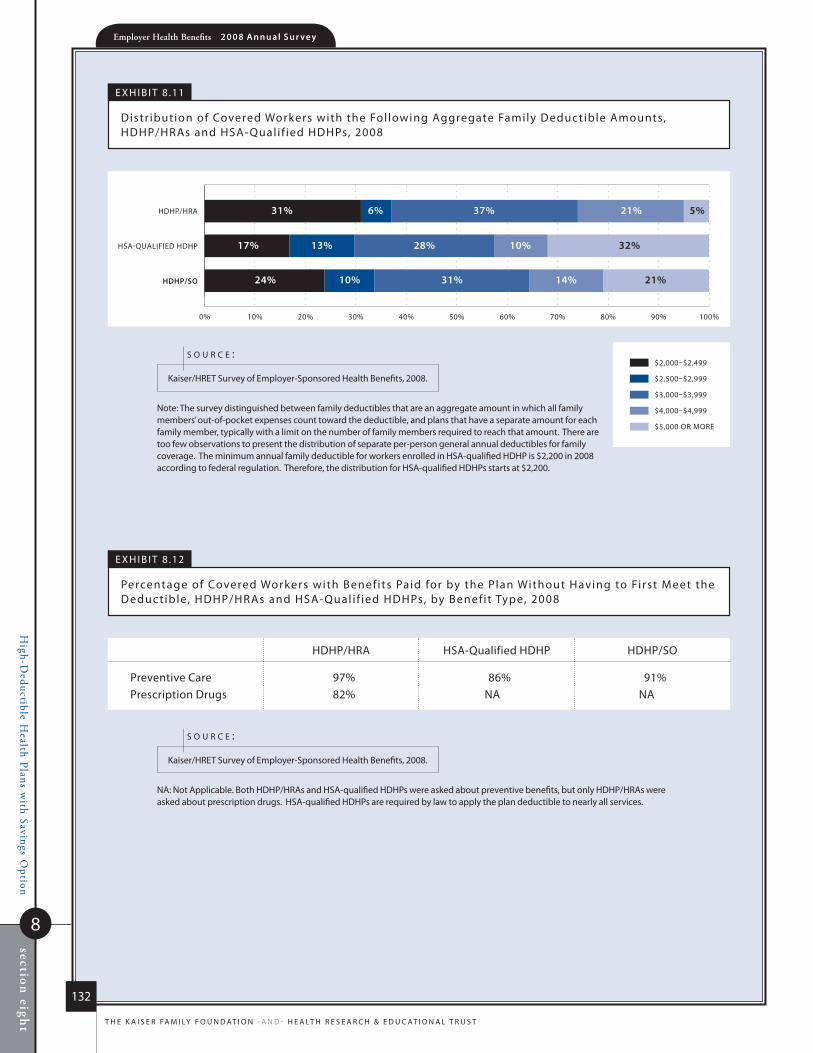
High-D
eductible Health Plans w
ith Savings Option
8
section
eight
Employer Health Benefits 2 0 0 8 An n u a l s u r vey
132
t h e k a i s e r fa m i ly f o u n d at i o n - a n d - h e a lt h r e s e a r C h & e d u C at i o n a l t r u s t
HDHP/SO
HSA-QUALIFIED HDHP
HDHP/HRA
$2,000–$2,499
$2,500–$2,999
$3,000–$3,999
$4,000–$4,999
$5,000 OR MORE
0% 10% 20% 30% 40% 50% 60% 70% 80% 90% 100%
13%17%
31% 6%
24% 10%
28%
37%
31%
10% 32%
21% 5%
14% 21%
e x h i B i t 8 .11
distr ibution of Covered Workers with the fol lowing aggregate family deductible amounts, hdhP/hras and hsa-Quali f ied hdhPs, 2008
note: the survey distinguished between family deductibles that are an aggregate amount in which all family members’ out-of-pocket expenses count toward the deductible, and plans that have a separate amount for each family member, typically with a limit on the number of family members required to reach that amount. there are too few observations to present the distribution of separate per-person general annual deductibles for family coverage. the minimum annual family deductible for workers enrolled in hsa-qualified hdhP is $2,200 in 2008 according to federal regulation. therefore, the distribution for hsa-qualified hdhPs starts at $2,200.
kaiser/hret survey of employer-sponsored health Benefits, 2008.
s o u r c e :
hdhP/hra hsa-Qualified hdhP hdhP/so
Preventive Care 97% 86% 91%Prescription drugs 82% na na
e x h i B i t 8 .12
Percentage of Covered Workers with Benef its Paid for by the Plan Without having to first meet the deduc tible, hdhP/hras and hsa- Qual i f ied hdhPs, by Benef it type, 2008
na: not applicable. Both hdhP/hras and hsa-qualified hdhPs were asked about preventive benefits, but only hdhP/hras were asked about prescription drugs. hsa-qualified hdhPs are required by law to apply the plan deductible to nearly all services.
kaiser/hret survey of employer-sponsored health Benefits, 2008.
s o u r c e :
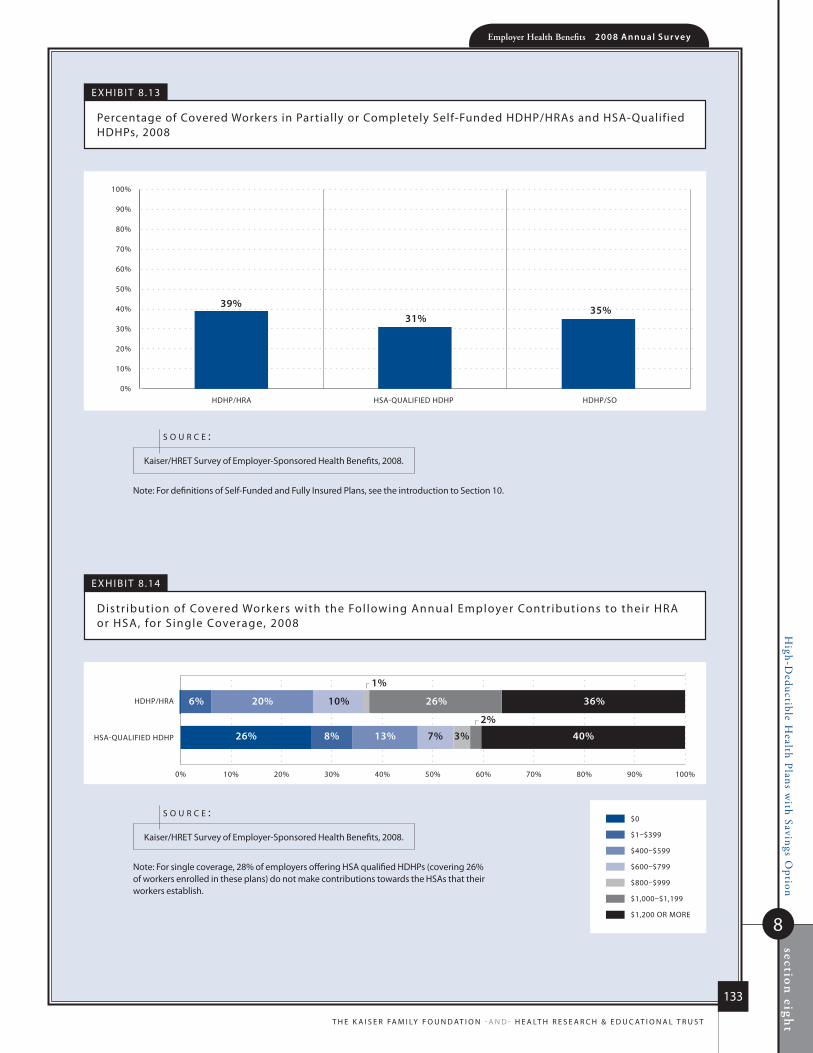
High-D
eductible Health Plans w
ith Savings Option
8
section
eight
Employer Health Benefits 2 0 0 8 An n u a l s u r vey
133
t h e k a i s e r fa m i ly f o u n d at i o n - a n d - h e a lt h r e s e a r C h & e d u C at i o n a l t r u s t
HDHP/HRA HSA-QUALIFIED HDHP HDHP/SO0%
10%
20%
30%
40%
50%
60%
70%
80%
90%
100%
39%31%
35%
e x h i B i t 8 .13
Percentage of Covered Workers in Partially or Completely self-funded hdhP/hras and hsa-Qualified hdhPs, 2008
note: for definitions of self-funded and fully insured Plans, see the introduction to section 10.
kaiser/hret survey of employer-sponsored health Benefits, 2008.
s o u r c e :
HSA-QUALIFIED HDHP
HDHP/HRA
$0
$1–$399
$400–$599
$600–$799
$800–$999
$1,000–$1,199
$1,200 OR MORE
0% 10% 20% 30% 40% 50% 60% 70% 80% 90% 100%
8%26%
6% 20%
13%
10%
7% 3% 40%
26% 36%
1%
2%
e x h i B i t 8 .14
distr ibution of Covered Workers with the fol lowing annual employer Contr ibutions to their hra or hsa, for s ingle Coverage, 2008
note: for single coverage, 28% of employers offering hsa qualified hdhPs (covering 26% of workers enrolled in these plans) do not make contributions towards the hsas that their workers establish.
kaiser/hret survey of employer-sponsored health Benefits, 2008.
s o u r c e :
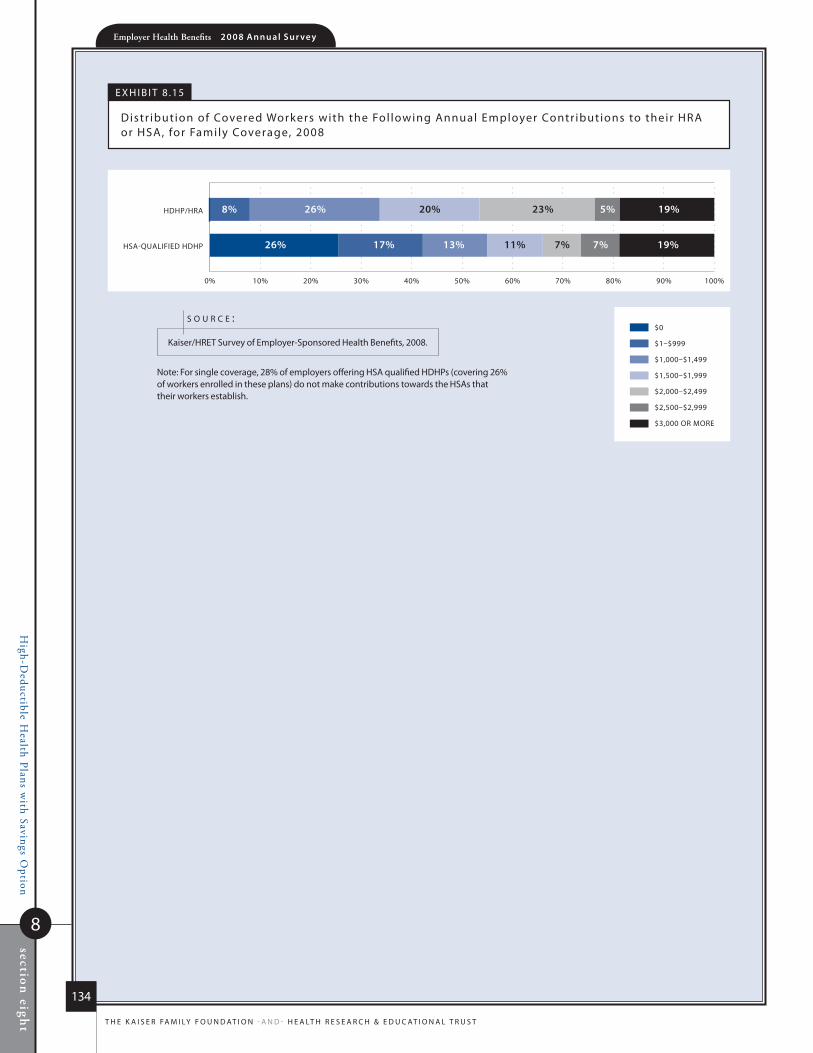
High-D
eductible Health Plans w
ith Savings Option
8
section
eight
Employer Health Benefits 2 0 0 8 An n u a l s u r vey
134
t h e k a i s e r fa m i ly f o u n d at i o n - a n d - h e a lt h r e s e a r C h & e d u C at i o n a l t r u s t
HSA-QUALIFIED HDHP
HDHP/HRA
$0
$1–$999
$1,000–$1,499
$1,500–$1,999
$2,000–$2,499
$2,500–$2,999
$3,000 OR MORE
0% 10% 20% 30% 40% 50% 60% 70% 80% 90% 100%
17%26%
8% 26%
13%
20%
11% 7% 7% 19%
23% 19%5%
e x h i B i t 8 .15
distr ibution of Covered Workers with the fol lowing annual employer Contr ibutions to their hra or hsa, for family Coverage, 2008
note: for single coverage, 28% of employers offering hsa qualified hdhPs (covering 26% of workers enrolled in these plans) do not make contributions towards the hsas that their workers establish.
kaiser/hret survey of employer-sponsored health Benefits, 2008.
s o u r c e :
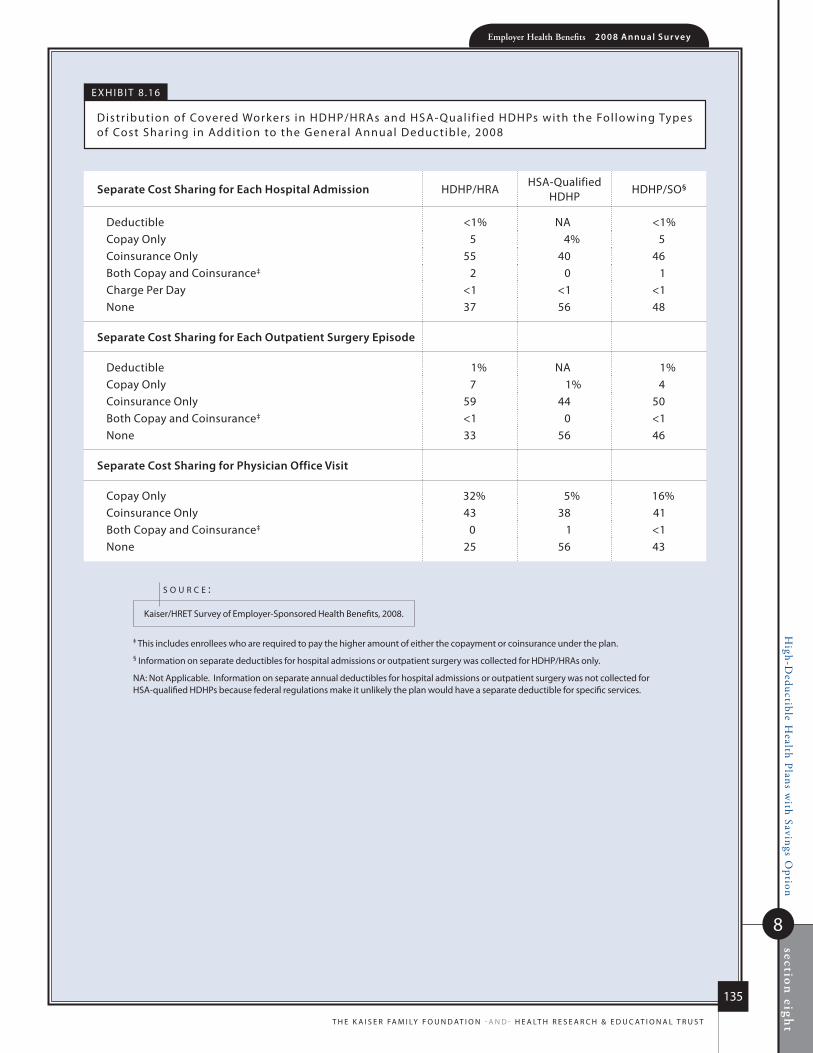
High-D
eductible Health Plans w
ith Savings Option
8
section
eight
Employer Health Benefits 2 0 0 8 An n u a l s u r vey
135
t h e k a i s e r fa m i ly f o u n d at i o n - a n d - h e a lt h r e s e a r C h & e d u C at i o n a l t r u s t
separate Cost sharing for each hospital Admission hdhP/hrahsa-Qualified
hdhPhdhP/so§
deductible <1% na <1%Copay only 5 4% 5Coinsurance only 55 40 46Both Copay and Coinsurance‡ 2 0 1Charge Per day <1 <1 <1none 37 56 48
separate Cost sharing for each outpatient surgery episode
deductible 1% na 1%Copay only 7 1% 4Coinsurance only 59 44 50Both Copay and Coinsurance‡ <1 0 <1none 33 56 46
separate Cost sharing for physician office visit
Copay only 32% 5% 16%Coinsurance only 43 38 41Both Copay and Coinsurance‡ 0 1 <1none 25 56 43
e x h i B i t 8 .16
distr ibution of Covered Workers in hdhP/hras and hsa- Qual i f ied hdhPs with the fol lowing types of Cost shar ing in addit ion to the General annual deduc tible, 2008
‡ this includes enrollees who are required to pay the higher amount of either the copayment or coinsurance under the plan.§ information on separate deductibles for hospital admissions or outpatient surgery was collected for hdhP/hras only.
na: not applicable. information on separate annual deductibles for hospital admissions or outpatient surgery was not collected for hsa-qualified hdhPs because federal regulations make it unlikely the plan would have a separate deductible for specific services.
kaiser/hret survey of employer-sponsored health Benefits, 2008.
s o u r c e :
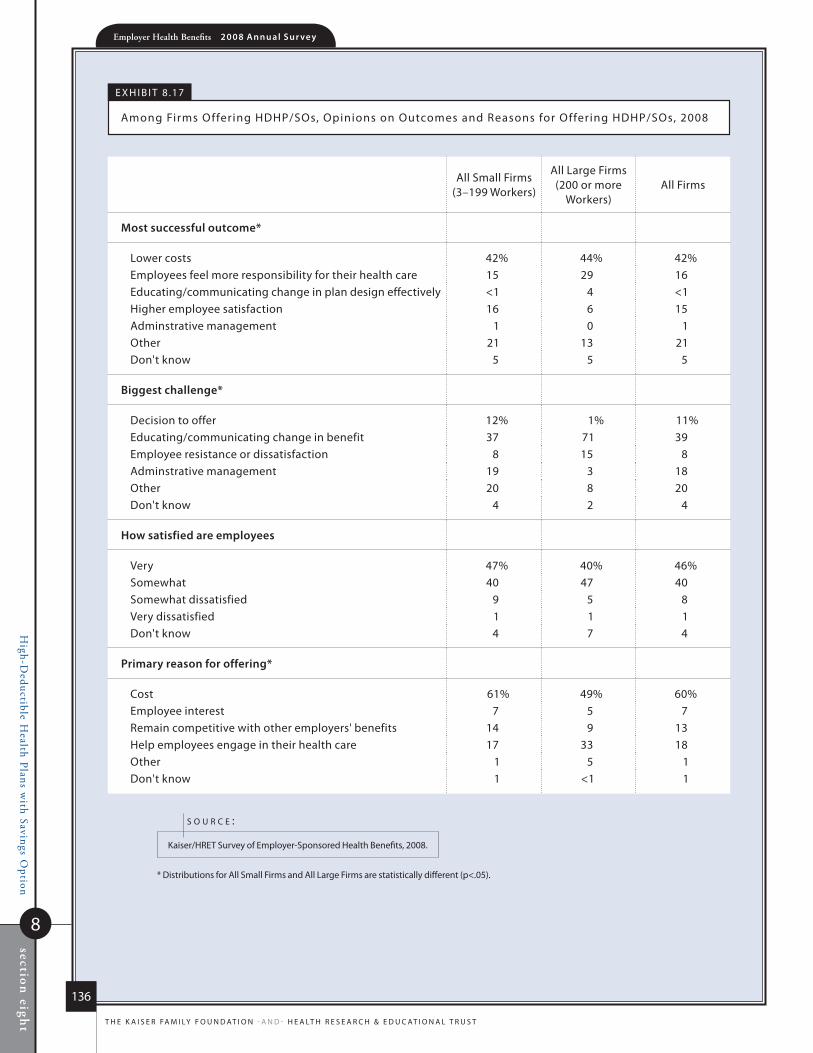
High-D
eductible Health Plans w
ith Savings Option
8
section
eight
Employer Health Benefits 2 0 0 8 An n u a l s u r vey
136
t h e k a i s e r fa m i ly f o u n d at i o n - a n d - h e a lt h r e s e a r C h & e d u C at i o n a l t r u s t
all small firms (3–199 Workers)
all large firms (200 or more
Workers)all firms
most successful outcome*
lower costs 42% 44% 42%employees feel more responsibility for their health care 15 29 16educating/communicating change in plan design effectively <1 4 <1higher employee satisfaction 16 6 15adminstrative management 1 0 1other 21 13 21don't know 5 5 5
biggest challenge*
decision to offer 12% 1% 11%educating/communicating change in benefit 37 71 39employee resistance or dissatisfaction 8 15 8adminstrative management 19 3 18other 20 8 20don't know 4 2 4
how satisfied are employees
Very 47% 40% 46%somewhat 40 47 40somewhat dissatisfied 9 5 8Very dissatisfied 1 1 1don't know 4 7 4
primary reason for offering*
Cost 61% 49% 60%employee interest 7 5 7remain competitive with other employers' benefits 14 9 13help employees engage in their health care 17 33 18other 1 5 1don't know 1 <1 1
e x h i B i t 8 .17
among firms offering hdhP/sos, opinions on outcomes and reasons for offering hdhP/sos, 2008
* distributions for all small firms and all large firms are statistically different (p<.05).
kaiser/hret survey of employer-sponsored health Benefits, 2008.
s o u r c e :

High-D
eductible Health Plans w
ith Savings Option
8
section
eight
Employer Health Benefits 2 0 0 8 An n u a l s u r vey
137
t h e k a i s e r fa m i ly f o u n d at i o n - a n d - h e a lt h r e s e a r C h & e d u C at i o n a l t r u s t
3–199 WORKERS 200–999 WORKERS 1,000–4,999 WORKERS 5,000 OR MORE WORKERS ALL FIRMS
SOMEWHAT LIKELY
VERY LIKELY
0%
10%
20%
30%
40%
50%
22%
3%
18%
5%
21%
3%
21%
5%
20%
6%
21%
7%
21%
3%
22%
7%
28%
5%
16%
10%
21%
7%
17%
4%
21%
7%
21%
10%
20%
6%
9%
7%
22%
4%
18%
6%
21%
3%
21%
5%
2005 2006 2007 2008 2005 2006 2007 2008 2005 2006 2007 2008 2005 2006 2007 2008* 2005 2006 2007 2008
e x h i B i t 8 .18
among firms not Currently o ffer ing an hdhP/hra, Percentage that say they are “ Ver y l ikely ” or “somewhat l ikely ” to o ffer an hdhP/hra in the nex t year, 2005–2008
* the total sum of “somewhat likely” and “very likely” is statistically different from the sum of “somewhat likely” and “very likely” for the previous year shown (p<.05).
note: in 2008, 1.5% of firms not currently offering an hdhP/hra reported “don’t know” to whether they would offer one in the next year. in 2007, less than one percent of firms reported “don’t know,” in 2006, 1.4% reported “don’t know,” and in 2005, 2.5% reported “don’t know.”
kaiser/hret survey of employer-sponsored health Benefits, 2005–2008.
s o u r c e :
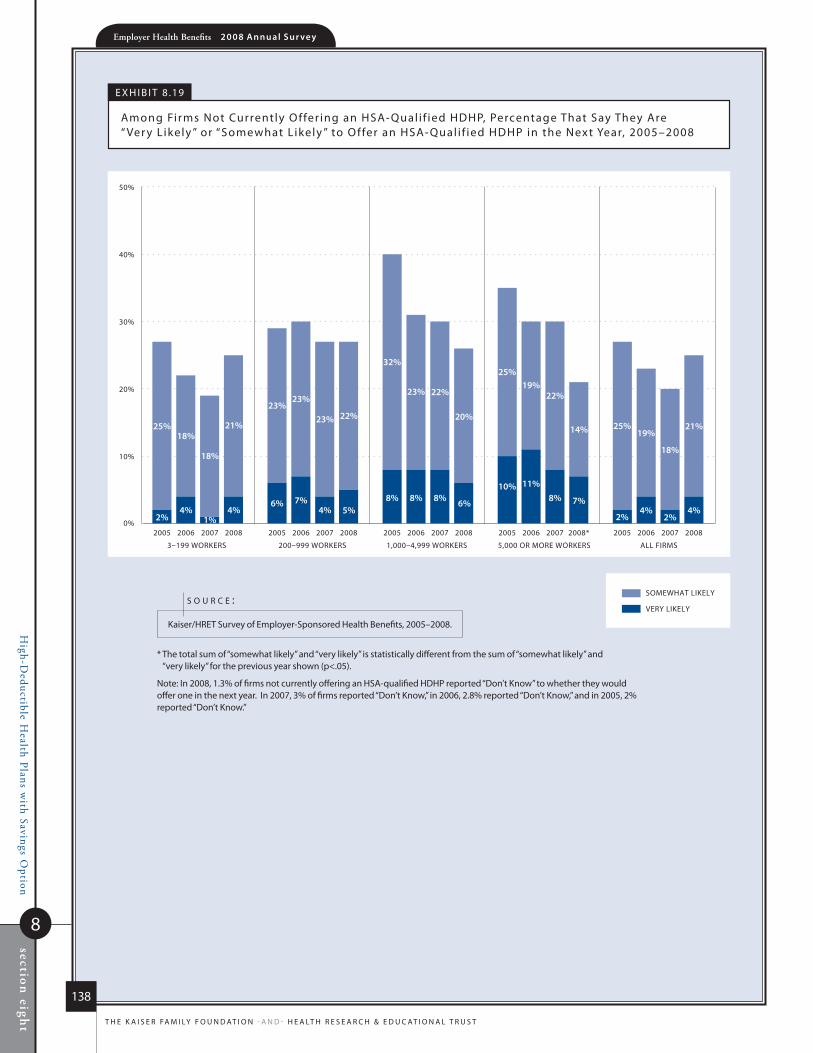
High-D
eductible Health Plans w
ith Savings Option
8
section
eight
Employer Health Benefits 2 0 0 8 An n u a l s u r vey
138
t h e k a i s e r fa m i ly f o u n d at i o n - a n d - h e a lt h r e s e a r C h & e d u C at i o n a l t r u s t
3–199 WORKERS 200–999 WORKERS 1,000–4,999 WORKERS 5,000 OR MORE WORKERS ALL FIRMS
2005 2006 2007 2008 2005 2006 2007 2008 2005 2006 2007 2008 2005 2006 2007 2008* 2005 2006 2007 2008
SOMEWHAT LIKELY
VERY LIKELY
0%
10%
20%
30%
40%
50%
25%
2%
18%
4%
18%
1%
21%
4%
23%
6%
23%
7%
23%
4%
22%
5%
32%
8%
23%
8%
22%
8%
20%
6%
25%
10%
19%
11%
22%
8%
14%
7%
25%
2%
19%
4%
18%
2%
21%
4%
e x h i B i t 8 .19
among firms not Currently o ffer ing an hsa- Qual i f ied hdhP, Percentage that say they are “ Ver y l ikely ” or “somewhat l ikely ” to o ffer an hsa- Qual i f ied hdhP in the nex t year, 2005–2008
* the total sum of “somewhat likely” and “very likely” is statistically different from the sum of “somewhat likely” and “very likely” for the previous year shown (p<.05).
note: in 2008, 1.3% of firms not currently offering an hsa-qualified hdhP reported “don’t know” to whether they would offer one in the next year. in 2007, 3% of firms reported “don’t know,” in 2006, 2.8% reported “don’t know,” and in 2005, 2% reported “don’t know.”
kaiser/hret survey of employer-sponsored health Benefits, 2005–2008.
s o u r c e :
78%$12,1
06
$4,4
79
Employer Health Benefits2 0 0 7 a n n u a l s u r V e y
s ect ion
Prescription Drug Benefits
9
6.1%
63%$12,6
80
$4,7
04
2008
Employer Health Benefits2 0 0 8 a n n u a l s u r V e y
s ect ion
Prescription Drug and Mental Health Benefits
9
Employer Health Benefits 2 0 0 8 An n u a l s u r vey
section
nin
ePrescription D
rug and Mental H
ealth Benefits
9
140
t h e k a i s e r fa m i ly f o u n d at i o n - a n d - h e a lt h r e s e a r C h & e d u C at i o n a l t r u s t
p r e S C r i p t i o n D r u g a n D M e n t a l h e a l t h B e n e f i t S
virTually all covered workers have coverage for prescripTion drugs. more Than Three in four covered
workers are in plans wiTh Three or more cosT-sharing Tiers for prescripTion drugs. copaymenTs raTher
Than coinsurance conTinue To be The dominanT form of cosT sharing for prescripTion drugs.
nearly all covered workers also have coverage for menTal healTh benefiTs. however, limiTs on The number
of visiTs for ouTpaTienT care and The number of days for inpaTienT care remain common feaTures in all plan
Types.
p r e s C r i p T i o N D r u g b e N e f i T s
As in prior years, nearly all (98%) covered workers in employer-sponsored plans have a prescription drug benefit.
A large majority of covered workers (93%) in 2008 have some sort of tiered cost-sharing formula for prescription drugs (Exhibit 9.1). Cost-sharing tiers generally are associated with a health plan placing a drug on a formulary or preferred drug list. The formulary or drug list generally classifies drugs as generic, preferred brand-name, or nonpreferred brand-name. More recently, some plans have created a fourth tier of drug cost sharing, which may be used in some cases for lifestyle drugs or expensive biologics.1
Seventy-seven percent of covered workers are enrolled in plans with three, four, or more tiers of cost sharing for prescription drugs, a similar percentage to last year (75%) (Exhibit 9.1).
HDHP/SOs have different cost-sharing patterns for prescription drugs than other plan types. Only 48% of covered workers in HDHP/SOs are in a plan with three or more tiers of cost sharing for prescription drugs. Sixteen percent of covered workers in HDHP/SOs are in plans that apply the same cost-sharing structure regardless of the type of drug, and an additional 27% are in plans that pay 100% of prescription costs once the plan deductible is met (Exhibit 9.2).
Among workers covered by plans with three or more tiers of cost sharing for prescription drugs, a large majority face copayments rather than coinsurance for the first three tiers (Exhibit 9.3). The percentages differ slightly across drug types because some plans have copayments for some drug tiers and coinsurance for other drug tiers.
For covered workers in plans with three or four tiers of cost sharing for prescription drugs, the average drug copayments for first-tier drugs ($10) and second-tier drugs ($26) are similar to the amounts reported last year. The average copayment for third-tier drugs ($46) slightly increased from the average reported in 2007 ($43) (Exhibit 9.4).
For covered workers in plans with three or four tiers of cost sharing for prescription drugs who face coinsurance rather than copayments, coinsurance levels average 21% for first-tier drugs, 25% for second-tier drugs, and 38% for third-tier drugs, also similar to the percentages reported last year (Exhibit 9.4).
As in 2007, seven percent of covered workers are in a plan that has four or more tiers of cost sharing for prescription drugs (Exhibit 9.1).
The average copayment for a fourth-tier drug is $75 and the average coinsurance is 28% (Exhibit 9.4). These amounts are not statistically different from the amounts reported in 2007.
1 this year we made a slight change to the prescription drug cost sharing questions and rather than asking about the cost sharing for “generic drugs,” “preferred drugs,” “nonpreferred drugs,” and “tier four drugs,” we changed the wording to “first-tier drugs, often called generics,” second-tier drugs, often called preferred,” “third-tier drugs, often called non-preferred” and “fourth-tier drugs.” the modification was made to allow more flexibility in responses since formularies may vary in what types of drugs are specified for each tier. see text Box for descriptions of drug types.
n o T e :
Employer Health Benefits 2 0 0 8 An n u a l s u r veysectio
n n
ine
9
Prescription Drug and M
ental Health B
enefits
141
t h e k a i s e r fa m i ly f o u n d at i o n - a n d - h e a lt h r e s e a r C h & e d u C at i o n a l t r u s t
Fifteen percent of covered workers are in a plan that has two tiers for prescription drug cost sharing (Exhibit 9.1). Similar to workers in plans with four tiers, copayments are more common than coinsurance for workers in plans with two tiers (Exhibit 9.5). The average copayment for the first tier is $11, and the average copayment for the second tier is $24 (Exhibit 9.6). Average coinsurance rates for the first and second tier are 19% and 32%, respectively (Exhibit 9.6).
Four percent of covered workers are covered by plans in which cost sharing is the same regardless of the type of drug chosen (Exhibit 9.1). Among these covered workers, 32% have copayments and 63% have coinsurance (Exhibit 9.7). The vast majority of covered workers in HDHP/SOs with the same cost sharing regardless of the type of drug face coinsurance rather than copayments (96% vs. 3%) for prescriptions (Exhibit 9.7).
For those workers with the same cost sharing regardless of the type of drug, the average copayment is $15 and the average coinsurance is 24% (Exhibit 9.8).
As in 2007, eleven percent of covered workers with drug coverage face a separate drug deductible, in addition to any general annual deductible the plan may have (Exhibit 9.9).
Ten percent of covered workers with drug coverage have a separate annual out-of-pocket maximum that applies to prescription drugs (Exhibit 9.10).
m e N TA l h e A lT h b e N e f i T s
Nearly all covered workers (98%) have coverage for mental health benefits in 2008. However, limits on the number of visits for outpatient care and the number of days for inpatient care remain common features of all plan types.
Eighteen percent of covered workers have coverage for an unlimited number of mental health outpatient visits, similar to 13% in 2006, the last time the question was asked. Sixty-two percent of covered workers are in plans that provide for 30
or fewer outpatient mental health visits in a year, similar to 2006 (Exhibit 9.11). Fifty-five percent of covered workers in small firms (3–199 workers) have limits of 20 or fewer outpatient mental health visits per year compared to 24% of workers in large firms (200 or more workers).
Twenty-two percent of covered workers have coverage for an unlimited number of mental health inpatient days, up from 15% in 2006. Sixty-two percent of covered workers face an inpatient limit of 30 or fewer days (Exhibit 9.12). Thirty-three percent of covered workers in small firms (3–199 workers) have 20 or fewer covered days of inpatient mental health care covered by their plan, compared to 11% of covered workers in large firms (200 or more workers).
Generic drugs: A drug product that is no longer covered by patent protection and thus may be produced and/or distributed by multiple drug companies.
Preferred drugs: Drugs included on a formulary or preferred drug list; for example, a brand-name drug without a generic substitute.
Nonpreferred drugs: Drugs not included on a formulary or preferred drug list; for example, a brand-name drug with a generic substitute.
Fourth-tier drugs: New types of cost-sharing arrangements that typically build additional layers of higher copayments or coinsurance for specifically identified types of drugs, such as lifestyle drugs or biologics.
Brand-name drugs: Generally, a drug product that is covered by a patent and is thus manufactured and sold exclusively by one firm. Cross-licensing occasionally occurs, allowing an additional firm to market the drug. After the patent expires, multiple firms can produce the drug product, but the brand name or trademark remains with the original manufacturer’s product.

section
nin
ePrescription D
rug and Mental H
ealth Benefits
9
Employer Health Benefits 2 0 0 8 An n u a l s u r vey
142
t h e k a i s e r fa m i ly f o u n d at i o n - a n d - h e a lt h r e s e a r C h & e d u C at i o n a l t r u s t
0% 10% 20% 30% 40% 50% 60% 70% 80% 90% 100%
2002*
2001*
2000
2005*
2004‡
2003*
2008*
2007‡
2006
FOUR OR MORE TIERS
THREE TIERS
TWO TIERS
PAYMENT IS THE SAME REGARDLESS OF TYPE OF DRUG
NO COST SHARING AFTER DEDUCTIBLE IS MET
OTHER
27% 49% 2%
1%
1%
2%
1%
2%
2%
1%
1%
22%
41% 41% 18%
55% 30% 13%
63% 23% 13%
65% 20% 10%
70% 15% 8%
69% 16% 8%
68% 16% 6%
70%
3%
4%
5%
7%
7% 15% 3%4%
2%
e x h i B i t 9 .1
distr ibution of Covered Workers facing dif ferent Cost-shar ing formulas for Prescr ipt ion drug Benef its, 2000–2008
* distribution is statistically different from distribution for the previous year shown (p<.05).‡ no statistical tests are conducted between 2003 and 2004 or between 2006 and 2007 due to
the addition of a new category.
note: fourth-tier drug cost sharing information was not obtained prior to 2004.
kaiser/hret survey of employer-sponsored health Benefits, 2000–2008.
s o u r c e :

section
nin
e
9
Prescription Drug and M
ental Health B
enefitsEmployer Health Benefits 2 0 0 8 An n u a l s u r vey
143
t h e k a i s e r fa m i ly f o u n d at i o n - a n d - h e a lt h r e s e a r C h & e d u C at i o n a l t r u s t
0% 10% 20% 30% 40% 50% 60% 70% 80% 90% 100%
POS
PPO*
HMO
ALL PLANS
HDHP/SO*
FOUR OR MORE TIERS
THREE TIERS
TWO TIERS
PAYMENT IS THE SAME REGARDLESS OF TYPE OF DRUG
NO COST SHARING AFTER DEDUCTIBLE IS MET
OTHER
7% 68% 1%
1%
<1%
3%
1%
20% 3%
7% 74% 14% 3%
10% 70% 16%
10% 16%5%38% 27%
70% 15% 4% 3%7%
1%
1%2%
1%
e x h i B i t 9 .2
distr ibution of Covered Workers facing dif ferent Cost-shar ing formulas for Prescr ipt ion drug Benef its, by Plan type, 2008
*distribution is statistically different from all Plans distribution (p<.05).
kaiser/hret survey of employer-sponsored health Benefits, 2008.
s o u r c e :

section
nin
ePrescription D
rug and Mental H
ealth Benefits
9
Employer Health Benefits 2 0 0 8 An n u a l s u r vey
144
t h e k a i s e r fa m i ly f o u n d at i o n - a n d - h e a lt h r e s e a r C h & e d u C at i o n a l t r u s t
first-Tier Drugs, often Called generic DrugsCopay only
Coinsurance only
either Copay or
Coinsurance‡
Plan Pays entire Cost after any
deductibles are met
some other
amount
hmo* 94% 2% 1% 1% 2%PPo 87 7 2 2 2Pos* 89 5 5 1 1hdhP/so* 70 11 2 12 6
All plANs 88% 5% 2% 2% 3%
second-Tier Drugs, often Called preferred Drugs
Copay or Coinsurance
Plus any difference
hmo* 91% 4% 1% 1% 3%PPo* 77 12 3 1 6Pos* 94 3 <1 1 1hdhP/so* 68 13 8 2 9
All plANs 82% 9% 3% 1% 5%
Third-Tier Drugs, often Called Nonpreferred Drugs
hmo* 85% 8% 1% 1% 5%PPo 73 14 4 2 7Pos* 88 6 1 4 2hdhP/so* 65 14 8 5 8
All plANs 76% 12% 3% 2% 6%
fourth-Tier Drugs
hmo nsd nsd nsd nsd nsdPPo 39% 40% <1% <1% 20%Pos nsd nsd nsd nsd nsdhdhP/so nsd nsd nsd nsd nsd
All plANs 43% 35% 3% <1% 18%
e x h i B i t 9 .3
among Workers with three, four, or more tiers of Cost shar ing, distr ibution of Covered Workers with the fol lowing types of Cost shar ing for Prescr ipt ion drugs, by drug and Plan type, 2008
* distribution is statistically different from all Plans distribution within drug type (p<.05). ‡ this includes enrollees who are required to pay the higher amount of either the copayment or coinsurance under the plan.
nsd: not sufficient data.
note: these distributions do not include the 1% of covered workers whose employers report “none of the above” to the survey question about the type of prescription drug cost-sharing formula. for definitions of Generic, Preferred, nonpreferred, and fourth-tier drugs, see the introduction to section 9.
kaiser/hret survey of employer-sponsored health Benefits, 2008.
s o u r c e :
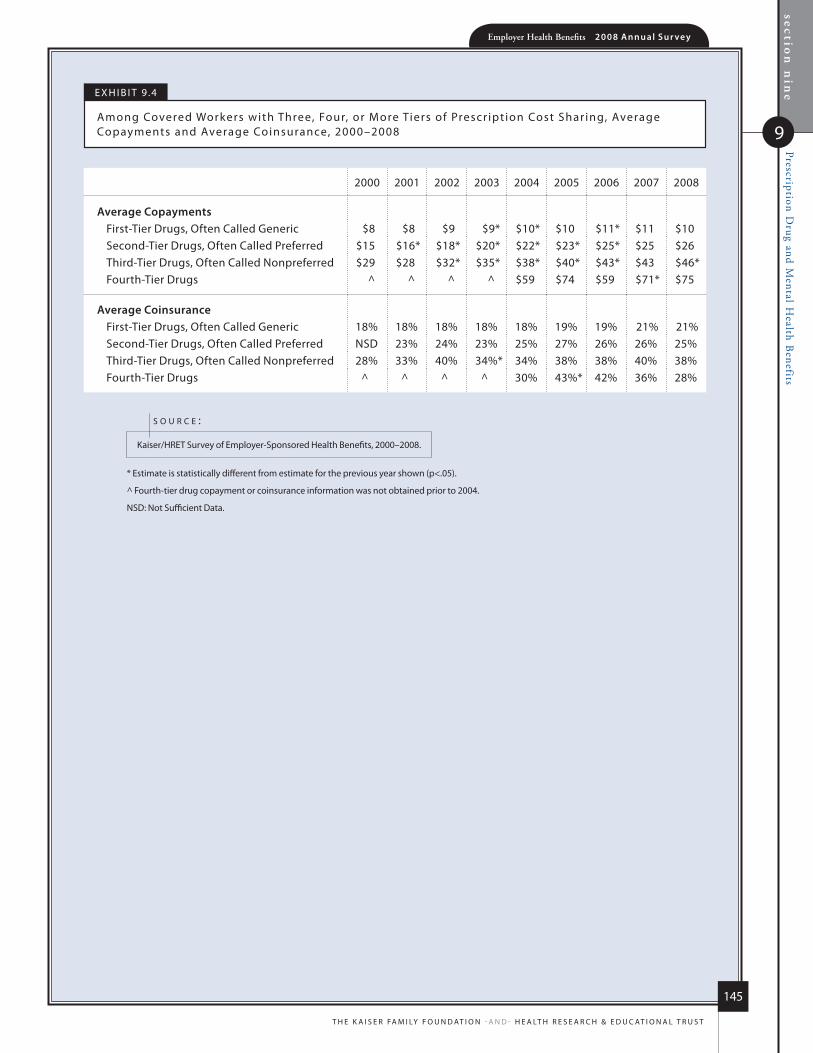
section
nin
e
9
Prescription Drug and M
ental Health B
enefitsEmployer Health Benefits 2 0 0 8 An n u a l s u r vey
145
t h e k a i s e r fa m i ly f o u n d at i o n - a n d - h e a lt h r e s e a r C h & e d u C at i o n a l t r u s t
* estimate is statistically different from estimate for the previous year shown (p<.05).
^ fourth-tier drug copayment or coinsurance information was not obtained prior to 2004.
nsd: not sufficient data.
kaiser/hret survey of employer-sponsored health Benefits, 2000–2008.
s o u r c e :
e x h i B i t 9 .4
among Covered Workers with three, four, or more tiers of Prescr ipt ion Cost shar ing, average Copayments and average Coinsurance, 2000–2008
2000 2001 2002 2003 2004 2005 2006 2007 2008
Average Copaymentsfirst-tier drugs, often Called Generic $8 $8 $9 $9* $10* $10 $11* $11 $10second-tier drugs, often Called Preferred $15 $16* $18* $20* $22* $23* $25* $25 $26third-tier drugs, often Called nonpreferred $29 $28 $32* $35* $38* $40* $43* $43 $46*fourth-tier drugs ^ ^ ^ ^ $59 $74 $59 $71* $75
Average Coinsurancefirst-tier drugs, often Called Generic 18% 18% 18% 18% 18% 19% 19% 21% 21%second-tier drugs, often Called Preferred nsd 23% 24% 23% 25% 27% 26% 26% 25%third-tier drugs, often Called nonpreferred 28% 33% 40% 34%* 34% 38% 38% 40% 38%fourth-tier drugs ^ ^ ^ ^ 30% 43%* 42% 36% 28%

section
nin
ePrescription D
rug and Mental H
ealth Benefits
9
Employer Health Benefits 2 0 0 8 An n u a l s u r vey
146
t h e k a i s e r fa m i ly f o u n d at i o n - a n d - h e a lt h r e s e a r C h & e d u C at i o n a l t r u s t
e x h i B i t 9 .5
among Workers with two tiers of Cost sharing for Prescription drugs, distribution of Covered Workers with the following types of Cost sharing for Prescription drugs, by drug and Plan type, 2008
* distribution is statistically different from all Plans distribution within drug type (p<.05). ‡ this includes enrollees who are required to pay the higher amount of either the copayment or coinsurance under the plan.
nsd: not sufficient data.
note: these distributions do not include the 1% of covered workers whose employers report “none of the above” to the survey question about the type of prescription drug cost-sharing formula. for definitions of Generic, Preferred, nonpreferred, and fourth-tier drugs, see the introduction to section 9.
kaiser/hret survey of employer-sponsored health Benefits, 2008.
s o u r c e :
first-Tier Drugs, often Called generic DrugsCopay only
Coinsurance only
either Copay or
Coinsurance‡
Plan Pays entire Cost after any
deductibles are met
some other
amount
hmo* 94% 4% <1% 1% <1%PPo 77 10 3 9 2Pos* 89 7 0 <1 5hdhP/so nsd nsd nsd nsd nsd
All plANs 80% 8% 2% 8% 2%
second-Tier Drugs, often Called preferred Drugs
Copay only
Coinsurance only
either Copay or
Coinsurance‡
Copay or Coinsurance
Plus difference
some other
amount
hmo 87% 9% <1% 1% 2%PPo 73 15 2 3 6Pos* 89 9 0 0 2hdhP/so nsd nsd nsd nsd nsd
All plANs 79% 13% 1% 3% 4%
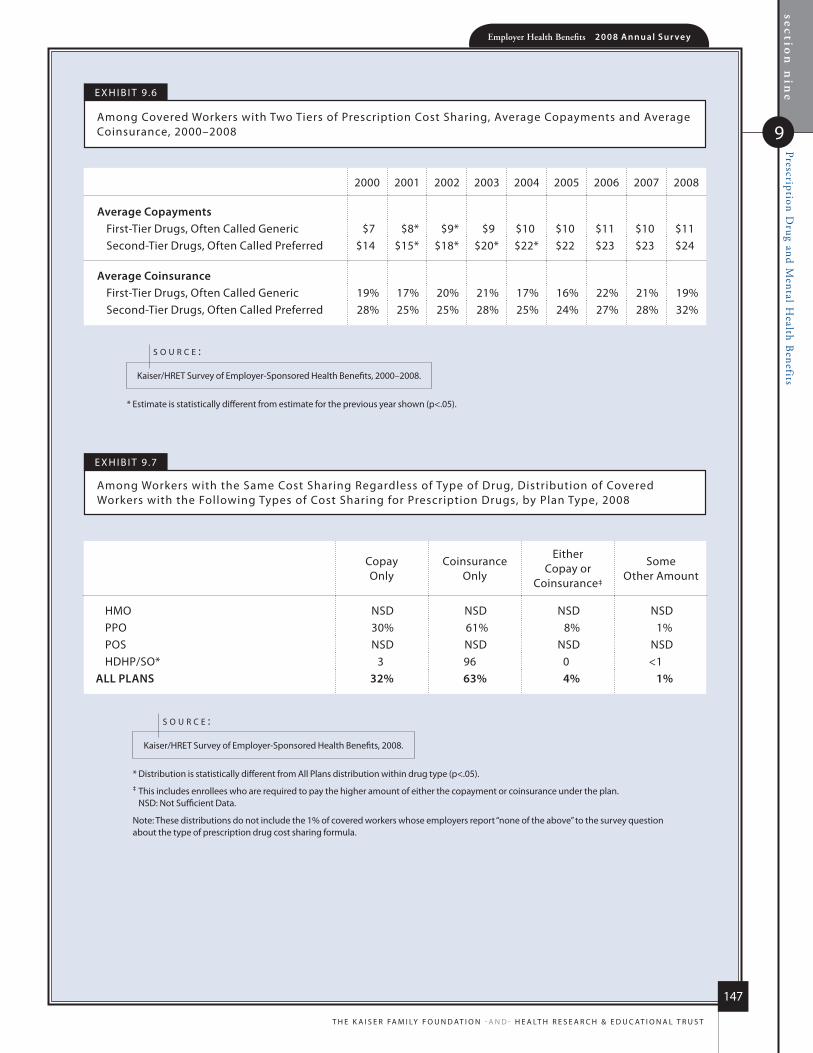
section
nin
e
9
Prescription Drug and M
ental Health B
enefitsEmployer Health Benefits 2 0 0 8 An n u a l s u r vey
147
t h e k a i s e r fa m i ly f o u n d at i o n - a n d - h e a lt h r e s e a r C h & e d u C at i o n a l t r u s t
e x h i B i t 9 .7
among Workers with the same Cost sharing regardless of type of drug, distribution of Covered Workers with the following types of Cost sharing for Prescription drugs, by Plan type, 2008
* distribution is statistically different from all Plans distribution within drug type (p<.05).‡ this includes enrollees who are required to pay the higher amount of either the copayment or coinsurance under the plan.
nsd: not sufficient data.
note: these distributions do not include the 1% of covered workers whose employers report “none of the above” to the survey question about the type of prescription drug cost sharing formula.
kaiser/hret survey of employer-sponsored health Benefits, 2008.
s o u r c e :
Copay only
Coinsurance only
either Copay or
Coinsurance‡
some other amount
hmo nsd nsd nsd nsdPPo 30% 61% 8% 1%Pos nsd nsd nsd nsdhdhP/so* 3 96 0 <1
All plANs 32% 63% 4% 1%
* estimate is statistically different from estimate for the previous year shown (p<.05).
kaiser/hret survey of employer-sponsored health Benefits, 2000–2008.
s o u r c e :
e x h i B i t 9 .6
among Covered Workers with two tiers of Prescription Cost sharing, average Copayments and average Coinsurance, 2000–2008
2000 2001 2002 2003 2004 2005 2006 2007 2008
Average Copaymentsfirst-tier drugs, often Called Generic $7 $8* $9* $9 $10 $10 $11 $10 $11second-tier drugs, often Called Preferred $14 $15* $18* $20* $22* $22 $23 $23 $24
Average Coinsurancefirst-tier drugs, often Called Generic 19% 17% 20% 21% 17% 16% 22% 21% 19%second-tier drugs, often Called Preferred 28% 25% 25% 28% 25% 24% 27% 28% 32%
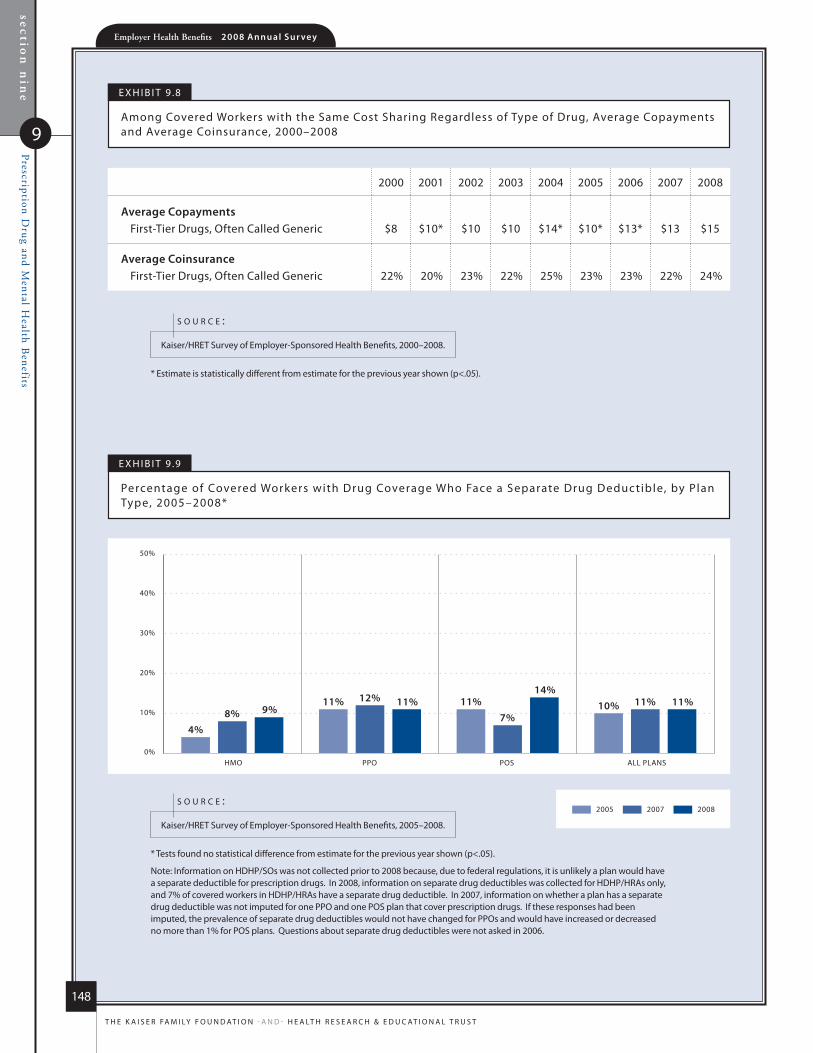
section
nin
ePrescription D
rug and Mental H
ealth Benefits
9
Employer Health Benefits 2 0 0 8 An n u a l s u r vey
148
t h e k a i s e r fa m i ly f o u n d at i o n - a n d - h e a lt h r e s e a r C h & e d u C at i o n a l t r u s t
HMO PPO POS ALL PLANS
200820072005
0%
10%
20%
30%
40%
50%
4%8% 9%
11% 12% 11% 11%7%
14%10% 11% 11%
* estimate is statistically different from estimate for the previous year shown (p<.05).
kaiser/hret survey of employer-sponsored health Benefits, 2000–2008.
s o u r c e :
* tests found no statistical difference from estimate for the previous year shown (p<.05).
note: information on hdhP/sos was not collected prior to 2008 because, due to federal regulations, it is unlikely a plan would have a separate deductible for prescription drugs. in 2008, information on separate drug deductibles was collected for hdhP/hras only, and 7% of covered workers in hdhP/hras have a separate drug deductible. in 2007, information on whether a plan has a separate drug deductible was not imputed for one PPo and one Pos plan that cover prescription drugs. if these responses had been imputed, the prevalence of separate drug deductibles would not have changed for PPos and would have increased or decreased no more than 1% for Pos plans. Questions about separate drug deductibles were not asked in 2006.
kaiser/hret survey of employer-sponsored health Benefits, 2005–2008.
s o u r c e :
e x h i B i t 9 .8
among Covered Workers with the same Cost sharing regardless of type of drug, average Copayments and average Coinsurance, 2000–2008
e x h i B i t 9 .9
Percentage of Covered Workers with drug Coverage Who face a separate drug deduc tible, by Plan type, 2005–2008*
2000 2001 2002 2003 2004 2005 2006 2007 2008
Average Copaymentsfirst-tier drugs, often Called Generic $8 $10* $10 $10 $14* $10* $13* $13 $15
Average Coinsurancefirst-tier drugs, often Called Generic 22% 20% 23% 22% 25% 23% 23% 22% 24%

section
nin
e
9
Prescription Drug and M
ental Health B
enefitsEmployer Health Benefits 2 0 0 8 An n u a l s u r vey
149
t h e k a i s e r fa m i ly f o u n d at i o n - a n d - h e a lt h r e s e a r C h & e d u C at i o n a l t r u s t
HMO PPO POS ALL PLANS
2007
2008
0%
10%
20%
30%
40%
50%
6%8%
10% 11%
5%
11%8%
10%
e x h i B i t 9 .10
Percentage of Covered Workers with drug Coverage with a separate annual out-of-Pocket limit that applies to Prescription drugs, by Plan type, 2007–2008*
* tests found no statistical difference from estimate for the previous year shown (p<.05).
note: data for hdhP/sos are not included in this exhibit because hsa-qualified hdhPs are required by law to have an annual out-of-pocket limit of no more than $5,600 for single coverage and $11,200 for family coverage, making it unlikely a plan would include a separate out-of-pocket maximum for prescription drugs. as a result, only firms offering hdhP/hras were asked if the plan has a separate out-of-pocket maximum that applies to prescription drugs. among covered workers enrolled in hdhP/hras, 8% are enrolled in plans with a separate annual out-of-pocket limit that applies to prescription drugs.
kaiser/hret survey of employer-sponsored health Benefits, 2007–2008.
s o u r c e :

section
nin
ePrescription D
rug and Mental H
ealth Benefits
9
Employer Health Benefits 2 0 0 8 An n u a l s u r vey
150
t h e k a i s e r fa m i ly f o u n d at i o n - a n d - h e a lt h r e s e a r C h & e d u C at i o n a l t r u s t
e x h i B i t 9 .11
among Covered Workers with outpatient mental health Coverage, distribution of number of annual outpatient Visits Covered, by Plan type, 2008
* distributions are statistically different between all small firms and all large firms within each plan type (p<.05).
note: distribution is among covered workers with outpatient mental health coverage. two percent of covered workers do not have outpatient mental health coverage in 2008.
kaiser/hret survey of employer-sponsored health Benefits, 2008.
s o u r c e :
20 Visits or fewer
21 to 30 Visits
31 to 50 Visits
more than 50 Visits
no limit
hmo*all small firms (3–199 Workers) 67% 20% 3% 3% 7%all large firms (200 or more Workers) 40 22 14 6 18
All firm sizes 49% 22% 10% 5% 15%
ppo*all small firms (3–199 Workers) 52% 22% 4% 5% 16%all large firms (200 or more Workers) 21 33 13 13 21
All firm sizes 29% 30% 11% 11% 19%
posall small firms (3–199 Workers) 45% 21% 6% 8% 20%all large firms (200 or more Workers) 31 19 24 10 16
All firm sizes 38% 20% 16% 9% 18%
hDhp/so*all small firms (3–199 Workers) 57% 23% 11% 4% 6%all large firms (200 or more Workers) 17 33 19 10 21
All firm sizes 41% 27% 14% 6% 12%
All plANs*all small firms (3–199 Workers) 55% 22% 5% 5% 13%all large firms (200 or more Workers) 24 30 14 11 20
All firm sizes 34% 27% 11% 9% 18%

section
nin
e
9
Prescription Drug and M
ental Health B
enefitsEmployer Health Benefits 2 0 0 8 An n u a l s u r vey
151
t h e k a i s e r fa m i ly f o u n d at i o n - a n d - h e a lt h r e s e a r C h & e d u C at i o n a l t r u s t
e x h i B i t 9 .12
among Covered Workers with inpatient mental health Coverage, distribution of number of annual inpatient days Covered, by Plan type, 2008
*distributions are statistically different between all small firms and all large firms within each plan type (p<.05).
note: distribution is among covered workers with inpatient mental health coverage. two percent of covered workers do not have inpatient mental health coverage in 2008.
kaiser/hret survey of employer-sponsored health Benefits, 2008.
s o u r c e :
10 days or fewer
11 to 20 days
21 to 30 days
31 or more days
no limit
hmo*all small firms (3–199 Workers) 29% 23% 28% 11% 9%all large firms (200 or more Workers) 3 6 54 16 21
All firm sizes 12% 12% 46% 14% 17%
ppo*all small firms (3–199 Workers) 9% 19% 38% 13% 21%all large firms (200 or more Workers) 4 8 46 18 25
All firm sizes 5% 11% 44% 17% 24%
posall small firms (3–199 Workers) 12% 22% 33% 23% 11%all large firms (200 or more Workers) 3 12 37 20 28
All firm sizes 8% 17% 35% 21% 19%
hDhp/soall small firms (3–199 Workers) 11% 14% 43% 18% 13%all large firms (200 or more Workers) 7 7 57 9 20
All firm sizes 10% 11% 49% 15% 16%
All plANs*all small firms (3–199 Workers) 14% 19% 36% 15% 16%all large firms (200 or more Workers) 4 7 48 17 24
All plANs 7% 11% 44% 16% 22%
63%$12,6
80
$4,7
04
2008
E H B2 0 0 8 A N N U A L S U R V E Y
Plan Funding
10
Employer Health Benefits 2 0 0 8 An n u a l s u r vey
sec
tion
ten
Plan Funding
10
154
t h e k a i s e r fa m i ly f o u n d at i o n - a n d - h e a lt h r e s e a r C h & e d u C at i o n a l t r u s t
p l a n f u n D i n g
The employee reTiremenT income securiTy acT (erisa) of 1974 exempTs self-funded plans from sTaTe
insurance laws, including reser ve requiremenTs, mandaTed benefiTs, premium Taxes, and consumer
proTecTion regulaTions. over one half (55%) of covered workers are in a self-funded healTh plan.
because larger firms have more employees over whom To spread The risk of cosTly claims, self funding is
more common and less risky among larger firms Than among smaller ones.
�The percentage of covered workers who are in a plan that is completely or partially self-funded has remained stable over the last few years. Slightly more than half (55%) of covered workers are in a self-funded plan (Exhibit 10.1).
As expected, covered workers in large firms (200 or more workers) are more likely to be in a self-funded plan than workers in small firms (3–199 workers). Seventy-seven percent of workers in large firms (200 or more workers) are in self-funded plans, compared to 12% of workers in small firms (3–199 workers) (Exhibit 10.3). The percentage of covered workers in self-funded plans increases as the number of employees increases. Forty-seven percent of workers in firms with 200 to 999 workers are in self-funded plans, compared to 76% of workers in firms with 1,000 to 4,999 workers, and 89% of workers in firms with 5,000 or more workers (Exhibit 10.3). As previously mentioned, these percentages have changed little over the past several years (Exhibit 10.1).
A higher percentage of workers in PPOs are in a self-funded plan (64%), compared to 47% in conventional health plans, 40% in HMOs, 35% in HDHP/SOs, and 29% in POS plans (Exhibit 10.2).
Self-Funded Plan: An insurance arrangement in which the employer assumes direct financial responsibility for the costs of enrollees’ medical claims. Employers sponsoring self-funded plans typically contract with a third-party administrator or insurer to provide administrative services for the self-funded plan. In some cases, the employer may buy stop-loss coverage from an insurer to protect the employer against very large claims.
Fully Insured Plan: An insurance arrangement in which the employer contracts with a health plan that assumes financial responsibility for the costs of enrollees’ medical claims.
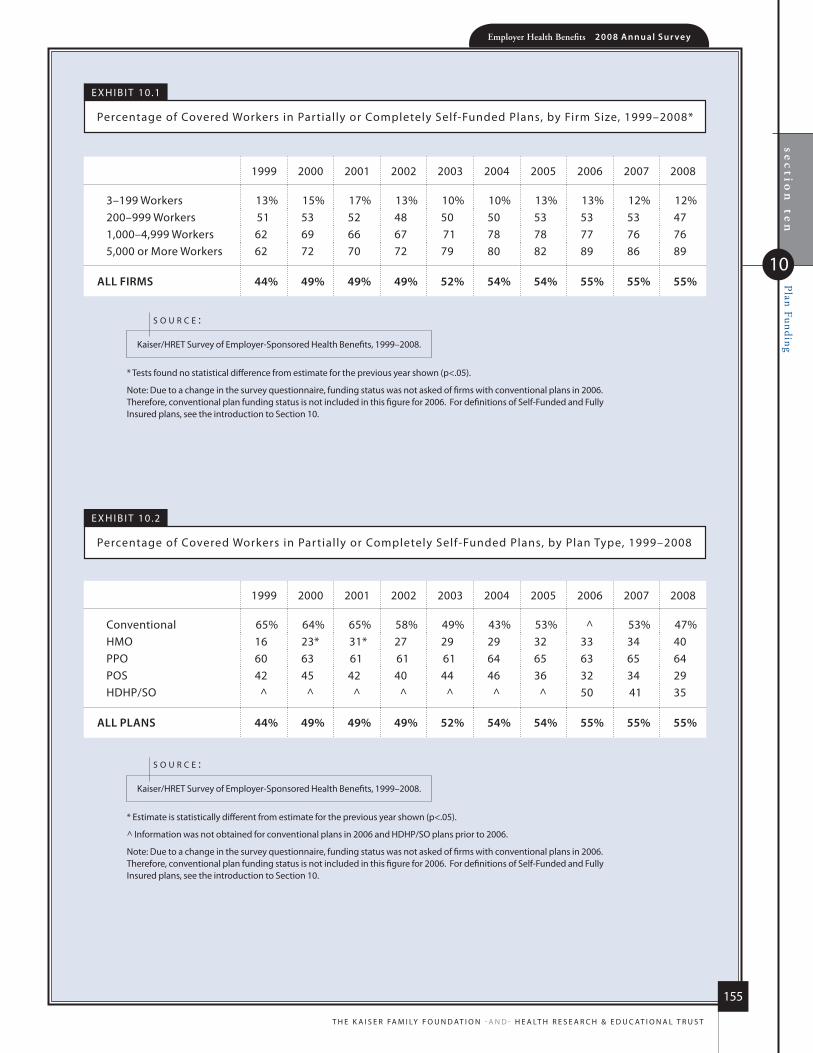
sec
tion
ten
Plan FundingEmployer Health Benefits 2 0 0 8 An n u a l s u r vey
155
t h e k a i s e r fa m i ly f o u n d at i o n - a n d - h e a lt h r e s e a r C h & e d u C at i o n a l t r u s t
10
* tests found no statistical difference from estimate for the previous year shown (p<.05).
note: due to a change in the survey questionnaire, funding status was not asked of firms with conventional plans in 2006. therefore, conventional plan funding status is not included in this figure for 2006. for definitions of self-funded and fully insured plans, see the introduction to section 10.
kaiser/hret survey of employer-sponsored health Benefits, 1999–2008.
s o u r c e :
* estimate is statistically different from estimate for the previous year shown (p<.05).
^ information was not obtained for conventional plans in 2006 and hdhP/so plans prior to 2006.
note: due to a change in the survey questionnaire, funding status was not asked of firms with conventional plans in 2006. therefore, conventional plan funding status is not included in this figure for 2006. for definitions of self-funded and fully insured plans, see the introduction to section 10.
kaiser/hret survey of employer-sponsored health Benefits, 1999–2008.
s o u r c e :
e x h i B i t 10.1
Percentage of Covered Workers in Partially or Completely self-funded Plans, by firm size, 1999–2008*
e x h i B i t 10.2
Percentage of Covered Workers in Partially or Completely self-funded Plans, by Plan type, 1999–2008
1999 2000 2001 2002 2003 2004 2005 2006 2007 2008
3–199 Workers 13% 15% 17% 13% 10% 10% 13% 13% 12% 12%200–999 Workers 51 53 52 48 50 50 53 53 53 471,000–4,999 Workers 62 69 66 67 71 78 78 77 76 765,000 or more Workers 62 72 70 72 79 80 82 89 86 89
All firms 44% 49% 49% 49% 52% 54% 54% 55% 55% 55%
1999 2000 2001 2002 2003 2004 2005 2006 2007 2008
Conventional 65% 64% 65% 58% 49% 43% 53% ^ 53% 47%hmo 16 23* 31* 27 29 29 32 33 34 40PPo 60 63 61 61 61 64 65 63 65 64Pos 42 45 42 40 44 46 36 32 34 29hdhP/so ^ ^ ^ ^ ^ ^ ^ 50 41 35
All plANs 44% 49% 49% 49% 52% 54% 54% 55% 55% 55%

Employer Health Benefits 2 0 0 8 An n u a l s u r vey
156
t h e k a i s e r fa m i ly f o u n d at i o n - a n d - h e a lt h r e s e a r C h & e d u C at i o n a l t r u s t
sec
tion
ten
Plan Funding
10
* estimate is statistically different from estimate for all other firms not in the indicated size, region, or industry category (p<.05).
note: for definitions of self-funded and fully insured plans, see the introduction to section 10.
kaiser/hret survey of employer-sponsored health Benefits, 2008.
s o u r c e :
e x h i B i t 10.3
Percentage of Covered Workers in Par t ia l ly or Completely sel f -funded Plans, by firm size, region, and industr y, 2008
self-funded (employer Bears some or all of financial risk)
firm size200–999 Workers 47%*1,000–4,999 Workers 76*5,000 or more Workers 89*
All small firms (3–199 Workers) 12%*All large firms (200 or more Workers) 77%*
regioNnortheast 57%midwest 60south 61*West 36*
iNDusTryagriculture/mining/Construction 35%*manufacturing 66*transportation/Communications/utilities 58Wholesale 43*retail 52finance 55service 49*state/local Government 66health Care 65*
All firms 55%
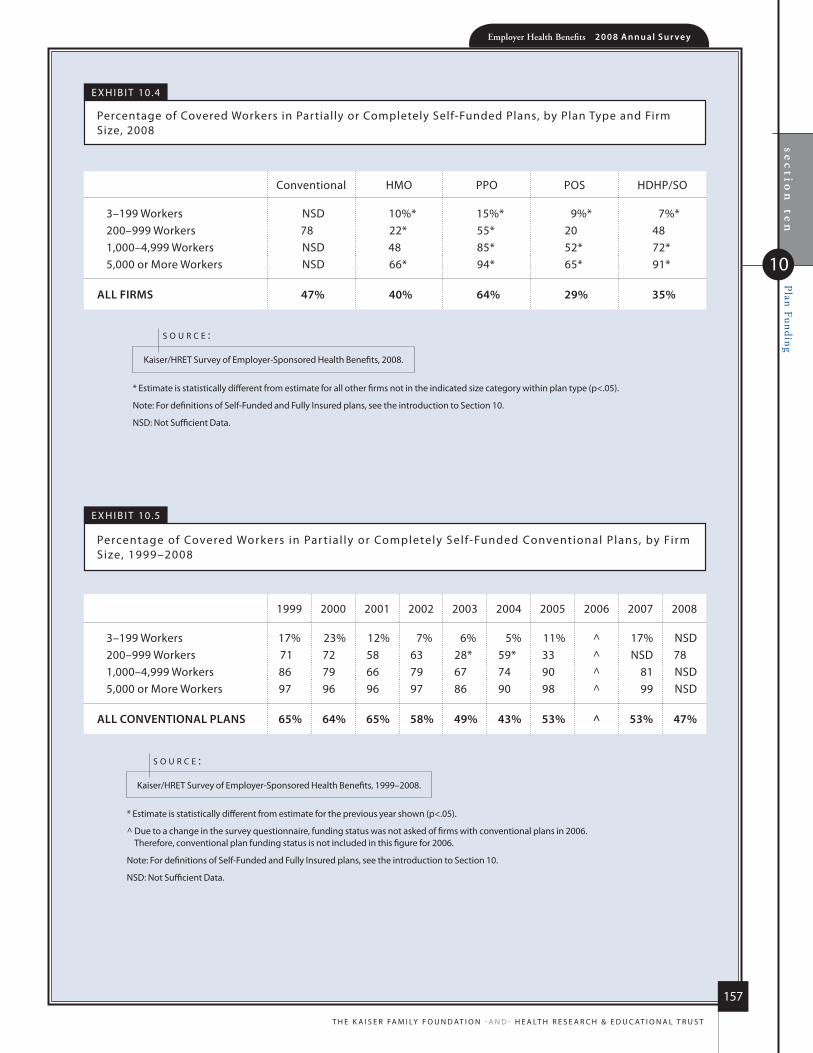
sec
tion
ten
Plan FundingEmployer Health Benefits 2 0 0 8 An n u a l s u r vey
157
t h e k a i s e r fa m i ly f o u n d at i o n - a n d - h e a lt h r e s e a r C h & e d u C at i o n a l t r u s t
10
e x h i B i t 10.4
Percentage of Covered Workers in Partially or Completely self-funded Plans, by Plan type and firm size, 2008
* estimate is statistically different from estimate for all other firms not in the indicated size category within plan type (p<.05).
note: for definitions of self-funded and fully insured plans, see the introduction to section 10.
nsd: not sufficient data.
kaiser/hret survey of employer-sponsored health Benefits, 2008.
s o u r c e :
Conventional hmo PPo Pos hdhP/so
3–199 Workers nsd 10%* 15%* 9%* 7%*200–999 Workers 78 22* 55* 20 481,000–4,999 Workers nsd 48 85* 52* 72*5,000 or more Workers nsd 66* 94* 65* 91*
All firms 47% 40% 64% 29% 35%
* estimate is statistically different from estimate for the previous year shown (p<.05).
^ due to a change in the survey questionnaire, funding status was not asked of firms with conventional plans in 2006. therefore, conventional plan funding status is not included in this figure for 2006.
note: for definitions of self-funded and fully insured plans, see the introduction to section 10.
nsd: not sufficient data.
kaiser/hret survey of employer-sponsored health Benefits, 1999–2008.
s o u r c e :
e x h i B i t 10.5
Percentage of Covered Workers in Par t ia l ly or Completely sel f -funded Conventional Plans, by firm size, 1999–2008
1999 2000 2001 2002 2003 2004 2005 2006 2007 2008
3–199 Workers 17% 23% 12% 7% 6% 5% 11% ^ 17% nsd200–999 Workers 71 72 58 63 28* 59* 33 ^ nsd 781,000–4,999 Workers 86 79 66 79 67 74 90 ^ 81 nsd5,000 or more Workers 97 96 96 97 86 90 98 ^ 99 nsd
All CoNveNTioNAl plANs 65% 64% 65% 58% 49% 43% 53% ^ 53% 47%
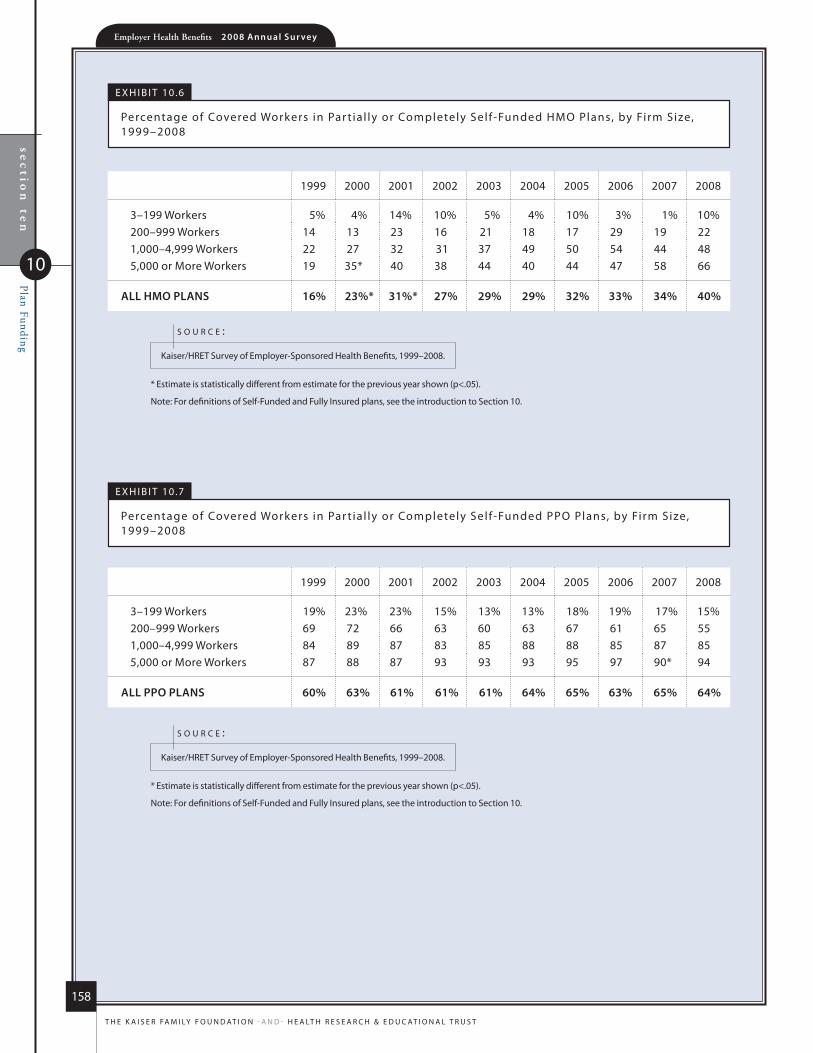
Employer Health Benefits 2 0 0 8 An n u a l s u r vey
158
t h e k a i s e r fa m i ly f o u n d at i o n - a n d - h e a lt h r e s e a r C h & e d u C at i o n a l t r u s t
sec
tion
ten
Plan Funding
10
* estimate is statistically different from estimate for the previous year shown (p<.05).
note: for definitions of self-funded and fully insured plans, see the introduction to section 10.
kaiser/hret survey of employer-sponsored health Benefits, 1999–2008.
s o u r c e :
* estimate is statistically different from estimate for the previous year shown (p<.05).
note: for definitions of self-funded and fully insured plans, see the introduction to section 10.
kaiser/hret survey of employer-sponsored health Benefits, 1999–2008.
s o u r c e :
e x h i B i t 10.6
Percentage of Covered Workers in Par t ia l ly or Completely sel f -funded hmo Plans, by firm size, 1999–2008
e x h i B i t 10.7
Percentage of Covered Workers in Par t ia l ly or Completely sel f -funded PPo Plans, by firm size, 1999–2008
1999 2000 2001 2002 2003 2004 2005 2006 2007 2008
3–199 Workers 5% 4% 14% 10% 5% 4% 10% 3% 1% 10%200–999 Workers 14 13 23 16 21 18 17 29 19 221,000–4,999 Workers 22 27 32 31 37 49 50 54 44 485,000 or more Workers 19 35* 40 38 44 40 44 47 58 66
All hmo plANs 16% 23%* 31%* 27% 29% 29% 32% 33% 34% 40%
1999 2000 2001 2002 2003 2004 2005 2006 2007 2008
3–199 Workers 19% 23% 23% 15% 13% 13% 18% 19% 17% 15%200–999 Workers 69 72 66 63 60 63 67 61 65 551,000–4,999 Workers 84 89 87 83 85 88 88 85 87 855,000 or more Workers 87 88 87 93 93 93 95 97 90* 94
All ppo plANs 60% 63% 61% 61% 61% 64% 65% 63% 65% 64%
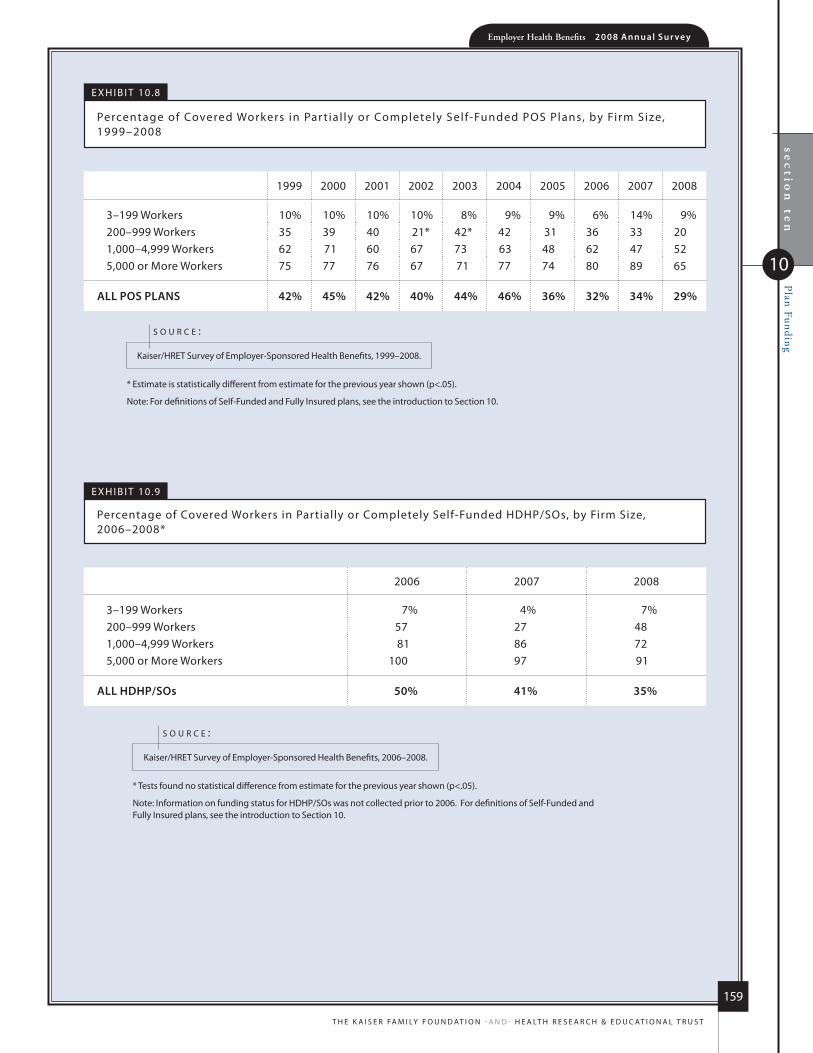
sec
tion
ten
Plan FundingEmployer Health Benefits 2 0 0 8 An n u a l s u r vey
159
t h e k a i s e r fa m i ly f o u n d at i o n - a n d - h e a lt h r e s e a r C h & e d u C at i o n a l t r u s t
10
* estimate is statistically different from estimate for the previous year shown (p<.05).
note: for definitions of self-funded and fully insured plans, see the introduction to section 10.
kaiser/hret survey of employer-sponsored health Benefits, 1999–2008.
s o u r c e :
e x h i B i t 10.8
Percentage of Covered Workers in Par t ia l ly or Completely sel f -funded Pos Plans, by firm size, 1999–2008
1999 2000 2001 2002 2003 2004 2005 2006 2007 2008
3–199 Workers 10% 10% 10% 10% 8% 9% 9% 6% 14% 9%200–999 Workers 35 39 40 21* 42* 42 31 36 33 201,000–4,999 Workers 62 71 60 67 73 63 48 62 47 525,000 or more Workers 75 77 76 67 71 77 74 80 89 65
All pos plANs 42% 45% 42% 40% 44% 46% 36% 32% 34% 29%
e x h i B i t 10.9
Percentage of Covered Workers in Partially or Completely self-funded hdhP/sos, by firm size, 2006–2008*
* tests found no statistical difference from estimate for the previous year shown (p<.05).
note: information on funding status for hdhP/sos was not collected prior to 2006. for definitions of self-funded and fully insured plans, see the introduction to section 10.
kaiser/hret survey of employer-sponsored health Benefits, 2006–2008.
s o u r c e :
2006 2007 2008
3–199 Workers 7% 4% 7%200–999 Workers 57 27 481,000–4,999 Workers 81 86 725,000 or more Workers 100 97 91
All hDhp/sos 50% 41% 35%
63%$12,6
80
$4,7
04
2008
E H B2 0 0 8 A N N U A L S U R V E Y
Retiree Health Benefits
11
Employer Health Benefits 2 0 0 8 An n u a l s u r vey
section
elevenR
etiree Health B
enefits
11
162
t h e k a i s e r fa m i ly f o u n d at i o n - a n d - h e a lt h r e s e a r C h & e d u C at i o n a l t r u s t
r e t i r e e h e a l t h B e n e f i t S
reTiree healTh benefiTs are an imporTanT consideraTion for older workers making decisions abouT Their
reTiremenT. healTh benefiTs for reTirees also provide an imporTanT supplemenT To medicare for reTirees
age 65 or older. among firms offering healTh benefiTs To Their workers, large firms (200 or more
workers) are much more likely Than small firms (3–199 workers) To offer reTiree healTh benefiTs. afTer
falling dramaTically in The laTe 1980s and early 1990s, The percenTage of large firms (200 or more
workers) offering reTiree healTh benefiTs has remained relaTively consTanT.
Thirty-one percent of large firms (200 or more workers) that offer health benefits to their employees offer retiree coverage in 2008, similar to 33% in 2007 but down from 66% in 1988 (Exhibit 11.1).
Offering retiree health benefits varies substantially with firm size, industry, presence of union workers, wage level, and other factors.
Large firms (200 or more workers) are much more likely to offer retiree health benefits than small firms (3–199 workers). Among firms that offer health benefits, 31% of large firms (200 or more workers) offer retiree health benefits, compared to just 4% of small firms (3–199 workers) (Exhibit 11.2).
Among large firms (200 or more workers) that offer health benefits, state and local governments, and firms in the finance industry are more likely than large firms in other industries to offer retiree health benefits (Exhibit 11.2). In contrast, large firms in the retail and wholesale industries are less likely to offer retiree health benefits when compared to large firms in other industries.
Large firms (200 or more workers) with union workers are significantly more likely to offer retiree health benefits than large firms without union workers—46% of all large firms with union employees that offer health benefits offer retiree health benefits, compared to 24% for all large firms with no union employees (Exhibit 11.3).
Large firms (200 or more workers) with few lower-wage workers (where less than 35% of workers earn $22,000 a year or less) are significantly more likely to offer retiree health benefits than large firms with a higher proportion of lower-wage workers (where 35% or more workers earn $22,000 a year or less)—34% versus 17% (Exhibit 11.3).
Among firms offering health benefits, virtually all large firms (200 or more workers) that offer retiree health benefits offer them to early retirees under the age of 65 (93%). A lower percentage (75%) of large firms offering retiree health benefits offer them to Medicare-age retirees (Exhibit 11.4).
This year we asked employers currently providing health benefits to retirees whether any of their current workers would be eligible for retiree health benefits when they retire in the future, assuming that the worker meets relevant eligibility criteria.
Among large firms currently offering retiree health benefits, 69% report that at least some active employees would be eligible for retiree health benefits after they retire at age 65 or older (Exhibit 11.6). At these firms, approximately 78% of active employees will be eligible for retiree health benefits at age 65 if they remain at the firm until retirement (Exhibit 11.7).
Among large firms currently offering retiree health benefits, 90% stated that at least some active employees would be eligible for retiree health benefits if they retire before the age of 65 (Exhibit 11.6). At these firms, approximately 72% of active employees will be eligible if they retire from the firm before the age of 65 (Exhibit 11.7).
We also asked employers currently providing retiree health benefits whether recently hired workers would be eligible for retiree health benefits when they retire in the future, assuming that the worker meets relevant eligibility criteria.
Among large firms currently offering retiree health benefits, 61% indicated that at least some employees hired in the past 12 months would be eligible for retiree health benefits if they remain employed by the firm until retirement at age 65 or older. Similarly, 71% reported that at least some employees hired in the past year would be eligible for early retiree health benefits (before the age of 65) (Exhibit 11.8).

section
elevenR
etiree Health B
enefits
11
Employer Health Benefits 2 0 0 8 An n u a l s u r vey
163
t h e k a i s e r fa m i ly f o u n d at i o n - a n d - h e a lt h r e s e a r C h & e d u C at i o n a l t r u s t
1988 1991 1993 1995 1998 1999 2000 2001 2002 2003 2004 2005 2006 2007 20080%
10%
20%
30%
40%
50%
60%
70%
80%
90%
100%
66%
46%
36%40% 40% 40%
35% 37% 36% 38% 36% 33% 35% 33% 31%
* tests found no statistical difference from estimate for the previous year shown (p<.05). no statistical tests are conducted for years prior to 1999.
kaiser/hret survey of employer-sponsored health Benefits, 1999–2008; kPmG survey of employer-sponsored health Benefits, 1991, 1993, 1995, 1998; the health insurance association of america (hiaa), 1988.
s o u r c e :
e x h i B i t 11.1
among al l large firms (200 or more Workers) o ffer ing health Benef its to ac t ive Workers, Percentage of fi rms o ffer ing ret iree health Benef its, 1988–2008*
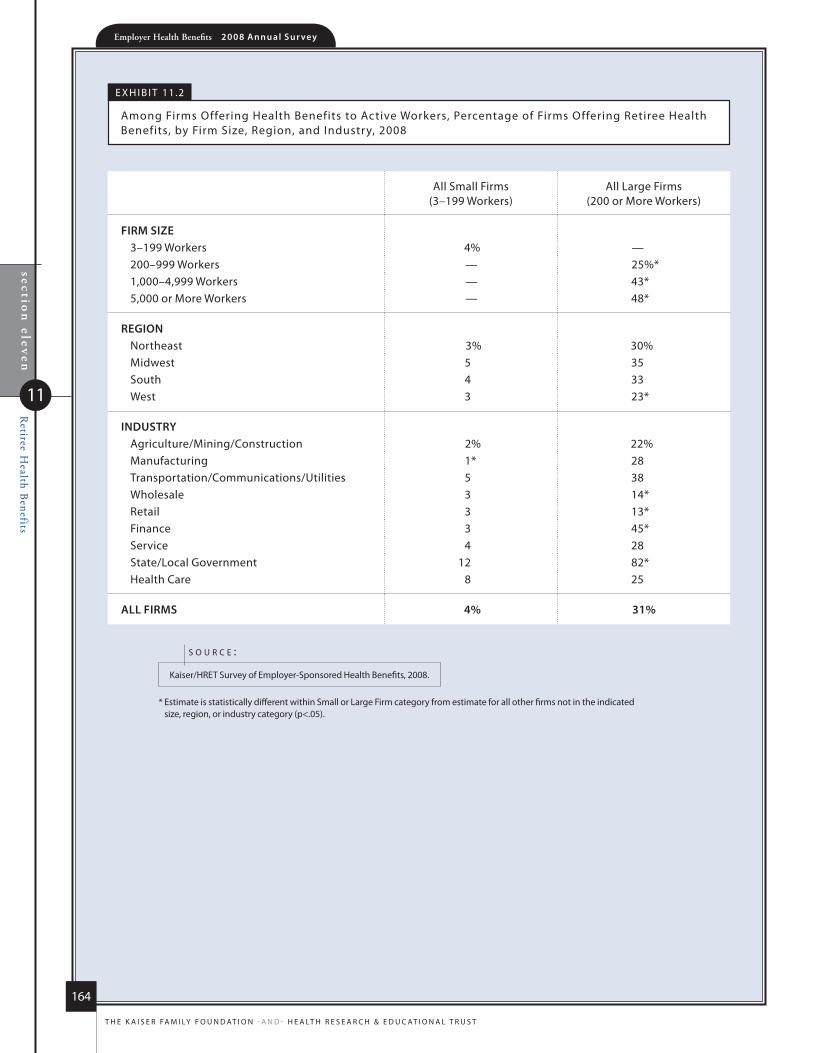
section
elevenR
etiree Health B
enefits
11
Employer Health Benefits 2 0 0 8 An n u a l s u r vey
164
t h e k a i s e r fa m i ly f o u n d at i o n - a n d - h e a lt h r e s e a r C h & e d u C at i o n a l t r u s t
e x h i B i t 11.2
among firms offering health Benefits to active Workers, Percentage of firms offering retiree health Benefits, by firm size, region, and industry, 2008
* estimate is statistically different within small or large firm category from estimate for all other firms not in the indicated size, region, or industry category (p<.05).
kaiser/hret survey of employer-sponsored health Benefits, 2008.
s o u r c e :
all small firms (3–199 Workers)
all large firms (200 or more Workers)
firm size3–199 Workers 4% —200–999 Workers — 25%*1,000–4,999 Workers — 43*5,000 or more Workers — 48*
regioNnortheast 3% 30%midwest 5 35south 4 33West 3 23*
iNDusTryagriculture/mining/Construction 2% 22%manufacturing 1* 28transportation/Communications/utilities 5 38Wholesale 3 14*retail 3 13*finance 3 45*service 4 28state/local Government 12 82*health Care 8 25
All firms 4% 31%
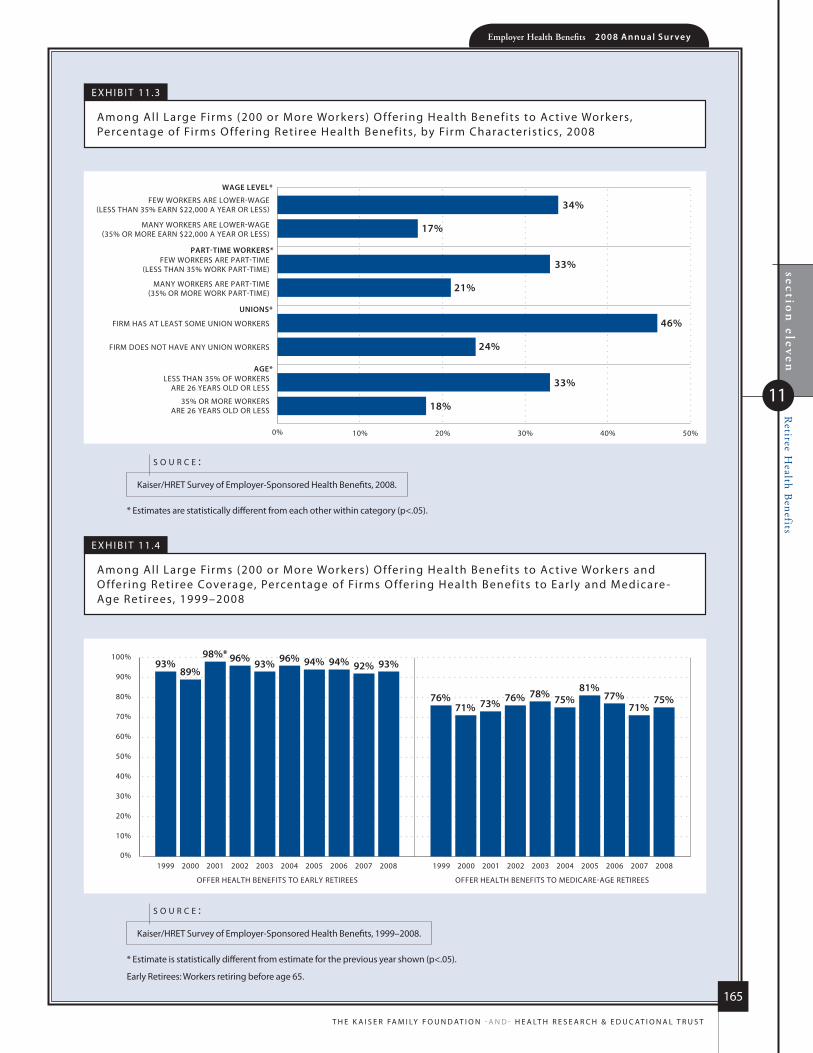
section
elevenR
etiree Health B
enefits
11
Employer Health Benefits 2 0 0 8 An n u a l s u r vey
165
t h e k a i s e r fa m i ly f o u n d at i o n - a n d - h e a lt h r e s e a r C h & e d u C at i o n a l t r u s t
* estimates are statistically different from each other within category (p<.05).
kaiser/hret survey of employer-sponsored health Benefits, 2008.
s o u r c e :
e x h i B i t 11.3
among al l large firms (200 or more Workers) o ffer ing health Benef its to ac t ive Workers, Percentage of fi rms o ffer ing ret iree health Benef its, by firm Charac ter ist ics, 2008
FIRM DOES NOT HAVE ANY UNION WORKERS
FIRM HAS AT LEAST SOME UNION WORKERS
FEW WORKERS ARE LOWER-WAGE(LESS THAN 35% EARN $22,000 A YEAR OR LESS)
MANY WORKERS ARE LOWER-WAGE (35% OR MORE EARN $22,000 A YEAR OR LESS)
FEW WORKERS ARE PART-TIME(LESS THAN 35% WORK PART-TIME)
MANY WORKERS ARE PART-TIME(35% OR MORE WORK PART-TIME)
WAGE LEVEL*
PART-TIME WORKERS*
UNIONS*
35% OR MORE WORKERS ARE 26 YEARS OLD OR LESS
LESS THAN 35% OF WORKERS ARE 26 YEARS OLD OR LESS
AGE*
0% 10% 20% 30% 40% 50%
17%
34%
21%
33%
24%
33%
18%
46%
OFFER HEALTH BENEFITS TO EARLY RETIREES OFFER HEALTH BENEFITS TO MEDICARE-AGE RETIREES
0%
10%
20%
30%
40%
50%
60%
70%
80%
90%
100%93%
89%
98%* 96% 93% 96% 94% 94% 92% 93%
76%71% 73% 76% 78% 75%
81%77%
71%75%
1999 2000 2001 2002 2003 2004 2005 2006 2007 2008 1999 2000 2001 2002 2003 2004 2005 2006 2007 2008
* estimate is statistically different from estimate for the previous year shown (p<.05).
early retirees: Workers retiring before age 65.
kaiser/hret survey of employer-sponsored health Benefits, 1999–2008.
s o u r c e :
e x h i B i t 11.4
among al l large firms (200 or more Workers) o ffer ing health Benef its to ac t ive Workers and o ffer ing ret iree Coverage, Percentage of fi rms o ffer ing health Benef its to ear ly and medicare -age ret irees, 1999–2008
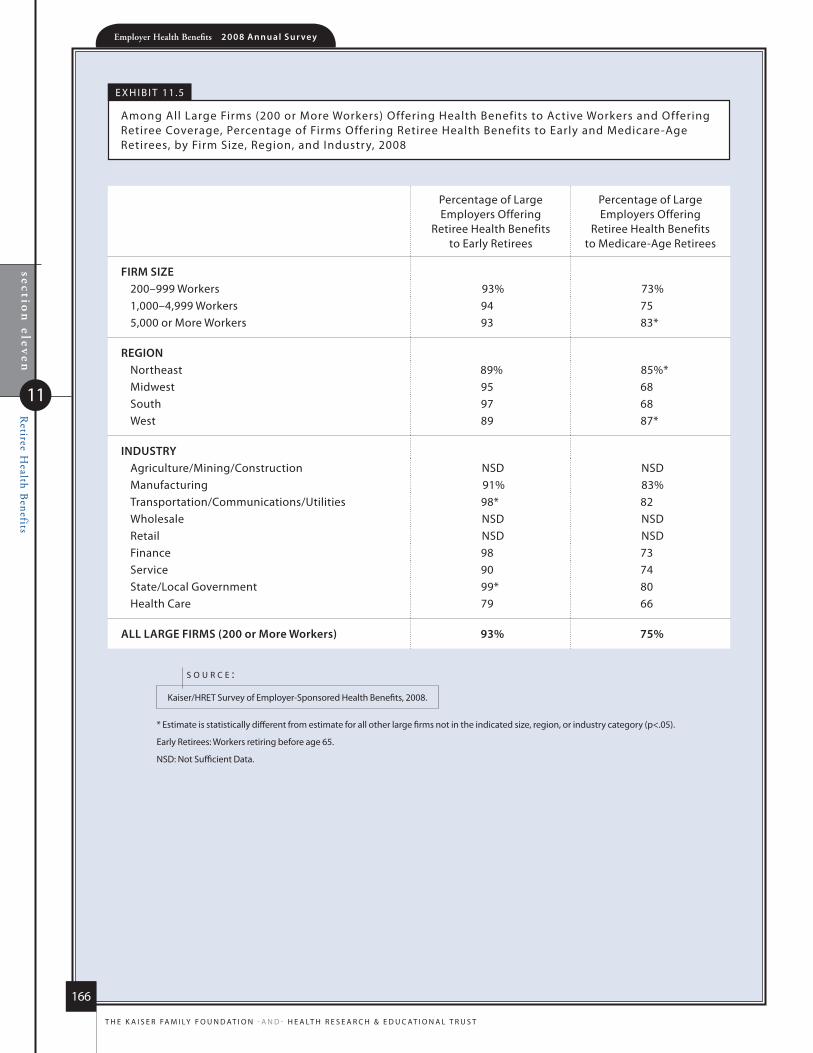
section
elevenR
etiree Health B
enefits
11
Employer Health Benefits 2 0 0 8 An n u a l s u r vey
166
t h e k a i s e r fa m i ly f o u n d at i o n - a n d - h e a lt h r e s e a r C h & e d u C at i o n a l t r u s t
e x h i B i t 11.5
among all large firms (200 or more Workers) offering health Benefits to active Workers and offering retiree Coverage, Percentage of firms offering retiree health Benefits to early and medicare-age retirees, by firm size, region, and industry, 2008
* estimate is statistically different from estimate for all other large firms not in the indicated size, region, or industry category (p<.05).
early retirees: Workers retiring before age 65.
nsd: not sufficient data.
kaiser/hret survey of employer-sponsored health Benefits, 2008.
s o u r c e :
Percentage of large employers offering
retiree health Benefits to early retirees
Percentage of large employers offering
retiree health Benefits to medicare-age retirees
firm size200–999 Workers 93% 73%1,000–4,999 Workers 94 755,000 or more Workers 93 83*
regioNnortheast 89% 85%*midwest 95 68south 97 68West 89 87*
iNDusTryagriculture/mining/Construction nsd nsdmanufacturing 91% 83%transportation/Communications/utilities 98* 82Wholesale nsd nsdretail nsd nsdfinance 98 73service 90 74state/local Government 99* 80health Care 79 66
All lArge firms (200 or more Workers) 93% 75%

section
elevenR
etiree Health B
enefits
11
Employer Health Benefits 2 0 0 8 An n u a l s u r vey
167
t h e k a i s e r fa m i ly f o u n d at i o n - a n d - h e a lt h r e s e a r C h & e d u C at i o n a l t r u s t
EARLY RETIREES MEDICARE-AGE RETIREES0%
10%
20%
30%
40%
50%
60%
70%
80%
90%
100%
90% 90% 89% 90%
68% 69%72%
69%
200–999 WORKERS
1,000–4,999 WORKERS
5,000 OR MORE WORKERS
ALL LARGE FIRMS (200 OR MORE WORKERS)* tests found no statistical difference between estimates when compared to estimate
for all large firms not in the indicated size category (p<.05).
early retirees: Workers retiring before age 65.
kaiser/hret survey of employer-sponsored health Benefits, 2008.
s o u r c e :
e x h i B i t 11.6
among al l large firms (200 or more Workers) o ffer ing health Benef its to ac t ive Workers and o ffer ing ret iree health Benef its, Percentage of fi rms in Which at least some ac t ive employees are el igible for ret iree health Benef its, by firm size, 2008*
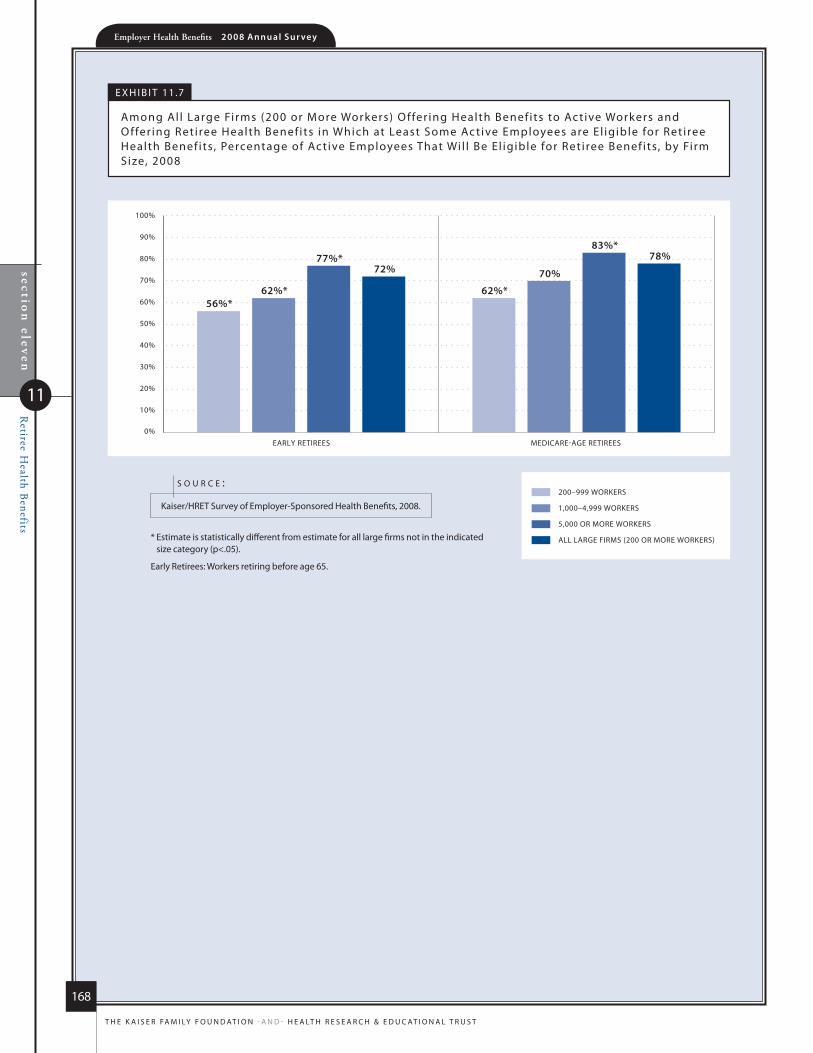
section
elevenR
etiree Health B
enefits
11
Employer Health Benefits 2 0 0 8 An n u a l S u r vey
168
T h e K a i s e r Fa m i ly F o u n d aT i o n - a n d - h e a lT h r e s e a r c h & e d u c aT i o n a l T r u s T
EARLY RETIREES MEDICARE-AGE RETIREES0%
10%
20%
30%
40%
50%
60%
70%
80%
90%
100%
56%*62%*
77%*72%
62%*
70%
83%*78%
200–999 WORKERS
1,000–4,999 WORKERS
5,000 OR MORE WORKERS
ALL LARGE FIRMS (200 OR MORE WORKERS)* estimate is statistically different from estimate for all large firms not in the indicated size category (p<.05).
early retirees: Workers retiring before age 65.
Kaiser/hreT survey of employer-sponsored health Benefits, 2008.
s o u r c e :
e x h i B i T 11.7
among al l large Firms (200 or more Workers) o ffer ing health Benef its to ac t ive Workers and o ffer ing ret iree health Benef its in Which at least some ac t ive employees are el igible for ret iree health Benef its, Percentage of ac t ive employees That Wil l Be el igible for ret iree Benef its, by Firm size, 2008
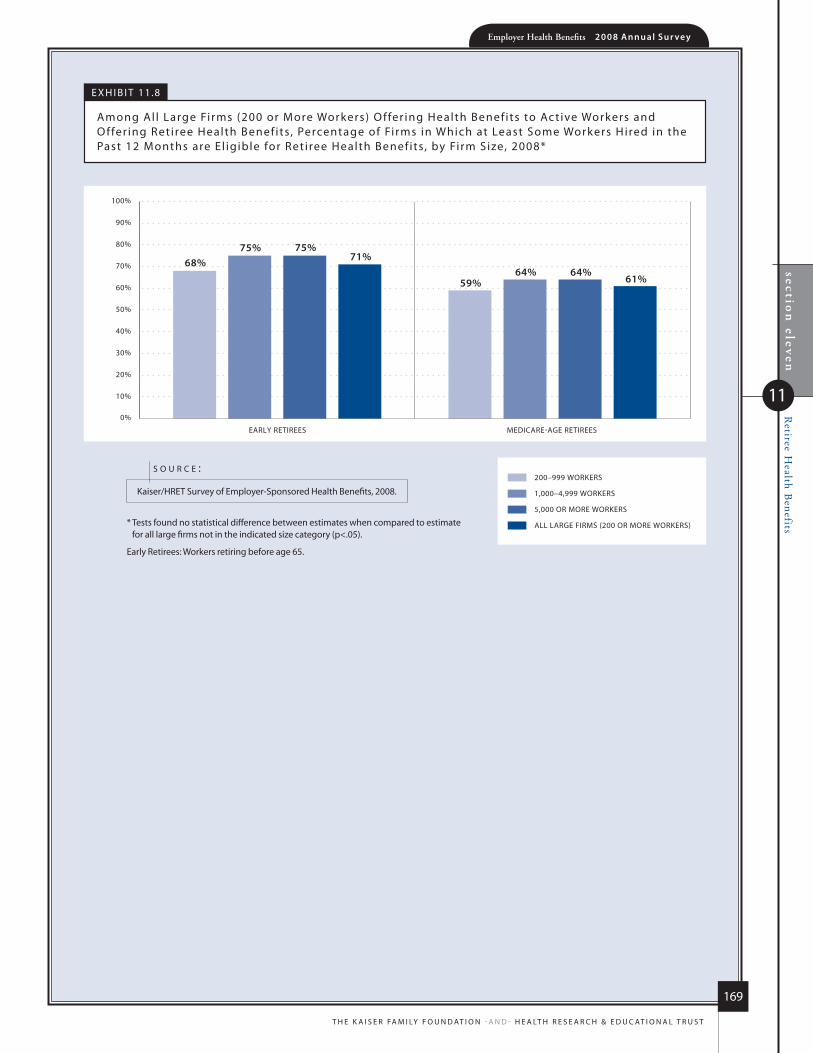
section
elevenR
etiree Health B
enefits
11
Employer Health Benefits 2 0 0 8 An n u a l S u r vey
169
T h e K a i s e r Fa m i ly F o u n d aT i o n - a n d - h e a lT h r e s e a r c h & e d u c aT i o n a l T r u s T
EARLY RETIREES MEDICARE-AGE RETIREES
0%
10%
20%
30%
40%
50%
60%
70%
80%
90%
100%
68%75% 75%
71%
59%64% 64%
61%
200–999 WORKERS
1,000–4,999 WORKERS
5,000 OR MORE WORKERS
ALL LARGE FIRMS (200 OR MORE WORKERS)* Tests found no statistical difference between estimates when compared to estimate for all large firms not in the indicated size category (p<.05).
early retirees: Workers retiring before age 65.
Kaiser/hreT survey of employer-sponsored health Benefits, 2008.
s o u r c e :
e x h i B i T 11.8
among al l large Firms (200 or more Workers) o ffer ing health Benef its to ac t ive Workers and o ffer ing ret iree health Benef its, Percentage of Fi rms in Which at least some Workers hired in the Past 12 months are el igible for ret iree health Benef its, by Firm size, 2008*
63%$12,6
80
$4,7
04
2008
E H B2 0 0 8 A N N U A L S U R V E Y
Wellness Programs and
Employer Opinions
12

Employer Health Benefits 2 0 0 8 An n u a l s u r vey
section
twelve
Wellness Program
s and Em
ployer Opinions
12
172
t h e k a i s e r fa m i ly f o u n d at i o n - a n d - h e a lt h r e s e a r C h & e d u C at i o n a l t r u s t
W e l l n e S S p r o g r a M S a n D e M p l o y e r o p i n i o n S
employers play a significanT role in healTh insurance coverage—providing healTh benefiTs To abouT 158
million nonelderly people in america1—so Their aTTiTudes, knowledge, and experiences are imporTanT
facTors in healTh policy discussions.
This year’s survey included new quesTions on The wellness programs offered To employees, incenTives for
parTicipaTion in wellness programs, employer opinions of wellness programs, and The disease managemenT
programs offered To employees. employers also were asked how They view differenT approaches To
conTaining cosT increases and how They plan To change Their healTh benefiT plans in The near fuTure.
W e l l N e s s b e N e f i T s
�In an effort to improve health and lower costs, some health plans or employers offer wellness programs. Wellness programs may range from classes in nutrition or healthy living to a wellness newsletter.
Fifty-four percent of firms offering health benefits offer at least one of the following wellness programs: weight loss programs, gym membership discounts or on-site exercise facilities, smoking cessation program, personal health coaching, classes in nutrition or healthy living, web-based resources for healthy living, or a wellness newsletter.2 The offer rate for each type of wellness benefit included in the survey is presented in Exhibit 12.1 and Exhibit 12.2. Forty-seven percent of firms offering health insurance and wellness benefits offer the benefits to spouses or dependents (Exhibit 12.3).
Among firms offering health benefits and at least one wellness program, 70% of employers report that most of the wellness benefits they offer are provided through the health plan (Exhibit 12.3).3
There is no significant difference between small firms (3–199 workers) and large firms (200 or more workers) in the percentage reporting most wellness programs are provided by the health plan (71% vs. 62%) (Exhibit 12.3).
�In order to encourage participation in wellness programs, firms may offer financial incentives to employees who participate.
Very few firms offering health benefits offer the following incentives to workers who participate in wellness programs: a smaller share of the premium (4%), a lower deductible (1%), or gift cards, travel, merchandise, or cash (7%). Among firms that offer a high-deductible plan paired with a HRA or HSA, 2% of firms offer workers who participate in wellness programs higher HSA or HRA contributions than employees who do not participate. Large firms (200 or more workers) are more likely to offer gift cards, travel, merchandise, or cash than small firms (3–199 workers) (20% vs. 6%) (Exhibit 12.4).
1 kaiser family foundation, kaiser Commission on medicaid and the uninsured, health insurance Coverage in america, 2006 data update, october 2007.
2 in previous years, the survey collected information on the types of wellness programs offered by the firm, including fitness programs or on-site health club facilities, smoking cessation programs, and weight loss programs. Previously, the question asked about the wellness benefits offered by the firm. in 2008, the question was expanded to ask firms if they or any of their health plans offer the specified wellness programs.
3 the survey asks firms offering at least one wellness program if most of the wellness benefits are provided by the health plan or the firm.
n o T e :
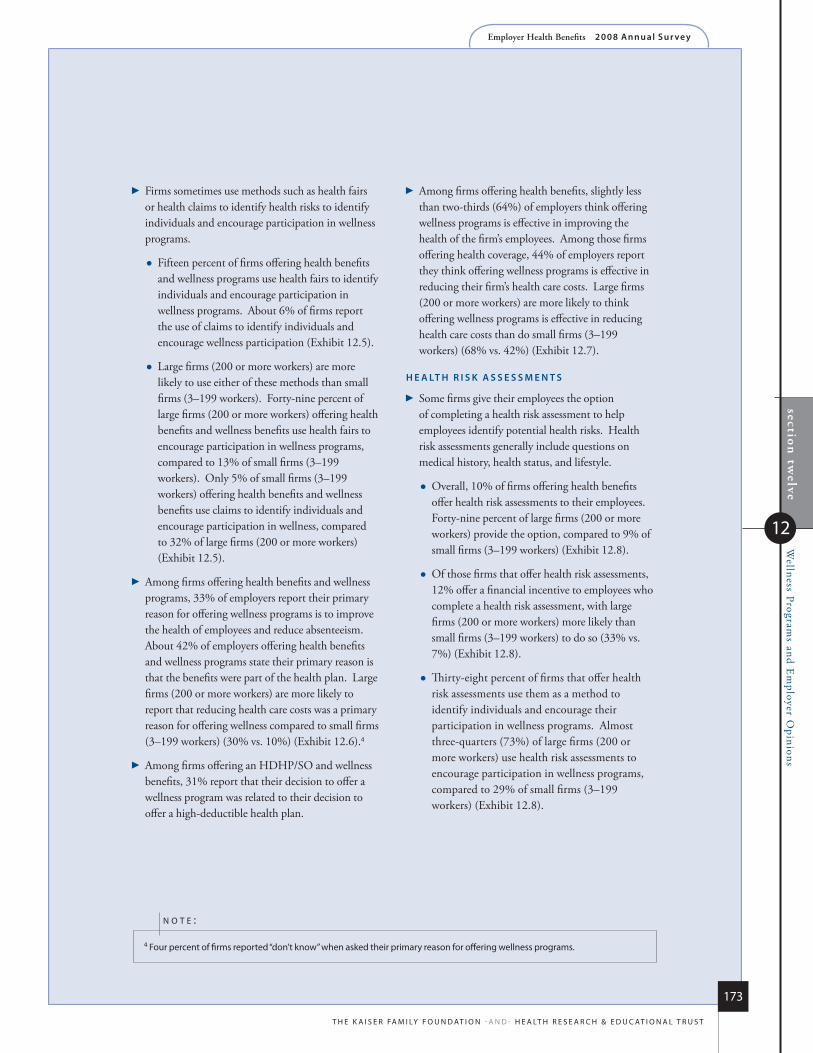
section
twelve
Wellness Program
s and Em
ployer Opinions
12
Employer Health Benefits 2 0 0 8 An n u a l s u r vey
173
t h e k a i s e r fa m i ly f o u n d at i o n - a n d - h e a lt h r e s e a r C h & e d u C at i o n a l t r u s t
4 four percent of firms reported “don’t know” when asked their primary reason for offering wellness programs.
n o T e :
�Firms sometimes use methods such as health fairs or health claims to identify health risks to identify individuals and encourage participation in wellness programs.
Fifteen percent of firms offering health benefits and wellness programs use health fairs to identify individuals and encourage participation in wellness programs. About 6% of firms report the use of claims to identify individuals and encourage wellness participation (Exhibit 12.5).
Large firms (200 or more workers) are more likely to use either of these methods than small firms (3–199 workers). Forty-nine percent of large firms (200 or more workers) offering health benefits and wellness benefits use health fairs to encourage participation in wellness programs, compared to 13% of small firms (3–199 workers). Only 5% of small firms (3–199 workers) offering health benefits and wellness benefits use claims to identify individuals and encourage participation in wellness, compared to 32% of large firms (200 or more workers) (Exhibit 12.5).
�Among firms offering health benefits and wellness programs, 33% of employers report their primary reason for offering wellness programs is to improve the health of employees and reduce absenteeism. About 42% of employers offering health benefits and wellness programs state their primary reason is that the benefits were part of the health plan. Large firms (200 or more workers) are more likely to report that reducing health care costs was a primary reason for offering wellness compared to small firms (3–199 workers) (30% vs. 10%) (Exhibit 12.6).4
�Among firms offering an HDHP/SO and wellness benefits, 31% report that their decision to offer a wellness program was related to their decision to offer a high-deductible health plan.
�Among firms offering health benefits, slightly less than two-thirds (64%) of employers think offering wellness programs is effective in improving the health of the firm’s employees. Among those firms offering health coverage, 44% of employers report they think offering wellness programs is effective in reducing their firm’s health care costs. Large firms (200 or more workers) are more likely to think offering wellness programs is effective in reducing health care costs than do small firms (3–199 workers) (68% vs. 42%) (Exhibit 12.7).
h e A lT h r i s k A s s e s s m e N T s
�Some firms give their employees the option of completing a health risk assessment to help employees identify potential health risks. Health risk assessments generally include questions on medical history, health status, and lifestyle.
Overall, 10% of firms offering health benefits offer health risk assessments to their employees. Forty-nine percent of large firms (200 or more workers) provide the option, compared to 9% of small firms (3–199 workers) (Exhibit 12.8).
Of those firms that offer health risk assessments, 12% offer a financial incentive to employees who complete a health risk assessment, with large firms (200 or more workers) more likely than small firms (3–199 workers) to do so (33% vs. 7%) (Exhibit 12.8).
Thirty-eight percent of firms that offer health risk assessments use them as a method to identify individuals and encourage their participation in wellness programs. Almost three-quarters (73%) of large firms (200 or more workers) use health risk assessments to encourage participation in wellness programs, compared to 29% of small firms (3–199 workers) (Exhibit 12.8).

Employer Health Benefits 2 0 0 8 An n u a l s u r vey
section
twelve
Wellness Program
s and Em
ployer Opinions
12
174
t h e k a i s e r fa m i ly f o u n d at i o n - a n d - h e a lt h r e s e a r C h & e d u C at i o n a l t r u s t
D i s e A s e m A N A g e m e N T
�Disease management programs try to improve the health of and reduce the costs associated with people with chronic illnesses by teaching patients about their disease, suggesting treatment options, and assessing the treatment process and outcomes.
The proportion of firms where the largest plan includes one or more disease management programs is 26% in 2008, the same percentage reported in 2006, the last time this question was asked. Large firms (200 or more workers) are more likely than small firms (3–199 workers) to include disease management in their health plan with the largest enrollment (59% vs. 25%). To encourage participation, 10% of firms offer financial incentives to employees who participate in disease management programs (Exhibit 12.9).
e m p l o y e r o p i N i o N s o N C o s T
C o N TA i N m e N T A N D l i k e ly C h A N g e s
i N h e A lT h b e N e f i T s
�All firms, including those that offer and do not offer health benefits, were asked to rate how effective several different strategies are in reducing the growth of health insurance costs. Few firms rated any of the suggested strategies as “very effective” at controlling costs (between 7% and 18% of firms, depending on the strategy). More firms (between 32% and 46%) report that each of the approaches we asked about were “somewhat effective” at controlling cost growth.
Similar percentages of employers report that consumer-driven health plans (15%), higher employee cost sharing (13%), or disease management programs (18%) would be “very effective” in reducing the growth of health care costs. Large firms (200 or more workers) are more likely than small firms (3–199 workers) to report disease management programs as being “very effective” at controlling costs (28% vs. 17%) (Exhibit 12.12).
�Each year we ask employers whether they expect to change the employee premium contributions, cost sharing, or eligibility for health benefits in the next year.
Thirty-five percent of large firms (200 or more workers) say that they are “very likely” to increase the amount employees pay for health insurance in the next year, compared to 13% of small firms (3–199 workers) (Exhibit 12.13). An additional 26% of all firms say they are “somewhat likely” to do so.
Relatively small percentages of firms say that they are “very likely” to increase employee cost sharing next year, with 12% saying that they are “very likely” to increase deductibles, 10% saying that they are “very likely” to increase office visit copayments or coinsurance, and 9% saying that they are “very likely” to increase the amount that employees pay for prescription drugs (Exhibit 12.13). These responses vary little between small firms (3–199 workers) and large firms (200 or more workers).
As observed in previous years, small percentages of employers report that they are likely to restrict eligibility or drop coverage altogether. One percent of firms say that they are “very likely” to restrict eligibility for benefits in the next year. About three percent of firms say that they are “very likely” to drop coverage in the next year (Exhibit 12.13). These percentages are not statistically different from the percentages reported in 2007.
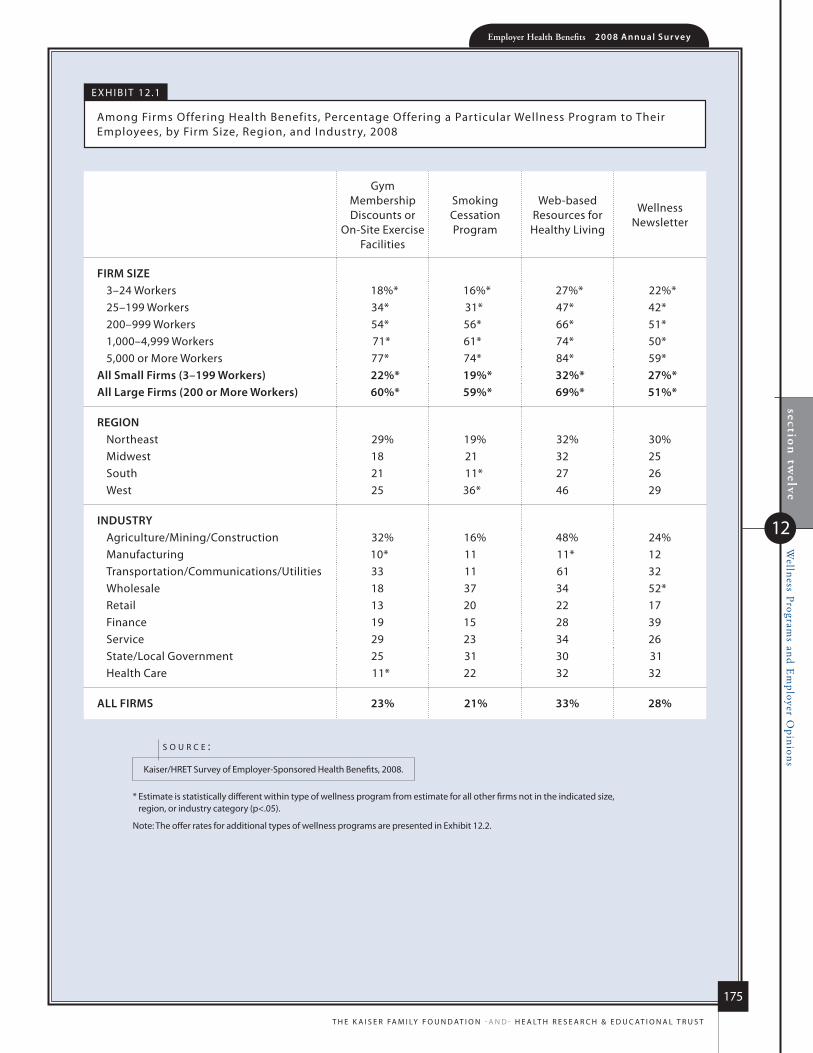
section
twelve
Wellness Program
s and Em
ployer Opinions
12
Employer Health Benefits 2 0 0 8 An n u a l s u r vey
175
t h e k a i s e r fa m i ly f o u n d at i o n - a n d - h e a lt h r e s e a r C h & e d u C at i o n a l t r u s t
e x h i B i t 12.1
among firms offering health Benefits, Percentage offering a Particular Wellness Program to their employees, by firm size, region, and industry, 2008
* estimate is statistically different within type of wellness program from estimate for all other firms not in the indicated size, region, or industry category (p<.05).
note: the offer rates for additional types of wellness programs are presented in exhibit 12.2.
kaiser/hret survey of employer-sponsored health Benefits, 2008.
s o u r c e :
Gym membership discounts or
on-site exercise facilities
smoking Cessation Program
Web-based resources for healthy living
Wellness newsletter
firm size3–24 Workers 18%* 16%* 27%* 22%*25–199 Workers 34* 31* 47* 42*200–999 Workers 54* 56* 66* 51*1,000–4,999 Workers 71* 61* 74* 50*5,000 or more Workers 77* 74* 84* 59*
All small firms (3–199 Workers) 22%* 19%* 32%* 27%*All large firms (200 or more Workers) 60%* 59%* 69%* 51%*
regioNnortheast 29% 19% 32% 30%midwest 18 21 32 25south 21 11* 27 26West 25 36* 46 29
iNDusTryagriculture/mining/Construction 32% 16% 48% 24%manufacturing 10* 11 11* 12transportation/Communications/utilities 33 11 61 32Wholesale 18 37 34 52*retail 13 20 22 17finance 19 15 28 39service 29 23 34 26state/local Government 25 31 30 31health Care 11* 22 32 32
All firms 23% 21% 33% 28%
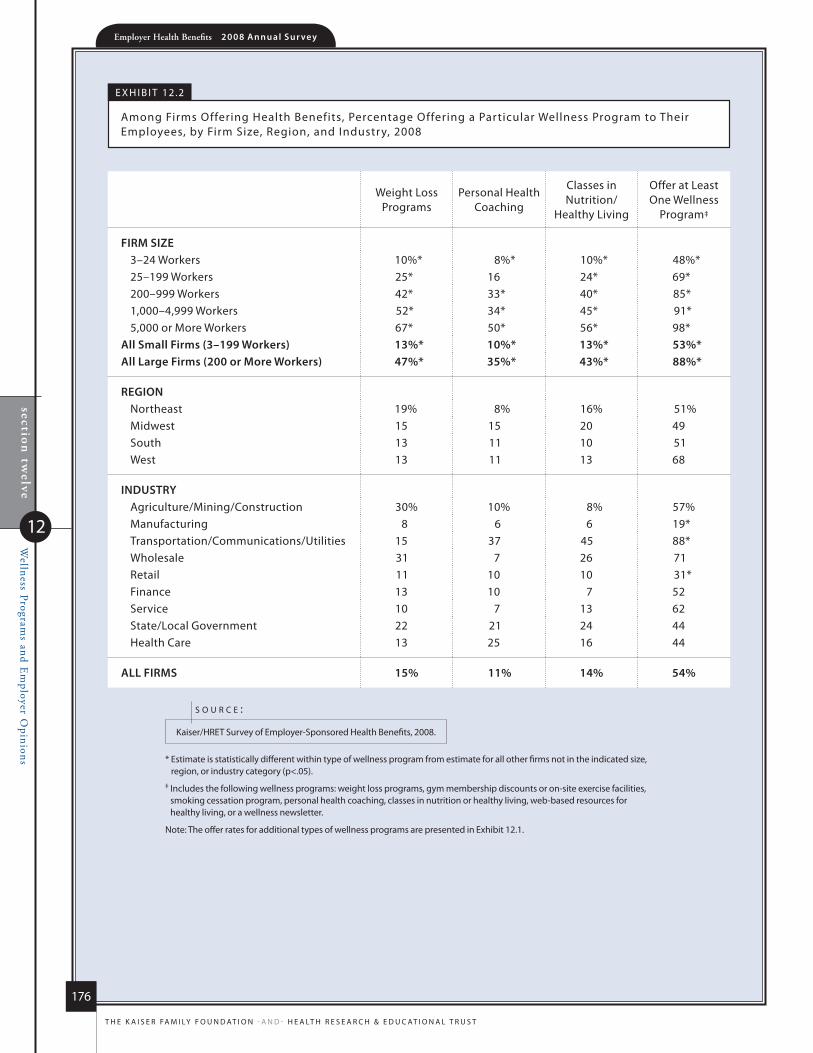
section
twelve
Wellness Program
s and Em
ployer Opinions
12
Employer Health Benefits 2 0 0 8 An n u a l s u r vey
176
t h e k a i s e r fa m i ly f o u n d at i o n - a n d - h e a lt h r e s e a r C h & e d u C at i o n a l t r u s t
e x h i B i t 12.2
among firms offering health Benefits, Percentage offering a Particular Wellness Program to their employees, by firm size, region, and industry, 2008
* estimate is statistically different within type of wellness program from estimate for all other firms not in the indicated size, region, or industry category (p<.05).
‡ includes the following wellness programs: weight loss programs, gym membership discounts or on-site exercise facilities, smoking cessation program, personal health coaching, classes in nutrition or healthy living, web-based resources for healthy living, or a wellness newsletter.
note: the offer rates for additional types of wellness programs are presented in exhibit 12.1.
kaiser/hret survey of employer-sponsored health Benefits, 2008.
s o u r c e :
Weight loss Programs
Personal health Coaching
Classes in nutrition/
healthy living
offer at least one Wellness
Program‡
firm size3–24 Workers 10%* 8%* 10%* 48%*25–199 Workers 25* 16 24* 69*200–999 Workers 42* 33* 40* 85*1,000–4,999 Workers 52* 34* 45* 91*5,000 or more Workers 67* 50* 56* 98*
All small firms (3–199 Workers) 13%* 10%* 13%* 53%*All large firms (200 or more Workers) 47%* 35%* 43%* 88%*
regioNnortheast 19% 8% 16% 51%midwest 15 15 20 49south 13 11 10 51West 13 11 13 68
iNDusTryagriculture/mining/Construction 30% 10% 8% 57%manufacturing 8 6 6 19*transportation/Communications/utilities 15 37 45 88*Wholesale 31 7 26 71retail 11 10 10 31*finance 13 10 7 52service 10 7 13 62state/local Government 22 21 24 44health Care 13 25 16 44
All firms 15% 11% 14% 54%

section
twelve
Wellness Program
s and Em
ployer Opinions
12
Employer Health Benefits 2 0 0 8 An n u a l s u r vey
177
t h e k a i s e r fa m i ly f o u n d at i o n - a n d - h e a lt h r e s e a r C h & e d u C at i o n a l t r u s t
e x h i B i t 12.3
among firms offering health Benefits, Percentage of firms with the following features of Wellness Benefits, by firm size and region, 2008
* estimate is statistically different from estimate for all other firms not in the indicated size or region (p<.05).
note: the survey asks firms offering at least one wellness program if most of the wellness benefits are provided by the health plan or the firm.
kaiser/hret survey of employer-sponsored health Benefits, 2008.
s o u r c e :
Wellness Benefits offered to spouses or dependents
most Wellness Benefits are Provided by the health Plan
firm size3–24 Workers 42% 71%25–199 Workers 55 71200–999 Workers 65* 641,000–4,999 Workers 62* 59*5,000 or more Workers 73* 54*
All small firms (3–199 Workers) 46%* 71%All large firms (200 or more Workers) 65%* 62%
regioNnortheast 48% 86%*midwest 56 61south 30* 64West 59 70
All firms 47% 70%
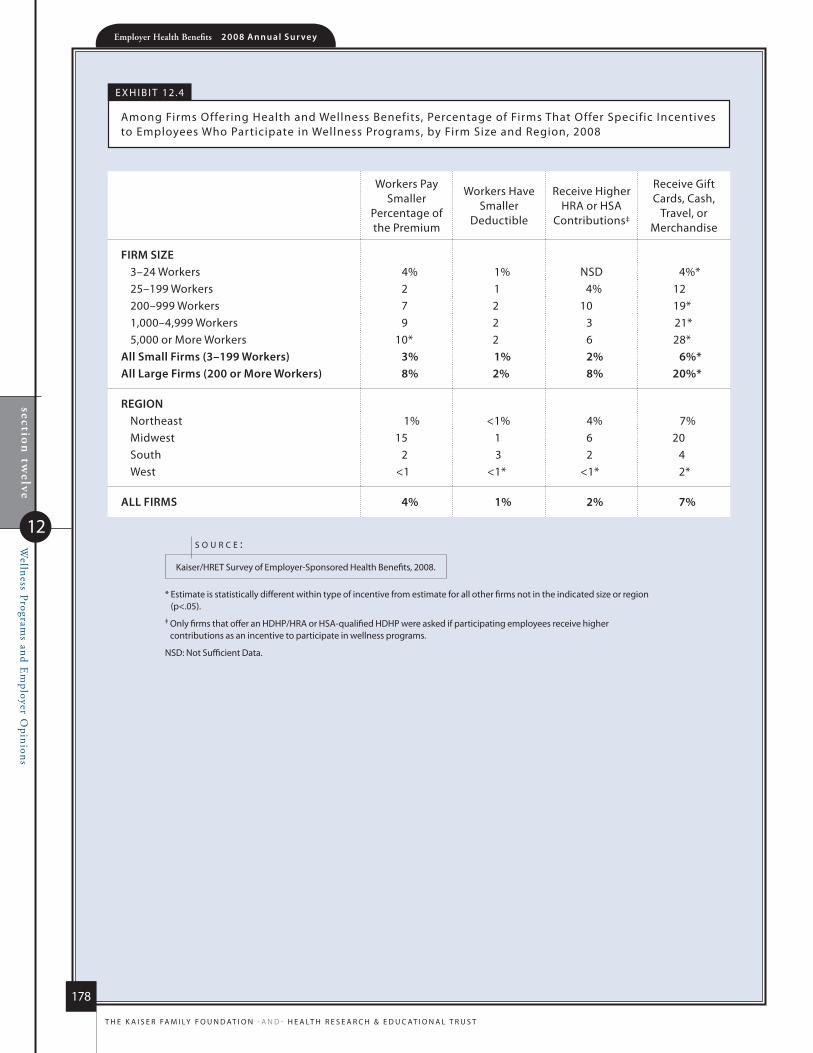
section
twelve
Wellness Program
s and Em
ployer Opinions
12
Employer Health Benefits 2 0 0 8 An n u a l s u r vey
178
t h e k a i s e r fa m i ly f o u n d at i o n - a n d - h e a lt h r e s e a r C h & e d u C at i o n a l t r u s t
e x h i B i t 12.4
among firms offering health and Wellness Benefits, Percentage of firms that offer specific incentives to employees Who Participate in Wellness Programs, by firm size and region, 2008
* estimate is statistically different within type of incentive from estimate for all other firms not in the indicated size or region (p<.05).
‡ only firms that offer an hdhP/hra or hsa-qualified hdhP were asked if participating employees receive higher contributions as an incentive to participate in wellness programs.
nsd: not sufficient data.
kaiser/hret survey of employer-sponsored health Benefits, 2008.
s o u r c e :
Workers Pay smaller
Percentage of the Premium
Workers have smaller
deductible
receive higher hra or hsa
Contributions‡
receive Gift Cards, Cash,
travel, or merchandise
firm size3–24 Workers 4% 1% nsd 4%*25–199 Workers 2 1 4% 12200–999 Workers 7 2 10 19*1,000–4,999 Workers 9 2 3 21*5,000 or more Workers 10* 2 6 28*
All small firms (3–199 Workers) 3% 1% 2% 6%*All large firms (200 or more Workers) 8% 2% 8% 20%*
regioNnortheast 1% <1% 4% 7%midwest 15 1 6 20south 2 3 2 4West <1 <1* <1* 2*
All firms 4% 1% 2% 7%
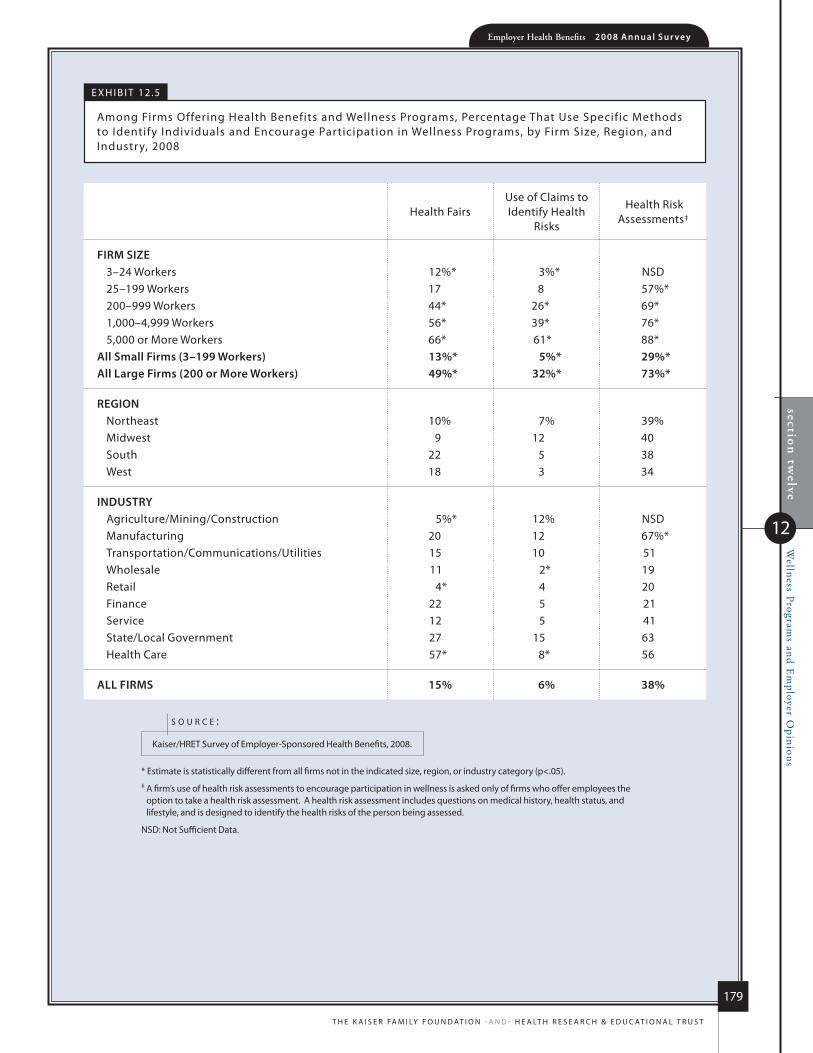
section
twelve
Wellness Program
s and Em
ployer Opinions
12
Employer Health Benefits 2 0 0 8 An n u a l s u r vey
179
t h e k a i s e r fa m i ly f o u n d at i o n - a n d - h e a lt h r e s e a r C h & e d u C at i o n a l t r u s t
e x h i B i t 12.5
among firms offering health Benefits and Wellness Programs, Percentage that use specific methods to identify individuals and encourage Participation in Wellness Programs, by firm size, region, and industry, 2008
* estimate is statistically different from all firms not in the indicated size, region, or industry category (p<.05).‡ a firm’s use of health risk assessments to encourage participation in wellness is asked only of firms who offer employees the
option to take a health risk assessment. a health risk assessment includes questions on medical history, health status, and lifestyle, and is designed to identify the health risks of the person being assessed.
nsd: not sufficient data.
kaiser/hret survey of employer-sponsored health Benefits, 2008.
s o u r c e :
health fairsuse of Claims to identify health
risks
health risk assessments‡
firm size3–24 Workers 12%* 3%* nsd25–199 Workers 17 8 57%*200–999 Workers 44* 26* 69*1,000–4,999 Workers 56* 39* 76*5,000 or more Workers 66* 61* 88*
All small firms (3–199 Workers) 13%* 5%* 29%*All large firms (200 or more Workers) 49%* 32%* 73%*
regioNnortheast 10% 7% 39%midwest 9 12 40south 22 5 38West 18 3 34
iNDusTryagriculture/mining/Construction 5%* 12% nsdmanufacturing 20 12 67%*transportation/Communications/utilities 15 10 51Wholesale 11 2* 19retail 4* 4 20finance 22 5 21service 12 5 41state/local Government 27 15 63health Care 57* 8* 56
All firms 15% 6% 38%
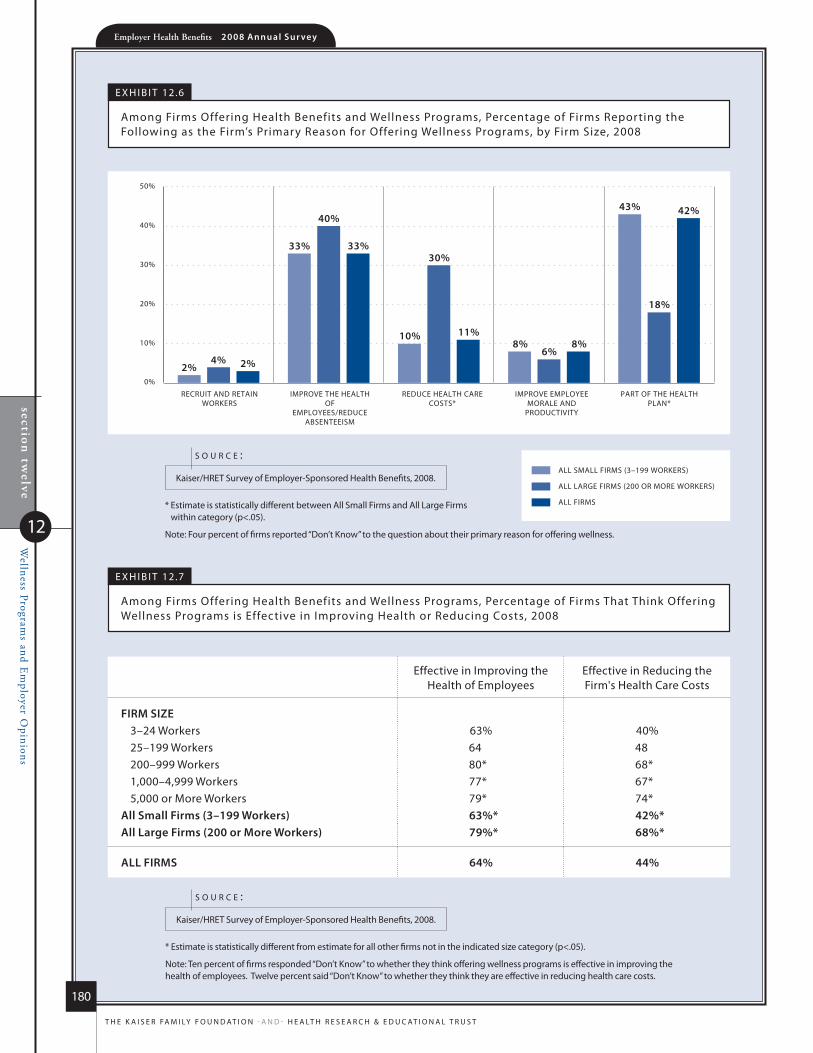
section
twelve
Wellness Program
s and Em
ployer Opinions
12
Employer Health Benefits 2 0 0 8 An n u a l s u r vey
180
t h e k a i s e r fa m i ly f o u n d at i o n - a n d - h e a lt h r e s e a r C h & e d u C at i o n a l t r u s t
RECRUIT AND RETAINWORKERS
IMPROVE THE HEALTHOF
EMPLOYEES/REDUCEABSENTEEISM
REDUCE HEALTH CARECOSTS*
IMPROVE EMPLOYEEMORALE AND
PRODUCTIVITY
PART OF THE HEALTHPLAN*
0%
10%
20%
30%
40%
50%
2%4% 2%
33%
40%
33%
10%
30%
11%8%
6%8%
43%
18%
42%
ALL SMALL FIRMS (3–199 WORKERS)
ALL LARGE FIRMS (200 OR MORE WORKERS)
ALL FIRMS
e x h i B i t 12.6
among firms offering health Benefits and Wellness Programs, Percentage of firms reporting the following as the firm’s Primary reason for offering Wellness Programs, by firm size, 2008
* estimate is statistically different between all small firms and all large firms within category (p<.05).
note: four percent of firms reported “don’t know” to the question about their primary reason for offering wellness.
kaiser/hret survey of employer-sponsored health Benefits, 2008.
s o u r c e :
e x h i B i t 12.7
among firms offering health Benefits and Wellness Programs, Percentage of firms that think offering Wellness Programs is effective in improving health or reducing Costs, 2008
* estimate is statistically different from estimate for all other firms not in the indicated size category (p<.05).
note: ten percent of firms responded “don’t know” to whether they think offering wellness programs is effective in improving the health of employees. twelve percent said “don’t know” to whether they think they are effective in reducing health care costs.
kaiser/hret survey of employer-sponsored health Benefits, 2008.
s o u r c e :
effective in improving the health of employees
effective in reducing the firm's health Care Costs
firm size3–24 Workers 63% 40%25–199 Workers 64 48200–999 Workers 80* 68*1,000–4,999 Workers 77* 67*5,000 or more Workers 79* 74*
All small firms (3–199 Workers) 63%* 42%*All large firms (200 or more Workers) 79%* 68%*
All firms 64% 44%

section
twelve
Wellness Program
s and Em
ployer Opinions
12
Employer Health Benefits 2 0 0 8 An n u a l s u r vey
181
t h e k a i s e r fa m i ly f o u n d at i o n - a n d - h e a lt h r e s e a r C h & e d u C at i o n a l t r u s t
e x h i B i t 12.8
among firms offering health Benefits, Percentage of firms that offer employees health risk assessments, offer incentives to Complete assessments, and use assessments to increase Wellness Participation, by firm size and region, 2008
* estimate is statistically different from estimate for all other firms not in the indicated size or region (p<.05).
note: a health risk assessment includes questions on medical history, health status, and lifestyle, and is designed to identify the health risks of the person being assessed.
nsd: not sufficient data.
kaiser/hret survey of employer-sponsored health Benefits, 2008.
s o u r c e :
offer employees option to
Complete health risk assessment
offer financial incentives
to employees Who Complete an assessment
use health risk assessments to
increase Wellness Participation
firm size3–24 Workers 6%* nsd nsd25–199 Workers 17* 16% 57%*200–999 Workers 45* 28* 69*1,000–4,999 Workers 55* 35* 76*5,000 or more Workers 67* 51* 88*
All small firms (3–199 Workers) 9%* 7%* 29%*All large firms (200 or more Workers) 49%* 33%* 73%*
regioNnortheast 9% 14% 39%midwest 10 19 40south 10 10 38West 11 6 34
All firms 10% 12% 38%

section
twelve
Wellness Program
s and Em
ployer Opinions
12
Employer Health Benefits 2 0 0 8 An n u a l s u r vey
182
t h e k a i s e r fa m i ly f o u n d at i o n - a n d - h e a lt h r e s e a r C h & e d u C at i o n a l t r u s t
PLAN INCLUDES A DISEASE MANAGEMENT PROGRAM* FIRM OFFERS FINANCIAL INCENTIVES TO PARTICIPATE IN A DISEASE MANAGEMENT PROGRAM‡
0%
10%
20%
30%
40%
50%
60%
70%
25%
59%
26%
11%
6%10%
ALL SMALL FIRMS (3–199 WORKERS)
ALL LARGE FIRMS (200 OR MORE WORKERS)
ALL FIRMS
e x h i B i t 12.9
among firms offering health Benefits, Percentage of firms that offer a disease management Program for their Plan with the largest enrollment and Percentage of firms with disease management offering financial incentives to Participate, by firm size, 2008
* estimate is statistically different between all small firms and all large firms within category (p<.05).
‡ among firms offering health benefits that offer a disease management program for their plan with the largest enrollment.
kaiser/hret survey of employer-sponsored health Benefits, 2008.
s o u r c e :
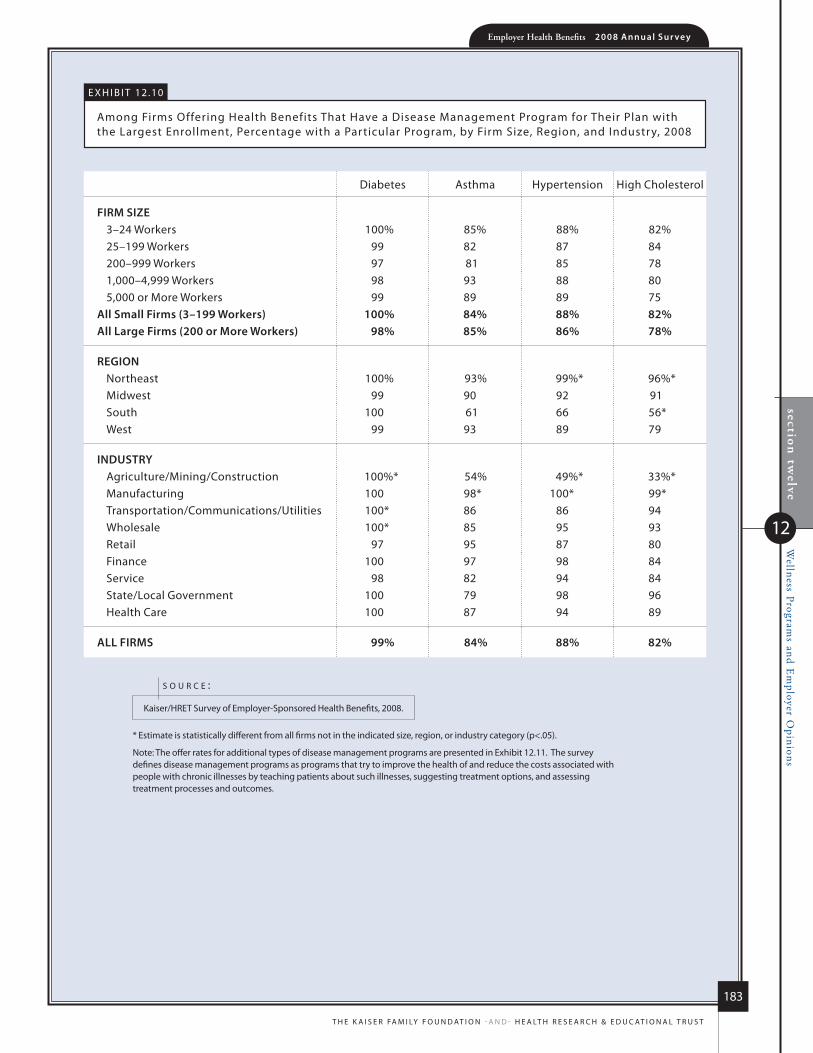
section
twelve
Wellness Program
s and Em
ployer Opinions
12
Employer Health Benefits 2 0 0 8 An n u a l s u r vey
183
t h e k a i s e r fa m i ly f o u n d at i o n - a n d - h e a lt h r e s e a r C h & e d u C at i o n a l t r u s t
e x h i B i t 12.10
among firms offering health Benefits that have a disease management Program for their Plan with the largest enrollment, Percentage with a Particular Program, by firm size, region, and industry, 2008
* estimate is statistically different from all firms not in the indicated size, region, or industry category (p<.05).
note: the offer rates for additional types of disease management programs are presented in exhibit 12.11. the survey defines disease management programs as programs that try to improve the health of and reduce the costs associated with people with chronic illnesses by teaching patients about such illnesses, suggesting treatment options, and assessing treatment processes and outcomes.
kaiser/hret survey of employer-sponsored health Benefits, 2008.
s o u r c e :
diabetes asthma hypertension high Cholesterol
firm size3–24 Workers 100% 85% 88% 82%25–199 Workers 99 82 87 84200–999 Workers 97 81 85 781,000–4,999 Workers 98 93 88 805,000 or more Workers 99 89 89 75
All small firms (3–199 Workers) 100% 84% 88% 82%All large firms (200 or more Workers) 98% 85% 86% 78%
regioNnortheast 100% 93% 99%* 96%*midwest 99 90 92 91south 100 61 66 56*West 99 93 89 79
iNDusTryagriculture/mining/Construction 100%* 54% 49%* 33%*manufacturing 100 98* 100* 99*transportation/Communications/utilities 100* 86 86 94Wholesale 100* 85 95 93retail 97 95 87 80finance 100 97 98 84service 98 82 94 84state/local Government 100 79 98 96health Care 100 87 94 89
All firms 99% 84% 88% 82%
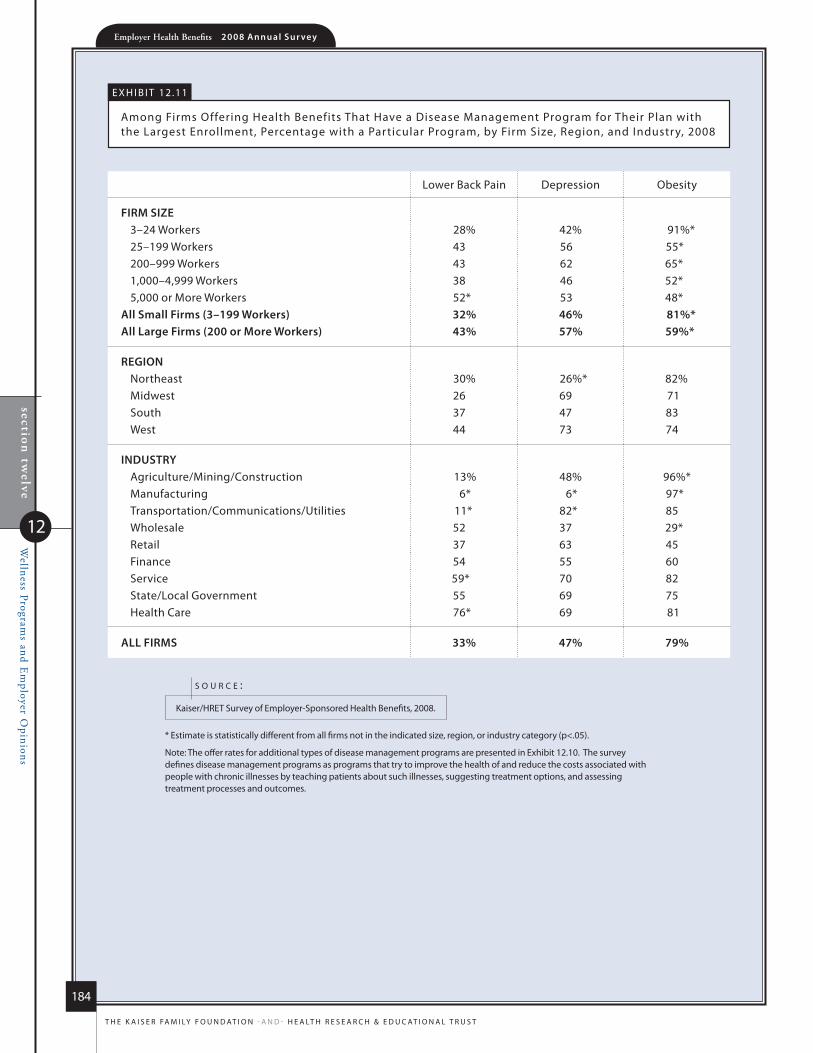
section
twelve
Wellness Program
s and Em
ployer Opinions
12
Employer Health Benefits 2 0 0 8 An n u a l s u r vey
184
t h e k a i s e r fa m i ly f o u n d at i o n - a n d - h e a lt h r e s e a r C h & e d u C at i o n a l t r u s t
e x h i B i t 12.11
among firms offering health Benefits that have a disease management Program for their Plan with the largest enrollment, Percentage with a Particular Program, by firm size, region, and industry, 2008
* estimate is statistically different from all firms not in the indicated size, region, or industry category (p<.05).
note: the offer rates for additional types of disease management programs are presented in exhibit 12.10. the survey defines disease management programs as programs that try to improve the health of and reduce the costs associated with people with chronic illnesses by teaching patients about such illnesses, suggesting treatment options, and assessing treatment processes and outcomes.
kaiser/hret survey of employer-sponsored health Benefits, 2008.
s o u r c e :
lower Back Pain depression obesity
firm size3–24 Workers 28% 42% 91%*25–199 Workers 43 56 55*200–999 Workers 43 62 65*1,000–4,999 Workers 38 46 52*5,000 or more Workers 52* 53 48*
All small firms (3–199 Workers) 32% 46% 81%*All large firms (200 or more Workers) 43% 57% 59%*
regioNnortheast 30% 26%* 82%midwest 26 69 71south 37 47 83West 44 73 74
iNDusTryagriculture/mining/Construction 13% 48% 96%*manufacturing 6* 6* 97*transportation/Communications/utilities 11* 82* 85Wholesale 52 37 29*retail 37 63 45finance 54 55 60service 59* 70 82state/local Government 55 69 75health Care 76* 69 81
All firms 33% 47% 79%

section
twelve
Wellness Program
s and Em
ployer Opinions
12
Employer Health Benefits 2 0 0 8 An n u a l s u r vey
185
t h e k a i s e r fa m i ly f o u n d at i o n - a n d - h e a lt h r e s e a r C h & e d u C at i o n a l t r u s t
e x h i B i t 12.12
among Both firms offering and not offering health Benefits, distribution of firms’ opinions on the effectiveness of the following strategies to Contain health insurance Costs, by firm size, 2008
* distributions are statistically different between all small firms and all large firms within category (p<.05).
kaiser/hret survey of employer-sponsored health Benefits, 2008.
s o u r c e :
Very effective
somewhat effective
not too effective
not at all effective
don’t know
Tighter managed Care Networks*all small firms (3–199 Workers) 7% 42% 17% 22% 12%all large firms (200 or more Workers) 4% 33% 37% 24% 2%
All firms 7% 42% 18% 22% 12%
Consumer-Driven health plans (ex: high-Deductible plan Combined with a health savings Account)*
all small firms (3–199 Workers) 15% 40% 19% 17% 9%all large firms (200 or more Workers) 13% 52% 19% 11% 5%
All firms 15% 40% 19% 17% 9%
higher employee Cost sharing*all small firms (3–199 Workers) 13% 31% 24% 26% 6%all large firms (200 or more Workers) 12% 48% 24% 14% 2%
All firms 13% 32% 24% 25% 6%
Disease management programs*all small firms (3–199 Workers) 17% 45% 11% 16% 10%all large firms (200 or more Workers) 28% 56% 9% 4% 3%
All firms 18% 46% 11% 15% 10%

section
twelve
Wellness Program
s and Em
ployer Opinions
12
Employer Health Benefits 2 0 0 8 An n u a l s u r vey
186
t h e k a i s e r fa m i ly f o u n d at i o n - a n d - h e a lt h r e s e a r C h & e d u C at i o n a l t r u s t
e x h i B i t 12.13
among firms offering health Benefits, distribution of firms reporting the likelihood of making the following Changes in the next year, by firm size, 2008
Very likely
somewhat likely
not too likely
not at all likely
don’t know
increase the Amount employees pay for health insurance*
all small firms (3–199 Workers) 13% 25% 23% 37% 1%all large firms (200 or more Workers) 35% 37% 16% 11% 1%
All firms 14% 26% 23% 36% 1%
increase the Amount employees pay for Deductibles
all small firms (3–199 Workers) 12% 29% 26% 31% 2%all large firms (200 or more Workers) 9% 31% 35% 24% 1%
All firms 12% 29% 27% 31% 2%
increase the Amount employees pay for office visit Copays or Coinsurance*
all small firms (3–199 Workers) 10% 36% 21% 32% 1%all large firms (200 or more Workers) 7% 29% 40% 23% 1%
All firms 10% 35% 22% 32% 1%
increase the Amount employees pay for prescription Drugs*
all small firms (3–199 Workers) 9% 32% 26% 29% 4%all large firms (200 or more Workers) 8% 29% 40% 22% 1%
All firms 9% 32% 26% 28% 4%
restrict employees’ eligibility for Coverage*all small firms (3–199 Workers) 1% 12% 16% 70% 1%all large firms (200 or more Workers) 2% 4% 26% 67% <1%
All firms 1% 12% 16% 69% 1%
Drop Coverage entirely*all small firms (3–199 Workers) 3% 3% 17% 77% <1%all large firms (200 or more Workers) <1% <1% 4% 96% <1%
All firms 3% 3% 16% 78% <1%
introduce Tiered Networks for office visits or hospital stays
all small firms (3–199 Workers) 2% 16% 37% 38% 7%all large firms (200 or more Workers) 2% 13% 35% 48% 2%
All firms 2% 16% 37% 39% 7%
offer hDhp/hrA‡
all small firms (3–199 Workers) 5% 21% 27% 45% 2%all large firms (200 or more Workers) 6% 20% 29% 44% 1%
All firms 5% 21% 27% 45% 1%
offer hsA-Qualified hDhp‡
all small firms (3–199 Workers) 4% 21% 24% 51% 1%all large firms (200 or more Workers) 5% 20% 29% 44% 1%
All firms 4% 21% 24% 50% 1%
* distributions are statistically different between all small firms and all large firms within category (p<.05).‡ among firms not currently offering this type of hdhP/so.
kaiser/hret survey of employer-sponsored health Benefits, 2008.
s o u r c e :

This publication (#7790) is available on the Kaiser Family Foundation’s website at www.kff.org. multiple copies may be obtained from hreT by calling 1-800-242-2626 (order #097519).
september 2008
-and-
The henry J. Kaiser Family Foundation
headquarters
2400 sand hill roadmenlo Park, ca 94025
Phone 650-854-9400 Fax 650-854-4800
Washington offices and
Barbara Jordan conference center
1330 G street, nW
Washington, dc 20005
Phone 202-347-5270 Fax 202-347-5274
www.kff.org
health research & educational Trust
1 north Franklin street chicago, il 60606
Phone 312-422-2600 Fax 312-422-4568
www.hret.org