Embed Size (px)
Citation preview

Quick Reference GuideEmployer Safety Planning Tool Kit

Employer Safety Planning Tool Kit –
Quick Reference Guide Effective Date:
June 2, 2014
2
Contents Introduction: Your Employer Safety Planning Tool Kit ......................................................................... 3
Experience Rating Forecaster ........................................................................................................... 6
Competitive Comparison ................................................................................................................. 8
Performance Scorecard ................................................................................................................. 10
Injury Claim Breakdown Map & Injury Prevention Forecaster ............................................................. 12
Return to Work ............................................................................................................................ 16
Additional Resources .................................................................................................................... 17
Need Help? .................................................................................................................................. 17

Employer Safety Planning Tool Kit –
Quick Reference Guide Effective Date:
June 2, 2014
3
Introduction: Your Employer Safety Planning Tool Kit
What is the Employer Safety Planning Tool Kit?
The Employer Safety Planning Tool Kit is a suite of interactive tools that enables Employers to learn about
the injuries and claims that impact their safety performance. It allows you to compare your performance
against your peers, and see how operational and workplace health and safety changes could impact your
company.
These tools tell a safety story for your organization. While each tool can be used independently, the story
is best told as part of the cycle shown here.
Which Employers should use the Safety Planning Tool Kit?
The Tool Kit benefits large employers who typically have 50 or more employees and who have experienced
~5 loss time claims a year over the last 5 years. For smaller employers with limited time loss claims data,
many of the tools will not contain enough data to make them useful for planning purposes.
Who can access your Data?
Your data is secure and is only available to personnel in your organization who are authorized to access
the secured online services on WorkSafeBC.com.

Employer Safety Planning Tool Kit –
Quick Reference Guide Effective Date:
June 2, 2014
4
How to access the Employer Safety Planning Tool Kit?
The Tool Kit is available from WorkSafeBC home page: http://www.worksafebc.com/
2. Enter your User Id &
Password, or if you
are a new user, sign
up for service.
1. Select the Log on/ Sign up link
3. Select the Employer Safety
Planning Tool Kit
4. If you do not see the Employer Safety Planning Tool Kit in your list
of applications, click the Update access link and fill out the online
request form. The Access Administrator for your company’s account
will receive your email and grant you access.

Employer Safety Planning Tool Kit –
Quick Reference Guide Effective Date:
June 2, 2014
5
What you’ll see – the Home Page
The home page lists all of applications contained in this interactive suite of tools.

Employer Safety Planning Tool Kit –
Quick Reference Guide Effective Date:
June 2, 2014
6
Experience Rating Forecaster
What’s your current experience rating? Is your rating improving or dropping?
What types of premiums will you experience if you continue at the current pace?
How can a change in your claim costs impact your future Experience Rating?
Interpret - Experience Rating Forecaster
View your experience rating for the past 5 years and your 3 year projected rating if you continue on the
same path.
General Functions
The following functions are available throughout the application.
Function: Purpose:
Saves the current chart to your own clipboard. You can integrate these images into
your own safety presentations for use in your organization.
Allows you to print the current charts.
Provides additional information for the tool you are currently using.

Employer Safety Planning Tool Kit –
Quick Reference Guide Effective Date:
June 2, 2014
7
Interact - Experience Rating Forecaster
Apply Filters: choose an increase or decrease in your claim costs and see the impact on your forecast
Review Details for Forecaster: allows for more detailed what-if scenarios
Premium Savings: estimated direct cost premiums savings over 3 years based on the selected
change in claims costs
Take Action - Experience Rating Forecaster
Review your Experience Rating Trend – are you comfortable with your current forecast? Reflect on how a change in claim costs can make a change in your direct costs – your WorkSafe
premiums Now that you understand how your experience rating trends, move on to the Competitive Comparison
tool so see how your performance compares to your peers.

Employer Safety Planning Tool Kit –
Quick Reference Guide Effective Date:
June 2, 2014
8
Competitive Comparison
At a glance - how do you compare to your peers?
What’s your experience rating compared to similar firms in your Classification Unit and
Rate Group?
Are your injury rates and claim durations above or below average?
Interpret: Competitive Comparison
The competitive comparison tool provides two ways to see how you compare with other firms in your Rate
group or Classification unit.
Experience Rating versus Assessable Payroll
The experience rating versus assessable payroll graph shows your position relative to your peers in the
same Rate Group. The 0% line on the x-axis represents the base rate for your group. Look at your graph.
Are you above or below the line?

Employer Safety Planning Tool Kit –
Quick Reference Guide Effective Date:
June 2, 2014
9
Injury Rate versus Claim Duration
Interact – Competitive Comparison
The purpose of both charts is to show how you compare to your peers at a glance.
Review the Experience Rating vs Assessable Payroll chart: how do you compare against other
employers of similar size?
Review the Injury Rate version Claim Duration chart: which quadrant are you in?
Take Action – Competitive Comparison
Are you comfortable with your performance when compared against your peers?
To understand more about how you rank against other key performance indicators when compared
against your industry averages, move on to the Performance Scorecard application.

Employer Safety Planning Tool Kit –
Quick Reference Guide Effective Date:
June 2, 2014
10
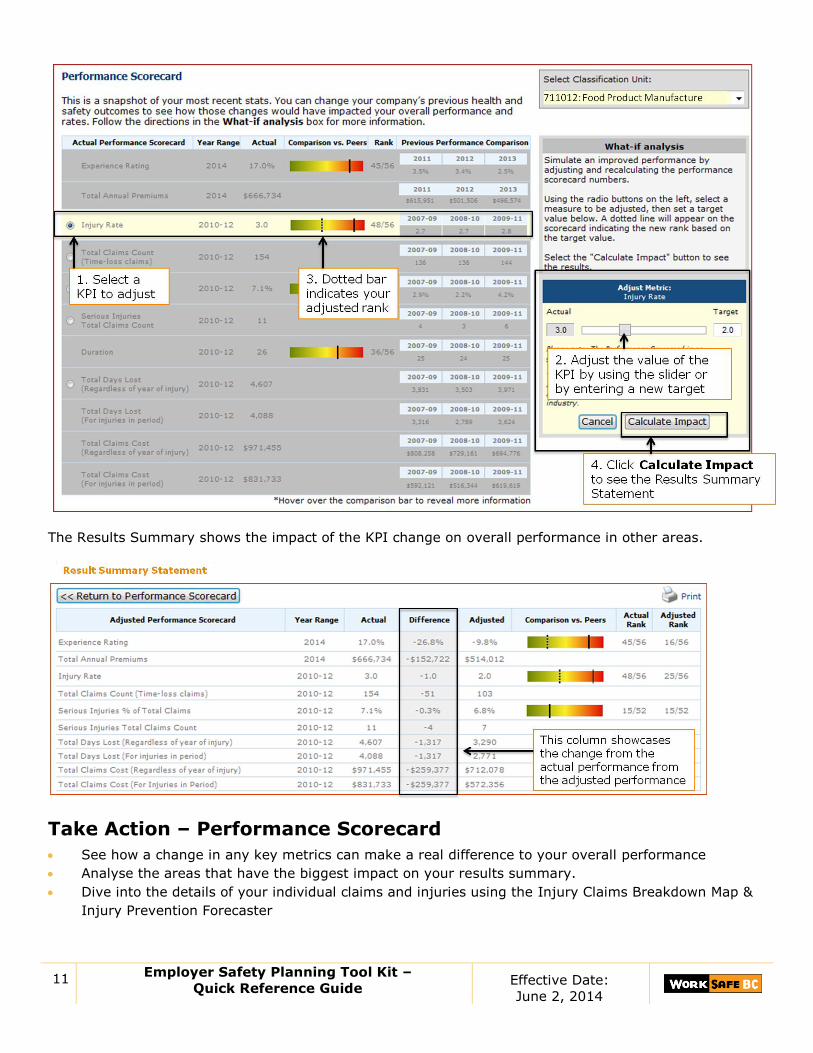
Performance Scorecard
How is your company performing across key health and safety indicators?
How does your company rank in comparison with your peers?
How can a change in the performance of one KPI impact your overall performance?
Interpret – Performance Scorecard Snapshot
The performance scorecard give you a snapshot of your company’s performance across selected health
and safety Key Performance Indicators (KPIs). Use the radio buttons on the left to see how changing the
value of a specific KPI can impact your overall performance.
Interact – Performance Scorecard
To see how a change in one KPI can impact your overall performance:
Reduce your injury rate by half and see the impact that change has on your overall performance.
Run similar simulations by adjusting the other 4 interactive KPIs.
Save or print your results to share with others in your organization.
Employer Safety Planning Tool Kit –
Quick Reference Guide Effective Date:
June 2, 2014
11
The Results Summary shows the impact of the KPI change on overall performance in other areas.
Take Action – Performance Scorecard
See how a change in any key metrics can make a real difference to your overall performance
Analyse the areas that have the biggest impact on your results summary.
Dive into the details of your individual claims and injuries using the Injury Claims Breakdown Map &
Injury Prevention Forecaster

Employer Safety Planning Tool Kit –
Quick Reference Guide Effective Date:
June 2, 2014
12
Injury Claim Breakdown Map & Injury Prevention
Forecaster
Which injuries occur most often?
What injuries cost you the most?
Where should you focus your safety improvement efforts?
Are there quick wins for your organization to reduce injuries?
Interpret – Injury Claim Map & Injury Prevention Forecaster
The Injury Claim Map & Injury Prevention Forecaster are powerful tools for understanding injury frequency
and claim costs in your organization.
There are 2 maps that help you view claim counts and costs by 5 different categories - Nature of Injury,
Accident Type, Body Part, Source of Injury or Occupation.
The first map provides a count of claims in your organization. The second map provides the cost of those
claims to your organization.
The table below the two maps, shows the actual % values for the claim counts and costs.
To correctly interpret the information in the maps and the chart, you need to view them together. Are the
claims that are occurring most often, also costing your organization the most? Are there injury types that
can be addressed or eliminated with simple safety improvement changes?
View the screenshots on the next page, to understand how to interpret these maps.

Employer Safety Planning Tool Kit –
Quick Reference Guide Effective Date:
June 2, 2014
13
Click on any shaded area, in either map, to access a list of detailed claim information for each area.

Employer Safety Planning Tool Kit –
Quick Reference Guide Effective Date:
June 2, 2014
14
Interact - Injury Claim Map & Injury Prevention Forecaster
The Injury Prevention Forecaster can help you understand your specific incidents and direct you to
additional information within your own organization to help design prevention programs.
Enter a desired reduction in % of injuries and click the “Calculate Experience Rating Projections”
button to estimate the impact that prevented injuries would have

Employer Safety Planning Tool Kit –
Quick Reference Guide Effective Date:
June 2, 2014
15
Take Action - Injury Claim Map & Injury Prevention Forecaster
Identify which injuries occur the most and by which occupation type
Identify which injuries account for the most cost
A higher claim count does not correlate to higher claim cost
Determine how a reduction in a specific injury can impact your experience rating
Develop prevention/awareness strategy to help decrease specific injuries
When an employee is injured, view the Return-to-Work table to see how successful you have been at
returning injured employees to work

Employer Safety Planning Tool Kit –
Quick Reference Guide Effective Date:
June 2, 2014
16
Return to Work
How successful have you been at returning injured employees to work?
How effective and timely is your modified work program?
Do you have a modified duty inventory to help you accommodate workers with various
types of injuries?
Interpret - Return to Work Outcome Success
Compare your company’s return-to-work performance with other companies in your industry.
Interact – Return to Work Outcome Success
Filter the charts to compare yourself by your CU or Rate Group
Take Action – Return to Work Outcome Success
Safe and timely return to work is the best possible outcome for your injured workers.
How effective and timely is your modified work program?
Compare your return to work average with your CU or Rate Group.
Filter the information
by peer group and/or
by category

Employer Safety Planning Tool Kit –
Quick Reference Guide Effective Date:
June 2, 2014
17
Additional Resources Tool: Purpose:
Employer
Reports
Printable Reports which display your organization’s injury data and
compare your health and safety performance to your industry’s
performance on reports you can print.
Claim Cost
Analyzer
View your organization’s claims costs and trends over time.
Accident Cost
Calculator
Calculate and analyze the true cost of accidents at your organization.
This calculation includes all the indirect costs that represent the true
costs of a single accident.
WorkSafeBC Premium savings represent your direct cost savings related
to preventing workplace injuries. As a rule of thumb the indirect costs for
any incident is actually three or more times the direct costs.
Industry Safety
Information
Centre
View health and safety KPIs and trends for any B.C. industry or
WorkSafeBC classification unit.
Definitions &
Help
Definitions of the terms used throughout these interactive WorkSafeBC
planning tools, and links to a quick reference guide and video
tutorial.
Need Help?
Use the Feedback button on the homepage to send a comment or question to a WorkSafeBC
representative.
Definitions of the terms used throughout these interactive WorkSafeBC planning tools, and
links to this quick reference guide and video tutorial.