Embed Size (px)
Citation preview
AUTEX Research Journal, Vol. 10, No2, June 2010 © AUTEX
http://www.autexrj.org/No2-2010/ 39
EMPLOYING VISUALISATION TECHNIQUES AND TOOLS FOR EDUCATIONALPURPOSES IN TEXTILE STUDIES
Zoran Stjepanovic, Darinka Fakin
University of Maribor, Faculty of Mechanical Engineering
Department of Textile Materials and Design, SI-2000 Maribor, [email protected]
Abstract:
Modern textile and clothing manufacturers can today use the entire range of conventional CAD/CAM systems
together with new computer graphics and Internet-based technologies in order to strengthen their position on
the market, building a completely new electronic-business offer. Graphical presentation of textile products and
processing, or visualisation, presents a promising technology that can be treated as a potential enrichment of
conventional computer aided technologies used today by the majority of advanced producers of textile fabrics,
clothing, and other textile products. The article presents the results of research on designing computer software
for visualising the fabric dyeing process. The program package produced enables the effective visualisation of
two fabric dyeing processes: a Pad-Batch machine line for dyeing flat textiles in open-width state, and an HT
overflow dyeing machine for fabric dyeing in rope form. Graphical applications of both dyeing processes can be
used for both industrial and educational purposes. In this article, we focus more on presenting the program
structure and functionalities for using the software to support the education of textile students.
Key words:
Textile fabrics, dyeing process, visualisation, textile engineering, education.
Introduction
In the last twenty years, computer graphics have been
successfully used to support design and construction tasks inmany textile applications. Above all, the design and construction
of woven and knitted fabrics and apparel products have been
supported by the use of specially designed computer based
information systems. Visualisation of textile processes hasnot received so much attention. One of the reasons for this is
that visualisation of the process is not as interesting and
attractive for textile producers and buyers as the textile productitself. On the other hand, such a visualisation is of great
importance for educational purposesbecause of its potential to effectively and
clearly show the students the technologyand processes used in the production oftextiles.
Recent Developments in
Visualisation of Textile
Products and Processes
Visualisation of Textile Fabrics and
Garments
The microscopic appearance of textileproducts - fabrics and garments - has
not received much attention until recently.
Research into computer graphicssuitable for textiles has focused mainly
on the modelling and rendering of themacroscopic structure of woven textiles.
In addition, knitted textiles have been
successfully modelled and effectivelypresented graphically only a few years
ago because of their very complexphysical behaviours. The textile industry
on the other hand would clearly benefit from the ability tovisualise the whole diversity of textiles: not only the
macroscopic mechanical behaviour of all types of garments,
but also realistic microscopic visual properties. Specificproblems appearing when visualising the knitted materials
are much more complex than for woven materials, and
therefore we can conclude that the knitted fabric model is a
more general model of flat textile structures.Different approaches to dealing with the fabric drape model
have been made [1-3]. When simulating the draping of textiles,
one has to deal with subtle, but important, differences betweenknitted and woven fabrics regarding the arising force functions.
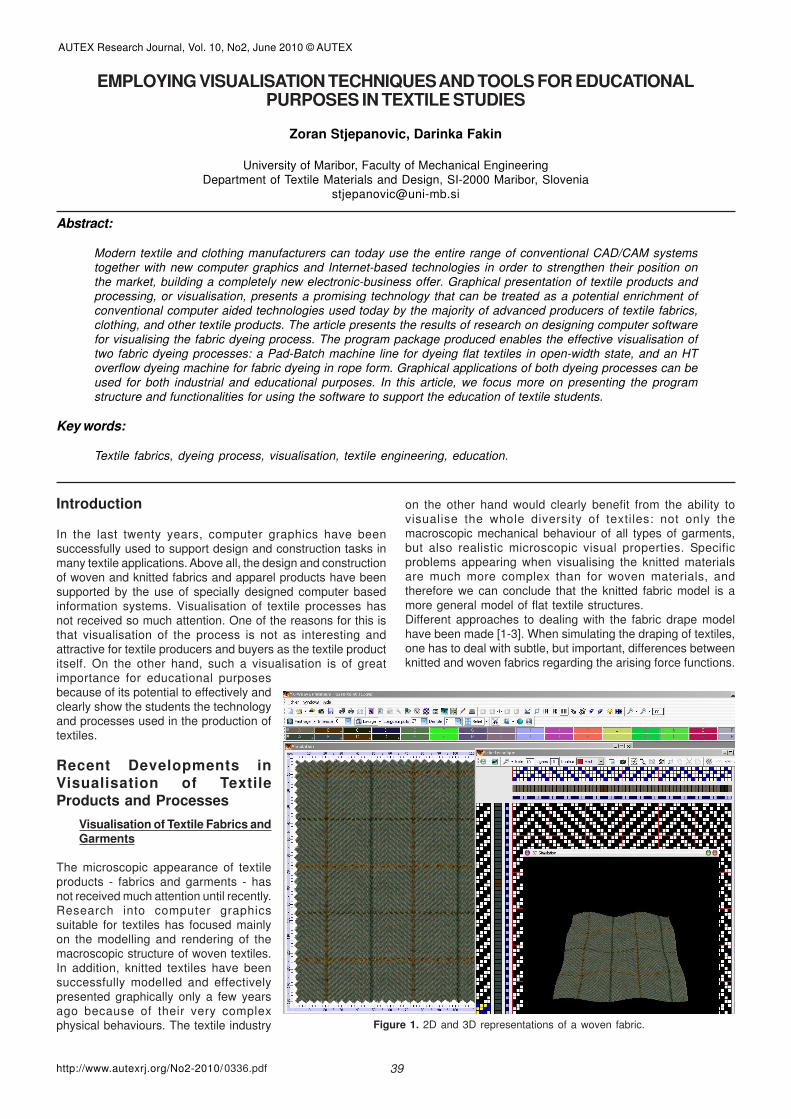
Figure 1. 2D and 3D representations of a woven fabric.
0336.pdf

AUTEX Research Journal, Vol. 10, No2, June 2010 © AUTEX
http://www.autexrj.org/No2-2010/ 40
To describe the draping of the flat textile structures, such as
woven or knitted fabrics, the particle system approach oranother suitable model is usually adapted [2,4]. Figure 1 shows2D and 3D representations of a woven fabric [5]. A 3D
representation of a shaped knitted fabric is shown in Figure 2[6].
producers have developed dedicated software packages.
Numerous apparel CAD systems have made-to-measure orpattern alteration functions which can be used in concert withthe scanner based measurements to create a custom pattern
for the customer. The measurements are formatted specificallyfor the target apparel CAD package so that the input of the datato the system and the output of the made-to-measure pattern,
either to a fabric cutter or to a plotter, occur automatically.Additionally, the possibility exists for the customer to view thefit and appearance of both made-to-measure and standard-
sized garments as a computer simulation (a virtual try-on).The garment is draped on the customer’s 3D scan image,and he or she can see how the garment looks and fits before
the purchase is made [7]. In Figure 3 the visualisation of pre-positioned and sewn garments can be seen [8].
Graphical Representation of Textile Processes
Graphical representation of textile processes includes thevisualisation and animation of different production processesfor manufacturing linear and flat textile structures as well as
garments and other 3D textile forms. Until recently, graphicalrepresentation of textile processes did not receive as muchattention as visualisation and virtualisation of textile products.
One of the reasons for this is that visualisation of the processis not as interesting and attractive for textile producers and
buyers as the textile product itself. On the other hand, such a
visualisation is of great importance for controlling andmaintaining the process, as well as for educational purposes,
because of its potential to effectively and clearly show students
the technology and processes within the textile manufacturing
chain.
Visualisation and animation techniques have greater potential
for clearly representing different processes that have acontinuous or semi-continuous nature. Figure 4 shows the
visualisation of a sliver conveying system [9]. One frame from
the animation of a precision mote knife setting system [10] is
presented in Figure 5.
Figure 2. 3D representation of a shaped knitted fabric.
In order to perform a draping simulation, the textile structure is
represented by mesh-elements, rectangular sections ofgarment. Mass points (or particles) are then set at the corners
of the mesh-elements defining the couplings between the
mass points. This organisation gives a fairly standard system
of coupled particles and may be treated as in any otherphysically based modelling system.
In order to enable and support the whole range of e-businessactivities, universities, research institutions, and software
Figure 3. Visualisation of pre-positioned and sewn garments.
Figure 4. Visualisation of sliver conveying.
0336.pdf

AUTEX Research Journal, Vol. 10, No2, June 2010 © AUTEX
http://www.autexrj.org/No2-2010/ 41
Figure 5. Animation of a precision mote knife setting system.
Results and Discussion
When planning the research, two configurations of fabric dyeing
machinery were selected for visualisation: an HT overflowdyeing machine for fabric dyeing in rope form, and a semi-continuous Pad-Batch machine line for dyeing of flat textiles in
open-width state. The research team involved textile specialistsas well as specialists from the area of computer programming
and computer graphics. Object oriented Microsoft Visual C++programming language was used for development of the
software running on personal computers using the Microsoft
Windows XP operating system.
Visualising the HT overflow dyeing process
HT overflow is a piece goods dyeing process suitable formedium-weight and heavy woven and knitted fabrics, especially
those made of natural fibres and blends with delicate surfaces
[11]. The finished surfaces of fabrics and their handle meethigh quality requirements. Because of the closed machine
construction it is not easy for students to form a picture of the
dyeing process and to understand it. For this reason wedesigned and programmed the graphical application forvisualisation and animation of the HT overflow dyeing process,
a practical example of which follows this text [12]. Figure 6shows a diagram of the exhaustion dyeing process applied topure cotton fabric having a surface mass of 200 g/m using
Bezaktiv Rot HE-3B dyestuff and suitable chemicals and textileauxiliary agents. A screenshot from the program for visualisationof the HT overflow dyeing machine is shown in Figure 7.
Visualisation and Animation of the Pad-Batch Machine LineThe Pad-Batch dyeing process is one of the commonly used
dyeing processes for open-width dyeing of textile fabrics thatenables, among others [13]: flexible dyeing of short lots, quick
changes of lot by means of a quick cleaning system,minimisation of residual liquor due to optimum trough designs,maximal dye yield, even colouration, reasonable prices, safety,
reproducibility, integrated control of all process parameterssuch as temperature, fabric tension, moisture profile, andwinding tension, optional connection of a process pilot system,
and tailing correction.
As a result of our R&D work we designed and developed a
computer graphics program for visualisation and animation ofvital/active/moving machine elements, with the flow of the fabric
through the fabric dyeing process shown. The graphic interface
enables intuitive and simple use of program functions.
Potential applications of the developed program are:
- to enable the visualisation of the active dyeing machine
elements,- to enable students of textile technology and young
professionals (without production experience) to get
acquainted with the textile dyeing machinery and technologicalprocesses,
- to enable textile specialists dealing with the planning of
technological plants to choose between different possibilities
for optimal location of the machine lines.
As a higher education institution offering
textile education programs, we wereabove all concentrating on potentialrelated to the use of the program for
pedagogical purposes, although there
exist other possibilities for application ofthe program.
Program Functionalities
The main menus in the Pad-Batchmachine line application are: Program,
Animation, Library, View, and Help.Submenu functions can be selected from
the charts containing selection/input
fields, which enables simple, effective,and surveyable use of the program. We
can easily set different processparameters, such as processing times,
length, surface mass and thickness of
the fabric, squeezing effect, andprocessing velocities. Different sound
effects and colours can be used in orderto enhance the clear representation of
the dyeing process. Also the reset
function is programmed so that it can beused to set the original (default) values.
Figure 6. Diagram of exhaustion dyeing process.
Figure 7: Screenshot from the program for visualisation of HT overflow dyeing machine.
0336.pdf
AUTEX Research Journal, Vol. 10, No2, June 2010 © AUTEX
http://www.autexrj.org/No2-2010/ 42
Figures 8-11 show some of the available Pad-Batch machine
line elements that can be reached from the Library menu.
Practical Examples for Visualisation of a Fabric Dyeing
Process
An illustrative example for visualisation and animation of the
Pad-Batch semi-continuous line for open-width fabric dyeingis shown in Figure 12. The three parts of the semi-continuousline - impregnation, fixation, and washing/rinsing areas - can
be clearly seen. For this purpose we prepared an example ofdyeing a pure cotton fabric having a surface mass of 200 g/m.In the upper part of the screen, information on the material
(fabric), such as fabric thickness, surface mass, width, andlength, is given, as well as the type and commercial name ofthe applied dye. Important processing parameters can be
chosen, inputted into the program, and shown together withthe recipe in the upper part of the window (Figure 12).
Future Work and Expectations
The software package designed and produced offers manypossibilities for improvement and enhancement of programfunctionalities. In order to make the visualisation and animation
of the dyeing process even more clear and understandable,we plan to include 3D representation of the vital machines/production line parts. For this purpose, the main elements
and mechanisms, particularly within the Pad-Batch machineline, will be modelled and their activity will be animated. Also,
the possibility of including some already existing graphical
representations and animations from acknowledged machine
producers, such as Kuesters [13], exists. An example of the3D detail - a representation of the impregnation part within the
Pad-Batch machine line - is shown in Figure 13. We expect
that the planned enhancement will bring the program packagea new value and will therefore raise its application value.
Conclusions
Universities, research institutions, and software producers
nowadays apply new computer graphics technologies in order
to create advanced computer solutions that will in the future
support the whole cycle starting from the virtual design of fabricand garments through automated production up to virtual
merchandising.
Graphical presentation of textile products and processing, or
visualisation, presents a promising technology that can be
treated as a potential enrichment of conventional computeraided technologies used today by the majority of advancedproducers of textile fabrics, clothing, and other textile products.
The results of R&D work on designing computer software for
visualising the fabric dyeing process were presented in thisarticle. The developed program package enables an effectivevisualisation of two fabric dyeing processes: a Pad-Batch
machine line for dyeing flat textiles in an open-width state and
an HT overflow dyeing machine for fabric dyeing in rope form.
Although graphical applications of both dyeing processes canalso be used for industrial purposes, in this article we focused
more on presenting the program structure and functionalitiesfor using the software for educational purposes. The program
package and its structure and functionalities were presented
to both professionals and university-level students. Theirreaction was that the program offers an enhanced insight into
the dyeing machinery possibilities to enable them to betterunderstand the parameters of the dyeing process.
These kinds of computer based technologies and programs
are in permanent development to improve the application
value. They can be evaluated as very useful for educational
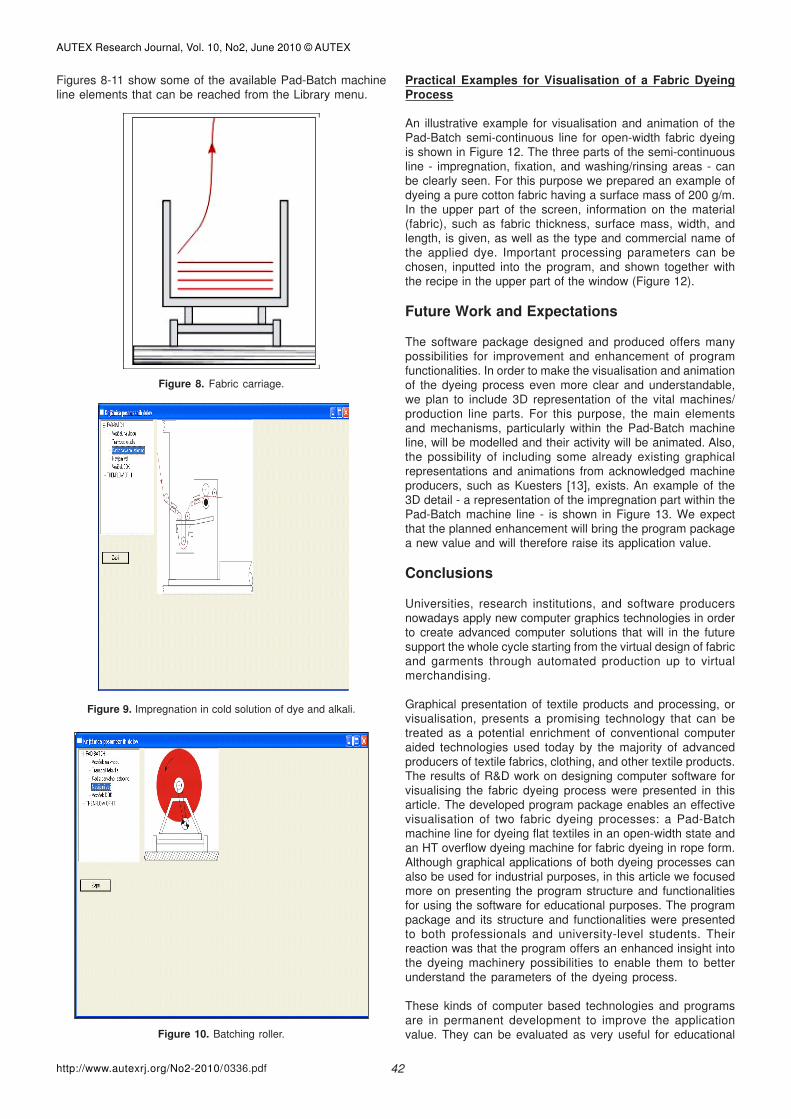
Figure 8. Fabric carriage.
Figure 9. Impregnation in cold solution of dye and alkali.
Figure 10. Batching roller.
0336.pdf

AUTEX Research Journal, Vol. 10, No2, June 2010 © AUTEX
http://www.autexrj.org/No2-2010/ 43
purposes in universities and higher education institutions
offering modern textile studies. With this article we also wantedto present the need to create multidisciplinary teams and to
connect the knowledge from different scientific fields when
realising a research work of this kind.
Material: 100 % cotton Fabric thickness: 0.9 mm Fabric mass:200 g/length meter Fabric width: 152 cm Fabric length: 2000 m Dye type; commercial name:
Reactive; Bezaktiv Rot S-GT 150 Squeezing effect: 80 % Fixation time: 24 h Washing time: 20 mins
Recipe: Dyeing solution: 30 g/L Bezaktiv Rot S-GT 150
50 – 100 g/L urea 3 – 5 g/L Subitol RNC
Alkali solution: 50 mL/L waterglass (w=32%) 22 mL/L natriumhydroxyd (w=32%) Blend ratio: 4 part - Dyeing solution 1 part - Alkali solution Padding temperature: 25°C
Fabric length: 2.000 m Fabric mass: 200 g/m Fabric thickness: 0,9 mm Fabric width: 152 cm
Measure: 1:75
Figure 13. Functionality for introducing 3D details within the Pad-Batch machine line.
Figure 12. Screenshot of a program sequence of Pad-Batch machine line visualisation.
Figure 11. Washing machinery.
References:
1. C.K. Au, M.M.F. Yuen, Feature-based
reverse engineering of mannequin
for garment design, Computer-Aided
Design Vol. 31 (1999), pp. 751-759.
2. D.E. Breen, D.H. House, M.J. Wozny,
“Predicting the drape of woven cloth
using interacting particles”, Proc.
SIGGRAPH ’94, Orlando: Computer
Graphics Annual Conf. Series, ACM
Press (1994), pp. 365-372.
3. B. Eberhardt, A. Weber, W. Strasser,
A fast, flexible, particle-system model
for cloth draping, IEEE Computer
Graphics and Applications, Vol. 16,
No. 5 (1996).
4. D.E. Breen, D.H. House, M.J. Wozny,
“A particle-based model for
simulating the draping behaviour of
woven cloth”, Technical Report
ECRC-94-19, European Computer-
Industry Research Centre, München
(1994).
5. Yxendis, Dobby Weaving Software.
Available from: http://
www.yxendis.com/ [5. 02. 2006].
6. Yxendis, XY Knit Platinium. Available
from: http://www.yxendis.com/ [5. 02.
2006].
7. S. Cray, Virtual reality in virtual
fashion, IEEE Spectrum Magazine
Online. Available from: http://
www.spectrum.ieee.org/select/0298/
vr.html [5. 02. 2006].
8. A. Fuhrmann, V. Luckas, C. Gross,
“Improving the clothing design
process: fast 3D visualisation of
garments”, Proc. 4th Int. Conf.
Innovation and Modelling of Clothing
Engineering Processes IMCEP 2003,
Maribor, Slovenia (2003), pp. 69-77.
9. Truetzschler. Fibre and sliver
technology. CD-ROM, Truetzschler,
Moenchenglagbach (2003).
10. Truetzschler. Product range, Sliver
Formation. Available from: http://
www.truetzschler.de/ [4. 03. 2009].
11. Then. Products/piece dyeing.
Available from: http://www.then.de/
[16. 11. 2008].
12. Z. Stjepanovic, D. Fakin, P. Puncer,
Visualization of a fabric dyeing process
for educational purposes. Proc. 5th World
Textile Conference AUTEX 2005, 27-29 June 2005,
Portoro•, Slovenia. Maribor: Faculty of Mechanical
Engineering, Department of Textiles (2005), pp. 1123-1129.
13. Kuesters. CPB Dyeing. Available from: http://
www.kuesters.com/ [20. 03. 2009].
∇∆∇∆∇∆∇∆∇∆
0336.pdf