Embed Size (px)
Citation preview

Technical Report II A SURVEY OF THE EMPLOYMENT AND LEARNING
PATHWAYS OF LEARNERSHIP PARTICIPANTS
INTRODUCTION
This report presents an analysis of data from an HSRC survey conducted on behalf of the
Department of Labour (DoL) to investigate the employment and learning pathways of
learnership participants enrolled in the first financial year of NSDS Phase II.
The report consists of eight sections. The first section explains the methodological basis of
the survey. It does so by presenting the methodological assumptions, the sampling frame
extracted from the NSDS Phase II contact database, the methodological challenges faced by
the study and the weighting of the sample to ensure generalisability to the population of
learnership participants enrolled in the first financial year of NSDS Phase II.
Sections 2 and 3 describe the population of NSDS Phase II learners, and the demographic
profiles of learnership participants surveyed.
Section 4 presents the status of the learners included in the survey in terms of three
categories:
1. Learners who have completed their learnership study
2. Learners who terminated their learnership study before completing all programme
requirements
3. Learners who are currently registered and still in the process of undertaking the
learnership.
This section provides the backdrop to the remaining sections, which focus on particular
groups of learners and the ‘pathways’ they take through, and out of, the learnership system.
Section 5 focuses on the expectations of learners who are still currently registered and
undertaking a learnership, as well as the reasons why learners who have already completed
or terminated their programmes enrolled for learnerships.
Section 6 describes the extent of migration from one province to another to pursue a
learnership programme, highlighting trends in terms of geographical location, sectors and
qualification levels.
Section 7 examines the issue of progression between qualification levels, and focuses on the
extent to which learnerships are enabling vertical movement and articulation within the
NQF.
Section 8 focuses on the key issue of labour market outcomes. It decribes the extent and ways
in which learnerships are equipping the employed to advance through the formal labour
market with enhanced skills and capacities, or equipping the young unemployed to find jobs
or to proceed to self-employment or to advance to further learning.
Employment and Learning Pathways of Learnership Participants in the NSDS Phase II
56
In conclusion, the study illustrates that when assessing the impact and effectiveness of the
learnership system, it is valuable to take multiple priorities and roles into account. Distinct
learnership pathways are determined by the needs of individuals, interlinked with the
labour market demands of employers in specific sectors, skills levels and regions. After
seven years, the learnership system is positive for some learners participating, but not all.
1 METHODOLOGY
1.1 The research process
A telephonic survey of approximately 15 minutes was conducted with a sample of
learnership participants, those who enrolled in the first year of the NSDS Phase II, in the
financial year of 1 April 2005 to 31 March 2006.
The survey aimed to trace diverse learning and employment pathways, by exploring the
labour market outcomes of participants and the degree to which there has been any
progression in employment or education status. That is, the focus of the study was on
determining the external efficiency of learnership, rather than a focus on the internal
efficiency in terms of issues such as the quality of education and training. This focus
determined the selection of all learners enrolled in the first financial year of NSDS Phase II as
a sampling frame. The aim was to increase the possibility of sufficient returns from
learnership participants who had completed or terminated their study.
The survey aimed to determine the demographic profile of each participant; their learning
and employment status prior to and post the learnership; their motivation for enrolling and
the current status of learnership participation. For example, if an 18.1 participant (a person
who was employed prior to commencing the learnership) completed the learnership, the
survey investigated whether there had been any progression in their employment status. Or,
if an 18.2 participant (a person who was unemployed prior to commencing the learnership)
completed the learnership, the survey determined whether or not they had been successful
in accessing a job, and if so, in what ways, and if not, why not. A copy of the survey
instrument is in the Appendix at the back of this publication.
1.2 The sample
The contact database (described in Technical Report I) provided the basis for the sampling
frame. Table 1 provides key data to describe the sampling frame and the eventual returns.
The sampling frame included all learnership participants with contact details who enrolled
within the first financial year of NSDS Phase II (1 April 2005 to 31 March 2006).
The number of learners that registered for a learnership during this period was 54 617. A
high 92% of these learners had contact details as provided by the SETA. Contact details
considered valid for the study could be a home telephone number, a cell number, the
telephone number of the training provider or a work phone number.
The initial sampling frame included 47 482 learnership registrations. Since the number of
learners with telephone contact details registered through AgriSETA was very low (445 out
of 3 307 registrations) it was agreed with AgriSETA that a random sample of all 3 307
registered learners would be selected and supplied to AgriSETA and that they would add
contact details for the random sample. Therefore, the final sampling frame included a total of
50 344 learnership registrations.

TECHNICAL REPORT II: A Survey of the Employment and Learning Pathways of Learnership Participants
57
Further investigation into the sampling frame showed that less than 1% (0.14% or 79
registrations) of the 54 617 learnership registrations accounts for learners who registered for
more than one learnership within this time period. It could have happened that the same
person undertook more than one learnership programme, either due to the learner
terminating or completing one learnership and proceeding into a totally different
learnership or due to progression to higher NQF levels within the same field (discussion on
progression and learning pathways is presented later in the report).
The contact database contained telephone contact details of more than 90% of all SETA’s
learners, except for THETA (3%) and LGSETA (69%). Of concern was the validity of the
contact details provided by the SETAs. The pilot and pre-pilot showed that many of the
contact details proved to be outdated and no longer valid. In fact, during the pilot and pre-
pilot an average of one out of four contact details were found to be no longer valid. To
increase the validity of contact details, training providers were contacted and asked to
supply contact details that they had to the study. This resulted in a slight increase in the
validity of contact numbers but still did not fully address the problem. The limited contact
details provided by THETA, for example, resulted in its being excluded from the study, as
the eventual number of returns it was possible to obtain was too limited.
Thus, Table 1 provides an overview of the final sampling frame, based on processes
described in Technical Report I, aimed to ensure a valid response rate. It shows that a total of
50 344 enrolments were included in the final sampling frame.
Table 1: Sampling frame.
Number of learnerships registered within the first financial year of NSDS Phase II
SETA Total number registered
Number with telephone contact details (Initial
sampling frame)
Final sampling frame
(Number)
Final sampling frame
(Percentage)
Survey returns Percentage returns
AgriSETA 3 307 445 3 307 100% 109 3.3%
BankSETA 1 640 1 553 1 553 95% 291 18.7%
CETA 6 181 6 181 6 181 100% 834 13.5%
CHIETA 1 800 1 800 1 800 100% 259 14.4%
CTFL SETA 859 859 859 100% 132 15.4%
ESETA 1 862 1 862 1 862 100% 314 16.9%
ETDP SETA 589 586 586 99% 98 16.7%
FASSET 4 030 4 028 4 028 100% 585 14.5%
FIETA 350 350 350 100% 115 32.9%
FoodBev 1 884 1 884 1 884 100% 43 2.3%
HWSETA 4 503 4 164 4 164 92% 646 15.5%
INSETA 755 752 752 100% 236 31.4%
ISETT SETA 1 915 1 805 1 805 94% 2 0.1%
LGSETA 2 465 1 693 1 693 69% 360 21.3%
MAPPP-SETA 113 110 110 97% 17 15.5%
MerSETA 5 294 5 261 5 261 99% 781 14.8%
MQA 2 667 2 667 2 667 100% 331 12.4%
SASETA 6 275 6 275 6 275 100% 839 13.4%
SERVICES 2 598 2 571 2 571 99% 431 16.8%
TETA 1 057 967 967 91% 151 15.6%
THETA 2 795 87 87 3% 2 2.3%
W&RSETA 1 678 1 582 1 582 94% 243 15.4%
Total 54 617 47 482 50 344 92% 6 819 13.5%

Employment and Learning Pathways of Learnership Participants in the NSDS Phase II
58
1.3 Number in sample (n)
The aim was to use this sample frame to obtain 8 000 responses, proportionately spread
across the 22 SETAs according to the size of each SETA. PSETA provided no information on
their learners registered in the NSDS Phase II and was the only SETA excluded from the
sampling frame.
Each data record within each SETA database was allocated a random number. Each data set
was then sorted in ascending order according to the random number. The call centre
operators proceeded by telephoning the learners from the top to the bottom of the list for
each SETA separately.
Using this method, a total number of 6 819 valid surveys were returned (Table 1). This
represents a total return rate of 13.5%.
The number of calls made to obtain a successful contact and conduct an interview (a
‘successful hit’) differed markedly across the SETAs. The ‘hit rate’ can be used as an
indication of the accuracy of the telephone contact details of the SETA. MerSETA and ISETT
SETA had the highest ‘hit rate’ with one successful contact for every 6 calls made, while the
operators succeeded in a successful contact for every call made to learners registered with
SETAs such as CHIETA, ETDP and FASSET.
Table 2: Call and contact rate.
SETA ‘Hit' rate = number of calls made for
one successful return
AgriSETA 5
BankSETA 3
CETA 4
CHIETA 1
CTFL 3
ESETA 3
ETDP 1
FASSET 1
FIETA 1
FoodBev 5
HWSETA 3
INSETA 2
ISETT 6
LGSETA 3
MAPPP 3
MerSETA 6
MQA 4
SASETA 1
SERVICES 3
TETA 1
W&RSETA 5
As Table 2 illustrates, the return rate thus differed markedly across SETAs. AgriSETA and
FoodBev had a low return rate of 3.3% and 2.3% respectively, while FIETA and INSETA had
a high return rate of 32.9% and 31.4% respectively. Extremely low returns meant that it was
not possible to include two SETAs in the analysis, ISETT SETA and Theta. In total, three
SETAs were excluded from the analysis, which includes 20 SETAs.

TECHNICAL REPORT II: A Survey of the Employment and Learning Pathways of Learnership Participants
59
1.4 Weighting the sample
The database of returns consisted of a sample of learners. Hence, statistical weights were
calculated for each sample cell to adjust the number of responses in a particular cell to the
original number of learnership participants in the sample frame or population, that is, those
enrolled in the first financial year of NSDS Phase II.
The calculation of weights for each cell used the following formula:
∑
∑
−
−−
=niCell
niCell
niCell n
NWeight
The key factors taken into consideration in weighting were therefore SETA, race, gender and
NQF level.
The weighted data provided a weighted estimate of 47 034 responses distributed across the
twenty SETAs included in the study.
Analysis of race by SETA shows, with the exception of SASETA and FoodBev, no significant
difference between the population and the weighted survey returns. Significant non
response by coloured, Indian and white learners enrolled for programmes through FoodBev
and non response by white learners enrolled through SASETA resulted in the weighted
returns excluding learners in these race groups as weighting cannot correct for non response.

Employment and Learning Pathways of Learnership Participants in the NSDS Phase II
60
2 PATTERNS OF ENROLMENT
2.1 Enrolment by SETA
The contact database records a total of 48 452 learnership participants enrolled for
learnership programmes during the first financial year of NSDS Phase II (1 April 2005 to 31
March 2006) across the twenty SETAs that form the sampling frame for this study.1
For the analyses that follow, the weighted value of a total of 47 034 learners will be used.
The mean enrolment by SETA is 2 352, with MAPP having the lowest enrolments of 82
learners and CETA the highest of 6 145. More than a third (39%) of the total learnership
enrolments are found in three SETAs: CETA with a total of 6 145 (14%) enrolments, SASETA
with a total of 6 117 (14%) and MerSETA with 5 234 (12%) (Figure 1).
0 1,000 2,000 3,000 4,000 5,000 6,000 7,000
M APPP
FIETA
ETDP SETA
INSETA
TETA
CTFL SETA
BANKSETA
FOODBEV
W&RSETA
LGSETA
CHIETA
ESETA
SERVICES
M QA
AGRISETA
FASSET
HWSETA
M ERSETA
SASETA
CETA
SE
TA
s
Number of learnership participants
Figure 1: Total learnership enrolments by SETA.
The strong growth in construction, driven by increased infrastructural spending by
government on prioritiess such as road and housing developments, may explain the high
enrolments of learners at CETA. Employment in the construction sector has increased
dramatically and future employees require training in order to offer their services to the
industry. However, section 4.2 of this report shows that a high number of learners who
participate in training through CETA terminate their learnership training before completion.
The rapid growth of the private security industry in South Africa over the past decade may
explain the high enrolments of learners at SASETA. Although growth in an industry may not
1 This total is derived by deducting the ISETT SETA and THETA enrolments from the final sampling frame total of
50 344.

TECHNICAL REPORT II: A Survey of the Employment and Learning Pathways of Learnership Participants
61
always be linked to growth in employment, Macfarlane (1994) indicated that it is an
unfortunate fact that security is a growth industry because crime is on the rise. According to
him, employees are needed to fulfill the duties to combat crime and the industry has to
provide training opportunities to meet the demand for new employment. It does so by
providing training opportunities, employment and a career-path for many initially unskilled
people.
The manufacturing sector experienced a rapid decline in employment levels (especially at
the low-skills level) from 1990 (Wakeford 2004), but the slightly upward trend in
employment since March 2003 may have influenced the comparable high enrolments for
training in the sector through the MerSETA (MerSETA 2006).
2.2 Enrolment by province
Learnership provision across provinces indicates the extent to which learners from different
provinces and different socio-economic contexts are able to access learnerships, the extent to
which employers are signing learnership contracts, the distribution of service providers for
particular learnership programmes, and the activity in certain sectors of the economy.
Respondents were asked to indicate the province from which they originate and the
province in which they undertook their learnership. Figure 2 shows an unequal provision
across provinces, with more than half of the total 47 034 learners enrolled in two provinces:
Gauteng with 16 825 (37%) enrolments and Kwazulu Natal with 7 126 (16%) enrolments. In
fact, Gauteng accounts for almost the same number of enrolments as the total enrolments in
Northern Cape (1 201), North West (2 028), Mpumalanga (2 522), Free State (3 378), Limpopo
(2 873) and Eastern Cape (4 282) put together.
North West4%
Northern Cape3%
Kw aZulu-Natal16%
Gauteng37%
Mpumalanga6%
Limpopo6%
Western Cape12%
Eastern Cape9%
Free State7%
Figure 2: Total learnership enrolments by province.
The provincial location of learnership enrolment provided in Table A1 in the Annexure
shows that the provision of learnerships by SETA is unequally distributed across the
provinces. Almost all (95%) learnership enrolments at FoodBev, for example, are in Gauteng.
More than 60% of enrolments at INSETA and SERVICES SETA are also in Gauteng. ESETA
has more than 55% of learnership enrolments in Gauteng, while BankSETA has 50% of their
enrolments in Gauteng.

Employment and Learning Pathways of Learnership Participants in the NSDS Phase II
62
The distribution of provincial enrolment for the SETAs highlights the location of the major
economic activity of the related sectors. For example, the chemical industry has major
operations such as SASOL in Secunda, Mpumalanga, and this explains the presence of high
enrolments in programmes that fall under CHIETA in this province. Similarly, almost all
(80%) of enrolments in learnership programmes that fall under CTFL are in the Western
Cape, the major location of the textile industry.
The provincial location of learnership enrolment provided in Table A1 in the Annexure
shows that the provision of learnerships by SETA is unequally distributed across the
provinces. Almost all (95%) learnership enrolments at FoodBev, for example, are in Gauteng.
More than 60% of enrolments at INSETA and SERVICES SETA are also in Gauteng. ESETA
has more than 55% of learnership enrolments in Gauteng, while BankSETA has 50% of their
enrolments in Gauteng.
The distribution of provincial enrolment for the SETAs highlights the location of the major
economic activity of the related sectors. For example, the chemical industry has major
operations such as SASOL in Secunda, Mpumalanga, and this explains the presence of high
enrolments in programmes that fall under CHIETA in this province. Similarly, almost all
(80%) of enrolments in learnership programmes that fall under CTFL are in the Western
Cape, the main location of the textile industry.
2.3 Enrolment by NQF Level
For the purposes of this study, qualifications were divided into three broad categories:
• low-skills level (defined as NQF Levels 1–3)
• intermediate skills level (defined as NQF Level 4)
• high-skills level (defined as NQF Levels 5–7).
Figure 3 shows that almost two thirds (64%) of the total learnership enrolment were at the
low-skills level, 22% at the intermediate skills level and only 14% at the high-skills level.
8%
1%
5%
22%23%
29%
12%
0
5
10
15
20
25
30
35
1 2 3 4 5 6 7
Per
cent
age
Figure 3: Total learnership enrolments by NQF Level.
According to Table A2 in the Annexure, the distribution of provision by NQF level differs
substantially across SETAs. Almost all FASSET enrolments are at NQF Level 7, while almost
two thirds (61%) of AgriSETA enrolments are at NQF Level 1.

TECHNICAL REPORT II: A Survey of the Employment and Learning Pathways of Learnership Participants
63
Further, provision by SETA tends to be predominantly at one skills level, either the low-
skills level, the intermediate skills level or the high-skills level. These results point very
clearly to the range of different pathways within the ambit of ’learnerships’.
Table 3 reports that for ten of the 20 SETAs in the study, more than 80% of enrolments are at
the low-skills level. These SETAs are AgriSETA, CETA, CHIETA, CTFL, ESETA, FIETA,
FoodBev, MerSETA, MQA and TETA. LGSETA and ETDP tend to have most learnership
enrolments at the intermediate skills level, while BankSETA and FASSET have most of their
enrolments at the high-skills level.
Table 3: Total learnership enrolments by low-, intermediate and high-skills level categories.
SETA Low %
Intermediate %
High %
Total %
AgriSETA 99 1 0 100
BankSETA 1 91 100
CETA 80 13 0 100
CHIETA 80 14 6 100
CTFL SETA 100 0 0 100
ESETA 92 6 3 100
ETDP SETA 13 73 15 100
FASSET 1 0 99 100
FIETA 88 8 4 100
FoodBev 96 1 3 100
HWSETA 28 52 20 100
INSETA 49 39 11 100
LGSETA 10 90 0 100
MAPPP 20 60 21 100
MerSETA 96 4 0 100
MQA 84 16 0 100
SASETA 54 46 0 100
SERVICES 50 44 6 100
TETA 96 4 0 100
W&RSETA 77 21 2 100
Total 64 22 14 100

Employment and Learning Pathways of Learnership Participants in the NSDS Phase II
64
3 DEMOGRAPHIC PROFILE OF LEARNERS
This section focuses on the demographic profile of learners, and addresses the questions:
• Who are the people that are likely to enrol for learnerships in terms of gender, race,
and age?
• What are their highest qualifications, and at what level do they enrol for
learnerships?
• What was their employment status at enrolment?
3.1 Enrolment by gender
The gender distribution of NSDS Phase II learners is 53% (25 050) male and 47% (21 984)
female (Figure 4).
Male53%
Female47%
Figure 4: Learnership participants by gender.
Gender distribution differs markedly by SETA, NQF level and learnership programme.
Table 4 reports that more than two thirds of learners who enrolled through CHIETA (80%),
FIETA (76%), MerSETA (75%), SASETA (68%) and ESETA (67%) respectively are male, and
close to two thirds enrolled through TETA (64%), MQA (63%) and CETA (61%) are also
male. The chemical, manufacturing, mining and construction sectors are traditionally seen
and described as a ‘man’s world’. Traditionally it was experienced that women are not
attracted to technology to the same degree. Despite many initiatives – ranging from
dedicated recruitment and selection to the establishment of support groups for women
students at training institutions and women workers in the labour market – women are still
under-represented in the more technical fields.
On the other side of the coin, more than eight out of ten of learners enrolled through ETDP
SETA (90%), HWSETA (89%), and CTFL SETA (82%) are female. The findings suggest that
gender disparity in programme selection continues, with greater numbers of female learners
entering the ‘softer’ programmes as compared to males. Sectors such as health, welfare
andeducation are traditionally seen as the ‘caring’ sectors and women tend to gain easy

TECHNICAL REPORT II: A Survey of the Employment and Learning Pathways of Learnership Participants
65
access to employment in these sectors. The clothing or textile industry has also traditionally
been dominated by coloured women. These disparities are a reflection of the typical
feminisation of certain occupational roles.
Table 4: Gender of learnership participants by SETA.
Number of learners enrolled Percentage distribution SETA
Male Female Total Male Female Total
AgriSETA 1,590 1,669 3,259 49 51 100
BankSETA 553 883 1,436 39 61 100
CETA 3,739 2,406 6,145 61 39 100
CHIETA 1,407 303 1,710 82 18 100
CTFL SETA 151 688 839 18 82 100
ESETA 1,248 605 1,853 67 33 100
ETDP SETA 58 506 564 10 90 100
FASSET 1,985 1,999 3,984 50 50 100
FIETA 263 83 346 76 24 100
FoodBev 816 672 1,488 55 45 100
HWSETA 435 3,687 4,122 11 89 100
INSETA 313 415 728 43 57 100
LGSETA 737 862 1,599 46 54 100
MAPPP 27 55 82 33 67 100
MerSETA 3,901 1,333 5,234 75 25 100
MQA 1,677 988 2,665 63 37 100
SASETA 4,134 1,983 6,117 68 32 100
SERVICES 854 1,651 2,505 34 66 100
TETA 508 286 794 64 36 100
W&RSETA 654 910 1,564 42 58 100
Total 25,050 21,984 47,034 53 47 100
Table 5 provides an analysis of gender by NQF level, which reveals an interesting trend. It
shows that more than half (58%, 12 666) of all female learners are enrolled at NQF Levels 1–
3, as compared to more than two thirds (69%, 17 200) of all male learners. A quarter (25%) of
the total female learners are enrolled at NQF Level 4 in comparison with a fifth (20%) of the
total male learners. Seventeen per cent of the total female learners are enrolled at NQF
Levels 5–7 and 12% of the total male learners.
Table 5: Gender of learnership participants by NQF Level.
Number of learners enrolled Percentage distribuiton NQF Level
Male Female Total Male Female Total
NQF 1 2,639 2,939 5,578 47 53 100
NQF 2 7,718 5,798 13,516 57 43 100
NQF 3 6,843 3,929 10,772 64 36 100
NQF 4 4,896 5,563 10,459 47 53 100
NQF 5 832 1,471 2,303 36 64 100
NQF 6 212 349 561 38 62 100
NQF 7 1,911 1,921 3,832 50 50 100
Blank 0 14 14 0 100 100
Total 25,050 21,984 47,034 53 47 100

Employment and Learning Pathways of Learnership Participants in the NSDS Phase II
66
Thus, of note is that women tend to enrol in learnership programmes at the intermediate and
high-skills levels to a greater extent than males (see Figure 5).
Figure 5: Gender of learnership participants by skills levels.
3.2 Enrolment by race
Learnership participants are predominantly black, with 73% being African, 13% coloured,
3% Indian and 11% white (Figure 6).
African73%
Coloured13%
Indian3%
White11%
Figure 6: Learnership participants by race.
The racial distribution differs markedly by SETA, NQF level, learnership programme and
provincial location of the learnership. For example, more than half of the learners enrolled
through FASSET are white. On the other hand, more than eight out of ten learnership
participants who fall under CETA, ESETA, FoodBev, MAPP, MQA and SASETA are African.
Further, white learners are enrolled at only 14 of the 20 SETAs included in the study,
0
10
20
30
40
50
60
70
80
Low Intermediate High
Skills level
Per
cent
age
Male Female

TECHNICAL REPORT II: A Survey of the Employment and Learning Pathways of Learnership Participants
67
excluding CTFL SETA, FOOFBEV, LGSETA, MAPP, SASETA and TETA (Table A3 in the
Annexure).
Table 6 provides an analysis of race by NQF level. It shows that more than two thirds (70%)
of all African learners are enrolled at NQF Levels 1–3, 22% at NQF Level 4 and 8% (4 414) at
NQF Level 5–7. A similar distribution exists for coloured learners where 70% are enrolled at
NQF Levels 1–3, 21% at NQF Level 4 and 9% (529) at NQF Level 5–7. In contrast to this
trend, almost half (49%) of all white learners are enrolled at NQF Levels 5–7, 27% at NQF
Level 4, and 24% at NQF Levels 1–3. The same trend is noticed for Indian learners at NQF
Levels 5–7. Almost half (49%) of the Indian learners are enrolled at this level. Thus of note is
the racial skewing at the high-skills level. African and coloured learners tend to enrol in
programmes at the low-skills level to a greater extent than white and Indian learners (see
Figure 7).
Table 6: Race of learnership participants by NQF Level.
Number of learners enrolled Percentage distribution NQF Level
A* C* I* W* Total A C I W Total
NQF 1 4,145 1,294 53 86 5,578 12 22 3 2 12
NQF 2
10,703 1,891 342 580 13,516 31 32 21 11 29
NQF 3 9,023 995 135 619 10,772 26 17 8 12 23
NQF 4
7,527 1,248 287 1,397 10,459 22 21 18 27 22
NQF 5 1,495 276 188 343 2,303 4 5 12 7 5
NQF 6 418 25 33 85 561 1 0 2 2 1
NQF 7 877 247 570 2,137 3,832 3 4 35 41 8
Blank 14 0 0 0 14 0 0 0 0 0
Total 34,202 5,977 1,607 5,248 47,034 100 100 100 1 00 100
* A: African; C: Coloured; I: Indian; W: White
0
10
20
30
40
50
60
70
80
Low Intermediate High
Skills level
Per
cent
age
African Coloured Indian White
Figure 7: Race of learnership participants by skills levels.

Employment and Learning Pathways of Learnership Participants in the NSDS Phase II
68
3.3 Enrolment by age
The term ‘age’ used in this analysis was calculated as in 2007 from the ID numbers of
learners. Learnerships, unlike apprenticeships, are not limited by age. Rather, they are
expected to contribute to the lifelong learning needs of individuals. However, youth is
specifically targeted by government in terms of skills development and the enhancement of
employability.
The mean age of learners included in this study is 29.1, with an age range of 50, with 18
being the minimum and 68 the maximum. Table 7 shows a significant difference in the mean
age distribution between the SETAs, which range from 33.8 years old for learners enrolled
through MAPP and 23.5 for learners enrolled through BankSETA. The following SETAs have
a mean age slightly higher than the average of 29.1: AgriSETA, CETA, CTFL, ETDP,
HWSETA, LGSETA, MAPP, SASETA and TETA.
Table 7: Mean age of learner participants.
SETA Min Max Range Mean S.D S.E
AgriSETA 20 60 40 30.9 8.9 0.2
BankSETA 20 40 20 23.5 2.7 0.1
CETA 20 68 48 32.2 9.0 0.1
CHIETA 20 60 40 28.7 7.5 0.2
CTFL SETA 19 55 36 30.2 7.6 0.3
ESETA 19 50 31 26.6 4.8 0.1
ETDP SETA 20 55 35 30.6 8.4 0.4
FASSET 19 48 29 24.9 3.4 0.1
FIETA 20 52 32 28.8 6.6 0.4
FoodBev 19 50 31 28.1 7.4 0.2
HWSETA 19 68 49 32.1 8.2 0.1
INSETA 19 56 37 24.7 5.0 0.2
LGSETA 19 53 34 31.3 7.1 0.2
MAPPP 19 48 29 33.8 9.6 1.1
MerSETA 18 64 46 28.0 7.5 0.1
MQA 18 63 45 28.8 7.9 0.2
SASETA 19 55 36 29.8 4.8 0.1
SERVICES 18 57 39 28.2 7.5 0.2
TETA 20 50 30 30.1 6.3 0.2
W&RSETA 20 55 35 28.4 6.8 0.2
Total 18 68 50 29.1 7.4 0.0
Figure 7, showing the age distribution of learners, indicates that 81% of learners may be
categorised as youth, falling between 15 and 34 years of age. A significant decrease in
participation with an increase in age occurs from the age of 34. This reflects strongly the fact
that the NSDS II has identified youth as a specific target population. The strategy document
states that ‘the youth are a vulnerable group in South Africa and are thus a special target
group of the NSDS. The intention is to target unemployed youth and to provide them with
skills to improve their chances of finding or creating work’ (DoL 2006: 54). The pathways of
youth through learnerships are therefore most significant, and are discussed further in
section 8 of this report.

TECHNICAL REPORT II: A Survey of the Employment and Learning Pathways of Learnership Participants
69
15-191%
30-3418%
20-2430%
15-3481%
>551%
35-5418%
25-2932%
Figure 7: Age distribution of learners.
3.4 Highest qualification at enrolment
Figure 8 shows that prior to enrolling for the learnership, more than two thirds (71%) of
learners already held a qualification at the intermediate skills level (NQF Level 4). About a
fifth (19%) of learners held a qualification at the high-skills level, and only 11% at the low-
skills level.
Eighty one per cent of learnership participants held a qualification at NQF Level 4 or below
at the time of enrolling for their learnership, and of this group 83% were matriculants.
19%
71%
11%
0
10
20
30
40
50
60
70
80
Low Intermediate High
Skills levels
Per
cent
age
Figure 8: Highest qualification of learners at enrolment.
Table 8 reports the data across SETAs. The only SETAs where less than 71% learners held a
qualification at the intermediate level were CETA, CTF, ESETA, FASSET, LGSETA and
MerSETA. More than half (59%) of the learners who were enrolled for a learnership
programme under FASSET held a qualification at the high-skills level, while the same
percentage (59%) of the learners who were enrolled for a learnership programme under
CTFL held a qualification at the low-skills level.

Employment and Learning Pathways of Learnership Participants in the NSDS Phase II
70
Table 8: Highest qualification of learners at enrolment by SETA.
Number of learners Percentage distribution SETA
Low Intm.* High Blank Total Low Intm.* High Blank Total
AgriSETA 528 2,578 153 3,259 16 79 5 0 100
BankSETA 0 1,309 123 5 1,436 0 91 9 0 100
CETA 1,261 3,760 1,117 7 6,145 21 61 18 0 100
CHIETA 6 1,704 0 1,710 0 100 0 0 100
CTFL SETA 493 335 11 839 59 40 1 0 100
ESETA 187 1,031 615 20 1,853 10 56 34 1 100
ETDP SETA 11 518 31 4 564 2 93 6 1 100
FASSET 0 1,637 2,347 3,984 0 41 59 0 100
FIETA 6 323 2 15 346 2 97 1 4 100
FoodBev 271 1,121 96 1,488 18 75 6 0 100
HWSETA 40 2,909 1,164 9 4,122 1 71 28 0 100
INSETA 2 597 129 728 0 82 18 0 100
LGSETA 289 949 358 3 1,599 18 59 22 0 100
MAPPP 11 61 6 4 82 14 79 8 5 100
MerSETA 1,040 3,538 642 13 5,234 20 68 12 0 100
MQA 303 1,900 421 41 2,665 12 72 16 2 100
SASETA 321 5,210 574 12 6,117 5 85 9 0 100
SERVICES 69 1,494 567 375 2,505 3 70 27 18 100
TETA 102 620 72 794 13 78 9 0 100
W&RSETA 51 1,190 283 41 1,564 3 78 19 3 100
Total 4,990 32,785 8,711 549 47,034 11 71 19 1 100
* Intm: Intermediate
The extent to which learnership participants undertake learnerships at NQF levels above or
below their highest qualification is discussed in section 7 on learner progression.
Figure 9 shows the employment status of learners by their highest qualification at enrolment.
It seems that for both the employed (18.1) (68%) and unemployed (18.2) (71%) groups, more
than two thirds of learners already held a NQF Level 4 qualification at enrolment (see
section 3.6).
Figure 9: Employment status of learners prior to enrolment by highest qualification.
EMPLOYED
NQF 70%
NQF 62%
ABET1%
NQF 12%
NQF 26%
NQF 37%
NQF 468%
NQF 514%
UNEMPLOYED
NQF 511%
NQF 471%
NQF 36%
NQF 22%
NQF 10%
ABET1%
NQF 65%
NQF 74%

TECHNICAL REPORT II: A Survey of the Employment and Learning Pathways of Learnership Participants
71
3.5 People with disabilities
Less than 1% (334) of the learnership participants are people living with a disability. Of the
334 who have disabilities, 46% indicated that they have severe visual limitations and 40%
have physical disabilities requiring the use of a wheelchair, crutches or prosthesis.
3.6 Employment status
Respondents were asked to indicate their employment status at enrolment of the learnership.
The analysis in this section is based on these responses. Figure 10 shows that 69% (32 424) of
total learnership participants were unemployed at enrolment (18.2) and 31% (14 610) were
employed (18.1). The ratio of learners who were employed at enrolment to learners who
were unemployed at enrolment differs by SETA and NQF. More than three quarters (79%) of
SERVICES SETA learners were employed at enrolment, while all MAPP learners were
unemployed at enrolment.
0 10 20 30 40 50 60 70 80 90 100
Total
MAPPP
FASSET
LGSETA
SASETA
BANKSETA
FOODBEV
FIETA
AGRISETA
MQA
ESETA
TETA
INSETA
CETA
MERSETA
ETDP SETA
CHIETA
HWSETA
W&RSETA
CTFL SETA
SERVICES
SE
TA
s
Percentage
Employed Unemployed
Figure 10: Employment status of learners at enrolment by SETA.

Employment and Learning Pathways of Learnership Participants in the NSDS Phase II
72
3.7 Nature of employment
Respondents were asked to describe the nature of their unemployment/employment at the
time of enrolment on the learnership in terms of a number of criteria such as the salary, the
permanency of the appointment contract, or the activities engaged in for economic survival.
Analysis of the nature of unemployment/employment prior to enrolment is presented in this
section.
The employed
There is a significant difference in the race and gender of learners who were employed at the
time of enrolment in a learnership programme. Figure 11 shows that of this group, 67% were
African, 17% were coloured, 5% were Indian and 11% were white learners. In terms of
gender the distribution was 54% male learners and 46% female learners.
Figure 11: Learners employed at enrolment by gender and race.
Ninety per cent were employed in the private sector, 7% in government and 2% were self-
employed (Figure 12). Seventy seven per cent were employed in large (150+ employees)
enterprises or medium size (50–149 employees) enterprises and 98% were employed in the
formal sector. A small number, 4%, were employed in expanded public works programmes.
Almost two thirds (65%, 9 841) of learners employed at the time of enrolment were
employed in a full-time capacity, i.e. for 40 or more hours a week, and in a permanent
position, i.e. an employment contract with no end date stipulated. More than a third (35%)
were employed in a part-time capacity, i.e. for less than 40 hours a week, and in a contract
position with an end date stipulated. The learners also provided information on the nature
of their employment contracts: almost two thirds (64%) had permanent contracts with no
end date, more or less a third (30%) had temporary contracts with a fixed end date, and only
6% were working as casuals.
46%
54%
14%
5%
17%
67%
0
10
20
30
40
50
60
70
African Coloured Indian White Male Female

TECHNICAL REPORT II: A Survey of the Employment and Learning Pathways of Learnership Participants
73
Government7%Self
Employed2%
Unknow n1%
Parastatal0%
Private sector/
Enterprise90%
Figure 12: Employer type.
Salary information was provided by only 30% of the respondents who were employed at the
time of enrolment. Salaries ranged from less than R999 per month to about R10 000
per month, with 15% of learners who were employed earning less than R1 000 per month
(Figure 13).
1%1%2%
4%
13%
10%
17%
13%
22%
2%
15%
0
5
10
15
20
25
<999 >10000 1000-1999
2000-2999
3000-3999
4000-4999
5000-5999
6000-6999
7000-7999
8000-8999
9000-9999
Salary categories
Per
cent
age
Figure 13: Average monthly salary.
The unemployed
The majority (69%, 32 424) of learners were unemployed at the time of enrolment. They were
asked to indicate what activities they engaged in to survive financially. The data identifies
their resourcefulness: almost all (96%) of them indicated that they were looking for work,
more than two thirds (70%) said that that they were doing piecework for payment in kind,
about a third (31%) were studying, a tenth (10%) were involved in unpaid volunteer work
and 6% were taking care of home full-time. Only 6% indicated that they were not doing
anything (Figure 14).

Employment and Learning Pathways of Learnership Participants in the NSDS Phase II
74
The majority (91%) of the learners who were unemployed at enrolment for the learnership
indicated that they survived by receiving cash, food and clothing from family and friends.
More than three quarters also did piece work for pay (78%) and piece work for payment in
kind (77%) respectively (Figure 15).
The percentages of learners that mainly survived due to family support are high across all
the age categories, but show a decline for the 50–54 age category, there after increasing
again. This suggests that this mode of survival remains the key solution for learners who
were unemployed at enrolment. As can be expected, the learners in the older age categories
also survived by doing piece work for pay or piece work for payment in kind (Figure 16).
96%
70%
31%
10%
6%
6%
0 20 40 60 80 100 120
Looking for w ork
Piece w ork for payment in kind
Studying
Unpaid volunteer w ork
Taking care of home full-time
Doing nothing
Figure 14: Activities of the unemployed.
91%
78%
77%
3%
2%
1%
0%
0 10 20 30 40 50 60 70 80 90 100
Cash/food/clothing from family/friends
Piece w ork for pay
Piece w ork for payment in kind
Pension in family
Child support grant
Disablility grant/pension
Foster care grant
Figure 15: Sources of survival.

TECHNICAL REPORT II: A Survey of the Employment and Learning Pathways of Learnership Participants
75
Figure 16: Sources of survival by age.
0
10
20
30
40
50
60
70
80
90
100
15-19 20-24 25-29 30-34 35-39 40-44 45-49 50-54 >55
Cash/food/ clothing from family/friendsPiece w ork for pay or piece w ork for payment in kind

Employment and Learning Pathways of Learnership Participants in the NSDS Phase II
76
4 THE COMPLETION STATUS OF LEARNERS
Learnership participants included in the study fall within three categories:
• Those who had completed the learnership programme for which they were enrolled
• Those who terminated the learnership programme by leaving before graduation
• Those who are still registered and currently in the process of undertaking the
learnership
A total of 47 034 weighted learners were included in the study, representing enrolments in
20 SETAs in the first financial year of the NSDS Phase II. Of these, 30 520 (65%) had
completed their learnership at the time of the study, 6 801 (15%) had terminated their study
and 9 306 (20%) were still registered (Figure 17). The completion status of 407 learners was
unknown.
It is important to note, as discussed in the methodology section, that the sampling frame
aimed to increase the probability of accessing learners who had completed or terminated
their learnership study, in order to track labour market outcomes. Hence, it selected only
those who had enrolled in the first financial year of the NSDS Phase II. These results should
therefore not be interpreted as representative of the NSDS Phase II population as a whole to
date. In particular, they should not be interpreted as a ‘completion rate’ for learnerships in
general. Rather, the data are used to indicate the kinds of outcomes and trends evident for
each category of learnership participant in the specific cohort of the study, those who
enrolled in the first financial year of NSDS Phase II.
Terminated15%
Registered20%
Completed65%
Figure 17: Completion status of learners.
The present section focuses primarily on the 6 801 learners who terminated their study
before completion of the learnership programme. The purpose is to interrogate those factors
that impact on the retention of learners in programmes, and to identify areas where learners
are most vulnerable to the potential of non-completion or termination.

TECHNICAL REPORT II: A Survey of the Employment and Learning Pathways of Learnership Participants
77
4.1 Learners who terminated the learnership
Time in the learnership before terminating
Figure 18 indicates that almost all (98%) of the learners who terminated their learnership
programmes did so within a year, with 38% just after one to three months and 34% after four
to six months. The next section investigates the reasons for termination.
0%
38%
34%
16%
11%
1% 0%0
5
10
15
20
25
30
35
40
< 1 month 1-3 months 4-6 months 7-9 months 10-12months
>1 up to 2years
>2 years
Figure 18: Time that learners were studying before termination.
Reasons for terminating the learnership programme
Learners who terminated their learnership were asked to provide reasons for doing so. Their
responses revealed that about three quarters (74%) terminated the learnership programme
because of the quality of training in either the practical component at the workplace or in the
theoretical component in the classroom. Discussion with learners who had terminated
revealed that in many instances the classroom training was not related to the workplace,
which made it difficult for them to fulfil their duties during the workplace training phase
(see Technical Report III for elaboration).
Lack of support from mentors as well as other staff at the workplace added to this problem
and led them to terminate their learnership training. One respondent mentioned, ‘…there
was resistance from the staff members to accept and acknowledge us. For some it was a
threat that they might loose their jobs’. In fact, about a quarter (24%) of the learners
terminated their programmes because of the resistance of fellow employees.
Just more than a fifth (22%) of the learners terminated the learnership because they found
employment. Other reasons for termination ranged from family responsibilities (9%) to
learnerships that were cancelled (3%) or difficulties with accommodation, travel and
finances (7%). Minor reasons provided were that learners felt that the qualification was of no
value (2%), physical illness (1%), decided to pursue another learnership (1%), learnership
was not interesting enough (1%), and failure of completing certain components of
learnership (1%). Of the 7% who terminated due to financial reasons, a number of learners
indicated that they left because their stipend was either not paid to them or not paid
timeously enough to support their learning. During in-depth interviews with learners one of
them highlighted the impact of stipends not being paid on time, ‘We didn’t receive our
allowances on time. This causes problems because sometimes we couldn’t attend lectures
everyday because we didn’t have money to travel’.

Employment and Learning Pathways of Learnership Participants in the NSDS Phase II
78
39%
35%
24%22%
9%7%
3% 2% 2% 1% 1% 1% 1%
0
5
10
15
20
25
30
35
40
45
Wor
kpla
ce b
ased
trai
ning
poo
r
The
ory
/ cla
ssro
om tr
aini
ng p
oor
Res
ista
nce
from
oth
er e
mpl
oyer
s
Fou
nd e
mpl
oym
ent
Fam
ily r
espo
nsib
ilitie
s
Phy
sica
l /C
ost p
robl
ems
(eg.
Acc
omod
atio
n, tr
ansp
ort,
livin
gex
pens
es)
Lear
ners
hip
term
inat
ed
Qua
lific
atio
n of
no
valu
e
Phy
sica
l bod
y pr
oble
ms
(illn
ess,
acci
dent
, inj
ury,
pre
gnan
cy)
Oth
er le
arne
rshi
p
Phy
sica
l/Cos
t pro
blem
s re
late
d to
prog
ram
me
(eg.
Acc
omod
atio
n,tr
ansp
ort,
livin
g ex
pens
es)
Not
inte
rest
ed in
sub
ject
of
lear
ners
hip
Fai
led
to c
ompl
ete
com
pone
nt o
fpr
ogra
mm
e
Figure 19: Reasons for terminating the learnership programme.
4.2 Differences between learners who completed and terminated
Thus, learners’ self-reported reasons for termination referred mostly to the poor quality of
training they received. The questions arise as to what the differences are between those who
complete and those who terminate, and whether these differences account for their decision.
Skills levels
Differences exists between learners who terminated the learnership programme and learners
who completed in terms of the skills levels of the learnership programme for which they
enrolled, i.e. between learners who enrolled for low-skills level programmes, learners who
enrolled for intermediate and high-skills level programmes.
30%
83%
67% 64%
12%13%
5%5%
20%
0
10
20
30
40
50
60
70
80
90
NQF 1-3 NQF 4 NQF 5-7
Completed Registered Terminated
Figure 20: Completion status of learners by NQF level of learnership.

TECHNICAL REPORT II: A Survey of the Employment and Learning Pathways of Learnership Participants
79
Figure 20 shows that at the low-skills level (NQF 1–3), about two thirds (67%) of learners
completed their training, in comparison with 84% of learners at the intermediate skills level
(NQF 4). At the high-skills level (NQF 5–7), only 30% have already completed compared to
almost two thirds (64%) who are still registered. Given that the sample included all those
who enrolled in the first year of NSDS Phase II, this difference reflects the existence of
learnerships longer than one year duration, at the high-skills level.
The data also reflects the trend that one out of five learners at the low-skills level terminated
their training. This is in comparison with only 5% at the intermediate (NQF 4) level and
high-skills level respectively, indicating that learners at the low-skills level are more likely to
‘drop out’, to terminate their learnership participation before completing the programme.
SETA
Differences exist between learners who terminated their learnership programme and those
who completed the programme in terms of the SETA under which the programme falls.
Figure 21 (see Table A4 in the Annexure) shows the learners who completed as compared to
the learners who terminated early, for each SETA. The data reveal that almost half (46%) of
the learners who undertook a learnership that falls under CETA terminated their learnership
programme before completion. Other SETAs with significant numbers of learners who did
not complete the programme are MAPP SETA, W&R SETA and FoodBev SETA. The
question arises why so many learners that undertook learnerships that fall under these
SETAs are more likely to terminate before completion. These trends point to the need to
examine internal efficiency issues, such as the quality of theoretical and workplace training,
and the opportunities available for the workplace training component.
0
10
20
30
40
50
60
70
80
90
100
AGRISETA
BANKSETA
CETA
CHIETA
CTFL S
ETA
ESETA
ETDP SETA
FASSET
FIETA
FOODBEV
HWSETA
INSETA
LGSETA
MAPPP
MERSETAMQA
SASETA
SERVICES
TETA
W&RSETA
Per
cent
age
Completed Registered Terminated
Figure 21: Completion status of learners by SETA.
Figure 20 noted that almost two thirds of learners at the high-skills level were still registered
for their programmes at the time of the survey. It is interesting to note from the data in
Figure 21 that only a small percentage of learners falling under FASSET either terminated

Employment and Learning Pathways of Learnership Participants in the NSDS Phase II
80
their programmes in this study, and the majority of learners are still registered (93%). This
illustrates the extended nature and duration of the high level learnerships in this sector.
Race
Differences exist in the racial profile of learners who completed, terminated or are still
registered for their learnership programme.
The data show that more than three quarters of the group that completed their learnerships
were African. This trend is significantly different to that identified in the survey of NSDS
Phase I learners, where the majority of completed learners were white (Jennings et al. 2004).2
However, we conclude that the difference is simply an indication that the SETAs were better
represented in the present survey compared to the more skewed sample in the 2004 study. In
the 2004 study, the majority of participants represented SETAs such as FASSET, which has a
predominantly white participation.
However, the flip side of the coin shows that African learners are also more vulnerable.
Africans represent proportionally the largest group of all the learners who terminated their
training (85%).
Taken for each race separately, the data shows that for Africans, 69% completed, for
coloureds 72%, for Indians 43% and for whites 44% completed (Figure 22). Viewed against
their registration statistics, this indicates that the Indian and white learners are pursuing
longer-term learnership programmes. The previous two sections revealed that these
learnerships are at the high-skills level and fall mostly under FASSET.
69%72%
43% 44%
14%18%
50% 50%
17%
10% 7% 6%
0
10
20
30
40
50
60
70
80
African Coloured Indian White
Completed Registered Terminated
Figure 22: Completion status by race.
Gender
Figure 23 shows that taken for men and women separately, the proportion of learners who
completed or terminated is more or less equivalent, suggesting little gender distinction.
2 Important to note the difference in methodology between Jennings et al. (2004) and the current learnership survey,
particularly with respect to the sample frame and SETAs included.

TECHNICAL REPORT II: A Survey of the Employment and Learning Pathways of Learnership Participants
81
Figure 23: Completion status by gender.
Age cohort
Differences exist in the age profile of learners who completed, terminated or are still
registered for their learnership programme. A higher percentage of younger learners
terminated their study as compared to older learners. Discussions with learners revealed
that older learners realise the significance of these training opportunities better than the
younger ones and therefore commit themselves to pursue and complete the training.
Figure 24: Completion status by age.
Highest qualification compared to skills level of learnership
Figure 25 compares the completion status of learners in terms of their pursuit of a
learnership at a lower, the same or a higher NQF level than their highest qualification at
enrolment. It appears that about one out of five learners who enrolled for a learnership
programme at a lower NQF level than their previous highest qualification, terminated their
training. This is an indication that these learners questioned the value of a qualification at a
lower level in assisting them to achieve the goals of employment.
0%
29%31%
19%
10%
5%3% 2% 1%1%
25%
38%
19%
9%
3%2% 2% 1%
0
5
10
15
20
25
30
35
40
15-19 20-24 25-29 30-34 35-39 40-44 45-49 50-54 >55
Completed Terminated
64% 67%
21% 19%15% 14%
0
10
20
30
40
50
60
70
80
Male Female
Completed Registered Terminated

Employment and Learning Pathways of Learnership Participants in the NSDS Phase II
82
Figure 25: Completion status by highest qualification and skills level of learnership.
Further disaggregation by race shows that for Africans, slightly more than one out of five
learners (21%) at the low-skills level terminated their training compared to 8% for whites
and Indians respectively (Figure 26). As may be expected from the analysis above, at the
high-skills level about seven out of ten white and Indian learners respectively are still
registered. These are the learners who are pursuing the longer-term learnerships, mostly in
the financial services sector.
Figure 26: Completion status by highest qualification and skills level of learnership for race groups.
In summary, it appears that the learner who is more likely to terminate the learnership
before completion is thus younger, African, pursuing a learnership at the low-skills level, at
a lower NQF level than their previous highest qualification, and located in specific sectors
such as construction. The reasons for termination reside directly in the perceived quality of
especially work-place based training and related experiences. Significantly, 22% terminated
participation because they found alternative employment.
68%72%
45%
13%
22%
49%
19%
6% 7%
0
10
20
30
40
50
60
70
80
Low er NQF Same NQF Higher NQF
Completed Registered Terminated
LOWER NQF
66%75%
66%71%
12% 13%
26%21%21%
13%8% 8%
0
10
20
30
40
50
60
70
80
African Coloured Indian White
Completed Registered Terminated
SAME NQF
79% 76%
39%46%
14%20%
55% 52%
8% 4% 7%2%
01020
30405060
708090
African Coloured Indian White
Completed Registered Terminated
HIGHER NQF
62%55%
23%18%
31%
41%
70%76%
8%4% 7% 6%
0
10
20
30
40
50
60
70
80
African Coloured Indian White
Completed Registered Terminated

TECHNICAL REPORT II: A Survey of the Employment and Learning Pathways of Learnership Participants
83
5 MOTIVATION FOR ENROLMENT
The section begins with data trends on the expectations that the currently enrolled learners
hold of the learnership programme, and the reasons why they chose to enrol. To avoid
retrospective bias, these questions related to learner expectations were asked only of learners
who were still enrolled at the time of the study, as information about their labour market
outcomes was not available yet. Thereafter, the section focuses on the motivation for
enrolment articulated by all the learnership participants in the study, whatever their
completion status.
5.1 Expectations of learners who are still enrolled
Currently registered learners were asked to provide their top three expectations of
learnerships. Figure 27 shows that almost all the learners (99%) indicated that they expected
to gain employment after completion of the learnership, and to improve their career
opportunities. Only 118 out of 9 036 currently registered learners reported that they do not
expect that the learnership will lead to employment. More than three quarters (78%) expect
that the learnership will improve their technical skills. An interesting expectation is that they
believe involvement in learnership training will enhance their self-confidence. In-depth
interviews revealed that some learners experience an enhancement of self-confidence during
the workplace training component, because they learn to do things in practice which builds
their self-confidence.
40%
78%
99%
97%
99%
0 20 40 60 80 100 120
To increase earning capacity
To improve technical skills
To improve career opportunities
To enhance self conf idence
To enable the learner to access w ork
Figure 27: Expectations from learners who are still registered.
The small group of learners who expected that the learnership would not enable them to
gain employment were asked to provide reasons for this claim. Figure 28 shows that just
more than a quarter (27%) felt their lack of work experience would disenable them from
accessing employment while another 27% were not sure that the qualification would be
recognised by industry. Sixteen per cent also indicated that they were not sure if there were
related work opportunities available. This means that they have embarked on training in a
field for which there may not be a demand in the labour market.

Employment and Learning Pathways of Learnership Participants in the NSDS Phase II
84
27%
27%
17%
16%
8%
3%
2%
0 5 10 15 20 25 30
Not enough w ork experience
Qualif ication not recognised by industry
Other
No related w ork in this area
Not interested in w ork related to thislearnership
No demand for this type of qualif ication
No demand for this level of qualif ication
Figure 28: Reasons why they do not expect to gain employment.
In contrast are the reasons provided by the majority of learners who do expect to gain
employment after completion of their learnership programmes (Figure 29). A third (33%) of
these learners reported that they expect to have enough work experience after completion in
order to access gainful employment, and almost a third (31%) indicated that their
qualification would be recognised by the specific industry in which they are pursuing a
learnership. About a fifth (21%) claimed that there is related work in the field of their
studies.
33%
31%
21%
10%
4%
1%
0 5 10 15 20 25 30 35
Will have w ork experience
Qualif ication is recognised by industry
There is related w ork in this area
Other
Demand for this level of qualif ication
Demand for this type of qualif ication
Figure 29: Reasons why they do expect to gain employment.
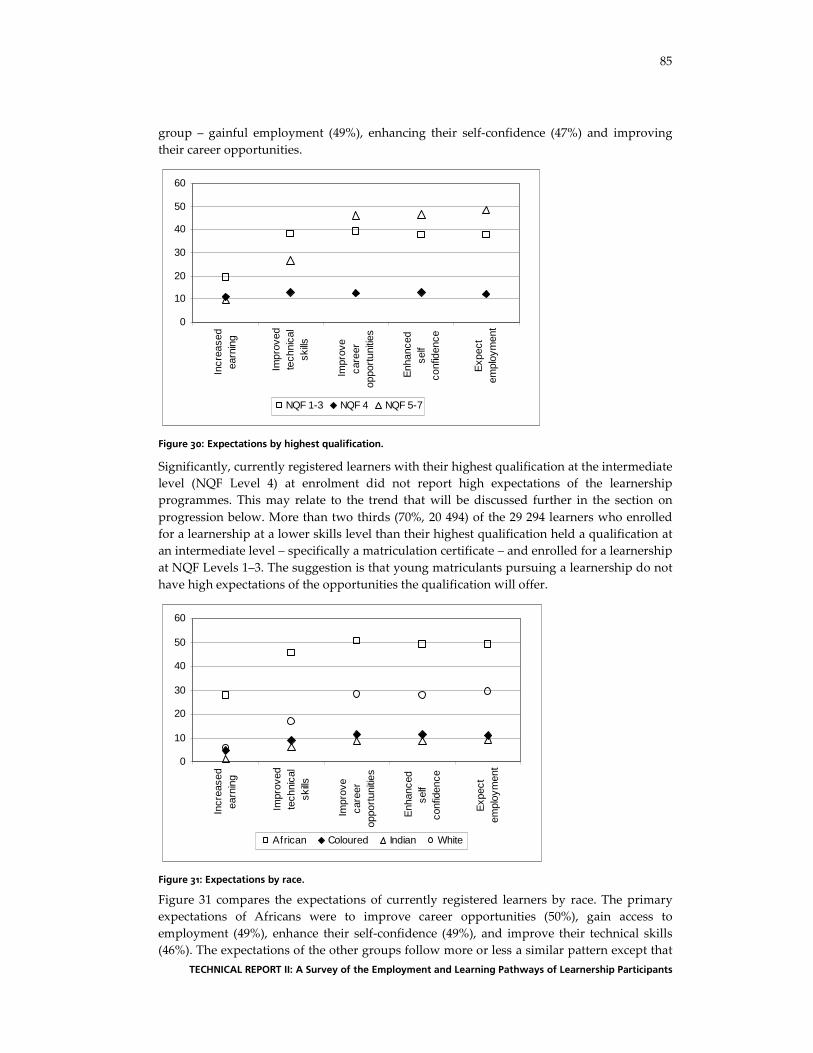
Figure 30 compares the expectations of registered learners who expect to gain employment
by their highest qualification at the time of enrolment. The graph shows that the primary
expectations of learners with low-skills (NQF Levels 1–3) were to improve their career
opportunities (40%), improve their technical skills (38%), gain access to employment (38%)
and enhance their self-confidence (38%). Except for improving technical skills, learners at the
high-skills level (NQF Levels 5–7) had similar expectations to those of the low-skills level
TECHNICAL REPORT II: A Survey of the Employment and Learning Pathways of Learnership Participants
85
group – gainful employment (49%), enhancing their self-confidence (47%) and improving
their career opportunities.
0
10
20
30
40
50
60
Incr
ease
dea
rnin
g
Impr
oved
tech
nica
lsk
ills
Impr
ove
care
erop
port
uniti
es
Enh
ance
dse
lfco
nfid
ence
Exp
ect
empl
oym
ent
NQF 1-3 NQF 4 NQF 5-7
Figure 30: Expectations by highest qualification.
Significantly, currently registered learners with their highest qualification at the intermediate
level (NQF Level 4) at enrolment did not report high expectations of the learnership
programmes. This may relate to the trend that will be discussed further in the section on
progression below. More than two thirds (70%, 20 494) of the 29 294 learners who enrolled
for a learnership at a lower skills level than their highest qualification held a qualification at
an intermediate level – specifically a matriculation certificate – and enrolled for a learnership
at NQF Levels 1–3. The suggestion is that young matriculants pursuing a learnership do not
have high expectations of the opportunities the qualification will offer.
0
10
20
30
40
50
60
Incr
ease
dea
rnin
g
Impr
oved
tech
nica
lsk
ills
Impr
ove
care
erop
port
uniti
es
Enh
ance
dse
lfco
nfid
ence
Exp
ect
empl
oym
ent
African Coloured Indian White
Figure 31: Expectations by race.
Figure 31 compares the expectations of currently registered learners by race. The primary
expectations of Africans were to improve career opportunities (50%), gain access to
employment (49%), enhance their self-confidence (49%), and improve their technical skills
(46%). The expectations of the other groups follow more or less a similar pattern except that
Employment and Learning Pathways of Learnership Participants in the NSDS Phase II
86
the Indian and coloured learners show very low expectations over all. None of the groups
expressed a high expectation in terms of increased earnings.
5.2 Motivation for enrolling in the learnership programme
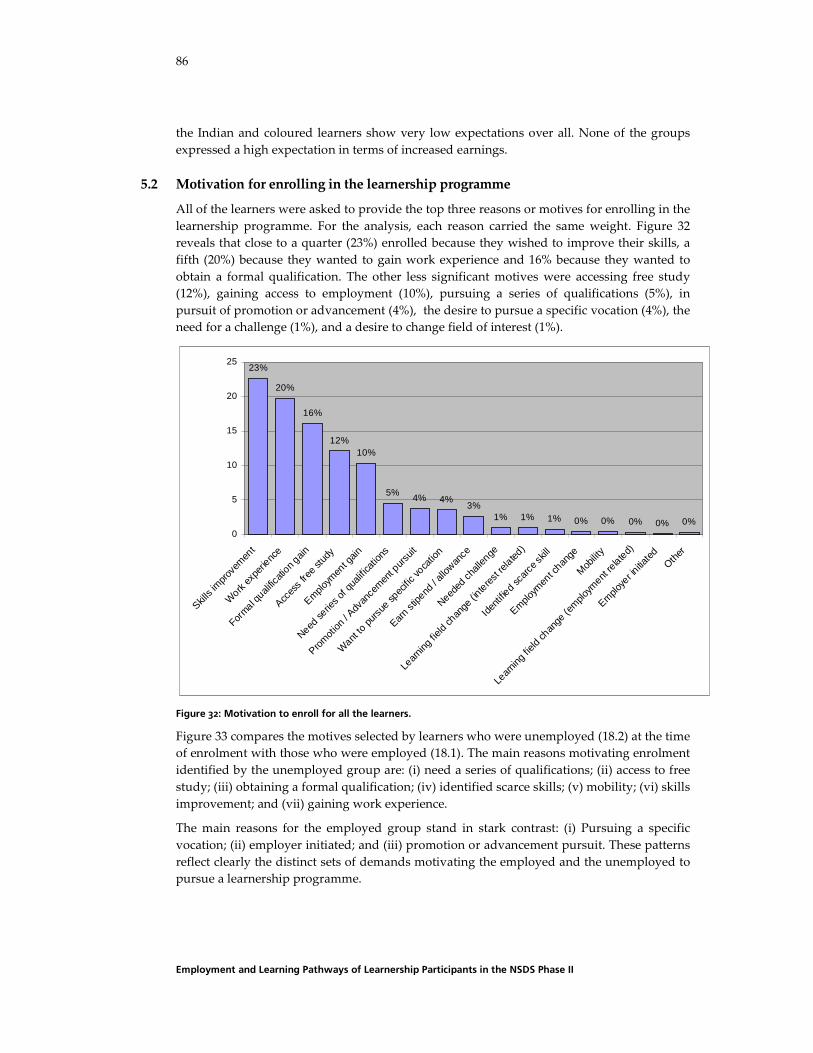
All of the learners were asked to provide the top three reasons or motives for enrolling in the
learnership programme. For the analysis, each reason carried the same weight. Figure 32
reveals that close to a quarter (23%) enrolled because they wished to improve their skills, a
fifth (20%) because they wanted to gain work experience and 16% because they wanted to
obtain a formal qualification. The other less significant motives were accessing free study
(12%), gaining access to employment (10%), pursuing a series of qualifications (5%), in
pursuit of promotion or advancement (4%), the desire to pursue a specific vocation (4%), the
need for a challenge (1%), and a desire to change field of interest (1%).
23%
20%
16%
12%10%
5%4% 4%
3%1% 1% 1% 0% 0% 0% 0% 0%
0
5
10
15
20
25
Skills
impr
ovem
ent
Work
expe
rienc
e
Formal q
ualific
ation g
ain
Acces
s fre
e stu
dy
Emplo
ymen
t gain
Need se
ries o
f qua
lifica
tions
Prom
otion
/ Adv
ance
men
t pur
suit
Want
to p
ursu
e sp
ecific
voca
tion
Earn st
ipend
/ all
owan
ce
Needed
chall
enge
Lear
ning fie
ld ch
ange
(inte
rest
rela
ted)
Iden
tified
scar
ce sk
ill
Emplo
ymen
t chan
ge
Mob
ility
Lear
ning fie
ld ch
ange
(em
ploym
ent re
lated)
Emplo
yer in
itiate
dOth
er
Figure 32: Motivation to enroll for all the learners.
Figure 33 compares the motives selected by learners who were unemployed (18.2) at the time
of enrolment with those who were employed (18.1). The main reasons motivating enrolment
identified by the unemployed group are: (i) need a series of qualifications; (ii) access to free
study; (iii) obtaining a formal qualification; (iv) identified scarce skills; (v) mobility; (vi) skills
improvement; and (vii) gaining work experience.
The main reasons for the employed group stand in stark contrast: (i) Pursuing a specific
vocation; (ii) employer initiated; and (iii) promotion or advancement pursuit. These patterns
reflect clearly the distinct sets of demands motivating the employed and the unemployed to
pursue a learnership programme.

TECHNICAL REPORT II: A Survey of the Employment and Learning Pathways of Learnership Participants
87
.
2440
51 45 3824 24
4436 27
14
35 3451
28
54
29
7660
49 55 6276 76
5664 73
86
65 6649
72
46
71
0
10
2030
40
50
60
7080
90
100
Acces
s free
stud
y
Earn s
tipend
/ allo
wance
Emplo
yer in
itiate
d
Emplo
ymen
t cha
nge
Emplo
ymen
t gain
Formal
qualifi
catio
n gain
Iden
tified s
carce
skill
Lear
ning
field
chan
ge (e
mploy
men
t rela
ted)
Lear
ning
field
chan
ge (i
nter
est r
elate
d)
Mobilit
y
Need s
eries
of q
ualifi
catio
ns
Neede
d chall
enge
Othe
r
Prom
otion
/ Adv
ance
ment
purs
uit
Skills
impr
ovem
ent
Want
to p
ursu
e sp
ecific
voca
tion
Work
experi
ence
Per
cent
age
Employed Unemployed
Figure 33: Motivation for enrolment by employment status.
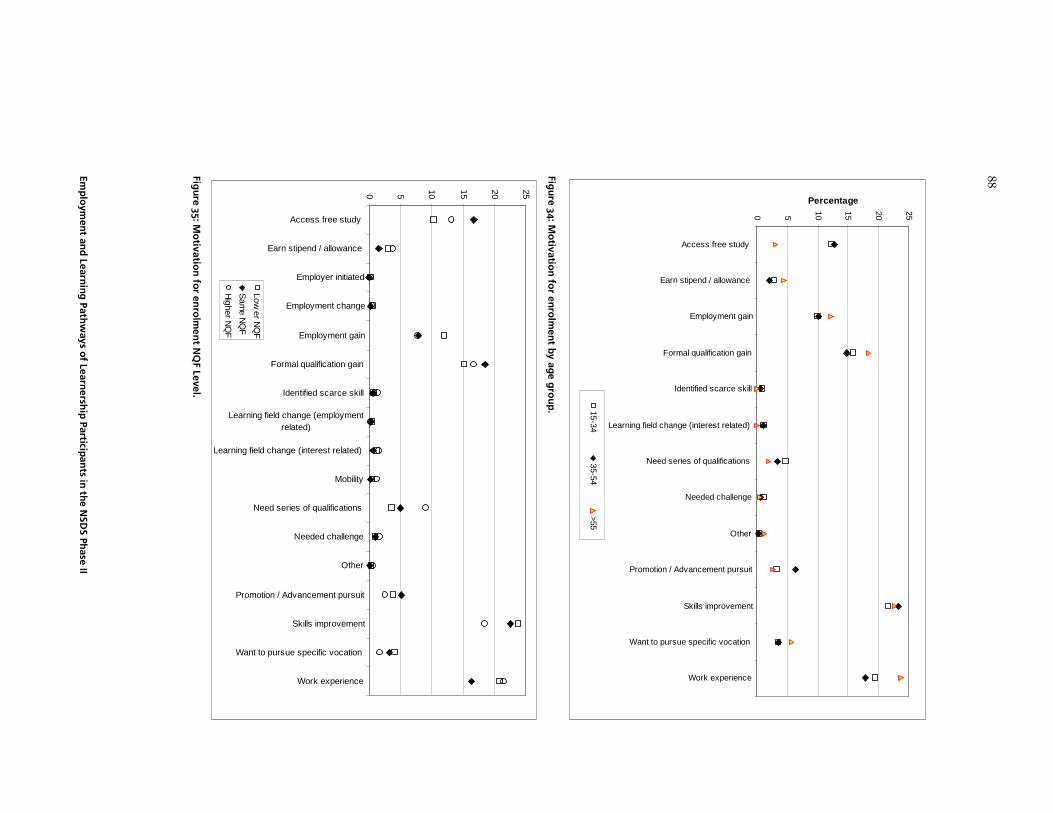
Figure 34 compares the motives of learners from different age groups. Skills improvement,
gaining work experience and obtaining a formal qualification were mentioned as major
motivations for all three of the age groups. The age groups 19–34 and 35–54 indicated that
access to free study and employment gain were also important motives for them.
Figure 35 shows that learners who undertook their learnership at the same NQF level as
their highest qualification tend to be mostly motivated by the opportunity to improve their
skills, obtain a formal qualification, get access to free study, work experience and
employment gain. Learners who undertook their learnership at a higher or a lower NQF
level than their highest qualification tend to be mostly motivated by the same set of
reasonsThe identification of scarce skills is not a strong reason that motivated the learners.
One would expect that in the context of skills shortages in certain fields in South Africa,
learners would be motivated to pursue studies in those fields where a demand for skills
exists.
In summary, those who are currently registered expect that the learnership will enable them
to access work. Some fear that they will not succeed in this aim, because they will not have
the required work experience, or a qualification recognised by employers. With the benefit of
hindsight, the primary motivation for those who had completed or terminated their
programme was to improve skills, gain work experience and a formal qualification.
However, a stark difference is evident between the employed, who are motivated by career
advancement goals, and the unemployed, who are motivated by a desire for certification
that can enhance employability. Access to free study was a significant motivation for some
groups of learners.
Em
plo
yme
nt an
d Le
arnin
g P
athw
ays o
f Learn
ersh
ip P
articipa
nts in
the
NS
DS
Pha
se II
88
0 5 10 15 20 25
Access free study
Earn stipend / allowance
Employment gain
Formal qualification gain
Identified scarce skill
Learning field change (interest related)
Need series of qualifications
Needed challenge
Other
Promotion / Advancement pursuit
Skills improvement
Want to pursue specific vocation
Work experience
Percentage
15-3435-54
>55
Figu
re 34: M
otiv
ation
for e
nro
lme
nt b
y a
ge
gro
up
.
0 5 10 15 20 25
Access free study
Earn stipend / allowance
Employer initiated
Employment change
Employment gain
Formal qualification gain
Identified scarce skill
Learning field change (employmentrelated)
Learning field change (interest related)
Mobility
Need series of qualifications
Needed challenge
Other
Promotion / Advancement pursuit
Skills improvement
Want to pursue specific vocation
Work experience
Lower N
QF
Sam
e NQ
F
Higher N
QF
Figu
re 35: M
otiv
ation
for e
nro
lme
nt N
QF Le
vel.

TECHNICAL REPORT II: A Survey of the Employment and Learning Pathways of Learnership Participants
89
6 MIGRATION TO PURSUE A LEARNERSHIP
In this section we examine the profile of learners who undertook their learnership in a
province other than their home province, that is, migrant learners. Migration can occur for a
range of reasons including the belief that a higher quality education and training will be
received; the belief that locating oneself closer to particular economic areas will increase the
probability of accessing employment after study; the need to undertake a programme not
offered closer to home or personal reasons such as the individual’s desire to move away
from home. While the space of this study did not allow a focus on the reasons or motives for
migration, it does allow a description of provincial migration patterns. These demonstrate
the strong desire of learners to advance in terms of accessing training and employment
opportunities.
6.1 Learner migration
The data shows that about a quarter of learnership participants (24%, 10 841) undertook their
learnership study in a province other than their home province (Table A5 in the Annexure).
The strongest trend towards migration (see Figure 36) was in Limpopo, where almost half of
the learners there (49%) undertook their learnership study in another province. More than a
third of North West (39%) and Mpumalanga learners (35%) respectively undertook their
learnerships in another province than their home province, as did 30% of Eastern Cape
learners, 24% of learners from the Northern Cape and 23% of Free State learners. Learners
from Western Cape, Gauteng and KwaZulu-Natal tended to undertake theirs in the same
province as their home.
30
23
7
16
49
35
24
39
5
70
77
93
84
51
65
76
61
95
0
20
40
60
80
100
EC FS GP KZN LP MP NC NW WC
Province
Per
cent
age
Did migrate Did not migrate
Figure 36: Learner migration.

Employment and Learning Pathways of Learnership Participants in the NSDS Phase II
90
6.2 Migration patterns
As may be expected, the data show that learners are moving from less resourced
environments to better resourced provinces. More than a quarter (26%) of the 10 841 migrant
learners originate from Limpopo, 17% from the Eastern Cape, 13% from Kwazulu Natal and
10% from Mpumalanga and North West each. Together these provinces account for more
than three quarters (76%) of the total learners who undertake their learnership in a province
other than their home province (see Figure 37).
EC17%
WC3%
OUTSIDE-SA2%
NW10%
NC3%
MP10%
LP26%
KZN13%
GP8%
FS8%
Figure 37: Home province of migrant learners.
Analysis of migration patterns shows that close to half (42%) of learners who have their
homes in Limpopo undertook their learnership in Gauteng. Similarly, a third (33%) of
learners with their homes in the North West province and almost a third (30%) from
Mpumalanga undertook their learnerships in Gauteng. Just more than a tenth (12%) of
learners from the Eastern Cape undertook their learnership in the Western Cape (Figure 36
and Table A6 in the Annexure).
Thus in general, Figure 38 shows that 64% of the 10 841 learners who undertook their
learnership away from their home province undertook their learnership in Gauteng. Only
11% of the 10 841 ‘migrant’ learners undertook their learnership in the Western Cape, 7% in
the Free State and 5% in Mpumalanga.
Gauteng is known to be the economic heartland therefore the business hub of South Africa.
Premier Shilowa described Gauteng as ‘the country's engine room’, contributing 33%
to the South African economy and 9% to Africa's entire gross domestic profit. There is
ample motivation for the migration of learners to this well-resourced province
(www.southafricainfo.gov.za).

TECHNICAL REPORT II: A Survey of the Employment and Learning Pathways of Learnership Participants
91
6,320
1,065707
537 384 290 197 189 145
0
1,000
2,000
3,000
4,000
5,000
6,000
7,000
GP WC FS MP KZN NW EC LP NC
Num
ber o
f lea
rner
s
Figure 38: Destination of migrant learners.
More than a third (35%) of the learnership participants who migrated to Gauteng came from
Limpopo. Almost another third migrated from KwaZulu-Natal (15%) and North West (15%),
while 14% came from Mpumalanga (Figure 39).
1%3%
9%9%
14%15%15%
35%
0
5
10
15
20
25
30
35
40
LP KZN NW MP FS EC NC WC
Per
cent
age
Figure 39: Learners who migrated to Gauteng by province of origin.

Employment and Learning Pathways of Learnership Participants in the NSDS Phase II
92
6.3 Migration by SETA
Figure 40 presents learner migration by SETA in order to identify sectors within which there
is most movement to pursue skills development. It shows that almost half the learners (48%)
who undertook a learnership through FoodBev enrolled for the learnership in a province
other than their home province. Similar to this pattern, almost half (47%) of those who
undertook their learnership through ESETA migrated to another province where they
pursued their learnership training. More than a third (35%) of learners who enrolled for
learnership programmes falling under SASETA migrated, a third (33%) from CHIETA and
almost a third (31%) from FASSET (Table A7 in the Annexure).
Of the 715 FoodBev learners who undertook their learnership in a province other than their
home province, 93% migrated to Gauteng. Similarly so for the majority of SETAs, where a
large percentage of migrant learners undertook their learnership in Gauteng (Table A5 in the
Annexure).
89
77
89
67
97
53
91
69
99
52
81
74
90
73 72
83
64
86
72
79
11
23
11
33
3
47
9
31
1
48
19
26
10
27 28
17
36
14
28
21
0
10
20
30
40
50
60
70
80
90
100
AGRISETA
BANKSETA
CETA
CHIETA
CTFL
SETA
ESETA
ETDP S
ETA
FASSET
FIETA
FOODBEV
HWSETA
INSETA
LGSETA
MAPPP
MERSETA
MQA
SASETA
SERVICES
TETA
W&RSETA
Per
cent
age
Did not migrate Did migrate
Figure 40: Migration by SETA.
6.4 Characteristics of migrating learners
This section determines the differences in the profile of those learners who undertook a
learnership in a province different to that of their home province (termed migrant learners)
and those who undertook their learnership in their home province (termed home province
learners). It focuses specifically on the characteristics of age, race, gender, employment
status, the highest qualification at the time of enrolment, and the level of the learnership.

TECHNICAL REPORT II: A Survey of the Employment and Learning Pathways of Learnership Participants
93
Learners who migrated by age
More than 70% of learners in each age category said that they did not migrate (Table 9).
Figure 41 shows the distribution of learners who did migrate across the age groups. Learners
in the younger age groups have a higher tendency to migrate away from their home
province than learners in the older age groups. More than a third (36%) of the learners who
did migrate fall in the age groups 25–29 (36%) and more than a quarter in the age group 20–
24.
1%1%3%4%
9%
19%
36%
27%
0%0
5
10
15
20
25
30
35
40
15-1
9
20-2
4
25-2
9
30-3
4
35-3
9
40-4
4
45-4
9
50-5
4
>55
Per
cent
age
Figure 41: Migration by age.
Table 9: Age distribution of migrating learners.
Number Row % Column % Age group Yes No Blank Total Yes No Blank Total Yes No Blank Total
15-19 29 223 3 255 11 89 1 100 0 1 0 1
20-24 2,932 10,613 518 14,063 22 78 4 100 27 30 50 30
25-29 3,895 11,027 306 15,227 26 74 2 100 36 31 29 32
30-34 2,073 6,279 92 8,444 25 75 1 100 19 18 9 18
35-39 949 3,394 39 4,382 22 78 1 100 9 10 4 9
40-44 388 1,519 23 1,930 20 80 1 100 4 4 2 4
45-49 289 1,014 20 1,323 22 78 2 100 3 3 2 3
50-54 161 614 33 807 21 79 4 100 1 2 3 2
>55 67 356 8 431 16 84 2 100 1 1 1 1
Not Provided 59 113 172 34 66 0 100 1 0 0 0
Total 10,841 35,151 1,042 47,034 24 76 2 100 100 100 100 100
Learners who migrate by race and gender
Figure 42 shows the migration pattern of learners according to race and gender. It shows
that coloured learners have a lower tendency to migrate than white and African learners,
and male learners have a stronger tendency to migrate as compared with female learners.

Employment and Learning Pathways of Learnership Participants in the NSDS Phase II
94
Figure 42: Migration by race and gender.
Learners who migrate by employment status at enrolment
As may be expected, Figure 43 reports that learners who were unemployed at enrolment
have a stronger tendency to migrate in contrast with learners who were employed at
enrolment. Table 10 shows that almost three quarters (72%) of all learners who migrated
were unemployed at the time of enrolment.
Figure 43: Migration by employment status at enrolment.
Table 10: Migration by employment status at enrolment.
Number Row % Column % Employment status Yes No Blank Total Yes No Blank Total Yes No Blank Total
Employed 3,057 10,793 760 14,610 22 78 5 100 28 31 73 31
Unemployed 7,784 24,358 282 32,424 24 76 1 100 72 69 27 69
Total 10,841 35,151 1,042 47,034 24 76 2 100 100 100 100 100
0102030405060708090
Fem
ale
Mal
e
Yes
No
0
20
40
60
80
100
Afr
ican
Col
oure
d
Indi
an
Whi
te
Yes
No
0
10
20
30
40
50
60
70
80
90
Em
ploy
ed
Une
mpl
oyed
Yes
No

TECHNICAL REPORT II: A Survey of the Employment and Learning Pathways of Learnership Participants
95
Learners who migrated by NQF level of learnership
Figure 44 shows that of all the learners, those who enrolled at NQF Levels 2–4 display a
stronger tendency towards migration than learners who enrolled at NQF Level 1 and at NQF
Levels 5–7. This suggests a strong desire to pursue occupationally related certification and
skills development.
0
5
10
15
20
25
30
NQ
F 1
NQ
F 2
NQ
F 3
NQ
F 4
NQ
F 5
NQ
F 6
NQ
F 7
Figure 44: Migration by highest qualification.
In summary, the data reveals that those pursuing the ‘migration’ learnership pathway tend
to be unemployed younger males, more typically white and African. They are more likely to
migrate to Gauteng, which is known to be the business hub of South Africa, from the
provinces of Limpopo, Mpumalanga or the Eastern Cape, and in relation to programmes at
the low- to intermediate skills levels in a limited range of sectors.

Employment and Learning Pathways of Learnership Participants in the NSDS Phase II
96
7 LEARNER PROGRESSION
A critical aspect of the National Qualifications Framework is to provide and enable
articulation across programmes and by so doing, to enable learner progression from one
qualifications level to another. This section investigates how learnerships are promoting
progression, and what the most common ‘progression’ pathways are.
Of the 47 034 learners in this study, only 14 % (6 532) were enrolled for a qualification at a
NQF level higher than that of their highest qualification at the time of enrolment. Almost a
quarter (23%, 10 646) were enrolled for a learnership qualification at the same NQF level as
their highest qualification. Significantly, almost two thirds (63%, 29 294) were enrolled for a
qualification at a lower NQF level than their highest qualification (Figure 45). This is a very
definite message in terms of the nature of progression. Only a small proportion of learners
are progressing in a linear movement, advancing up a qualifications ladder. For the most
part, progression can rather be described by a ‘zigzag’ movement between qualifications
levels.
Anderson (2003) referred to several studies in Australia with samples of VET students that
follow such zigzag, rather than linear pathways. These pathways are also typified by
disruptions, pauses and adjustments to the initial direction the learners have chosen. They
found that the major factors contributing to this phenomenon were age progression and
changes in personal circumstance. However, through in-depth interviews with learnership
participants in this study (see Technical Report III), it became clear that in South Africa
zigzag progression is more strongly related to the lack of employment opportunities.
PROGRESSION
Low er NQF63%
Same NQF23%
Higher NQF14%
Figure 45: Learner progression.

TECHNICAL REPORT II: A Survey of the Employment and Learning Pathways of Learnership Participants
97
7.1 Progression trends of those enrolled at the same NQF level
Of the 10 646 who undertook a learnership programme at the same NQF level as their
highest qualification, more than two thirds (68%) held a matric certificate at NQF Level 4,
and enrolled for a learnership at the same level. The majority (77%) of this group are
Africans. Ten per cent of the learners already held a qualification at the high-skills band and
continued with a learnership at NQF Level 7. Almost three quarters of this group are white
learners. Sixteen per cent held a qualification at the low-skills band and proceeded to a
learnership at the same low level. Almost three quarters (74%) of this group are Africans (see
Table A8 in the Annexure).
7.2 Progression patterns of those enrolled at a higher NQF level
Table A9 in the Annexure shows that more than half (56%, 3 657) of the 6 532 learners who
enrolled at a higher NQF level than their highest qualification held a matric certificate and
enrolled for a learnership at the higher skills level (NQF 5–7). Almost half (48%) of this
group are African and two thirds (34%) are white. Only 8% proceeded from the low-skills
band to a learnership on the intermediate skills level (NQF Level 4).
7.3 Progression patterns of those enrolled at a lower NQF level
Table A10 in the Annexure shows that more than two thirds (70%, 20 494) of the 29 294
learners who enrolled for a learnership at a lower skills-level than their highest qualification
had a matric certificate and enrolled for learnerships at NQF Levels 1–3. A high 80% of this
group are African. Furthermore, of the 10% (2 859) of learners with a NQF 5 qualification
enrolled for a learnership at NQF Levels 1–3, 86% were African. Similarly, 12% (709) with a
NQF 6 level qualification did the same thing and have the same profile.
7.4 Progression by race and gender
Differences exist in the racial distribution of learners across these three groups, i.e. learners
enrolled at a higher, the same or lower NQF level to their highest qualification. Figure 46
shows that more than three quarters (79%) of all learners who enrolled for learnerships at a
lower NQF level than their highest qualification were African. The same trend is noticed for
learners who enrolled for a learnership at the same NQF level as their highest qualification.
Of the group that enrolled for a learnership at a higher NQF level as their highest
qualification, almost half (49%) were African and more than a quarter (29%) white.
Figure 46: Learner progression by race.
Table A11 in the Annexure shows that 69% of African learners are enrolled for a learnership
programme at a lower NQF level to their highest qualification; 22% for a learnership
LOWER NQF
White5%
Indian2%
Coloured14%
African79%
SAME NQF
African71%
Coloured10%
Indian4%
White15%
HIGHER NQF
African49%
Coloured13%
Indian9%
White29%

Employment and Learning Pathways of Learnership Participants in the NSDS Phase II
98
programme at the same NQF level and 9% at a higher NQF level. This is similarly so for
coloured learners where 67% are enrolled for learnership programmes at a lower NQF level;
19% for a learnership programme at the same NQF level and 14% at a higher NQF level. In
contrast, 34% of white learners are enrolled for learnership programmes at a lower NQF
level; 29% for a learnership programme at the same NQF level and 37% at a higher NQF
level.
In fact, a comparison between African and white enrolments shows a direct inversion, with
the majority of African and coloured learners enrolled at a lower NQF level to their highest
qualification and the majority of white learners enrolled at either a higher NQF level or the
same NQF level. White learners enrolled for programmes on a high-skills level are most
likely to be on a linear progression pathway. In contrast, the progression pathway of African
learners is more likely to zigzag, as participants seek certification even if it means studying
for a lower level qualification.
Figure 47 shows that more than half (57%) of all learners who enrolled for learnerships at a
lower NQF level than their highest qualification were male. There was an even distribution
of males and females who enrolled for a learnership at the same NQF than their highest
qualification, but more females (53%) than males (47%) enrolled for a learnership at a higher
NQF level than their highest qualification.
Figure 47: Learner progression by gender.
Table A11 also reports that of all the female learners, 16% enrolled for learnership
programmes at an NQF level higher than their highest qualification and 59% for learnership
programmes at an NQF level lower than their highest qualification. For males the
comparable figures are 12% and 67%. Proportionally more females than males enrolled for
learnership programmes at an NQF level higher than their highest qualification and fewer
females than males enrolled for learnership programmes at an NQF level lower than their
highest qualification.
7.5 Progression by SETA
Table A12 in the Annexure provides an analysis of progression by SETA. It shows that more
than half (55%) of the enrolments through four of the SETAs are at an NQF level lower than
that of the learners’ highest qualification: AgriSETA, CETA, MerSETA and SASETA. Nine
out of ten learners in AgriSETA and ESETA are enrolled at an NQF level lower than their
highest qualification, and eight out of ten at CETA, CHIETA, FIETA, MerSETA, MQA, TETA
and W&RSETA. In fact, these SETAS account for more than two thirds (68%) of learners who
enrolled for a learnership at a lower NQF level than their highest qualification.
Almost three quarters of the learners who enrolled at ETDP SETA (73%) and MAPP (71%)
did so at the same NQF level as their highest qualification. More than half of the learners
LOWER NQF
Male57%
Female43%
SAME NQF
Female50%
Male50%
HIGHER NQF
Male47%
Female53%

TECHNICAL REPORT II: A Survey of the Employment and Learning Pathways of Learnership Participants
99
under LGSETA (57%) enrolled for programmes at the same NQF level as their highest
qualification.
Most of the learners who enrolled for programmes falling under BankSETA (85%) and
FASSETT (70%) did so at a higher level than their highest qualification. It is clear that these
two SETAs are providing opportunities for learners to obtain higher qualifications and
accordingly progress in their career pathway.
7.6 Progression by completion status
Of the 6 801 learners who terminated their study, the majority (84%) were enrolled for a
programme at a lower skills level to their highest qualification, only 6% at a higher skills
level and 10% (674) at the same skills level. Comparing completed learners to this trend, only
about two thirds (65%) of learners were enrolled for a programme at a lower skills level, 25%
at the same skills level and 10% (2 909) at a higher skills level (Table 11).
Table 11: Learner progression by completion status.
Number of learners Percentage distribuiton Completion Status Lower Same Higher ?* Total
Completion Status Lower Same Higher ?* Total
Completed 19,628 7,608 2,909 376 30,520 Completed 65 25 10 1 100
Registered 3,755 2,351 3,164 37 9,306 Registered 41 25 34 0 100
Terminated 5,614 674 432 81 6,801 Terminated 84 10 6 1 100
Blank 297 14 28 69 407 Blank 88 4 8 20 100
Total 29,294 10,646 6,532 562 47,034 Total 63 23 14 1 100
*?: Unknown
In sum, two distinct progression pathways are evident. One is linear and moves up an
occupational and career ladder. Learners on this pathway tend to be enrolled at the high-
skills level in a small range of SETAs, particularly FASSET and BankSETA, and they are
more likely to be female and white.
The other is a zigzag pathway, in which learners enrol at the same or lower NQF levels.
What is of particular note is the high number of matriculants who are prepared to move
‘backwards’ down the qualifications ladder, in order to obtain an occupationally oriented
qualification. The trend is particularly evident in SETAs which offer low- and intermediate
skills level programmes.

Employment and Learning Pathways of Learnership Participants in the NSDS Phase II
100
8 EMPLOYMENT AND LEARNING PATHWAYS OF LEARNERS
This section examines to what extent and in what ways the skills imparted have enabled
learnership participants to access or to advance in the labour market. The learners’
perspectives of the impact that the learnership had on their lives is also highlighted.
Of the 47 034 learners enrolled, 6 801 are still registered and 37 321 have either completed or
terminated their learnership programmes. The section focuses specifically on the 37 321 who
have completed or terminated the learnership and excludes any discussion on the learners
who are currently still registered.
8.1 Employment status of all learners after completion or termination
Of all the 18.1 and 18.2 learners (37 321), the majority, about two thirds (63%, 23 294), were
employed after completion or termination of their learnerships and 37% (13 768) were
unemployed. The employment status of 259 learners after completion or termination was
unknown (Figure 48).
Employed63%
Unemployed37%
Figure 48: Employment status of all learners after completion or termination.
Figure 49 reports the employment status of 18.2 learners, i.e. learners who were unemployed
at enrolment, after completion or termination. Slightly over half (53%) of these learners
gained employment after completion or termination of their learnership programmes. This
trend is very positive for learnership programmes and represents the potential difference
that learnerships can make to the lives of individuals and to the skills needs of the economy.
This is particularly so when the percentage remaining unemployed is compared with the
high percentage of unemployed youth in the country.

TECHNICAL REPORT II: A Survey of the Employment and Learning Pathways of Learnership Participants
101
Employed 53%
Unemployed 47%
Figure 49: Employment status of 18.2 learners after completion or termination.
Figure 50 reports the employment status of 18.1 learners, i.e. learners who were employed at
the time of enrolment, after completion or termination. A small percentage of these learners
(16%) became unemployed. On further inspection the data show that 41% of this group
enrolled for programmes that fall under CETA. The nature of work in the construction
industry relates to site and/or project work. It is often found that after completion of a
construction project, the workers have to seek employment on another project. This may
explain part of the trend of 18.1 learners who became unemployed. Section 8.2 below also
suggests that a proportion of this group may have terminated the learnership without
completing.
Unemployed 16%
Employed 84%
Figure 50: Employment status of 18.1 learners after completion or termination.

Employment and Learning Pathways of Learnership Participants in the NSDS Phase II
102
8.2 Pathways of learners who completed or terminated
The research team wanted to define and explore the pathways of learners in terms of their
labour market outcomes. A range of possibilities and their key features were identified. This
disaggregation of pathways of the labour market outcomes of learners was used to guide the
analysis that follows (see Figure 51):
Unemployed at enrolment (18.2), terminated, still unemployed
Unemployed at enrolment (18.2), terminated, now employed
Of the 4 638 learners who were unemployed at enrolment and terminated their
learnership training, almost two thirds (64%) are still unemployed while 36% found
employment.
Unemployed at enrolment (18.2), completed, still unemployed
Unemployed at enrolment (18.2), completed, now employed
Of the 20 710 learners who were unemployed at enrolment and completed their
learnership training, more than half (57%) gained employment while 43% are still
unemployed.
Employed at enrolment (18.1), terminated, now unemployed
Employed at enrolment (18.1), terminated, still employed
Of the 2 100 learners who were employed at enrolment and terminated their
learnership training, 70% are still employed while 30% became unemployed.
Employed at enrolment (18.1), completed, now unemployed
Employed at enrolment (18.1), completed, still employed.
Almost all (87%) of the 9 614 learners who were employed at enrolment and
completed their learnership training are still employed while 13% became
unemployed.
87%
70%
57%
36%
13%
30%
43%
64%
0 10 20 30 40 50 60 70 80 90 100
Employed at enrolment,completed
Employed at enrolment,terminated
Unemployed atenrolment, completed
Unemployed atenrolment, terminated
Employed after Unemployed after
Figure 51: Labour market pathways of 18.1 and 18.2 learners who completed or terminated.

TECHNICAL REPORT II: A Survey of the Employment and Learning Pathways of Learnership Participants
103
These employment pathways will be analysed in turn.
8.3 Labour market pathways of learners who were unemployed at enrolment (18.2) and
gained employment
This section focuses on the learners who were unemployed at the time of enrolment and
who gained employment on completion or termination of the learnership. It discusses the
nature of employment gained by these learners, but first shows the results for each SETA
(Table 12).
Table 12 reports that except for CETA, ESETA, FASSET, FoodBev, MAPPP and W&RSETA,
eight to nine out of ten learners at the other SETAs who were unemployed at enrolment
found employment after completion of their studies. The low percentage for FASSET is
expected, due to the extended duration of learnerships at the high-skills level in that sector.
Table 12: Pathways of 18.2 learners who gained employment after completion or termination.
Number Percentage distribution SETA
Completed Terminated Total SETA
Completed Terminated Total
AgriSETA 701 48 749 AgriSETA 94 6 100
BankSETA 909 57 966 BankSETA 94 6 100
CETA 231 331 562 CETA 41 59 100
CHIETA 666 44 710 CHIETA 94 6 100
CTFL SETA 139 21 160 CTFL SETA 87 13 100
ESETA 231 127 359 ESETA 64 36 100
ETDP SETA 133 133 ETDP SETA 100 0 100
FASSET 53 72 126 FASSET 42 58 100
FIETA 85 14 99 FIETA 85 15 100
FoodBev 484 231 715 FoodBev 68 32 100
HWSETA 677 47 724 HWSETA 94 6 100
INSETA 326 34 360 INSETA 91 9 100
LGSETA 1,006 22 1,028 LGSETA 98 2 100
MAPPP 11 11 22 MAPPP 50 50 100
MerSETA 824 148 971 MerSETA 85 15 100
MQA 980 40 1,021 MQA 96 4 100
SASETA 3,619 254 3,873 SASETA 93 7 100
SERVICES 277 8 285 SERVICES 97 3 100
TETA 251 23 274 TETA 92 8 100
W&RSETA 195 137 332 W&RSETA 59 41 100
Total 11,799 1,669 13,468 Total 88 12 100
Relationship of the job to the learnership
Figure 52 shows that almost all (94%, 11 025) of the learners who were unemployed at
enrolment, completed their learnerships and gained employment indicated that the
employment was related to the learnership they completed. Again, this is a positive result
for learnership programmes as it suggests that learnerships have the capacity to make a real
difference in the labour market outcomes of graduates. Not only did they gain employment,
that employment was directly related to the training they undertook and provided them the
opportunity to further build their skills and knowledge in the field.

Employment and Learning Pathways of Learnership Participants in the NSDS Phase II
104
Employment related94%
Employment not related
6%
Figure 52: Employment related or not.
Reasons not related
The very small number of learners who indicated that the employment gained was unrelated
to their learnership programme of study was asked to provide reasons. The following is a
summary of the reasons provided by the learners:
• They had to accept any employment as they needed a salary regardless of the type of
work, but that they continue to look for employment related to the programme of
study
• There is no demand for people with this type of qualification
• There is no demand for people with this level of qualification
• They are unable to access related employment as they did not have enough work
experience
• There is no related work in this area
• The qualification is not recognised by industry
• They are not interested in work related to this learnership
Nature of employment
Three quarters (75% or 8 908) of these learners are employed in positions that are full-time
and permanent, 9% (1 012) in positions that are full-time and contract and 12% (1 370) on a
part-time, contract basis (Table 13).
Table 13: Nature of employment for unemployed learners who completed and gained employment.
Casual Contract/ Temporary Permanent Blank Total
Full-time 70 1,012 8,908 18 10,008
Part-time 140 1,370 199 1,709
Blank 6 4 71 81
Total 211 2,388 9,110 89 11,799
This is a good outcome for most of the learners in terms of the nature of employment gained
after completion of their learnership programme. Only 2% (211) indicated that they are

TECHNICAL REPORT II: A Survey of the Employment and Learning Pathways of Learnership Participants
105
working on a casual basis. Analysis by race shows that all of the 211 learners who are
working as casuals are African and coloured, and there are no white or Indian learners in
casual employment.
Table 14 shows the results for the 1 669 unemployed learners who did not complete their
learnership programmes and found employment. Almost two thirds (63%, 1 057) of these
learners are employed in positions that are full-time and permanent, 10% (170) in positions
that are full-time and contract and 17% (281) on a part-time, contract basis. Seven per cent
(116) reported that they had found work on a casual basis.
Table 14: Nature of employment for unemployed learners who terminated and gained employment.
Casual Contract/ Temporary Permanent Blank Total
Full-time 21 170 1,057 5 1,253
Part-time 95 281 34 410
Blank 6 6
Total 116 451 1,091 11 1,669
Monthly income
Salary information was provided by 50% of employed learners who were unemployed at the
time of enrolment and completed their studies. Salaries provided by respondents range from
less than R1 001 to more than R10 000 per month. Almost half (49%) earned between R3 001
and R5 000 per month and almost a third (30%) between R1 001 and R3 00 per month. Only
4% indicated that they earn less than R1 001 per month and only 2% more than R10 000 per
month (Figure 53).
2%2&2%1%
5%5%
24%25%
14%16%
4%
0
5
10
15
20
25
30
< 10
01
1001
- 2
000
2001
- 3
000
3001
- 4
000
4001
- 5
000
5001
- 6
000
6001
- 7
000
7001
- 8
000
8001
- 9
000
9001
- 1
0000
>100
00
Per
cent
age
Figure 53: Salary scales of unemployed learners who completed and gained employment.
Salary information was provided by only 37 of employed learners who were unemployed at
the time of enrolment, terminated their studies and gained employment. Compared to
learners who completed their learnership, a greater proportion of learners who terminated
(11%) earned less than R1 001 per month and a smaller proportion (23%) between R3 001 and

Employment and Learning Pathways of Learnership Participants in the NSDS Phase II
106
R5 000. Almost half (48%) of the terminated learners earned a salary between R1 001 and R3
000 per month (Figure 54).
1%3%
1%1%
8%
4%
8%
16%
20%
28%
11%
0
5
10
15
20
25
30
< 1 0
01
100 1
- 2 0
00
2 00 1
- 30
0 0
3 001
- 4 0
0 0
400 1
- 5 0
00
5 00 1
- 6 0
00
6 001
- 70
0 0
7001
- 8 0
0 0
8 00 1
- 9 0
00
9 001
- 10
0 00
>10 0
0 0
Per
cent
age
Figure 54: Salary scales of unemployed learners who terminated and gained employment.
Table 15 shows an analysis of mean salaries by gender, race, NQF level and type of
employment contract. Completed learners who undertook a learnership at NQF Level 1
have a mean salary of R3 042 compared to R4 207 for learners at NQF Level 4 and R10 950
for learners at NQF Level 7.
Table 15: Mean salaries of unemployed learners who completed or terminated and gained employment.
Mean salary
Gender Completed Terminated All
Male R 4,091 R 3,011 R 4,005
Female R 3,689 R 3,559 R 3,673
Race
African R 3,919 R 3,295 R 3,862
Coloured R 3,464 R 2,685 R 3,383
Indian R 5,582 R 5,582
White R 5,576 R 5,100 R 5,554
NQF Level
NQF 1 R 3,042 R 2,580 R 2,974
NQF 2 R 3,669 R 3,538 R 3,633
NQF 3 R 3,564 R 3,044 R 3,515
NQF 4 R 4,207 R 3,060 R 4,185
NQF 5 R 4,706 R 4,386 R 4,661
NQF 6 R 6,021 R 5,138 R 5,944
NQF 7 R 10,950 R 10,950
Employment contract
Casual (daily) R 2,145 R 997 R 1,597
Contract/ temporary (with fixed end date) R 4,140 R 3,030 R 3,996
Permanent (no end date) R 3,924 R 3,487 R 3,891
Occupational category
Figure 55 shows that almost half (46%) of the completed learners are working as community
and personal service workers, 11% as labourers and 10% as professionals. A further 9% are
engaged both in clerical/administrative and machine operating work, 6% as technicians and

TECHNICAL REPORT II: A Survey of the Employment and Learning Pathways of Learnership Participants
107
trade workers and 2% as managers. Excluding manager category, the learners who
terminated are quite evenly distributed across the occupational categories.
11
9
6
9
46
6
10
2
15
11
20
11
19
9
14
1
1
0 5 10 15 20 25 30 35 40 45 50
Labourers
Machinery operators and drivers
Sales workers
Clerical and administrative workers
Community and personal service workers
Technicians and trades workers
Professionals
Managers
Unknown
Percentage
Completed Terminated
Figure 55: Occupational categories of unemployed learners who completed or terminated and gained employment.
Employer type
Figure 56 shows that more than two thirds (70%) of learners who completed are working in
the private sector and more than a quarter (29%) in government. The learners who
terminated their studies and found employment are mostly (84%) working in the private
sector, while 12% indicated they were employed in government. It is interesting to note that
78 (1%) of the completed learners are self-employed compared to 57 (3%) of the terminated.
Figure 56: Type of employer of unemployed learners who gained employment.
Almost three quarters of the completed learners work at large organisations (150+
employees) compared to about half (52%) of those who terminated the learnership.
Proportionally more learners who terminated their learnership programmes work at micro
COMPLETEDSelf-
employed 1%
Unknow n 1%
Government 29%
Private sector 70%
Parastatal 0%
TERMINATEDUnknow n1%
Private sector 84%
Parastatal0%
Government12%
Self-employed
3%

Employment and Learning Pathways of Learnership Participants in the NSDS Phase II
108
(13%) and small (9%) enterprises compared to learners who completed their training – 6%
and 3% respectively (Figure 57).
Figure 57: Size of employer of unemployed learners who gained employment.
Method of accessing employment
The majority (84%) of completed learners were employed within one month or less of
completion of their learnership programmes (Figure 58). This shows that employers
committed themselves to make employment opportunities available to these learners. It also
means that employers thought the skills and qualifications of these learners are applicable. A
small percentage (6%) only gained access to employment more than six months after
completion of their learnership programmes. Compared to the completed learners, a smaller
proportion of learners who terminated (61%) found employment within one month or less
after termination of their studies.
Figure 58: Time before unemployed learners got access to employment.
Almost two thirds (60%) of the learners who completed are employed at the company at
which they undertook their learnership study. In contrast, more than two thirds (68%) of
learners who terminated their studies found employment at a different company.
COMPLETEDMicro6% Small
3%
Medium 17%
Blank1%
Large73%
TERMINATED
Large52%
Medium 26%
Small9%
Micro13%
9 6 3
61
13 12 14
82
0
10
20
30
40
50
60
70
80
90
Up to 1 month Between 1 and 3months
From 3 to 6 months > 6 months
Per
cant
age
Completed Terminated

TECHNICAL REPORT II: A Survey of the Employment and Learning Pathways of Learnership Participants
109
In summary, this section on the unemployed (18.2) learners who gained employment
provides an indication of the nature of the employment accessed, most significantly, that it is
strongly related to the learnership pursued. The trends suggest that the employment status
of those who terminated the learnership is more vulnerable than those who completed.
8.4 Comparison of labour market pathways of 18.2 learners who did not gain
employment and those who gained employment.
The question now addressed is how many 18.2 learners remained unemployed, who are they
in comparison with those who gained employment and what are the reasons they are not
accessing employment?
The data show that 47% (11 880) of the total of 18.2 learners (25 348) did not gain
employment compared to the 53% (13 468) who gained employment.
Who are they?
A comparison between these two groups of learners for the race groups separately shows
that almost half of African (49%) and coloured learners (44%) did not gain employment
compared to only about a tenth (11%) of Indian learners (out of a total of 205) and almost a
fifth (18%) of whites (out of a total of 680) (Figure 59).
18%11%
44%49%
82%89%
56%51%
0
10
20
30
40
50
60
70
80
90
100
African Coloured Indian White
Did NOT gain employment Gained employment
Figure 59: Comparison of labour market pathways of 18.2 learners by race.
A further comparison between these learners for gender separately shows that
proportionally more women (53%) did not gain employment than men (41%) (Figure 60).

Employment and Learning Pathways of Learnership Participants in the NSDS Phase II
110
41%53%
59%47%
0
10
20
30
40
50
60
70
80
90
100
Male Female
Did NOT gain employment Gained employment
Figure 60: Comparison of labour market pathways of 18.2 learners by gender.
Figure 61 shows the proportion of learners who did not gain employment for the different
skills levels. More than half of the 18.2 learners who enrolled at a low-skills level did not
gain employment, compared to about a quarter for the intermediate and high-skills levels
separately. This clearly shows a pathway of potentially extended periods of unemployment
for the learners enrolled at the low-skills level. Almost three quarters (71%) of this group
indicated that they had plans to enroll for further education and training, as they realised
that their learnership training was not enough to give them the necessary skills to access
employment.
57
25 26
43
75 74
0
10
20
30
40
50
60
70
80
90
100
Low level Intermediate level High level
Did NOT gain employment Gained employment
Figure 61: Comparison of labour market pathways of 18.2 learners by skills level of learnership.
Figure 62 shows the 18.2 learners who did not gain employment for each age category. There
were only 27 learners in the age category above 55, of whom all gained employment. It
further shows that the proportion of learners in the age categories 35–39 (50%) and 45–49
(55%) who did not gain employment was slightly higher than in the other age categories.
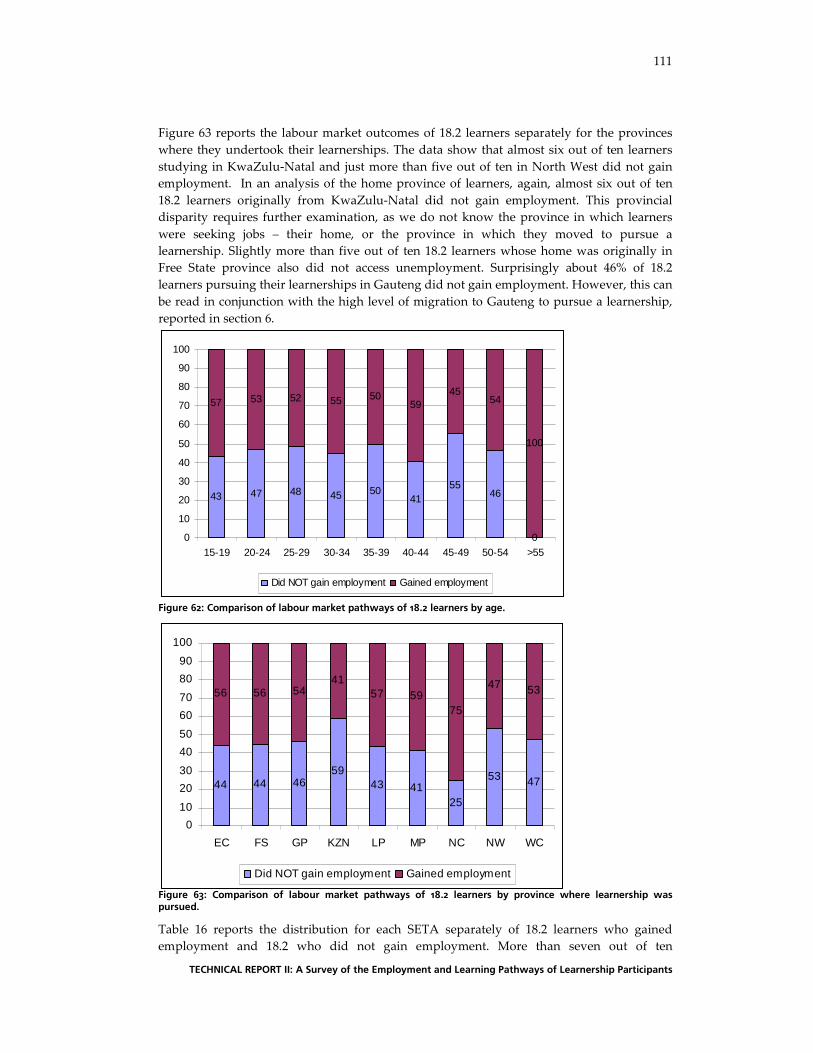
TECHNICAL REPORT II: A Survey of the Employment and Learning Pathways of Learnership Participants
111
Figure 63 reports the labour market outcomes of 18.2 learners separately for the provinces
where they undertook their learnerships. The data show that almost six out of ten learners
studying in KwaZulu-Natal and just more than five out of ten in North West did not gain
employment. In an analysis of the home province of learners, again, almost six out of ten
18.2 learners originally from KwaZulu-Natal did not gain employment. This provincial
disparity requires further examination, as we do not know the province in which learners
were seeking jobs – their home, or the province in which they moved to pursue a
learnership. Slightly more than five out of ten 18.2 learners whose home was originally in
Free State province also did not access unemployment. Surprisingly about 46% of 18.2
learners pursuing their learnerships in Gauteng did not gain employment. However, this can
be read in conjunction with the high level of migration to Gauteng to pursue a learnership,
reported in section 6.
Figure 62: Comparison of labour market pathways of 18.2 learners by age.
Figure 63: Comparison of labour market pathways of 18.2 learners by province where learnership was pursued.
Table 16 reports the distribution for each SETA separately of 18.2 learners who gained
employment and 18.2 who did not gain employment. More than seven out of ten
44 44 4659
43 4125
53 47
56 56 5441
57 5975
47 53
0
10
20
30
40
50
60
70
80
90
100
EC FS GP KZN LP MP NC NW WC
Did NOT gain employment Gained employment
43 47 48 45 5041
5546
0
57 53 52 55 5059
4554
100
0
10
20
30
40
50
60
70
80
90
100
15-19 20-24 25-29 30-34 35-39 40-44 45-49 50-54 >55
Did NOT gain employment Gained employment

Employment and Learning Pathways of Learnership Participants in the NSDS Phase II
112
unemployed learners who accessed employment enrolled for learnership programmes that
fall under BankSETA, INSETA, CHIETA, FASSET and SASETA. More than seven out of ten
unemployed learners who did not access employment enrolled for learnership programmes
that fall under CETA and MAPP. Taking into account those who are on a learnerships
pathway of extended duration (such as FASSET and BankSETA programmes), this
distinction points to a combination of the quality of programmes provided by these SETAs
and their labour market relevance.
Table 16: Unemployed (18.2) learners who gained employment versus learners who did not.
Number of learners Percenatge distribution SETA
Employed Unemployed Total SETA
Employed Unemployed Total
AgriSETA 749 1,409 2,158 AgriSETA 35 65 100
BankSETA 976 228 1,204 BankSETA 81 19 100
CETA 562 2,550 3,112 CETA 18 82 100
CHIETA 721 197 918 CHIETA 79 21 100
CTFL SETA 160 216 376 CTFL SETA 43 57 100
ESETA 371 580 951 ESETA 39 61 100
ETDP SETA 133 160 293 ETDP SETA 46 54 100
FASSET 126 44 170 FASSET 74 26 100
FIETA 105 135 241 FIETA 44 56 100
FoodBev 715 463 1,178 FoodBev 61 39 100
HWSETA 724 1,173 1,897 HWSETA 38 62 100
INSETA 360 88 448 INSETA 80 20 100
LGSETA 1,031 475 1,507 LGSETA 68 32 100
MAPPP 22 61 82 MAPPP 26 74 100
MerSETA 971 1,381 2,352 MerSETA 41 59 100
MQA 1,033 497 1,530 MQA 67 33 100
SASETA 3,873 1,518 5,391 SASETA 72 28 100
SERVICES 297 178 474 SERVICES 63 37 100
TETA 274 246 520 TETA 53 47 100
W&RSETA 332 434 766 W&RSETA 43 57 100
Total 13,536 12,033 25,569 Total 53 47 100
Figure 64 shows that almost two thirds (64%) of the 18.2 learners who did not gain
employment terminated their learnership training compared to 36% of the group that gained
employment. This shows that the ‘pathway of termination’ leads to an ongoing ‘pathway of
unemployment’ for 18.2 learners.
Reasons why they did not gain employment
These learners were asked to provide their perceptions of the reasons why they did not gain
employment. More than three quarters (77%) reported that they did not gain sufficient work
experience during their training. They claim that this may strongly contribute to lack of
success in finding employment. The same proportion of learners also claimed that they need
more training in the field for which they initially enrolled. Almost half of them (47%) felt
that employers are not really interested in future employees with learnership qualifications.
About a third (31%) proposed that they need totally different training, because of the lack of
employment opportunities in the field they initially chose.
In summary, it appears that the 18.2 learner who is more likely not to access employment is
African, female, pursuing a learnership at a low-skills level, located in specific sectors such
as construction, studying in specific provinces and having terminated the learnership.

TECHNICAL REPORT II: A Survey of the Employment and Learning Pathways of Learnership Participants
113
36%
64%
57%
43%
0
10
20
30
40
50
60
70
80
90
100
Did NOT gain employment Gained employment
Terminated Completed
Figure 64: Comparison of labour market pathways of 18.2 learners by completion status.
8.5 Learners employed at enrolment (18.1) who remain employed
This section describes the 9 954 learners who were employed at enrolment, either completed
or terminated their studies and who stayed in employment thereafter. Of this group, 84%
completed their learnerships while the rest (16%) terminated. In spite of the remarks of this
group of learners during in-depth interviews that it is difficult to balance studies with work
demands, a higher number did complete their learnerships.
The data show that 42% of the learners who were employed at enrolment and remained
employed fell under SERVICES SETA, MerSETA and HWSETA.
More than three quarters (76%) indicated that they are employed at the same company at
which they were employed prior to the learnership. About a quarter (24%) left that company
and found a job at another company.
Salary information provided by learners shows that the salaries of 12% of learners who
completed their learnership increased compared to 8% of those who terminated. Analysis of
individuals working for the same employer as prior to completion or termination of the
learnership shows little change in contract type.
8.6 Learners employed at enrolment (18.1) who are now unemployed
An unexpected trend was that 1 905 learners who were employed at enrolment, either
completed or terminated their studies, became unemployed afterwards. The question is
again, who are they in comparison with those who remained in employment and what are
the reasons that they are now unemployed?
Who are they?
A comparison between these two groups of learners for the race groups separately shows
that just more than one out of five African (49%) 18.1 learners are not employed anymore
compared to lower figures for Indian, white and coloured learners ( (Figure 65). In terms of
gender the data revealed that the proportion of male and female 18.1 learners who are not
employed anymore is the same (16% each).

Employment and Learning Pathways of Learnership Participants in the NSDS Phase II
114
1 6%12%21%
94%99%88%
79%
0
10
20
30
40
50
60
70
80
90
100
African Coloured Indian White
Not employed anymore Still employed
Figure 65: Comparison of labour market pathways of 18.1 learners by race.
The question remains, at what NQF levels did this group enrol for learnerships and in which
sectors (SETAs)? It is clear that one out of five of 18.1 learners who enrol for a learnership at
the low-skills level are not employed anymore, compared to lower percentages for the other
skills levels, suggesting that employment at low-skills levels is more precarious. However, it
is interesting to note that almost a tenth (9%) of the high-skills level group for 18.1 learners
were not employed at the time of the study. This needs further investigation (Figure 66).
9%6%20%
91%94%80%
0
10
20
30
40
50
60
70
80
90
100
Low level Intermediate level High level
Not employed anymore Still employed
Figure 66: Comparison of labour market pathways of 18.1 learners by skills level of learnership.
In terms of SETAs, Figure 67 shows that FASSET, FoodBev, LGSETA and MAPPP did not
have any 18.1 learners who are now unemployed. The data further show that 58% of CETA’s
18.1 learners are not employed after completion or termination of their learnerships. This
trend raises again the question about the nature of work in the construction industry as
mentioned earlier.

TECHNICAL REPORT II: A Survey of the Employment and Learning Pathways of Learnership Participants
115
0
10
20
30
40
50
60
70
80
90
100
AG
RIS
ET
A
BA
NK
SE
TA
CE
TA
CH
IET
A
CT
FL
SE
TA
ES
ET
A
ET
DP
SE
TA
FA
SS
ET
FIE
TA
FO
OD
BE
V
HW
SE
TA
INS
ET
A
LGS
ET
A
MA
PP
P
ME
RS
ET
A
MQ
A
SA
SE
TA
SE
RV
ICE
S
TE
TA
W&
RS
ET
A
Not employed anymore Still employed
Figure 67: Comparison of labour market pathways of 18.1 learners by SETA.
If age is taken into consideration, Figure 68 shows that it is pertinent. The data displays that
proportionally there are a higher percentage of 18.1 learners in the older age categories who
are no longer employed.
Three quarters (66%) of this group of 18.1 learners who are not employed anymore
completed their learnerships, while a third terminated. These learners were asked what their
future plans were. Almost two thirds (61%) indicated that they are considering self-
employment options and almost three quarters (71%) indicated a desire to enrol for further
training.
0
10
20
30
40
50
60
70
80
90
100
15-19 20-24 25-29 30-34 35-39 40-44 45-49 50-54 >55
Not employed anymore Still employed
Figure 68: Comparison of labour market pathways of 18.1 learners by age.
In summary, it appears that the 18.1 learner who is more likely to have lost their
employment despite the learnership is older, African, and probably pursuing a learnership
at a low-skills level in specific sectors such as construction, once again.

Employment and Learning Pathways of Learnership Participants in the NSDS Phase II
116
8.7 The pathway of further training
Table 17 reveals that a very small group of learners (1 617) were pursuing post-learnership
further studies at the time of the survey. One of the reasons for these low figures may be the
fact that the survey was conducted in the second year of NSDS Phase II. Learners may only
plan to enrol for further studies some time after completion or termination.
Table 17: Pathway of training for different labour market pathways.
Labour market pathway Total Completed Terminated
N % N % N %
1. Employment to Employment 9,954 8,361 1,465
Have you pursued further training other than learnerships? 553 6 403 5 139 9
2. Employment to Unemployment 1,905 1,252 635
Have you pursued further training other than learnerships? 131 7 114 9 17 3
3 Unemployment to Employment 13,536 11,799 1,669
Have you pursued further training other than learnerships? 448 3 324 3 114 7
4 Unemployment to Unemployment 12,033 8,912 2,968
Have you pursued further training other than learnerships? 485 4 332 4 146 5
Total 1,617 1,172 415
The data shows for example, that only 4% of the group on a labour market pathway of
‘unemployment to unemployment’ indicated that they were busy with further training, and
only 7% of the group on a labour market pathway of ‘employment to unemployment’. One
would expect of both these groups that further or other training would be an option to better
their opportunities.
8.8 Learner self-reported perspectives on the impact of the learnerships
Learners were asked to indicate the impact of learnerships on their lives. The results for
learners on different pathways are reported in Table 18. The learners who completed and
moved from unemployment to employment were the most positive about their learnership
experience, as can be expected. The strongest impact seems to be the improvement of their
career opportunities and enhancement of their self-confidence.
Interestingly enough, this was also identified by the learners who remained unemployed.
Although they did not gain employment after the learnership, they perceived it had an
impact on enhancing their self-confidence and on improving their career opportunities. This
was confirmed through in-depth interviews. Some of the learners revealed that they
experienced an enhancement of self-confidence during the workplace training component.
They indicated that during this phase they learned to do things in practice which helped to
regain and build their self-confidence. In terms of impact this is a positive outcome. It relates
to the training opportunity afforded, which gave them the chance to obtain a form of
workplace experience that provided them with certain skills they could use.
The learners who remained in employment reported that the strongest impact was the
improvement of their technical skills.

TECHNICAL REPORT II: A Survey of the Employment and Learning Pathways of Learnership Participants
117
Table 18: Impact of learnerships.
Employed–Unemployed Impact question
Completed Terminated Total Improve your technical skills? 83% 42% 70%
Improve your career opportunities? 70% 37% 59%
Enhanced your self-confidence? 64% 32% 53%
Unemployed – Employed Impact question
Completed Terminated Total Lead to an increase in your earning capacity? 66% 44% 63%
Improve your technical skills? 79% 60% 76%
Improve your career opportunities? 97% 79% 95%
Enhanced your self-confidence? 95% 73% 92%
Unemployed – Unemployed Impact question
Completed Terminated Total Improve your technical skills? 71% 37% 63%
Improve your career opportunities? 87% 42% 76%
Enhanced your self-confidence? 81% 38% 70%


![[title] 2018 Webinar Series - National Career Pathways Network · 4/23/2018 · Pathways Network. 2018 Webinar Series. Promising Apprenticeship Models: ... • 12.2% of participants](https://img.pdfslide.net/doc/110x75/5f5cd124668b1d71ee0ba850/title-2018-webinar-series-national-career-pathways-network-4232018-pathways.jpg)