Embed Size (px)
Citation preview
Serial No. R. 990
UNITED STATES DEPARTMENT OF LABORFrances Perkins, Secretary
BUREAU OF LABOR STATISTICSIsador Lubin, Commissioner
*++++###+»»+?
EMPLOYMENT
AND PAY ROLLSPrepared by
DIVISION OF EMPLOYMENT STATISTICS
Lewis E. Talbert, Chief
-and
DIVISION OF CONSTRUCTION AND
PUBLIC EMPLOYMENT
Herman B. Byer, Chief
JULY 1939
UNITED STATES GOVERNMENT PRINTING OFFICE • WASHINGTON • 1939
Digitized for FRASER http://fraser.stlouisfed.org/ Federal Reserve Bank of St. Louis

CONTENTS
PageSummary of employment reports for July 1939:
Total nonagricultural employment 1Industrial and business employment 1Public employment 5
Detailed tables for July 1939:Industrial and business employment 7Public employment 22.
Tables
SUMMARY
TABLE 1.—All manufacturing industries combined and nonmanufacturingindustries—employment, pay rolls, and weekly earnings,July 1939 "_ 4
TABLE 2.—Federal employment and pay rolls—summary, July 1939 6
INDUSTRIAL AND BUSINESS EMPLOYMENT
TABLE 3.—Manufacturing and nonmanufacturing industries—employ-ment, pay rolls, hours, and earnings, July 1939 8
TABLE 4.—Manufacturing and nonmanufacturing industries—employ-ment, pay rolls, hours, and earnings, May through July1939 *_ 12
TABLE 5.—Manufacturing and nonmanufacturing industries—indexes ofemployment and pay rolls, July 1938 through July 1939 17
TABLE 6.—Geographic divisions and States—comparison of employmentand pay rolls in identical establishments in June and July1939 19
TABLE 7.—Principal metropolitan areas—comparison of employment andpay rolls in identical establishments in June and July 1939_ _ 21
PUBLIC EMPLOYMENT
TABLE 8.—Executive service of the Federal Government—employmentand pay rolls in June and July 1939 22
TABLE 9.—Construction projects financed by Public Works Administra-tion funds—employment, pay rolls, and man-hours worked,July 1939, by type of project 23
TABLE 10.—Housing projects of the U. S. Housing Authority—employ-ment, pay rolls, and man-hours worked, July 1939, bygeographic division 26
TABLE 11.—Projects financed by the Work Projects Administration—employment, pay rolls, and man-hours worked, July 1939,by t.ype of project 27
(in)
Digitized for FRASER http://fraser.stlouisfed.org/ Federal Reserve Bank of St. Louis
IV
TABLE 12.—Employment and pay rolls on projects operated by the WorksProgress Administration, by type of project, for the secondquarter of 1939 28
TABLE 13.—National Youth Administration work projects and StudentAid—employment, pay rolls, and man-hours worked frombeginning of the program 28
TABLE 14.—Civilian Conservation Corps—employment and pay rolls,June and July 1939 29
TABLE 15.—Construction projects financed by the Reconstruction FinanceCorporation—employment, pay rolls, and man-hoursworked, July 1939, by type of project 29
TABLE 16.—Construction projects financed from regular Federal appro-priations—employment, pay rolls, and man-hours worked,July 1939, by type of project 30
TABLE 17.—Construction and maintenance of State roads—emploj^mentand pay-roll disbursements, July 1939, June 1939, and July1938— 31
Digitized for FRASER http://fraser.stlouisfed.org/ Federal Reserve Bank of St. Louis
Employment and Pay Rolls
SUMMARY OF REPORTS FOR JULY 1939
Total Nonagricultural Employment
AGGREGATE employment in nonagricultural industries in July-showed virtually no change from the preceding month's level althoughthe experience of individual industries differed widely. The net de-crease of 30,000 workers was due largely to the seasonal decline inretail trade, which was less than the average July decrease reportedfor the past 10 years. Several of the service industries also showedseasonal employment recessions and anthracite and metal minesreported decreased employment. These losses wTere offset to a largeextent by employment gains in construction, transportation, andpublic utilities. The declines in manufacturing and wholesale tradewere negligible. Comparisons of total nonagricultural employmentin July 1939 with July 1938 showed an increase of approximately1,200,000 workers over the year interval.
These figures do not include emergency employment which de-creased 280,300 in July. Decreases of 294,700 on projects operatedby the Work Projects Administration and 5,300 on work projects ofthe National Youth Administration were partly offset by an increaseof 19,700 in the Civilian Conservation Corps.
Industrial and Business Employment
Employment gains from June to July were reported for 50 of the 87manufacturing industries surveyed monthly by the Bureau of LaborStatistics and for 8 of the 16 nonmanufacturing industries covered.Pay rolls were larger for 34 of the manufacturing and 5 of the non-manu fa cturing in du stries.
The over-all declines of 0.1 percent or 8,000 wage earners in manu-facturing employment and 2.3 percent or $3,800,000 in weekly factorywage disbursements were smaller than the usual decreases for thismonth of 0.2 percent and 3.7 percent, respectively. Factory employ-ment in July 1939 was 10.5 percent above the level of a year ago andcorresponding pay rolls were 18.8 percent higher than a year ago.
(1)
Digitized for FRASER http://fraser.stlouisfed.org/ Federal Reserve Bank of St. Louis
Most of the employment gains over the month interval in the manu-facturing industries were contraseasonal or larger than .seasonal.Among the industries showing such increases were men's clothing(8,500 workers), cotton goods (7,000 workers), book and job printing(3,600 workers), woolen and worsted goods (2,900 workers), aircraft(2,700 workers), radios and phonographs (2,600 workers), dyeing andfinishing textiles (2,300 workers), furniture (2,200 workers), meatpacking (1,700 workers), cane sugar refining (900 workers), petroleumrefining (800 workers), structural metalwork (800 workers), andmachine tools (700 workers).
Gains of about seasonal proportions were shown in the followingmanufacturing industries: canning (40,000 workers), shoes (13,C00workers), rayon and allied products (1,700 workers), silk and rayongoods (1,600 workers), and flour (1,000 workers).
Seasonal employment losses were reported by firms manufacturingwomen's clothing (17,3C0 workers), millinery (3,300 workers), glass(1,700 workers), steel (1,600 workers), pottery (1,300 workers),confectionery (1,100 workers), and stamped and enameled ware(1,100 workers).
Firms manufacturing rubber footwear reported a contraseasonaldecline (2,800 workers), while larger than seasonal recessions werereported by establishments manufacturing automobiles, bodies, andparts (65,300 workers), agricultural implements (2,500 workers),wirework (2,200 workers), and electric- and steam-railroad cars (1,800workers). The decline in the automobile industry was due in part tostrikes in certain key plants.
The employment gain of 7.4 percent in aircraft factories continuedthe unbroken series of monthly increases, which began in October oflast year, and brought the employment level to nearly 2){ times the1929 figure. Employment in shipbuilding showed a slight decline inJuly following the uninterrupted succession of monthly increaseswhich began in September of last year. The employment level inJuly for this industry was still above the level of every month sinceApril 1923 except June 1939. The employment index for the machinetool industry was higher in July than in any month since February1938.
The employment decline of 3.2 percent or 108,500 workers in retailtrade was slightly less than the average mid-summer loss shown in thelast 10 years. The more important lines or groups under retail tradeshowing decreases were general merchandising, apparel, furniture,lumber and building materials, farmers'*supplies, and jewelry. Retaillines showing increases were coal-wood-ice, with an employmentgain of 4.2 percent, and hardware, automobiles and automobile sup-plies, and food, with gains of 0.6 percent or less each.
Wholesale trade establishments as a whole reported a slight loss innumber of workers in July as compared with the preceding month.
Digitized for FRASER http://fraser.stlouisfed.org/ Federal Reserve Bank of St. Louis
Decreases were reported by wholesalers of lumber and buildingmaterials, farm products, and automobiles and automobile supplies.Gains w ere registered by dealers in groceries and food products;petroleum products; machinery, equipment, and supplies; and drygoods and apparel.
A contraseasonal employment increase of 1.8 percent in bituminous-coal mining was coupled with a pay-roll decrease of 2.8 percent becauseof generally decreased production and shut-downs for the July 4 holi-day. Quarries and oil wells increased their forces slightly, whileanthracite operators reduced the number of their workers somewhatmore than seasonally (12.1 percent). Employment in metal minesfell off 2.0 percent. On the other hand, public utilities increased thenumber of workers on their rolls slightly, while the seasonal gain of1.3 percent in laundries brought the employment level for this industryto the highest point since September 1937. Insurance firms reportedan increase of 0.8 percent in employment, but brokerage houses de-creased their personnel by 1.6 percent. Employment in hotels anddyeing and cleaning plants fell 2.8 percent and 3.2 percent, respectively.
Employment in private building construction showed an increase of4.5 percent from June to July, according to reports from 14,218builders and contractors employing 140,434 wage earners in July.Corresponding pay rolls increased 4.6 percent. Building employ-ment in the East North Central States increased 10.7 percent and inthe South Atlantic area 10.1 percent. All of the States in these tworegions shared in the increased employment except Delaware, whichshowed virtually no change. An increase in Connecticut of 7.6 per-cent offset slight decreases in the remaining five New England Statesand resulted in a gain of 0.6 percent for the New England group as awhole. The West North Central and Pacific divisions showed in-creases of 4.2 percent and 2.3 percent respectively, while the MiddleAtlantic area showed a gain of 1.7 percent, and the East South CentralStates an increase of 0.4 percent. Two geographic divisions, theWest South Central and the Mountain, registered decreases of 1.1percent and 1.0 percent, respectively. The reports on which thesefigures are based do not cover construction projects financed by theWorks Progress Administration, the Public Works Administration,and the Reconstruction Finance Corporation, or by regular appropria-tions of the Federal, State, or local governments.
A preliminary report of the Interstate Commerce Commissionshowed a gain since June of 1.0 percent persons in the numberemployed by class I railroads. The total number working in Julywas 1,002,135. Corresponding pay-roll figures were not availablewhen this report was prepared. For June they were $154,436,650,an increase of 2.4 percent over the $150,858,242 figure for May.
Hours and earnings.—The average hours worked per week by wageearners in manufacturing industries were 36.6 in July, a decrease of
Digitized for FRASER http://fraser.stlouisfed.org/ Federal Reserve Bank of St. Louis

1.5 percent since June. The average hourly earnings of these workerswere 64.3 cents, a decrease of 0.7 percent as compared with the pre-ceding month. Average weekly earnings of factory workers fell 2.2percent to $23.70.
Of the 14 nonmanufacturing industries for which man-hour dataare available, 3 showed increases in average hours worked per week,and 9 showed gains in average hourly earnings. Four of the sixteennonmanufacturing industries surveyed reported higher average weeklyearnings.
Employment and pay-roll indexes, and average weekly earnings inJuly 1939 for all manufacturing industries combined, for selected non-manufacturing industries, and for class I railroads, with percentage*changes over the month and year intervals are presented in table 1.
TABLE 1.—Employment, Pay Rolls, and Earnings in All Manufacturing IndustriesCombined and in Nonmanufacturing Industries, July 1939
Industry
Employment
I PercentageIndex change f rom-July1939 June July
1939 1938
Pay roll Average weekly earnings-
IndexJuly1939
Percentagechange from—
June1939
July1938
Averagein July
1939
Percentagechange from—
June1939
July1938
All manufacturing industriescombined *_ .-
Class I steam railroads 2
Coal mining:Anthracite 4__Bituminous 4
Metalliferous mining _Quarrying and nonmetallic
mining. _Crude-petroleum producingPublic utilities:
Telephone and telegraph. _.Electric light and power
and manufactured gasElectric-railroad and mo-
tor-bus operation andmaintenance _
Trade:WholesaleRetail
General merchandisingOther than general
merchandisingHotels (year-round) 7___Laundries 4
Dyeing and cleaning 4
BrokerageInsuranceBuilding construction.
(1928-25= 100)
90.5 - 0 . 1 +10.5
(1923-25•100)83.9 - 2 . 3 +18.8 $23. 70 -2.2
56.1
(1929=100)45.079.760.4
47.567.5
75.4
93.2
9.7
+1.0
- 1 2 . 1+1.8- 2 . 0
+.3+.7+.1
+1.0
- . 3 I
+7.8
+.9+1.5
+21.6
+7.7-6.7
+0.7
+1.1
- . 6
87.983.691.7
81.5SO. 2
100.0100.6(3)(3)(3)
- . 2- 3 . 2- 5 . 8
- 2 . 4- 2 . 8+1.3- 3 . 2- 1 . 6+.8
+4.5
+1.3+3.1+4.4+2.7
- . 5+2.2- 1 . 9- 7 . 2+1.2+8.9
(1929=100)25.364.647.8
40.862.4
94.6
100.1
70.8
75.970.983.8
68.279. 287.977.1
- 3 0 . 0- 2 . 8
- 1 1 . 2
- 2 . 1- . 1
+1.1- . 1
+()- 2 . 3- 4 . 9
- 1 . 6- 3 . 5+1.1-8 .4- 2 . 2+.2
+4.6
+25.1+13.8+25.7
+10.4- 6 . 5
4.2
+1.8
+2.6
+3.1+4.1+4.2
+3.9+2.3+6.0- . 6
-6.4+1.5
+14.3
18.6522.1125.11
21.6633.29
«31.06
«33.64
5 33.15
«29.975 21.58s 18.25
s 24.165 15. 05
17.9219.92
8 35. 525 34.38
30.85
- 2 0 . 4- 4 . 5- 9 . 4
-2.5
+•9- 1 . 2
- . 3
+.3+1.0+.9+.8- . 7- . 2
- 5 . 4—.6- . 6
-K6)
+23.9+12.1+3.3
+2.5+.2-
+3.4
+.8-
+3.1
+1.8+1.0'
- . 2
+1.2+2.8+3.7+1.3+.9'+.3
+4.4
i Revised indexes—Adjusted to 1935 Census of Manufactures.» Preliminary—Source: Interstate Commerce Commission.* Not available.4 Indexes adjusted to 1935 census. Comparable series back to January 1929 presented in January 1938
issue of this pamphlet.* Average weekly earnings not strictly comparable with figures published in issues of this pamphlet
dated earlier than April 1938, as they now exclude corporation officers, executives, and other employeeswhose duties are mainly supervisory.
6 Less than Ho of 1 percent.' Cash payments only; the additional value of board, room, and tips cannot be computed.
Digitized for FRASER http://fraser.stlouisfed.org/ Federal Reserve Bank of St. Louis
Public Employment
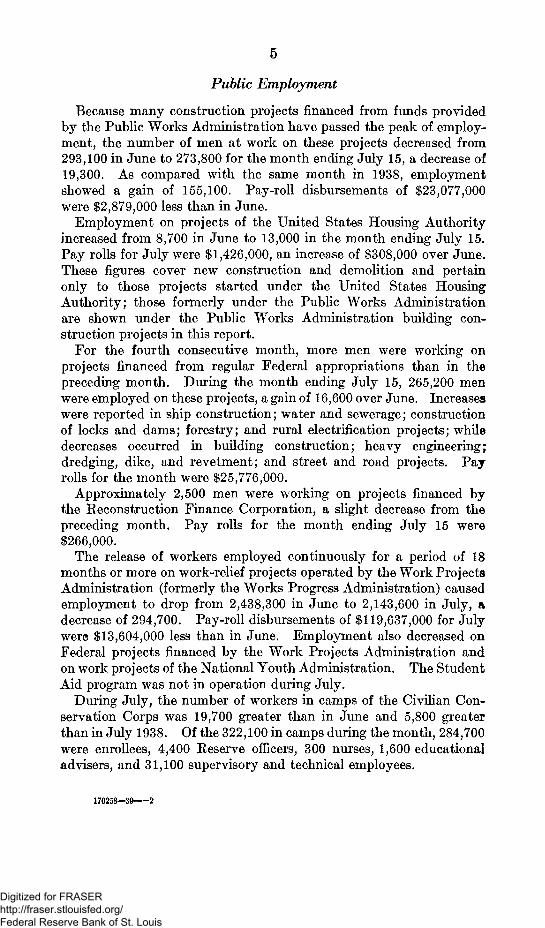
Because many construction projects financed from funds providedby the Public Works Administration have passed the peak of employ-ment, the number of men at work on these projects decreased from293,100 in June to 273,800 for the month ending July 15, a decrease of19,300. As compared with the same month in 1938, employmentshowed a gain of 155,100. Pay-roll disbursements of $23,077,000were $2,879,000 less than in June.
Employment on projects of the United States Housing Authorityincreased from 8,700 in June to 13,000 in the month ending July 15.Pay rolls for July were $1,426,000, an increase of $308,000 over June.These figures cover new construction and demolition and pertainonly to those projects started under the United States HousingAuthority; those formerly under the Public Works Administrationare shown under the Public Works Administration building con-struction projects in this report.
For the fourth consecutive month, more men were working onprojects financed from regular Federal appropriations than in thepreceding month. During the month ending July 15, 265,200 menwere employed on these projects, a gain of 16,600 over June. Increaseswere reported in ship construction; water and sewerage; constructionof locks and dams; forestry; and rural electrification projects; whiledecreases occurred in building construction; heavy engineering;dredging, dike, and revetment; and street and road projects. Payrolls for the month were $25,776,000.
Approximately 2,500 men were working on projects financed bythe Reconstruction Finance Corporation, a slight decrease from thepreceding month. Pay rolls for the month ending July 15 were$266,000.
The release of workers employed continuously for a period of 18months or more on work-relief projects operated by the Work ProjectsAdministration (formerly the Works Progress Administration) causedemployment to drop from 2,438,300 in June to 2,143,600 in July, adecrease of 294,700. Pay-roll disbursements of $119,637,000 for Julywere $13,604,000 less than in June. Employment also decreased onFederal projects financed by the Work Projects Administration andon work projects of the National Youth Administration. The StudentAid program was not in operation during July.
During July, the number of workers in camps of the Civilian Con-servation Corps was 19,700 greater than in June and 5,800 greaterthan in July 1938. Of the 322,100 in camps during the month, 284,700were enrollees, 4,400 Reserve officers, 300 nurses, 1,600 educationaladvisers, and 31,100 supervisory and technical employees.
176258-39 2
Digitized for FRASER http://fraser.stlouisfed.org/ Federal Reserve Bank of St. Louis
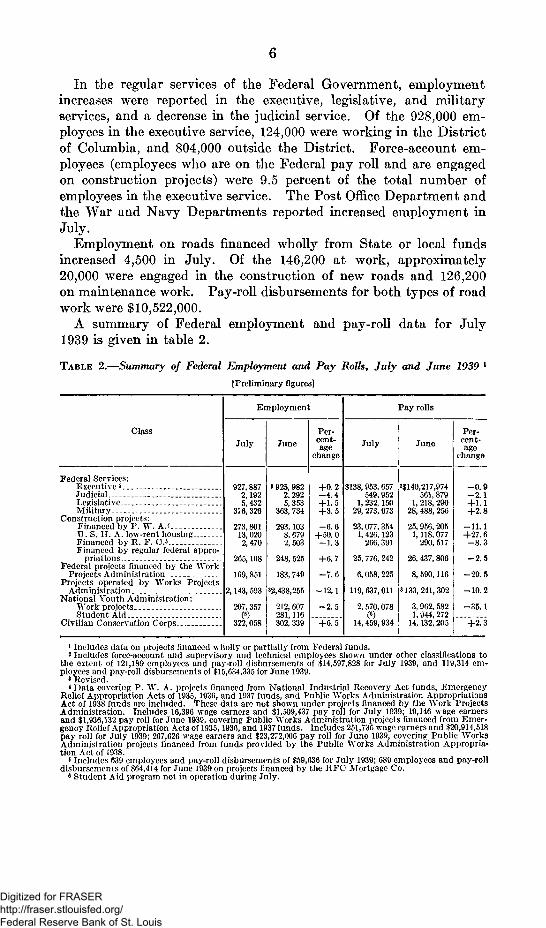
In the regular services of the Federal Government, employmentincreases were reported in the executive, legislative, and militaryservices, and a decrease in the judicial service. Of the 928,000 em-ployees in the executive service, 124,000 were working in the Districtof Columbia, and 804,000 outside the District. Force-account em-ployees (employees who are on the Federal pay roll and are engagedon construction projects) were 9.5 percent of the total number ofemployees in the executive service. The Post Office Department andthe War and Navy Departments reported increased employment inJuly-
Employment on roads financed wholly from State or local fundsincreased 4,500 in July. Of the 146,200 at work, approximately20,000 were engaged in the construction of new roads and 126,200on maintenance work. Pay-roll disbursements for both types of roadwork were $10,522,000.
A summary of Federal employment and pay-roll data for July1939 is given in table 2.
TABLE 2.—Summary of Federal Employment and Pay Rolls, July and June 1939[Preliminary figures]
Class
Federal Services:Executive2
JudicialLegislativeMilitary
Construction projects:Financed by P. W. A.*U. S. II. A. low-rent housingFinanced by R. F. O.sFinanced by regular federal appro-
priationsFederal projects financed by the "Work
Projects AdministrationProjects operated by Works Projects
AdministrationNational Youth Administration:
Work projectsStudent Aid ...
Civilian Conservation Corps
Employment
July
927, 8872,1925,432
376, 326
273,80113, 0202,470
265,168
169, 851
2,143,593
207, 357(6)
322,058
June
3 925, 9822.2925, 353
363, 734
293,1038, 6792,503
248, 525
183, 749
»2,438,255
212,607281,316302, 339
Per-cent-age
change
+0.2- 4 . 4+1.5+3.5
+50.0- 1 . 3
+6.7
- 1 2 . 1
- 2 . 5
Pay rolls
July June
$138, 953, 657549, 952
1, 232, 15029, 273, 973
23,077, 3541, 426, 123
266, 391
25, 776, 242
6,058, 225
119,637,011
2, 570,078(6)
14, 459,934
3$14O,217,974561,879
1, 218, 29028, 488, 256
25, 956, 2051,118,077
290,517
26,437,806
8,590,116
133,241,302
3, 962. 5821,944,272
14,132,205
Per-cent-age
change
- 0 . 9- 2 . 1+1.1+2.8
-11.1+27. 6
- 8 . 3
- 2 . 5
-29.5
-10.2
-35.1
1 Includes data on projects financed wholly or partially from Federal funds.2 Includes force-account and supervisory and technical employees shown under other classifications to
the extent of 121,189 employees and pay-roll disbursements of $14,597,828 for July 1939, and 119,314 em-ployees and pay-roll disbursements of $15,634,335 for June 1939.
3 Revised.* Data covering P. W. A. projects financed from National Industrial Recovery Act funds, Emergency
Relief Appropriation Acts of 1935, 1936, and 1937 funds, and Public Works Administration AppropriationsAct of 1938 funds arc included. These data are not shown under projects financed by the Work ProjectsAdministration. Includes 16,396 wage earners and $1,509,437 pay roll for July 1939; 19,146 wage earnersand $1,936,132 pay roll for June 1939, covering Public Works Administration projects financed from Emer-gency Relief Appropriation Acts of 1935,1936, and 1937 funds. Includes 251,735 wage earners and $20,914,518pay roll for July 1939: 267,626 wage earners and $23,272,006 pay roll for June 1939, covering Public WorksAdministration projects financed from funds provided by the Public Works Administration Appropria-tion Act of 1938.
«Includes 639 employees and pay-roll disbursements of $59,636 for July 1939; 6S9 employees and pay-rolldisbursements of $64,41.4 for June 1939 on projects financed by the RFC Mortgage Co.
6 Student Aid program not in operation during July.
Digitized for FRASER http://fraser.stlouisfed.org/ Federal Reserve Bank of St. Louis
DETAILED TABLES FOR JULY 1939
Industrial and Business Employment
MONTHLY reports on employment and pay rolls are available for thefollowing groups: 87 manufacturing industries; 16 nonmanufacturingindustries, including private building construction; and class I steamrailroads. The reports for the first two of these groups—manufactur-ing and nonmanufacturing—are based on sample surveys by the Bu-reau of Labor Statistics. The figures on class I steam railroads arecompiled by the Interstate Commerce Commission and are presentedin the foregoing summary.
EMPLOYMENT, PAY ROLLS, HOURS, AND EARNINGS
The indexes of employment and pay rolls as well as average hoursworked per week, average hourly earnings, and average weeklyearnings in manufacturing and nonmanufacturing industries in July1939 are shown in table 3. Percentage changes from June 1939 andJuly 1938 are also given.
Employment and pay-roll indexes, as well as average hours workedper week, average hourly earnings, and average weekly earnings forMay, June, and July 1939, where available, are presented in table 4.The May and June figures, where given, may differ in some instancesfrom those previously published, because of revisions necessitatedprimarily by the inclusion of late reports.
The average weekly earnings shown in tables 3 and 4 are computedby dividing the total weekly pay rolls in the reporting establishmentsby the total number of full- and part-time employees reported. Asnot all reporting establishments supply man-hours, averge hoursworked per week and average hourly earnings are necessarily based ondata furnished by a smaller number of reporting firms. The size andcomposition of the reporting sample varies slightly from month tomonth. Therefore the average hours per week, average hourlyearnings, and average weekly earnings shown are not strictly com-parable from month to month. The sample, however, is believed tobe sufficiently adequate in virtually all instances to indicate thegeneral movement of earnings and hours over the period shown.The changes from the preceding month, expressed as percentages,are based on identical lists of firms for the 2 months, but the changesfrom July 1938 are computed from chain indexes based on the month-to-month percentage changes.
Digitized for FRASER http://fraser.stlouisfed.org/ Federal Reserve Bank of St. Louis
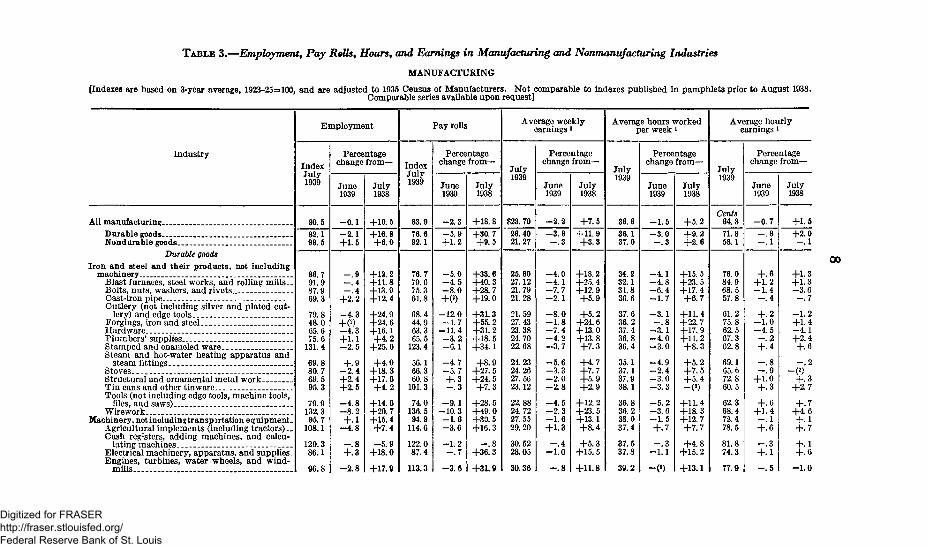
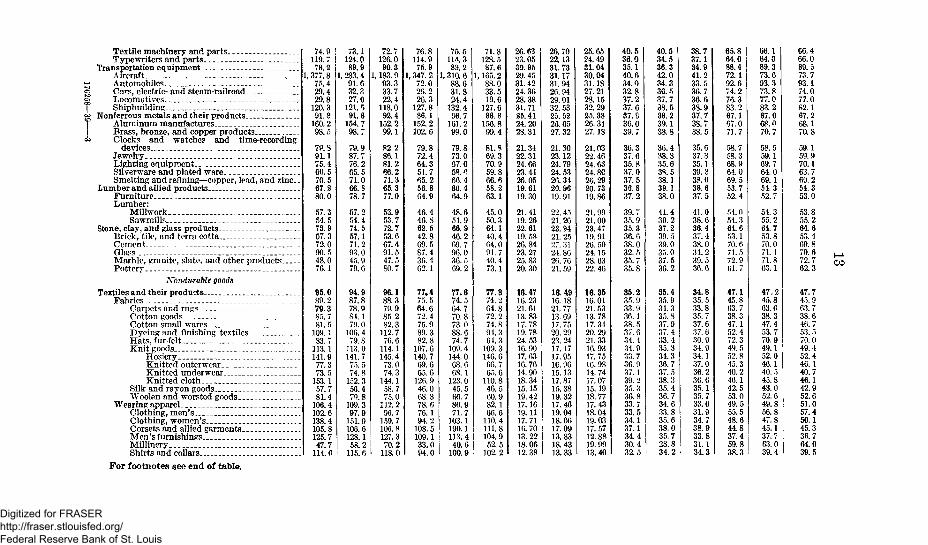
TABLE 3.—Employment, Pay Rolls, Hours, and Earnings in Manufacturing and Nonmanufacturing Industries
MANUFACTURING
[Indexes are based on 3-year average, 1923-25=100,
Industry-
All manufacturing _ _Durable goodsNondurable goods
Durable goodsIron and steel and their products, not including
machineryBlast furnaces, steel works, and rolling mills. _Bolts, nuts, washers, and rivetsCast-iron pipeCutlery (not including silver and plated cut-
lery) and edge toolsForcings, iron and steelHardwarePlumbers' suppliesStamped and enameled wareSteam and hot-water heating apparatus and
steam fittingsStovesStructural and ornamental metal workTin cans and other tinware...Tools (not including edge tools, machine tools,
files, and saws) _ _ _Wirework _ _ _. _
Machinery, not includingtranspartation equipment.Agricultural implements (including tractors)..Cash registers, adding machines, and calcu-
lating machinesElectrical machinery, apparatus, and supplies.Engines, turbines, water wheels, and wind-
mills
and are adjusted to 1935 Census of Manufacturers. Not comparable to indexes published in pamphlets prior to August 1938.Comparable series available upon request]
Employment
IndexJuly1939
90.582.198.5
86 791.987.969.3
79 848.065.675.6
131.4
69.880.769.595.3
79.9132.395.7
108.1
129.386.1
06.8
Percentagechange from—
June1939
- 0 . 1
- 2 . 1+1.5
— 9- . 4- . 4
+2.2
- 4 . 3+ (2)- 4 . 3+1.1- 2 . 5
+.9- 2 . 4+2.4+2.5
-4.8- 8 . 2+.1
- 4 . 8
- . 8+.3
- 2 . 8
July1938
+10.5+18.8+6.0
+13 2+11.8+13. 9+12.4
+24.9+24.6+16.1+4.2
+25.0+4.0
+18.3+17.6+4.2
+14.6+20.7+15.4+7.4
- 5 . 9+18.0
+17.9
IndexJuly1939
83.976.692.1
76 779.075.361.8
68.444.963.365.5
123.4
56.166.360.8
101.3
74.0136.594.9
114.6
122.087.4
113.3
Pay rolls
Percentagechange from—
Juno1939
- 2 . 3- 5 . 9+1.2
- 5 . 0- 4 . 5- 8 . 0+(2)
-12.0- 1 . 7
-11.4- 3 . 2- 6 . 1
- 4 . 7- 5 . 7+.3- . 3
- 9 . 1-10.3- 1 . 6- 3 . 6
- 1 . 2- . 7
- 3 . 6
July1938
+18.8+30.7+9.5
+33.6+40.3+28.7+19.0
+31.3+55.2+31.2+ 18.5+34.1+8.9
+27.5+24.5+7.3
+28.5+49. 0+3D. 5+16.3
- . 8+36.3
+31.9
Average weeklyearnings l
July1939
$23. 7026.4021.27
25.8027.1221. 7921.28
21. 5927.4323.3824.7022.68
24.2324. 2627.5623.12
22.8824.7227.5529.20
30.5228.05
30.36
Percentagechange from—
June1939
- 2 . 2- 3 . 8- . 3
- 4 . 0—4. 1- 7 . 7- 2 . 1
- 8 . 0- 1 . 8- 7 . 4- 4 . 2- 3 . 7
- 5 . 6- 3 . 3- 2 . 0- 2 . 8
- 4 . 5- 2 . 3- 1 . 6+1.3
- . 4- 1 . 0
- . 8
July1938
+7.5+11.9+3.3
+18. 2+25. 4+12. 9+5.9
+5.2+24.6+13.0+13.8+7.3+4.7+7.7+5. 9+2.9
+12.2+23.5+13.1+8.4
+5.3+15.5
+11.8
Average hours workedper week *
July1939
36.636.137.0
34.232.131.836.6
37.636.237.436.836.4
35.137. 137.938.1
36.836.238.037.4
37.537.8
39.2
Percentagechange from—
June1939
- 1 . 5- 3 . 0- . 3
- 4 . 1- 4 . 8- 6 . 4- 1 . 7
—3.1- . 8
- 3 . 1- 4 . 0—3.0
- 4 . 9- 2 . 4- 3 . 0- 3 . 3
- 5 . 2- 3 . 6- 1 . 5
+.7- . 3
- 1 . 1
July1938
+5.2+9.2+2.6
+15.5+23.5+ 17.4+6.7
+11.4+22.7+17.9+11.2+8.3+5.2+7.5+5.4-(2)
+11.4+18.3+12.7+7.7
+4.8+15.2
+13.1
Average hourlyearningsl
July1939
Cents64.371.858.1
76.084.968.557.8
61.275.862.567.362.8
69.165.672.860.5
62.368.472.478.5
81.874.3
77.9
Percentagechange from—
June1939
- 0 . 7- . 8- . 1
+.6+1.2- 1 . 4
A
+.2- 1 . 0- 4 . 5
- . 2+.4- . 8- . 9
+1.0+.3+.6
+1.4
+.'o- . 3+.1
- . 5
July1938
+1.5+2.0
- . 1
+1.3+1.3- 3 . 6- . 7
- 1 . 2+1.4- 4 . 1+2.4+.6- . 2
- ( 2 )+.3
+2.7+.7
+4.6+.1+.7
+.1+.6
- 1 . 0
GO
Digitized for FRASER http://fraser.stlouisfed.org/ Federal Reserve Bank of St. Louis
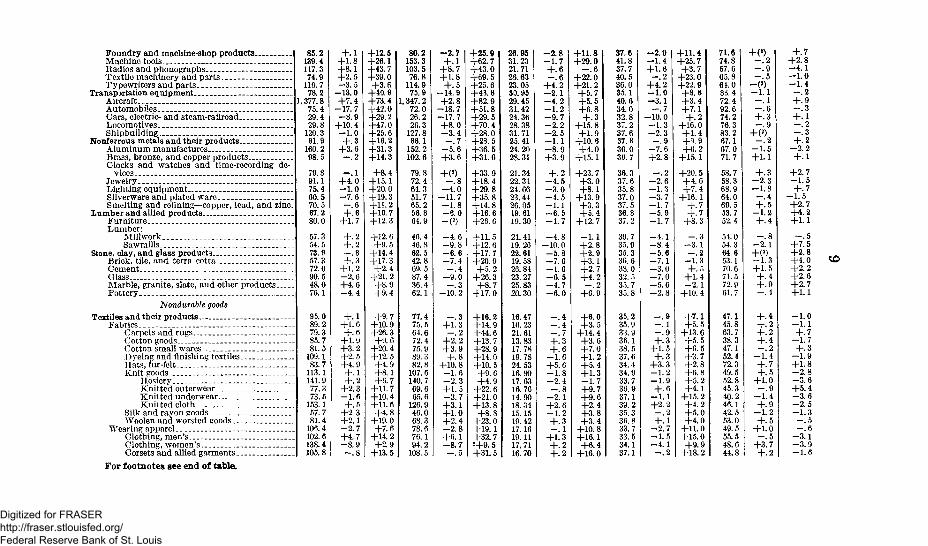
Foundry and machine-shop products, _Machine toolsRadios and phonographsTextile machinery and partsTypewriters and parts
Transportation equipmentAircraftAutomobilesCars, electric- and steam-railroadLocomotivesShipbuilding
Nonferrous metals and their productsAluminum manufacturesBrass, bronze, and copper productsClocks and watches and time-recording de-
vicesJewelryLighting equipmentSilverware and plated wareSmelting and refining—copper, lead, and zinc.
Lumber and allied products. . .FurnitureLumber:
MillworkSawmills
Stone, clay, and glass productsBrick, tile, and terra cottaCementGlassMarble, granite, slate, and other productsPottery
Nondurable goods
Textiles and their productsFabrics
Cnrpcts and rugsCotton goodsCotton small waresDyeing and finishing textilesHats, fur-feltKnit goods
HosieryKnitted outerwearKnit ted underwearKnitted cloth
Silk and rayon goodsWoolen and worsted goods
"Wearing apparelClothing, men'sClothing, women'sCorsets and allied garments
85.2139.4117.374.9
119.778.2
, 377.875.429.429.8
120.391.9
160. 298.5
79.891.175.460.570.567.280.0
57.354.573.957. 372.090.548.076.1
95.089.279.385.781.5
109.183.7
113.1141.977.373.5
153.157.781.4
100. 4102. 6138. 4105.8
+.1+1.8+8.1+2.5- 3 . 5
-13 .0+7.4
-17 .7- 8 . 9
+10.4- 1 . 0+.3
+3.6- . 2
- . 1+4.0- 1 . 0- 7 . 6
- . 6+.6
+1.7+.2+.2- . 8+.3
+1.2- 2 . 6+4.6- 4 . 4
+.1+ 1.6+.6
+ 1.9+3.2+2. 5+4.9+.1+.2
+2.3- 1 . 6+.5
+2.3+2.1- 2 . 7+4.7- 8 . 9
- . 8
+12.5+26.1+43.7+39.0+3.6
+40.9+73.4+42.0+29.2+47.0+25.6+16.2+31.3+14.3
+8.4+15.1+20.0+19.3+11.2+10.7+-12. 3
+12. 6+9. 5
+14.4+17.3+2.4
+21.2+8.9+ 9.4
+9.7+10.9+26. 3+9. 6
+20. 4+12. 5+4.9+8.1+6.7
+11.7+10.4+11.6+4.8
+19.0+7.6
+14.2+2.9
+13.5
80.2153.3103.576.8
114.975.9
1,347.272.026.226.3
127.883.1
152. 2102.6
79.872.464.351.765.258.864.9
46.446. 862.542.869.587.436.462.1
77.475.564.672.475. 989.382.8
107.6140.769.665. 6
126.946.068.378.676.194.2
108.5
-2.7+.1
+8.7+1.8+.5
-14 .9+2.8
-18 .7-17 .7+8.0- 3 . 4
- . 7- 5 . 6+3.6
+(2)- . 8
- 4 . 0-11 .7- 1 . 8- 6 . 0- (9- 4 . 0- 9 . 8- 6 . 6- 7 . 4
- . 4- 9 . 0
- . 3-10 .2
- . 3+1.3
- . 2+2.2+ 3.9+.8
+10. 8- 1 . 6- 2 . 3+1.5- 3 . 7+3.1+1.0+2.4- 2 . 8+6.1- 8 . 7- . 5
+25.9+62.7+43.0+69.5+25. 6+43.8+82.9+51.8+29.5+70.4+28.0+23.5+36. 5+31.6+33. 9+ 18.4+29.8+35. 8+ 14.8+16.6+26.6+11. 5+ 12.6+17.7+20. 9+5. 2
+26.3+8.7
+ 17.0
+16.2+ 14.9+ 14. 6+13.7+28.9+14. 0+10.5+9. 6+4.9
+22. 6+21.0+13.8+8.S
+23.0+19.1+32.72+9. 5+31.5
26.9531.2321.7126.6323.05SO. 9529.4531.4224.3628.3831.7125. 4124.2028.31
21.3422.3124.6623.4426. 0519.8119. 30
21.4119. 2622. 6119. 5826. 8t23.2725.8320.30
16.4716. 2321.6113. 8317.7819.7824.5316.9017. 6316.7614.9018.3415.1519.4217.1619.1117.7116.70
- 2 . 8- 1 . 7+.6—.6
+4.2- 2 . 1- 4 . 2- 1 . 2- 9 . 7- 2 . 2- 2 . 5- 1 . 1- 8 . 9+3.9+.2
- 4 . 5- 3 . 0- 4 . 5- 1 . 1- 6 . 5- 1 . 7
- 4 . 8-10 .0- 5 . 8- 7 . 6- 1 . 6- 6 . 5- 4 . 7- 6 . 0
- . 4- . 4- . 7+.3+.6
- 1 . 6+5.6- 1 . 8- 2 . 4
- . 8- 2 . 1+2.6- 1 . 2+.3- . 1
+1.3+.2+.2
+11.8+29.0
+22! 0+21.2+5.7+5.5+6.8+.3
+15. 8+1.9
+10.8+4.0
+15.1+23.7+3.0+8.1
+13. 9+3.3+5.4
+12.7- 1 . 1+2.8+2.9+3.1+2.7+4.2
+6.9
+6.0+3. 5
+14.4+3.6+7.0+1.2+5. 4+1.3- 1 . 7+9.7+9.6+2.4+3.8+3.4
+10.8+16.1+6.4
+16.0
37.641.837.740. 536.035.140.634. 032.837.237.6S7.836.039.7
36. 337.635.837.037.536.837.2
39.735.935.336.638.032. 535. 735.8
35.235. 933. 936.138.537.634. 434.933.736. 937.139. 235.336.833.733.534.137.1
- 2 . 9—1.4+1.6
- . 2+4.2- 1 . 0- 3 . 1
- . 7-10 .0- 1 . 3- 2 . 3
- . 9- 7 . 6+2.8
- . 2- 2 . 6- 1 . 3- 3 . 7- 1 . 7- 5 . 9- 1 . 7
—1.1- 8 . 4- 5 . 6- 7 . 1- 3 . 0- 7 . 0- 5 . 6- 2 . 8
- . 9- . 1- . 9+.3
+ 1.5+.3
+3.3- 1 . 2— 1.9+.6
- 1 . 1+2.2
- . 2+.1
- 2 . 7- 1 . 5—4.1
- . 2
+11.4+25.7+3.7
+23.0+22.9+8.6+3.4+7.1+.2
+ 16.0+1.4+9.9+0.2
+15.1+20.5+4.6+7.4
+16.1+.7+.7
+8.3- . 3
- 3 . 1- . 2
— 1.3+.5
+1.4- 2 . 1
+10.4
+7.1+5.5
+13. 6+5.5+6.5+3.7+2.8+6.8+5.2+4.1
+15.2+4.2+5.0+4.0
+11.0+15.0+9.9
+18.2
71.674.857.665.861.083.472,492.674.276.383. 267.167.071.7
58. 758.368.964.069.553.752.4
51.054. 364.653.170.671.572.961.7
47.145.863.73S.347.152.472.349.552.845.340.246.142.553.049.555.548.644.8
+(J)- . 2- . 9- . 5
- ( 2 )- 1 . 1- . 1—.6+.3- . 9
+(2)- . 2- 1 . 5
+1.1+.3
- 2 . 3- 1 . 8
—.4+.5
- 1 . 2+.4- . 8
- 2 . 1+00- 1 . 3+1.5+.4+.9- . 4
+.4+.2+.2+.4- . 2
- 1 . 4+.7+.5
+1.0- . 9
- 1 . 4+.9
- 1 . 2+.5
4-1.0- . 5
+3.7+.2
+.7+2.8- 4 . 1- 1 . 0- 1 . 4- . 2+.9- . 3+.1- . 2- . 3+.2
- 2 . 2+.1
+2.7- 1 . 5+.7
- 1 . 5+2.7+4.2+1.1-.5
+7.5+2.8+10+2.2+2.6+2.7+1.1
- 1 . 0- 1 . 1+.7
- 1 . 7+.3
- 1 . 9+1.8- 2 . 8- 3 . 6+5.4- 3 . 6- 2 . 5- 1 . 3
—. 5- . 6
- 3 . 1- 3 . 9- 1 . 6
For footnotes see end of table.
Digitized for FRASER http://fraser.stlouisfed.org/ Federal Reserve Bank of St. Louis
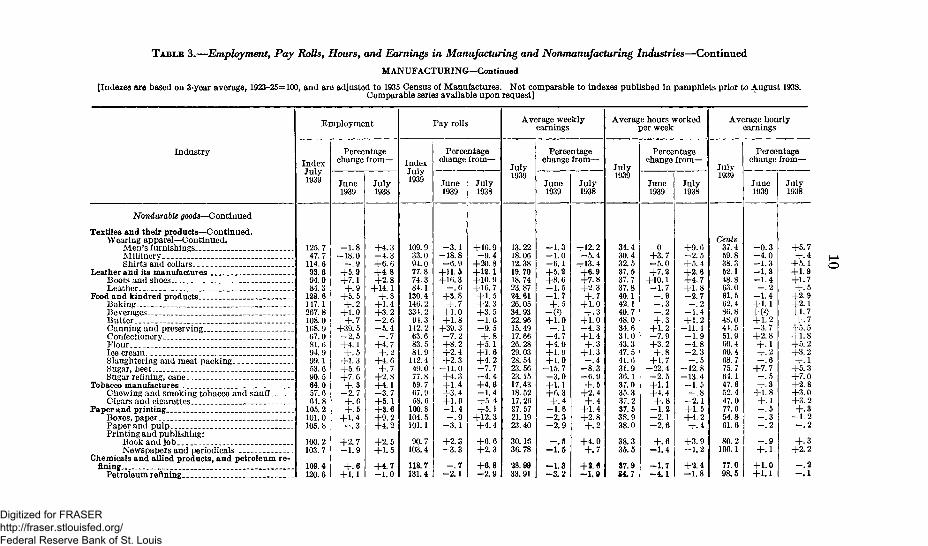
TABLE 3.—Employment, Pay Rolls, Hours, and Earnings in Manufacturing and Nonmanufacturing Industries—Continued
MANUFACTURING—Continued
[Indexes are based on 3-year average, 1923-25= 100, and are adjusted to 1935 Census of Manufactures. Not comparable to indexes published in pamphlets prior to August 193S.Comparable series available upon request]
Industry
Nondurable goods—Continued
Textiles and their products—Continued.Wearing apparel—Continued.
Men's furnishingsMillineryShirts and collars
Leather and its manufacturesBoots and shoesLeather __ _
Food and kindred productsBakingBeverages _ _ _ -ButterCanning and preserving _ _ _ _ConfectioneryFlourIce cream _ _ _ _ _ _ _Slaughtering and meat packingSugar, beetSugar refining, cane _ _ _ _ _ _
Tobacco manufactures _ _ _ _ _ _ _Chewing and smoking tobacco and snuff. _ _ _ _Cigars and cigarettes _ .
Paper and printing _. _Boxes, paperPaper and pulpPrinting and publishing:
Book and jobNewspapers and periodicals
Chemicals and allied products, and petroleum re-fining _
Petroleum refining. __
Employment
IndexJuly1939
125.747.7
114. C93.694.084. 3
129.6147.12(37. 8108. 0108. 967.081. 694. 999.153. 690. 564.057. 004.8
105.2101. 0105.8
100.2103.7
109.4120.6
Percentagechange from—
June1939
- 1 . 8-18 .0
—.9+5.9+7.1+.9
+5.5+.2
+.1. 0+.7
+39. 5- 2 , 5+4. 1+.5
+1. 3+5. 0+7. 0+.3
- 2 . 7
+.0+.5+ 1.4
- . 3
+2.7- 1 . 9
+.6+1.1
July1938
+4.3- 4 . 3+6.6+4.8+2.8
+14.1+.8
+ 1.4+3.2- 2 . 6- 5 . 4- . 7
+4.7+.2
+4. 6+.7
+2.8+4.1-3.7+5.1+3.6+9.2+4.2
+2. 5+1.5
+4.7- 1 . 0
IndexJuly1939
109.933.094.077.874.384.1
130.414(5.2331. 294. 3
142.263. 683. 581. 9
112. 449.077.859.707. 958. 0
100.8104. 5101.1
90.7103.4
118.7131.4
Pay rolls
Percentagechange from—
June1939
- 3 . 1-18 .8—6.9
+11.5+16.3
- . 6+3.8+.7
+1.0+1.8
+39. 3- 7 . 2+8.2+2.4+2. 3
-11 .0+4. 3+1.4+3.4+1.0- 1 . 4- . 9
- 3 . 1
+2.3-3 .3
- . 7- 2 . 1
July1938
+16.9- 9 . 4
+20. 8+12.1+10.9+16.7+1.5+2.3+3. 5- 1 . 6- 9 . 5
+.8+5.1+ L 6+4.2—7. 7- 4 . 4+4.6- 1 . 4+5.4+5.1
+12.3+4.4+6.6+2.3
+6.8- 2 . 9
Average weeklyearnings
July1939
13.2218.0612.3819.7018.7423.8724.6126.0534.9322.9615.4917. 6626. 2829.0328. 5423. 5623.1517.4318.5217. 2027.5721.1923.40
30.1636.78
28.9933.91
Percentagechange from—
June1939
- 1 . 3- 1 . 0- 6 . 1+5.2+8.6- 1 . 5- 1 . 7+.5
~(2)+1.0—.1
- 4 . 7+4.0+1. 9+ 1.0
- 1 5 . 7- 3 . 0+1.1+6.3+.4
-1 .8- 2 . 3- 2 . 9
—.5- 1 . 5
- 1 . 8- 3 . 2
July1938
+12.2- 5 . 4
+13.4+6.9+7.8+2.3
+ • 7+1.0+.3
+1.0-4.3+1.4+.3+1.3
- . 4- 8 . 3- 6 . 9+.5
++
2 1+1.4+2.8+.2
+4.0+.7
+2.6- 1 . 9
Average hours workedper week
July1939
34.430.432.537.537.737.840.142.140.748.034. 631.043. 347.541.631.936.137.035.337.237.53S. 938.0
38.335.5
37.934.7
Percentagechange from—
Juno1939
0+3.7- 5 . 0+7.2
+10.1- 1 . 7- . 9- . 3
+.3+1. 2-7.9+3. 2+.8
+1.7- 2 2 . 4- 2 . 5+1.1+1.4+.8
- 1 . 2- 2 . 1- 2 . 6
+.6- 1 . 4
- 1 . 7- 4 . 1
July1938
+9.0- 2 . 5+5.4+2.6+4.7+1.8- 2 . 7
- . 2- 1 . 4+ 1.2
-11 .4- 1 . 9- 4 . 8- 2 . 3—. 5
- 1 2 . 8-13 .4- 1 . 5- . 8
- 2 . 1+1.5+4.2+.4
+3.9- 1 . 2
+2.4- 1 . 8
Average hourlyearnings
Julv1939
Cents37.459.838.352.148.863.061.562.486.848.041.551. 960. 400.468. 775.764.147.652.447.077.054.861.6
80.2100.1
77.098.5
Percentagechange from—
June1939
- 0 . 3- 4 . 0- 1 . 3- 1 . 3- 1 . 4- . 2
- 1 . 4+1.1+(2)+1,2-3.7+2.8+.1+.2- . 6
+7.7- . 5+.3
+1.8+.1- . 5- . 3- . 2
A
+ .1+1.0+1.1
Julv1938
+5.7+.4
+5.1+1.9+1.7+.5
+2.9+2.1+1.7+.7
+1.8+5.2+3. 2+• 1
+5. 3+7.0+2.8+3.0+3. 2+.3
- 1 . 2- . 2
+.3+2.2
- . 2- . 1
Digitized for FRASER http://fraser.stlouisfed.org/ Federal Reserve Bank of St. Louis
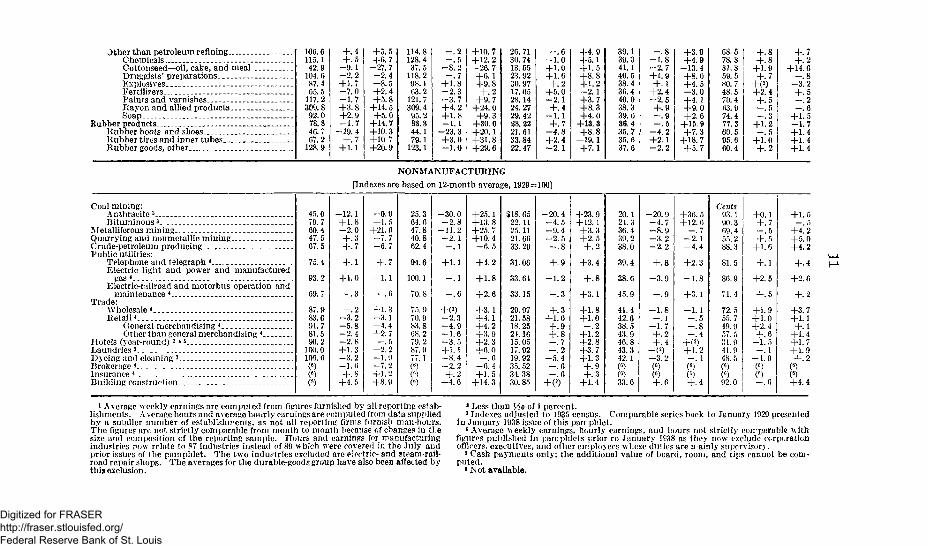
J ther than petroleum refiningChemicalsCottonseed—oil, cake, and mealDruggists' preparationsExplosivesFertilizersPaints and varnishesRayon and allied productsSoap
Rubber productsRubber boots and shoesRubber tires and inner tubesRubber goods, other
106.6115.142.9
101. 687.405.5
117.2309. 892. 078.840.767.2
128.9
+.4+.5
- 9 . 1- 2 . 2+1.7- 7 . 0- 1 . 7+3.8+2.9- 1 . 7
- 1 9 . 4+.7
+1.1
+5. 5+0.7
- 2 7 . 7- 2 . 4+8.5+2.4+5.8
+14. 5+5.0
+14.7+10.3+10 7+20.9
114.8128.437.5
118.298.1(53. 2
121.7309.495.283.344.179.1
123.1
- . 2- . 5
-8.2- . 7
+1.8- 2 . 3- 3 . 7+4.2+1.8- 1 . 1
- 2 3 . 3+3.0- 1 . 0
+10.7+12.2- 2 6 . 7+0.1+9.8+ . 2
+9.7+24.0+9.3
+30.0+20.1+31.8+29.6
26.7130. 7413. 5523. 9230. 9717.6528.1424. 2729. 4228.2221.6133.8422.47
- . 6- 1 . 0+1.0+1.6+.2
+5.0- 2 . 1+.4
- 1 . 1+.7
- 4 . 8+2.4- 2 . 1
+4.9+5.1+1.5+8.8+ 1.2- 2 . 1+3.7+8.3+4.0
+ 13.3+8.8
+19.1+7.1
39.139. 341.140.538.436.440.038. 339.636.435.735. 637.6
- . 8- 1 . 8—2.7+1.9+.1
+2.4- 2 . 5+.9- . 9- . 5
- 4 . 2+2.1- 2 . 2
+3.9+4.9
-13.4+8.0+4.5- 3 . 0+4.1+9.0+2.6
+15.9+7.3
+18.7+5.7
68.578.331.359. 580.748.570. 463. 974.477.360. 595.660.4
+.8+.8
+ 1.9+.7
+ (2)+2.4+.5- . 5- . 3
+1.2- . 5
+1.0+.2
+.7+.2
+14.6- . 8
-3 .2+.5
2- . ' 6
+1 . 5-1 .7+1.4+1.4+1.4
NONMANUFACTURING
[Indexes are based on 12-month average, 1929=100]
Coal mining:Anthracite3
Bituminous3
Metalliferous miningQuarrying and nonmetallic miningCrude-petroleum producing.Public utilities:
Telephone and telegraph 4 .Electric light and power and manufactured
gas4 . . .Electric-railroad and motorbus operation and
maintenance *Trade:
Wholesale *RetaiH
General merchandising *Other than general merchandising *
Hotels (year-round)'a *sLaundries 3. . __Dyeing and cleaning 3Brokerage *Insurance *...Building construction
45.079.760.447.567.5
75.4
93. 2
69.7
87.983.691.781.590. 2
100.0100. 6
-12.1+ 1.8- 2 . 0+. 3+.7
+.1+1. 0
- . 3
- . 2- 3 . 2- 5 . 8- 2 . 4- 2 . 8+1.3-3.2- 1 . 0+.8
+4. 5
+0.9+ 1.5
+21.0+7.7
-G.7
+.7+1.1- . 6
+1.3+3.1+4.4+2.7
- . 5+2.2-1.9-7 .2+.1.2+ 8.9
25. 364.047.840. 862.4
94.6
100.1
70.8
75.970. 983.808. 279. 287.977.1(*)
er)
- 3 0 . 0- 2 . 8
- 1 1 . 2- 2 . 1- . 1
+1.1- . 1
- . 6
+ ()- 2 . 3- 4 .9-1 .6- 3 . 5+1.1-8 .4- 2 . 2+.2
+4. 0
+25.1+13. 8+25. 7+10.4-6. 5
+4.2
+1.8
+2.6
+3.1+4.1+4.2+3. 9+2.3+0. 0- . 0
-0.4+ 1.5
+ 14.3
$1.8. 6522.1125.1121.0033. 29
31.06
33.64
33.15
29.9721.5818.2521.1615. 0517.9219. 9235. 5231. 3830. 85
- 2 0 . 4- 4 . 5- 9 . 4- 2 . 5
+.9— 1.2
- . 3
+.3+1.0+.9+.8- . 7- . 2
- 5 . 4- . 6- . 6
+23. 9+12.1+3.3+2.5+.2
+3.4
+.8
+3.1
+1.8+1.0- . 2
+1.2+2.8+3.7+1.3+.9+.3
+4.4
20.124.330. 439. 238.0
39.4
45.9
41.442.638. 543. 940.843. 342.1
(33.0
- 2 0 . 9- 4 . 7- 8 . 9- 3 . 2- 2 . 2
+.8- 3 . 9
- . 9
- 1 . 8- . 1
- 1 . 7+.2+.4
- ( ' )-3.2(°)(G)+.6
+30. 5+12. 0
- 2 i l-4 .4
+2.3
- 1 . 8
+3.1
- 1 . 1—. 5- . 8—.4
+ L2- . 1
+.4
Cents93.190. 369.455. 288.3
81.5
86.9
71.4
72.555.749. 9
41.94S.5(('••>)
92.0
+0+—
+1
++2
++1
17556
1
5
5
9+1.0+2 4+.6
- 1—
- I .
(«)
510
6
+1.5
+4^2+5.0+4.2
+.4
+2.6
+.2
+3.7+1.1+.1
+ 1.4+1.7+ 1.9+.2
(6)(6)+4.4
* Average weekly earnings are computed from figures furnished by all reporting estab-lishments. Average hours and average hourly earnings are computed from data suppliedby a smaller number of establishments, as not all reporting firms furnivsh man-hours.The figures are not strictly comparable from month to month because of changes in tliesize and composition of the reporting sample. Hours and earnings for manufacturingindustries now relate to S7 industries instead of 89 which were covered in the July andprior issues of the pamphlet. The two industries excluded are electric- and steam-rail*road repair shops. The averages for the durable-goods group have also been affected bythis exclusion.
1 Less than Mo of 1 percent.3 Indexes adjusted to 1935 census. Comparable series back to January 1929 presented
in January 1938 issue of this pamphlet.* Averago weekly earnings, hourly earnings, and hours not strictly comparable with
fiiniros published in pamphlets prior ro January H'38 as they now exclude ec rporaticnofficers, executives, and other employees whose duties are nainly supervisory.
s Cash payments only; the additional value of board, room, and tips cannot be com-puted.
• Not available.
Digitized for FRASER http://fraser.stlouisfed.org/ Federal Reserve Bank of St. Louis
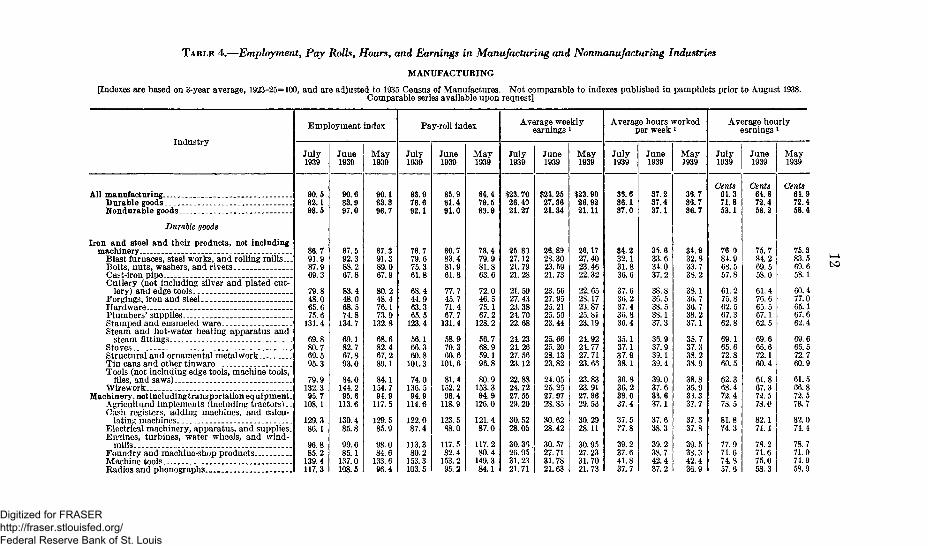
TABLE 4.—Employment, Pay Rolls, Hours, and Earnings in Manufacturing and Nonmanufacturing Industries
MANUFACTURING
[Indexes are based on 3-year average, 1923-25=100, and are adjusted to 1935 Census of Manufactures. Not comparable to indexes published in pamphlets prior to August 1938.Comparable series available upon request]
Industry
All manufacturingDurable goodsNondurable goods
Durable goods
Iron and steel and their products, not includingmachinery
Blast furnaces, steel works, and rolling mills..Bolts, nuts, washers, and rivetsCast-iron pipeCutlery (not including silver and plated cut-
lery) and edge toolsForgings, iron and steel _HardwarePlumbers' suppliesStamped and enameled wareSteam and hot-water heating apparatus and
steam fittingsStovesStructural and ornamental metahvorkTin cans and other tinwareTools (not including edge tools, machine tools,
files, and saws) _.Wirework
Machinery, not including transjmtation equipment.Agricultural implements (including tractors)..Cash registers, adding machines, and calcu-
lating machinesElectrical machinery, apparatus, and supplies.Engines, turbines, water wheels, and wind-
millsFoundry and machine-shop productsMachine toolsRadios and phonographs _
Employment index
July1939
90.582.198.5
86.791.987.969.3
79.848.065.675.6
131.4
80.769.595.3
79.9132.395.7
108.1
129. 386.1
85.2139.4117.3
June1939
90.683.997.0
87.592.383.267.8
83.448.068.574.8
134.7
69.182.767.893.0
84.0144.295.6
113.6
130.485.8
85.1137. 0108.5
M a y1939
90.183.396.7
87.391.389.067.9
80.248.476.173.9
132. 8
82.467.289.1
84.1154. 791.9
117.5
129.585.9
98.084.6
133. 695.4
Pay-roll index
July1939
76.692.1
76.779.675.361.8
68.444.963.365.5
123.4
56.166.360.8
101.3
74.0136.594.9
114.6
122.087.4
113.380.2
153.3103.5
June1939
85.981.491.0
80.783.481.961.8
77.745.771.467.7
131.4
58.970.360.6
101.6
81.4152.298.4
118.9
123.5S8.0
117.582.4
153.295.2
M a y1939
84.479.583.9
78.479.981.863.6
72.046.575.167.2
128.2
56.768.959.195.8
80.9153.394.9
126.0
121.487.0
117.2SO. 4
149.384.1
Average weeklyearningsi
July1939
$23. 7028.4021.27
25.8127.1221.7921.28
21.5927. 4323. 3824.7022.68
24.2324. 2627.5623.12
22.8824. 7227.5529.20
30. 5228.05
30.3626.9531.2321.71
June1939
$24.2527.3821.34
23.3023. 5921.73
23. 5627.9525.2125. 5623. 44
25. 6625. 2023.1323.82
24.0525.2327.9728. 85
30. 6228.42
30. 5727.7131.7821.63
M a y1939
$23. 9026.9221.11
26.1727.4023. 4622.32
22. 6523.1723.8725. 8123.19
24.9224.7727.7123.66
23. 8323. 9127.8629. 53
30.2928.11
30.9527. 2331.7021.73
Average hours workedper week i
July1939
36.636.137.0
34.232.131.836.6
37.638. 237.436. 836.4
35.137.137.938.1
36.836.238.037.4
37.5?7.8
39.237.641.8 !
37.7
June1939
37.237.437.1
35.633.634.037.2
38.836.533. 533.137.3
36.937.939.139.4
39.037.633.637.1
37.638.3
39.238.742.437.2
M a y3939
36.736.736.7
34.932.833.73S.2
38.136. 736.738.237.1
35.737.333.238.9
33.835.933.337.7
37.337.8
39.533.342.4
Average hourlyearnings l
July1939
Cents61.371.853.1
76.084.963. 557. 8
61.275.862.567.362.8
69.165.672.860.5
62.363.472.473.5
81.874. 3
77.971.674. 857. G
June1939
Cents64.872.458.2
75.784.269.558.0
61.476. 665. 567.162.5
69.663.672.160.4
61.867.372.573.0
82.174.4
78.271.675.053-3
M a y1939
Cents64.972.458.4
75.383.569. 653.1
60.477.065.167.662.4
66.572.760.9
61.566.872.5
82.074. 4
78.771.074.953.9
Digitized for FRASER http://fraser.stlouisfed.org/ Federal Reserve Bank of St. Louis
Textile machinery and partsTypewriters and parts
Transportation equipmentAircraftAutomobiles. __Cars, electric- and steam-railroadLocomotivesShipbuilding
Nonferrous metals and their products.Aluminum manufacturesBrass, bronze, and copper productsClocks and watches and time-recording
devicesJewelryLighting equipmentSilverware and plated wareSmelting and refining—copper, lead, and zinc.
lumber and allied productsFurnitureLumber:
MillworkSawmills
Stone, clay, and glass productsBrick, tile, and terra cottaCement .GlassMarble, granite, slate, and other productsPottery
Nondurable goodsTextiles and their products
FabricsCarpets and rugsCotton goods...Cotton small waresDyeing and finishing textiles .Hats, fur-felt ...Knit goods
HosieryKnitted outerwear..Knitted underwearKnitted cloth
Silk and rayon goodsWoolen and worsted goods
Wearing apparelClothing, men'sClothing, women'sCorsets and allied garments...Men's furnishingsMillineryShirts and collars
74.9119.778.2
1. 377. 875.429.429.8
120.391.9
160.2
79.891.175.4CO. 570.567.280.0
57.354. 573.957.372.090. 548.070.1
95.089.279.3So. 781.5
109.1
113.1141.977.373.5
153.157. 781.4
10(5.4102.6138.4105.8125.747.7
114.0
73.1124.089.9
1. 283. 491.632.327.0
121. r>91.6
154.798.7
79.987.770.265.571.066.878.7
57.254. 474.557.171.293.045.979. 6
94.9S7.878.98-1.179.0
100. 479.8
J13. 0141.775. 574.8
152. 35G. 479.8
109.397.9
.151.9100. 6128.158.2
1 115.0
72.7126.090.3
1,183. 993.333.722.4
118.092,4
152. 299.1
82 280.181.266.271.365.377.0
53.953.772.753. 607.491.547. 580.7
96.188.379.985. 282.3
112.776. 6
114.1145. 473.074.3
144.158.775.0
11.2.296. 7
159. 7100.8127.370.2
118. 0
76.8114.975.9
1, 347. 272.026.226.3
127.886.1
152.2102.6
79.872.464.351.765. 258.864.9
46.446. 862.542.869. 587.430. 4G2.1
77.475. 564.672.475. 989.382.8
107. 6140. 769. 665. 6
126. 946.068.378.670.194.2
108. 5109.133.094.0
75.5111 383.2
1, 310. 688.631.824.4
132.486.7
161.299.0
79.873.007.058.'566.460.464.9
48.651.966.946.269. 796.036. f>69.2
77.674.564.770.873.088. 674.7
109.4144.068. 668.1
123.045.566. 780.971.7
103.1.190.1
i 113.440.0
100.9
71.8128.587.6
1,165. 288.033.519.6
127.686.8
156.899.4
81.869.370. 959. 866.658.263.1
45.050. 364.140.464.091.740.473.1
77.874.264.872.274.891. 36 k 3
109. 3146. 666. 765. 6
110.846. 560.982.106. 6
110.4111.8104.952.5
102.2
26.6323.0530.9529.4531.4224. 3628. 3831.7125. 4124.2028.31
21. 3422.3124.6623. 4126.0519.6119. 30
21.4119. 2622.6119. 5826. 8423.2725. 8320. 30
16.4716. 2321. 6113. 8317.7819.7824. 5316. 9017. 6316. 7614.9018.3415.1519.4217.1619.1117.7116. 7013.2218.0612.38
26.7022.1331.7331.1731.9426. 9429.0132. 5325.5220. 6527.32
21.3023.1224.7924. 5320. 3420.9619. 91
22. 4521.2623. 9421. 2527.3124. 8626. 7621. 59
16.4916.1821.7713. 6917.7520.2923. 2417. 1717.9516. 9615.1317.8715. 3819. 3217.4619.0418.0617. 0913.8318.4313.33
25. 6524.4931.0430.0431.1827. 2128.1532.2925. 3826.3127.18
21.0322. 4624. 6324. 8026.2920.7319. 86
21.9921.0023.4719. 9126. 5024.1528. 6322. 46
16.3516.0121. 5313. 7817. 3120. 2921.3316. 9317.7516.9814. 7417.0715.1918.7717. 4318.0419.0317. 5712.8819.9913. 40
40.536.035.140.634.032.837.237.637.836.039. 7
36.337.635.837.037.533.837.2
39.735.935.336. 638. 032. 535.735.8
35.235. 933. 930.138.537. 634. 434. 933.736.937. 139.235. 336.833.733.534.137.134.430.432. 5
40.534.536.342.034.336. 537.738.538.239.138. S
36.438.835.63*. 538.139.138.0
41.439. 237.239. 539. 035. 037.536.2
35.435. 931.335. 837.937. 433. 435. 334. 336.737. 538. 335.436.734.633.835. 638.035. 728.8
i 34.2
38.737.134.941.233.536.736.638.937.738.738.5
35.637.335.139.33?.O38.637.5
41.038.636.437. 438.03-1. 239.536. 6
34.835. 533.835. 737.637. 630.934. 934.137.036.236.035.135. 733.631.934.738.933.831.1
• 34.3
65.8 164.088.472.492.674.276.3 !83.267.167.071.7
58.758. 368.964.069. 553.752.4
54.054. 36 1 653.170.671.572. 961.7
47.145.803. 738. 347.152. 472.349. 552.845. 340.246.142.553.049.555.548.644.837.459.838.3
66.164.089.373.693.373.877.083.287.068.070.7
58.559.169.76 1 069.15 1 352.7
51 355.26 1 753. 870.071. 171.863.1
47.245.863. 638.347.453. 770.949.152.046.140. 545.843.052. 649.856.847.845.137.703. 039. 4
GO. 466.089. 573.793.174.077.082.167.268.170.8
59.159.970.163.769.25 1 353.0
53.855. 264.653. 469.870.672.762.3
47.745. 963.738. 646.753. 570.049.452. 446.140.746.142.952.651.057.450.145.336.764.039. 5
CO
For footnotes see end of table.
Digitized for FRASER http://fraser.stlouisfed.org/ Federal Reserve Bank of St. Louis
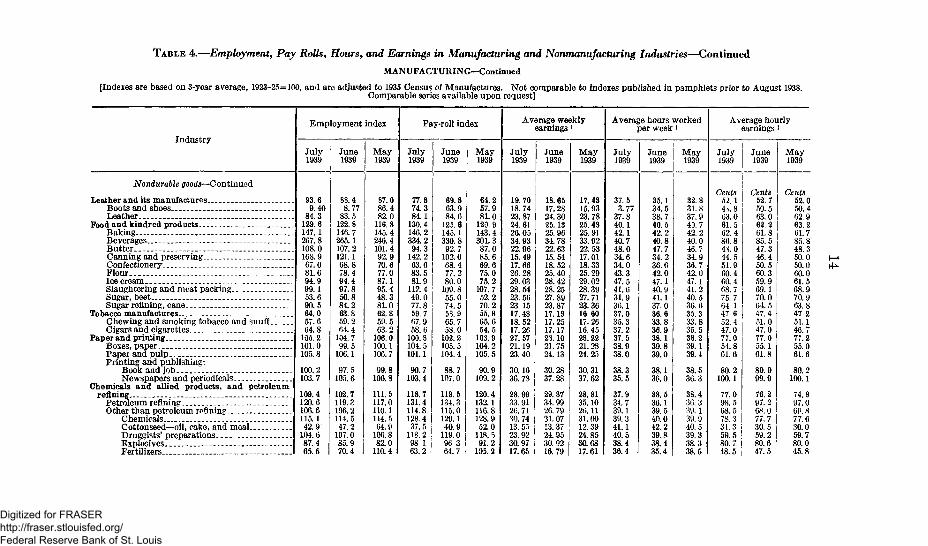
TABLE 4.—Employment, Pay Rolls, Hours, and Earnings in Manufacturing and Nonmanufactwing Industries—ContinuedMANUFACTURING-Continued
[Indexes are based on 3-ycar average, 1923-25=100, and are adjusted to 1935 Census of Manufactures. Not comparable to indexes published in pamphlets prior to August 1938.Comparable series available upon request]
Industry
Nondurable goods—Continued
Leather and its manufacturesBoots and shoesLeather
Food and kindred productsBakingBeveragesButterCanning and preservingConfectioneryFlour... .IcecreamSlaughtering and meat packingSugar, beetSugar refining, cane
Tobacco manufacturesChewing and smoking tobacco and snuffCigars and cigarettes.
Paper and printing.Boxes, paper...Paper and pulp.Printing and publishing:
Book and jobNewspapers and periodicals
Chemicals and allied products, and petroleumrefining
Petroleum refiningOther than petroleum rofinin^...
ChemicalsCottonseed—oil, cake, and meal___Druggists' preparationsExplosives _Fertilizers
Employment index
July1939
9.4084.3
129.6147.1207. 8108.0168.967.081.694.999.153.690.564.057.664.8
105. 2101.0105. 8
100. 2103.7
109.4120.6106.6115.142.9
104.687.465.5
June1939
83.48.77
83.5122.8146.7265.1107.2121.168.878.494.497.850.884.263.859.264.4
104.799.5
106.1
97.5105. 6
102.7119.3106. 2111. 547.2
107.085.970. 4
May1939
87.086.482.0
116.8145.4246.4101.492.970.677.087.195.448.381.062.859. 563.2
106.0100.1106.7
99.8106. 8
111. 5117.0110.1114. 5G4.9
100.882.0
110.4
Pay-roll index
July1939
June1939
I
77.874.384.1
130.4146.2334. 291. 3
142.263.683.581.9 j
112.449.077.859.767.958.6
100.8104. 5101.1
90.7103.4
118.7131.4114.8 ,128.4 |
37. 5 I118.2 !98 1 j63.2 i
69.863.984.6
125.6145.1330.892.7
102.068.477.280.0
109. 855.074.55S.965.758.0
102.2105.5104.4
88.7107.0
119.5134.3115. 0129.110.9
119.096 3 i64.7 i
May1939
64.257.981.0
120. 9143.4301.387.085.669.675.075.2
107.752.270.255.865.654.5
103. 9104.2105.5
90.9109.2
120. 4132.111G.8128.952.0
118.591.2
105.2
Average weekly
July1939
June
19.7018.7423.8724.6126.0534.9322.9615.4917.6626. 2829.0328.5423. 5623. 1517. 4.818.5217.2627.5721.1923.40
30.1630. 78
28.9933. 9126.7130. 7413. 5523.9230.9717.65
18.6517. 2824.3025.1325.9631 7822.6315.5418.5225.4028.4228.2527.8923.8717.1917.2517.1728.1021.7524.13
30. 2837. 28
29. 3734.9926. 7931.0713. 3724.9530.9216.79
May1939
17.4315.9323.7825.4825.9133.9222.5317.0118.3325.2929.0?28.3927.7123.3618.6017.2616.4528.2221.2824. 25
30.3137.62
28.8135.102s>. 1131.0012. 3924. 8530.6817.61
Average hours workedper week i
July1939
37.53.77
37.840.142.140.748.034.634.043.347.541.631.936.137.035.337.237.538.938.0
38.335.5
37.934.739.139.341.140.538.436.4
June1939
May1939
35.134.538.740.542.240.847.734.236. 642.047.140.941.137.036.633.836.938.139.839.0
38.136.0
38.536.139.540.042.239.838.435.4
32.831.837.943. 742.240.046.734.936.742.047.141.240.536.635.333.835.538.239.139.4
38.536.3
38.436. 339.139.040.539. 338.338.5
Average hourlyearnings J
July1939
Cents52. 14.. 863.061.562.486.84S.044.551.960.460.4 |68.7 ;75.7 I64.147.652.447.077.054.861. 6
80.2100.1
77.098. 568.5 j78.331.3 |59.5 !80.7 !48.5 |
June1939
Cents52.750.563.082.261.885.547.346.450.560.359. 969. 1 i70.0 !
64.5 i47.4 !
51. 047.077.055.161.8
80.999.9
76.297.2 i08. 077. 7 |30. 5 i59. 2 |80.6 I47.5 i
May1939
Cents52.050.462.963.261.785. 848.350.050.060.061.568.970.963.847.251.146.777.255.061.6
80.2100.1
74.997.000. 877.630.059.780.045.8
Digitized for FRASER http://fraser.stlouisfed.org/ Federal Reserve Bank of St. Louis

Paints and varnishesRayon and allied productsSoap
Rubber productsRubber boots and shoesRubber tires and inner tubesRubber goods, other
117.2309-892.078.846.767. 2
128.0
119.3298.589.480.25«.O66.7
127. 5
118.4308. 587.781.461.067.2
128.7
121.7309.495.283.344.179.1
123.1
126.4297.093. 584.257. 576.8
121. 3
127. 3298.390.382.156.873.5
124.2
28.1424.4729.4228.2221.6133.8422.47
28.6224.3829.7427.8822. 6933.0622.77
29.1223.7029 2326.7821.3531.4022. 65
40.038.339.636.435.735. 037.6
41.137.940.036.537.334.938.1
41.536.639.036.735.833.238.1
70.463.974.477.360.595.060.4
69.764.374.076.560.894.760.3
70.104.775.174.259. 794.400.1
NONMANUFACTURING
llndcxes are based on 12-month average, 1929 = 100]
Coal mining:Anthracite2
Bituminous 2_.Metalliferous miningQuarrying and nonmetallic miningCrude-petroleum producingPublic utilities:
Telephone and telegraph 3 .Electric light and power and manufactured
gas3
Electric-railroad and motorbus operation andmaintenance 3
Trade:Wholesale 3
Retain . .General merchandising3
Other than general merchandising 3
Hotels (year-round) 23 *Laundries 2
Dyeing and cleaning 2
Brokerage 3 5Insurance 3 5
Building construction *
45.079.700. 447. 507. 5
75.4
93.2
09.7
87.983.691.781.590.2
100.0106. 6—1. 0+.8.0
51.278.301.047.367.0
75. 3
92.3
09.9
88.180.497.483.592.898.7
110.1—2. 0+.4
+1.4
52.047.901.945.606.1
74.7
91.0
69.0
87.285.796.882.893.995.5
107.0— 1.4+.3
+6.7
25.364.647.840.862.4
94.0
100.1
70.8
75.970.983.808.279.287.977.1
—2.2+.2
+4.6
30. 100. 553.841.702. 5
93.7
100. 2
71.2
75.872.588.109. 382.080. 984. 2
—2. 4+.5
57.020.454.139.701.2
93.7
98.8
70.1
74. 971. 580. 708.382.483.983.0
— 1.1+.0+11.9
$18.6522.1125.1121.0033. 29
31.00
33.64
33.15
29.9721.5818.2524.1615.0517.9219.9235. 5234.3830.85
$23. 3022. 7527. 2022.1534. 38
30.79
33.89
33.21
29.9021.3618.0524.0015.3017.9521.0035. 7136.7530.87
$35. 8411.3227.5021.7434.04
31.05
33.82
32.89
29. 7221.1917.9023.8615.2218.0721.1236.0836.8231.40
20.124. 336.439.238.0
39.4
38.0
45.9
41.442.638.543.946.843.342.1(6 )
33.6
25.425.239.440.138.8
39.1
40.2
46.2
42.042.739.243.846.843.243.4
33.4
38 814! 140.040.038.8
39.2
40.1
45.6
42.142.438.943.546.643.043.9
33.5
Cents93 190^309.455. 288.3
81.5
86.9
71.4
72.555. 749.957.531.941.948.5
(6)92.0
Cents92. 888.669.554.980.7
81.4
84.4
71.1
71.555.148.757.132.641. 949.1
(°)92.8
Cents91.886.069.154.586.1
81.8
84.6
71.2
71.155.048.856.932.442.449.1
94.1
1 Average weekly earnings are corr. puted from figures furnished by all reporting estab-lishments. Average hours and average hourly earnings are coir puted from data suppliedby a smaller number of establishments, as not all reporting firms furnish man-hours.The figures are not strictly comparable from n:onth to month because of changes in thesize and composition of the reporting sample. Houis and earnings for all manufacturingindustries now relate to 87 industries instead of 89 which were covered in the July andprior issues of the pamphlet. The 2 industries excluded are electric- and steam-railroadrepair shops. The averages for the durable-goods group have also been affected by thisexclusion.
2 Indexes adjusted to 1935 census. Comparable series back to January 1929 presentedin January 1938 issue of this publication.
3 Average weekly earnings, hourly earnings, and hours not strictly comparable withfigures published in pamphlets prior to January 1938 as they now exclude corporationofficers, executives, and other employees whose duties are mainly supervisory.
* Cash payments only; the additional value of board, room, and tips cannot be com-puted.
8 Indexes of employment and pay rolls are not available, percentage changes from pre-ceding month substituted.
6 Not available.
Digitized for FRASER http://fraser.stlouisfed.org/ Federal Reserve Bank of St. Louis
16
INDEXES OF EMPLOYMENT AND PAY ROLLS, JULY 1938
THROUGH JULY 1939
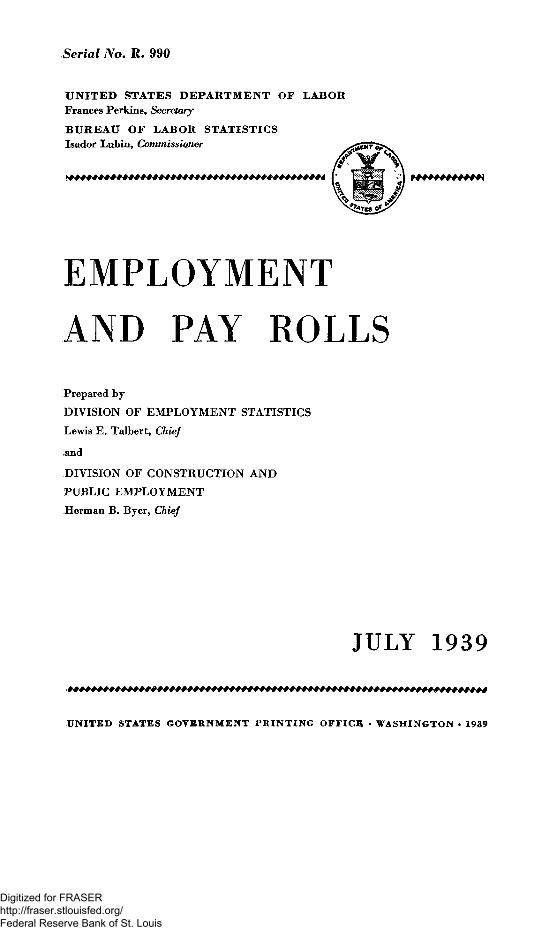
Indexes of employment and pay rolls are given in table 5 for allmanufacturing industries combined, for the durable- and nondurable-goods groups of manufacturing industries, and for each of 13 non-manufacturing industries, including 2 subgroups under retail trade, bymonths, from July 1938 to July 1939, inclusive. The accompanyingchart indicates the trend of factory employment and pay rolls fromJanuary 1919 to July 1939.
The indexes of factory employment and pay rolls are based on the3-year average 1923-25 as 100. They relate to wage earners onry andare computed from reports supplied by representative manufacturingestablishments in 87 manufacturing industries. These reports covermore than 55 percent of the total wage earners in all manufacturingindustries of the country and more than 65 percent of the wage earnersin the 87 industries included in the monthly survey of the Bureau ofLabor Statistics.
The indexes for the nonmanufacturing industries are based on the12-month average for 1929 as 100. Figures for mining, laundries, anddyeing and cleaning cover wage earners only, but the figures for publicutilities, trade, and hotels relate to all employees except corporationofficers, executives, and other employees whose duties are mainlysupervisory. For crude-petroleum production they cover wage earn-ers and the clerical field force. The coverage of the reporting samplesfor the various nonmanufacturing industries ranges from approxi-mately 25 percent for wholesale trade and dyeing and cleaning to ap-proximately 80 percent for quarrying and nonmetallic mining, anthra-cite mining, and public utilities.
Data for both manufacturing and nonmanufacturing industries arebased on reports of the number of employees and amount of pay rollsfor the pay period ending nearest the 15th of the month*
Digitized for FRASER http://fraser.stlouisfed.org/ Federal Reserve Bank of St. Louis

17
TABLE 5.—Indexes of Employment and Pay Rolls in Selected Manufacturing 1 and Non-
manufacturing 2 Industries, July 1938 to July 1939, Inclusive
Employment
IndustryAv.1938 I
1938
i J u l y Aug. Sept J Oct. :Nov. Dec.i : i i
Manufacturing
All industries. .Durable goods 3
Nondurable goods i
Nonmanufacturing
Anthracite miningBituminous-coal mining._Metalliferous miningQuarrying and nonmetallic
mining^Crude-petroleum produc-
iugTelephone and telegraph..Electric light and power,
and manufactured gas.__Electric-railroad and mo-
torbus operation andmaintenance.
Wholesale tradeRetail trade
General merchandis-ing
Other than generalmerchandising
Year-round hotels. 1LaundriesDyeing and cleaning-
Manufacturing
All industries _-Durable goods'__ —Nondurable, goods 4..-.
No n manufacturing
Anthracite miningBituminous-coal mining...Metalliferous miningQuarrying and noi.metal-
lic miningCrude-petroleum produc-
ingTelephone ind telegraph...Electric light ftnd power,
and manufactured gas.-Electric-railroad and mo-
torbus operation andmaintenance. _
Wholesale tradeRetail trade
General merchandis-ing
Other than generalmerchandising
Year-round hotelsLaundriesDyeing and cleaning
80. 8 i 81.977.3; 70.396.0| 92.9
I !85.7 88.8' 80.5 90.5 91.271.7! 75.3: 79.0! 82.1! 83.199.0 101. 71 99. 4i 98.41 93.8
52.3 44.0 37.0- 40.4 52.4 51.0 51.386.7, 78. o1 80.11 83.4 ! 87. 2 88.6 89.359.0 49.71 51.11 55.2- 57.9: 61.91 02.3
i . I . I - i - ! J72.11 72. 3 72.4 71.5 G0.5.! 68. 3! 07.875.11 74. 9j 74. S[ 74.0; 74.7, 74.4- 74.3
92.3| 92.3; 92.7; 92.5; 92. 0! 91. o! 91.4
70.31 70.1 69.5 09.3] 09.9 69.5' 09.488.8, 86.8: 87.0, 88.5 89. li 89.8, 90.085.2,1 81.1! 80.0; 84.7- 85.9 80.9.' 98.1
98.01 87.9! 80. i 97.0 99.4 104.5 144.1I ! I ' i !
81.8 79.3: 78.3j 81.5 82.3 «2. 3 80.092.7 90.7 : 90.4 91.8 92.9 92.5 92.095.7, 97. S' 97.5i 96.5 94.4 93.7 93.4
104. 3 108.6 105.0 107.8 106. >> 102. 5, 97. 9: i I , ! I
1939
Jan. Feb. Mar.1 Apr. May; June July
89.51 90. 7j 91.481. O1, 82.6 83.597. 1 98. 4 98. 9
50. 088.762.6
38.3
91.1 90.11
84.11 83.3,97.8- 90.71
90. 0: 90.583.9, 82.197.0 9S.5
i I52.2' 51. 7 i 53.0! 52. 01' 51.2 45.088.0 87.4 : 25.9 47.91 78.3 79.760.9 01.0! 01. 5| 61.9' 61. Gj 60.4
37. 9" 40.11 43.0; 45.6, 47.3' 47.5i I I
67.0 P6.4 60.2' 05.8 f>6.11 67.0! 67.574. li 73.3 73.4. 74. lj 74.7] 75. 3j 75.4
90.0 89.6! 89.5 90.3| 91.0' 92. 3i 93.2' i i
69.2, 09.'V 69.5 60.11 09. 6 69.9! 69.788.?I 87. 9." 87.4; 87. 3j 87.2' 88. l! 87.982.2, 81.5, 83. S 85.5 85.7, «6.4, 83.6
90.71 88.8 93.2j 96. 9J 96.8. 97.4 91.7
80.01 79.0 81.3: 82. 51 82.8' 83. 51 81.591.8 92.0. 92.7 93.2 93.9 92.8 90.293.3 : 92.8 92.9 93.5 95.5 98.7 100.091. 2, 92. 1 95. 4 102. 2 107.0110.1 106. 6
Pay rolls
77.5 70.6 76.9 81.0 83.8 84.1 86.508.2 58.6 63.7: 08.7 75.2 78.3 : 80.488.0' 84.1; 91.7: 94.9 93.1 90.6 93.4
38. 2:67.950.4
20.256.338. 0:
20. 0'64.243. 7 i
i I29.4'71.9,46.1 '
35.11 37. o' 39.2 38. 4:
I60. 592. 6'
66.592.1 '
66.790.9"
•8.5"
09.7;74. T70.4'
60.8!91.3
I
43.4 30.2. 42.578.3 81.1 80.949.2 52. 3 ; 5J.1
39. 2 37.2, 33.7
63.7. 63. 3 : 62.595. n, 93.0, 92.5
(8.9, 93.4 99.9 98.6 98.2
69.073.668.11
69.573. 7166. 8
!
08. 41
74.369. 4i
87.8 80.4 • 78.8 85.3
OS. 9 e8.8 : 69.775. V 75.4 75.770.8 71.5! 79.2
88.3: 91.8 122.9
60.8 65. G1 64.3 06.11 67.2 67.3 70.180.3 77.4 77.4. 78.9! 80.8 81.3 81.180.6 83.0 83 1 81.41 79.5 79.3 80.075.3 77.5 74.3 81.7, 78.0 73.9 68.3
I I i I i
83.4' 85.5 80.9! 84.9! 84.4 ! 85.9, 83.976.6 78. 51 80.1 80. 2: 79. 5! 81. 4 70.691.0, 93.3 94 0 90.2 89,9' 91.0 92.1
38.0, 45.2, 34.2, 43.4; 57.0 30.11 25.378.2 81.2 77.8 17.0' 20.4 06.51 64.65r;.3; 53. 4j 53. 6j 52. C 54. l | 53. 8 : 47.8
30.2: 29.7; 33. lj 35.9, 39.7! 41. 71 40.8, | I I i !
60.9 62.7. 61.3 60.8. 61.2 62. 5;i 02.492.0. 91.7( 91.9, 92.1! 93.7
95. 9' 9G. 4' 90. 7! 90.9 98. 8 100. 2,100.1
| I |
i3.7, 94.0
09. 91 70.5" 09. 6' 70. l! 71.2 70.874.0' 74.7 i 74.8 74.9, 75.8 75.9
, 6S.4, 69.6, 71.3, 71.5 72.5: 70.9! ! i i i
84.0, 81.0 83.41 86.6, 86. 71 88.1. S3. 8I ! i j i
65.8 s 06.8, 08.1 68.3" 69.3' 63.282.8 81.1 81.9- 82.4. 82.0 79.278.6; 79.3 79.9 83.9 86.9 87.96?. 2 67.7. 73.3 83.0, 81.2 77.1
i ! '
71.175.569.7,
I00.780.279.665.8,
j i>r earlier
. „ _ _omparable indexes are in November 1934 and subsequent issues ofEmployment and Pay Rolls, or in February 1035 and subsequent issues of Monthly Labor Review, exceptfor anthracite and bituminous-coal mining, year-round hotels, laundries, and dyeing and cleaning. Indexesfor these industries from January 1929 foiward have been adjusted to the 1935 census and are presented inthe January 1938 and subsequent issues of Employment and Pay Rolls.
3 Includes: Iron and steel, machinery, transportation equipment, nonferrous metals, lumber and alliedproducts, and stone, clay, and glass product?.
4 Includes: Textiles and their products, leather and its manufactures, food and kindred products, tobaccomanufactures, paper and printing, chemicals and allied products, products of petroleum and coal, rubberproducts, and a number of miscellineous industries not included ia other groups.
Digitized for FRASER http://fraser.stlouisfed.org/ Federal Reserve Bank of St. Louis

INDEX
120
100
80
6 0
4 0
4vv
* u 1919 1920 1921 1922
UNITED STATES BUREAU OF LABOR
E M P L O Y M E N T A N D PAY ROLLSALL MANUFACTURING INDUSTRIES
1923-25=100
PAY
fROLLS
\ \
E
VV
MPL
f
OYMENTi
ffcf
f 1
f]1
1923 1924 1925 1926 1927 1928 1929 1930 1931 1932 1933 1934 1935 1936 1937
STATISTICS
INDEX
120
100
80
60
Af\4 0
1938 1939 1940 fcV
oo
Digitized for FRASER http://fraser.stlouisfed.org/ Federal Reserve Bank of St. Louis
19
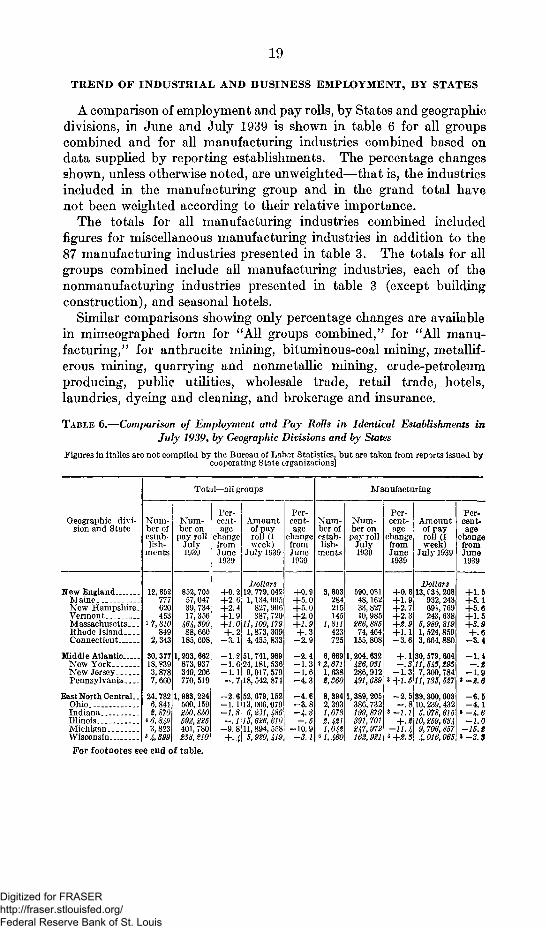
TREND OF INDUSTRIAL AND BUSINESS EMPLOYMENT, BY STATES
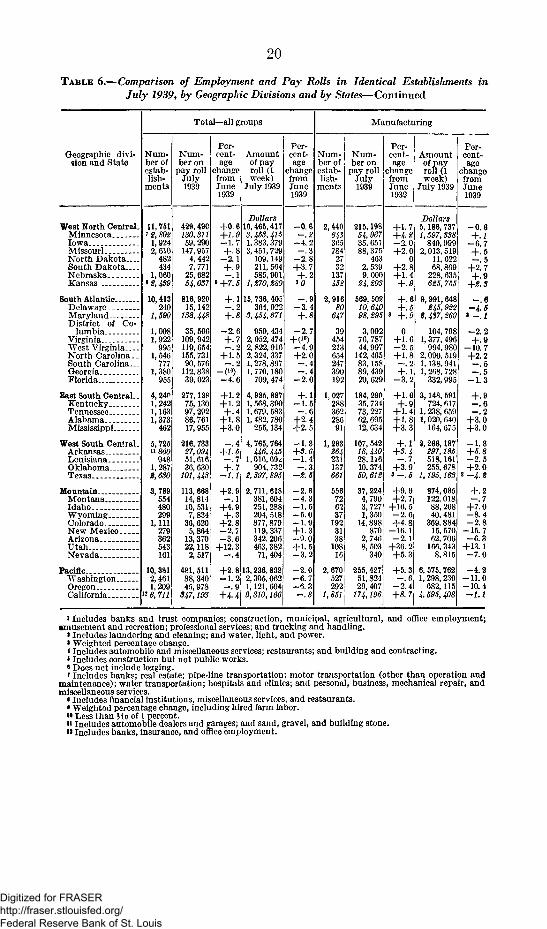
A comparison of employment and pay rolls, by States and geographicdivisions, in June and July 1939 is shown in table 6 for all groupscombined and for all manufacturing industries combined based ondata supplied by reporting establishments. The percentage changesshown, unless otherwise noted, are unweighted—that is, the industriesincluded in the manufacturing group and in the grand total havenot been weighted according to their relative importance.
The totals for all manufacturing industries combined includedfigures for miscellaneous manufacturing industries in addition to the87 manufacturing industries presented in table 3. The totals for allgroups combined include all manufacturing industries, each of thenonmanufacturing industries presented in table 3 (except buildingconstruction), and seasonal hotels.
Similar comparisons showing only percentage changes are availablein mimeographed form for "All groups combined/7 for "All manu-facturing/J for anthracite mining, bituminous-coal mining, metallif-erous mining, quarrying and nonmetallic mining, crude-petroleumproducing, public utilities, wholesale trade, retail trade, hotels,laundries, dyeing and cleaning, and brokerage and insurance.
TABLE 6.—Comparison of Employment and Pay Rolls in Identical Establishments inJuly 1939, by Geographic Divisions and by States
Figures in italics arc not compiled by the Bureau of Labnr Statistics, but are taken from reports issued bycooperating State organizations]
Geographic divi-sion and State
New EnglandMaine.New Hampshire.VermontMassachusetts.. _Rhode IslandConnecticut
Middle AtlanticNew YorkNew JerseyPennsylvania
East North Central. _OhioIndianaIllinois....MichiganWisconsin
Total—all groups
Per-cent-age
changefromJune1939
Per-cent-age
changefromJune1939
Xum-ber ofestab-lish-
ments
Num-ber on
pay rollJuly1939
Amountof payroll (1week)
July 1939
changfromJune1939
Dollars+0. 2 19, 779,042+2.0 1,134,09;-)
Dollars,C3*,208932, 243091,769243, 638
5,980, 8191, 524,8593, 664,880
620453
i 7, 810.849
2,343
30, 377 1,18,»393,8787, 660
24,7826,8412, 870
3,823' 4,899
852, 70557,04739,73417,356
464,80088, 660185, 608
L, 993, 662873, 937349,206770, 519
1, 983, 224500,159250,850592,225401,780238, 210
+2.4+1.9+1.0+•2
- 3 . 1
11,100,1791,873,3094, 455, 833
- 1 . 2 51,741,!- 1 . 6 24,181,536- 1 . l! 9,017,579
- . 7 18, 542, 874
- 2 . 6 52,679,152- 1 . 1 13,006,079-1.8 6,231, 486\-.l\15,626,610\
- 9 . 8111, 894, 5581+. { 5,920, 419\
+0.8+5.0+5. 0+2.0+1.9+.3
- 2 . 9
- 2 . 4- 1 . 3- 1 . 6- 4 . 3
- 4 . 6- 3 . 8-4.3-.5
-10.9-3.1
Manufacturing
6, 669 12 2,671
1, 638
8, 394 1,2,3931,0782,421l,0!{2
»1,460
., 204, 632426,031286,912491,689
., 389, 205386, 732199,879391,701247,972
+.130,579,604- . 8 11,543,293
- 1 . 3 7,300,7843 +1. 5lll, 735, 527
-2.5139,300,603- . 8 10, 239, 432
3 -l.l\ 5,078,615+.2\W,259,634
-11. 4\ 9,706,857162,921 ] z+2.3\ 4,016,065
- 1 . 4-.2
- 1 . 91-2.6
- 8 . 5- 4 . 1
*-4.6-1.0
-15.23-3.3
For footnotes see end of table.
Digitized for FRASER http://fraser.stlouisfed.org/ Federal Reserve Bank of St. Louis
20
TABLE 6.—Comparison of Employment and Pay Rolls in Identical Establishments inJuly 1939, by Geographic Divisions and by States—Continued
Geographic divi-sion and State
West North Central.MinnesotaIowaMissouriNorth Dakota.-.South DakotaNebraskaKansas.. _.
South AtlanticDelawareMarylandDistrict of Co-
lumbiaVirginiaWest Virginia....North Carolina..South Carolina-..GeorgiaFlorida
East South Central..Kentucky. _TennesseeAlabama..Mississippi
West South Central.ArkansasLouisianaOklahomaTexas _„.
MountainMontanaIdahoWyomingColoradoNew MexicoArizonaUtahNevada _.
PacificWashingtonOregon...California
Total—all groups
Num-ber ofestab-lish-
ments
11,7517 2, 802
1,9242,610
482434
1,0608 2,439
10,413240
1,690
1,0081,922
9951,546
7771,380
955
4,2401,2421,1631,373
462
5,725"860
9481,287
3,789554480299
1,111279362543161
10, 3812,4611,209
2 6, 711
Num-ber on
pay rollJuly1939
Per-cent-age
changefromJune1939
429,49G130,31159, 290
147,9574,4427,771
25, 6825/h 037
816, 92015,142
188,448
35, 566109,942119,654155,73190,576
112,83839, 023
277,13875,13097, 29286, 76117, 955
216, 78327, C'51,61636, 630
101, 443
113,66814, 81.410, 5317,834
36,6205,864
13, 37022,118
2,517
+0.+1.9"+'8- 2 . 1+.9- . 1
+.1- . 2
-2.6+.7- . 2
+1.5- . 2
- ( 1 0 )
-4.6
+1.2+1.2+.4
+1.8+3.0
- .4+1.6—. 7+.7
-1.1
+2.9- . 1
+4.9+.3
+2.8-2.7-3.6
+12.3- .4
6 10,
I Per-Amount I cent-of pay ageroll (1 change
fromJune
o (week)
July 1939
Dollarsi, 465, 417
3,453, 4151, 383, 3793,451,729
109,149211,564585, 901
/, 270,280
15, 736, 405364, 022
3,454,671
959,4342, 052, 4742,822,9162. 324, 3371, 278,8971,770,180
709, 474
4, 985, 8871, 568, 3901,679, 5831, 482, 780
255,134
4, 765, 764446,445
1.010,69z904, 732
2,397, 895
2.711,618381, 604251, 288204,518877, 879119,337342, 206463, 382
71, 404
- 0 . 6-.2
- 4 . 2- . 3
- 2 . 8+3.7+.230
- . 9- 3 . 4+.8
-2.7
481,511 +2.8 13,236,832|88,340; — 1.2j 2.305.0621
45,978; —.9 1,121,604347,193' +4.4 9,810,166
+ ()-4.9+2.0
- . 4- . 4
- 2 . 0
+.1- 1 .
—. 6+2.4+2.5
-1.3+3.6- 1 . 4
- . 3-2.5
- 2 . 8- 4 . 3- 1 . 6- 5 . 0- 1 .+1.3-9.0+1.5-3.2
-2.0-6.7-6.3
o
Manufacturing
1
Num-ber ofestab-lish-
ments
2,440643365784
2732
137452
2,91680
647
3945421365424'390192
1,02'28836228691
1,293264231137661
556726237
1923138
108|16
2,670527j292!
1,851\
Num-ber on
pay rollJuly1939
change I roll (1
215,19854, 96735, 65188, 375
4632, 5399. 000
24,203
569. 50210, 64098,295
3,09276, 78744, 997
142, 46583,1.5889, 43920, 629
184,29035, 73473, 22762, 69512, 634
107, 54218,44028,11610. 37460, 612
37, 2244,7903,7271, 350
14, 898870
2, 746 j8,503
340l
Per-cent- Amount,age , orpay
from week)June Julv 19391939
Per-cent-age
changefromJune1939
Dollars+1.7! 5,186,737+4.2\ 1,397, ~-2.0j+2.0
0+2.8+ 1.4+.9+.6+.5
3 +••"0
+1.6-2.5
840,9992,013,519
11, 62268,869
228.635625, 755
9,991,648245,922
2,437,269
104, 7981, 377,496
994,980+1.81 2,090,519
- . 2 ! 1,138,941+ . 1| 1,268,728
- 3 . 2 332,995
+1.6
+1.4+1.8+3.3+.1
+3.4
+3.'93 -.5
+9.9+2.7
+16.5-2.6+4.8
- 1 6 . 1- 2 . 1
+36. 2i+5.3
255,42751, 824!29, 407
174,196.
3,148, 591724, 617
1, 238, 0591,020, 640
164,675
2, 266,187297,185518,161255, 678
/, 195,163
874,085122,01888, 26840, 481
369,88415,57062, 706
166. 3438,815
+5.3 6,575,762- . 6 . 1,298,239
-2.4l 682,115+8.7\ 4,595,4081
-0.6+.1
-6.7+.5- . 5
+2.7+.9
+2.3
-4.63 - . /
-2.2+.9
-10.7+2.2
- . 5- . 5
- 1 . 3
+.9- . 6- . 2
+3.0+3.0
-1.8+5.8-2.5+2.0
42
+.2- . 7
+7.0-8.4-2.8
-15.7-6.3
+13.1-7.0
-4.2-11.0-10.4-1.1
1 Includes banks and trust companies; construction, municipal, agricultural, and office employment;amusement and recreation; professional services; and trucking and handling.
»Includes laundering and cleaning; and water, light, and power.* Weighted percentage change.* Includes automobile and miscellaneous services; restaurants; and building and contracting.«Includes construction but not public works.« Does not include logging.r Includes banks; real estate; pipe-line transportation; motor transportation (other than operation and
maintenance); water transportation; hospitals and clinics; and personal, business, mechanical repair, andmiscellaneous services.
«Includes financial institutions, miscellaneous services, and restaurants.* Weighted percentage change, including hired farm labor.10 Less than Ho of 1 percent.« Includes automobile dealers and garages; and sand, gravel, and building stone.»Includes banks, insurance, and office employment.
Digitized for FRASER http://fraser.stlouisfed.org/ Federal Reserve Bank of St. Louis
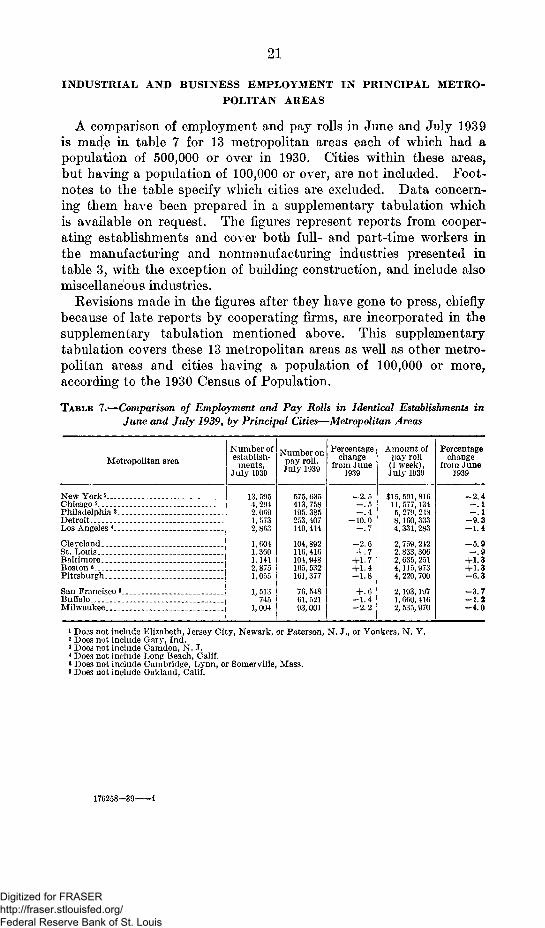
21
INDUSTRIAL AND BUSINESS EMPLOYMENT IN PRINCIPAL METRO-POLITAN AREAS
A comparison of employment and pay rolls in June and July 1939is made in table 7 for 13 metropolitan areas each of which had apopulation of 500,000 or over in 1930. Cities within these areas,but having a population of 100,000 or over, are not included. Foot-notes to the table specify which cities are excluded. Data concern-ing them have been prepared in a supplementary tabulation whichis available on request. The figures represent reports from cooper-ating establishments and cover both full- and part-time workers inthe manufacturing and nonmanufacturing industries presented intable 3, with the exception of building construction, and include alsomiscellaneous industries.
Revisions made in the figures after they have gone to press, chieflybecause of late reports by cooperating firms, are incorporated in thesupplementary tabulation mentioned above. This supplementarytabulation covers these 13 metropolitan areas as well as other metro-politan areas and cities having a population of 100,000 or more,according to the 1930 Census of Population.
TABLE 7.—Comparison of Employment and Pay Rolls in Identical Establishments inJune and July 1939, by Principal Cities—Metropolitan Areas
Metropolitan areaNumber ofestablish-
ments,July 1939
Number onpay roll,July 1939
Percentagechange
from June1939
Amount ofpay roll
(1 week),July 1939
Percentagechange
from J une1939
New York iChicago 2
Philadelphia 3.Detroit..Los Angeles 4_.
Cleveland..St. Louis.._Baltimore..Boston fiPittsburgh.
San Francisco 6_.BuffaloMilwaukee
13, 5954, 2942. 0091,5732, 863
1,0041, 3(503,1412,8751, 055
1,513745
1,004
575,035413,758195. 385253, 407149, 414
104,892110,41.0104, 948105, 532101, 377
76, 54861, 52193, 001
-2.5-.5
,i
-io!o—. 7
-2.6+.7+1.7+1.4-1.8
+.0-1.4-2.2
$15,591,81611,577,1345,279,2188,100,3334, 331, 283
2,759,2122. 833, 3002, 035, 2514,115,9734, 220, 700
2,193,1971,000,4102, 535, 970
-2.4-.1-.1-9.3-1.4
-5.9-.9+1.3+1.3-6.3
-3.7-1.2-4.0
1 Do3s not include Elizabeth, Jersey City, Newark, or Paterson, N. J., or Yonkers, N. Y.2 Does not include Gary, Ind.3 Does not include Camden, N. J.* Does not include Long Beach, Calif.8 Does not include Cambridge, Lynn, or Somerville, Mass.6 Does not include Oakland, Calif.
170258—39 4
Digitized for FRASER http://fraser.stlouisfed.org/ Federal Reserve Bank of St. Louis
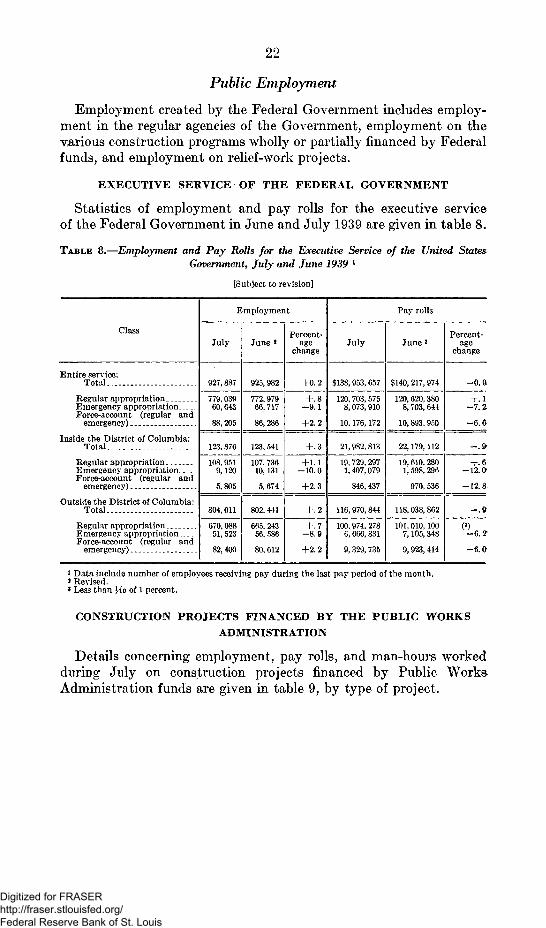
22
Public Employment
Employment created by the Federal Government includes employ-ment in the regular agencies of the Government, employment on thevarious construction programs wholly or partially financed by Federalfunds, and employment on relief-work projects.
EXECUTIVE SERVICE OF THE FEDERAL GOVERNMENT
Statistics of employment and pay rolls for the executive serviceof the Federal Government in June and July 1939 are given in table 8.
TABLE 8.—Employment and Pay Rolls for the Executive Service of the United StatesGovernment, July and June 1939 l
[Subject to revision]
Class
Entire service:Total.
Regular appropriation . _._ .P^mergency appropriationForce-account (regular and
emergency)
Inside the District of Columbia:Total
Regular appropriationEmergency appropriationForce-account (regular and
emergency)
Outside the District of Columbia:Total
Regular appropriation . . .Emergency appropriat ion. . . .Force-account (regular and
emergency) '_.
Employment
July
927,887
779,03960,643
88,205
123, 876
108. 9,r)19,120
5,805
804, 011
670,08851, 523
82, 400
June *
925,982
772,97966,717
86, 286
123,541
107, 73610, 131
5,674
802, 441
665, 24356, 586
80, 612
Percent-age
change
+0.2
+.8- 9 . 1
+2.2
+ . 3
+1.1-10.0
+2.3
+.2
+.7-8.9
+2.2
Pay rolls
July
$138, 953, 657
120, 703, 5758,073,910
10.176,172
21,982, 813
19, 729, 2971,407,079
846, 437
116,970,844
100, 974. 2786, 666, 831
9, 329, 735
June 2
$140,217,974
120, 620, 3808, 703, 644
10,893.950
22,179,112
19,610.2801, 598, 296
970,536
118,038,862
101,010.1007,105; 348
9, 923,414
Percent-age
change
-o.a+. 1
-7.2.
-6.6
- .9 '
+.6-12. a-12.8
- . 9
(3)-6.2
-6.0
* Data include number of employees receiving pay during the last pay period of the month.i Revised.' Less than Ho of 1 percent.
CONSTRUCTION PROJECTS FINANCED BY THE PUBLIC WORKS
ADMINISTRATION
Details concerning employment, pay rolls, and man-hours workedduring July on construction projects financed by Public WorksAdministration funds are given in table 9, by type of project.
Digitized for FRASER http://fraser.stlouisfed.org/ Federal Reserve Bank of St. Louis
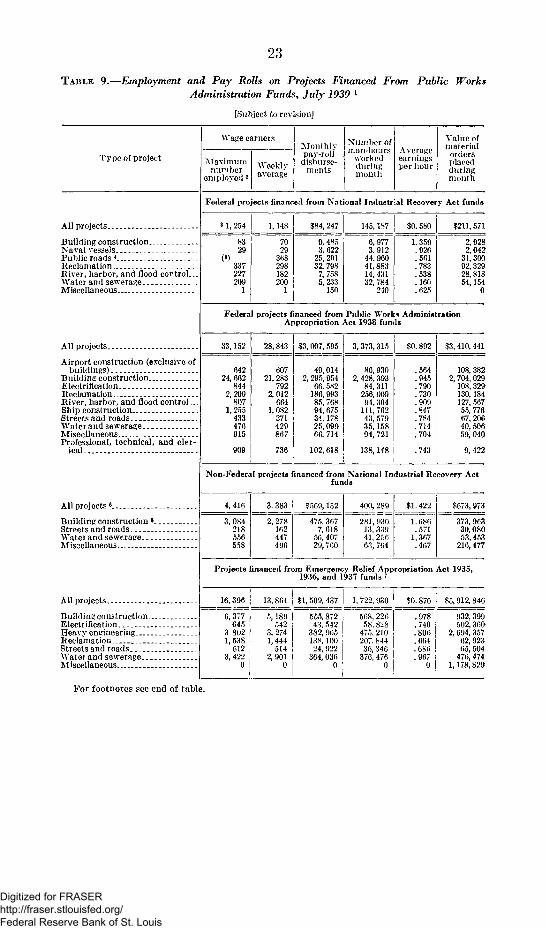
23
TABLE 9.—Employment and Pay Rolls on Projects Financed From Public WorksAdministration Funds, July 1939 1
[Subject to revision]
Type of project
Wage earners
Maximumnumber
employed 2Weeklyaverage
Monthlypay-roll
disburse-ments
Xumber ofman-hours
workedduringmonth
Averageearningsper hour
Value ofmaterial
oidersplacedduringmonth
Federal projects financed from National Industrial Recovery Act funds
All projects _
Building constructionNaval vesselsPublic roads 4
ReclamationRiver, harbor, and flood control...Water and sewerageMiscellaneous
All projects
Airport construction (exclusive ofbuildings)
Building constructionElectrificationReclamationRiver, harbor, and flood control .Ship constructionStreets and roadsWat er and sewerageMiscellaneousProfessional, technical, and cler-
ical
All projects 6 . . .
Building construction •.Streets and roadsWater and sewerageMiscellaneous
All projects
Building constructionElectrificationHeavy engineeringReclamationStreets and roadsWater and sewerage..Miscellaneous
For footnotes see end of table.
3 1, 254
8329
(5)337227209
1
1,148
7029
368298182200
1
$84, 247
9. 4853. 622
25, 20132, 798
7, 7585, 233
150
145,187
6, 9773.912
44. 96041,88314, 43132, 784
240
Federal projects financed from Public Worl<
33,152
64224, 662
8442, 209
8071, 255
433476915
909
Appropriation
28,843
60721, 283
7922, 012
6641,082
371429867
736
$3, 007, 595
49,0142, 295, 954
66, 582186, 99385. 76894,67534,17825.09966, 714
102,618
$0. 580
1. 359.926. 561.783. 538.160. 625
$211,571
2,9282,042
31,30092, 32928,81854,154
0
s Administration\c t 1938 funds
3,373,315
86, 9302, 428, 393
84,311256, 00994, 304
111,76243, 57935,15894, 721
138,148
$0.892
.564
.945
.790
.730
. 909
. S4.7
.784
.714
.704
.743
$3, 410,441
108, 3822, 704, 029
108, 329130,184127, 56755, 77667. 20640. 50659, 040
9, 422
Non-Federal projects financed from National Industrial Recovery Actfunds
4, 416
3,084218556558
3383
2.278162447496
$569,152
475, 3677,618
56, 40729, 760
400, 289
281,93013,33941,2f;663,764
$1,422
1. 686.571
1.367. 467
Projects financed from Emergency Relief Appropriation
16, 396
6,377645
3 8021, 538
6123,422
0
13, 864
5,189542
3, 2741, 444
5142, 901
0
1936, and 1937 funds -
$1, 509, 437
555,87243. 542
382, 965138.10024.922
304, 0360
1,722,930
568, 22658.828
475.210207.84436, 346
376, 4760
$0.876
.978
.740
. 806
. 664
. 686
. 9670
$673,973
373, 96330.08053, 453
216, 477
Act 1935,
$5,912,846
932,399502, 360
2. 694, 35762, 92365, 504
476, 4741,178,829
Digitized for FRASER http://fraser.stlouisfed.org/ Federal Reserve Bank of St. Louis
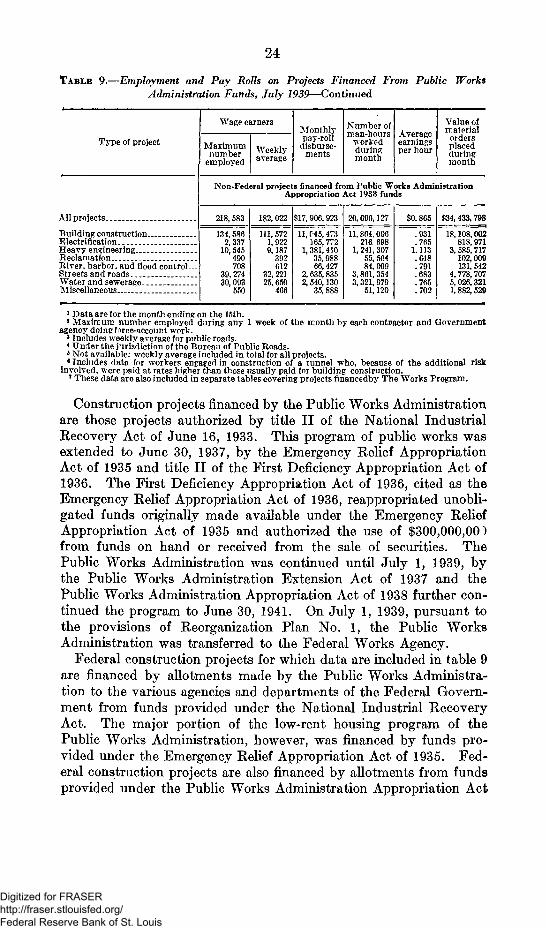
24
TABLE 9.—Employment and Pay Rolls on Projects Financed From Public WorksAdministration Funds, July 1939—Continued
Type of project
Wage earners
Maximumnumber
employedWeeklyaverage
Monthlypay-roll
disburse-ments
Number ofrnan-hours
workedduring;month
Averageearningsper hour
Value ofmaterialordersplacedduringmonth
Non-Federal projects financed from Public Works AdministrationAppropriation Act 1938 funds
All projects. __ _
Building constructionElectrificationHeavy engineeringReclamationJUver, harbor, and flood control...Streets and roadsWater and sewerageMiscellaneous
218, 583
134, 5802,33710, 545
490708
39, 27430, 093
550
182, 022
111,5721,9229,187392012
32, 22125, 050
400
$17, 900, 923
11,045,473105,772
1,381,41035, 98800, 427
2,035,8352,540,130
35, 888
20,090,127
11, 804. 090210. 098
1,241,30755, 50484, 009
3, 801, 3543, 321, 979
51,120
$0.805
.931
.7051.113.048.791.083.705.702
$34,433. 798
1 Data are for the month ending on the 15th.1 Maximum number employed during any 1 week of the month by each contractor and Government
agency doing force-account work.1 Includes weekly average for public roads.* Under the jurisdiction of the Bureau of Public Roads.3 Not available: weekly average included in total for all projects.«Includes data for workers engaged in construction of a tunnel who, because of the additional risk
involved, were paid at rates higher than those usually paid for building construction.T These data are also included in separate tables covering projects fmancedby The Works Program.
Construction projects financed by the Public Works Administrationare those projects authorized by title II of the National IndustrialRecovery Act of June 16, 1933. This program of public works wasextended to June 30, 1937, by the Emergency Relief AppropriationAct of 1935 and title II of the First Deficiency Appropriation Act of1936. The First Deficiency Appropriation Act of 1936, cited as theEmergency Relief Appropriation Act of 1936, reappropriated unobli-gated funds originally made available under the Emergency ReliefAppropriation Act of 1935 and authorized the use of $300,000,00)from funds on hand or received from the sale of securities. ThePublic Works Administration was continued until July 1, 1939, bythe Public Works Administration Extension Act of 1937 and thePublic Works Administration Appropriation Act of 1938 further con-tinued the program to June 30, 1941. On July 1, 1939, pursuant tothe provisions of Reorganization Plan No. 1, the Public WorksAdministration was transferred to the Federal Works Agency.
Federal construction projects for which data are included in table 9are financed by allotments made by the Public Works Administra-tion to the various agencies and departments of the Federal Govern-ment from funds provided under the National Industrial RecoveryAct. The major portion of the low-rent housing program of thePublic Works Administration, however, was financed by funds pro-vided under the Emergency Relief Appropriation Act of 1935. Fed-eral construction projects are also financed by allotments from fundsprovided under the Public Works Administration Appropriation Act
Digitized for FRASER http://fraser.stlouisfed.org/ Federal Reserve Bank of St. Louis
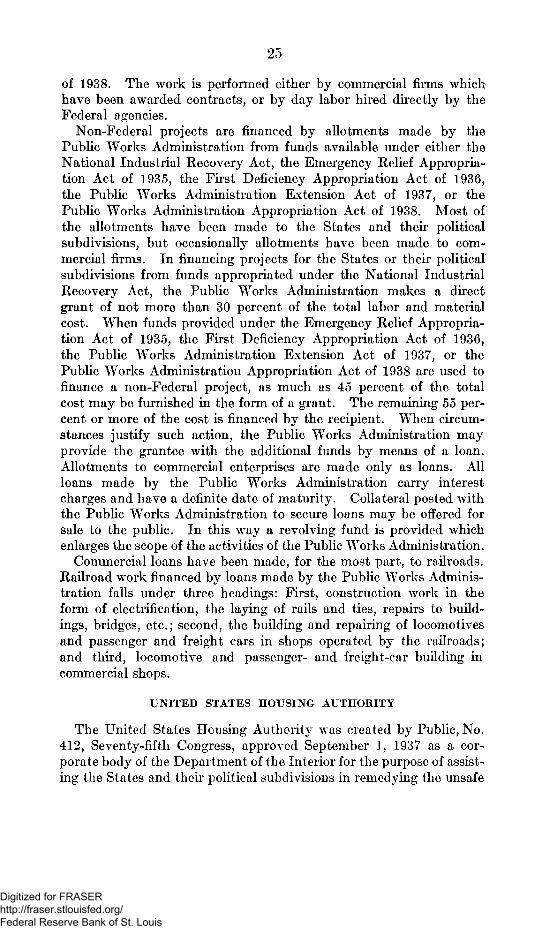
25
of 1938. The work is performed either by commercial firms whichhave been awarded contracts, or by day labor hired directly by theFederal agencies.
Non-Federal projects are financed by allotments made by thePublic Works Administration from funds available under either theNational Industrial Recovery Act, the Emergency Relief Appropria-tion Act of 1935, the First Deficiency Appropriation Act of 1936,the Public Works Administration Extension Act of 1937, or thePublic Works Administration Appropriation Act of 1938. Most ofthe allotments have been made to the States and their politicalsubdivisions, but occasionally allotments have been made to com-mercial firms. In financing projects for the States or their politicalsubdivisions from funds appropriated under the National IndustrialRecovery Act, the Public Works Administration makes a directgrant of not more than 30 percent of the total labor and materialcost. When funds provided under the Emergency Relief Appropria-tion Act of 1935, the First Deficiency Appropriation Act of 1936,the Public Works Administration Extension Act of 1937, or thePublic Works Administration Appropriation Act of 1938 are used tofinance a non-Federal project, as much as 45 percent of the totalcost may be furnished in the form of a grant. The remaining 55 per-cent or more of the cost is financed by the recipient. When circum-stances justify such action, the Public Works Administration mayprovide the grantee with the additional funds by means of a loan.Allotments to commercial enterprises are made only as loans. Allloans made by the Public Works Administration carry interestcharges and have a definite date of maturity. Collateral posted withthe Public Works Administration to secure loans may be offered forsale to the public. In this way a revolving fund is provided whichenlarges the scope of the activities of the Public Works Administration.
Commercial loans have been made, for the most part, to railroads.Railroad work financed by loans made by the Public Works Adminis-tration falls under three headings: First, construction work in theform of electrification, the laying of rails and ties, repairs to build-ings, bridges, etc.; second, the building and repairing of locomotivesand passenger and freight cars in shops operated by the railroads;and third, locomotive and passenger- and freight-car building incommercial shops.
UNITED STATES HOUSING AUTHORITY
The United States Housing Authority was created by Public, No.412, Seventy-fifth Congress, approved September 1, 1937 as a cor-porate body of the Department of the Interior for the purpose of assist-ing the States and their political subdivisions in remedying the unsafe
Digitized for FRASER http://fraser.stlouisfed.org/ Federal Reserve Bank of St. Louis
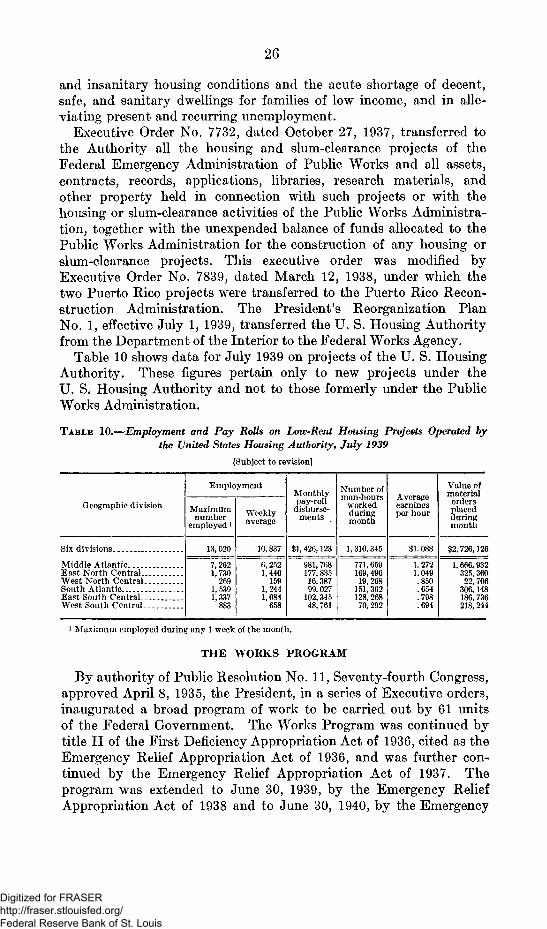
26
and insanitary housing conditions and the acute shortage of decent,safe, and sanitary dwellings for families of low income, and in alle-viating present and recurring unemployment.
Executive Order No. 7732, dated October 27, 1937, transferred tothe Authority all the housing and slum-clearance projects of theFederal Emergency Administration of Public Works and all assets,contracts, records, applications, libraries, research materials, andother property held in connection with such projects or with thehousing or slum-clearance activities of the Public Works Administra-tion, together with the unexpended balance of funds allocated to thePublic Works Administration for the construction of any housing orslum-clearance projects. This executive order was modified byExecutive Order No. 7839, dated March 12, 1938, under which thetwo Puerto Rico projects were transferred to the Puerto Rico Recon-struction Administration. The President's Reorganization PlanNo. 1, effective July 1, 1939, transferred the U. S. Housing Authorityfrom the Department of the Interior to the Federal Works Agency.
Table 10 shows data for July 1939 on projects of the U. S. HousingAuthority. These figures pertain only to new projects under theU. S. Housing Authority and not to those formerly under the PublicWorks Administration.
TABLE 10.—Employment and Pay Rolls on Low-Rent Housing Projects Operated bythe United States Housing Authority, July 1939
[Subject to revision]
Geographic division
Six divisions
Middle AtlanticEast North CentralWest North CentralSouth Atlantic _.East South CentralWest South Central
Employment
Maximumnumber
employed l
13,020
7,2621, 730
2691, 5391,337
883
Weeklyaverage
10,837
6,2521,440
1591,2441,084
658
Monthlypay-roll
disburse-ments
$1,426,123
981,768177,83516. 38799,027
102,34548,761
Number ofman-hours
workedduringmonth
1,310,345
771,659169,49619, 268
151,362128, 26870, 292
Averageearningsper hour
$1,088
1.2721.049.850. 654.798.694
Value ofmaterialordersplacedduringmonth
$2,726,126
1,666,932325, 36022,706
306,148186,736218,244
1 Maximum employed during any 1 week of the month.
THE WORKS PROGRAM
By authority of Public Resolution No. 11, Seventy-fourth Congress,approved April 8, 1935, the President, in a series of Executive orders,inaugurated a broad program of work to be carried out by 61 unitsof the Federal Government. The Works Program was continued bytitle II of the First Deficiency Appropriation Act of 1936, cited as theEmergency Relief Appropriation Act of 1936, and was further con-tinued by the Emergency Relief Appropriation Act of 1937. Theprogram was extended to June 30, 1939, by the Emergency ReliefAppropriation Act of 1938 and to June 30, 1940, by the Emergency
Digitized for FRASER http://fraser.stlouisfed.org/ Federal Reserve Bank of St. Louis
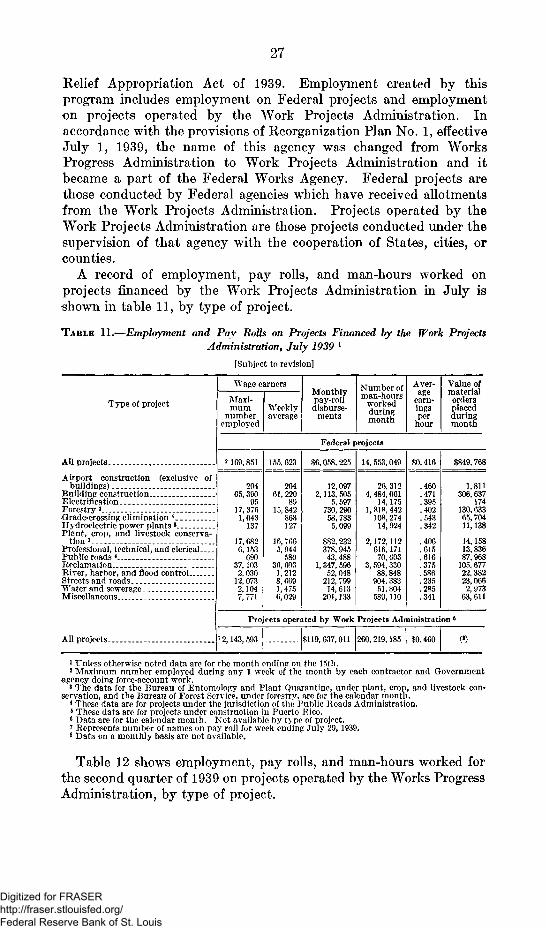
27
Relief Appropriation Act of 1939. Employment created by thisprogram includes employment on Federal projects and employmenton projects operated by the Work Projects Administration. Inaccordance with the provisions of Reorganization Plan No. 1, effectiveJuly 1, 1939, the name of this agency was changed from WorksProgress Administration to Work Projects Administration and itbecame a part of the Federal Works Agency. Federal projects arethose conducted by Federal agencies which have received allotmentsfrom the Work Projects Administration. Projects operated by theWork Projects Administration are those projects conducted under thesupervision of that agency with the cooperation of States, cities, orcounties.
A record of employment, pay rolls, and man-hours worked onprojects financed by the Work Projects Administration in July isshown in table 11, by type of project.
TABLE 11.—Employment and Pay Rolls on Projects Financed by the Work ProjectsAdministration9 July 1939 l
[Subject to revision]
Type of project
All projects _
Airport construction (exclusive ofbuildings)
Build ing constructionElectrificationForestry 3•Grade-crossing elimination 4
Hydroelectric power plants 5
Plant, crop, and livestock conserva-tion 3
Professional, technical, and clericalPublic roads 4
ReclamationRiver, harbor, and flood controlStreets and roadsWater and sewerageMiscellaneous
Wage earners
Maxi-mum
numberemployed
Weeklyaverage
Monthlypay-rolldisburse-
ments
Number ofman-hours
workedduringmonth
Aver-age
earn-ingsper
hour
Value ofmaterialordersplacedduringmonth
Federal projects
M09,851
20465, 3G0
9517,376
1,043137
17,682C, 1.53
69037,1032,030
12,0732,104 '7, 771
155,623
20461,220
8915,842
863127
16,7665, 944
58036, 6031,2128, 6691,4756,029
$6,058, 225
12,0972,113,505
5, 597730, 290
58,7835,099
882, 232378, 945
43, 4881,347, 596
52,048212,79914,613
201,133
14, 553,049
26,3124,484,061
14,1751,818,442
108, 27414,924
2,172,112616, 17170, 603
3, 594, 33088,848
904, 38351.304
589,110
$0.416
.460
.471
. 395
.402
.543
.342
.406
.615
.616
.375
.586
. 235
. 285
.341
$849, 768
1,811306, 637
174130,63365,70411,138
14,15813,83687,968
105, 67722, 38223,066
2, 97363,611
Projects operated by Work Projects Administration 6
All projects . 72,143, 593 $119,637,011 260,219,185 $0. 460
1 Unless otherwise noted data are for the month ending on the loth.2 Maximum number employed during any 1 week of the month by each contractor and Government
agency doing force-account work.3 The data for the Bureau of Entomology and Plant Quarantine, under plant, crop, and livestock con-
servation, and the Bureau o! Forest Service, under forestry, are for the calendar month.4 These data are for projects under the jurisdiction of the Public Roads Administration.5 These data are for projects under construction in Puerto Rico.c Data are for the calendar month. Not available by type of project.7 Represents number of names on pay roll for week ending July 29, 1939.8 Data on a monthly basis are not available.
Table 12 shows employment, pay rolls, and man-hours worked forthe second quarter of 1939 on projects operated by the Works ProgressAdministration, by type of project.
Digitized for FRASER http://fraser.stlouisfed.org/ Federal Reserve Bank of St. Louis
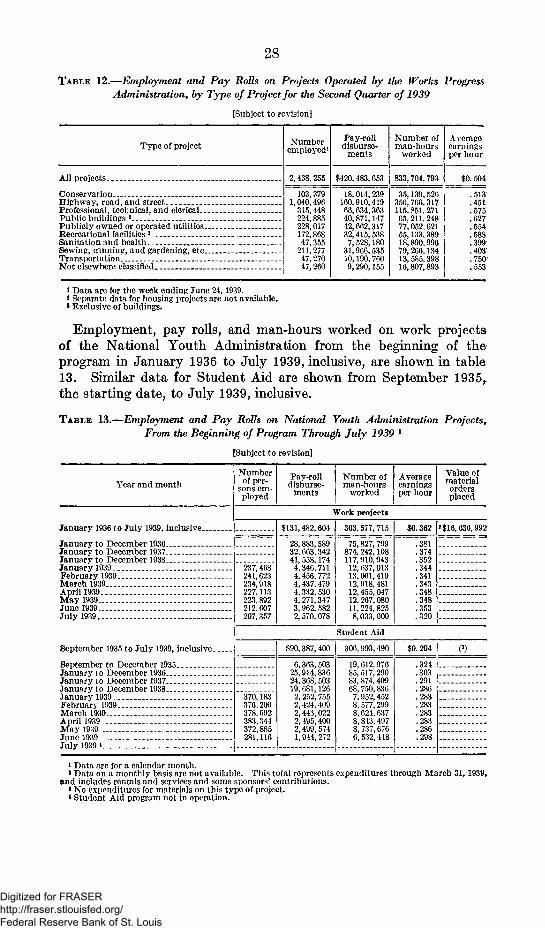
28
TABLE 12.—Employment and Pay Rolls on Projects Operated by the Works ProgressAdministration, by Type of Project for the Second Quarter of 1939
[Subject to revision]
Type of project
All projects _ _ .
Conservation . . .Highway, road, and streetProfessional, technical, and clericalPublic buildings 2
Publicly owned or operated utilities _._Recreational facilities 3
Sanitation and healthSewing, canning, and gardening, etc.Transportation . . . _Not elsewhere classified
Numberemployed 1
2,438,255
103,3791,040,496
315,448224,885228.017172,86847,355
211,27747,27047, 260
Pay-rolldisburse-
ments
$420,483,653
18.014,239160,910.41966,634.36340,871,14742,662,31732,415,538
7,528,18031,966, 53510,190, 7609,290,155
Number ofman-hours
worked
833,704, 793
35,139.526356,766,317115.851.27165,211,24877,052. 62155,133,38918,890,99679,266,13413, 585,39816,807,893
Averageearningsper hour
$0.504
.513
. 451
.575
.627
.554
.588
.399
.403
.750
.553
1 Data arc for the week ending June 24, 1939.> Separate data for housing projects are not available.1 Exclusive of buildings.
Employment, pay rolls, and man-hours worked on work projectsof the National Youth Administration from the beginning of theprogram in January 1936 to July 1939, inclusive, are shown in table13. Similar data for Student Aid are shown from September 1935y
the starting date, to July 1939, inclusive.
TABLE 13.—Employment and Pay Rolls on National Youth Administration Projects,From the Beginning of Program Through July 1939 *
[Subject to revision]
Year and monthNumberof per-
sons em-ployed
Pay-rolldisburse-
ments
Number ofman-hours
worked
Averageearningsper hour
Value ofmaterialordersplaced
Work projects
January 1936 to July 1939, inclusive..
January to December 1936..January to December 1937..January to December 1938..January 1939February 1939March 1939... ._.April 1939May 1939June 1939July 1939
237,468241,623234,918227.113223.892212,607207,357
$131,482,604 363,577,715
28,883,58932,663,34241, 558,174
4,346,7114,456,7724, 437. 4794,332, 5304,271,3473,962. 5822,570,078
75,827, 799874.242,108117,910,943
12,637.01313,061,41912,918,48112, 455,04712, 267,08011,224,8258,033,000
$0.362
.381
.374
.352
.344
.341
.343
.348
.348
.353
.320
»$16,636,992'
SIndent Aid
September 1935 to July 1939, inclusive.
September to December 1935.January to December 1936January to December 1937January to December 1938January 1939February 1939March 1939April 1939May 1939June 1939July 1939*
370,183376.209378,692383.344372,885281,116
$90,387,400 306,993,490
6,363,50325,914,83624,368, 50319,681,126
2, 252,7552,424,4092,443,0222,495,4002,499,5741,941,272
19,612.97685,517,29083,874,40968,750,836
7,952,4528. 577,2998,6216378, 813,4978, 737,6766,532,418
$0. 294
.324
.303
.291
.2H6
.283
.283
. 283
.283
. 286
.298
i Data arc for a calendar month.* Data on a monthly basis are not available. This total represents expenditures through March 31, 1939,
and includes rentals and services and some sponsors' contributions.» No expenditures for materials on this type of project.4 Student Aid program not in operation.
Digitized for FRASER http://fraser.stlouisfed.org/ Federal Reserve Bank of St. Louis
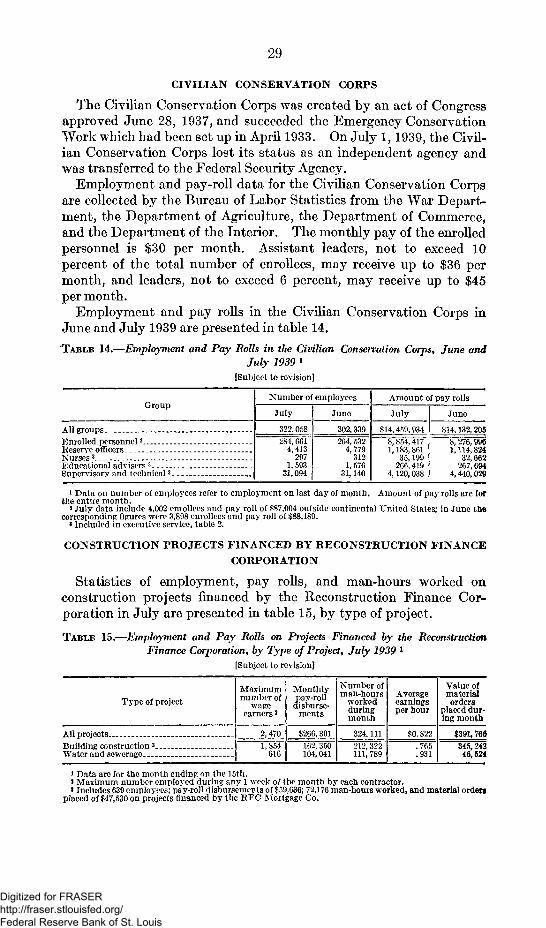
29
CIVILIAN CONSERVATION CORPS
The Civilian Conservation Corps was created by an act of Congressapproved June 28, 1937, and succeeded the Emergency ConservationWork which had been set up in April 1933. On July 1, 1939, the Civil-ian Conservation Corps lost its status as an independent agency andwas transferred to the Federal Security Agency.
Employment and pay-roll data for the Civilian Conservation Corpsare collected by the Bureau of Labor Statistics from the War Depart-ment, the Department of Agriculture, the Department of Commerce,and the Department of the Interior. The monthly pay of the enrolledpersonnel is $30 per month. Assistant leaders, not to exceed 10percent of the total number of enrollees, may receive up to $36 permonth, and leaders, not to exceed 6 percent, may receive up to $45per month.
Employment and pay rolls in the Civilian Conservation Corps inJune and July 1939 are presented in table 14.TABLE 14.—Employment and Pay Rolls in the Civilian Conservation Corps, June and
July 1939 1
[Subject to revision]
Group
All groups _Enrolled personnel2
Reserve officers ._
Educational advisers 3 _Supervisory and technical3 _ _ _
Number of employees
July
322.058281,661
4,413207
1,59331,094
June
302,339264, 532
4,779312
1,57631,140
Amount of pay rolls
July
$14,459,9348,854,4171,183,861
35 199266,419
4,120,038
June
$14,132,2058, 276,9961,114,824
32 662267,694
4, 440,029
1 Data on number of employees refer to employment on last day of month. Amount of payrolls are forthe entire month.
2 July data include 4,002 enrollees and pay roll of $87,004 outside continental United States; in June thecorresponding figures wore 3,898 enrollees and pay roll of $88,189.
»Included in executive service, table 2.
CONSTRUCTION PROJECTS FINANCED BY RECONSTRUCTION FINANCECORPORATION
Statistics of employment, pay rolls, and man-hours worked onconstruction projects financed by the Reconstruction Finance Cor-poration in July are presented in table 15, by type of project.
TABLE 15.—Employment and Pay Rolls on Projects Financed by the ReconstructionFinance Corporation, by Type of Project, July 1939 *
[Subject to revision]
Type of project
All projects.— _-Building construction 3 _. _ ._ _ _.Water and sewerage
Maximumnumber of
wageearners2
2,4701,854
616
Monthlypay-rolldisburse-
ments
$266,391102, 350104, 041
Number ofman-hours
workedduringmonth
324,111212,322111,789
Averageearningsper hour
$0.822. 765.931
Value ofmaterialorders
placed dur-ing month
$391,766345,24246,524
i Data arc for the month ending on the 15th.1 Maximum number employed during any 1 week of the month by each contractor.* Includes 639 employees; pay-roll disbursements of $59,636; 72,176 man-hours worked, and material orderi
placed of $47,530 on projects financed by the 1\YC Mortgage Co.
Digitized for FRASER http://fraser.stlouisfed.org/ Federal Reserve Bank of St. Louis
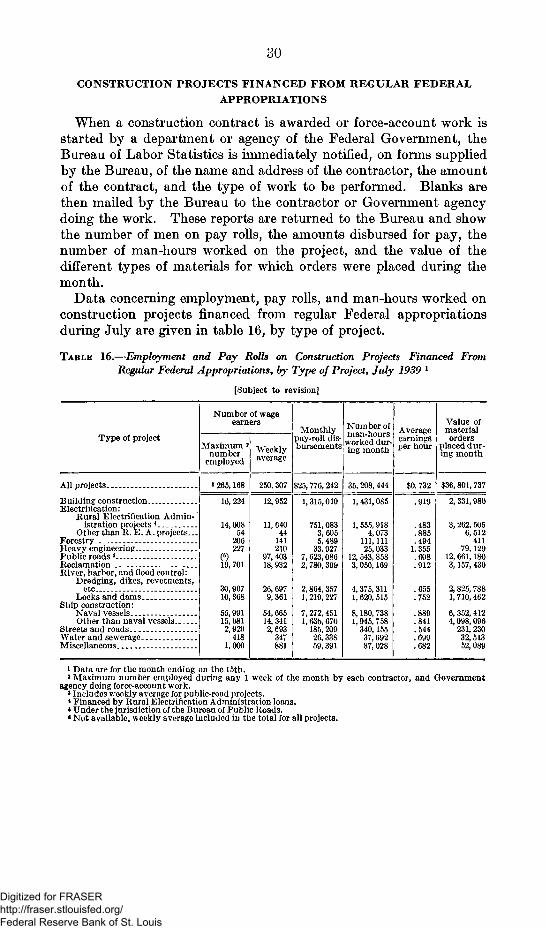
30
CONSTRUCTION PROJECTS FINANCED FROM REGULAR FEDERALAPPROPRIATIONS
When a construction contract is awarded or force-account work isstarted by a department or agency of the Federal Government, theBureau of Labor Statistics is immediately notified, on forms suppliedby the Bureau, of the name and address of the contractor, the amountof the contract, and the type of work to be performed. Blanks arethen mailed by the Bureau to the contractor or Government agencydoing the work. These reports are returned to the Bureau and showthe number of men on pay rolls, the amounts disbursed for pay, thenumber of man-hours worked on the project, and the value of thedifferent types of materials for which orders were placed during themonth.
Data concerning employment, pay rolls, and man-hours worked onconstruction projects financed from regular Federal appropriationsduring July are given in table 16, by type of project.
TABLE 16.—Employment and Pay Rolls on Construction Projects Financed FromRegular Federal Appropriations, by Type of Project, July 1939 1
[Subject to revision]
Type of project
All projects
Building construction.Electrification:
Rural Electrification Admin-istration projects A
Other than It. E. A. projects-ForestryHeavy engineering._Public roads 5
ReclamationRiver, harbor, and ilood control:
Dredging, dikes, revetments,etc
Locks and damsShip construction:
Naval vessels. _Other than naval vessels
Streets and roadsWater and se werageMiscellaneous
Number of wageearners
3 265,168
16, 224
14,00854
206227
(6)19,701
30,96710, 368
55,99115, 0812,920
4181,000
250, 307
12, 952
11, 64044
141210
97, 40318, 932
26, 6979,361
54,66514, 3412, 693
347881
Monthlypay-roll dis-bursements
Number ofman-hours
worked dur-ing month
$25,776, 242
1,315,010
751,0833, 6055,489
33,9277, 623,0862, 780, 399
2,864, 3571,219,227
7, 272, 4511,636,670
185,20926, 33859, 391
35, 208, 444
1, 431,085
1,555,9184,073
111,11125,033
12, 543, 8583,050,169
4,375,3111, 620, 515
8,180,7381,945, 758
340,15537, 69287,028
Averageearningsper hour
;0. 732
.919
.483
.885
.4941.355.608.912
.655
.752
.841
.544
Value ofmaterialorders
placed dur-ing month
$36,801,737
2, 331,980
3, 262, 5056,512
41179,129
12, 661,1803, 157, 430
2, 825, 7881, 710, 462
6,352,4124,098,096
231, 23032, 51352, 089
* Data are for the month ending on the 15th.i Maximum number employed during any 1 week of the month by each contractor, and Government
agency doing force-account work.8 Includes weekly average for public-road projects.* Financed by Rural Electrification Administration loans.* Under the jurisdiction of the Bureau of Public Roads.•Not available, weekly average included in the total for all projects.
Digitized for FRASER http://fraser.stlouisfed.org/ Federal Reserve Bank of St. Louis

31
STATE-ROADS PROJECTS
A record of employment and pay-roll disbursements in the con-struction and maintenance of roads financed wholly from State orlocal funds in July 1939, compared with June 1939 and July 1938, ispresented in table 17.
TABLE 17.—Employment and Pay Roils on Construction and Maintenance of State
Roads, July 1939, June 1939, and July 1938 *
[Subject to revision]
Item
Total
New roadsMaintenance
Number of employees 2
1July 1939,! June 1939
1
140,202 j 141,750
20,045 | 20,17V120,157 j 121,573
July 1938
199,470
30,504108,900
Pay-roll disbursements
July 1939 j June 1939
$10,521,530 $10,743,330
1,310,890 | 1,417,3009,210,040 ! 9,320,030
July 1938
$12,982,940
1,940,49011,042, 450
1 Data are for the month ending on the 15th and are for projects financed wholly from State or localfunds* Average number working during month.
O
Digitized for FRASER http://fraser.stlouisfed.org/ Federal Reserve Bank of St. Louis