Embed Size (px)
Citation preview

Report No. 438
Employment and Unemployment Situation Among Religious Groups in
India, 1993-94
Fifth Quinquennial Survey NSS 50th Round
July 1993 - June 1994
National Sample Survey Organisation Department of Statistics
Government of India
June 1998

Preface
The National Sample Survey Organisation (NSSO) has been carrying out all-India surveys quinquennially on consumer expenditure, employment & unemployment. The fifth quinquennial survey on consumer expenditure, employment & unemployment was conducted during the 50th round (July1993-June1994) of NSS. The present report is based on data collected in that round. The previous four quinquennial surveys were conducted during the 27th (October 1972 - September 1973), the 32nd (July 1977 - June 1978), the 38th (January- December 1983) and the 43rd (July 1987 - June 1988) rounds. The concepts used for this survey were essentially similar to that adopted in the previous quinquennial rounds to facilitate comparability of estimates. This report attempts comparative analysis of levels of monthly per capita expenditure, land cultivation, etc., of the households and of ‘Labour Force Participation’ of persons belonging to various religious groups at all India level and for the major states. Seven religious groups have been considered for the study viz., the Hindus, Muslims, Christians, Sikhs, Jains, Buddhists and the Parsis. The report consists of four chapters and related tables. Chapter 1 is introductory, Chapter 2 sets out the conceptual framework, Chapter 3 gives the sample design and estimation procedure adopted in the survey and Chapter 4 gives the main findings of the report. The field work of the survey was done by the Field Operations Division, data processing and tabulation work were carried out by the Data Processing Division and the Computer Centre, respectively. The Survey Design and Research Division was responsible for designing the survey and preparation of the report. I am thankful to the members of the Working Group for their valuable guidance at various phases of the survey work starting from finalisation of the sample design/schedules of enquiry to preparation of this report. I am also thankful to the members of the Governing Council, Heads of various Divisions of NSSO and their colleagues for the efforts in preparing the report which, I am sure, will serve as a reference document to planners and policy makers. June, 1998 S. Ray Chief Executive Officer National Sample Survey Organisation

Employment and Unemployment Situation Among Religious Groups in India, 1993-94
Contents Pages Chapter One: Introduction 1 Chapter Two: Conceptual Framework 2 - 7 Chapter Three: Sample Design & Estimation Procedure 8 - 11 Chapter Four: Main Findings 12 - 58 Appendix: Detailed Tables A1 - A97

Highlights
• The survey collected information on
religions followed by each household. Seven main religions were considered for the survey. They were Hinduism, Islam, Christianity, Sikhism, Jainism, Buddhism and Zoroastrianism. Among them Hinduism, Islam and Christianity were found to be the three major religions in India. The other religious groups were concentrated in a few states and union territories. During 1993-94, about 86% of rural households were following Hinduism and 9% Islam. In urban areas, the corresponding percentages were 80 and 14, respectively. Only 2 to 3 per cent of households reported to follow Christianity.
• The sex ratio was the highest among the
Christians (998 in rural and 984 in urban areas) followed by the Muslims (rural: 960; urban: 909) and the Hindus (rural: 941; urban: 900).
• The size of an average Indian household
has been estimated as 4.9 and 4.4 in rural and urban areas, respectively. Both the Hindu and Christian households had sizes less than or equal to the national average while the size of the Muslim households was above the national average in both the sectors.
• In rural India, the proportion of persons
belonging to the bottom two deciles of MPCE was the maximum for the Muslims (20%) followed by the Hindus (19%) and the Christians (16%). On the contrary, the proportion of persons belonging to the top two deciles was 31% for the Christians followed by the Hindus (19%) and the Muslims (15%). As in rural India, a similar order among these religious groups is observed in urban India.
• The proportion of landless households was highest for the Christians (51%) followed by the Muslim (49%) and the Hindus (37%). The proportion of marginal farmer households were 35 to 36% for these religious groups. Between the period 1987-88 and 1993-94, the proportion of households cultivating land less than 1.00 hectare and particularly, the landless households have increased.
• In rural areas, ‘self-employment in
agriculture’ was the mainstay for all the religious groups. The proportion of rural labour households varied from 35 (Muslims) to 40% (Christians). In urban areas, the proportion of households, among all ‘types’, depending on ‘regular wage salary’ was the highest for the Christians (54%) and the Hindus (46%) whereas majority of the Muslim households (48%) depended on ‘self-employment’ for their livelihood.
• The age distribution for the Muslims are
over-burdened with children as compared to the Hindus and the Christians. The share of aged population to total is also lowest among the Muslims and highest among the Christians.
• The Christians had the highest literary rate
and the rate among the Hindus was higher than that among the Muslims. Compared to 1987-88, the school attendance rate had increased for all the school going age groups between 5 to 24 years during 1993-94.
• The WPR among the rural males was
highest for the Hindus (559) followed closely by the Christians (554). For rural females, although the WPRs among the Christians (360) and the Hindus (346) were

close to each other, they were lower than the males. The corresponding rates for the Muslims were considerably low both for males (494) and females (162). In urban India, the WPRs among the males were close to each other for all the three major religious groups. Further, WPRs were much higher among Christian women than among their Hindu and Muslim sisters.
• The quality of workforce in terms of
educational level is much better for the Christians than that for the Hindus and the Muslims and also, the Hindus are better off than the Muslims.
• Compared to all-household, the WPR was
marginally lower for the landless households and was marginally higher for the marginal farmer households.
• In the rural areas, the proportion of workers engaged in the ‘agriculture’ sector was highest among the Hindus and lowest among the Muslims. In the urban areas, a large section of workers was engaged in the ‘tertiary’ sector. In general, the proportion of workers had increased for the ‘tertiary’ sector between the periods 1987-88 and 1993-94.
• Among the educated (secondary & above),
the unemployment rate was as high as 16 to 19 for female as against 6 to 7% for males. Since 1987-88, the unemployment rate among the educated decreased for the Hindus and the Christians, and increased for the Muslims in 1993-94 in rural areas. The urban rate did not show any uniform trend.

Report 438: Employment and Unemployment Situation Among Religious Groups in India, 1993-94; NSS 50th Round
Chapter One
Introduction 1.0 The National Sample Survey Organisation (NSSO) carried out its fifth quinquennial survey on employment - unemployment and household consumer expenditure in its 50th round conducted during the period July 1993 to June 1994. Based on the data collected from the ‘central sample’ (i.e. the samples surveyed by NSSO), six reports on employment - unemployment have already been brought out. The present report, deals with the employment - unemployment situation of the people belonging to different religions. For each household surveyed, the religion followed by the head of the household was collected. The religion of the head was considered as the religion of the household irrespective of the religion of other members. Seven religions viz. Hinduism, Islam, Christianity, Sikhism, Jainism, Buddhism and Zoroastrianism were considered for data collection. Some results like, distribution of households, population; distribution of households by household type, land cultivated class, monthly per capita expenditure class and the worker population ratio, proportion unemployed, etc. have been obtained for each religions from the survey. Utilising this information, some selected tables by religious group were generated. This report is based on the tables thus generated from the central sample data. 1.1 Geographical Coverage : The fifth quinquennial survey covered the entire Indian Union excepting certain interior areas of Nagaland and Andaman & Nicobar Islands. In the state of Jammu & Kashmir, only 3 districts, namely, Jammu, Kathua and Udhampur could be surveyed out of a total of 14 districts in the state. Thus, estimates for the corresponding state/union territory as well as for the country presented in this report are based on the areas other than those left out from the survey. 1.2 Sample Size : The survey altogether covered 115,409 households (69,230 rural and
46,179 urban households) spread over 6983 sample villages and 4670 urban blocks in the central sample. Out of these 115,409 households surveyed at the national level , 91,507 households belonged to Hinduism, 12,090 households to Islam, 6,536 households to Christianity, 2,582 households to Sikhism, 442 households to Jainism and 997 households belonged to Buddhism. The survey could capture only 36 households in the sample at the all-India level, reporting Zoroastrianism as their religion. 1.3 It is evident that the sample sizes pertaining to the religious groups other than those following Hinduism, Islam and Christianity are considerably small even at the all-India level and that too are concentrated in certain states/u.t’s. The estimates based on such small samples may not reveal the true situation and hence any estimate relating to these religious groups is to be used with a great deal of caution. In this report, therefore, the estimates are given for 15 major states and all-India only. However, the estimates for all-India are inclusive of all the states and union territories. 1.4 Contents of the Report : The present report consists of four chapters including this introductory first chapter. The next chapter describes the conceptual framework of the survey. While Chapter Three describes the sample design and estimation procedure adopted in the survey, main findings on employment - unemployment situation among different religious groups and their broad household and population characteristics are discussed in Chapter Four. Summary statements relating to 15 major states are given at the end of Chapter Four. The detailed tables for all-India are given in the Appendix.

Chapter Two Conceptual Framework
Report 438: Employment and Unemployment Situation Among Religious Groups in India, 1993-94; NSS 50th Round
Chapter Two
Conceptual Framework
2.1 The NSSO surveys on employment and unemployment aim to measure the extent of ‘employment’ and ‘unemployment’ in quantitative terms disaggregated by various household and population characteristics . The persons surveyed are classified in to various activity categories on the basis of the activities pursued by them during certain specified reference periods. Three reference periods are used in these surveys. These are (i) one year, (ii) one week and (iii) each day of the week. Based on these three periods three different measures are arrived at. These are termed as usual status, current weekly status, and the current daily status . As far as this report is concerned, the estimates of employment - unemployment indicators have been obtained from the data collected in the usual status approach. Therefore, the concepts of usual status are described below.
2.2 Classification according to Usual Status. In this approach the status of activity on which a person spent relatively longer time of the preceding 365 days from the date of survey is considered as the principal usual status activity of the person. Accordingly, a person is con-
sidered ‘working or employed’ if the person was engaged for a
relatively longer time during the past year in any one or more work-related activities (economic activities). The person is considered as ‘seeking or available’ for work or ‘unemployed’ if the person was not working but was either seeking or was available for work for a relatively longer time during the past year. If the person was engaged in any
non-economic activities for a relatively longer time of the reference year he/she is considered as ‘out of labour force’. The specific activity category is determined on the basis of time spent criterion. i.e. the activity on which major time was spent being assigned as the usual status activity. A person categorised as ‘worker’ or ‘employed’ on the basis of the principal status is called a ‘principal status worker’ or ‘principal status employed’. A person categorised as a non-worker (i.e. unemployed or out of labour force) who pursued some economic activity in a subsid-iary capacity is called a ‘subsidiary status worker’ or ‘subsidiary status employed’. These two groups viz. principal status workers and subsidiary status workers together constitute ‘all workers’ according to the usual status classification.
The various activity categories along with the codes used for usual status classification are given in the box below. code description
[activities for working(employed) persons] 11 worked in household enterprise (self-employed) as an own account worker 12 worked in household enterprise (self- employed) as an employer 21 worked in household enterprise as a helper 31 worked as regular salaried/wage employee 41 worked as casual labour in public works 51 worked as casual labour in other types of works
[unemployed]
81 seeking or available for work
Usual Status : Principal Status and Subsidiary Status

Chapter Two Conceptual Framework
Report 438: Employment and Unemployment Situation Among Religious Groups in India, 1993-94; NSS 50th Round
[out of labour force activities] 91 attended educational institutions 92 attended domestic duties only 93 attended domestic duties and was also enga- ged in free collection of goods (vegetables, roots, fire-wood, etc. for household ) 94 rentiers, pensioners, remittance recipients, etc. 95 not able to work due to disability 96 beggars, prostitutes, etc. 97 others 99 infants of age 0-4 years.
Activities coded 11-51 are those applicable for persons who are classified as workers while 91-99 apply to those who are out of labour force. Detailed definitions of these categories are given elsewhere in this section. Code 81 is assigned to an unemployed.
2.3 As can be seen in the above paragraph, central to the concept of identifying a worker is the engagement in any economic activity. The concept of economic activity as used in the NSS is explained now.
Economic activity is any activity that results in production of goods and services that adds
value to national product. Such activities include pro-duction of all goods and ser-vices for market i.e. produc-tion for pay or profit and the production of primary com-
modities for own consumption and own account production of fixed assets, among the non-market activities. The entire spectrum of human activity falls in two categories: eco-nomic and non-economic activities. The economic activities have two parts:- market activities and non-market activities. Market activities are those that involve remuneration to those who perform it i.e. activity performed for pay or profit. These are essentially production of goods including those of Gov-
ernment services etc. Non market activities are the production for own consumption of primary products and own account production of fixed assets. The full spectrum of economic activities as defined in the UN system of National Accounts is not covered in the defini-tion adopted for the current survey or in the previous surveys. The term economic activity as adopted in the 50th round survey include:
i) All the market activities described above i.e. the activities performed for pay or profit which result in production of goods and services for ex-change.
ii) Of the non-market activities, a) all the activities relating to the agricultural sector (industry section 0 of NIC 1987) which results in production (including gathering of uncultivated crops, forestry, collection of firewood, hunting, fishing etc.) of agricultural produce for consumption and b) the activities relating to the own-account production of fixed assets. Own account production of fixed assets include construction of own houses, roads, wells, etc., and of machinery, tools etc. for household enterprise and also construction of any private or community facilities free of charge. A person may be engaged in own-account construction either in the capacity of a labour or a supervisor.
2.4 In this context, it may be noted that hitherto in NSS the term used was ‘gainful activity’. The above definition is very close to the ‘gainful activity’ concept except for the inclusion of own-account production of fixed assets. The contribution of this component was found to be negligible from a separate tabula-
Concept of
economic activity

Chapter Two Conceptual Framework
Report 438: Employment and Unemployment Situation Among Religious Groups in India, 1993-94; NSS 50th Round
tion of this component in the 43rd round survey and as such the comparability of the survey results will be unaffected by this change.
2.5 According to the international standards the term ‘economically active population’ comprises of persons of either sex who furnish the supply of labour for production of goods and services as defined in the United Nations system of national accounts and balances during a specified time reference period. According to these systems, the production of goods and services includes all production and processing of primary products, whether for market, for barter or for own consumption, the production of all other goods and services for the market and, in the case of households which produce such goods and services for the market, the corresponding production for own consumption.1 The definition adopted in the NSS follow the above approach very closely except for the ‘processing of primary commodities for own consumption by the producers of these items’ which is not covered by the NSS definition. Further the international standards use the term ‘economically active population’ as a generic term and use two other measures viz. the ‘usually active population’ in relation to a long reference period such as a year and the ‘currently active population’ measured in relation to a short reference period such as a week or a day. Generally the term ‘labour force’ is used to denote the currently active population. In this report the term labour force is meant to imply the population comprising the employed and the unemployed. In conventional terms, the employed,
1 Surveys of econo-mically
active population, employment, unemployment and underemployment: An ILO manual on concepts and me-thods, I L O , Geneva, 1990.
unemployed and those in the labour force are defined as follows.
2.6 Workers or Employed : Persons who are engaged in any economic activity or who despite their attachment to economic activity have abstained for reason of illness, injury or other physical disability, bad weather, festivals, social or religious functions or other contingencies necessitating temporary absence from work constitute workers. Unpaid helpers who assist in the operation of an economic activity in the household farm or non-farm activities are also considered as workers.
2.7 Seeking or Available for Work or Unemployed : Persons who owing to lack of work had not worked but either sought work through employment exchanges, intermediaries, friends or relatives or by making applications to prospective employers or expressed their willingness or availability for work under the prevailing condition of work and remuneration are considered as those ‘seeking or available for work or as unemployed’.
2.8 Labour Force and Those Out of Labour Force : Persons who are either ‘working’ or seeking or available for work (i.e. unemployed) during the reference period constitute the labour force. Persons who were neither working and at the same time were not seeking nor available for work during the reference period are considered to be ‘ out of labour force’. The persons under this category are students, those engaged in domestic duties, rentiers, pensioners, recipients of remittances, those living on alms, infirm or disabled, too young or too old, prostitutes, smugglers etc., and casual workers not working due to sickness etc.. However a domestic servant who is considered as a member of the employer’s

Chapter Two Conceptual Framework
Report 438: Employment and Unemployment Situation Among Religious Groups in India, 1993-94; NSS 50th Round
household is treated as a worker though he/she may be performing only household chores.
2.9 The status of persons engaged in various economic activities are classified as follows.
2.9.1 Self-employed in Household Enterprises: Persons who operate their own farm or non-farm enterprises or are engaged independently in a profession or trade on own-account or with one or a few partners are self-employed in household enterprises. The essential feature of self-employment is that the remuneration is determined wholly or mainly by sales or profits of the goods or services which are being produced. The self-employed persons are further categorised into three groups.
(a) Own-Account Workers: They are the self-employed persons who operate their enterprises on their own account or with one or a few partners and who during the reference period by and large, run their enterprise without hiring any labour. They may, however, have unpaid helpers to assist them in the activity of the enterprise.
(b) Employers: The self-employed persons who work on their own account or with one or a few partners and by and large run their enterprise by hiring labour.
(c) Helpers in Household Enterprises: The helpers are mostly family members who keep themselves engaged in their household enterprises, working full or part time and do not receive any regular salary or wages in return for the work. They do not run the enterprise on their own, but assist the related person living in the same household running the enterprise. Here it is to be noted that a departure was made in the case of identifying ‘helpers’ from the
earlier surveys. Persons who worked in the capacity of ‘helpers’ but had a share in their family earnings were not considered as ‘helpers’ in the earlier rounds, but are con-sidered so in the present survey.
2.9.2 Regular Salaried/Wage Employee: Persons working in other’s farm or non-farm enterprises, both household and non-household, and getting in return salary or wages on a regular basis (and not on the basis of daily or periodic renewal of work contract) are the regular salaried/wage employees. This category not only includes persons getting time wage but also persons receiving piece wage or salary and paid apprentices, both full time and part-time.
2.9.3 Casual Labour: A person casu-ally engaged in other’s farm or non-farm enterprises (both household and non-household) and getting in re-turn wage according to the terms of the daily or periodic work contract is a casual labour. Depending on whether they are so employed in ‘public works’ sponsored by Govt. agencies or local bodies or in other types work, the casual workers are classified into the two groups viz. Casual labour in public works and casual workers in other types of work.
2.10 Certain other terms related to the different types of ‘labour’ are now explained.
2.11 Manual Work : A job essentially involving physical labour is considered as manual work. However, jobs essentially involving physical labour but also requiring a certain level of general, professional, scientific, or technical education are not termed manual work. On the other hand, jobs not involving much of physical labour and at the same time not requiring much educational background as above, are treated as manual

Chapter Two Conceptual Framework
Report 438: Employment and Unemployment Situation Among Religious Groups in India, 1993-94; NSS 50th Round
work. Thus engineers, doctors etc. are not considered as manual workers even though their jobs involve some amount of physical labour. But peons, chowkidars, watchman, etc. Are considered as manual workers even though their work involve much less physical labour. In the NSS, the manual work is specifically defined a as work pursued in one or more of the following occupational groups of the National Classification of Occupations.(1968):
Division 5 - Service workers:
Group 52,53,54,55,56 and family 570,574,579
Division 6 -Farmers, Fishermen, Hunters, loggers, and related workers:
Group 63,64,65,66,67,68
Division 7-8-9 : production and related workers, Transport equipment operators and labourers.
2.12 Wage Paid Manual Labour : A person who does manual work in return for wages in cash or kind or partly in cash and partly in kind (excluding exchange labour) is a wage paid manual labour. Persons who are self employed doing manual work is not treated as a wage paid manual labour.
2.13 Agricultural Labour : A person is considered engaged in agricultural labour if he/she follows one or more of the following agricultural occupations in the capacity of a wage paid manual labour, whether paid in cash or kind or both:
(i) farming (ii) dairy farming (iii) production of any horticultural commodity (iv) raising of livestock, bees or poultry
(v) any practice performed on a farm as incidental to or in conjunction with farm operations (including forestry and timbering) and the operation for market and delivery to storage or to market or to carriage for transportation to market of farm produce. Carriage for transportation refers to the first stage of the transport from farm to the first place of disposal. Working in fisheries is excluded from agricultural labour.
2.14 Rural Labour : Manual labour, living in rural areas, working in agricultural and/or non-agricultural occupations in return for wages paid either in cash or in kind (excluding exchange labour) is considered as rural labour. Thus rural labour includes both agricultural labour and other labour.
2.15 Cultivation : All activities relating to production of crops and related ancillary activities are considered as cultivation. Growing of trees, plants or crops as plantation or orchards (such as rubber, cashew, coconut, pepper, coffee, tea etc.) are not considered as cultivation activities for the purpose. In general, the activities covered under industry groups 000-008 are considered as cultivation.
2.16 Procedural Changes in the Present Survey: Apart from the changes in the definition and classification of the economically active persons mentioned above, a few other procedural aspects introduced in the classification of usual status and current weekly and daily status are explained now. These changes, it may be seen , do not in any way affect the comparability of the survey estimates with that of the previous rounds.
In the past, for the identification of the usual status based on the major time crite-rion, a trichotomous classification of the popula-

Chapter Two Conceptual Framework
Report 438: Employment and Unemployment Situation Among Religious Groups in India, 1993-94; NSS 50th Round
tion was followed. i.e. a person is classified into one of the three broad groups ‘employed’,
‘unemployed’ and out of labour force’ based on the major time criterion. In this round, the procedure prescribed is a two stage dichotomous procedure which involves a classification into ‘labour force’ and ‘out labour force’ in the first stage and thereafter the labour force into ‘employed’ and ‘unemployed’ in the second stage. While this could marginally affect the principal and subsidiary classification theoretically, it can be seen that the ‘all workers’ would remain the same.

Report 438: Employment and Unemployment Situation Among Religious Groups in India, 1993-94; NSS 50th Round
Chapter Three Sample Design And Estimation Procedure
3.1 The sample design adopted for this round of survey was similar to that followed1 in the past surveys in its general aspects. The general scheme was a stratified two- stage design with the first stage units being villages in the rural areas and urban frame survey blocks (UFS) in the urban areas. The second stage units were the households.
3.2 Sampling Frame for First Stage Units: The frame used for selection of first stage units in the rural sector was the 1991 census list of villages for all the four sub-rounds for 8 states/u.t.s viz. Andhra Pradesh, Assam, Kerala, Madhya Pradesh, Orissa, Uttar Pradesh, West Bengal and Chandigarh. However for Agra district of U.P. and the three districts, viz. Durg, Sagar, and Morena of M.P., samples were drawn using 1981 census list of villages. For Jammu & Kashmir samples for all the 4 sub-rounds were drawn using the 1981 census list as the 1991 census was not conducted in the state. For the remaining 23 states/u.t.s, the frame was 1991 census list for sub-rounds 2 to 4 and 1981 census list for sub-round 1 as the 1991 census list was not available for use at the time of drawing the samples. As usual, for Nagaland the list of vil-lages within 5 kms. of the bus route and for Andaman and Nicobar Islands the list of accessible villages constituted the frame. In the case of urban sector the frame consisted of the UFS blocks and, for some newly declared towns where these were not available, the 1991 census enumeration blocks were used.
1 Sampling Design and estimation procedure for 50th Round NSS (Mimeographed, National Sample Survey Organisation, 1994)
3.3 Region Formation and Stratification: States were divided into regions by grouping contiguous districts similar in respect of population density and cropping pattern. In rural sector each district was treated a separate stratum if the population was below 2 million and where it exceeded 2 million, it was split into two or more strata. This cut off point of population was taken as 1.8 million (in place of 2 million) for the purpose of stratification for districts for which the 1981 census frame was used. In the urban sector, strata were formed, within each NSS region on the basis of population size class of towns. However for towns with population of 4 lakhs or more the urban blocks were divided into two classes viz. one consisting of blocks inhabited by affluent section of the population and the other consisting of the remaining blocks.
3.4 Selection of First Stage Units: Selection of sample villages was done circular system-atically with probability proportional to population and sample blocks circular system-atically with equal probability. Both the sample villages and the sample blocks were selected in the form of two or more independent sub-samples. In Arunachal Pradesh the procedure of cluster sampling has been followed. Further large villages/blocks having present population of 1200 or more were divided into a suitable number of hamlet- groups/ sub-blocks having equal population content. Two hamlet- groups were selected from the larger villages while one sub-block was selected in urban sector for larger blocks.
3.5 Selection of Households: While listing the households in the selected villages, certain relatively affluent households were identified and considered as second stage stratum 1 and the rest as second stage stratum 2. A total of

Chapter Three Sample Design & Estimation Procedure
Report 438: Employment and Unemployment Situation Among Religious Groups in India, 1993-94; NSS 50th Round
10 households were surveyed from the selected village/hamlet-groups, 2 from the first category and remaining from the second. Further in the second stage stratum-2, the households were arranged according to the means of livelihood. The means of livelihood were identified on the basis of the major source of income as i) self-employed in non-agriculture, ii) rural labour and iii) others. The land possessed by the households was also ascertained and the frame for selection was ar-ranged on the basis of this information. The households were selected circular system-atically from both the second stage strata.
3.6 In the urban blocks a different method was used for arranging the households for selection. This involved the identification means of livelihood of households as any one of a) self-employed, b)regular salaried/wage earnings, c) casual labour, d) others. Further the average household monthly per capita consumer expenditure (mpce) was also ascertained. All households with MPCE of (i) Rs. 1200/- or more (in towns with population less than 10 lakhs or (ii) Rs. 1500/- or more (in towns with population 10 lakh or more) formed second-stage stratum 1 and the rest, second-stage stratum 2. The households of second-stage stratum 2 were arranged accor-ding to means of livelihood class and MPCE ranges before selection of sample households. A total of 10 households were selected from each sample block as follows
(i) For affluent strata/classes : 4 households from second-stage stratum 1 and 6 households from second-stage stratum 2,
(ii) For other strata/classes : 2 house-holds from second stage stratum 1 and 8 from second-stage stratum 2. Households
were then selected circular systematically with a random start. Shortfall in the required number of household in any second-stage stratum was made up by increasing the quota for the other second stage stratum.
3.7 Work Programme: The survey period of one year was divided into four sub-rounds of three months duration each as below.
Period of Survey for the Four Sub-Rounds Equal number of sample villages and blocks was allotted for survey in each of these sub--rounds. However in Andaman and Nicobar Islands , Lakshadweep, and rural areas of Arunachal Pradesh and Nagaland, the re-striction of surveying the allotted households during the sub-round period was not strictly enforced. 3.8 No. of Villages/Blocks and Persons Surveyed: The number of villages/blocks and persons surveyed in different States and Union Territories is given in Table 3.8. The information relates to all the sub-rounds covered. As reported in para 1.1 in Jammu and Kashmir the survey work was undertaken in the districts of Jammu, Kathua and Udhampur only. The remaining 11 districts were not surveyed. Therefore the estimates pertaining to all India and Jammu and Kashmir will be exclusive of these districts.
sub-round period of survey ------- --------------------- 1 July-September, 1993 2 October- December, 1993 3 January-March, 1994 4 April-June, 1994

Chapter Three Sample Design & Estimation Procedure
Report 438: Employment and Unemployment Situation Among Religious Groups in India, 1993-94; NSS 50th Round
Table 3.8 : Number of villages/blocks allotted and surveyed and number of persons surveyed in different States and Union Territories
state/ut. Villages / blocks persons
allotted surveyed surveyed rural urban rural urban rural urban ( 1 ) (2) (3) (4) (5) (6) (7) Andhra Pradesh. 496 368 494 367 21420 15912Ar. Pradesh * 120 24 120 24 5133 834Assam 344 88 321 88 16706 3784Bihar 704 216 704 216 36575 10617Goa 16 24 16 24 643 848Gujarat 224 240 224 240 11849 10959Haryana 104 72 104 72 6137 3124H. P. 192 40 192 40 9808 1472Jammu Kashmir 264 168 84 53 4626 2553Karnataka 264 248 264 248 14202 11552Kerala 256 184 256 184 11856 8181Madhya Pradesh 544 328 534 326 28795 15924Maharashtra 448 560 448 559 22107 24277Manipur 104 72 102 71 5457 3696Meghalaya 112 48 112 48 5074 1897Mizoram 48 96 48 96 2350 4371Nagaland 48 24 48 24 2520 1171Orissa 336 104 336 104 16653 4525Punjab 224 200 206 198 11148 8779Rajasthan 312 184 312 184 16846 8440Sikkim 48 16 48 16 2066 571Tamil Nadu 392 408 391 408 16253 16405Tripura 176 56 154 56 6975 2316Uttar Pradesh 904 448 904 448 52149 23098West Bengal 448 336 448 336 23454 13509A & N Islands 56 40 50 40 2656 1504Chandigarh 8 16 8 16 336 537 D & N Haveli 24 8 24 8 1201 334Daman & Diu 8 8 8 8 396 347Delhi 8 112 8 112 244 4047Lakshadweep 8 24 7 24 391 1343Pondicherry 8 32 8 32 325 1462All India 7248 4792 6983 4670 356351 208389
* 26 nucleus villages were allotted.

Chapter Three Sample Design & Estimation Procedure
Report 438: Employment and Unemployment Situation Among Religious Groups in India, 1993-94; NSS 50th Round
3.9 Estimation Procedure 3.9.1 Estimation of Aggregates at Sub-Sample Level : Aggregates are first estimated at sub-sample level according to the following estimation formulae, where ∃Y denotes the estimate - based on one sub-sample - of the aggregate of a given characteristic Y for the rural sector of a state/u.t.
For the rural sector of Arunachal Pradesh,
For the urban sector of a state/u.t.,
where y : observed value of the same charac- teristic in a sample household s : stratum suffix t : second-stage stratum suffix i : sample village/block suffix j : sample household suffix D : number of hamlet - groups / sub- blocks
formed in the surveyed village/block H : number of households listed in the se- cond- stage sampling frame h : number of sample households surveyed p : population of sample village as in the sampling frame
N : for the urban sector, number of blo-cks in the sampling frame
n : number of sample villages/blocks surveyed in this sub-sample Psi : population of the s-th stratum as per frame
used in the selection of i-th sample village of the stratum
Nsi : for Arunachal Pradesh, number of sample villages in the sampling frame for s-th stratum which was used in selection of i-th sample village of the stratum
D* : equals 1, if D = 1 equals D/2, if D > 1 3.9.2 Estimation of Aggregates for the Combined Sample (pooling sub-samples): The combined sample estimate of an aggregate is obtained as the simple average of the corresponding sub-sample estimates. 3.9.3 Estimates of ratios : The estimate of a ratio of the form R = Y/X, where Y and X are the population aggregates of two characters, is obtained as
where ∃Y and ∃X are estimates of Y and X obtained according to the procedure laid down in para 3.9.1. Examples of ratio estimates are rates and percentages.
∃Y 1n
P Dp
Hh
ys s i
si si*
si t=1
2sit
sit j=1
h
sitj
sit
= ∑ ∑ ∑ ∑
∃Y 1n
N Hh
ys s i=1
n
sit=1
2sit
sit j=1
h
sitj
s sit
= ∑ ∑ ∑ ∑
∃∃R YX
=)
∃Y Nn
D Hh
ys
s
s i=1
n
sit=1
2sit
sit j=1
h
sitj
s sit
= ∑ ∑ ∑ ∑

Report 438: Employment and Unemployment Situation Among Religious Groups In India, 1993-94; NSS 50th Round
Chapter Four
Main Findings 4.0 The 50th round survey, as mentioned earlier, was conducted in 6983 villages and 4670 urban blocks of India during July1993 - June1994. In the survey, information on religion of the household was collected. Data on some household characteristics and employment - unemployment indicators have been generated for the different religious groups. In this chapter, the main findings are presented for religious groups. The estimates of key indicators are given for India and 15 major states with an effort to give a more detailed picture at all-India level. However, the discussion is mostly confined to all-India estimates only. Comparison with the earlier survey results have been attempted at the all-India level. 4.1 It is evident from para 1.2 of Chapter One that the sample sizes pertaining to the religious groups other than those following Hinduism, Islam and Christianity are considerably small even at the all-India level and are concentrated in certain states/u.ts. Therefore, for the minor religious groups (i.e. Sikhism, Jainism, Buddhism and Zoroastianism), the state-level estimates of an indicator classified by the correlates will be subject to high variability owing to very small sample size. For this reason, the estimates of broad indicators pertaining to three major religious groups viz., Hinduism, Islam and Christianity are given in this chapter for the 15 major states to get an overview of the statewise situation. The detailed tables are given for all-India only in the Appendix. 4.2 Generally, the population estimates
obtained from the NSS surveys are found to be lower when compared with those of census or projected ones. The differences are mainly due to differences in coverage and methods adopted in the NSS in comparison to the census operation. However, ratios obtained from the surveys are expected to be much closer to the true situation. Thus the marginal aggregates of population or households presented may be used only for combining ratios. Estimated number of persons or households under any classificatory characteristic may be obtained by applying the relevant survey ratio on the projected population. 4.3 Households and Population 4.3.1 Distribution of Households and Persons by Religious Group : Statement 1.1 gives per thousand distribution of households by religion separately for rural and urban areas of the major states and all-India. Similar distribution for persons is given in Statement 1.2. It may be seen that in rural India, about 86% of households sharing 85% of population followed Hinduism whereas 9% of households followed Islam and had about 10% of population, a little higher than its household share. In urban areas, the percentage of households and population for Hinduism were about 80 and 78, respectively. The corresponding percentages were 14 and 16 for Islam. Only 2 to 3% of households reported to follow Christianity and they share less than 3% of population. Among the states, there was a wide variation as far as the share of households and population among different religious groups was concerned.
Chapter Four Main Findings
Report 438: Employment and Unemployment Situation Among Religious Groups in India, 1993-94; NSS 50th Round
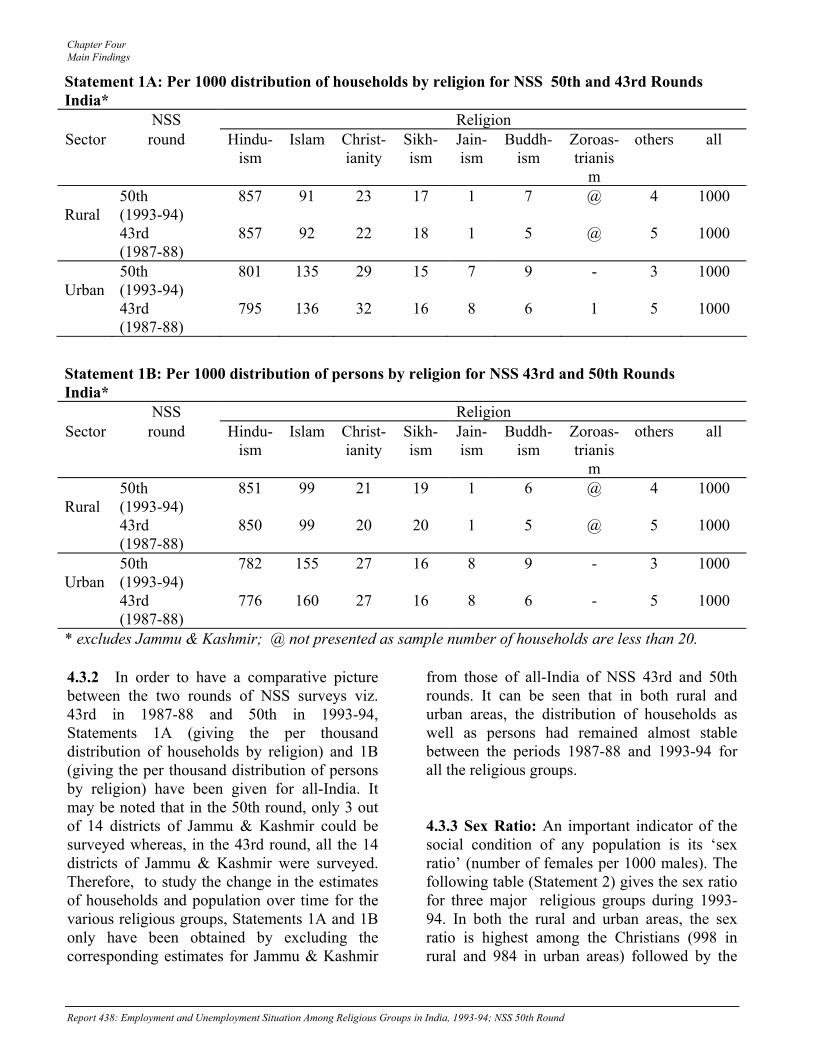
4.3.2 In order to have a comparative picture between the two rounds of NSS surveys viz. 43rd in 1987-88 and 50th in 1993-94, Statements 1A (giving the per thousand distribution of households by religion) and 1B (giving the per thousand distribution of persons by religion) have been given for all-India. It may be noted that in the 50th round, only 3 out of 14 districts of Jammu & Kashmir could be surveyed whereas, in the 43rd round, all the 14 districts of Jammu & Kashmir were surveyed. Therefore, to study the change in the estimates of households and population over time for the various religious groups, Statements 1A and 1B only have been obtained by excluding the corresponding estimates for Jammu & Kashmir
from those of all-India of NSS 43rd and 50th rounds. It can be seen that in both rural and urban areas, the distribution of households as well as persons had remained almost stable between the periods 1987-88 and 1993-94 for all the religious groups. 4.3.3 Sex Ratio: An important indicator of the social condition of any population is its ‘sex ratio’ (number of females per 1000 males). The following table (Statement 2) gives the sex ratio for three major religious groups during 1993-94. In both the rural and urban areas, the sex ratio is highest among the Christians (998 in rural and 984 in urban areas) followed by the
Statement 1A: Per 1000 distribution of households by religion for NSS 50th and 43rd Rounds India*
NSS Religion Sector round Hindu-
ism Islam Christ-
ianity Sikh-ism
Jain-ism
Buddh-ism
Zoroas-trianis
m
others all
Rural
50th (1993-94)
857 91 23 17 1 7 @ 4 1000
43rd (1987-88)
857 92 22 18 1 5 @ 5 1000
Urban
50th (1993-94)
801 135 29 15 7 9 - 3 1000
43rd (1987-88)
795 136 32 16 8 6 1 5 1000
Statement 1B: Per 1000 distribution of persons by religion for NSS 43rd and 50th Rounds India*
NSS Religion Sector round Hindu-
ism Islam Christ-
ianity Sikh-ism
Jain-ism
Buddh-ism
Zoroas-trianis
m
others all
Rural
50th (1993-94)
851 99 21 19 1 6 @ 4 1000
43rd (1987-88)
850 99 20 20 1 5 @ 5 1000
Urban
50th (1993-94)
782 155 27 16 8 9 - 3 1000
43rd (1987-88)
776 160 27 16 8 6 - 5 1000
* excludes Jammu & Kashmir; @ not presented as sample number of households are less than 20.

Chapter Four Main Findings
Report 438: Employment and Unemployment Situation Among Religious Groups In India, 1993-94; NSS 50th Round
Muslims (960 in rural and in 909 urban) and the Hindus (941 in rural and 900 in urban).
4.3.4 Average Household Size: While studying size of households belonging to various religious groups, it is to be noted that a household may consist of a number of family nuclei and so the size of a family may be very much different from the size of a household as per NSS definition. From Statement 3, it may be noted that the size of an average rural Hindu household was 4.9 - same as an average Indian rural household irrespective of religion. The size of an Islamic household was 5.3 persons - above the national average and that of a Christian household was 4.4 persons - smaller than the national average. For urban India, the size of a household was 4.4. Compared to that, the average size of a household was smaller for the Christians (4.1 persons) and the Hindus (4.3 persons). In the case of Islam, on the other hand, it was above the national average - the
size being 5.1. 4.3.5 Distribution of Households and Persons by Household Type : In NSS 50th round (1993-94), each surveyed household was categorised under an appropriate 'household type'. The type/nature of work which fetched maximum income to the household during the reference period of 365 days preceding the date of survey determined its household type. Distributions (per 1000) of households and persons by household type for each religion for rural and urban areas are given in Statement 4R and 4U. In the rural area, ‘self-employment in agriculture’ was the mainstay for all the religious groups. About 39% of Hindu households had to depend on ‘self-employment in agriculture’. The corresponding proportion was lower for the Christians (33%) followed by the Muslims (30%). The proportions of households depending on ‘self-employment in non-agriculture’ were 12% for the Hindus, 23% for the Muslims and 11% for the Christians. In the case of ‘rural labour’, the proportions varied from 35 (Muslims) to 40% (Christians). Between the periods 1987-88 and 1993-94, although the proportions of “self -employed” households did not change significantly for the major religious groups, a shift was noticed from
Statement 2: Sex-ratio for major religious groups during 1993-94
India Religion
sector Hindu-ism
Islam Christ-ianity
all*
rural 941 960 998 944 urban 900 909 984 905
*including all the religious groups
Statement 3R: Proportion (per 1000) of households and persons belonging to the self-employed and rural labour households by major religion
India Rural Religion
1993-94 1987-88 household type Hindu-
ism Islam Christ-
ianity All* Hindu-
ism Islam Christ-
ianity all*
Households self-employed:
agriculture 389 297 325 378 385 323 338 377 non-agri. 117 225 107 127 114 204 104 123
rural labour 385 345 404 383 403 373 405 397 Persons self-employed:
agriculture 437 333 347 424 439 363 379 428 non-agri. 120 234 107 131 117 212 109 128
rural labour 352 318 394 350 366 343 394 362 * including all the religious groups.

Chapter Four Main Findings
Report 438: Employment and Unemployment Situation Among Religious Groups in India, 1993-94; NSS 50th Round
‘agriculture’ to ‘non-agriculture’ for the Muslim household only. On the other hand, the ‘rural labour’ households showed a rising trend for the Hindus and the Muslims. In urban India, the proportion of Hindu households depending on ‘self-employment’, ‘regular wage salary’ and ‘casual labour’ were 31%, 46% and 13% respectively, whereas the same for the Muslims were 48%, 27% and 15% and for the Christians 21%, 54% and 12%. It can be observed that over the religious groups, though there was a moderate difference in the proportion of self-employed or regular wage/salaried persons, the proportion of the casual labourers remained more or less similar. In these three categories of households, a marginal rise in the proportion is noticed between the periods 1987-88 and 1993-94 for the Christians. For the Muslims, the proportion of ‘regular salaried’ households had fallen between the same periods. The corresponding proportions for persons are given in Statements 3.1 for major states. 4.3.6 Distribution of Households by Size Class of Land Cultivated : In the rural areas, amount of land cultivated by a household reflects the economic status of the household. Proportions (per 1000) of households and persons reporting 0.00 hectare of land cultivated and 0.01 to 1.00 hectare of land cultivated are given for each of the three major religions in Statement 5 for all-India and in Statements 4.1
and 4.2 for major states. Among the three major religious groups, the proportion of landless households (i.e. with land cultivated 0.00 hectare) was highest for the Christians (51%) followed by the Muslims (49%) and the Hindus (37%). On the other hand, the proportions of marginal farmer households (i.e. with land cultivated 0.01 to 1.00 hectare) remained almost same (35 to 36%) for these religious groups. A comparative picture of the landless and marginal farmer households for the periods 1987-88 and 1993-94 is given in the statement. As expected, the proportion of households cultivating land less than 1.00 hectares and particularly, the landless households have increased between the periods 1987-88 and 1993-94 for the major religious groups. 4.3.7 Distribution of Persons by Household Monthly Per Capita Expenditure (MPCE) Class : Household monthly expenditure, which serves as a proxy for household monthly income, reflects the standard of living of the members of a household to a large extent - the lower the value of the household consumer expenditure, the poorer are the members of the household. Based on the data on household consumer expenditure collected from the sample households surveyed in the NSS 50th round (1993-94), proportions of persons in the household MPCE classes Rs. 165 or less and Rs. 355 or more in rural India, and Rs. 230 or less and Rs. 605 or more in urban India, have been prepared for the three religious groups and
Statement 3U: Proportion (per 1000) of households and persons belonging to the self-employed and regular salaried and casual labour households by major religion in urban areas
India Urban Religion 1993-94 1987-88
household type Hindu-ism
Islam Christ-ianity
all* Hinduism Islam Christ-ianity
all*
Households self-employed 314 481 209 337 309 486 183 335 reg. Salaried 458 271 536 434 468 305 498 442 casual labour 131 149 120 132 127 146 104 127 Persons self-employed 360 543 236 388 359 534 214 389 reg. Salaried 459 256 551 428 467 289 561 436 casual labour 127 144 141 129 121 134 123 121 * including all the religious groups.

Chapter Four Main Findings
Report 438: Employment and Unemployment Situation Among Religious Groups In India, 1993-94; NSS 50th Round
the same is presented in Statement 5 for the major states and all-India. The pair of values of MPCE for rural and urban areas represents bottom and top 20% of overall population in the respective sectors. It may be seen from the statement that in rural India, proportion of persons in the three lowest MPCE classes combined (viz. Rs. 165 or less) was more among Muslims (20%), and Hindus (19%) than among Christians (16%). On the contrary, however, 31% of Christians in rural India spent Rs. 355 or more per month
during 1993-94, followed by Hindus (19%) and Muslims (15%). In urban India, proportion of persons spending Rs. 230 or less per month in 1993-94 was the highest among Muslims (30%) followed by Hindus (17%) and Christians (12%) while the proportion of persons spending Rs. 605 or more during 1993-94 was the highest among the Christians (29%) followed by the Hindus (21%) and the Muslims (10%). 4.3.8 Age distribution of persons: The
distribution of population by age-group and sex for each religious group can help in better understanding of the results on employment and unemployment. In Statement 6 the distribution of rural and urban population by broad age group is presented for the three religious groups and sex. Comparable results based on 43rd round survey are also presented in the statement. The age distribution for the Muslims are over-burdened with children as compared to the Hindus and the Christians. The Christians have lowest share of children to its population. Also, the share of aged population to total is
lowest among the Muslims and highest among the Christians. The proportion of children (0-14 years) had fallen substantially, particularly in the rural areas, for the Hindus and the Christians during 1987-88 to 1993-94. Surprisingly, the proportion of children did not change for the Muslims during the same period in the rural areas - indicating that a high birth rate prevailed among the rural Muslims. However, among the urban Muslims, a moderate fall in the proportion of children had been noticed.
Statement 4: Proportion (per 1000 hhs.) of households reporting 0.00 hectare and 0.01 to 1.00 hectare of land cultivated by major religion during 1993-94 and 1987-88
India Rural NSS Religion
Round (period)
Hinduism Islam Christianity
all*
land cultivated 0.00 hectare 50th
(1993-94) 369
(311) 490
(439) 514
(471) 387
(331) 43rd
(1987-88) 344
(280) 405
(347) 366
(304) 354
(292) land cultivated 0.00 - 1.00 hectare
50th (1993-94)
364 (361)
362 (372)
345 (357)
359 (357)
43rd (1987-88)
363 (357)
412 (420)
450 (464)
364 (360)
Figures in parenthesis give the corresponding proportion of persons * including all the religious groups.

Chapter Four Main Findings
Report 438: Employment and Unemployment Situation Among Religious Groups in India, 1993-94; NSS 50th Round
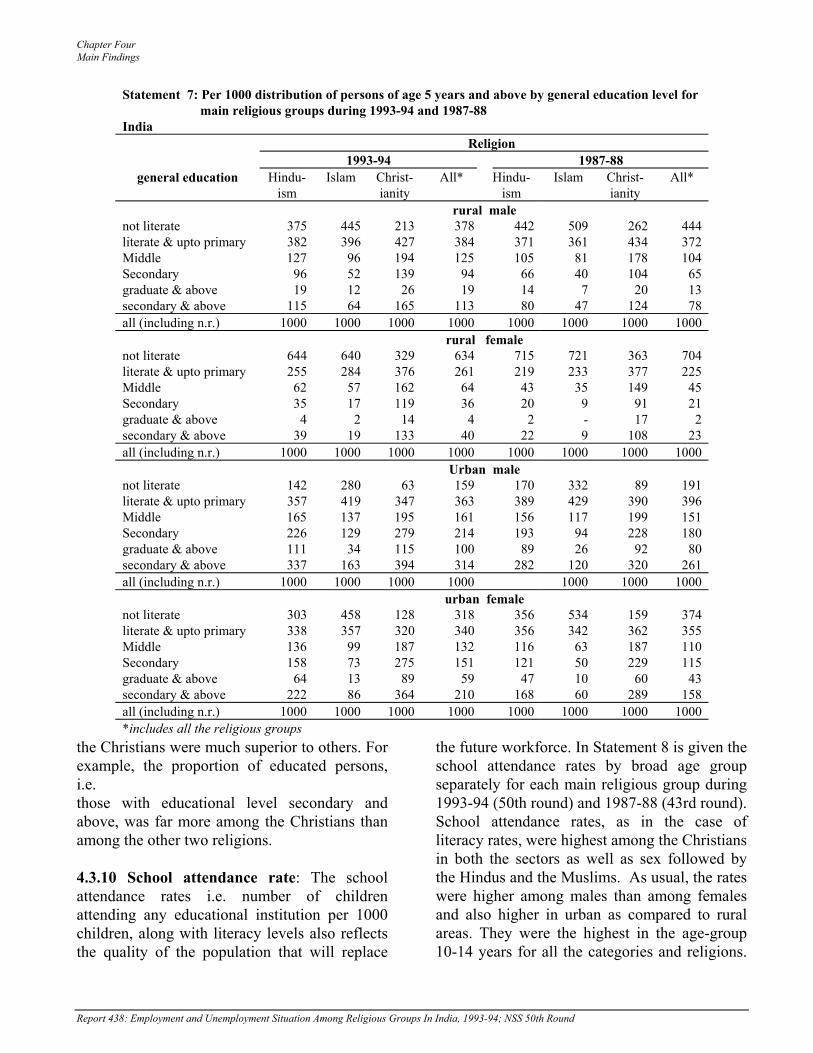
4.3.9 Education level: Educational attainment determines the quality of a population as also the employment prospects of an individual. Thus, it is important to study the distribution of population by educational attainment before taking up a discussion on employment and its correlates. Estimates obtained from the last quinquennial survey on the subject are also presented in Statement 7 to see the changes over time in the levels of literacy. Among the major religious groups, the Christians had the highest
literacy rate. The proportion of literates among the Hindus was higher than the Muslims. The proportion of illiterates was highest among the Muslims. Only in the rural areas, the female literacy rates were at par among the Hindus and the Muslims (36%). The corresponding rate was as high as 67% among the Christians. Barring the rural-urban and male-female differences, the quality of the literates among
Statement 6: Per 1000 distribution of persons by broad age group for major religious groups India
Religion age group 1993-94 1987-88
(years) Hinduism Islam Christia-nity
all* Hinduism Islam Christia-nity
all*
rural male 0-4 127 155 103 129 132 151 106 133 5-14 248 295 215 252 272 306 244 274 15-29 258 237 278 257 251 241 284 252 30-44 184 167 191 182 169 154 172 168 45-59 115 89 130 112 111 93 122 108 60 & above 68 57 83 68 65 55 72 65 Total 1000 1000 1000 1000 1000 1000 1000 1000 Rural female 0-4 127 151 99 128 130 150 110 131 5-14 228 276 210 233 249 278 215 251 15-29 266 258 286 266 265 260 302 266 30-44 189 168 205 187 175 161 183 174 45-59 119 94 131 117 114 98 118 112 60 & above 71 53 69 69 67 53 72 66 Total 1000 1000 1000 1000 1000 1000 1000 1000 urban male 0-4 100 132 91 105 108 147 116 115 5-14 221 266 217 227 234 275 206 239 15-29 293 290 278 292 299 271 299 294 30-44 213 172 234 207 195 167 197 190 45-59 116 96 122 114 110 96 111 108 60 & above 57 44 58 55 54 44 71 54 Total 1000 1000 1000 1000 1000 1000 1000 1000 Urban female 0-4 101 137 90 106 113 141 94 117 5-14 219 260 187 224 234 272 225 239 15-29 292 282 302 291 296 277 306 293 30-44 209 180 228 205 189 162 199 184 45-59 112 93 115 109 106 96 115 106 60 & above 67 48 78 65 62 52 61 61 Total 1000 1000 1000 1000 1000 1000 1000 1000 *including all the religious groups.
Chapter Four Main Findings
Report 438: Employment and Unemployment Situation Among Religious Groups In India, 1993-94; NSS 50th Round
the Christians were much superior to others. For example, the proportion of educated persons, i.e. those with educational level secondary and above, was far more among the Christians than among the other two religions. 4.3.10 School attendance rate: The school attendance rates i.e. number of children attending any educational institution per 1000 children, along with literacy levels also reflects the quality of the population that will replace
the future workforce. In Statement 8 is given the school attendance rates by broad age group separately for each main religious group during 1993-94 (50th round) and 1987-88 (43rd round). School attendance rates, as in the case of literacy rates, were highest among the Christians in both the sectors as well as sex followed by the Hindus and the Muslims. As usual, the rates were higher among males than among females and also higher in urban as compared to rural areas. They were the highest in the age-group 10-14 years for all the categories and religions.
Statement 7: Per 1000 distribution of persons of age 5 years and above by general education level for main religious groups during 1993-94 and 1987-88
India Religion 1993-94 1987-88
general education Hindu-ism
Islam Christ-ianity
All* Hindu-ism
Islam Christ-ianity
All*
rural male not literate 375 445 213 378 442 509 262 444 literate & upto primary 382 396 427 384 371 361 434 372 Middle 127 96 194 125 105 81 178 104 Secondary 96 52 139 94 66 40 104 65 graduate & above 19 12 26 19 14 7 20 13 secondary & above 115 64 165 113 80 47 124 78 all (including n.r.) 1000 1000 1000 1000 1000 1000 1000 1000 rural female not literate 644 640 329 634 715 721 363 704 literate & upto primary 255 284 376 261 219 233 377 225 Middle 62 57 162 64 43 35 149 45 Secondary 35 17 119 36 20 9 91 21 graduate & above 4 2 14 4 2 - 17 2 secondary & above 39 19 133 40 22 9 108 23 all (including n.r.) 1000 1000 1000 1000 1000 1000 1000 1000 Urban male not literate 142 280 63 159 170 332 89 191 literate & upto primary 357 419 347 363 389 429 390 396 Middle 165 137 195 161 156 117 199 151 Secondary 226 129 279 214 193 94 228 180 graduate & above 111 34 115 100 89 26 92 80 secondary & above 337 163 394 314 282 120 320 261 all (including n.r.) 1000 1000 1000 1000 1000 1000 1000 urban female not literate 303 458 128 318 356 534 159 374 literate & upto primary 338 357 320 340 356 342 362 355 Middle 136 99 187 132 116 63 187 110 Secondary 158 73 275 151 121 50 229 115 graduate & above 64 13 89 59 47 10 60 43 secondary & above 222 86 364 210 168 60 289 158 all (including n.r.) 1000 1000 1000 1000 1000 1000 1000 1000 *includes all the religious groups

Chapter Four Main Findings
Report 438: Employment and Unemployment Situation Among Religious Groups in India, 1993-94; NSS 50th Round
Compared to 1987-88, the attendance rates had increased for all the school going age groups between 5 to 24 years and for all the categories (males-female, rural-urban, religions) during 1993-94. 4.4 Employment & Unemployment 4.4.0 The NSSO generates estimates of indicators of employment-unemployment from
the data collected through its quinquennial employment-unemployment surveys using three different approaches, viz. ‘usual status (US) approach, current weekly status (CWS) approach and current daily status (CDS) approach’. For the purpose of generation of estimates with respect to religious groups only the usual status approach has been followed. 4.4.1 Labour Force
Statement 8: School attendance rate (per 1000 persons) by age-group for each religion and sex India
Religion Age- 1993-94 1987-88
group (years)
Hinduism Islam Christia-nity
all* Hinduism Islam Christia-nity
all*
(1) (2) (3) (4) (10) Rural male
0-4 34 25 60 34 26 14 69 265-9 675 544 806 664 535 421 674 525
10-14 764 702 853 759 669 566 756 6615-14 717 613 830 709 598 486 716 589
15-19 417 326 595 412 377 269 477 36620-24 110 76 154 108 84 70 131 83
all (5-24) 419 358 506 415 @ @ @ @ Rural female
0-4 30 19 84 30 22 13 51 225-9 560 495 757 559 406 328 669 404
10-14 551 507 836 558 413 370 701 4195-14 556 500 798 558 409 347 685 411
15-19 204 160 422 207 126 88 433 13220-24 27 13 119 29 15 12 98 17
all (5-24) 283 261 455 286 @ @ @ @ Urban male
0-4 106 59 175 99 88 48 126 825-9 857 737 915 837 763 560 892 730
10-14 893 738 928 867 832 636 933 7995-14 875 737 922 852 797 597 913 764
15-19 599 407 665 569 561 348 606 52920-24 239 134 272 225 210 113 169 195
all (5-24) 555 436 610 536 @ @ @ @ Urban female
0-4 103 45 137 92 77 35 141 725-9 818 678 928 797 707 521 861 679
10-14 839 677 942 815 746 536 900 7195-14 829 678 936 806 726 528 881 699
15-19 531 266 704 497 424 193 571 39520-24 140 64 229 133 96 43 166 90
all (5-24) 499 363 594 480 @ @ @ @@ not available for NSS 43rd round; * includes all the religious groups

Chapter Four Main Findings
Report 438: Employment and Unemployment Situation Among Religious Groups In India, 1993-94; NSS 50th Round
4.4.1.0 Labour force, or in other words, the ‘economically active’ population refers to the population which supplies or seeks to supply labour for production and, therefore, includes both ‘employed’ and ‘unemployed’. The Labour force participation rate (LFPR), number of persons belonging to the labour force per 1000 persons, has been obtained according to usual principal and subsidiary statuses taken together. 4.4.1.1 Estimates of LFPR : The estimates of LFPRs have been given for the major states and all-India in Statement 9. It can be seen that the rural-urban differentials, as usual, exist in the LFPRs for all the religious groups. The LFPRs for males are much higher than those for females - the differentials being more prominent in the urban areas and particularly among the Muslims (urban male: 517, urban female: 127). The LFPRs for the periods1987-88 and 1993-94 are given in Figures 1 to 4. The LFPR shows an increase during this period for the Hindus. For the Muslims, it has decreased in the rural areas but increased in the urban areas. Among the Christians, the LFPR has increased particularly for urban males while it has decreased for females during the period. 4.4.2 Employed (Workforce): In the US approach, the workforce has been defined as :
‘number of persons who worked for a relatively longer period during a reference period of 365 days preceding the date of survey.’
In the US approach, the estimates of usually employed are provided in two categories - usually employed in the principal status (PS workers) and usually employed in the subsidiary status (SS workers). The two categories together constitute the total usually employed (all workers). Number of persons employed per 1000 persons is referred to as workforce participation rate or worker population ratio (WPR).
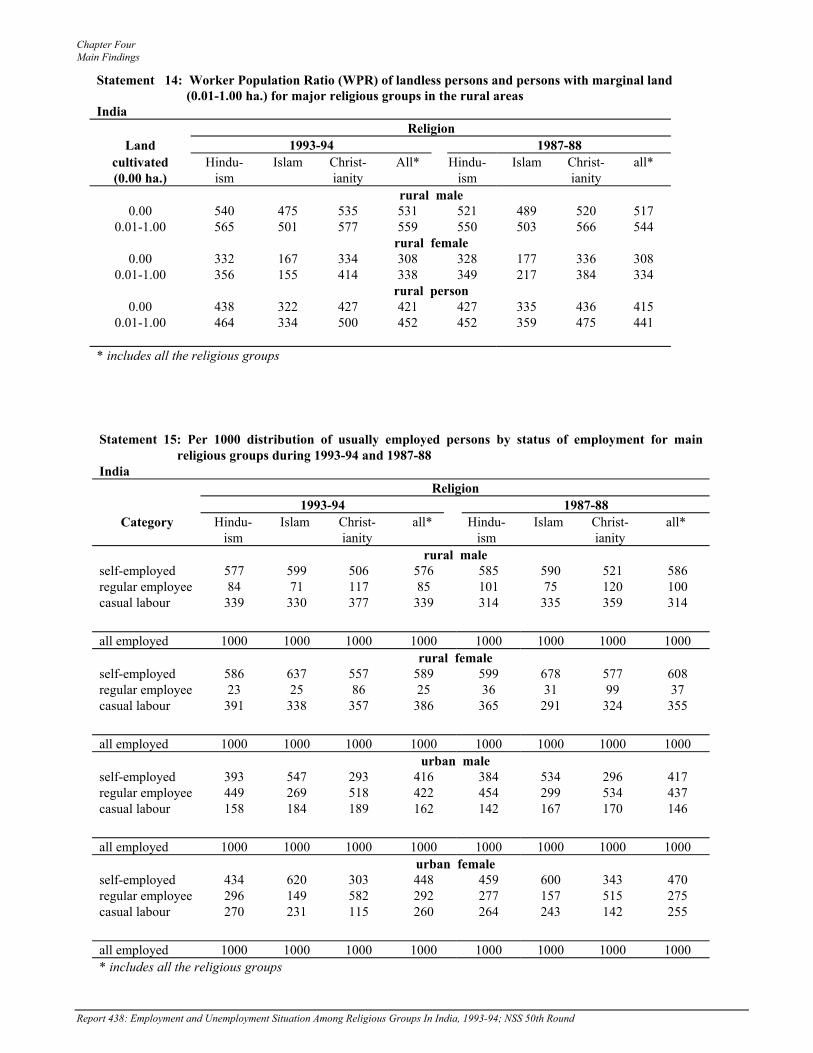
4.4.2.1 Estimates of WPR : The estimates of WPRs according to the PS & SS taken together have been given separately for each major religious group in Statement 10. In the rural areas of the country, WPR among the males was highest among the Hindus (559) followed closely by the Christians (554). The corresponding figure for the Muslims was considerably low at 494. As in the case of males, WPR for females for the Christians (360) and Hindus (346) was much higher than that for the Muslims (162). In urban India, the WPR among the males was the highest among the Hindus (525) followed by the Christians (503) and the Muslims (500). The Christian women (219) were ahead of the Hindu (160) and the Muslim women (122) in the urban areas in term of WPR. The comparative position changes when WPRs for persons of age 15 years & above is given in Statement 11. To compare the WPRs for two points of time, viz. 1987-88 and 1993-94, bar diagrams have been given at Figures 1 to 4. From the diagrams it may be observed that the WPR for the Hindus has increased from 1987-88 to 1993-94 for both the males and females in both the rural and urban areas. But, for the Muslims the WPR has increased in urban areas and decreased in rural areas for both males and females. In the case of the Christians, WPR has increased for males, but has decreased for females in both the sectors. 4.4.2.2 Education composition of the usually employed (15+) : The distribution of the employed over educational levels for a section of population at a given point of time reflects the quality of its workforce at that time. For that purpose, per 1000 distribution of the usually employed (all workers) of age 15 years and above is presented in Statement 12 for the three main religions. The corresponding distribution for 1987-88 obtained from NSS 43rd round results is also given in the statement. The quality of the workforce in terms of educational level is much better for the Christians than that for the Hindus and the

Chapter Four Main Findings
Report 438: Employment and Unemployment Situation Among Religious Groups in India, 1993-94; NSS 50th Round
Muslims and also, the Hindus are better than the Muslims. Between the periods 1987-88 and 1993-94, there has been, as expected, a significant improvement in the educational standards of workers in all the religious groups except the Christian women in the rural areas. In the rural areas, the Christian women workers remained educationally at the same level during
the periods as there was no significant progress in education among the Christian women. The WPRs by educational level obtained from NSS 50th and 43rd rounds are given for the major religions in Statement 13 at all-India level.
Statement 11: Worker population Ratio for persons of age 15 years and above for main religious groups during 1993-94 and 1987-88 India 1993-94 1987-88 Category Hinduism Islam Christianity All* Hinduism Islam Christianit
y All*
rural male 866 870 797 864 864 871 805 863 rural female 510 267 509 486 503 459 517 485 rural person 690 568 652 678 685 689 657 675 urban male 765 801 719 768 764 814 712 769 urban female 228 189 303 223 232 178 345 225 urban person 510 510 508 509 512 509 522 510 *include all the religious groups 4.4.2.3 WPR by land cultivated: On examining the WPR among the landless and marginal farmer households in the rural areas, given in Statement 14, it is seen that WPR for the landless households was marginally lower than that for all-households taken together. For marginal farmer households the WPR, on the other hand, was marginally higher than that for all-households. This pattern is observed for all
the three major religions except for the Muslim women. During the period 1987-88 to 1993-94, the WPRs among these households showed a rising trend for the Hindus and a declining trend for the Muslims. For the Christians, while the rate declined from 44% in 1987-88 to 43% in 1993-94 among the landless households, it rose from 48% to 50% between the same periods for the marginal farmer households.

Chapter Four Main Findings
Report 438: Employment and Unemployment Situation Among Religious Groups in India, 1993-94; NSS 50th Round
4.4.2.4 Workers by activity status: Employed persons are categorised into three broad groups according to their status of activity. The groups are self-employed, regular employees and casual labourers. Statement 15 shows the
distribution of workers by activity status for each religion at the all-India level. As usual, the proportion of self-employed was relatively much higher and highest among the Muslim workers, except for
Statement 12: Per 1000 distribution of usually employed persons of age 15 years and above by general educational level for main religious groups during 1993-94 and 1987-88
India general education
Religion Ro-und
not literate
literate & upto
primary
middle Second-dary@
graduate & above
secondary & above
all
Rural male Hinduism 50 435 289 139 111 26 137 1000 43 488 297 115 81 19 100 1000 Islam 50 501 314 109 59 17 76 1000 43 545 303 89 52 11 63 1000 Christianity 50 250 367 209 144 30 173 1000 43 292 381 193 106 27 132 1000 all* 50 437 291 137 108 26 134 1000 43 489 298 114 80 19 99 1000 rural female Hinduism 50 798 137 40 23 4 26 1000 43 842 114 28 14 2 16 1000 Islam 50 783 160 42 14 2 16 1000 43 827 132 27 12 - 13 1000 Christianity 50 471 280 136 94 19 113 1000 43 469 304 124 82 18 100 1000 all* 50 785 142 43 25 4 29 1000 43 829 121 31 16 3 19 1000 Urban male Hinduism 50 164 252 176 251 158 408 1000 43 182 297 165 227 128 356 1000 Islam 50 324 311 156 160 49 208 1000 43 342 379 131 113 35 148 1000 Christianity 50 58 246 201 327 168 495 1000 43 86 295 219 262 139 401 1000 all* 50 184 258 173 242 143 385 1000 43 203 309 160 213 115 328 1000 urban female Hinduism 50 491 195 87 118 109 227 1000 43 554 191 65 102 87 189 1000 Islam 50 614 221 61 76 28 104 1000 43 656 218 42 59 26 84 1000 Christianity 50 135 192 115 359 199 558 1000 43 191 216 139 300 153 454 1000 all* 50 489 197 84 123 106 230 1000 43 546 194 66 109 84 192 1000
@ “secondary” includes “higher secondary” also; NSS 50th round : 1993-94; NSS 43rd round: 1987-88 * includes all the religious groups

Chapter Four Main Findings
Report 438: Employment and Unemployment Situation Among Religious Groups In India, 1993-94; NSS 50th Round
the Christian workers in the urban areas.

Chapter Four Main Findings
Report 438: Employment and Unemployment Situation Among Religious Groups in India, 1993-94; NSS 50th Round
Statement 13: WPR for persons of age 15 years and above by general educational level for main religious groups during 1993-94 and 1987-88
India General education
Religion ro-und
not literate
literate & upto
primary
middle secon-dary@
graduate & above
secondary & above
all
rural male Hinduism 50 919 914 775 171 829 737 866 43 911 894 742 734 807 746 864 Islam 50 921 901 750 653 799 681 870 43 916 880 713 731 889 754 871 Christianity 50 887 871 746 629 696 634 797 43 897 871 732 599 791 626 805 all* 50 917 909 767 712 849 735 864 43 911 891 741 728 833 746 863 rural female Hinduism 50 566 438 293 256 383 259 510 43 546 402 288 253 253 253 503 Islam 50 294 221 165 147 229 154 267 43 333 246 196 280 - 288 312 Christianity 50 662 494 393 307 544 331 509 43 620 536 375 354 431 366 517 all* 50 540 415 288 254 360 265 486 43 526 391 290 261 351 272 485 urban male Hinduism 50 865 856 727 647 821 703 765 43 857 835 683 665 814 714 764 Islam 50 888 837 716 689 795 707 801 43 881 869 699 668 732 682 814 Christianity 50 744 819 689 641 796 687 719 43 681 809 670 630 829 687 712 all* 50 872 850 721 651 818 705 768 43 861 839 682 666 812 711 769 urban female Hinduism 50 322 208 136 130 292 177 228 43 324 182 115 145 309 192 232 Islam 50 221 175 102 140 280 162 189 43 198 156 101 145 321 172 178 Christianity 50 288 282 179 317 541 372 303 43 372 312 239 276 648 408 345 all* 50 300 203 131 137 302 185 223 43 295 178 119 156 319 200 225 @ ‘secondary’ includes ‘higher secondary’ also; NSS 50th round : 1993-94; NSS 43rd round: 1987-88 * includes all the religious groups
Chapter Four Main Findings
Report 438: Employment and Unemployment Situation Among Religious Groups In India, 1993-94; NSS 50th Round
Statement 15: Per 1000 distribution of usually employed persons by status of employment for main religious groups during 1993-94 and 1987-88
India Religion 1993-94 1987-88
Category Hindu-ism
Islam Christ-ianity
all* Hindu-ism
Islam Christ-ianity
all*
rural male self-employed 577 599 506 576 585 590 521 586 regular employee 84 71 117 85 101 75 120 100 casual labour 339 330 377 339 314 335 359 314
all employed 1000 1000 1000 1000 1000 1000 1000 1000 rural female self-employed 586 637 557 589 599 678 577 608 regular employee 23 25 86 25 36 31 99 37 casual labour 391 338 357 386 365 291 324 355
all employed 1000 1000 1000 1000 1000 1000 1000 1000 urban male self-employed 393 547 293 416 384 534 296 417 regular employee 449 269 518 422 454 299 534 437 casual labour 158 184 189 162 142 167 170 146
all employed 1000 1000 1000 1000 1000 1000 1000 1000 urban female self-employed 434 620 303 448 459 600 343 470 regular employee 296 149 582 292 277 157 515 275 casual labour 270 231 115 260 264 243 142 255
all employed 1000 1000 1000 1000 1000 1000 1000 1000 * includes all the religious groups
Statement 14: Worker Population Ratio (WPR) of landless persons and persons with marginal land (0.01-1.00 ha.) for major religious groups in the rural areas
India Religion
Land 1993-94 1987-88 cultivated (0.00 ha.)
Hindu-ism
Islam Christ-ianity
All* Hindu-ism
Islam Christ-ianity
all*
rural male 0.00 540 475 535 531 521 489 520 517
0.01-1.00 565 501 577 559 550 503 566 544 rural female
0.00 332 167 334 308 328 177 336 308 0.01-1.00 356 155 414 338 349 217 384 334
rural person 0.00 438 322 427 421 427 335 436 415
0.01-1.00 464 334 500 452 452 359 475 441
* includes all the religious groups

Chapter Four Main Findings
Report 438: Employment and Unemployment Situation Among Religious Groups in India, 1993-94; NSS 50th Round
The proportion of regular employees was highest among the urban Christian workers. In general, the proportion of regular employees was higher among the Christian than among the Hindus and the Muslims. Between the periods 1987-88 and 1993-94, the proportion of regular employees had decreased and the proportion of casual labourers had increased, except for urban female workers. Trends are not uniform for female workers of different religious groups. Among them, the proportion of casual workers showed a downward trend for the Muslims and the Christians while the regular employees showed an upward trend for the Hindus and the Christians. 4.4.2.5 Industrial distribution of workers: Statement 16 shows the distribution of workers
(age 15 years and above) by broad industry for each of the three major religious groups at the all-India level. The broad industries considered for obtaining the distribution are ‘agriculture (0)’, ‘secondary (1-5)’ and ‘tertiary (6-9)’. It may be noted that activities under ‘mining and quarrying (1)’ are generally considered under ‘primary’ sector. For the purpose of this report, those have been included under ‘secondary’ sector. Further, for comparison purposes, the similar results obtained from the 43rd round (1987-88) are also given in the statement. In the rural areas, the proportion of workers engaged in the ‘agriculture’ sector was highest among the Hindus and lowest among the Muslims. Further, the proportion of workers engaged in the ‘tertiary’ sector was higher than that in the ‘secondary’ sector, and was highest among the
Statement 16: Per 1000 distribution of usually employed persons (15+) by broad industry for main religious groups during 1993-94 and 1987-88
India Religion 1993-94 1987-88
Category indu-stry
Hindu-ism
Islam Christ-ianity
all* Hindu-ism
Islam Christ-ianity
all*
rural male 0 748 626 727 737 748 647 700 737 1-5 112 130 95 113 122 151 128 125 6-9 140 244 178 150 130 202 172 138 1-9 252 374 273 263 252 353 300 263
0-9 1000 1000 1000 1000 1000 1000 1000 1000 rural female 0 873 701 790 863 852 759 773 846 1-5 76 198 90 82 97 173 107 100 6-9 51 101 120 55 51 68 120 54 1-9 127 299 210 137 148 241 227 154
0-9 1000 1000 1000 1000 1000 1000 1000 1000 Urban male 0 92 65 125 89 88 70 114 85 1-5 332 337 296 330 339 382 334 345 6-9 576 598 579 581 573 548 552 570 1-9 908 935 875 911 912 930 886 915
0-9 1000 1000 1000 1000 1000 1000 1000 1000 Urban female 0 266 159 146 248 273 215 204 263 1-5 266 478 200 285 302 509 166 318 6-9 468 363 654 467 425 276 630 419 1-9 734 841 854 752 727 785 796 737
0-9 1000 1000 1000 1000 1000 1000 1000 1000 * includes all the religious groups

Chapter Four Main Findings
Report 438: Employment and Unemployment Situation Among Religious Groups In India, 1993-94; NSS 50th Round
Muslims. In the urban areas, a large section of the workers was engaged in the ‘tertiary’ sector. Among the Muslim female workers, the proportion was highest for the ‘secondary’ sector. The distribution of workers by industry obtained for the periods 1987-88 and 1993-94 showed different trends for different religious groups. In general, the proportion of workers had increased for the ‘tertiary’ sector. 4.4.3 Unemployed: The estimate of unemployed persons per 1000 population (PU) is given in Statement 16 for each major religious group. In rural India, the PU among the males was the highest for the Christians (21) followed by the Muslims (10) and Hindus (7). Among the
females, it was 16 for the Christians and 2 for the Hindus and Muslims each. The PUs are
found to be considerably higher in the urban areas. Among males, the proportions were 39, 22 and 17, and among females 27, 10 and 4, respectively, for the Christians, Hindus and Muslims. The unemployment rates (i.e. the number of unemployed persons per 1000 persons in the labour force) for the period 1987-88 and 1993-94 have been given in Statement 17 and also shown in Figures 9 to 12. The unemployment rate is higher among the Christians than among the Hindus and the Muslims. It is highest among the urban Christian women. Among the Hindus and Muslims, the unemployment rate (UR) has declined during 1987-88 to 1993-94 for both the sexes except for the urban Muslim females where it has increased. Between the periods, the
UR is found to decline in the rural areas and rise in the urban areas for the Christians.
Statement 18: Number of persons unemployed per 1000 persons in the labour force (unemployment rate) for the main religious groups during 1993-94 and 1987-88
India Religion 1993-94 1987-88
Category Hindu-ism
Islam Christ-ianity
all* Hindu-ism
Islam Christ-ianity
all*
rural male 12 20 36 14 16 23 42 18 rural female 6 12 43 6 20 25 86 24 rural persons 9 18 38 11 18 25 61 20 urban male 40 33 72 39 52 41 70 52 urban female 58 31 109 61 59 25 95 62 urban persons 43 33 83 44 55 40 79 53 * includes all the religious groups

Chapter Four Main Findings
Report 438: Employment and Unemployment Situation Among Religious Groups in India, 1993-94; NSS 50th Round
4.4.3.1 Unemployment rate by general educational level : For each major religion, the distribution of the unemployed and the unemployment rate by general educational level is given in Statements 19 and 20 at the all-India
level. As usual, the unemployment rate increases with educational level for all the religions. Among the educated (secondary & above), the unemployment rate was as high as 16 to 19% for females as against 6 to 7% for males. Since 1987-88, the unemployment rate among the educated in the rural areas decreased for the Hindus and the Christians, and increased
Statement 19: Per 1000 distribution of usually unemployed persons of age 15 years and above by general educational level for main religious groups during 1993-94 and 1987-88
India general education
Religion ro-und
Not literate
literate & upto
primary
middle secon-dary@
graduate & above
secondary & above
all
rural male Hinduism 50 61 78 203 464 193 658 1000 43 142 190 219 320 128 448 1000 Islam 50 89 228 212 311 156 468 1000 43 188 360 214 194 44 238 1000 Christianity 50 35 75 207 464 220 687 1000 43 64 126 272 446 89 535 1000 all* 50 62 98 208 443 189 632 1000 43 144 207 221 313 115 427 1000 rural female Hinduism 50 83 95 139 458 224 683 1000 43 606 85 83 180 45 225 1000 Islam 50 273 114 156 451 7 458 1000 43 509 145 181 149 16 165 1000 Christianity 50 - 46 556 260 138 719 1000 43 181 146 223 364 85 450 1000 all* 50 91 90 155 477 187 664 1000 43 563 93 103 194 47 241 1000 urban male Hinduism 50 41 136 225 379 219 599 1000 43 50 214 248 324 163 487 1000 Islam 50 51 187 288 323 151 474 1000 43 126 296 242 224 112 336 1000 Christianity 50 38 128 220 473 141 614 1000 43 16 281 300 289 113 402 1000 all* 50 41 141 232 383 204 587 1000 43 58 227 246 315 154 469 1000 urban female Hinduism 50 21 88 150 355 386 741 1000 43 84 117 152 334 311 645 1000 Islam 50 108 107 254 417 114 532 1000 43 69 218 236 255 222 477 1000 Christianity 50 - 63 118 546 273 819 1000 43 - 98 237 478 188 666 1000 all* 50 25 87 150 378 361 739 1000 43 78 125 165 339 292 631 1000
@ ‘secondary’ includes ‘higher secondary’ also; NSS 50th round : 1993-94; NSS 43rd round: 1987-88 * includes all the religious groups

Chapter Four Main Findings
Report 438: Employment and Unemployment Situation Among Religious Groups In India, 1993-94; NSS 50th Round
Muslims in 1993-94. The urban rates among the educated did not show any uniform trend for all the religious.
Statement 20: Unemployment Rates (UR) i.e. the number of persons (15+) unemployed per 1000 persons in the labour force according to the usual status (principal & subsidiary status taken together) for each broad education level and major religious groups
India general education
Religion ro-und
not literate
literate & upto
primary
Middle secon-dary@
graduate & above
secondary & above
All
rural male Hinduism 50 2 13 19 54 89 61 13 43 5 11 33 66 106 74 17 Islam 50 4 15 40 102 164 117 21 43 8 28 55 83 95 84 24 Christianity 50 5 7 35 106 211 127 35 43 10 15 60 160 132 154 43 all* 50 2 5 22 57 98 65 14 43 5 13 35 69 101 75 18 rural female Hinduism 50 1 5 23 118 300 152 7 43 16 17 63 220 329 235 22 Islam 50 6 13 62 359 61 334 18 43 16 27 146 233 401 258 25 Christianity 50 - 8 74 221 254 228 44 43 37 45 151 305 318 308 90 all* 50 1 5 29 138 253 159 8 43 16 19 77 232 281 240 24 Urban male Hinduism 50 11 22 52 60 56 59 41 43 15 38 76 73 65 70 52 Islam 50 5 20 60 65 96 72 33 43 16 33 75 79 123 90 42 Christianity 50 49 40 80 103 62 90 73 43 14 68 95 78 58 71 71 all* 50 9 23 53 63 57 60 40 43 15 38 76 74 67 71 51 Urban female Hinduism 50 3 30 106 172 196 184 65 43 10 40 135 181 195 187 63 Islam 50 7 20 150 188 143 176 40 43 3 31 155 123 218 155 31 Christianity 50 - 39 114 160 52 155 111 43 - 47 156 146 116 137 97 all* 50 3 29 108 173 189 181 64 43 9 41 139 170 188 177 62 @ ‘secondary’ includes ‘higher secondary’ also; NSS 50th round : 1993-94; NSS 43rd round: 1987-88 * includes all the religious groups

Statement 4.1: Proportion (per 1000 households) of households reporting land cultivated upto 1.00 hectares by major religion for major states
Ruralsize class religion
state
of land cultivated
(0.00 hectares)
Hinduism Islam Christianity all** estd. hhs. (00)
sample hhs.
(1) (2) (3) (4) (5) (6) (7) (8)A.P. 0.00 480 631 702 495 54642 2257
0.01 - 1.00 306 213 212 298 32960 1321Assam 0.00 283 327 264 294 10424 905
0.01 - 1.00 458 452 406 456 16188 1404Bihar 0.00 367 445 140 375 46285 2413
0.01 - 1.00 429 431 480 429 53041 2871
Gujarat 0.00 452 672 1000 463 23995 9110.01 - 1.00 255 130 - 249 12879 509
Haryana 0.00 520 474 - 515 11816 4670.01 - 1.00 156 172 - 153 3519 148
Karnataka 0.00 356 687 554 383 22098 8680.01 - 1.00 301 167 300 291 16840 716
Kerala 0.00 711 688 647 694 27095 16640.01 - 1.00 278 296 330 292 11421 810
M.P. 0.00 245 436 133 249 23821 11920.01 - 1.00 252 193 153 250 23897 1173
Maharashtra 0.00 398 740 712 430 41123 17070.01 - 1.00 253 79 123 245 23401 1016
Orissa 0.00 351 551 405 354 21087 10850.01 - 1.00 421 307 421 419 24965 1348
Punjab 0.00 770 750 935 615 15693 11040.01 - 1.00 98 158 33 113 2878 212
Rajasthan 0.00 178 297 - 189 10916 5260.01 - 1.00 308 218 - 298 17219 837
Tamil Nadu 0.00 620 832 752 634 56650 22100.01 - 1.00 273 133 201 265 23672 1046
U.P. 0.00 200 430 1000 229 45816 17960.01 - 1.00 528 413 - 512 102282 4252
W.B. 0.00 404 462 136 416 41577 16580.01 - 1.00 491 438 349 478 47762 2114
All-India* 0.00 369 490 514 387 463089 234060.01 - 1.00 364 362 345 359 428842 24891
* includes all states/u.t.'s ** includes all religious groups

Statement 4.2: Proportion (per 1000 persons) of persons reporting land cultivated upto 1.00 hectares by major religion for major states
Ruralsize class religion
stateof land
cultivated (0.00 hectares)
Hinduism Islam Christianity all** estd. hhs. (00) sample hhs.
(1) (2) (3) (4) (5) (6) (7) (8)Andhra Pr. 0.00 418 563 699 433 198923 8446
0.01 - 1.00 319 234 210 312 143088 5867Assam 0.00 249 281 236 257 46420 4085
0.01 - 1.00 446 453 426 448 81020 7102Bihar 0.00 320 391 118 328 202223 10681
0.01 - 1.00 426 446 430 429 264648 14636
Gujarat 0.00 397 614 1000 409 106456 41920.01 - 1.00 258 161 - 253 65817 2630
Haryana 0.00 463 436 - 459 58489 23190.01 - 1.00 149 163 - 146 18669 784
Karnataka 0.00 293 668 512 324 95736 37650.01 - 1.00 298 168 318 288 85000 3648
Kerala 0.00 701 693 624 684 121938 75790.01 - 1.00 288 287 349 300 53440 3811
M.P. 0.00 200 344 84 202 98840 50150.01 - 1.00 225 189 147 224 109338 5405
Maharashtra 0.00 344 691 532 378 170785 71850.01 - 1.00 249 98 234 244 110461 4848
Orissa 0.00 287 500 302 290 81220 43000.01 - 1.00 427 335 449 425 118981 6586
Punjab 0.00 739 729 910 574 76000 54160.01 - 1.00 99 148 48 109 14438 1065
Rajasthan 0.00 147 300 - 161 48607 23540.01 - 1.00 279 205 - 270 81513 4033
Tamil Nadu 0.00 570 824 725 588 212617 82930.01 - 1.00 296 130 213 286 103377 4605
U.P. 0.00 157 374 1000 185 198345 79750.01 - 1.00 499 415 - 486 519488 22205
W.B. 0.00 362 397 77 369 183631 73910.01 - 1.00 496 469 370 490 243974 11089
all-India * 0.00 311 439 471 331 1938676 999850.01 - 1.00 361 372 357 357 2091419 123435
* includes all states/u.t.'s ** includes all religious groups

Statement 1.1: Per 1000 distribution of households by major religion for major states
Rural
religion
state Hinduism Islam Christianity all** estd. hhs. (00)
sample hhs.
(1) (2) (3) (4) (5) (6) (7)Andhra Pr. 922 46 30 1000 110487 4918Assam 710 252 35 1000 35512 3200Bihar 846 134 17 1000 123511 6979Gujarat 958 32 5 1000 51777 2223Haryana 896 58 - 1000 22931 1040
Karnataka 909 70 15 1000 57773 2622Kerala 610 187 198 1000 39055 2560M.P. 970 22 5 1000 95602 5312Maharashtra 873 41 2 1000 95630 4446Orissa 966 14 16 1000 59547 3340
Punjab 297 11 22 1000 25497 2045Rajasthan 922 54 - 1000 57798 3097Tamil Nadu 917 26 51 1000 89374 3898U.P. 867 125 - 1000 199920 9008W.B. 736 251 3 1000 99838 4480
All-India * 857 91 23 1000 1195296 69230estd. hhs. (00) 1023989 108874 27538 1195296 X Xsample hhs. 56084 6031 3736 69230 X X
* includes all the states/u.t.'s ** includes all religious groups

Statement 1.1: Per 1000 distribution of households by major religion for major states
Urban
religion
state Hinduism Islam Christianity all** estd. hhs. (00)
sample hhs.
(1) (2) (3) (4) (5) (6) (7)Andhra Pr. 835 138 25 1000 37196 3647Assam 870 113 1 1000 4771 880Bihar 765 207 20 1000 17806 2159Gujarat 833 119 22 1000 27839 2372Haryana 927 28 4 1000 10098 697
Karnataka 783 164 42 1000 25451 2480Kerala 656 148 193 1000 13038 1830M.P. 866 100 12 1000 30151 3233Maharashtra 756 131 27 1000 61345 5534Orissa 928 45 16 1000 9455 1035
Punjab 666 12 2 1000 12056 1946Rajasthan 853 112 4 1000 19099 1803Tamil Nadu 846 90 59 1000 50472 4047U.P. 705 278 6 1000 51529 4450W.B. 869 121 4 1000 37473 3337
All-India * 802 135 29 1000 434536 46179estd. hhs. (00) 348367 58567 12687 434536 X Xsample hhs. 35423 6059 2800 46179 X X
* includes all the states/u.t.'s ** includes all religious groups

Statement 1.2: Per 1000 distribution of persons by major religion for major states
Rural
religion
state Hinduism Islam Christianity all** estd. persons (00)
sample persons
(1) (2) (3) (4) (5) (6) (7)Andhra Pr. 921 49 28 1000 459306 21420Assam 698 265 34 1000 180655 16706Bihar 839 141 16 1000 617162 36575Gujarat 956 36 5 1000 260570 11849Haryana 892 61 - 1000 127464 6137
Karnataka 906 77 11 1000 295165 14202Kerala 587 218 191 1000 178223 11856M.P. 969 23 4 1000 488311 28795Maharashtra 869 48 2 1000 451900 22107Orissa 964 16 16 1000 279788 16653
Punjab 289 13 20 1000 132427 11148Rajasthan 914 64 - 1000 301892 16846Tamil Nadu 911 30 53 1000 361855 16253U.P. 863 129 - 1000 1069869 52149W.B. 731 257 2 1000 497925 23454
All-India * 851 99 21 1000 5850217 356351estd. persons (00) 4976901 577281 121760 5850217 X Xsample persons 287122 33380 18162 356351 X Xaverage hh. size 4.9 5.3 4.4 4.9 X X * includes all the states/u.t.'s ** includes all religious groups

Statement 1.2: Per 1000 distribution of persons by major religion for major states
Urban
religion
state Hinduism Islam Christianity all** estd. persons (00)
sample persons
(1) (2) (3) (4) (5) (6) (7)Andhra Pr. 819 156 23 1000 162130 15912Assam 873 109 1 1000 20490 3784Bihar 765 208 18 1000 85251 10617Gujarat 816 139 18 1000 125226 10959Haryana 934 25 2 1000 44219 3124
Karnataka 748 207 34 1000 118421 11552Kerala 629 180 189 1000 57655 8181M.P. 855 112 11 1000 149057 15924Maharashtra 733 152 24 1000 268383 24277Orissa 919 57 14 1000 40939 4525
Punjab 638 11 2 1000 53854 8779Rajasthan 826 138 2 1000 89771 8440Tamil Nadu 822 112 61 1000 196848 16405U.P. 690 295 5 1000 261110 23098W.B. 860 132 3 1000 150974 13509
All-India * 782 155 27 1000 1932760 208389estd. persons (00) 1512207 299741 51463 1932760 X Xsample persons 155406 32154 12039 208389 X Xaverage hh. size 4.3 5.1 4.1 4.4 X X
* includes all the states/u.t.'s ** includes all religious groups

Statement 3.1: Proportion (per 1000) of persons belonging to the self-employed and rural labour households by major religion for major states
Ruralreligion
state hhs. type Hinduism Islam Christianity all** estd. hhs (00) sample hhs.(1) (2) (3) (4) (5) (6) (7) (8)
Andhra Pr. self-employed 470 482 176 462 212206 11203rural labour 476 390 702 478 219650 8607
Assam self-employed 589 553 410 573 103546 9673rural labour 285 353 335 305 55107 4644
Bihar self-employed 530 498 554 526 324527 20793rural labour 389 369 314 385 237634 12274
Gujarat self-employed 453 476 60 453 117954 6109rural labour 455 388 500 453 117963 4569
Haryana self-employed 593 575 - 599 76307 4026rural labour 280 372 - 282 35895 1407
Karnataka self-employed 547 545 511 546 161271 8665rural labour 389 352 333 386 113804 4483
Kerala self-employed 330 473 479 391 69642 5082rural labour 541 396 409 483 86153 5050
M.P. self-employed 596 600 752 597 291672 18857rural labour 358 308 199 356 173821 8531
Maharashtra self-employed 469 470 390 446 201602 11441rural labour 452 444 171 476 214924 8662
Orissa self-employed 574 484 509 571 159894 10048rural labour 275 135 311 274 76553 3914
Punjab self-employed 401 583 226 521 69035 6552rural labour 354 330 721 333 44076 3092
Rajasthan self-employed 690 657 - 688 207667 12293rural labour 236 258 - 238 71906 3175
Tamil Nadu self-employed 371 439 240 366 132417 7152rural labour 537 333 571 533 192801 7312
U.P. self-employed 719 710 - 718 768563 39495rural labour 173 162 - 172 183804 7294
W.B. self-employed 503 539 815 512 255025 12910rural labour 403 383 173 398 198167 7860
All-India * self-employed 557 567 454 554 3243569 217161rural labour 352 318 394 350 2048768 98939
* includes all states/u.t.'s ** includes all religious groups

Statement 3.1: Proportion (per 1000) of persons belonging to the self-employed and rural labour households by major religion for major states
Urbanreligion
state hhs. type Hinduism Islam Christianity all** estd. hhs (00) sample hhs.(1) (2) (3) (4) (5) (6) (7) (8)
Andhra Pr. self-employed 346 460 108 358 58114 5937reg. wage/salaried 427 330 758 419 67957 6804casual labour 178 155 81 172 27823 2410
Assam self-employed 386 497 - 405 8304 1618reg. wage/salaried 488 341 291 466 9546 1636casual labour 54 121 - 61 1241 291
Bihar self-employed 382 471 159 400 34067 4278reg. wage/salaried 416 247 637 383 32640 4059casual labour 108 160 87 118 10046 1292
Gujarat self-employed 347 443 16 358 44839 4505reg. wage/salaried 477 285 657 450 56355 4718casual labour 133 239 124 147 18402 1400
Haryana self-employed 419 386 576 421 18615 1509reg. wage/salaried 429 109 424 415 18367 1170casual labour 101 505 - 112 4972 301
Karnataka self-employed 329 521 259 370 43841 4570reg. wage/salaried 451 280 553 417 49337 4630casual labour 166 169 60 161 19100 1754
Kerala self-employed 303 479 329 340 19626 2889reg. wage/salaried 322 161 308 290 16718 2317casual labour 327 262 302 311 17910 2455
M.P. self-employed 348 457 138 366 54551 6350reg. wage/salaried 471 345 802 456 67948 7165casual labour 127 138 53 126 18777 1668
Maharashtra self-employed 309 537 121 336 90104 8646reg. wage/salaried 561 331 822 529 142082 12515casual labour 92 104 26 98 26311 2215
Orissa self-employed 300 595 83 317 12966 1621reg. wage/salaried 507 262 456 490 20077 2087casual labour 101 44 335 101 4126 435
Punjab self-employed 498 473 287 488 26288 4494reg. wage/salaried 392 325 713 387 20851 3258casual labour 83 73 - 86 4606 626
Rajasthan self-employed 428 518 4 446 40004 3913reg. wage/salaried 438 281 964 413 37094 3266casual labour 66 122 - 73 6547 630
Tamil Nadu self-employed 313 426 303 327 64303 5771reg. wage/salaried 415 349 491 411 80945 6587casual labour 217 137 160 204 40239 3256
U.P. self-employed 466 693 362 533 139211 12978reg. wage/salaried 399 142 603 325 84795 7072casual labour 86 100 - 89 23282 1888
W.B. self-employed 336 501 58 357 53911 4876reg. wage/salaried 513 263 499 479 72331 6572casual labour 98 195 407 111 16802 1344
All-India * self-employed 360 543 236 388 750599 84793reg. wage/salaried 459 256 551 428 828053 88045casual labour 127 144 141 129 248511 23929
* includes all states/u.t.'s ** includes all religious groups

Statement 5:Proportion (per 1000) of persons reporting Monthly Per Capita Expenditure (MPCE) less than Rs.165 and more than Rs.355 by major religion
Ruralmonthly per religion
statecapita exp-
enditure (MPCE) in Rs.
Hinduism Islam Christianity all**
(1) (2) (3) (4) (5) (6)Andhra Pr. 165 or less 160 133 228 160
355 or more 193 169 170 191Assam 165 or less 67 137 285 92
355 or more 132 74 18 113Bihar 165 or less 295 361 387 306
355 or more 75 50 133 71
Gujarat 165 or less 85 32 301 83355 or more 256 259 139 256
Haryana 165 or less 61 132 - 65355 or more 414 158 - 394
Karnataka 165 or less 197 134 192 192355 or more 164 179 435 170
Kerala 165 or less 44 108 46 58355 or more 408 352 532 419
M.P. 165 or less 269 170 37 265355 or more 146 207 26 148
Maharashtra 165 or less 225 313 - 237355 or more 183 144 197 174
Orissa 165 or less 335 288 528 337355 or more 83 53 86 83
Punjab 165 or less 23 41 - 21355 or more 463 362 222 518
Rajasthan 165 or less 92 128 - 92355 or more 292 237 - 291
Tamil Nadu 165 or less 180 104 242 180355 or more 200 229 126 197
U.P. 165 or less 221 196 - 216355 or more 187 173 1000 189
W.B. 165 or less 119 182 324 135355 or more 181 124 33 165
All-India * 165 or less 193 198 155 190355 or more 189 152 306 195
* includes all states/u.t.'s ** includes all religious groups

Statement 5 : Proportion (per 1000) of persons reporting Monthly Per Capita Expenditure (MPCE) less than Rs.230 and more than Rs.605 by major religion
Urbanmonthly per religion
statecapita exp-
enditure (MPCE) in Rs.
Hinduism Islam Christianity all**
(1) (2) (3) (4) (5) (6)Andhra Pr. 230 or less 217 271 143 223
605 or more 161 99 229 154Assam 230 or less 100 234 - 115
605 or more 220 119 68 208Bihar 230 or less 283 409 268 308
605 or more 112 54 104 102
Gujarat 230 or less 102 212 259 118605 or more 176 89 448 173
Haryana 230 or less 79 363 - 94605 or more 203 87 239 202
Karnataka 230 or less 200 318 48 218605 or more 190 74 359 173
Kerala 230 or less 123 181 111 131605 or more 189 185 217 192
M.P. 230 or less 231 275 90 232605 or more 137 78 233 134
Maharashtra 230 or less 132 255 50 156605 or more 304 178 585 290
Orissa 230 or less 229 349 254 235605 or more 154 54 255 149
Punjab 230 or less 69 216 - 65605 or more 255 131 - 260
Rajasthan 230 or less 148 376 10 176605 or more 175 44 206 160
Tamil Nadu 230 or less 197 242 165 201605 or more 169 129 204 168
U.P. 230 or less 224 369 98 265605 or more 169 47 326 136
W.B. 230 or less 155 335 385 180605 or more 256 61 118 231
All-India * 230 or less 172 304 121 189605 or more 209 95 289 197
* includes all states/u.t.'s ** includes all religious groups

Statement 10 : Proportion (per 1000 persons) of persons employed according to the usual principal and subsidiary statuses taken together for each major religion and major statesRural Male
religion estd. samplestate/u.t. Hinduism Islam Christianity all** persons (00) persons
(1) (2) (3) (4) (5) (6) (7)Andhra Pr. 634 585 595 630 143830 6707Assam 523 510 405 515 50765 4738Bihar 514 484 582 510 165878 9676Gujarat 575 527 467 573 77720 3496Haryana 463 423 - 463 31204 1521
Karnataka 607 559 570 603 89495 4323Kerala 565 431 568 536 45633 3047M.P. 572 505 804 571 145223 8478Maharashtra 555 498 511 551 126342 6221Orissa 569 360 607 566 79646 4674
Punjab 512 610 468 546 38083 3275Rajasthan 543 450 - 540 84776 4643Tamil Nadu 611 439 542 601 107833 4889U.P. 527 481 - 522 293677 14129W.B. 571 514 516 557 141860 6685
all-India * 559 494 554 552 1663681 100477 * includes all states/u.t.'s ** includes all religious groups

Statement 10 : Proportion (per 1000 persons) of persons employed according to the usual principal and subsidiary statuses taken together for each major religion and major statesRural Female
religion estd. samplestate/u.t. Hinduism Islam Christianity all** persons (00) persons
(1) (2) (3) (4) (5) (6) (7)Andhra Pr. 529 359 509 520 120178 5285Assam 178 99 229 159 13082 1110Bihar 178 121 339 172 50423 2664Gujarat 401 254 364 395 49426 2208Haryana 274 229 - 271 16275 791
Karnataka 442 272 478 430 63196 2886Kerala 265 134 269 237 22177 1401M.P. 411 319 692 410 96094 5266Maharashtra 484 317 566 476 106100 4989Orissa 317 96 534 316 44056 2334
Punjab 200 260 269 219 13786 1198Rajasthan 467 293 - 457 66276 3655Tamil Nadu 494 247 340 477 87249 3729U.P. 230 141 1000 218 110946 4879W.B. 212 104 282 185 45102 1998
all-India * 346 162 360 327 930907 53258 * includes all states/u.t.'s ** includes all religious groups

Statement 10 : Proportion (per 1000 persons) of persons employed according to the usual principal and subsidiary statuses taken together for each major religion and major statesRural Person
religion estd. samplestate/u.t. Hinduism Islam Christianity all** persons (00) persons
(1) (2) (3) (4) (5) (6) (7)Andhra Pr. 581 467 553 575 264217 12000Assam 365 324 331 353 63856 5849Bihar 356 305 456 350 216319 12341Gujarat 492 395 415 487 127146 5704Haryana 374 330 - 372 47479 2312
Karnataka 525 415 522 517 152692 7209Kerala 408 274 414 380 67829 4449M.P. 495 415 750 494 241341 13745Maharashtra 520 407 534 514 232443 11210Orissa 444 228 569 442 123734 7009
Punjab 362 444 378 391 51870 4473Rajasthan 507 376 - 500 151052 8298Tamil Nadu 552 342 438 539 195150 8620U.P. 386 317 500 378 404645 19009W.B. 396 313 399 375 186979 8684
all-India * 456 332 457 443 2595016 153758 * includes all states/u.t.'s ** includes all religious groups

Statement 10: Proportion (per 1000 persons) of persons employed according to the usual principal and subsidiary statuses taken together for each major religion and major statesUrban Male
religion estd. samplestate/u.t. Hinduism Islam C all** persons (00) persons
(1) (2) (3) (4) (5) (6) (7)Andhra Pr. 547 528 517 544 45086 4407Assam 523 554 405 528 5662 1085Bihar 447 419 353 438 20400 2590Gujarat 541 511 392 534 35001 3172Haryana 517 477 1000 518 12502 871
Karnataka 545 525 513 541 32890 3232Kerala 574 471 586 559 15712 2182M.P. 467 502 440 471 37331 4060Maharashtra 533 507 501 525 74116 6766Orissa 511 454 524 509 11037 1237
Punjab 566 567 692 553 15712 2566Rajasthan 491 477 676 489 23219 2202Tamil Nadu 585 540 505 574 56475 4773U.P. 483 477 471 482 67129 6018West Bengal 554 528 303 550 44722 4054
all-India * 525 500 503 520 528565 56996 * includes all the states/u.t.'s ** includes all religious groups

Statement 10: Proportion (per 1000 persons) of persons employed according to the usual principal and subsidiary statuses taken together for each major religion and major statesUrban Female
religion estd. samplestate/u.t. Hinduism Islam Christianity all** persons (00) persons
(1) (2) (3) (4) (5) (6) (7)Andhra Pr. 211 132 265 199 15810 1477Assam 92 103 - 92 901 180Bihar 72 48 133 68 2666 357Gujarat 142 144 224 141 8462 724Haryana 149 390 - 151 3053 208
Karnataka 182 176 174 180 10421 1017Kerala 235 114 189 203 6009 857M.P. 144 112 298 142 9937 1085Maharashtra 175 107 336 168 21481 1939Orissa 157 29 184 151 2916 302
Punjab 91 140 378 93 2379 401Rajasthan 163 174 227 162 6882 603Tamil Nadu 245 148 182 229 22655 1865U.P. 100 104 311 102 12453 1091West Bengal 141 148 273 143 9953 870
all-India * 160 122 219 154 142023 15496 * includes all the states/u.t.'s ** includes all religious groups

Statement 10: Proportion (per 1000 persons) of persons employed according to the usual principal and subsidiary statuses taken together for each major religion and major statesUrban Person
religion estd. samplestate/u.t. Hinduism Islam Christianity all** persons (00) persons
(1) (2) (3) (4) (5) (6) (7)Andhra Pr. 383 331 399 375 60896 5884Assam 318 346 96 320 6569 1266Bihar 276 252 243 270 23066 2947Gujarat 352 330 313 347 43465 3897Haryana 348 450 568 351 15555 1079
Karnataka 369 352 341 365 43317 4250Kerala 401 279 390 376 21721 3039M.P. 316 316 371 317 47271 5146Maharashtra 364 316 418 356 95602 8707Orissa 345 250 352 340 13953 1539
Punjab 347 412 575 335 18091 2967Rajasthan 336 334 442 335 30102 2805Tamil Nadu 20 19 28 21 4182 351U.P. 305 301 385 304 79582 7109West Bengal 362 360 289 362 54709 4928
all-India * 352 320 362 347 670664 72505 * includes all states/u.t.'s ** includes all religious groups

Statement 17: Proportion (per 1000 persons) of persons unemployed according to the usual principal and subsidiary statuses taken together for each major religion and major states
Rural Malereligion estd. sample
state Hinduism Islam Christianity all** persons (00) persons(1) (2) (3) (4) (5) (6) (7)Andhra Pr. 3 13 13 4 957 50Assam 27 18 13 24 2435 232Bihar 9 12 6 10 3267 222Gujarat 6 17 65 7 1022 44Haryana 7 - - 7 480 22
Karnataka 5 2 51 5 823 43Kerala 29 32 33 31 2640 179M.P. 4 - 11 4 1029 70Maharashtra 5 11 - 6 1501 72Orissa 9 21 60 10 1460 108
Punjab 13 - 12 7 511 40Rajasthan 2 - - 2 323 18Tamil Nadu 10 26 19 11 1990 95U.P. 4 5 - 4 2565 130W.B. 11 7 - 10 2557 150
all-India * 7 10 21 8 24094 1664 * includes all the states/u.t.'s ** includes all religious groups

Statement 17: Proportion (per 1000 persons) of persons unemployed according to the usual principal and subsidiary statuses taken together for each major religion and major states
Rural Femalereligion estd. sample
state Hinduism Islam Christianity all** persons (00) persons(1) (2) (3) (4) (5) (6) (7)Andhra Pr. 0 0 - 0 148 13Assam 13 11 13 13 1098 112Bihar 0 1 - 1 301 21Gujarat 1 - - 1 158 5Haryana 1 - - 1 64 4
Karnataka 1 0 29 1 253 15Kerala 26 13 35 25 2386 157M.P. 0 - - 0 118 6Maharashtra 1 2 - 1 335 18Orissa 2 - 28 2 342 26
Punjab 4 - 11 2 172 20Rajasthan 0 - - 0 84 5Tamil Nadu 2 2 14 3 573 44U.P. 0 1 - 0 292 19W.B. 4 0 34 3 789 47
all-India * 2 2 16 2 7389 610 * includes all the states/u.t.'s ** includes all religious groups

Statement 17: Proportion (per 1000 persons) of persons unemployed according to the usual principal and subsidiary statuses taken together for each major religion and major states
Rural Personreligion estd. sample
state Hinduism Islam Christianity all** persons (00) persons(1) (2) (3) (4) (5) (6) (7)Andhra Pr. 2 6 7 2 1106 63Assam 21 15 13 19 3534 344Bihar 5 7 3 5 3568 243Gujarat 4 8 32 4 1180 49Haryana 4 - - 4 545 26
Karnataka 3 1 39 3 1077 58Kerala 28 22 34 28 5026 336M.P. 2 - 5 2 1148 76Maharashtra 3 6 - 4 1836 90Orissa 5 10 44 6 1802 134
Punjab 9 - 12 5 684 60Rajasthan 1 - - 1 407 23Tamil Nadu 6 14 16 7 2564 139U.P. 2 3 - 2 2858 149W.B. 7 3 17 6 3347 197
all-India * 4 6 18 5 31484 2274 * includes all the states/u.t.'s ** includes all religious groups

Statement 17: Proportion (per 1000 persons) of persons unemployed according to the usual principal and subsidiary statuses taken together for each major religion and major states
Urban Malereligion estd. sample
state Hinduism Islam Christianity all** persons (00) persons(1) (2) (3) (4) (5) (6) (7)Andhra Pr. 16 11 25 15 1324 131Assam 31 25 - 30 328 67Bihar 32 31 40 32 1501 185Gujarat 15 23 57 16 1082 104Haryana 10 29 - 13 320 22
Karnataka 16 12 44 16 996 95Kerala 38 48 36 39 1121 152M.P. 26 23 49 26 2092 223Maharashtra 22 22 48 23 3337 289Orissa 37 8 82 36 786 77
Punjab 17 - - 17 507 84Rajasthan 8 7 - 8 402 36Tamil Nadu 25 26 32 25 2536 210U.P. 17 10 141 16 2240 192W.B. 40 12 125 37 3026 263
all-India * 22 17 39 21 22291 2424 * includes all the states/u.t.'s ** includes all religious groups

Statement 17: Proportion (per 1000 persons) of persons unemployed according to the usual principal and subsidiary statuses taken together for each major religion and major states
Urban Femalereligion estd. sample
state Hinduism Islam Christianity all** persons (00) persons(1) (2) (3) (4) (5) (6) (7)Andhra Pr. 7 1 36 7 579 46Assam 33 16 186 31 310 60Bihar 7 5 - 7 272 33Gujarat 6 4 - 6 385 34Haryana 5 - - 5 103 9
Karnataka 11 6 27 10 621 63Kerala 48 32 58 46 1385 188M.P. 6 0 2 5 407 50Maharashtra 8 4 11 8 1050 88Orissa 9 - 49 9 188 24
Punjab 6 - - 5 132 21Rajasthan 0 - 40 0 39 7Tamil Nadu 16 13 25 16 1645 141U.P. 0 1 - 1 141 17W.B. 26 3 - 23 1649 135
all-India * 10 4 27 10 9445 1096 * includes all the states/u.t.'s ** includes all religious groups

Statement 17: Proportion (per 1000 persons) of persons unemployed according to the usual principal and subsidiary statuses taken together for each major religion and major states
Urban Personreligion estd. sample
state Hinduism Islam Christianity all** persons (00) persons(1) (2) (3) (4) (5) (6) (7)Andhra Pr. 12 6 30 11 1904 177Assam 32 21 141 31 638 127Bihar 21 19 20 20 1773 218Gujarat 11 13 30 11 1468 138Haryana 8 20 - 9 423 31
Karnataka 13 9 35 13 1618 158Kerala 43 40 47 43 2506 340M.P. 16 12 26 16 2499 273Maharashtra 16 14 29 16 4387 377Orissa 24 4 66 23 974 101
Punjab 12 - - 11 640 105Rajasthan 5 4 20 4 441 43Tamil Nadu 20 19 28 21 4182 351U.P. 10 5 65 9 2382 209W.B. 34 8 67 31 4692 399
all-India * 16 11 33 16 31753 3521 * includes all the states/u.t.'s ** includes all religious groups

Statement 9: Proportion (per 1000 persons) of persons in the Labour Force according to the usual principal and subsidiary statuses taken together for each major religion and major states
Rural Malereligion estd. sample
state Hinduism Islam Christianity all** persons (00) persons(1) (2) (3) (4) (5) (6) (7)Andhra Pr. 638 599 609 635 144788 6757Assam 550 529 418 540 53201 4970Bihar 523 496 589 520 169145 9898Gujarat 582 545 532 581 78742 3540Haryana 471 423 - 470 31684 1543
Karnataka 612 562 621 609 90318 4366Kerala 595 463 602 567 48273 3226M.P. 576 505 816 576 146252 8548Maharashtra 561 510 511 557 127844 6293Orissa 578 382 667 576 81106 4782
Punjab 526 610 480 553 38595 3315Rajasthan 546 450 - 542 85099 4661Tamil Nadu 621 466 562 613 109823 4984U.P. 531 486 - 526 296243 14259W.B. 583 521 516 567 144418 6835
all-India * 566 505 575 560 1687776 102141 * includes all the states/u.t.'s ** includes all religious groups

Statement 9: Proportion (per 1000 persons) of persons in the Labour Force according to the usual principal and subsidiary statuses taken together for each major religion and major states
Rural Femalereligion estd. sample
state Hinduism Islam Christianity all** persons (00) persons(1) (2) (3) (4) (5) (6) (7)Andhra Pr. 530 360 509 521 120327 5298Assam 192 111 243 172 14180 1222Bihar 179 122 339 173 50725 2685Gujarat 403 254 364 396 49584 2213Haryana 276 229 - 272 16339 795
Karnataka 443 272 507 431 63450 2901Kerala 292 148 304 263 24564 1558M.P. 411 319 692 410 96213 5272Maharashtra 486 319 566 478 106436 5007Orissa 319 96 563 319 44398 2360
Punjab 205 260 281 222 13959 1218Rajasthan 468 293 - 457 66360 3660Tamil Nadu 496 249 354 480 87823 3773U.P. 230 142 1000 219 111239 4898W.B. 216 105 316 188 45892 2045
all-India * 349 165 376 330 938296 53868 * includes all the states/u.t.'s ** includes all religious groups

Statement 9: Proportion (per 1000 persons) of persons in the Labour Force according to the usual principal and subsidiary statuses taken together for each major religion and major states
Rural Personreligion estd. sample
state Hinduism Islam Christianity all** persons (00) persons(1) (2) (3) (4) (5) (6) (7)Andhra Pr. 583 474 560 577 265323 12063Assam 386 340 344 373 67390 6193Bihar 361 312 460 356 219888 12584Gujarat 496 404 447 492 128327 5753Haryana 379 330 - 376 48024 2338
Karnataka 528 417 562 520 153769 7267Kerala 436 297 449 408 72856 4785M.P. 497 415 756 496 242490 13821Maharashtra 524 414 534 518 234280 11300Orissa 449 238 613 448 125536 7143
Punjab 372 444 391 396 52554 4533Rajasthan 508 376 - 501 151460 8321Tamil Nadu 558 356 455 546 197715 8759U.P. 389 320 500 380 407504 19158W.B. 404 317 416 382 190326 8881
all-India * 461 338 476 448 2626500 156032 * includes all the states/u.t.'s ** includes all religious groups

Statement 20: Proportion (per 1000 persons) of persons in the Labour Force according to the usual principal and subsidiary statuses taken together for each major religion and major states
Urban Malereligion estd. sample
state Hinduism Islam Christianity all** persons (00) persons(1) (2) (3) (4) (5) (6) (7)Andhra Pr. 564 539 542 560 46410 4538Assam 555 580 405 558 5990 1152Bihar 479 450 393 471 21901 2775Gujarat 556 534 450 551 36083 3276Haryana 528 506 1000 532 12822 893
Karnataka 562 537 557 558 33887 3327Kerala 613 520 622 599 16833 2334M.P. 493 526 489 497 39423 4283Maharashtra 556 530 549 549 77453 7055Orissa 549 462 607 546 11823 1314
Punjab 584 567 692 571 16219 2650Rajasthan 500 485 676 498 23622 2238Tamil Nadu 610 566 537 600 59012 4983U.P. 501 487 612 498 69370 6210W.B. 595 540 429 587 47749 4317
all-India * 548 517 542 542 550857 59420 * includes all the states/u.t.'s ** includes all religious groups

Statement 20: Proportion (per 1000 persons) of persons in the Labour Force according to the usual principal and subsidiary statuses taken together for each major religion and major states
Urban Femalereligion estd. sample
state Hinduism Islam Christianity all** persons (00) persons(1) (2) (3) (4) (5) (6) (7)Andhra Pr. 218 133 301 206 16389 1523Assam 126 119 186 124 1212 240Bihar 79 53 133 75 2938 390Gujarat 149 148 224 148 8847 758Haryana 154 390 - 157 3156 217
Karnataka 193 183 201 191 11043 1080Kerala 283 147 247 250 7394 1045M.P. 151 112 300 148 10344 1135Maharashtra 184 112 347 176 22531 2027Orissa 166 29 234 161 3104 326
Punjab 97 140 378 98 2512 422Rajasthan 164 174 267 163 6921 610Tamil Nadu 261 161 207 246 24301 2006U.P. 101 106 311 103 12594 1108W.B. 167 151 273 166 11602 1005
all-India * 171 127 247 165 151468 16592 * includes all the states/u.t.'s ** includes all religious groups

Statement 20: Proportion (per 1000 persons) of persons in the Labour Force according to the usual principal and subsidiary statuses taken together for each major religion and major states
Urban Personreligion estd. sample
state Hinduism Islam Christianity all** persons (00) persons(1) (2) (3) (4) (5) (6) (7)Andhra Pr. 395 337 430 387 62800 6061Assam 351 367 238 351 7208 1393Bihar 297 271 263 291 24840 3165Gujarat 363 344 343 358 44933 4035Haryana 356 470 568 361 15979 1110
Karnataka 383 362 377 379 44936 4408Kerala 444 319 437 420 24228 3379M.P. 333 328 397 333 49770 5419Maharashtra 380 331 448 372 99990 9084Orissa 369 254 418 364 14927 1640
Punjab 360 412 575 347 18731 3072Rajasthan 341 339 463 340 30543 2848Tamil Nadu 435 366 372 423 83333 6991U.P. 315 307 451 313 81965 7318W.B. 397 368 356 393 59402 5327
all-India * 369 332 396 363 702417 76026 * includes all the states/u.t.'s ** includes all religious groups

List of Detailed Tables for All-India
Table No. Description Page No.
Table (1) Per thousand distribution of households by household type for each religion
A1 - A2
Table (2) Per thousand distribution of households by monthly per capita expenditure class for each religion
A3 - A4
Table (3R) Per thousand distribution of households by size class of land cultivated for each religion for rural areas
A5
Table (4) Per thousand distribution of persons by household type for each religion
A6 - A7
Table (5) Per thousand distribution of persons by household monthly per capita expenditure class for each religion
A8 - A9
Table (6R) Per thousand distribution of persons by size class of land cultivated for each religion for rural areas
A10
Table (7) Per thousand distribution of persons by age-group for each religion and sex
A11 - A16
Table (8) Per thousand distribution of persons of age 5 years & above by general educational level for each religion
A17 - A22
Table (9) School attendance rate per thousand persons by age-group for each religion and sex
A23 - A28
Table (10) Per thousand distribution of persons by usual activity category taking also into consideration the subsidiary economic status of persons categorised 'not working' for each religion
A29 - A34
Table (11) Per thousand distribution of persons by usual activity category taking also into consideration the subsidiary economic status of persons categorised 'not working' for each religion and household land cultivated class
A35 - A43
Table (12) Per thousand distribution of persons of age 15 years and above by general education for each usual activity category taking also into consideration the subsidiary economic status of persons categorised 'not working' and religion
A44 - A97

TABLE (1R) : PER THOUSAND DISTRIBUTION OF HOUSEHOLDS BY HOUSEHOLD TYPE FOR EACH RELIGION FOR RURAL AREAS
ALL-INDIA RURALHOUSEHOLD TYPE PER 1000 ESTI- SAMPLE
RELIGION SELF-EMPLOYED IN AGRI- OTHER SUB- OTHERS TOTAL DIST. OF MATED HHS.
AGRI-CUL-TURE
NON-AGRI-CUL-TURE
SUB-TOTAL
CUL-TURAL LAB-OUR
LABOUR TOTAL HHS. HHS. (00)
(1) (2) (3) (4) (5) (6) (7) (8) (9) (10) (11) (12)HINDUISM 389 117 506 307 78 385 108 1000 857 1023989 56084ISLAM 297 225 521 257 89 345 133 1000 91 108874 6031CHRISTIANITY 325 107 432 306 98 404 164 1000 23 27538 3736SIKHISM 451 118 570 256 47 304 127 1000 17 20830 1652JAINISM 257 357 614 264 20 284 102 1000 1 1056 68BUDDHISM 128 54 182 581 153 734 84 1000 7 7967 660ZOROASTRIANISM - 1000 1000 - - - - 1000 - 20 2OTHERS 357 203 560 229 110 339 101 1000 4 5022 997ALL 378 127 505 303 80 383 112 1000 1000 1195296 69230ESTD. HHS.(00) 452142 151739 603881 362622 95039 457662 133754 1195296 X X XSAMPLE HHS. 29870 8637 38507 16707 5164 21871 8852 69230 X X X
A - 1

TABLE (1U) : PER THOUSAND DISTRIBUTION OF HOUSEHOLDS BY HOUSEHOLD TYPE FOR EACH RELIGION FOR URBAN AREAS
ALL-INDIA URBANHOUSEHOLD TYPE PER 1000 ESTI- SAMPLE
RELIGION SELF-EMPL-OYED
REGU-LAR
WAGE/ SALA-RIED
CAS-UAL LAB-OUR
OTH-ERS
TOTAL DIST. OF HHS.
MATED HHS. (00)
HHS.
(1) (2) (3) (4) (5) (6) (7) (8) (9)HINDUISM 314 458 131 96 1000 802 348367 35423ISLAM 481 271 149 99 1000 135 58567 6059CHRISTIANITY 209 536 120 134 1000 29 12687 2800SIKHISM 472 390 65 73 1000 15 6465 930JAINISM 620 307 5 68 1000 7 2905 374BUDDHISM 94 586 211 108 1000 9 3891 337ZOROASTRIANISM 506 283 13 198 1000 - 211 34OTHERS 502 279 96 124 1000 3 1443 222ALL 337 434 132 97 1000 1000 434536 46179ESTD. HHS (00) 146460 188418 57386 42272 434536 X X XSAMPLE HHS. 16549 20183 5430 4017 46179 X X X
A - 2

TABLE (2) : PER THOUSAND DISTRIBUTION OF HOUSEHOLDS BY MONTHLY PER CAPITA EXPENDITURE CLASS FOR EACH HOUSEHOLD RELIGION
ALL-INDIA RURALHOUSEHOLD HOUSEHOLD RELIGION ESTI- SAM-
MONTHLY PER-CAPITA EXPEND-
ITURE (Rs.)
HINDU-ISM
ISLAM CHRIS-TIAN-ITY
SIKH-ISM
JAIN-ISM
BUDH-DH-ISM
ZORO-ASTR-IAN-ISM
OTH-ERS
ALL MATED HHS. (00)
PLE HHS.
(1) (2) (3) (4) (5) (6) (7) (8) (9) (10) (11) (12)LESS THAN 120 41 38 38 6 - 95 - 19 40 47830 2246
120 - 140 46 43 30 2 29 63 - 21 45 53818 2554140 - 165 82 92 65 11 - 123 - 64 81 96766 4639165 - 190 99 113 76 24 82 148 - 116 99 117925 5795190 - 210 83 94 72 17 54 91 - 114 82 98481 5037210 - 235 99 100 76 59 45 108 - 138 98 117400 6254235 - 265 106 117 85 76 49 76 - 86 105 125839 7049265 - 300 101 98 84 94 - 79 997 109 100 119267 6863300 - 355 111 109 120 131 259 90 - 121 111 133071 8311355 - 455 106 98 138 229 226 60 3 79 108 128628 8802455 - 560 54 41 75 138 88 18 - 21 55 65327 4628
560 & ABOVE 65 48 137 211 167 40 - 102 67 80513 6493N. R. 9 8 5 2 - 10 - 10 9 10434 559ALL 1000 1000 1000 1000 1000 1000 1000 1000 1000 1195296 69230
PER 1000 DIST. 857 91 23 17 1 7 - 4 1000 X XOF HHS.
ESTIMATED HHS. 1023989 108874 27538 20830 1056 7967 20 5022 1195296 X X(00)
SAMPLE HHS. 56084 6031 3736 1652 68 660 2 997 69230 X X
A - 3

TABLE (2) : PER THOUSAND DISTRIBUTION OF HOUSEHOLDS BY MONTHLY PER CAPITA EXPENDITURE CLASS FOR EACH HOUSEHOLD RELIGION
ALL-INDIA URBANHOUSEHOLD HOUSEHOLD RELIGION ESTI- SAM-
MONTHLY PER-CAPITA EXPEND-
ITURE (Rs.)
HINDU-ISM
ISLAM CHRIS-TIAN-ITY
SIKH-ISM
JAIN-ISM
BUDH-DH-ISM
ZORO-ASTR-IAN-ISM
OTH-ERS
ALL MATED HHS. (00)
PLE HHS.
(1) (2) (3) (4) (5) (6) (7) (8) (9) (10) (11) (12)LESS THAN 160 35 59 27 8 3 73 - 82 38 16583 1540
160 - 190 33 62 22 11 - 75 147 22 36 15753 1492190 - 230 70 117 46 26 14 93 - 62 75 32552 3151230 - 265 71 105 48 41 14 64 - 102 74 32284 3342265 - 310 91 143 75 66 27 77 14 113 97 41941 4244310 - 355 90 102 77 62 32 81 - 55 90 39044 3916355 - 410 97 92 85 101 59 165 - 143 96 41814 4330410 - 490 110 87 104 121 164 70 152 97 107 46363 4912490 - 605 115 80 126 154 177 119 - 72 112 48529 5103605 - 825 131 86 155 190 220 99 - 152 127 55055 5796825 -1055 69 29 95 100 154 52 97 32 65 28345 2937
1055 & ABOVE 78 31 120 117 136 26 587 47 73 31823 4931N. R. 11 8 20 2 - 6 4 20 10 4450 485ALL 1000 1000 1000 1000 1000 1000 1000 1000 1000 434536 46179
PER 1000 DIST. 802 135 29 15 7 9 - 3 1000 X XOF HHS.
ESTIMATED HHS. 348367 58567 12687 6465 2905 3891 211 1443 434536 X X(00)
SAMPLE HHS. 35423 6059 2800 930 374 337 34 222 46179 X X
A - 4
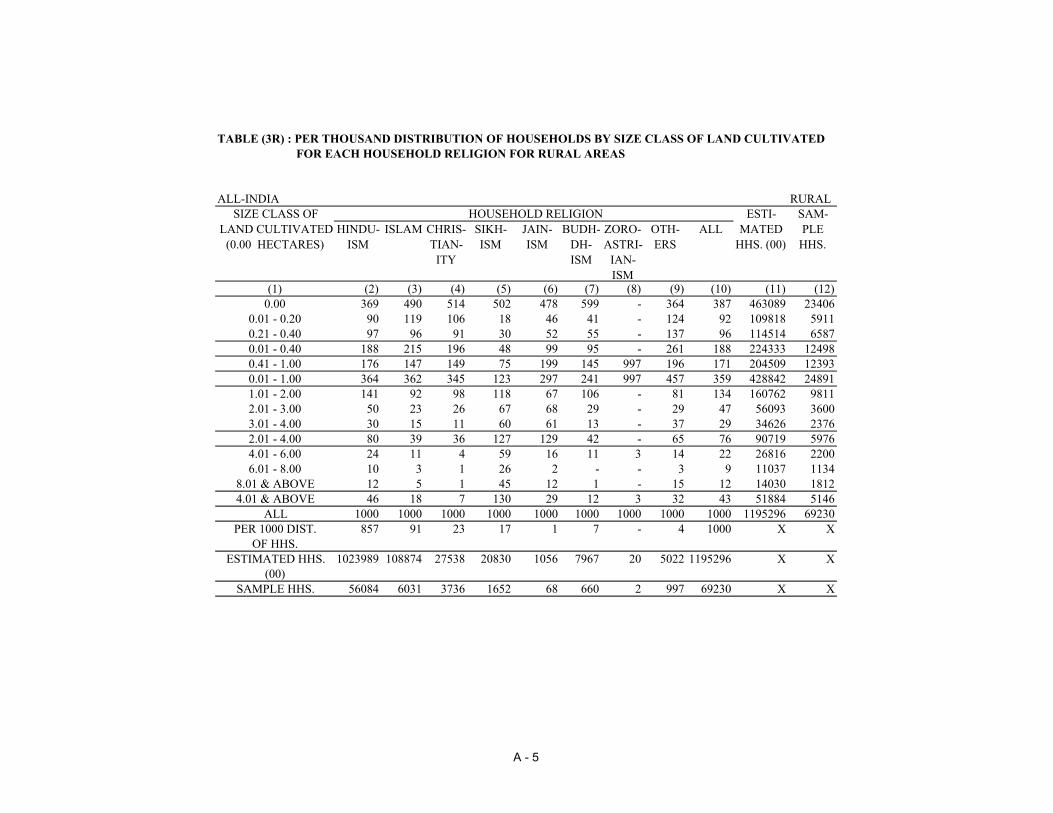
TABLE (3R) : PER THOUSAND DISTRIBUTION OF HOUSEHOLDS BY SIZE CLASS OF LAND CULTIVATED FOR EACH HOUSEHOLD RELIGION FOR RURAL AREAS
ALL-INDIA RURALSIZE CLASS OF HOUSEHOLD RELIGION ESTI- SAM-
LAND CULTIVATED (0.00 HECTARES)
HINDU-ISM
ISLAM CHRIS-TIAN-ITY
SIKH-ISM
JAIN-ISM
BUDH-DH-ISM
ZORO-ASTRI-
IAN-ISM
OTH-ERS
ALL MATED HHS. (00)
PLE HHS.
(1) (2) (3) (4) (5) (6) (7) (8) (9) (10) (11) (12)0.00 369 490 514 502 478 599 - 364 387 463089 23406
0.01 - 0.20 90 119 106 18 46 41 - 124 92 109818 59110.21 - 0.40 97 96 91 30 52 55 - 137 96 114514 65870.01 - 0.40 188 215 196 48 99 95 - 261 188 224333 124980.41 - 1.00 176 147 149 75 199 145 997 196 171 204509 123930.01 - 1.00 364 362 345 123 297 241 997 457 359 428842 248911.01 - 2.00 141 92 98 118 67 106 - 81 134 160762 98112.01 - 3.00 50 23 26 67 68 29 - 29 47 56093 36003.01 - 4.00 30 15 11 60 61 13 - 37 29 34626 23762.01 - 4.00 80 39 36 127 129 42 - 65 76 90719 59764.01 - 6.00 24 11 4 59 16 11 3 14 22 26816 22006.01 - 8.00 10 3 1 26 2 - - 3 9 11037 1134
8.01 & ABOVE 12 5 1 45 12 1 - 15 12 14030 18124.01 & ABOVE 46 18 7 130 29 12 3 32 43 51884 5146
ALL 1000 1000 1000 1000 1000 1000 1000 1000 1000 1195296 69230PER 1000 DIST. 857 91 23 17 1 7 - 4 1000 X X
OF HHS.ESTIMATED HHS. 1023989 108874 27538 20830 1056 7967 20 5022 1195296 X X
(00)SAMPLE HHS. 56084 6031 3736 1652 68 660 2 997 69230 X X
A - 5
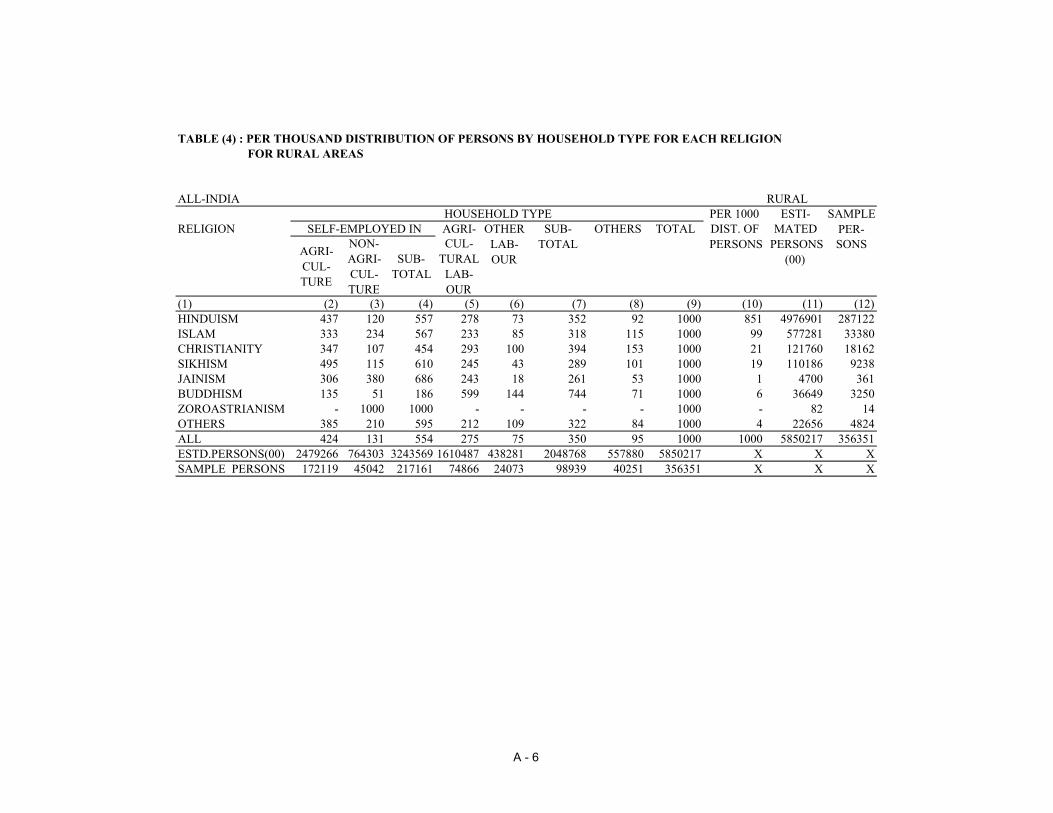
TABLE (4) : PER THOUSAND DISTRIBUTION OF PERSONS BY HOUSEHOLD TYPE FOR EACH RELIGION FOR RURAL AREAS
ALL-INDIA RURALHOUSEHOLD TYPE PER 1000 ESTI- SAMPLE
RELIGION SELF-EMPLOYED IN AGRI- OTHER SUB- OTHERS TOTAL DIST. OF MATED PER-
AGRI-CUL-TURE
NON-AGRI-CUL-TURE
SUB-TOTAL
CUL-TURAL LAB-OUR
LAB-OUR
TOTAL PERSONS PERSONS (00)
SONS
(1) (2) (3) (4) (5) (6) (7) (8) (9) (10) (11) (12)HINDUISM 437 120 557 278 73 352 92 1000 851 4976901 287122ISLAM 333 234 567 233 85 318 115 1000 99 577281 33380CHRISTIANITY 347 107 454 293 100 394 153 1000 21 121760 18162SIKHISM 495 115 610 245 43 289 101 1000 19 110186 9238JAINISM 306 380 686 243 18 261 53 1000 1 4700 361BUDDHISM 135 51 186 599 144 744 71 1000 6 36649 3250ZOROASTRIANISM - 1000 1000 - - - - 1000 - 82 14OTHERS 385 210 595 212 109 322 84 1000 4 22656 4824ALL 424 131 554 275 75 350 95 1000 1000 5850217 356351ESTD.PERSONS(00) 2479266 764303 3243569 1610487 438281 2048768 557880 5850217 X X XSAMPLE PERSONS 172119 45042 217161 74866 24073 98939 40251 356351 X X X
A - 6

TABLE (4) : PER THOUSAND DISTRIBUTION OF PERSONS BY HOUSEHOLD TYPE FOR EACH RELIGION FOR URBAN AREAS
ALL-INDIA URBANHOUSEHOLD TYPE PER 1000 ESTI- SAMPLE
RELIGION SELF-EMPL-OYED
REGU-LAR
WAGE/ SALA-RIED
CAS-UAL LAB-OUR
OTH-ERS
TOTAL DIST. OF PERSONS
MATED PERSONS
(00)
PERSONS
(1) (2) (3) (4) (5) (6) (7) (8) (9)HINDUISM 360 459 127 54 1000 782 1512207 155406ISLAM 543 256 144 58 1000 155 299741 32154CHRISTIANITY 236 551 141 72 1000 27 51463 12039SIKHISM 515 366 69 50 1000 16 30790 4419JAINISM 681 280 7 31 1000 8 14597 1839BUDDHISM 109 622 220 48 1000 9 17834 1546ZOROASTRIANISM 428 371 34 167 1000 - 649 109OTHERS 520 311 110 59 1000 3 5480 877ALL 388 428 129 55 1000 1000 1932760 208389ESTD. PERSONS (00) 750599 828053 248511 105597 2E+06 X X XSAMPLE PERSONS 84793 88045 23929 11622 208389 X X X
A - 7

TABLE (5) : PER THOUSAND DISTRIBUTION OF PERSONS BY MONTHLY PER CAPITA EXPENDITURE CLASS FOR EACH HOUSEHOLD RELIGION
ALL-INDIA RURALHOUSEHOLD HOUSEHOLD RELIGION ESTI- SAMPLE
MONTHLY PER-CAPITA EXPEND-
ITURE (Rs.)
HINDU-ISM
ISLAM CHRIS-TIAN-ITY
SIKH-ISM
JAIN-ISM
BUDH-DH-ISM
ZORO-ASTR-IAN-ISM
OTH-ERS
ALL MATED PERSONS
(00)
PERSONS
(1) (2) (3) (4) (5) (6) (7) (8) (9) (10) (11) (12)LESS THAN 120 47 44 45 7 - 112 - 23 46 270810 12839
120 - 140 54 50 38 3 40 78 - 25 52 303708 14692140 - 165 92 104 72 14 - 136 - 65 92 535341 26225165 - 190 109 131 89 28 75 140 - 134 110 640711 32600190 - 210 88 101 79 20 60 92 - 108 88 514747 27535210 - 235 103 101 78 67 56 102 - 153 102 596310 33619235 - 265 106 117 83 82 28 80 - 84 106 617691 37109265 - 300 99 92 83 98 - 68 993 123 98 574678 35388300 - 355 104 99 122 139 259 82 - 122 105 612340 42152355 - 455 95 83 134 225 227 58 7 63 97 565412 43076455 - 560 46 33 68 131 100 20 - 13 47 274394 21825
560 & ABOVE 48 36 104 184 157 21 - 81 51 296680 26565N. R. 8 8 5 2 - 11 - 5 8 47396 2726ALL 1000 1000 1000 1000 1000 1000 1000 1000 1000 5850217 356351
PER 1000 DIST. 851 99 21 19 1 6 - 4 1000 X XOF PERSONS
ESTIMATED PER- 4976901 577281 121760 110186 4700 36649 82 22656 5850217 X XSONS (00)
SAMPLE PERSONS 287122 33380 18162 9238 361 3250 14 4824 356351 X X
A - 8
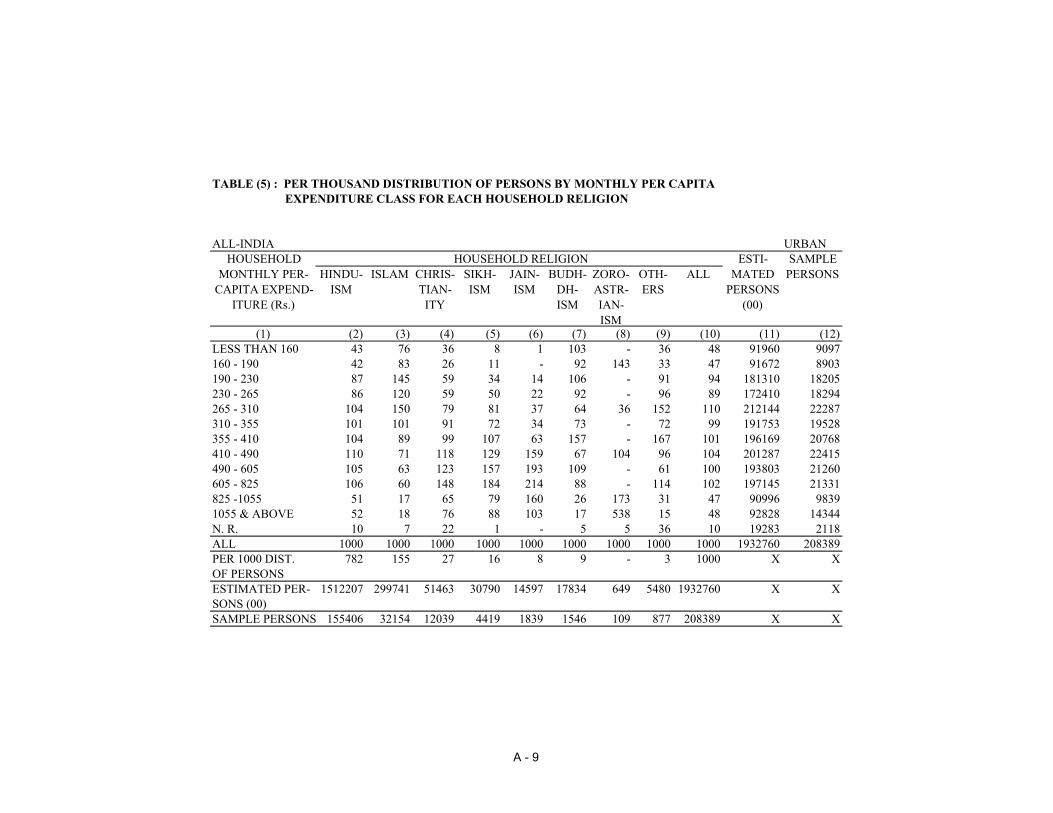
TABLE (5) : PER THOUSAND DISTRIBUTION OF PERSONS BY MONTHLY PER CAPITA EXPENDITURE CLASS FOR EACH HOUSEHOLD RELIGION
ALL-INDIA URBANHOUSEHOLD HOUSEHOLD RELIGION ESTI- SAMPLE
MONTHLY PER-CAPITA EXPEND-
ITURE (Rs.)
HINDU-ISM
ISLAM CHRIS-TIAN-ITY
SIKH-ISM
JAIN-ISM
BUDH-DH-ISM
ZORO-ASTR-IAN-ISM
OTH-ERS
ALL MATED PERSONS
(00)
PERSONS
(1) (2) (3) (4) (5) (6) (7) (8) (9) (10) (11) (12)LESS THAN 160 43 76 36 8 1 103 - 36 48 91960 9097160 - 190 42 83 26 11 - 92 143 33 47 91672 8903190 - 230 87 145 59 34 14 106 - 91 94 181310 18205230 - 265 86 120 59 50 22 92 - 96 89 172410 18294265 - 310 104 150 79 81 37 64 36 152 110 212144 22287310 - 355 101 101 91 72 34 73 - 72 99 191753 19528355 - 410 104 89 99 107 63 157 - 167 101 196169 20768410 - 490 110 71 118 129 159 67 104 96 104 201287 22415490 - 605 105 63 123 157 193 109 - 61 100 193803 21260605 - 825 106 60 148 184 214 88 - 114 102 197145 21331825 -1055 51 17 65 79 160 26 173 31 47 90996 98391055 & ABOVE 52 18 76 88 103 17 538 15 48 92828 14344N. R. 10 7 22 1 - 5 5 36 10 19283 2118ALL 1000 1000 1000 1000 1000 1000 1000 1000 1000 1932760 208389PER 1000 DIST. 782 155 27 16 8 9 - 3 1000 X XOF PERSONSESTIMATED PER- 1512207 299741 51463 30790 14597 17834 649 5480 1932760 X XSONS (00)SAMPLE PERSONS 155406 32154 12039 4419 1839 1546 109 877 208389 X X
A - 9

TABLE (7): PER THOUSAND DISTRIBUTION OF PERSONS BY AGE-GROUP FOR EACH RELIGION AND SEX
ALL-INDIA MALE RURALRELIGION A G E - G R O U P (Y E A R S) PER PERSONS
0-4 5-9 10-14 15-19 20-24 25-29 30-34 35-39 40-44 45-49 50-54 55-59 60 & above
all 1000 DIST.
ESTI-MATED
(00)
SAM-PLE
(1) (2) (3) (4) (5) (6) (7) (8) (9) (10) (11) (12) (13) (14) (15) (16) (17) (18)HINDUISM 127 129 119 103 81 75 69 65 50 46 39 30 68 1000 852 2562993 147887ISLAM 155 166 130 97 75 66 62 61 44 38 29 22 57 1000 98 294387 17069CHRISTIANITY 103 105 111 106 95 78 69 65 57 57 40 33 83 1000 20 60940 9275SIKHISM 114 119 118 123 82 72 65 56 48 45 38 25 95 1000 19 58326 4884JAINISM 103 39 103 150 143 104 28 55 56 61 45 19 95 1000 1 2373 181BUDDHISM 127 129 124 93 70 69 80 78 57 39 29 34 72 1000 6 18209 1676ZOROASTRIANISM - 499 249 1 1 - - 250 - - - - - 1000 - 82 8OTHERS 120 131 118 97 89 72 85 44 47 52 43 36 67 1000 4 11978 2484ALL 129 132 120 103 81 74 68 64 50 45 38 29 68 1000 1000 3009289 183464ESTIMATED PERSONS (00) 386997 397841 361417 308460 243401 223017 204986 192567 148964 135721 113935 88129 203653 3009289 X X XSAMPLE PERSONS 22815 23401 21963 19315 15373 13835 12392 11511 9093 8397 7089 5462 12808 183464 X X X
A - 11

TABLE (7): PER THOUSAND DISTRIBUTION OF PERSONS BY AGE-GROUP FOR EACH RELIGION AND SEX
ALL-INDIA FEMALE RURALRELIGION A G E - G R O U P (Y E A R S) PER PERSONS
0-4 5-9 10-14 15-19 20-24 25-29 30-34 35-39 40-44 45-49 50-54 55-59 60 & above
all 1000 DIST.
ESTI-MATED
(00)
SAM-PLE
(1) (2) (3) (4) (5) (6) (7) (8) (9) (10) (11) (12) (13) (14) (15) (16) (17) (18)HINDUISM 127 123 105 89 92 85 74 62 53 49 38 32 71 1000 850 2413041 139193ISLAM 151 154 122 88 84 86 68 56 44 36 32 26 53 1000 100 282676 16299CHRISTIANITY 99 102 108 110 94 81 74 72 59 54 43 34 69 1000 21 60811 8881SIKHISM 114 101 106 112 96 81 70 62 54 47 34 34 88 1000 18 51860 4354JAINISM 74 131 67 85 148 42 67 30 92 52 36 29 145 1000 1 2327 180BUDDHISM 127 141 106 87 79 66 96 63 38 40 45 36 74 1000 6 18440 1574ZOROASTRIANISM 167 167 - 333 - - 167 - - - - 167 - 1000 - - 6OTHERS 120 130 83 91 91 110 52 68 73 45 41 25 72 1000 4 10677 2338ALL 128 126 107 90 91 85 73 62 52 48 37 32 69 1000 1000 2839832 172825ESTIMATED PERSONS (00) 364052 357054 303967 254740 258392 242226 208560 175833 147274 135153 106164 90224 196071 2839832 X X XSAMPLE PERSONS 21318 21101 18670 16470 16158 14711 12422 10743 9015 8329 6532 5401 11949 172825 X X X
A - 12
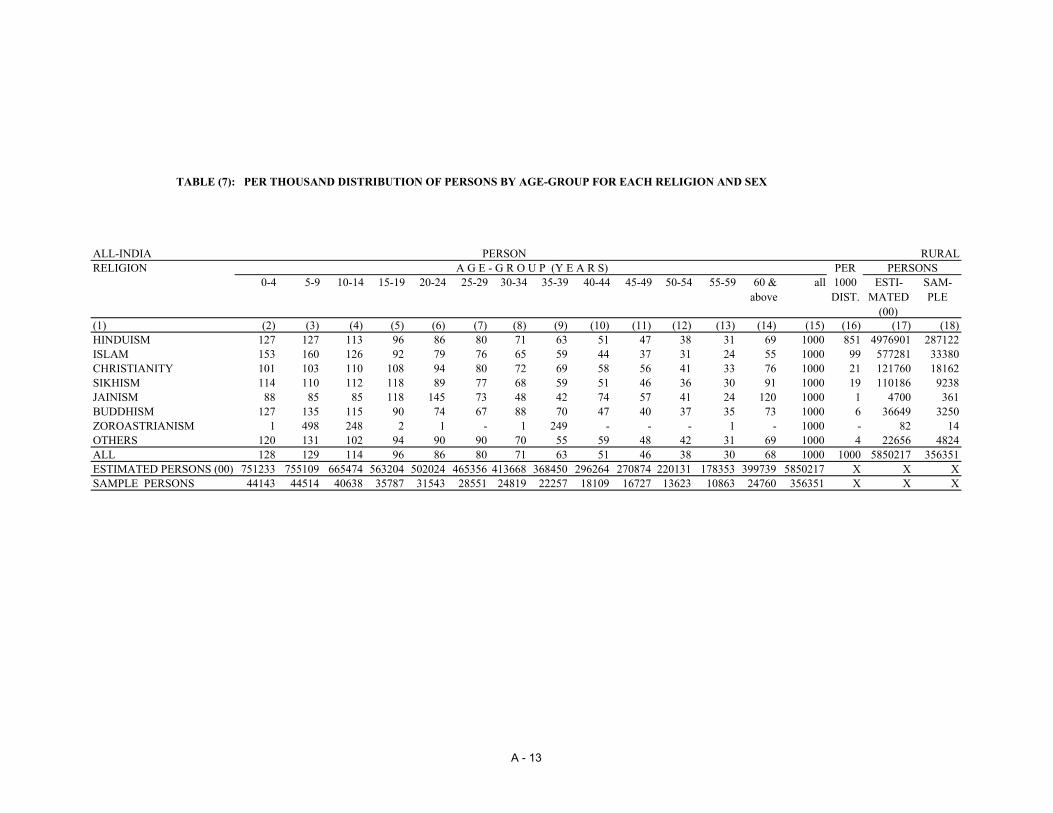
TABLE (7): PER THOUSAND DISTRIBUTION OF PERSONS BY AGE-GROUP FOR EACH RELIGION AND SEX
ALL-INDIA PERSON RURALRELIGION A G E - G R O U P (Y E A R S) PER PERSONS
0-4 5-9 10-14 15-19 20-24 25-29 30-34 35-39 40-44 45-49 50-54 55-59 60 & above
all 1000 DIST.
ESTI-MATED
(00)
SAM-PLE
(1) (2) (3) (4) (5) (6) (7) (8) (9) (10) (11) (12) (13) (14) (15) (16) (17) (18)HINDUISM 127 127 113 96 86 80 71 63 51 47 38 31 69 1000 851 4976901 287122ISLAM 153 160 126 92 79 76 65 59 44 37 31 24 55 1000 99 577281 33380CHRISTIANITY 101 103 110 108 94 80 72 69 58 56 41 33 76 1000 21 121760 18162SIKHISM 114 110 112 118 89 77 68 59 51 46 36 30 91 1000 19 110186 9238JAINISM 88 85 85 118 145 73 48 42 74 57 41 24 120 1000 1 4700 361BUDDHISM 127 135 115 90 74 67 88 70 47 40 37 35 73 1000 6 36649 3250ZOROASTRIANISM 1 498 248 2 1 - 1 249 - - - 1 - 1000 - 82 14OTHERS 120 131 102 94 90 90 70 55 59 48 42 31 69 1000 4 22656 4824ALL 128 129 114 96 86 80 71 63 51 46 38 30 68 1000 1000 5850217 356351ESTIMATED PERSONS (00) 751233 755109 665474 563204 502024 465356 413668 368450 296264 270874 220131 178353 399739 5850217 X X XSAMPLE PERSONS 44143 44514 40638 35787 31543 28551 24819 22257 18109 16727 13623 10863 24760 356351 X X X
A - 13

TABLE (7): PER THOUSAND DISTRIBUTION OF PERSONS BY AGE-GROUP FOR EACH RELIGION AND SEX
ALL-INDIA MALE URBANRELIGION A G E - G R O U P (Y E A R S) PER PERSONS
0-4 5-9 10-14 15-19 20-24 25-29 30-34 35-39 40-44 45-49 50-54 55-59 60 & above
all 1000 DIST.
ESTI-MATED
(00)
SAM-PLE
(1) (2) (3) (4) (5) (6) (7) (8) (9) (10) (11) (12) (13) (14) (15) (16) (17) (18)HINDUISM 100 108 113 110 96 86 79 72 62 51 37 28 57 1000 784 795652 81673ISLAM 132 140 127 125 90 76 62 59 51 44 29 23 44 1000 155 157049 16756CHRISTIANITY 91 97 120 94 98 87 89 85 60 51 42 29 58 1000 26 25934 6069SIKHISM 109 91 109 109 101 66 75 74 54 63 47 34 68 1000 15 15529 2295JAINISM 68 79 104 104 122 85 103 59 67 55 38 42 73 1000 7 7586 950BUDDHISM 130 119 112 108 107 82 82 81 42 38 30 18 49 1000 9 9434 802ZOROASTRIANISM 74 100 28 3 173 - 8 66 16 200 48 57 228 1000 - 367 57OTHERS 92 140 142 109 93 68 63 51 65 52 36 44 45 1000 3 3003 465ALL 105 112 115 112 96 84 77 70 60 50 36 28 55 1000 1000 1014553 109067ESTIMATED PERSONS (00) 106628 113984 116617 113684 97067 85507 77980 70941 60729 51028 36358 28087 55823 1014553 X X XSAMPLE PERSONS 10988 11882 12487 12042 10476 9169 8300 7731 6640 5652 4220 3192 6277 109067 X X X
A - 14

TABLE (7): PER THOUSAND DISTRIBUTION OF PERSONS BY AGE-GROUP FOR EACH RELIGION AND SEX
ALL-INDIA FEMALE URBANRELIGION A G E - G R O U P (Y E A R S) PER PERSONS
0-4 5-9 10-14 15-19 20-24 25-29 30-34 35-39 40-44 45-49 50-54 55-59 60 & above
all 1000 DIST.
ESTI-MATED
(00)
SAM-PLE
(1) (2) (3) (4) (5) (6) (7) (8) (9) (10) (11) (12) (13) (14) (15) (16) (17) (18)HINDUISM 101 108 111 102 99 92 80 75 54 46 36 30 67 1000 780 716280 73699ISLAM 137 129 131 109 94 78 71 63 46 41 29 23 48 1000 155 142687 15397CHRISTIANITY 90 86 101 106 94 102 81 78 69 45 37 33 78 1000 28 25527 5967SIKHISM 87 111 128 104 111 76 70 71 63 47 38 26 68 1000 17 15261 2124JAINISM 73 87 101 108 98 90 84 68 68 55 45 30 94 1000 8 7008 888BUDDHISM 96 133 83 107 107 111 76 58 50 51 30 26 74 1000 9 8399 744ZOROASTRIANISM 10 174 4 15 39 79 61 23 12 70 75 95 343 1000 - 282 52OTHERS 91 112 119 129 107 63 52 94 43 69 42 19 61 1000 3 2476 412ALL 106 111 114 103 98 90 78 73 54 45 35 29 65 1000 1000 917921 99283ESTIMATED PERSONS (00) 96869 101672 104673 94752 90056 82211 71948 67179 49181 41729 31877 26467 59179 917921 X X XSAMPLE PERSONS 9904 10641 11044 10317 9642 8901 7787 7324 5589 4851 3700 2855 6718 99283 X X X
A - 15

TABLE (7): PER THOUSAND DISTRIBUTION OF PERSONS BY AGE-GROUP FOR EACH RELIGION AND SEX
ALL-INDIA PERSON URBANRELIGION A G E - G R O U P (Y E A R S) PER PERSONS
0-4 5-9 10-14 15-19 20-24 25-29 30-34 35-39 40-44 45-49 50-54 55-59 60 & above
all 1000 DIST.
ESTI-MATED
(00)
SAM-PLE
(1) (2) (3) (4) (5) (6) (7) (8) (9) (10) (11) (12) (13) (14) (15) (16) (17) (18)HINDUISM 101 108 112 106 97 89 80 73 58 49 36 29 62 1000 782 1512207 155406ISLAM 134 135 129 117 92 77 66 61 49 42 29 23 46 1000 155 299741 32154CHRISTIANITY 91 92 111 100 96 94 85 81 64 48 39 31 68 1000 27 51463 12039SIKHISM 98 101 118 107 106 71 73 72 58 55 43 30 68 1000 16 30790 4419JAINISM 71 83 103 106 110 87 94 63 67 55 41 36 83 1000 8 14597 1839BUDDHISM 114 126 98 108 107 95 79 70 46 44 30 22 61 1000 9 17834 1546ZOROASTRIANISM 46 133 18 8 115 35 31 47 14 143 60 73 278 1000 - 649 109OTHERS 91 128 131 118 99 66 58 71 55 60 39 33 52 1000 3 5480 877ALL 105 112 115 108 97 87 78 71 57 48 35 28 60 1000 1000 1932760 208389ESTIMATED PERSONS (00) 203528 215662 221323 208499 187148 167733 149947 138128 109910 92757 68240 54556 115048 1932760 X X XSAMPLE PERSONS 20896 22524 23534 22366 20125 18073 16089 15056 12229 10503 7921 6048 12999 208389 X X X
A - 16

TABLE (9) : SCHOOL ATTENDENCE RATES PER THOUSAND PERSONS BY AGE-GROUP FOR EACH RELIGION AND SEX
ALL-INDIA MALE RURAL
RELIGIONA G E - G R O U P (Y E A R S) ESTIMATED
PERSONS (00)SAMPLE PERSONS
0-4 5-9 10-14 5-14 15-19 20-24 6-9 ALL TOTAL CURR-ENTLY ATTEN-
DING
CURR-ENTLY ATTEN-
DING(1) (2) (3) (4) (5) (6) (7) (8) (9) (10) (11) (12)HINDUISM 34 675 764 717 417 110 740 419 1433126 601626 37078ISLAM 25 544 702 613 326 76 606 358 183111 65630 4188CHRISTIANITY 60 806 853 830 595 154 871 506 31605 16017 2694SIKHISM 76 784 788 786 370 66 827 442 32414 14351 1209JAINISM 81 960 745 804 443 139 1000 388 1273 495 40BUDDHISM 33 854 825 840 547 179 870 515 9876 5095 424ZOROASTRIANISM - 500 1000 666 - - 500 665 61 40 3OTHERS 9 695 563 632 339 56 768 354 6645 2353 580ALL 34 664 759 709 412 108 728 415 1698115 705609 46216ESTD.TOTAL PERSONS(00) 386996 397840 361416 759257 308460 243401 317582 1698115 X X XESTD.PERSONS CURRENTLYATTENDING (00) 13370 264333 274463 538796 127134 26307 231461 705609 X X XSAMPLE PERSONSCURRENTLY ATTENDING 810 16290 17611 33901 9269 2236 14259 46216 X X X
A - 23

TABLE (9) : SCHOOL ATTENDENCE RATES PER THOUSAND PERSONS BY AGE-GROUP FOR EACH RELIGION AND SEX
ALL-INDIA FEMALE RURAL
RELIGIONA G E - G R O U P (Y E A R S) ESTIMATED
PERSONS (00)SAMPLE PERSONS
0-4 5-9 10-14 5-14 15-19 20-24 6-9 ALL TOTAL CURR-ENTLY ATTEN-
DING
CURR-ENTLY ATTEN-
DING(1) (2) (3) (4) (5) (6) (7) (8) (9) (10) (11) (12)HINDUISM 30 560 551 556 204 27 607 283 1293660 366772 23980ISLAM 19 495 507 500 160 13 548 261 169228 44227 2871CHRISTIANITY 84 757 836 798 422 119 786 455 31240 14237 2410SIKHISM 40 702 720 711 230 43 766 343 27423 9429 839JAINISM 162 976 489 811 396 7 971 411 1175 483 42BUDDHISM 33 680 798 731 334 50 729 403 9972 4022 329ZOROASTRIANISM - 1000 - 1000 500 - 1000 500 0 0 2OTHERS 63 599 750 657 196 35 726 328 5504 1806 454ALL 30 559 558 558 207 29 607 286 1538205 440978 30927ESTD.TOTAL PERSONS(00) 364051 357053 303967 661020 254740 258392 286653 1538205 X X XESTD.PERSONS CURRENTLYATTENDING (00) 11150 199813 169623 369437 52897 7493 174184 440978 X X XSAMPLE PERSONSCURRENTLY ATTENDING 684 12840 11881 24721 4705 817 11173 30927 X X X
A - 24
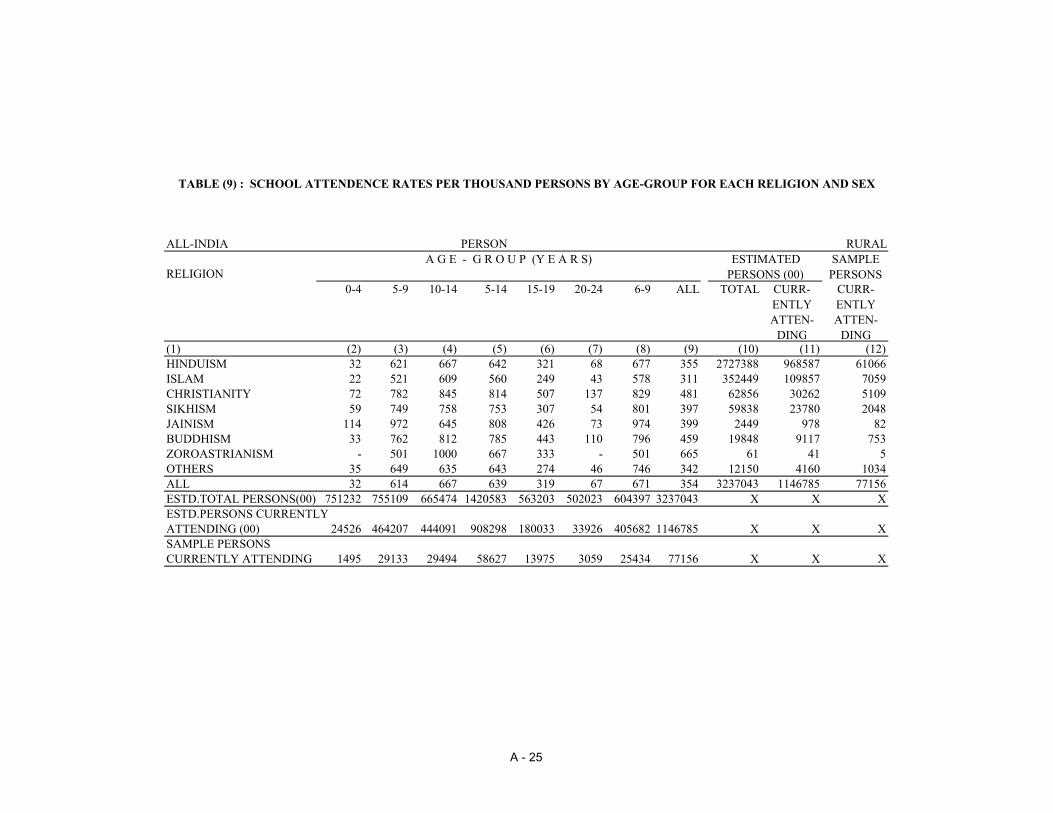
TABLE (9) : SCHOOL ATTENDENCE RATES PER THOUSAND PERSONS BY AGE-GROUP FOR EACH RELIGION AND SEX
ALL-INDIA PERSON RURAL
RELIGIONA G E - G R O U P (Y E A R S) ESTIMATED
PERSONS (00)SAMPLE PERSONS
0-4 5-9 10-14 5-14 15-19 20-24 6-9 ALL TOTAL CURR-ENTLY ATTEN-
DING
CURR-ENTLY ATTEN-
DING(1) (2) (3) (4) (5) (6) (7) (8) (9) (10) (11) (12)HINDUISM 32 621 667 642 321 68 677 355 2727388 968587 61066ISLAM 22 521 609 560 249 43 578 311 352449 109857 7059CHRISTIANITY 72 782 845 814 507 137 829 481 62856 30262 5109SIKHISM 59 749 758 753 307 54 801 397 59838 23780 2048JAINISM 114 972 645 808 426 73 974 399 2449 978 82BUDDHISM 33 762 812 785 443 110 796 459 19848 9117 753ZOROASTRIANISM - 501 1000 667 333 - 501 665 61 41 5OTHERS 35 649 635 643 274 46 746 342 12150 4160 1034ALL 32 614 667 639 319 67 671 354 3237043 1146785 77156ESTD.TOTAL PERSONS(00) 751232 755109 665474 1420583 563203 502023 604397 3237043 X X XESTD.PERSONS CURRENTLYATTENDING (00) 24526 464207 444091 908298 180033 33926 405682 1146785 X X XSAMPLE PERSONSCURRENTLY ATTENDING 1495 29133 29494 58627 13975 3059 25434 77156 X X X
A - 25
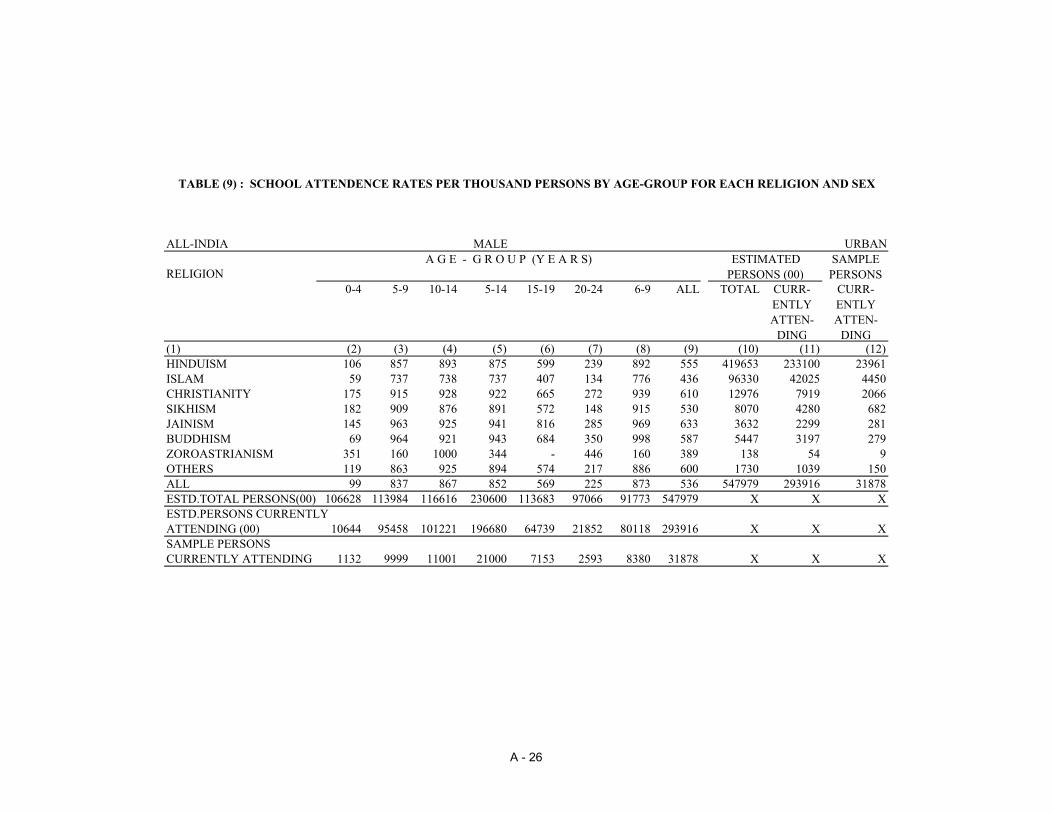
TABLE (9) : SCHOOL ATTENDENCE RATES PER THOUSAND PERSONS BY AGE-GROUP FOR EACH RELIGION AND SEX
ALL-INDIA MALE URBAN
RELIGIONA G E - G R O U P (Y E A R S) ESTIMATED
PERSONS (00)SAMPLE PERSONS
0-4 5-9 10-14 5-14 15-19 20-24 6-9 ALL TOTAL CURR-ENTLY ATTEN-
DING
CURR-ENTLY ATTEN-
DING(1) (2) (3) (4) (5) (6) (7) (8) (9) (10) (11) (12)HINDUISM 106 857 893 875 599 239 892 555 419653 233100 23961ISLAM 59 737 738 737 407 134 776 436 96330 42025 4450CHRISTIANITY 175 915 928 922 665 272 939 610 12976 7919 2066SIKHISM 182 909 876 891 572 148 915 530 8070 4280 682JAINISM 145 963 925 941 816 285 969 633 3632 2299 281BUDDHISM 69 964 921 943 684 350 998 587 5447 3197 279ZOROASTRIANISM 351 160 1000 344 - 446 160 389 138 54 9OTHERS 119 863 925 894 574 217 886 600 1730 1039 150ALL 99 837 867 852 569 225 873 536 547979 293916 31878ESTD.TOTAL PERSONS(00) 106628 113984 116616 230600 113683 97066 91773 547979 X X XESTD.PERSONS CURRENTLYATTENDING (00) 10644 95458 101221 196680 64739 21852 80118 293916 X X XSAMPLE PERSONSCURRENTLY ATTENDING 1132 9999 11001 21000 7153 2593 8380 31878 X X X
A - 26

TABLE (9) : SCHOOL ATTENDENCE RATES PER THOUSAND PERSONS BY AGE-GROUP FOR EACH RELIGION AND SEX
ALL-INDIA FEMALE URBAN
RELIGIONA G E - G R O U P (Y E A R S) ESTIMATED
PERSONS (00)SAMPLE PERSONS
0-4 5-9 10-14 5-14 15-19 20-24 6-9 ALL TOTAL CURR-ENTLY ATTEN-
DING
CURR-ENTLY ATTEN-
DING(1) (2) (3) (4) (5) (6) (7) (8) (9) (10) (11) (12)HINDUISM 103 818 839 829 531 140 852 499 372801 186385 19194ISLAM 45 678 677 678 266 64 722 363 85642 31118 3439CHRISTIANITY 137 928 942 936 704 229 948 594 12189 7249 1888SIKHISM 133 903 875 888 626 195 951 573 8258 4740 640JAINISM 86 903 1000 955 832 161 964 624 3271 2043 250BUDDHISM 37 854 959 894 489 199 951 514 4407 2266 216ZOROASTRIANISM - 370 1000 385 1000 1000 218 505 68 34 9OTHERS 149 604 872 741 653 184 653 518 1381 716 137ALL 92 797 815 806 497 133 833 480 488021 234555 25773ESTD.TOTAL PERSONS(00) 96868 101671 104673 206345 94751 90055 82505 488021 X X XESTD.PERSONS CURRENTLYATTENDING (00) 8925 81061 85400 166461 47129 12038 68800 234555 X X XSAMPLE PERSONSCURRENTLY ATTENDING 925 8632 9183 17815 5533 1500 7315 25773 X X X
A - 27

TABLE (9) : SCHOOL ATTENDENCE RATES PER THOUSAND PERSONS BY AGE-GROUP FOR EACH RELIGION AND SEX
ALL-INDIA PERSON URBAN
RELIGIONA G E - G R O U P (Y E A R S) ESTIMATED
PERSONS (00)SAMPLE PERSONS
0-4 5-9 10-14 5-14 15-19 20-24 6-9 ALL TOTAL CURR-ENTLY ATTEN-
DING
CURR-ENTLY ATTEN-
DING(1) (2) (3) (4) (5) (6) (7) (8) (9) (10) (11) (12)HINDUISM 104 839 867 853 568 192 873 529 792609 419587 43164ISLAM 52 710 709 709 345 100 751 401 181973 73143 7889CHRISTIANITY 156 921 934 928 685 251 943 602 25166 15169 3956SIKHISM 160 906 875 889 598 173 933 552 16329 9020 1322JAINISM 115 933 960 948 824 232 967 629 6906 4346 532BUDDHISM 56 909 936 921 592 279 976 554 9855 5464 495ZOROASTRIANISM 319 280 1000 365 774 527 190 427 207 88 18OTHERS 133 760 903 832 613 201 818 564 3112 1755 287ALL 96 818 843 831 536 181 854 510 1036159 528577 57663ESTD.TOTAL PERSONS(00) 203527 215662 221322 436985 208499 187147 174285 1036159 X X XESTD.PERSONS CURRENTLYATTENDING (00) 19596 176520 186654 363174 111897 33909 148918 528577 X X XSAMPLE PERSONSCURRENTLY ATTENDING 2059 18631 20187 38818 12689 4097 15695 57663 X X X
A - 28

TABLE (10): PER THOUSAND DISTRIBUTION OF PERSONS BY USUAL ACTIVITY CATEGORY TAKING ALSO INTO CONSIDERATION THE SUBSIDIARY ECONOMIC STATUS OF PERSONS CATEGORISED 'NOT WORKING'
FOR EACH HOUSEHOLD RELIGIONALL-INDIA MALE RURAL
USUAL ACTIVITY HOUSEHOLD RELIGION ESTI- SAMPLE
STATUS INDUSTRY
HINDU-ISM
ISLAM CHRI-STIA-NITY
SIKH-ISM
JAIN-ISM
BUDD-HISM
ZOR-OAS-TRIA-NISM
OTH-ERS
N.R. ALL MATED PER-SONS (00)
PERSONS
(1) (2) (3) (4) (5) (6) (7) (8) (9) (10) (11) (12) (13) (14)11 12 21 0 258 182 224 290 195 102 250 255 - 250 752339 50842
1-9 63 113 55 60 208 33 1 77 - 68 205317 123290-9 322 296 280 350 403 136 251 332 - 318 957657 63171
31 0 7 4 9 14 - 12 - 8 - 7 22909 14721-9 39 31 55 45 52 62 - 42 - 39 119472 87450-9 47 35 65 59 52 74 - 51 - 47 142382 10217
41 X 1 0 0 0 - 4 - 4 - 1 5505 44751 0 154 123 168 133 164 272 - 125 - 151 456865 21252
1-9 33 38 39 19 8 41 - 57 - 33 101270 539041,51 0-9 189 163 209 153 173 318 - 186 - 187 563641 2708911-51 0 420 310 403 438 359 387 250 389 - 409 1232114 73566
1-9 138 184 151 125 270 142 1 180 - 143 431566 269110-9 559 494 554 563 629 530 251 570 - 552 1663681 100477
81 X 7 10 21 4 3 9 - 8 - 8 24094 166411-81 X 566 505 575 568 632 540 251 578 - 560 1687776 102141
91 X 222 214 247 233 194 270 499 190 - 222 670059 4377592 X 2 2 2 0 - 1 - 13 - 2 7179 48393 X 1 2 1 2 - 0 - 10 - 1 5720 43194 X 3 3 6 6 8 1 - 5 - 3 10120 58495 X 6 5 10 9 6 11 - 0 - 6 19506 104496 X 0 1 - - - 1 - - - 0 1700 7697 X 69 110 52 66 54 44 249 80 - 73 220308 1211999 X 126 154 102 113 102 127 - 119 - 128 386916 22811
91-99 X 433 494 424 431 367 459 748 421 - 439 1321512 8132311-99 X 1000 1000 1000 1000 1000 1000 1000 1000 - 1000 3009288 183464
PER 1000 DIST. 851 97 20 19 0 6 0 3 - 1000 X XESTD. PERSONS (00) 2562993 294386 60939 58326 2372 18209 81 11977 - 3009288 X XSAMPLE PERSONS 147887 17069 9275 4884 181 1676 8 2484 - 183464 X X
A - 29

TABLE (10): PER THOUSAND DISTRIBUTION OF PERSONS BY USUAL ACTIVITY CATEGORY TAKING ALSO INTO CONSIDERATION THE SUBSIDIARY ECONOMIC STATUS OF PERSONS CATEGORISED 'NOT WORKING'
FOR EACH HOUSEHOLD RELIGIONALL-INDIA FEMALE RURAL
USUAL ACTIVITY HOUSEHOLD RELIGION ESTI- SAMPLE
STATUS INDUSTRY
HINDU-ISM
ISLAM CHRI-STIA-NITY
SIKH-ISM
JAIN-ISM
BUDD-HISM
ZOR-OAS-TRIA-NISM
OTH-ERS
N.R. ALL MATED PER-SONS (00)
PERSONS
(1) (2) (3) (4) (5) (6) (7) (8) (9) (10) (11) (12) (13) (14)11 12 21 0 176 70 164 205 140 72 166 235 - 165 470737 31618
1-9 26 32 36 4 29 16 - 44 - 26 75490 39590-9 202 102 200 209 169 89 166 279 - 192 546227 35577
31 0 1 0 5 0 - 1 - 0 - 1 4655 2601-9 6 4 25 3 - 24 - 4 - 7 20272 15420-9 8 4 31 4 - 25 - 4 - 8 24927 1802
41 X 1 0 0 0 - 1 - 0 - 1 3324 19351 0 124 42 115 25 161 321 - 84 - 115 326916 14218
1-9 10 12 13 2 7 23 - 12 - 10 29510 146841,51 0-9 135 54 128 27 169 345 - 96 - 126 359751 1587911-51 0 302 113 284 231 302 395 166 319 - 282 802309 46096
1-9 44 49 75 9 36 66 - 60 - 45 128597 71620-9 346 162 360 241 339 461 166 380 - 327 930907 53258
81 X 2 2 16 1 1 0 - 3 - 2 7389 61011-81 X 349 165 376 242 340 461 166 384 - 330 938296 53868
91 X 144 151 225 174 188 188 333 159 - 148 420599 2952692 X 153 220 155 104 245 83 166 117 - 158 450029 2913393 X 125 182 73 293 40 44 - 129 - 132 377431 2276094 X 2 2 4 3 19 1 - 5 - 2 7074 37695 X 5 3 9 6 - 12 - 7 - 5 15265 86596 X 0 1 - - - - - - - 0 1114 5897 X 92 121 56 60 91 80 166 75 - 93 266100 1492799 X 126 150 99 113 73 127 166 120 - 128 363921 21312
91-99 X 650 834 623 757 659 538 833 615 - 669 1901535 11895711-99 X 1000 1000 1000 1000 1000 1000 1000 1000 - 1000 2839832 172825
PER 1000 DIST. 849 99 21 18 0 6 - 3 - 1000 X XESTD. PERSONS (00) 2413040 282675 60811 51859 2327 18440 0 10677 - 2839832 X XSAMPLE PERSONS 139193 16299 8881 4354 180 1574 6 2338 - 172825 X X
A - 30
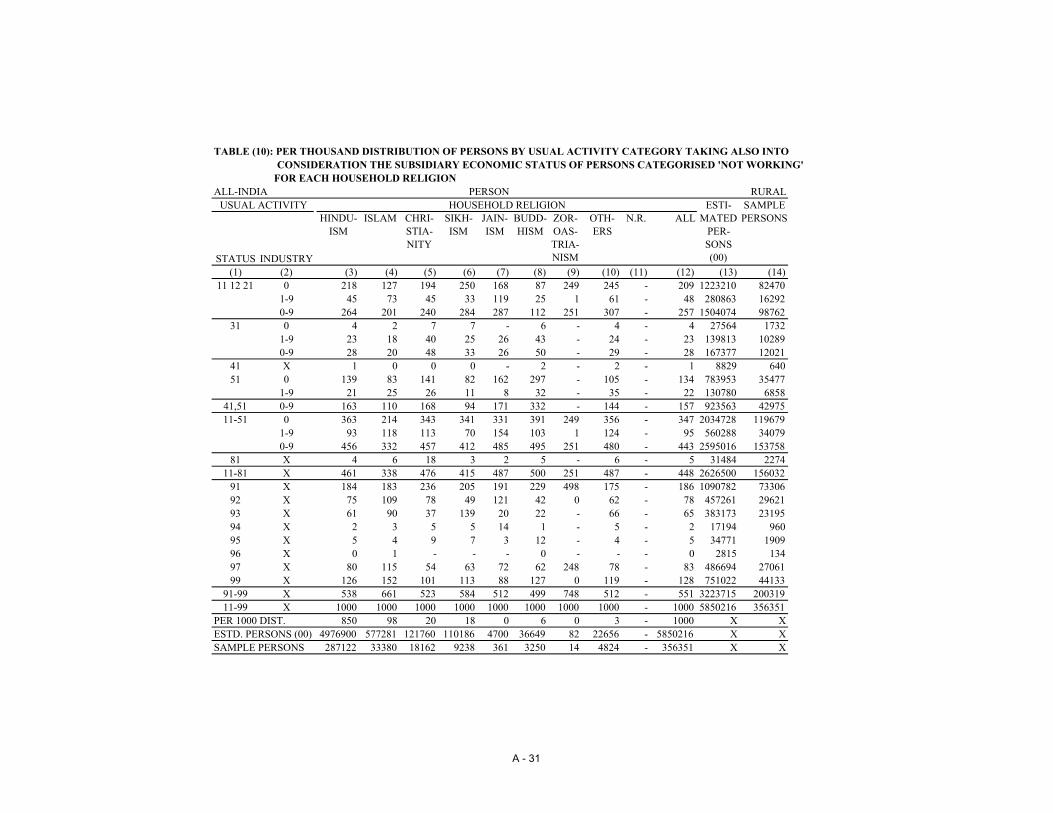
TABLE (10): PER THOUSAND DISTRIBUTION OF PERSONS BY USUAL ACTIVITY CATEGORY TAKING ALSO INTO CONSIDERATION THE SUBSIDIARY ECONOMIC STATUS OF PERSONS CATEGORISED 'NOT WORKING'
FOR EACH HOUSEHOLD RELIGIONALL-INDIA PERSON RURAL
USUAL ACTIVITY HOUSEHOLD RELIGION ESTI- SAMPLE
STATUS INDUSTRY
HINDU-ISM
ISLAM CHRI-STIA-NITY
SIKH-ISM
JAIN-ISM
BUDD-HISM
ZOR-OAS-TRIA-NISM
OTH-ERS
N.R. ALL MATED PER-SONS (00)
PERSONS
(1) (2) (3) (4) (5) (6) (7) (8) (9) (10) (11) (12) (13) (14)11 12 21 0 218 127 194 250 168 87 249 245 - 209 1223210 82470
1-9 45 73 45 33 119 25 1 61 - 48 280863 162920-9 264 201 240 284 287 112 251 307 - 257 1504074 98762
31 0 4 2 7 7 - 6 - 4 - 4 27564 17321-9 23 18 40 25 26 43 - 24 - 23 139813 102890-9 28 20 48 33 26 50 - 29 - 28 167377 12021
41 X 1 0 0 0 - 2 - 2 - 1 8829 64051 0 139 83 141 82 162 297 - 105 - 134 783953 35477
1-9 21 25 26 11 8 32 - 35 - 22 130780 685841,51 0-9 163 110 168 94 171 332 - 144 - 157 923563 4297511-51 0 363 214 343 341 331 391 249 356 - 347 2034728 119679
1-9 93 118 113 70 154 103 1 124 - 95 560288 340790-9 456 332 457 412 485 495 251 480 - 443 2595016 153758
81 X 4 6 18 3 2 5 - 6 - 5 31484 227411-81 X 461 338 476 415 487 500 251 487 - 448 2626500 156032
91 X 184 183 236 205 191 229 498 175 - 186 1090782 7330692 X 75 109 78 49 121 42 0 62 - 78 457261 2962193 X 61 90 37 139 20 22 - 66 - 65 383173 2319594 X 2 3 5 5 14 1 - 5 - 2 17194 96095 X 5 4 9 7 3 12 - 4 - 5 34771 190996 X 0 1 - - - 0 - - - 0 2815 13497 X 80 115 54 63 72 62 248 78 - 83 486694 2706199 X 126 152 101 113 88 127 0 119 - 128 751022 44133
91-99 X 538 661 523 584 512 499 748 512 - 551 3223715 20031911-99 X 1000 1000 1000 1000 1000 1000 1000 1000 - 1000 5850216 356351
PER 1000 DIST. 850 98 20 18 0 6 0 3 - 1000 X XESTD. PERSONS (00) 4976900 577281 121760 110186 4700 36649 82 22656 - 5850216 X XSAMPLE PERSONS 287122 33380 18162 9238 361 3250 14 4824 - 356351 X X
A - 31

TABLE (10): PER THOUSAND DISTRIBUTION OF PERSONS BY USUAL ACTIVITY CATEGORY TAKING ALSO INTO CONSIDERATION THE SUBSIDIARY ECONOMIC STATUS OF PERSONS CATEGORISED 'NOT WORKING'
FOR EACH HOUSEHOLD RELIGIONALL-INDIA MALE URBAN
USUAL ACTIVITY HOUSEHOLD RELIGION ESTI- SAMPLE
STATUS INDUSTRY
HINDU-ISM
ISLAM CHRI-STIA-NITY
SIKH-ISM
JAIN-ISM
BUDD-HISM
ZOR-OAS-TRIA-NISM
OTH-ERS
N.R. ALL MATED PER-SONS (00)
PERSONS
(1) (2) (3) (4) (5) (6) (7) (8) (9) (10) (11) (12) (13) (14)11 12 21 0 29 19 39 43 4 4 - 43 - 28 28549 3756
1-9 176 253 108 254 389 78 318 205 - 188 191441 210720-9 206 273 147 297 393 82 318 249 - 216 219991 24828
31 0 2 0 0 0 - - - 0 - 2 2272 2341-9 233 133 260 194 175 246 241 170 - 217 220544 236780-9 235 134 260 195 175 246 241 170 - 219 222817 23912
41 X 0 0 0 - - - - 0 - 0 882 15351 0 17 12 23 12 - 31 - 7 - 16 16543 1597
1-9 65 79 70 28 4 101 - 63 - 67 68332 650641,51 0-9 83 92 95 41 4 132 - 72 - 84 85757 825611-51 0 49 32 63 56 4 35 - 51 - 46 47365 5587
1-9 476 467 439 478 569 425 559 440 - 474 481200 514090-9 525 500 503 534 573 461 559 492 - 520 528565 56996
81 X 22 17 39 21 4 33 25 15 - 21 22291 242411-81 X 548 517 542 556 578 495 584 507 - 542 550857 59420
91 X 282 259 295 254 290 325 124 342 - 279 283330 3079692 X 2 2 2 1 2 1 - 3 - 2 2708 34193 X 1 1 0 1 0 - - - - 1 1090 12894 X 17 8 22 22 23 17 129 20 - 16 16668 184895 X 5 7 6 9 6 4 - 1 - 5 6081 63296 X 0 0 0 - - 3 - - - 0 303 2897 X 42 70 37 43 30 21 87 31 - 46 46887 488799 X 100 131 91 109 68 130 73 92 - 105 106624 10987
91-99 X 451 482 457 443 421 504 415 492 - 457 463696 4964711-99 X 1000 1000 1000 1000 1000 1000 1000 1000 - 1000 1014553 109067
PER 1000 DIST. 784 154 25 15 7 9 0 2 - 1000 X XESTD. PERSONS (00) 795651 157048 25934 15528 7586 9434 366 3003 - 1014553 X XSAMPLE PERSONS 81673 16756 6069 2295 950 802 57 465 - 109067 X X
A - 32

TABLE (10): PER THOUSAND DISTRIBUTION OF PERSONS BY USUAL ACTIVITY CATEGORY TAKING ALSO INTO CONSIDERATION THE SUBSIDIARY ECONOMIC STATUS OF PERSONS CATEGORISED 'NOT WORKING'
FOR EACH HOUSEHOLD RELIGIONALL-INDIA FEMALE URBAN
USUAL ACTIVITY HOUSEHOLD RELIGION ESTI- SAMPLE
STATUS INDUSTRY
HINDU-ISM
ISLAM CHRI-STIA-NITY
SIKH-ISM
JAIN-ISM
BUDD-HISM
ZOR-OAS-TRIA-NISM
OTH-ERS
N.R. ALL MATED PER-SONS (00)
PERSONS
(1) (2) (3) (4) (5) (6) (7) (8) (9) (10) (11) (12) (13) (14)11 12 21 0 23 13 23 23 1 1 - 42 - 21 20145 2518
1-9 45 62 43 20 29 36 2 83 - 47 43418 47620-9 69 75 66 43 30 37 2 125 - 69 63563 7280
31 0 0 0 - - - - - - - 0 346 381-9 47 18 127 40 19 76 144 21 - 44 41059 47770-9 47 18 127 40 19 76 144 21 - 45 41405 4815
41 X 0 - 0 - - 1 - - - 0 120 2651 0 18 5 8 5 - 47 - 4 - 15 14543 1268
1-9 25 23 17 2 1 32 - 31 - 24 22390 210741,51 0-9 43 28 25 7 1 80 - 36 - 40 37054 340111-51 0 42 19 31 28 1 48 - 47 - 38 35034 3824
1-9 117 103 187 62 50 145 147 136 - 116 106989 116720-9 160 122 219 91 51 194 147 183 - 154 142023 15496
81 X 10 4 27 8 5 14 - 12 - 10 9445 109611-81 X 171 127 247 99 56 208 147 196 - 165 151468 16592
91 X 249 209 272 301 288 263 122 249 - 245 225028 2488892 X 330 340 298 248 448 348 389 335 - 330 303648 3240893 X 84 96 38 219 66 25 10 56 - 86 79384 894394 X 4 4 14 3 2 6 20 6 - 4 4534 54495 X 4 3 3 2 11 4 10 1 - 4 3948 40396 X 0 0 - - - 1 - - - 0 545 6497 X 53 79 34 37 51 45 289 63 - 57 52494 553799 X 100 136 90 87 73 95 9 90 - 105 96868 9904
91-99 X 828 872 752 900 943 791 852 803 - 834 766452 8269111-99 X 1000 1000 1000 1000 1000 1000 1000 1000 - 1000 917921 99283
PER 1000 DIST. 780 155 27 16 7 9 0 2 - 1000 X XESTD. PERSONS (00) 716279 142687 25527 15261 7008 8399 281 2476 - 917921 X XSAMPLE PERSONS 73699 15397 5967 2124 888 744 52 412 - 99283 X X
A - 33

TABLE (10): PER THOUSAND DISTRIBUTION OF PERSONS BY USUAL ACTIVITY CATEGORY TAKING ALSO INTO CONSIDERATION THE SUBSIDIARY ECONOMIC STATUS OF PERSONS CATEGORISED 'NOT WORKING'
FOR EACH HOUSEHOLD RELIGIONALL-INDIA PERSON URBAN
USUAL ACTIVITY HOUSEHOLD RELIGION ESTI- SAMPLE
STATUS INDUSTRY
HINDU-ISM
ISLAM CHRI-STIA-NITY
SIKH-ISM
JAIN-ISM
BUDD-HISM
ZOR-OAS-TRIA-NISM
OTH-ERS
N.R. ALL MATED PER-SONS (00)
PERSONS
(1) (2) (3) (4) (5) (6) (7) (8) (9) (10) (11) (12) (13) (14)11 12 21 0 26 16 31 33 3 2 - 43 - 25 48700 6275
1-9 114 162 75 138 216 58 181 150 - 121 234897 258400-9 141 179 107 171 219 61 181 193 - 146 283597 32115
31 0 1 0 0 0 - - - 0 - 1 2618 2721-9 144 79 194 118 100 166 199 102 - 135 261619 284590-9 146 79 194 118 100 166 199 103 - 136 264237 28731
41 X 0 0 0 - - 0 - 0 - 0 1002 17951 0 17 8 15 8 - 38 - 6 - 16 31086 2865
1-9 46 52 44 15 3 68 - 49 - 46 90740 861541,51 0-9 64 61 60 24 3 108 - 56 - 63 122829 1165911-51 0 46 26 47 42 3 41 - 49 - 42 82404 9412
1-9 306 294 314 272 320 293 380 303 - 304 588259 630930-9 352 320 362 314 323 335 380 352 - 347 670664 72505
81 X 16 11 33 15 4 24 14 13 - 16 31753 352111-81 X 369 332 396 330 327 360 394 366 - 363 702417 76026
91 X 266 235 283 277 289 296 123 300 - 263 508399 5569092 X 157 163 149 124 216 164 169 153 - 158 306385 3275493 X 40 46 19 109 32 12 4 25 - 41 80510 907394 X 11 6 18 13 13 12 82 14 - 10 21225 239395 X 5 5 4 5 8 4 4 1 - 5 10029 103596 X 0 0 0 - - 2 - - - 0 849 9297 X 47 74 36 40 40 32 175 46 - 51 99417 1043199 X 100 134 90 98 70 113 45 91 - 105 203524 20895
91-99 X 630 667 603 669 672 639 605 633 - 636 1230342 13236311-99 X 1000 1000 1000 1000 1000 1000 1000 1000 - 1000 1932760 208389
PER 1000 DIST. 782 155 26 15 7 9 0 2 - 1000 X XESTD. PERSONS (00) 1512207 299741 51462 30789 14597 17833 648 5479 - 1932760 X XSAMPLE PERSONS 155406 32154 12039 4419 1839 1546 109 877 - 208389 X X
A - 34

TABLE (12) : PER THOUSAND DISTRIBUTION OF PERSONS OF AGE 15 YEARS AND ABOVE BY GENERAL EDUCATION FOR EACH USUAL ACTIVITY CATEGORY TAKING ALSO INTO CONSIDERATION THE SUBSIDIARY ECONOMIC STATUS OF PERSONS CATEGORISED 'NOT WORKING' AND RELIGION
ALL INDIA HINDUISM RURAL MALEUSUAL ACTIVITY GENERAL EDUCATION PERSONS
STATUS INDUSTRY NOT LITE-RATE
LITE-RATE &
UPTO PRI-
MARY
MIDD-LE
SECO-NDARY
HIGH-ER SE-COND-
ARY
GRAD-UATE & AB-OVE
N.R. SECO-NDARY & AB-OVE
ALL ESTI-MATED
(00)
SAM-PLE
(1) (2) (3) (4) (5) (6) (7) (8) (9) (10) (11) (12) (13)11, 12, 21 0 407 298 157 81 38 19 - 139 1000 634795 39759
1-5 356 364 163 75 28 13 - 117 1000 55662 30946-9 245 333 205 117 55 44 - 217 1000 103610 64330-9 382 307 163 85 40 22 - 147 1000 794066 49286
31 0 616 229 74 45 20 16 - 81 1000 17981 10951-5 184 283 203 201 55 74 - 330 1000 29966 16466-9 82 161 173 223 149 212 - 584 1000 71620 53660-9 188 202 165 191 106 148 - 445 1000 119568 8107
41 X 484 355 124 25 11 1 - 36 1000 5058 38151 0 625 263 77 25 8 3 - 36 1000 385069 17454
1-5 431 360 139 57 11 1 - 69 1000 63897 31996-9 381 334 187 60 30 7 - 97 1000 18279 11680-9 589 279 90 31 9 3 - 42 1000 467245 21821
41 - 51 0-9 587 280 90 30 9 3 - 42 1000 472304 2220211 - 51 0 491 283 126 60 27 13 - 99 1000 1037846 58308
1-5 358 347 160 90 26 20 - 135 1000 154583 83206-9 197 269 191 151 88 103 - 342 1000 193509 129670-9 435 289 139 76 35 26 - 137 1000 1385938 79595
81 X 61 78 203 274 190 193 - 658 1000 18840 129811 - 81 X 430 286 140 78 37 29 - 144 1000 1404778 80893
91 X 8 156 397 265 147 23 4 435 1000 116763 809292 X 557 264 98 60 10 11 - 81 1000 4344 26993 X 677 160 92 48 17 6 - 71 1000 2248 14894 X 388 334 137 91 19 29 3 138 1000 8079 44795 X 717 200 61 12 7 2 - 21 1000 15065 78396 X 758 208 34 - - - - - 1000 1176 5497 X 653 232 71 29 9 5 1 43 1000 48804 281299 X - - - - - - - - - - -
91 - 99 X 262 189 267 172 91 17 3 279 1000 196479 1260511 - 99 X 410 274 155 90 44 27 - 161 1000 1601257 93498
ESTIMATED PERSONS (00) 655916 438394 248597 143929 70178 43459 785 257565 1601257 X XSAMPLE PERSONS 33120 25390 15788 10286 5174 3701 39 19161 93498 X X
A - 44

TABLE (12) : PER THOUSAND DISTRIBUTION OF PERSONS OF AGE 15 YEARS AND ABOVE BY GENERAL EDUCATION FOR EACH USUAL ACTIVITY CATEGORY TAKING ALSO INTO CONSIDERATION THE SUBSIDIARY ECONOMIC STATUS OF PERSONS CATEGORISED 'NOT WORKING' AND RELIGION
ALL INDIA HINDUISM RURAL FEMALEUSUAL ACTIVITY GENERAL EDUCATION PERSONS
STATUS INDUSTRY NOT LITE-RATE
LITE-RATE &
UPTO PRI-
MARY
MIDD-LE
SECO-NDARY
HIGH-ER SE-COND-
ARY
GRAD-UATE & AB-OVE
N.R. SECO-NDARY & AB-OVE
ALL ESTI-MATED
(00)
SAM-PLE
(1) (2) (3) (4) (5) (6) (7) (8) (9) (10) (11) (12) (13)11, 12, 21 0 784 147 46 17 4 2 - 23 1000 401007 24560
1-5 674 230 65 22 8 1 - 31 1000 33806 17476-9 611 221 83 53 17 14 - 84 1000 25458 13240-9 766 157 50 20 5 2 - 27 1000 460270 27631
31 0 826 127 30 6 11 - - 17 1000 3876 2191-5 502 210 104 62 64 57 - 183 1000 4893 2256-9 262 130 114 227 128 140 - 494 1000 11290 9130-9 429 149 95 144 90 92 - 326 1000 20060 1357
41 X 695 294 5 6 - - - 6 1000 3051 17051 0 876 99 20 4 1 - - 5 1000 286986 12381
1-5 766 174 45 11 4 - - 15 1000 18843 8756-9 804 132 48 3 2 12 - 17 1000 3918 2580-9 869 104 22 4 1 - - 6 1000 309747 13514
41 - 51 0-9 867 106 21 5 1 - - 6 1000 312799 1368411 - 51 0 823 127 35 12 3 1 - 15 1000 691869 37160
1-5 690 214 59 21 11 5 - 37 1000 60594 30176-9 533 187 88 97 46 49 - 192 1000 40666 24950-9 798 137 40 17 6 4 - 26 1000 793129 42672
81 X 83 95 139 291 167 224 - 683 1000 5338 42611 - 81 X 793 136 40 19 7 5 - 30 1000 798466 43098
91 X 10 160 418 290 107 15 - 412 1000 44879 377892 X 601 222 106 49 16 6 - 71 1000 344460 2216193 X 711 179 68 27 10 5 - 42 1000 281308 1645294 X 859 79 45 17 - - - 18 1000 5669 29095 X 928 57 9 6 - - - 6 1000 11641 63396 X 1000 - - - - - - - 1000 673 3797 X 912 66 15 5 2 1 - 8 1000 68010 420699 X - - - - - - - - - - -
91 - 99 X 642 184 100 50 17 6 - 73 1000 756642 4755711 - 99 X 719 160 70 34 12 5 - 51 1000 1555108 90655
ESTIMATED PERSONS (00) 1118773 248264 108186 52861 18479 8278 268 79618 1555108 X XSAMPLE PERSONS 59522 16193 8081 4391 1614 828 26 6833 90655 X X
A - 45

TABLE (12) : PER THOUSAND DISTRIBUTION OF PERSONS OF AGE 15 YEARS AND ABOVE BY GENERAL EDUCATION FOR EACH USUAL ACTIVITY CATEGORY TAKING ALSO INTO CONSIDERATION THE SUBSIDIARY ECONOMIC STATUS OF PERSONS CATEGORISED 'NOT WORKING' AND RELIGION
ALL INDIA HINDUISM RURAL PERSONUSUAL ACTIVITY GENERAL EDUCATION PERSONS
STATUS INDUSTRY NOT LITE-RATE
LITE-RATE &
UPTO PRI-
MARY
MIDD-LE
SECO-NDARY
HIGH-ER SE-COND-
ARY
GRAD-UATE & AB-OVE
N.R. SECO-NDARY & AB-OVE
ALL ESTI-MATED
(00)
SAM-PLE
(1) (2) (3) (4) (5) (6) (7) (8) (9) (10) (11) (12) (13)11, 12, 21 0 553 239 114 57 25 12 - 94 1000 1035887 64323
1-5 476 313 126 55 20 9 - 84 1000 89501 48436-9 317 311 181 105 48 38 - 191 1000 129089 77580-9 523 252 122 61 27 15 - 103 1000 1254476 76924
31 0 653 211 66 38 18 13 - 70 1000 21858 13141-5 229 273 189 181 56 72 - 309 1000 34859 18716-9 106 157 165 223 146 202 - 572 1000 82911 62790-9 222 194 155 184 104 140 - 428 1000 139628 9464
41 X 563 332 80 18 7 1 - 25 1000 8109 55151 0 732 193 53 16 5 2 - 22 1000 672190 29840
1-5 508 318 118 46 10 1 - 56 1000 82740 40746-9 456 299 163 50 25 8 - 83 1000 22198 14260-9 700 209 63 20 6 2 - 28 1000 777128 35340
41 - 51 0-9 699 210 63 20 6 2 - 28 1000 785238 3589111 - 51 0 624 221 90 41 17 8 - 66 1000 1729935 95477
1-5 451 309 131 71 21 16 - 108 1000 215210 113396-9 256 255 174 141 81 94 - 316 1000 234197 154630-9 567 233 103 54 24 18 - 97 1000 2179342 122279
81 X 66 82 189 278 185 200 - 663 1000 24178 172411 - 81 X 562 232 104 57 26 20 - 103 1000 2203520 124003
91 X 8 157 402 272 136 21 3 429 1000 161712 1187292 X 600 223 106 49 16 6 - 71 1000 348822 2243393 X 711 178 68 27 10 5 - 42 1000 283576 1660394 X 582 228 99 61 11 17 2 89 1000 13748 73795 X 809 138 39 9 4 1 - 14 1000 26706 141696 X 846 132 22 - - - - - 1000 1849 9197 X 803 135 38 15 5 3 1 23 1000 116892 702299 X - - - - - - - - - - -
91 - 99 X 564 185 135 75 33 8 1 116 1000 953305 6017411 - 99 X 562 218 113 62 28 16 - 107 1000 3156825 184177
ESTIMATED PERSONS (00) 1774722 686701 356784 196791 88726 51803 1299 337320 3156825 X XSAMPLE PERSONS 92646 41585 23870 14678 6790 4532 76 26000 184177 X X
A - 46

TABLE (12) : PER THOUSAND DISTRIBUTION OF PERSONS OF AGE 15 YEARS AND ABOVE BY GENERAL EDUCATION FOR EACH USUAL ACTIVITY CATEGORY TAKING ALSO INTO CONSIDERATION THE SUBSIDIARY ECONOMIC STATUS OF PERSONS CATEGORISED 'NOT WORKING' AND RELIGION
ALL INDIA ISLAM RURAL MALEUSUAL ACTIVITY GENERAL EDUCATION PERSONS
STATUS INDUSTRY NOT LITE-RATE
LITE-RATE &
UPTO PRI-
MARY
MIDD-LE
SECO-NDARY
HIGH-ER SE-COND-
ARY
GRAD-UATE & AB-OVE
N.R. SECO-NDARY & AB-OVE
ALL ESTI-MATED
(00)
SAM-PLE
(1) (2) (3) (4) (5) (6) (7) (8) (9) (10) (11) (12) (13)11, 12, 21 0 490 308 119 44 18 20 - 82 1000 51282 3295
1-5 498 348 98 34 12 11 - 56 1000 8582 4186-9 385 386 146 48 19 17 - 83 1000 23995 13450-9 461 334 125 44 18 18 - 80 1000 83859 5058
31 0 650 163 170 14 - 4 - 17 1000 1089 841-5 363 369 111 52 74 31 - 158 1000 2307 1216-9 113 294 178 186 122 107 - 414 1000 6795 5360-9 227 297 162 137 98 78 - 314 1000 10190 741
41 X 807 101 67 25 - - - 25 1000 211 3251 0 671 254 59 12 3 1 1 15 1000 35676 1774
1-5 562 332 83 7 17 - - 24 1000 7148 3286-9 378 451 139 22 5 5 - 32 1000 3560 2180-9 632 281 69 12 5 1 1 18 1000 46384 2320
41 - 51 0-9 632 280 69 12 5 1 1 18 1000 46595 235211 - 51 0 565 284 96 30 12 12 - 54 1000 88047 5153
1-5 509 341 93 25 22 9 - 56 1000 18248 8996-9 331 375 151 72 38 33 - 143 1000 34350 20990-9 501 314 109 40 19 17 - 76 1000 140645 8151
81 X 89 228 212 201 110 156 3 468 1000 3019 19211 - 81 X 492 312 111 43 21 20 - 84 1000 143664 8343
91 X 13 215 430 213 117 12 - 342 1000 9398 74192 X 606 266 58 66 2 2 - 71 1000 531 3593 X 866 93 40 - - - - - 1000 434 2794 X 333 416 72 134 18 26 - 179 1000 1039 5295 X 663 295 31 11 - - - 11 1000 1404 7996 X 893 107 - - - - - - 1000 415 1797 X 697 222 57 15 9 - - 24 1000 4815 28999 X - - - - - - - - - - -
91 - 99 X 323 231 248 126 64 8 - 198 1000 18037 124011 - 99 X 473 303 126 53 26 19 - 97 1000 161701 9583
ESTIMATED PERSONS (00) 76523 48995 20441 8497 4216 2992 36 15705 161701 X XSAMPLE PERSONS 3870 2953 1459 684 334 281 2 1299 9583 X X
A - 47
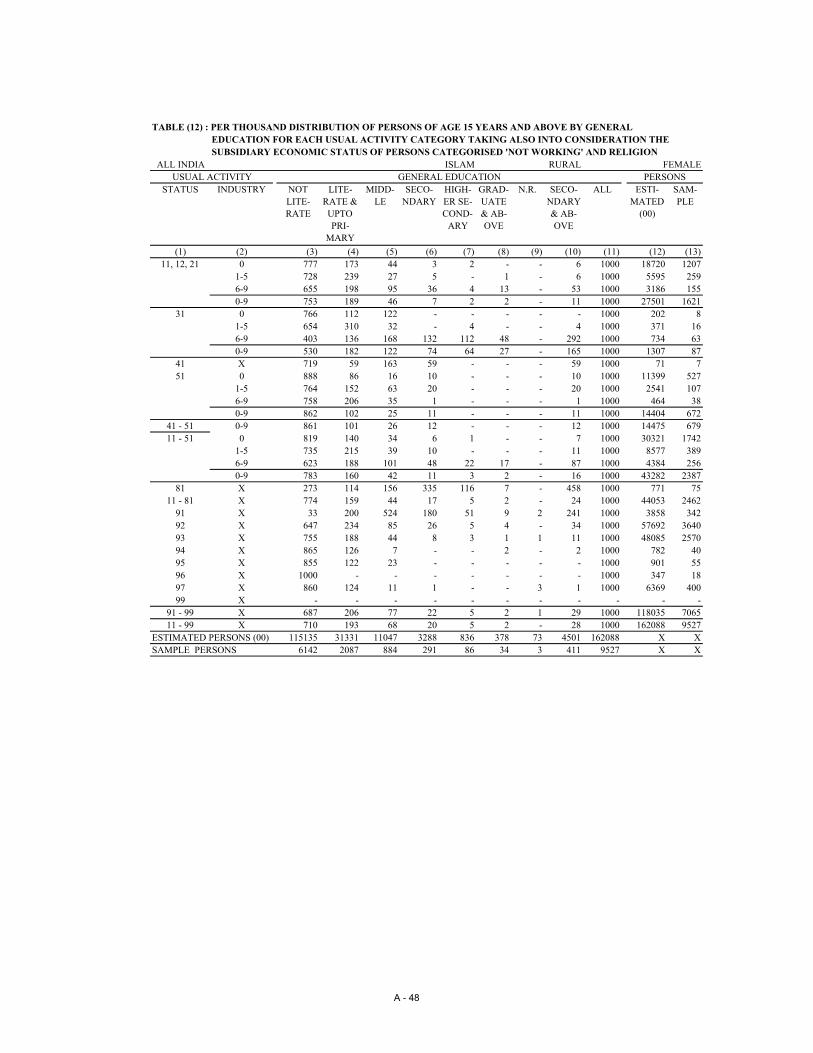
TABLE (12) : PER THOUSAND DISTRIBUTION OF PERSONS OF AGE 15 YEARS AND ABOVE BY GENERAL EDUCATION FOR EACH USUAL ACTIVITY CATEGORY TAKING ALSO INTO CONSIDERATION THE SUBSIDIARY ECONOMIC STATUS OF PERSONS CATEGORISED 'NOT WORKING' AND RELIGION
ALL INDIA ISLAM RURAL FEMALEUSUAL ACTIVITY GENERAL EDUCATION PERSONS
STATUS INDUSTRY NOT LITE-RATE
LITE-RATE &
UPTO PRI-
MARY
MIDD-LE
SECO-NDARY
HIGH-ER SE-COND-
ARY
GRAD-UATE & AB-OVE
N.R. SECO-NDARY & AB-OVE
ALL ESTI-MATED
(00)
SAM-PLE
(1) (2) (3) (4) (5) (6) (7) (8) (9) (10) (11) (12) (13)11, 12, 21 0 777 173 44 3 2 - - 6 1000 18720 1207
1-5 728 239 27 5 - 1 - 6 1000 5595 2596-9 655 198 95 36 4 13 - 53 1000 3186 1550-9 753 189 46 7 2 2 - 11 1000 27501 1621
31 0 766 112 122 - - - - - 1000 202 81-5 654 310 32 - 4 - - 4 1000 371 166-9 403 136 168 132 112 48 - 292 1000 734 630-9 530 182 122 74 64 27 - 165 1000 1307 87
41 X 719 59 163 59 - - - 59 1000 71 751 0 888 86 16 10 - - - 10 1000 11399 527
1-5 764 152 63 20 - - - 20 1000 2541 1076-9 758 206 35 1 - - - 1 1000 464 380-9 862 102 25 11 - - - 11 1000 14404 672
41 - 51 0-9 861 101 26 12 - - - 12 1000 14475 67911 - 51 0 819 140 34 6 1 - - 7 1000 30321 1742
1-5 735 215 39 10 - - - 11 1000 8577 3896-9 623 188 101 48 22 17 - 87 1000 4384 2560-9 783 160 42 11 3 2 - 16 1000 43282 2387
81 X 273 114 156 335 116 7 - 458 1000 771 7511 - 81 X 774 159 44 17 5 2 - 24 1000 44053 2462
91 X 33 200 524 180 51 9 2 241 1000 3858 34292 X 647 234 85 26 5 4 - 34 1000 57692 364093 X 755 188 44 8 3 1 1 11 1000 48085 257094 X 865 126 7 - - 2 - 2 1000 782 4095 X 855 122 23 - - - - - 1000 901 5596 X 1000 - - - - - - - 1000 347 1897 X 860 124 11 1 - - 3 1 1000 6369 40099 X - - - - - - - - - - -
91 - 99 X 687 206 77 22 5 2 1 29 1000 118035 706511 - 99 X 710 193 68 20 5 2 - 28 1000 162088 9527
ESTIMATED PERSONS (00) 115135 31331 11047 3288 836 378 73 4501 162088 X XSAMPLE PERSONS 6142 2087 884 291 86 34 3 411 9527 X X
A - 48

TABLE (12) : PER THOUSAND DISTRIBUTION OF PERSONS OF AGE 15 YEARS AND ABOVE BY GENERAL EDUCATION FOR EACH USUAL ACTIVITY CATEGORY TAKING ALSO INTO CONSIDERATION THE SUBSIDIARY ECONOMIC STATUS OF PERSONS CATEGORISED 'NOT WORKING' AND RELIGION
ALL INDIA ISLAM RURAL PERSONUSUAL ACTIVITY GENERAL EDUCATION PERSONS
STATUS INDUSTRY NOT LITE-RATE
LITE-RATE &
UPTO PRI-
MARY
MIDD-LE
SECO-NDARY
HIGH-ER SE-COND-
ARY
GRAD-UATE & AB-OVE
N.R. SECO-NDARY & AB-OVE
ALL ESTI-MATED
(00)
SAM-PLE
(1) (2) (3) (4) (5) (6) (7) (8) (9) (10) (11) (12) (13)11, 12, 21 0 567 272 99 33 14 15 - 62 1000 70003 4502
1-5 589 305 70 23 7 7 - 36 1000 14177 6776-9 417 364 140 46 17 16 - 80 1000 27181 15000-9 533 299 105 35 14 14 - 63 1000 111360 6679
31 0 668 155 163 11 - 3 - 14 1000 1291 921-5 393 352 97 56 75 26 - 158 1000 2745 1396-9 142 279 177 181 121 101 - 402 1000 7530 5990-9 260 282 157 132 97 72 - 301 1000 11565 830
41 X 785 90 91 33 - - - 33 1000 282 3951 0 723 213 49 11 2 - 1 14 1000 47109 2303
1-5 615 285 78 10 12 - - 23 1000 9689 4356-9 422 422 127 20 5 5 - 29 1000 4024 2560-9 686 239 58 12 4 1 1 16 1000 60823 2994
41 - 51 0-9 686 238 59 12 4 1 1 16 1000 61105 303311 - 51 0 630 247 80 24 9 9 1 42 1000 118402 6897
1-5 580 300 76 22 16 6 - 44 1000 26893 12906-9 364 353 146 70 36 32 - 137 1000 38734 23550-9 567 277 93 33 16 13 - 62 1000 184030 10542
81 X 126 205 201 229 111 126 3 466 1000 3790 26711 - 81 X 558 276 95 37 18 16 - 71 1000 187820 10809
91 X 19 211 457 203 98 12 1 313 1000 13256 108392 X 646 234 84 26 5 4 1 35 1000 58259 367793 X 756 188 44 8 3 1 1 11 1000 48520 259794 X 561 292 44 77 10 16 - 103 1000 1821 9295 X 738 227 28 6 - - - 6 1000 2305 13496 X 942 58 - - - - - - 1000 762 3597 X 789 167 31 7 4 - 2 11 1000 11188 69099 X - - - - - - - - - - -
91 - 99 X 638 209 100 35 13 3 1 52 1000 136111 830811 - 99 X 592 248 97 36 16 10 1 63 1000 323931 19117
ESTIMATED PERSONS (00) 191658 80331 31488 11819 5086 3370 180 20275 323931 X XSAMPLE PERSONS 10012 5041 2343 976 421 315 9 1712 19117 X X
A - 49

TABLE (12) : PER THOUSAND DISTRIBUTION OF PERSONS OF AGE 15 YEARS AND ABOVE BY GENERAL EDUCATION FOR EACH USUAL ACTIVITY CATEGORY TAKING ALSO INTO CONSIDERATION THE SUBSIDIARY ECONOMIC STATUS OF PERSONS CATEGORISED 'NOT WORKING' AND RELIGION
ALL INDIA CHRISTIANITY RURAL MALEUSUAL ACTIVITY GENERAL EDUCATION PERSONS
STATUS INDUSTRY NOT LITE-RATE
LITE-RATE &
UPTO PRI-
MARY
MIDD-LE
SECO-NDARY
HIGH-ER SE-COND-
ARY
GRAD-UATE & AB-OVE
N.R. SECO-NDARY & AB-OVE
ALL ESTI-MATED
(00)
SAM-PLE
(1) (2) (3) (4) (5) (6) (7) (8) (9) (10) (11) (12) (13)11, 12, 21 0 249 400 210 105 25 11 - 141 1000 13372 2929
1-5 186 513 138 118 24 22 - 163 1000 767 866-9 86 382 269 184 44 34 - 263 1000 2488 3030-9 222 402 215 117 28 15 - 160 1000 16627 3318
31 0 427 340 156 40 3 34 - 77 1000 580 841-5 40 128 245 364 108 114 - 586 1000 674 736-9 21 92 208 342 119 218 - 679 1000 2708 5560-9 83 134 207 301 100 174 - 575 1000 3961 713
41 X 344 130 451 48 27 - - 75 1000 60 1351 0 377 396 168 51 6 1 - 58 1000 10076 684
1-5 231 415 325 29 - - - 29 1000 1645 1246-9 68 352 374 157 5 44 - 206 1000 707 620-9 340 396 201 54 5 4 - 63 1000 12429 870
41 - 51 0-9 340 395 202 54 5 4 - 63 1000 12490 88311 - 51 0 307 397 191 81 17 8 - 105 1000 24028 3697
1-5 181 372 265 123 30 30 - 182 1000 3147 2966-9 54 246 254 253 74 120 - 447 1000 5903 9210-9 250 367 209 116 28 30 - 173 1000 33078 4914
81 X 35 75 207 287 177 220 - 684 1000 1216 10111 - 81 X 242 357 209 122 33 37 - 191 1000 34294 5015
91 X 6 121 374 308 157 34 - 499 1000 4440 83592 X 561 366 73 - - - - - 1000 86 1593 X 565 181 160 18 76 - - 94 1000 97 7594 X 138 354 283 150 20 54 - 224 1000 382 3995 X 293 531 142 - 34 - - 34 1000 657 4696 X - - - - - - - - - - -97 X 406 399 126 62 5 1 - 68 1000 1569 15599 X - - - - - - - - - - -
91 - 99 X 140 235 288 211 102 24 - 337 1000 7231 116511 - 99 X 224 336 223 137 45 34 - 217 1000 41526 6180
ESTIMATED PERSONS (00) 9320 13941 9261 5694 1882 1425 3 9000 41526 X XSAMPLE PERSONS 1262 2096 1436 804 362 219 1 1385 6180 X X
A - 50

TABLE (12) : PER THOUSAND DISTRIBUTION OF PERSONS OF AGE 15 YEARS AND ABOVE BY GENERAL EDUCATION FOR EACH USUAL ACTIVITY CATEGORY TAKING ALSO INTO CONSIDERATION THE SUBSIDIARY ECONOMIC STATUS OF PERSONS CATEGORISED 'NOT WORKING' AND RELIGION
ALL INDIA CHRISTIANITY RURAL FEMALEUSUAL ACTIVITY GENERAL EDUCATION PERSONS
STATUS INDUSTRY NOT LITE-RATE
LITE-RATE &
UPTO PRI-
MARY
MIDD-LE
SECO-NDARY
HIGH-ER SE-COND-
ARY
GRAD-UATE & AB-OVE
N.R. SECO-NDARY & AB-OVE
ALL ESTI-MATED
(00)
SAM-PLE
(1) (2) (3) (4) (5) (6) (7) (8) (9) (10) (11) (12) (13)11, 12, 21 0 413 339 147 77 18 5 - 100 1000 9790 2306
1-5 105 484 343 53 15 - - 68 1000 1206 846-9 367 313 258 59 3 - - 62 1000 893 1250-9 378 352 176 73 17 4 - 94 1000 11889 2515
31 0 850 17 68 63 - 2 - 64 1000 310 191-5 - 125 313 492 70 - - 562 1000 106 106-9 45 85 127 393 114 236 - 743 1000 1469 2040-9 175 76 128 344 93 184 - 621 1000 1886 233
41 X 1000 - - - - - - - 1000 6 351 0 713 207 76 3 - - - 3 1000 6786 412
1-5 576 262 106 26 30 - - 57 1000 603 316-9 227 446 32 296 - - - 296 1000 193 290-9 690 217 77 13 2 - - 15 1000 7582 472
41 - 51 0-9 690 217 77 13 2 - - 15 1000 7588 47511 - 51 0 542 280 117 47 10 3 - 61 1000 16887 2737
1-5 250 393 266 69 23 - - 92 1000 1920 1286-9 171 192 166 269 67 136 - 471 1000 2556 3580-9 471 280 136 76 18 19 - 113 1000 21362 3223
81 X - 46 235 321 260 138 - 719 1000 987 7411 - 81 X 450 269 141 87 29 24 - 139 1000 22349 3297
91 X 1 100 371 333 163 32 - 527 1000 3564 63392 X 257 351 205 136 43 8 - 187 1000 9294 98193 X 371 341 181 92 11 4 - 107 1000 4299 75594 X 355 272 251 122 - - - 122 1000 270 2295 X 260 527 177 37 - - - 37 1000 505 3696 X - - - - - - - - - - -97 X 540 390 47 21 1 1 - 23 1000 1701 17899 X - - - - - - - - - - -
91 - 99 X 261 310 216 150 52 11 - 213 1000 19633 260511 - 99 X 362 288 176 116 40 18 - 174 1000 41982 5902
ESTIMATED PERSONS (00) 15192 12105 7394 4872 1670 746 2 7289 41982 X XSAMPLE PERSONS 1955 1912 1112 592 225 105 1 922 5902 X X
A - 51

TABLE (12) : PER THOUSAND DISTRIBUTION OF PERSONS OF AGE 15 YEARS AND ABOVE BY GENERAL EDUCATION FOR EACH USUAL ACTIVITY CATEGORY TAKING ALSO INTO CONSIDERATION THE SUBSIDIARY ECONOMIC STATUS OF PERSONS CATEGORISED 'NOT WORKING' AND RELIGION
ALL INDIA CHRISTIANITY RURAL PERSONUSUAL ACTIVITY GENERAL EDUCATION PERSONS
STATUS INDUSTRY NOT LITE-RATE
LITE-RATE &
UPTO PRI-
MARY
MIDD-LE
SECO-NDARY
HIGH-ER SE-COND-
ARY
GRAD-UATE & AB-OVE
N.R. SECO-NDARY & AB-OVE
ALL ESTI-MATED
(00)
SAM-PLE
(1) (2) (3) (4) (5) (6) (7) (8) (9) (10) (11) (12) (13)11, 12, 21 0 318 374 183 93 22 9 - 124 1000 23163 5236
1-5 136 495 263 78 19 8 - 105 1000 1973 1706-9 160 364 266 151 33 25 - 210 1000 3382 4290-9 287 381 199 99 23 11 - 133 1000 28518 5835
31 0 574 227 126 48 2 23 - 73 1000 890 1031-5 35 128 255 382 103 98 - 583 1000 780 836-9 29 90 180 360 117 225 - 702 1000 4177 7600-9 113 116 182 315 98 177 - 590 1000 5847 946
41 X 400 119 413 44 24 - - 69 1000 66 1651 0 512 320 131 32 4 1 - 36 1000 16863 1096
1-5 323 374 266 29 8 - - 37 1000 2248 1556-9 102 372 301 187 4 35 - 225 1000 900 910-9 473 328 154 39 4 2 - 45 1000 20012 1342
41 - 51 0-9 472 328 155 39 4 2 - 45 1000 20078 135811 - 51 0 404 349 161 67 14 6 - 87 1000 40916 6435
1-5 207 380 265 102 27 18 - 148 1000 5067 4246-9 89 229 227 258 72 125 - 454 1000 8460 12800-9 337 333 181 100 24 25 - 150 1000 54443 8139
81 X 19 62 220 303 214 183 - 699 1000 2203 17511 - 81 X 324 322 182 108 32 32 - 171 1000 56646 8314
91 X 4 112 373 319 160 33 - 511 1000 8005 146892 X 259 351 204 135 42 8 - 186 1000 9380 99693 X 375 338 180 90 12 4 - 107 1000 4397 83194 X 228 320 270 138 12 32 - 182 1000 652 6195 X 279 529 157 16 19 - - 35 1000 1162 8296 X - - - - - - - - - - -97 X 476 394 85 41 3 1 - 45 1000 3270 33399 X - - - - - - - - - - -
91 - 99 X 229 290 236 166 66 14 - 246 1000 26866 377111 - 99 X 294 312 199 127 43 26 - 195 1000 83511 12085
ESTIMATED PERSONS (00) 24512 26048 16655 10566 3552 2172 6 16290 83511 X XSAMPLE PERSONS 3217 4009 2548 1396 587 325 3 2308 12085 X X
A - 52

TABLE (12) : PER THOUSAND DISTRIBUTION OF PERSONS OF AGE 15 YEARS AND ABOVE BY GENERAL EDUCATION FOR EACH USUAL ACTIVITY CATEGORY TAKING ALSO INTO CONSIDERATION THE SUBSIDIARY ECONOMIC STATUS OF PERSONS CATEGORISED 'NOT WORKING' AND RELIGION
ALL INDIA SIKHISM RURAL MALEUSUAL ACTIVITY GENERAL EDUCATION PERSONS
STATUS INDUSTRY NOT LITE-RATE
LITE-RATE &
UPTO PRI-
MARY
MIDD-LE
SECO-NDARY
HIGH-ER SE-COND-
ARY
GRAD-UATE & AB-OVE
N.R. SECO-NDARY & AB-OVE
ALL ESTI-MATED
(00)
SAM-PLE
(1) (2) (3) (4) (5) (6) (7) (8) (9) (10) (11) (12) (13)11, 12, 21 0 396 239 146 166 30 23 - 219 1000 16436 1633
1-5 369 277 125 168 19 40 3 226 1000 1291 876-9 277 324 141 195 31 32 - 258 1000 2210 1420-9 381 251 144 169 29 25 - 224 1000 19937 1862
31 0 805 84 82 30 - - - 30 1000 770 721-5 208 184 241 256 84 28 - 367 1000 730 546-9 58 173 163 322 106 177 - 606 1000 1879 1700-9 261 155 161 241 77 105 - 423 1000 3379 296
41 X - 1000 - - - - - - 1000 3 151 0 722 173 66 36 4 - - 40 1000 7568 515
1-5 539 311 56 94 - - - 94 1000 862 516-9 516 217 178 88 - - - 88 1000 296 210-9 697 188 69 44 3 - - 47 1000 8726 587
41 - 51 0-9 696 188 69 44 3 - - 47 1000 8729 58811 - 51 0 508 214 120 122 21 16 - 159 1000 24774 2220
1-5 379 264 133 168 30 25 1 222 1000 2886 1936-9 199 252 153 243 61 92 - 396 1000 4385 3330-9 454 223 126 143 27 27 - 197 1000 32045 2746
81 X - 123 309 365 80 123 - 567 1000 235 1911 - 81 X 451 223 127 144 28 28 - 199 1000 32280 2765
91 X 9 209 443 222 113 6 - 340 1000 2773 25592 X 1000 - - - - - - - 1000 3 193 X 1000 - - - - - - - 1000 119 794 X 511 184 117 134 - 54 - 189 1000 408 3495 X 797 115 28 28 - 32 - 60 1000 495 2796 X - - - - - - - - - - -97 X 819 99 15 44 - 23 - 67 1000 1808 15799 X - - - - - - - - - - -
91 - 99 X 398 159 235 136 56 17 - 209 1000 5606 48111 - 99 X 443 213 143 143 32 26 - 201 1000 37886 3246
ESTIMATED PERSONS (00) 16780 8079 5413 5424 1203 984 4 7611 37886 X XSAMPLE PERSONS 1303 687 491 514 152 98 1 764 3246 X X
A - 53

TABLE (12) : PER THOUSAND DISTRIBUTION OF PERSONS OF AGE 15 YEARS AND ABOVE BY GENERAL EDUCATION FOR EACH USUAL ACTIVITY CATEGORY TAKING ALSO INTO CONSIDERATION THE SUBSIDIARY ECONOMIC STATUS OF PERSONS CATEGORISED 'NOT WORKING' AND RELIGION
ALL INDIA SIKHISM RURAL FEMALEUSUAL ACTIVITY GENERAL EDUCATION PERSONS
STATUS INDUSTRY NOT LITE-RATE
LITE-RATE &
UPTO PRI-
MARY
MIDD-LE
SECO-NDARY
HIGH-ER SE-COND-
ARY
GRAD-UATE & AB-OVE
N.R. SECO-NDARY & AB-OVE
ALL ESTI-MATED
(00)
SAM-PLE
(1) (2) (3) (4) (5) (6) (7) (8) (9) (10) (11) (12) (13)11, 12, 21 0 607 228 67 79 10 8 - 97 1000 10426 916
1-5 565 - 289 146 - - - 146 1000 38 56-9 650 79 - 183 88 - - 270 1000 176 100-9 608 225 67 81 11 8 - 100 1000 10640 931
31 0 1000 - - - - - - - 1000 40 21-5 - - - - - - - - - - -6-9 72 14 - 382 163 370 - 915 1000 171 240-9 247 11 - 310 132 300 - 742 1000 211 26
41 X 1000 - - - - - - - 1000 2 151 0 910 76 14 - - - - - 1000 1300 84
1-5 1000 - - - - - - - 1000 33 16-9 1000 - - - - - - - 1000 62 40-9 917 71 13 - - - - - 1000 1395 89
41 - 51 0-9 917 71 13 - - - - - 1000 1398 9011 - 51 0 642 210 61 70 9 8 - 86 1000 11766 1002
1-5 776 - 149 75 - - - 75 1000 74 76-9 461 40 - 239 106 155 - 500 1000 409 380-9 637 203 60 76 12 12 - 100 1000 12249 1047
81 X - - 12 509 377 102 - 988 1000 84 1611 - 81 X 633 202 59 79 14 13 - 106 1000 12332 1063
91 X 15 174 346 261 175 22 8 457 1000 1405 14792 X 654 198 57 72 15 3 - 91 1000 5017 36593 X 596 212 83 90 11 7 1 108 1000 14673 128894 X 809 191 - - - - - - 1000 183 1495 X 848 - 152 - - - - - 1000 322 2496 X - - - - - - - - - - -97 X 957 19 24 1 - - - 1 1000 1306 11999 X - - - - - - - - - - -
91 - 99 X 599 193 90 89 21 6 1 117 1000 22907 195711 - 99 X 611 196 80 86 19 9 1 113 1000 35239 3020
ESTIMATED PERSONS (00) 21519 6905 2803 3020 663 307 21 3990 35239 X XSAMPLE PERSONS 1712 598 277 318 86 27 2 431 3020 X X
A - 54

TABLE (12) : PER THOUSAND DISTRIBUTION OF PERSONS OF AGE 15 YEARS AND ABOVE BY GENERAL EDUCATION FOR EACH USUAL ACTIVITY CATEGORY TAKING ALSO INTO CONSIDERATION THE SUBSIDIARY ECONOMIC STATUS OF PERSONS CATEGORISED 'NOT WORKING' AND RELIGION
ALL INDIA SIKHISM RURAL PERSONUSUAL ACTIVITY GENERAL EDUCATION PERSONS
STATUS INDUSTRY NOT LITE-RATE
LITE-RATE &
UPTO PRI-
MARY
MIDD-LE
SECO-NDARY
HIGH-ER SE-COND-
ARY
GRAD-UATE & AB-OVE
N.R. SECO-NDARY & AB-OVE
ALL ESTI-MATED
(00)
SAM-PLE
(1) (2) (3) (4) (5) (6) (7) (8) (9) (10) (11) (12) (13)11, 12, 21 0 478 234 116 132 22 18 - 172 1000 26861 2549
1-5 375 269 129 168 18 38 3 224 1000 1329 926-9 304 306 130 194 35 30 - 259 1000 2386 1520-9 460 242 117 139 23 19 - 181 1000 30576 2793
31 0 814 80 78 28 - - - 28 1000 810 741-5 208 184 241 256 84 28 - 367 1000 730 546-9 59 160 149 327 111 193 - 631 1000 2051 1940-9 260 147 152 245 80 116 - 442 1000 3591 322
41 X 459 541 - - - - - - 1000 5 251 0 749 158 58 31 3 - - 34 1000 8869 599
1-5 556 300 54 91 - - - 91 1000 895 526-9 600 180 147 73 - - - 73 1000 358 250-9 727 172 61 38 3 - - 40 1000 10121 676
41 - 51 0-9 727 172 61 38 3 - - 40 1000 10127 67811 - 51 0 551 213 101 105 17 13 - 135 1000 36540 3222
1-5 388 258 134 166 29 24 1 219 1000 2960 2006-9 222 234 140 242 65 98 - 405 1000 4794 3710-9 505 218 107 124 23 23 - 170 1000 44294 3793
81 X - 91 231 403 158 117 - 678 1000 319 3511 - 81 X 501 217 108 126 24 24 - 174 1000 44613 3828
91 X 11 197 410 235 134 11 3 380 1000 4178 40292 X 654 198 57 72 15 3 - 91 1000 5020 36693 X 599 211 82 89 11 7 1 107 1000 14792 129594 X 603 186 81 93 - 37 - 130 1000 591 4895 X 817 70 77 17 - 19 - 36 1000 817 5196 X - - - - - - - - - - -97 X 877 65 19 26 - 13 - 39 1000 3114 27699 X - - - - - - - - - - -
91 - 99 X 559 186 119 99 28 8 1 135 1000 28513 243811 - 99 X 524 205 112 115 26 18 - 159 1000 73125 6266
ESTIMATED PERSONS (00) 38299 14984 8216 8444 1866 1291 25 11601 73125 X XSAMPLE PERSONS 3015 1285 768 832 238 125 3 1195 6266 X X
A - 55

TABLE (12) : PER THOUSAND DISTRIBUTION OF PERSONS OF AGE 15 YEARS AND ABOVE BY GENERAL EDUCATION FOR EACH USUAL ACTIVITY CATEGORY TAKING ALSO INTO CONSIDERATION THE SUBSIDIARY ECONOMIC STATUS OF PERSONS CATEGORISED 'NOT WORKING' AND RELIGION
ALL INDIA JAINISM RURAL MALEUSUAL ACTIVITY GENERAL EDUCATION PERSONS
STATUS INDUSTRY NOT LITE-RATE
LITE-RATE &
UPTO PRI-
MARY
MIDD-LE
SECO-NDARY
HIGH-ER SE-COND-
ARY
GRAD-UATE & AB-OVE
N.R. SECO-NDARY & AB-OVE
ALL ESTI-MATED
(00)
SAM-PLE
(1) (2) (3) (4) (5) (6) (7) (8) (9) (10) (11) (12) (13)11, 12, 21 0 132 403 137 187 67 75 - 328 1000 463 38
1-5 295 164 - 335 206 - - 541 1000 78 96-9 24 280 477 67 58 95 - 219 1000 416 420-9 98 330 274 147 74 77 - 298 1000 957 89
31 0 - - - - - - - - - - -1-5 - - - 1000 - - - 1000 1000 23 16-9 - 15 - 626 - 359 - 985 1000 102 90-9 - 13 - 695 - 292 - 987 1000 125 10
41 X - - - - - - - - - - -51 0 665 147 62 126 - - - 126 1000 389 14
1-5 - - 1000 - - - - - 1000 21 16-9 - - - - - - - - - - -0-9 630 139 111 119 - - - 119 1000 411 15
41 - 51 0-9 630 139 111 119 - - - 119 1000 411 1511 - 51 0 375 286 103 159 36 41 - 236 1000 852 52
1-5 188 104 174 403 131 - - 534 1000 122 116-9 19 228 383 177 46 147 - 370 1000 519 510-9 236 251 206 185 47 74 - 307 1000 1493 114
81 X - - - - - 1000 - 1000 1000 8 111 - 81 X 235 250 205 184 47 79 - 310 1000 1501 115
91 X - - 312 230 301 121 35 653 1000 200 1492 X - - - - - - - - - - -93 X - - - - - - - - - - -94 X - 1000 - - - - - - 1000 21 195 X - 1000 - - - - - - 1000 16 196 X - - - - - - - - - - -97 X 477 523 - - - - - - 1000 54 399 X - - - - - - - - - - -
91 - 99 X 88 225 215 158 207 83 24 449 1000 292 1911 - 99 X 211 246 207 180 73 80 4 333 1000 1793 134
ESTIMATED PERSONS (00) 378 440 370 323 131 143 7 597 1793 X XSAMPLE PERSONS 17 32 29 27 14 14 1 55 134 X X
A - 56

TABLE (12) : PER THOUSAND DISTRIBUTION OF PERSONS OF AGE 15 YEARS AND ABOVE BY GENERAL EDUCATION FOR EACH USUAL ACTIVITY CATEGORY TAKING ALSO INTO CONSIDERATION THE SUBSIDIARY ECONOMIC STATUS OF PERSONS CATEGORISED 'NOT WORKING' AND RELIGION
ALL INDIA JAINISM RURAL FEMALEUSUAL ACTIVITY GENERAL EDUCATION PERSONS
STATUS INDUSTRY NOT LITE-RATE
LITE-RATE &
UPTO PRI-
MARY
MIDD-LE
SECO-NDARY
HIGH-ER SE-COND-
ARY
GRAD-UATE & AB-OVE
N.R. SECO-NDARY & AB-OVE
ALL ESTI-MATED
(00)
SAM-PLE
(1) (2) (3) (4) (5) (6) (7) (8) (9) (10) (11) (12) (13)11, 12, 21 0 315 515 71 99 - - - 99 1000 328 23
1-5 - - - 1000 - - - 1000 1000 6 16-9 - 601 117 283 - - - 283 1000 62 90-9 261 521 77 142 - - - 142 1000 396 33
31 0 - - - - - - - - - - -1-5 - - - - - - - - - - -6-9 - - - - - - - - - - -0-9 - - - - - - - - - - -
41 X - - - - - - - - - - -51 0 1000 - - - - - - - 1000 297 11
1-5 - 1000 - - - - - - 1000 18 16-9 - - - - - - - - - - -0-9 943 57 - - - - - - 1000 315 12
41 - 51 0-9 943 57 - - - - - - 1000 315 1211 - 51 0 640 271 37 52 - - - 52 1000 625 34
1-5 - 747 - 253 - - - 253 1000 24 26-9 - 601 117 283 - - - 283 1000 62 90-9 563 315 43 79 - - - 79 1000 710 45
81 X - - - - - 1000 - 1000 1000 3 211 - 81 X 561 314 43 79 - 4 - 82 1000 713 47
91 X - 124 554 199 124 - - 323 1000 81 992 X 264 337 133 196 40 30 - 266 1000 572 5093 X - 221 527 - 77 174 - 251 1000 95 994 X 1000 - - - - - - - 1000 46 295 X - - - - - - - - - - -96 X - - - - - - - - - - -97 X 606 149 - 245 - - - 245 1000 188 1499 X - - - - - - - - - - -
91 - 99 X 317 256 174 178 41 34 - 253 1000 982 8411 - 99 X 419 281 119 136 24 21 - 181 1000 1695 131
ESTIMATED PERSONS (00) 711 476 201 231 40 36 - 307 1695 X XSAMPLE PERSONS 36 41 18 22 5 9 - 36 131 X X
A - 57

TABLE (12) : PER THOUSAND DISTRIBUTION OF PERSONS OF AGE 15 YEARS AND ABOVE BY GENERAL EDUCATION FOR EACH USUAL ACTIVITY CATEGORY TAKING ALSO INTO CONSIDERATION THE SUBSIDIARY ECONOMIC STATUS OF PERSONS CATEGORISED 'NOT WORKING' AND RELIGION
ALL INDIA JAINISM RURAL PERSONUSUAL ACTIVITY GENERAL EDUCATION PERSONS
STATUS INDUSTRY NOT LITE-RATE
LITE-RATE &
UPTO PRI-
MARY
MIDD-LE
SECO-NDARY
HIGH-ER SE-COND-
ARY
GRAD-UATE & AB-OVE
N.R. SECO-NDARY & AB-OVE
ALL ESTI-MATED
(00)
SAM-PLE
(1) (2) (3) (4) (5) (6) (7) (8) (9) (10) (11) (12) (13)11, 12, 21 0 208 449 110 151 39 44 - 233 1000 791 61
1-5 273 152 - 384 191 - - 574 1000 84 106-9 21 321 431 94 50 83 - 227 1000 478 510-9 146 385 216 145 52 55 - 252 1000 1353 122
31 0 - - - - - - - - - - -1-5 - - - 1000 - - - 1000 1000 23 16-9 - 15 - 626 - 359 - 985 1000 102 90-9 - 13 - 695 - 292 - 987 1000 125 10
41 X - - - - - - - - - - -51 0 810 83 35 71 - - - 71 1000 686 25
1-5 - 458 542 - - - - - 1000 39 26-9 - - - - - - - - - - -0-9 766 104 63 68 - - - 68 1000 725 27
41 - 51 0-9 766 104 63 68 - - - 68 1000 725 2711 - 51 0 487 279 75 114 21 23 - 158 1000 1477 86
1-5 157 210 145 379 109 - - 488 1000 146 136-9 17 267 355 188 41 131 - 361 1000 580 600-9 342 272 153 151 32 50 - 233 1000 2203 159
81 X - - - - - 1000 - 1000 1000 10 311 - 81 X 340 270 153 150 32 55 - 237 1000 2214 162
91 X - 36 382 221 250 86 25 558 1000 282 2392 X 264 337 133 196 40 30 - 266 1000 572 5093 X - 221 527 - 77 174 - 251 1000 95 994 X 682 318 - - - - - - 1000 67 395 X - 1000 - - - - - - 1000 16 196 X - - - - - - - - - - -97 X 577 233 - 190 - - - 190 1000 242 1799 X - - - - - - - - - - -
91 - 99 X 264 249 183 173 79 45 5 298 1000 1273 10311 - 99 X 312 263 164 159 49 51 2 259 1000 3487 265
ESTIMATED PERSONS (00) 1089 916 572 553 171 179 7 904 3487 X XSAMPLE PERSONS 53 73 47 49 19 23 1 91 265 X X
A - 58

TABLE (12) : PER THOUSAND DISTRIBUTION OF PERSONS OF AGE 15 YEARS AND ABOVE BY GENERAL EDUCATION FOR EACH USUAL ACTIVITY CATEGORY TAKING ALSO INTO CONSIDERATION THE SUBSIDIARY ECONOMIC STATUS OF PERSONS CATEGORISED 'NOT WORKING' AND RELIGION
ALL INDIA BUDDHISM RURAL MALEUSUAL ACTIVITY GENERAL EDUCATION PERSONS
STATUS INDUSTRY NOT LITE-RATE
LITE-RATE &
UPTO PRI-
MARY
MIDD-LE
SECO-NDARY
HIGH-ER SE-COND-
ARY
GRAD-UATE & AB-OVE
N.R. SECO-NDARY & AB-OVE
ALL ESTI-MATED
(00)
SAM-PLE
(1) (2) (3) (4) (5) (6) (7) (8) (9) (10) (11) (12) (13)11, 12, 21 0 489 296 78 63 66 7 - 136 1000 1748 431
1-5 273 349 214 43 34 87 - 164 1000 211 216-9 176 213 303 174 87 47 - 308 1000 401 440-9 416 287 129 80 67 21 - 168 1000 2360 496
31 0 620 148 105 - - 127 - 127 1000 197 91-5 147 533 231 11 79 - - 90 1000 281 166-9 1 280 227 218 199 75 - 493 1000 863 810-9 123 313 210 143 145 67 - 354 1000 1341 106
41 X 912 74 15 - - - - - 1000 78 851 0 462 293 153 83 10 - - 93 1000 4842 217
1-5 270 367 197 166 - - - 166 1000 594 296-9 446 382 172 - - - - - 1000 161 190-9 441 303 158 89 9 - - 98 1000 5598 265
41 - 51 0-9 448 300 156 88 9 - - 96 1000 5676 27311 - 51 0 474 289 132 75 24 5 - 105 1000 6787 657
1-5 284 384 196 95 25 16 - 136 1000 1164 746-9 100 273 242 181 145 59 - 385 1000 1425 1440-9 393 299 157 94 43 15 - 151 1000 9376 875
81 X - 169 365 152 309 6 - 466 1000 180 1411 - 81 X 386 296 161 95 48 15 - 157 1000 9556 889
91 X - 96 439 298 147 20 - 464 1000 1079 10392 X 997 3 - - - - - - 1000 27 293 X 1000 - - - - - - - 1000 9 594 X 41 24 935 - - - - - 1000 26 395 X 513 361 - 126 - - - 126 1000 186 1296 X - 1000 - - - - - - 1000 32 197 X 783 150 67 - - - - - 1000 374 3099 X - - - - - - - - - - -
91 - 99 X 245 150 302 199 91 12 - 303 1000 1732 15611 - 99 X 364 274 182 111 54 14 - 180 1000 11289 1045
ESTIMATED PERSONS (00) 4113 3090 2059 1252 614 162 - 2027 11289 X XSAMPLE PERSONS 407 306 153 110 49 20 - 179 1045 X X
A - 59

TABLE (12) : PER THOUSAND DISTRIBUTION OF PERSONS OF AGE 15 YEARS AND ABOVE BY GENERAL EDUCATION FOR EACH USUAL ACTIVITY CATEGORY TAKING ALSO INTO CONSIDERATION THE SUBSIDIARY ECONOMIC STATUS OF PERSONS CATEGORISED 'NOT WORKING' AND RELIGION
ALL INDIA BUDDHISM RURAL FEMALEUSUAL ACTIVITY GENERAL EDUCATION PERSONS
STATUS INDUSTRY NOT LITE-RATE
LITE-RATE &
UPTO PRI-
MARY
MIDD-LE
SECO-NDARY
HIGH-ER SE-COND-
ARY
GRAD-UATE & AB-OVE
N.R. SECO-NDARY & AB-OVE
ALL ESTI-MATED
(00)
SAM-PLE
(1) (2) (3) (4) (5) (6) (7) (8) (9) (10) (11) (12) (13)11, 12, 21 0 648 205 104 43 - - - 43 1000 1277 228
1-5 572 115 181 132 - - - 132 1000 190 126-9 700 77 52 4 167 - - 171 1000 122 150-9 643 185 109 51 13 - - 63 1000 1590 255
31 0 1000 - - - - - - - 1000 24 11-5 562 - 438 - - - - - 1000 147 56-9 157 219 214 166 130 114 - 410 1000 307 230-9 324 140 273 106 84 73 - 263 1000 478 29
41 X 1000 - - - - - - - 1000 25 251 0 746 155 76 23 - - - 23 1000 5640 225
1-5 411 228 361 - - - - - 1000 330 156-9 583 50 367 - - - - - 1000 70 60-9 726 158 95 21 - - - 21 1000 6040 246
41 - 51 0-9 727 157 95 21 - - - 21 1000 6065 24811 - 51 0 729 164 81 26 - - - 26 1000 6940 454
1-5 509 140 315 36 - - - 36 1000 693 346-9 349 161 196 103 121 70 - 294 1000 498 440-9 687 162 108 32 7 4 - 44 1000 8132 532
81 X - - 849 132 19 - - 151 1000 16 311 - 81 X 685 161 109 32 7 4 - 44 1000 8148 535
91 X - 154 361 399 77 10 - 486 1000 406 5392 X 517 223 207 50 2 - - 53 1000 1463 18493 X 648 182 165 5 - - - 5 1000 690 15094 X 1000 - - - - - - - 1000 24 195 X 1000 - - - - - - - 1000 230 1396 X - - - - - - - - - - -97 X 993 7 - - - - - - 1000 574 4299 X - - - - - - - - - - -
91 - 99 X 598 153 167 70 10 1 - 82 1000 3387 44311 - 99 X 660 159 126 43 8 3 - 55 1000 11535 978
ESTIMATED PERSONS (00) 7611 1834 1455 501 95 40 - 636 11535 X XSAMPLE PERSONS 633 175 103 50 12 5 - 67 978 X X
A - 60

TABLE (12) : PER THOUSAND DISTRIBUTION OF PERSONS OF AGE 15 YEARS AND ABOVE BY GENERAL EDUCATION FOR EACH USUAL ACTIVITY CATEGORY TAKING ALSO INTO CONSIDERATION THE SUBSIDIARY ECONOMIC STATUS OF PERSONS CATEGORISED 'NOT WORKING' AND RELIGION
ALL INDIA BUDDHISM RURAL PERSONUSUAL ACTIVITY GENERAL EDUCATION PERSONS
STATUS INDUSTRY NOT LITE-RATE
LITE-RATE &
UPTO PRI-
MARY
MIDD-LE
SECO-NDARY
HIGH-ER SE-COND-
ARY
GRAD-UATE & AB-OVE
N.R. SECO-NDARY & AB-OVE
ALL ESTI-MATED
(00)
SAM-PLE
(1) (2) (3) (4) (5) (6) (7) (8) (9) (10) (11) (12) (13)11, 12, 21 0 556 258 89 55 38 4 - 97 1000 3025 659
1-5 415 238 198 85 18 46 - 149 1000 401 336-9 298 181 244 135 106 36 - 276 1000 523 590-9 508 246 121 68 45 12 - 126 1000 3949 751
31 0 661 132 94 - - 114 - 114 1000 221 101-5 290 349 302 7 52 - - 59 1000 428 216-9 42 264 223 205 181 85 - 471 1000 1169 1040-9 175 268 226 133 129 69 - 331 1000 1818 135
41 X 933 56 11 - - - - - 1000 103 1051 0 615 219 112 50 5 - - 55 1000 10482 442
1-5 321 317 256 107 - - - 107 1000 924 446-9 487 282 230 - - - - - 1000 231 250-9 589 228 125 54 4 - - 58 1000 11637 511
41 - 51 0-9 592 226 124 53 4 - - 58 1000 11741 52111 - 51 0 603 226 106 51 12 3 - 65 1000 13727 1111
1-5 368 293 240 73 16 10 - 99 1000 1857 1086-9 165 244 230 161 139 62 - 362 1000 1924 1880-9 530 235 134 65 26 10 - 101 1000 17508 1407
81 X - 155 405 150 285 5 - 440 1000 196 1711 - 81 X 524 234 137 66 29 10 - 105 1000 17705 1424
91 X - 112 417 326 128 17 - 470 1000 1485 15692 X 525 219 204 49 2 - - 52 1000 1490 18693 X 652 180 163 5 - - - 5 1000 699 15594 X 508 12 480 - - - - - 1000 50 495 X 782 161 - 56 - - - 56 1000 415 2596 X - 1000 - - - - - - 1000 32 197 X 910 64 27 - - - - - 1000 948 7299 X - - - - - - - - - - -
91 - 99 X 479 152 212 114 38 5 - 157 1000 5119 59911 - 99 X 514 216 154 77 31 9 - 117 1000 22824 2023
ESTIMATED PERSONS (00) 11723 4924 3514 1752 709 201 - 2663 22824 X XSAMPLE PERSONS 1040 481 256 160 61 25 - 246 2023 X X
A - 61

TABLE (12) : PER THOUSAND DISTRIBUTION OF PERSONS OF AGE 15 YEARS AND ABOVE BY GENERAL EDUCATION FOR EACH USUAL ACTIVITY CATEGORY TAKING ALSO INTO CONSIDERATION THE SUBSIDIARY ECONOMIC STATUS OF PERSONS CATEGORISED 'NOT WORKING' AND RELIGION
ALL INDIA ZOROASTRIANISM RURAL MALEUSUAL ACTIVITY GENERAL EDUCATION PERSONS
STATUS INDUSTRY NOT LITE-RATE
LITE-RATE &
UPTO PRI-
MARY
MIDD-LE
SECO-NDARY
HIGH-ER SE-COND-
ARY
GRAD-UATE & AB-OVE
N.R. SECO-NDARY & AB-OVE
ALL ESTI-MATED
(00)
SAM-PLE
(1) (2) (3) (4) (5) (6) (7) (8) (9) (10) (11) (12) (13)11, 12, 21 0 997 - - - - 3 - 3 1000 20 2
1-5 - - - - - - - - - - -6-9 500 - - - 500 - - 500 1000 - 20-9 994 - - - 3 3 - 6 1000 21 4
31 0 - - - - - - - - - - -1-5 - - - - - - - - - - -6-9 - - - - - - - - - - -0-9 - - - - - - - - - - -
41 X - - - - - - - - - - -51 0 - - - - - - - - - - -
1-5 - - - - - - - - - - -6-9 - - - - - - - - - - -0-9 - - - - - - - - - - -
41 - 51 0-9 - - - - - - - - - - -11 - 51 0 997 - - - - 3 - 3 1000 20 2
1-5 - - - - - - - - - - -6-9 500 - - - 500 - - 500 1000 - 20-9 994 - - - 3 3 - 6 1000 21 4
81 X - - - - - - - - - - -11 - 81 X 994 - - - 3 3 - 6 1000 21 4
91 X - - - - - - - - - - -92 X - - - - - - - - - - -93 X - - - - - - - - - - -94 X - - - - - - - - - - -95 X - - - - - - - - - - -96 X - - - - - - - - - - -97 X - - - - - - - - - - -99 X - - - - - - - - - - -
91 - 99 X - - - - - - - - - - -11 - 99 X 994 - - - 3 3 - 6 1000 21 4
ESTIMATED PERSONS (00) 20 - - - - - - - 21 X XSAMPLE PERSONS 2 - - - 1 1 - 2 4 X X
A - 62

TABLE (12) : PER THOUSAND DISTRIBUTION OF PERSONS OF AGE 15 YEARS AND ABOVE BY GENERAL EDUCATION FOR EACH USUAL ACTIVITY CATEGORY TAKING ALSO INTO CONSIDERATION THE SUBSIDIARY ECONOMIC STATUS OF PERSONS CATEGORISED 'NOT WORKING' AND RELIGION
ALL INDIA ZOROASTRIANISM RURAL FEMALEUSUAL ACTIVITY GENERAL EDUCATION PERSONS
STATUS INDUSTRY NOT LITE-RATE
LITE-RATE &
UPTO PRI-
MARY
MIDD-LE
SECO-NDARY
HIGH-ER SE-COND-
ARY
GRAD-UATE & AB-OVE
N.R. SECO-NDARY & AB-OVE
ALL ESTI-MATED
(00)
SAM-PLE
(1) (2) (3) (4) (5) (6) (7) (8) (9) (10) (11) (12) (13)11, 12, 21 0 1000 - - - - - - - 1000 - 1
1-5 - - - - - - - - - - -6-9 - - - - - - - - - - -0-9 1000 - - - - - - - 1000 - 1
31 0 - - - - - - - - - - -1-5 - - - - - - - - - - -6-9 - - - - - - - - - - -0-9 - - - - - - - - - - -
41 X - - - - - - - - - - -51 0 - - - - - - - - - - -
1-5 - - - - - - - - - - -6-9 - - - - - - - - - - -0-9 - - - - - - - - - - -
41 - 51 0-9 - - - - - - - - - - -11 - 51 0 1000 - - - - - - - 1000 - 1
1-5 - - - - - - - - - - -6-9 - - - - - - - - - - -0-9 1000 - - - - - - - 1000 - 1
81 X - - - - - - - - - - -11 - 81 X 1000 - - - - - - - 1000 - 1
91 X - - - - 1000 - - 1000 1000 - 192 X - - - - 1000 - - 1000 1000 - 193 X - - - - - - - - - - -94 X - - - - - - - - - - -95 X - - - - - - - - - - -96 X - - - - - - - - - - -97 X - 1000 - - - - - - 1000 - 199 X - - - - - - - - - - -
91 - 99 X - 333 - - 667 - - 667 1000 - 311 - 99 X 250 250 - - 500 - - 500 1000 - 4
ESTIMATED PERSONS (00) - - - - - - - - - X XSAMPLE PERSONS 1 1 - - 2 - - 2 4 X X
A - 63

TABLE (12) : PER THOUSAND DISTRIBUTION OF PERSONS OF AGE 15 YEARS AND ABOVE BY GENERAL EDUCATION FOR EACH USUAL ACTIVITY CATEGORY TAKING ALSO INTO CONSIDERATION THE SUBSIDIARY ECONOMIC STATUS OF PERSONS CATEGORISED 'NOT WORKING' AND RELIGION
ALL INDIA ZOROASTRIANISM RURAL PERSONUSUAL ACTIVITY GENERAL EDUCATION PERSONS
STATUS INDUSTRY NOT LITE-RATE
LITE-RATE &
UPTO PRI-
MARY
MIDD-LE
SECO-NDARY
HIGH-ER SE-COND-
ARY
GRAD-UATE & AB-OVE
N.R. SECO-NDARY & AB-OVE
ALL ESTI-MATED
(00)
SAM-PLE
(1) (2) (3) (4) (5) (6) (7) (8) (9) (10) (11) (12) (13)11, 12, 21 0 997 - - - - 3 - 3 1000 21 3
1-5 - - - - - - - - - - -6-9 500 - - - 500 - - 500 1000 - 20-9 994 - - - 3 3 - 6 1000 21 5
31 0 - - - - - - - - - - -1-5 - - - - - - - - - - -6-9 - - - - - - - - - - -0-9 - - - - - - - - - - -
41 X - - - - - - - - - - -51 0 - - - - - - - - - - -
1-5 - - - - - - - - - - -6-9 - - - - - - - - - - -0-9 - - - - - - - - - - -
41 - 51 0-9 - - - - - - - - - - -11 - 51 0 997 - - - - 3 - 3 1000 21 3
1-5 - - - - - - - - - - -6-9 500 - - - 500 - - 500 1000 - 20-9 994 - - - 3 3 - 6 1000 21 5
81 X - - - - - - - - - - -11 - 81 X 994 - - - 3 3 - 6 1000 21 5
91 X - - - - 1000 - - 1000 1000 - 192 X - - - - 1000 - - 1000 1000 - 193 X - - - - - - - - - - -94 X - - - - - - - - - - -95 X - - - - - - - - - - -96 X - - - - - - - - - - -97 X - 1000 - - - - - - 1000 - 199 X - - - - - - - - - - -
91 - 99 X - 333 - - 667 - - 667 1000 - 311 - 99 X 986 3 - - 9 3 - 11 1000 21 8
ESTIMATED PERSONS (00) 21 - - - - - - - 21 X XSAMPLE PERSONS 3 1 - - 3 1 - 4 8 X X
A - 64

TABLE (12) : PER THOUSAND DISTRIBUTION OF PERSONS OF AGE 15 YEARS AND ABOVE BY GENERAL EDUCATION FOR EACH USUAL ACTIVITY CATEGORY TAKING ALSO INTO CONSIDERATION THE SUBSIDIARY ECONOMIC STATUS OF PERSONS CATEGORISED 'NOT WORKING' AND RELIGION
ALL INDIA OTHERS RURAL MALEUSUAL ACTIVITY GENERAL EDUCATION PERSONS
STATUS INDUSTRY NOT LITE-RATE
LITE-RATE &
UPTO PRI-
MARY
MIDD-LE
SECO-NDARY
HIGH-ER SE-COND-
ARY
GRAD-UATE & AB-OVE
N.R. SECO-NDARY & AB-OVE
ALL ESTI-MATED
(00)
SAM-PLE
(1) (2) (3) (4) (5) (6) (7) (8) (9) (10) (11) (12) (13)11, 12, 21 0 509 275 138 55 21 1 1 76 1000 2819 1022
1-5 491 374 119 6 5 6 - 17 1000 316 306-9 304 441 120 129 5 2 - 135 1000 610 510-9 474 310 134 63 17 1 1 81 1000 3745 1103
31 0 781 28 4 60 128 - - 188 1000 55 91-5 280 446 104 78 - 93 - 170 1000 324 156-9 333 290 87 114 23 152 - 290 1000 173 470-9 346 355 89 87 20 102 - 210 1000 552 71
41 X 930 43 27 - - - - - 1000 51 951 0 619 253 110 17 - - - 17 1000 1429 92
1-5 180 244 324 218 33 - - 251 1000 550 236-9 628 73 - 299 - - - 299 1000 109 150-9 504 242 161 84 9 - - 93 1000 2088 130
41 - 51 0-9 514 237 158 82 9 - - 91 1000 2139 13911 - 51 0 549 265 127 42 15 1 1 58 1000 4303 1123
1-5 316 322 202 119 16 26 - 160 1000 1241 776-9 349 367 99 147 8 31 - 185 1000 892 1130-9 477 290 138 71 14 10 1 95 1000 6435 1313
81 X 5 99 411 50 2 433 - 485 1000 98 1111 - 81 X 469 287 142 71 14 16 1 101 1000 6533 1324
91 X 11 189 431 203 158 7 - 369 1000 430 19092 X 286 677 - 22 - 15 - 37 1000 112 3293 X 991 9 - - - - - - 1000 23 1494 X - 719 281 - - - - - 1000 69 395 X 1000 - - - - - - - 1000 11 1096 X - - - - - - - - - - -97 X 701 169 43 84 - 2 - 86 1000 384 2299 X - - - - - - - - - - -
91 - 99 X 331 264 215 119 66 5 - 190 1000 1030 27111 - 99 X 451 284 152 78 21 15 1 113 1000 7563 1595
ESTIMATED PERSONS (00) 3408 2147 1149 586 160 110 4 856 7563 X XSAMPLE PERSONS 942 288 183 98 53 30 1 181 1595 X X
A - 65

TABLE (12) : PER THOUSAND DISTRIBUTION OF PERSONS OF AGE 15 YEARS AND ABOVE BY GENERAL EDUCATION FOR EACH USUAL ACTIVITY CATEGORY TAKING ALSO INTO CONSIDERATION THE SUBSIDIARY ECONOMIC STATUS OF PERSONS CATEGORISED 'NOT WORKING' AND RELIGION
ALL INDIA OTHERS RURAL FEMALEUSUAL ACTIVITY GENERAL EDUCATION PERSONS
STATUS INDUSTRY NOT LITE-RATE
LITE-RATE &
UPTO PRI-
MARY
MIDD-LE
SECO-NDARY
HIGH-ER SE-COND-
ARY
GRAD-UATE & AB-OVE
N.R. SECO-NDARY & AB-OVE
ALL ESTI-MATED
(00)
SAM-PLE
(1) (2) (3) (4) (5) (6) (7) (8) (9) (10) (11) (12) (13)11, 12, 21 0 785 133 69 12 - 1 - 13 1000 2461 869
1-5 824 163 5 4 - 4 - 8 1000 170 146-9 846 56 95 1 - 2 - 3 1000 304 110-9 793 127 68 11 - 1 - 12 1000 2935 894
31 0 - - - 1000 - - - 1000 1000 1 11-5 - - 1000 - - - - - 1000 1 16-9 - - 845 18 16 121 - 155 1000 44 80-9 - - 840 29 16 116 - 160 1000 46 10
41 X - - 1000 - - - - - 1000 2 151 0 828 172 - - - - - - 1000 901 45
1-5 965 35 - - - - - - 1000 79 76-9 950 - - - 50 - - 50 1000 47 60-9 844 154 - - 2 - - 2 1000 1026 58
41 - 51 0-9 842 153 2 - 2 - - 2 1000 1028 5911 - 51 0 796 143 51 9 - - - 10 1000 3363 915
1-5 856 121 17 3 - 3 - 6 1000 253 236-9 763 43 168 2 8 15 - 26 1000 394 250-9 797 132 60 8 1 2 - 11 1000 4010 963
81 X - 476 454 7 33 30 - 70 1000 28 511 - 81 X 791 134 63 8 1 2 - 12 1000 4038 968
91 X 120 226 445 158 40 11 - 209 1000 221 10592 X 652 164 106 69 6 2 - 77 1000 1215 22693 X 800 165 33 1 1 - - 3 1000 1284 17094 X 746 254 - - - - - - 1000 60 495 X 1000 - - - - - - - 1000 84 1696 X - - - - - - - - - - -97 X 891 94 - - 11 4 - 15 1000 211 3099 X - - - - - - - - - - -
91 - 99 X 704 161 88 39 7 2 - 48 1000 3075 55111 - 99 X 753 146 73 22 4 2 - 27 1000 7113 1519
ESTIMATED PERSONS (00) 5358 1038 523 153 26 15 - 194 7113 X XSAMPLE PERSONS 1203 169 77 32 22 16 - 70 1519 X X
A - 66

TABLE (12) : PER THOUSAND DISTRIBUTION OF PERSONS OF AGE 15 YEARS AND ABOVE BY GENERAL EDUCATION FOR EACH USUAL ACTIVITY CATEGORY TAKING ALSO INTO CONSIDERATION THE SUBSIDIARY ECONOMIC STATUS OF PERSONS CATEGORISED 'NOT WORKING' AND RELIGION
ALL INDIA OTHERS RURAL PERSONUSUAL ACTIVITY GENERAL EDUCATION PERSONS
STATUS INDUSTRY NOT LITE-RATE
LITE-RATE &
UPTO PRI-
MARY
MIDD-LE
SECO-NDARY
HIGH-ER SE-COND-
ARY
GRAD-UATE & AB-OVE
N.R. SECO-NDARY & AB-OVE
ALL ESTI-MATED
(00)
SAM-PLE
(1) (2) (3) (4) (5) (6) (7) (8) (9) (10) (11) (12) (13)11, 12, 21 0 638 209 106 35 11 1 1 47 1000 5281 1892
1-5 607 300 79 6 3 5 - 14 1000 486 446-9 484 313 112 86 3 2 - 91 1000 914 620-9 614 230 105 40 10 1 1 51 1000 6680 1998
31 0 773 27 4 69 127 - - 196 1000 55 101-5 279 444 107 77 - 92 - 170 1000 325 166-9 265 231 242 95 22 146 - 262 1000 218 550-9 320 328 147 83 20 103 - 206 1000 598 81
41 X 892 41 67 - - - - - 1000 53 1051 0 700 222 68 10 - - - 10 1000 2330 137
1-5 279 218 283 191 29 - - 220 1000 629 306-9 724 51 - 209 15 - - 224 1000 155 210-9 616 213 108 57 7 - - 63 1000 3114 188
41 - 51 0-9 621 210 107 56 7 - - 62 1000 3167 19811 - 51 0 658 211 94 28 9 1 1 37 1000 7665 2039
1-5 407 288 171 99 13 22 - 134 1000 1493 1006-9 476 268 120 102 8 26 - 136 1000 1286 1380-9 600 229 108 47 9 7 - 63 1000 10445 2277
81 X 4 183 421 40 9 343 - 392 1000 126 1611 - 81 X 592 229 112 47 9 11 - 67 1000 10571 2293
91 X 48 201 436 188 118 8 - 315 1000 651 29592 X 621 207 97 65 6 3 - 74 1000 1327 25893 X 804 162 32 1 1 - - 3 1000 1307 18494 X 346 504 151 - - - - - 1000 129 795 X 1000 - - - - - - - 1000 95 2696 X - - - - - - - - - - -97 X 769 142 28 54 4 3 - 61 1000 595 5299 X - - - - - - - - - - -
91 - 99 X 610 187 120 59 22 3 - 83 1000 4105 82211 - 99 X 597 217 114 50 13 9 - 72 1000 14676 3115
ESTIMATED PERSONS (00) 8766 3185 1671 740 186 125 4 1050 14676 X XSAMPLE PERSONS 2146 457 260 130 75 46 1 251 3115 X X
A - 67

TABLE (12) : PER THOUSAND DISTRIBUTION OF PERSONS OF AGE 15 YEARS AND ABOVE BY GENERAL EDUCATION FOR EACH USUAL ACTIVITY CATEGORY TAKING ALSO INTO CONSIDERATION THE SUBSIDIARY ECONOMIC STATUS OF PERSONS CATEGORISED 'NOT WORKING' AND RELIGION
ALL INDIA ALL RURAL MALEUSUAL ACTIVITY GENERAL EDUCATION PERSONS
STATUS INDUSTRY NOT LITE-RATE
LITE-RATE &
UPTO PRI-
MARY
MIDD-LE
SECO-NDARY
HIGH-ER SE-COND-
ARY
GRAD-UATE & AB-OVE
N.R. SECO-NDARY & AB-OVE
ALL ESTI-MATED
(00)
SAM-PLE
(1) (2) (3) (4) (5) (6) (7) (8) (9) (10) (11) (12) (13)11, 12, 21 0 410 299 155 81 36 19 - 136 1000 720935 49109
1-5 373 362 154 72 26 14 - 112 1000 66907 37456-9 267 343 195 107 48 39 - 194 1000 133730 83620-9 386 310 160 84 37 22 - 143 1000 921572 61216
31 0 620 222 82 43 18 16 - 76 1000 20671 13531-5 194 287 197 193 57 71 - 321 1000 34305 19266-9 81 171 174 226 145 202 - 573 1000 84141 67650-9 189 207 166 191 105 142 - 437 1000 139117 10044
41 X 505 336 123 24 10 1 - 36 1000 5462 44451 0 623 264 79 25 8 2 - 35 1000 445050 20750
1-5 437 357 139 54 12 1 - 66 1000 74718 37556-9 374 350 185 58 25 8 - 91 1000 23113 15030-9 586 280 91 31 9 2 - 42 1000 542881 26008
41 - 51 0-9 586 281 92 30 9 2 - 42 1000 548342 2645211 - 51 0 493 284 125 59 25 13 - 97 1000 1186657 71212
1-5 370 345 155 86 25 19 - 130 1000 181391 98706-9 212 284 187 144 80 93 - 317 1000 240984 166300-9 437 291 137 75 33 26 - 134 1000 1609031 97712
81 X 62 98 208 265 178 189 - 632 1000 23596 163611 - 81 X 432 288 139 78 35 28 - 141 1000 1632628 99348
91 X 8 160 399 262 145 22 3 429 1000 135084 1023092 X 558 273 91 59 9 10 - 77 1000 5104 35493 X 718 143 81 38 16 4 - 58 1000 2930 27694 X 373 340 138 98 18 30 2 146 1000 10024 57995 X 697 220 60 13 7 3 - 23 1000 17834 95896 X 777 198 25 - - - - - 1000 1623 7297 X 656 231 69 30 9 5 - 43 1000 57808 346899 X - - - - - - - - - - -
91 - 99 X 266 193 265 168 89 16 2 273 1000 230407 1593711 - 99 X 411 276 154 89 42 26 - 157 1000 1863035 115285
ESTIMATED PERSONS (00) 766457 515087 287291 165705 78384 49273 838 293362 1863035 X XSAMPLE PERSONS 40923 31752 19539 12523 6139 4364 45 23026 115285 X X
A - 68

TABLE (12) : PER THOUSAND DISTRIBUTION OF PERSONS OF AGE 15 YEARS AND ABOVE BY GENERAL EDUCATION FOR EACH USUAL ACTIVITY CATEGORY TAKING ALSO INTO CONSIDERATION THE SUBSIDIARY ECONOMIC STATUS OF PERSONS CATEGORISED 'NOT WORKING' AND RELIGION
ALL INDIA ALL RURAL FEMALEUSUAL ACTIVITY GENERAL EDUCATION PERSONS
STATUS INDUSTRY NOT LITE-RATE
LITE-RATE &
UPTO PRI-
MARY
MIDD-LE
SECO-NDARY
HIGH-ER SE-COND-
ARY
GRAD-UATE & AB-OVE
N.R. SECO-NDARY & AB-OVE
ALL ESTI-MATED
(00)
SAM-PLE
(1) (2) (3) (4) (5) (6) (7) (8) (9) (10) (11) (12) (13)11, 12, 21 0 771 154 49 20 4 2 - 26 1000 444010 30110
1-5 664 238 68 21 7 1 - 29 1000 41011 21226-9 610 219 89 52 16 13 - 81 1000 30199 16490-9 753 165 53 22 5 2 - 29 1000 515220 33881
31 0 827 117 36 10 10 - - 20 1000 4453 2501-5 504 210 112 65 58 50 - 174 1000 5518 2576-9 241 125 121 240 126 147 - 512 1000 14016 12350-9 410 143 104 157 89 98 - 343 1000 23988 1742
41 X 698 285 9 7 - - - 7 1000 3158 18451 0 871 102 22 5 1 - - 5 1000 313308 13685
1-5 756 174 53 12 4 - - 16 1000 22447 10376-9 777 148 49 14 2 10 - 26 1000 4754 3410-9 862 107 24 5 1 - - 6 1000 340509 15063
41 - 51 0-9 861 109 24 5 1 - - 6 1000 343667 1524711 - 51 0 812 132 38 13 3 1 - 17 1000 761770 44045
1-5 682 218 64 21 10 4 - 35 1000 72134 36006-9 521 185 94 102 46 51 - 199 1000 48969 32250-9 785 142 43 19 6 4 - 29 1000 882874 50870
81 X 91 90 155 301 176 187 - 664 1000 7226 60111 - 81 X 780 142 44 21 7 6 - 34 1000 890100 51471
91 X 11 159 420 285 108 16 1 408 1000 54415 506892 X 599 226 105 48 15 6 - 69 1000 419713 2760893 X 708 183 67 28 9 4 - 41 1000 350435 2139494 X 839 95 47 19 - - - 19 1000 7035 37395 X 898 76 19 6 - - - 6 1000 13682 77796 X 1000 - - - - - - - 1000 1020 5597 X 900 77 15 6 1 1 - 8 1000 78359 499099 X - - - - - - - - - - -
91 - 99 X 638 190 100 50 17 5 - 72 1000 924660 6026511 - 99 X 708 166 73 36 12 5 - 53 1000 1814760 111736
ESTIMATED PERSONS (00) 1284299 301954 131608 64925 21810 9800 364 96535 1814760 X XSAMPLE PERSONS 71204 21176 10552 5696 2052 1024 32 8772 111736 X X
A - 69

TABLE (12) : PER THOUSAND DISTRIBUTION OF PERSONS OF AGE 15 YEARS AND ABOVE BY GENERAL EDUCATION FOR EACH USUAL ACTIVITY CATEGORY TAKING ALSO INTO CONSIDERATION THE SUBSIDIARY ECONOMIC STATUS OF PERSONS CATEGORISED 'NOT WORKING' AND RELIGION
ALL INDIA ALL RURAL PERSONUSUAL ACTIVITY GENERAL EDUCATION PERSONS
STATUS INDUSTRY NOT LITE-RATE
LITE-RATE &
UPTO PRI-
MARY
MIDD-LE
SECO-NDARY
HIGH-ER SE-COND-
ARY
GRAD-UATE & AB-OVE
N.R. SECO-NDARY & AB-OVE
ALL ESTI-MATED
(00)
SAM-PLE
(1) (2) (3) (4) (5) (6) (7) (8) (9) (10) (11) (12) (13)11, 12, 21 0 547 244 114 58 24 13 - 94 1000 1165031 79225
1-5 484 314 121 53 19 9 - 80 1000 107951 58696-9 330 320 176 97 42 34 - 174 1000 163952 100130-9 518 258 122 62 26 15 - 102 1000 1436934 95107
31 0 657 203 74 37 16 13 - 66 1000 25124 16031-5 237 276 185 176 58 68 - 302 1000 39891 21856-9 104 165 167 228 142 194 - 564 1000 98158 80000-9 222 198 157 186 102 135 - 423 1000 163173 11788
41 X 576 317 81 18 6 1 - 25 1000 8619 62851 0 725 197 55 17 5 1 - 23 1000 758529 34442
1-5 511 315 119 44 10 1 - 54 1000 97165 47926-9 443 316 161 50 21 8 - 80 1000 27866 18440-9 693 214 65 21 6 2 - 28 1000 883560 41078
41 - 51 0-9 691 215 66 21 6 2 - 28 1000 892180 4170611 - 51 0 618 225 91 41 16 8 - 66 1000 1948684 115270
1-5 458 309 129 68 21 15 - 103 1000 253627 134746-9 265 267 171 137 74 86 - 297 1000 289976 198570-9 561 238 104 55 24 18 - 97 1000 2492286 148601
81 X 69 96 196 273 177 189 - 639 1000 30822 223711 - 81 X 555 237 105 58 26 20 - 103 1000 2523108 150838
91 X 9 160 405 269 134 20 3 424 1000 189569 1530092 X 599 227 105 48 15 6 - 69 1000 424869 2796793 X 708 183 67 28 9 4 - 41 1000 353386 2167494 X 566 239 100 65 10 18 1 94 1000 17059 95295 X 784 158 43 10 4 2 - 16 1000 31516 173596 X 863 122 15 - - - - - 1000 2644 12797 X 796 142 38 16 4 3 1 23 1000 136249 846399 X - - - - - - - - - - -
91 - 99 X 564 190 133 73 3 1 71 112 1000 1155292 7621811 - 99 X 558 222 114 63 27 16 - 106 1000 3678401 227056
ESTIMATED PERSONS (00) 2050789 817088 418900 230665 100297 59140 1520 390103 3678401 X XSAMPLE PERSONS 112132 52932 30092 18221 8194 5392 93 31807 227056 X X
A - 70

TABLE (12) : PER THOUSAND DISTRIBUTION OF PERSONS OF AGE 15 YEARS AND ABOVE BY GENERAL EDUCATION FOR EACH USUAL ACTIVITY CATEGORY TAKING ALSO INTO CONSIDERATION THE SUBSIDIARY ECONOMIC STATUS OF PERSONS CATEGORISED 'NOT WORKING' AND RELIGION
ALL INDIA HINDUISM URBAN MALEUSUAL ACTIVITY GENERAL EDUCATION PERSONS
STATUS INDUSTRY NOT LITE-RATE
LITE-RATE &
UPTO PRI-
MARY
MIDD-LE
SECO-NDARY
HIGH-ER SE-COND-
ARY
GRAD-UATE & AB-OVE
N.R. SECO-NDARY & AB-OVE
ALL ESTI-MATED
(00)
SAM-PLE
(1) (2) (3) (4) (5) (6) (7) (8) (9) (10) (11) (12) (13)11, 12, 21 0 304 290 167 140 45 53 1 237 1000 22790 2545
1-5 137 315 192 142 85 128 - 356 1000 35097 35826-9 145 251 196 166 100 142 - 408 1000 103751 115330-9 166 271 191 157 89 126 - 373 1000 161638 17660
31 0 330 374 95 59 46 96 - 201 1000 2037 2021-5 110 245 180 198 112 154 - 464 1000 68649 63816-9 69 162 161 185 133 290 - 608 1000 115551 124710-9 87 195 167 189 124 238 - 551 1000 186236 19054
41 X 408 273 168 82 31 37 - 151 1000 776 11951 0 546 321 101 23 3 2 2 29 1000 13349 1252
1-5 336 401 175 67 13 7 - 87 1000 32733 28606-9 338 345 187 87 32 12 - 131 1000 18582 18340-9 380 369 163 64 16 7 - 88 1000 64664 5946
41 - 51 0-9 380 368 163 64 17 8 - 88 1000 65439 606511 - 51 0 390 306 140 95 30 38 1 163 1000 38176 3999
1-5 173 300 182 152 81 112 - 345 1000 137254 129426-9 123 215 178 169 111 203 - 484 1000 237883 258380-9 164 252 176 157 94 158 - 408 1000 413314 42779
81 X 41 136 225 210 169 219 - 599 1000 17576 184411 - 81 X 159 247 178 159 97 160 - 416 1000 430890 44623
91 X 4 68 264 301 274 86 3 661 1000 70864 753192 X 330 307 166 105 72 19 - 197 1000 1723 20993 X 389 168 150 126 109 58 - 293 1000 612 6894 X 80 166 121 283 118 231 1 632 1000 13932 149195 X 407 300 123 114 47 9 - 170 1000 4208 42796 X 684 316 - - - - - - 1000 155 1597 X 320 340 122 121 38 59 1 217 1000 17921 188199 X - - - - - - - - - - -
91 - 99 X 89 139 214 257 202 96 2 556 1000 109416 1162211 - 99 X 145 225 185 179 118 147 1 444 1000 540306 56245
ESTIMATED PERSONS (00) 78351 121647 100069 96562 63763 79537 377 239862 540306 X XSAMPLE PERSONS 7279 11917 10430 10389 6918 9268 44 26575 56245 X X
A - 71

TABLE (12) : PER THOUSAND DISTRIBUTION OF PERSONS OF AGE 15 YEARS AND ABOVE BY GENERAL EDUCATION FOR EACH USUAL ACTIVITY CATEGORY TAKING ALSO INTO CONSIDERATION THE SUBSIDIARY ECONOMIC STATUS OF PERSONS CATEGORISED 'NOT WORKING' AND RELIGION
ALL INDIA HINDUISM URBAN FEMALEUSUAL ACTIVITY GENERAL EDUCATION PERSONS
STATUS INDUSTRY NOT LITE-RATE
LITE-RATE &
UPTO PRI-
MARY
MIDD-LE
SECO-NDARY
HIGH-ER SE-COND-
ARY
GRAD-UATE & AB-OVE
N.R. SECO-NDARY & AB-OVE
ALL ESTI-MATED
(00)
SAM-PLE
(1) (2) (3) (4) (5) (6) (7) (8) (9) (10) (11) (12) (13)11, 12, 21 0 639 227 76 43 10 4 1 57 1000 16577 1694
1-5 428 316 144 58 34 20 - 112 1000 12684 13296-9 430 220 138 80 43 88 - 212 1000 18557 19690-9 502 248 118 62 29 41 - 132 1000 47818 4992
31 0 615 323 27 5 2 28 - 35 1000 317 341-5 326 184 150 128 62 149 - 340 1000 5359 5376-9 220 119 58 140 123 341 - 603 1000 27250 30860-9 241 131 73 137 112 307 - 555 1000 32925 3657
41 X 640 86 - 198 21 55 - 274 1000 111 2151 0 827 129 34 8 - 2 - 10 1000 12604 1091
1-5 662 234 73 29 1 1 1 31 1000 11348 10056-9 735 196 50 7 3 8 1 18 1000 6274 6290-9 746 182 52 16 1 3 - 20 1000 30226 2725
41 - 51 0-9 745 182 52 16 1 3 - 21 1000 30337 274611 - 51 0 719 186 58 28 6 4 1 37 1000 29498 2819
1-5 500 259 117 60 26 36 - 123 1000 29501 28926-9 357 164 86 103 80 211 - 393 1000 52081 56840-9 491 195 87 72 46 109 - 227 1000 111080 11395
81 X 21 88 150 205 150 386 - 741 1000 7659 83211 - 81 X 461 188 91 80 53 127 - 260 1000 118739 12227
91 X 5 63 254 323 272 79 4 674 1000 48677 537792 X 328 255 164 126 58 69 - 253 1000 231825 2401093 X 325 217 145 136 71 104 1 312 1000 58936 632994 X 451 275 86 95 35 58 - 188 1000 3369 39895 X 701 231 36 24 5 4 - 33 1000 2948 29496 X 789 183 - 29 - - - 29 1000 416 4597 X 681 217 51 28 10 11 2 49 1000 22267 240699 X - - - - - - - - - - -
91 - 99 X 311 221 164 146 85 72 1 303 1000 368438 3885911 - 99 X 347 213 146 130 77 85 1 292 1000 487177 51086
ESTIMATED PERSONS (00) 169175 103903 71228 63441 37498 41500 432 142439 487177 X XSAMPLE PERSONS 16347 10709 7711 7007 4286 4969 57 16262 51086 X X
A - 72

TABLE (12) : PER THOUSAND DISTRIBUTION OF PERSONS OF AGE 15 YEARS AND ABOVE BY GENERAL EDUCATION FOR EACH USUAL ACTIVITY CATEGORY TAKING ALSO INTO CONSIDERATION THE SUBSIDIARY ECONOMIC STATUS OF PERSONS CATEGORISED 'NOT WORKING' AND RELIGION
ALL INDIA HINDUISM URBAN PERSONUSUAL ACTIVITY GENERAL EDUCATION PERSONS
STATUS INDUSTRY NOT LITE-RATE
LITE-RATE &
UPTO PRI-
MARY
MIDD-LE
SECO-NDARY
HIGH-ER SE-COND-
ARY
GRAD-UATE & AB-OVE
N.R. SECO-NDARY & AB-OVE
ALL ESTI-MATED
(00)
SAM-PLE
(1) (2) (3) (4) (5) (6) (7) (8) (9) (10) (11) (12) (13)11, 12, 21 0 445 264 129 99 30 33 1 162 1000 39368 4239
1-5 214 315 179 120 72 99 1 291 1000 47787 49136-9 188 247 187 153 92 133 - 378 1000 122324 135040-9 242 265 174 135 76 107 - 318 1000 209479 22656
31 0 368 367 86 52 40 87 - 179 1000 2354 2361-5 126 241 178 193 108 154 - 455 1000 74008 69186-9 98 154 141 176 131 300 - 607 1000 142814 155600-9 110 185 153 181 122 248 - 551 1000 219176 22714
41 X 437 249 147 97 30 40 - 166 1000 887 14051 0 682 228 68 16 2 2 1 20 1000 25953 2343
1-5 420 358 149 58 10 5 - 73 1000 44087 38666-9 438 307 152 67 25 11 - 102 1000 24856 24630-9 496 309 128 49 12 6 1 66 1000 94896 8672
41 - 51 0-9 496 309 128 49 12 6 1 67 1000 95782 881211 - 51 0 533 253 104 66 19 23 1 108 1000 67675 6818
1-5 231 293 170 136 71 98 - 306 1000 166768 158376-9 165 206 161 157 105 205 - 467 1000 289994 315270-9 233 240 157 139 83 147 - 369 1000 524436 54182
81 X 35 121 203 208 163 270 - 642 1000 25252 267711 - 81 X 224 234 159 142 87 153 - 382 1000 549688 56859
91 X 4 66 260 310 273 83 4 666 1000 119572 1291192 X 328 256 164 126 58 68 1 252 1000 233577 2422493 X 326 217 145 136 72 104 1 311 1000 59583 639994 X 153 187 114 246 101 197 1 545 1000 17324 189095 X 528 272 87 77 29 7 - 113 1000 7156 72196 X 760 219 - 21 - - - 21 1000 570 6097 X 520 271 83 69 22 32 2 124 1000 40217 429399 X - - - - - - - - - - -
91 - 99 X 260 202 176 172 112 77 1 361 1000 478000 5049811 - 99 X 241 220 167 156 99 118 1 372 1000 1027688 107357
ESTIMATED PERSONS (00) 247571 225589 171344 160003 101261 121060 861 382323 1027688 X XSAMPLE PERSONS 23629 22629 18144 17396 11204 14240 115 42840 107357 X X
A - 73

TABLE (12) : PER THOUSAND DISTRIBUTION OF PERSONS OF AGE 15 YEARS AND ABOVE BY GENERAL EDUCATION FOR EACH USUAL ACTIVITY CATEGORY TAKING ALSO INTO CONSIDERATION THE SUBSIDIARY ECONOMIC STATUS OF PERSONS CATEGORISED 'NOT WORKING' AND RELIGION
ALL INDIA ISLAM URBAN MALEUSUAL ACTIVITY GENERAL EDUCATION PERSONS
STATUS INDUSTRY NOT LITE-RATE
LITE-RATE &
UPTO PRI-
MARY
MIDD-LE
SECO-NDARY
HIGH-ER SE-COND-
ARY
GRAD-UATE & AB-OVE
N.R. SECO-NDARY & AB-OVE
ALL ESTI-MATED
(00)
SAM-PLE
(1) (2) (3) (4) (5) (6) (7) (8) (9) (10) (11) (12) (13)11, 12, 21 0 420 231 141 122 47 38 - 207 1000 2991 447
1-5 359 368 117 89 41 25 - 156 1000 10705 10676-9 325 317 157 119 45 37 - 201 1000 27945 29510-9 340 324 146 112 44 34 - 190 1000 41641 4465
31 0 591 232 115 62 - - - 62 1000 94 161-5 232 298 206 144 65 53 3 261 1000 7655 7646-9 153 269 185 170 83 140 1 393 1000 12682 14990-9 184 280 192 160 76 106 2 342 1000 20431 2279
41 X 289 239 244 228 - - - 228 1000 80 1951 0 632 284 70 14 - - - 14 1000 1854 198
1-5 498 301 129 63 4 4 - 72 1000 7062 6656-9 406 367 161 48 10 9 - 67 1000 4578 4950-9 485 321 131 51 6 6 - 62 1000 13494 1358
41 - 51 0-9 484 321 132 52 6 5 - 63 1000 13574 137711 - 51 0 503 251 114 80 29 23 - 132 1000 4939 661
1-5 359 328 147 99 38 28 1 165 1000 25501 25156-9 285 309 165 126 52 63 - 241 1000 45205 49450-9 324 311 156 114 46 49 - 208 1000 75646 8121
81 X 51 187 288 231 92 151 - 474 1000 2592 34011 - 81 X 315 307 160 118 47 52 - 217 1000 78237 8461
91 X 9 223 316 243 164 43 2 450 1000 9717 105092 X 526 206 167 57 45 - - 102 1000 351 4593 X 517 194 263 26 - - - 26 1000 230 1594 X 203 349 180 165 50 52 - 267 1000 1326 15795 X 604 212 164 20 - - - 20 1000 1000 10496 X 784 216 - - - - - - 1000 106 1097 X 456 314 99 80 20 31 - 132 1000 3516 40099 X - - - - - - - - - - -
91 - 99 X 182 251 243 179 108 37 1 324 1000 16245 178111 - 99 X 292 298 174 128 58 49 1 235 1000 94482 10242
ESTIMATED PERSONS (00) 27592 28123 16472 12130 5449 4665 50 22244 94482 X XSAMPLE PERSONS 2764 2996 1861 1379 633 603 6 2615 10242 X X
A - 74

TABLE (12) : PER THOUSAND DISTRIBUTION OF PERSONS OF AGE 15 YEARS AND ABOVE BY GENERAL EDUCATION FOR EACH USUAL ACTIVITY CATEGORY TAKING ALSO INTO CONSIDERATION THE SUBSIDIARY ECONOMIC STATUS OF PERSONS CATEGORISED 'NOT WORKING' AND RELIGION
ALL INDIA ISLAM URBAN FEMALEUSUAL ACTIVITY GENERAL EDUCATION PERSONS
STATUS INDUSTRY NOT LITE-RATE
LITE-RATE &
UPTO PRI-
MARY
MIDD-LE
SECO-NDARY
HIGH-ER SE-COND-
ARY
GRAD-UATE & AB-OVE
N.R. SECO-NDARY & AB-OVE
ALL ESTI-MATED
(00)
SAM-PLE
(1) (2) (3) (4) (5) (6) (7) (8) (9) (10) (11) (12) (13)11, 12, 21 0 680 205 75 19 16 4 - 39 1000 1860 266
1-5 677 230 53 20 11 10 - 41 1000 5247 5156-9 453 282 89 79 56 38 2 173 1000 2956 2870-9 612 241 68 37 25 17 1 79 1000 10062 1068
31 0 145 850 5 - - - - - 1000 29 41-5 429 355 90 92 14 19 - 126 1000 410 626-9 415 116 69 147 115 137 - 400 1000 2054 2230-9 415 164 72 136 98 116 - 350 1000 2493 289
41 X - 317 - 683 - - - 683 1000 - 351 0 767 233 - - - - - - 1000 704 69
1-5 768 170 57 - 5 - - 5 1000 2126 1896-9 704 275 7 6 8 - - 14 1000 896 760-9 752 207 34 1 5 - - 6 1000 3725 334
41 - 51 0-9 752 207 34 1 5 - - 6 1000 3726 33711 - 51 0 698 220 54 13 12 3 - 28 1000 2592 339
1-5 688 220 56 18 10 8 - 35 1000 7783 7696-9 478 223 70 92 69 67 1 228 1000 5905 5860-9 614 221 61 44 32 28 - 104 1000 16281 1694
81 X 108 107 254 270 147 114 - 532 1000 680 11711 - 81 X 593 217 68 53 36 32 - 121 1000 16960 1811
91 X 15 119 335 299 186 46 2 530 1000 4581 61592 X 510 267 122 69 18 13 1 100 1000 45992 515793 X 580 240 88 47 23 21 1 91 1000 13205 129694 X 543 284 72 89 13 - - 102 1000 645 7095 X 853 45 44 59 - - - 59 1000 396 4296 X 1000 - - - - - - - 1000 92 1397 X 772 158 39 24 4 4 - 32 1000 4074 47599 X - - - - - - - - - - -
91 - 99 X 509 244 124 78 29 16 1 122 1000 68984 766811 - 99 X 526 239 113 73 30 19 1 122 1000 85944 9479
ESTIMATED PERSONS (00) 45197 20505 9690 6253 2600 1630 69 10483 85944 X XSAMPLE PERSONS 4571 2394 1171 794 330 212 7 1336 9479 X X
A - 75

TABLE (12) : PER THOUSAND DISTRIBUTION OF PERSONS OF AGE 15 YEARS AND ABOVE BY GENERAL EDUCATION FOR EACH USUAL ACTIVITY CATEGORY TAKING ALSO INTO CONSIDERATION THE SUBSIDIARY ECONOMIC STATUS OF PERSONS CATEGORISED 'NOT WORKING' AND RELIGION
ALL INDIA ISLAM URBAN PERSONUSUAL ACTIVITY GENERAL EDUCATION PERSONS
STATUS INDUSTRY NOT LITE-RATE
LITE-RATE &
UPTO PRI-
MARY
MIDD-LE
SECO-NDARY
HIGH-ER SE-COND-
ARY
GRAD-UATE & AB-OVE
N.R. SECO-NDARY & AB-OVE
ALL ESTI-MATED
(00)
SAM-PLE
(1) (2) (3) (4) (5) (6) (7) (8) (9) (10) (11) (12) (13)11, 12, 21 0 520 221 116 82 36 25 - 144 1000 4856 714
1-5 464 322 96 66 31 20 - 118 1000 15951 15826-9 337 314 151 115 46 37 - 199 1000 30901 32380-9 393 308 130 97 41 31 - 169 1000 51708 5534
31 0 486 378 89 47 - - - 47 1000 123 201-5 242 301 200 142 62 51 3 255 1000 8064 8266-9 189 248 169 167 88 139 1 394 1000 14736 17220-9 209 267 179 157 78 107 1 343 1000 22923 2568
41 X 287 239 243 231 - - - 231 1000 80 2251 0 669 270 50 10 - - - 10 1000 2558 267
1-5 560 271 112 49 4 3 - 56 1000 9188 8546-9 454 352 136 41 10 8 - 58 1000 5474 5710-9 543 296 110 40 5 4 - 50 1000 17220 1692
41 - 51 0-9 542 296 111 41 5 4 - 51 1000 17300 171411 - 51 0 570 240 93 57 23 16 - 97 1000 7537 1001
1-5 436 303 126 80 31 23 1 134 1000 33284 32846-9 307 299 154 122 54 64 - 240 1000 51111 55310-9 375 295 139 102 43 45 - 190 1000 91931 9816
81 X 63 170 281 239 104 144 - 486 1000 3271 45711 - 81 X 365 291 144 106 45 48 - 200 1000 95203 10273
91 X 11 189 322 261 171 44 2 476 1000 14298 166592 X 511 266 122 69 18 13 1 100 1000 46342 520293 X 579 240 91 47 23 20 1 90 1000 13435 131194 X 314 328 145 140 38 35 - 213 1000 1970 22795 X 674 164 130 31 - - - 31 1000 1396 14696 X 884 116 - - - - - - 1000 198 2397 X 625 230 67 50 11 17 - 78 1000 7589 87599 X - - - - - - - - - - -
91 - 99 X 447 245 146 97 44 20 1 161 1000 85228 944911 - 99 X 403 270 145 102 45 35 1 181 1000 180431 19722
ESTIMATED PERSONS (00) 72789 48629 26162 18383 8055 6294 119 32732 180431 X XSAMPLE PERSONS 7335 5390 3032 2173 964 815 13 3952 19722 X X
A - 76

TABLE (12) : PER THOUSAND DISTRIBUTION OF PERSONS OF AGE 15 YEARS AND ABOVE BY GENERAL EDUCATION FOR EACH USUAL ACTIVITY CATEGORY TAKING ALSO INTO CONSIDERATION THE SUBSIDIARY ECONOMIC STATUS OF PERSONS CATEGORISED 'NOT WORKING' AND RELIGION
ALL INDIA CHRISTIANITY URBAN MALEUSUAL ACTIVITY GENERAL EDUCATION PERSONS
STATUS INDUSTRY NOT LITE-RATE
LITE-RATE &
UPTO PRI-
MARY
MIDD-LE
SECO-NDARY
HIGH-ER SE-COND-
ARY
GRAD-UATE & AB-OVE
N.R. SECO-NDARY & AB-OVE
ALL ESTI-MATED
(00)
SAM-PLE
(1) (2) (3) (4) (5) (6) (7) (8) (9) (10) (11) (12) (13)11, 12, 21 0 141 397 212 133 38 79 - 250 1000 1004 520
1-5 22 270 215 273 63 155 1 492 1000 690 1496-9 67 271 213 250 88 112 - 449 1000 2082 4420-9 78 304 213 223 70 111 - 404 1000 3776 1111
31 0 50 866 - 57 - 27 - 84 1000 9 61-5 41 127 193 375 126 138 - 639 1000 2229 2486-9 27 132 156 242 125 317 - 685 1000 4493 12000-9 32 131 168 286 125 258 - 668 1000 6732 1454
41 X 779 141 65 10 - 5 - 15 1000 19 1251 0 163 579 193 50 15 - - 65 1000 605 77
1-5 87 510 264 120 19 - - 139 1000 884 1876-9 60 385 337 171 26 22 - 219 1000 880 1160-9 96 481 273 121 20 8 - 150 1000 2370 380
41 - 51 0-9 102 478 271 120 20 8 - 149 1000 2389 39211 - 51 0 149 467 204 102 29 49 - 180 1000 1618 603
1-5 52 242 213 296 89 109 - 493 1000 3823 5966-9 42 200 193 236 103 225 - 564 1000 7456 17580-9 58 246 201 237 90 168 - 495 1000 12897 2957
81 X 38 128 220 290 183 141 - 614 1000 1023 12211 - 81 X 57 237 202 241 96 166 - 504 1000 13919 3079
91 X - 31 251 305 307 105 - 717 1000 2470 73192 X 71 214 200 516 - - - 516 1000 45 2393 X 54 476 372 98 - - - 98 1000 12 1994 X 75 277 175 310 65 97 - 473 1000 595 8795 X 374 475 136 - 15 - - 15 1000 156 1796 X - 1000 - - - - - - 1000 6 197 X 143 316 257 164 3 117 - 284 1000 737 10599 X - - - - - - - - - - -
91 - 99 X 53 142 236 270 199 100 - 569 1000 4022 98311 - 99 X 56 216 210 247 120 152 - 518 1000 17941 4062
ESTIMATED PERSONS (00) 1006 3876 3760 4433 2145 2721 1 9298 17941 X XSAMPLE PERSONS 169 861 1100 868 528 535 1 1931 4062 X X
A - 77

TABLE (12) : PER THOUSAND DISTRIBUTION OF PERSONS OF AGE 15 YEARS AND ABOVE BY GENERAL EDUCATION FOR EACH USUAL ACTIVITY CATEGORY TAKING ALSO INTO CONSIDERATION THE SUBSIDIARY ECONOMIC STATUS OF PERSONS CATEGORISED 'NOT WORKING' AND RELIGION
ALL INDIA CHRISTIANITY URBAN FEMALEUSUAL ACTIVITY GENERAL EDUCATION PERSONS
STATUS INDUSTRY NOT LITE-RATE
LITE-RATE &
UPTO PRI-
MARY
MIDD-LE
SECO-NDARY
HIGH-ER SE-COND-
ARY
GRAD-UATE & AB-OVE
N.R. SECO-NDARY & AB-OVE
ALL ESTI-MATED
(00)
SAM-PLE
(1) (2) (3) (4) (5) (6) (7) (8) (9) (10) (11) (12) (13)11, 12, 21 0 166 330 214 218 48 24 1 289 1000 607 414
1-5 298 370 187 70 66 9 - 145 1000 364 616-9 83 245 231 249 58 133 - 441 1000 738 2960-9 158 302 216 200 56 68 - 324 1000 1709 771
31 0 - - - - - - - - - - -1-5 65 80 108 370 43 334 - 747 1000 457 516-9 66 85 66 306 175 302 - 783 1000 2789 5110-9 66 84 72 315 157 306 - 778 1000 3247 562
41 X - - 1000 - - - - - 1000 1 151 0 678 260 51 - 11 - - 11 1000 205 29
1-5 322 578 79 22 - - - 22 1000 298 406-9 261 471 45 222 - - - 223 1000 128 400-9 426 453 63 55 4 - - 59 1000 631 109
41 - 51 0-9 425 452 64 55 4 - - 59 1000 631 11011 - 51 0 295 312 173 163 39 18 - 219 1000 813 443
1-5 209 307 126 180 39 139 - 358 1000 1120 1536-9 77 130 99 292 146 257 - 694 1000 3655 8470-9 135 192 115 250 109 199 - 558 1000 5587 1443
81 X - 63 118 251 295 273 - 819 1000 700 10211 - 81 X 120 178 115 250 129 207 - 587 1000 6288 1545
91 X 1 46 246 373 263 65 6 701 1000 2488 65292 X 162 258 236 215 56 73 - 344 1000 7581 128093 X 170 293 293 177 35 33 - 245 1000 940 48094 X 360 170 352 56 60 3 - 119 1000 359 4795 X 289 595 17 100 - - - 100 1000 96 1696 X - - - - - - - - - - -97 X 476 331 94 89 - 9 - 98 1000 674 13899 X - - - - - - - - - - -
91 - 99 X 154 221 236 232 93 62 1 387 1000 12138 261311 - 99 X 142 206 195 238 105 112 1 455 1000 18426 4158
ESTIMATED PERSONS (00) 2622 3802 3595 4391 1944 2055 16 8391 18426 X XSAMPLE PERSONS 427 1078 1086 845 397 322 3 1564 4158 X X
A - 78

TABLE (12) : PER THOUSAND DISTRIBUTION OF PERSONS OF AGE 15 YEARS AND ABOVE BY GENERAL EDUCATION FOR EACH USUAL ACTIVITY CATEGORY TAKING ALSO INTO CONSIDERATION THE SUBSIDIARY ECONOMIC STATUS OF PERSONS CATEGORISED 'NOT WORKING' AND RELIGION
ALL INDIA CHRISTIANITY URBAN PERSONUSUAL ACTIVITY GENERAL EDUCATION PERSONS
STATUS INDUSTRY NOT LITE-RATE
LITE-RATE &
UPTO PRI-
MARY
MIDD-LE
SECO-NDARY
HIGH-ER SE-COND-
ARY
GRAD-UATE & AB-OVE
N.R. SECO-NDARY & AB-OVE
ALL ESTI-MATED
(00)
SAM-PLE
(1) (2) (3) (4) (5) (6) (7) (8) (9) (10) (11) (12) (13)11, 12, 21 0 150 371 213 165 42 58 - 265 1000 1611 934
1-5 117 304 206 203 64 105 1 372 1000 1054 2106-9 71 264 218 250 80 117 - 447 1000 2820 7380-9 103 303 214 216 66 98 - 379 1000 5485 1882
31 0 50 866 - 57 - 27 - 84 1000 9 61-5 45 119 179 374 112 172 - 657 1000 2687 2996-9 42 114 122 267 144 311 - 722 1000 7283 17120-9 43 116 137 295 135 273 - 704 1000 9979 2017
41 X 759 138 89 10 - 5 - 14 1000 20 1351 0 293 498 157 37 14 - - 51 1000 811 106
1-5 146 527 217 95 14 - - 109 1000 1182 2276-9 85 396 300 177 23 19 - 219 1000 1008 1560-9 166 475 229 107 17 7 - 131 1000 3001 489
41 - 51 0-9 169 473 228 106 17 7 - 130 1000 3020 50211 - 51 0 198 415 194 122 32 39 - 193 1000 2431 1046
1-5 87 256 193 269 78 116 - 463 1000 4942 7496-9 54 177 162 254 117 236 - 607 1000 11111 26060-9 82 230 175 241 95 178 - 514 1000 18484 4401
81 X 23 101 179 274 228 195 - 697 1000 1723 22411 - 81 X 77 219 175 244 107 179 - 529 1000 20207 4625
91 X 1 39 248 339 285 85 3 709 1000 4959 138592 X 161 258 236 217 55 73 - 345 1000 7626 130393 X 168 295 294 176 34 33 - 243 1000 952 49994 X 182 236 241 215 63 62 - 340 1000 954 13495 X 342 521 90 38 9 - - 47 1000 253 3396 X - 1000 - - - - - - 1000 6 197 X 302 323 179 128 1 65 - 195 1000 1411 24399 X - - - - - - - - - - -
91 - 99 X 129 201 236 241 120 72 1 433 1000 16161 359811 - 99 X 100 211 202 243 112 131 - 486 1000 36368 8223
ESTIMATED PERSONS (00) 3628 7678 7356 8825 4088 4777 16 17690 36368 X XSAMPLE PERSONS 596 1939 2186 1714 925 859 4 3498 8223 X X
A - 79

TABLE (12) : PER THOUSAND DISTRIBUTION OF PERSONS OF AGE 15 YEARS AND ABOVE BY GENERAL EDUCATION FOR EACH USUAL ACTIVITY CATEGORY TAKING ALSO INTO CONSIDERATION THE SUBSIDIARY ECONOMIC STATUS OF PERSONS CATEGORISED 'NOT WORKING' AND RELIGION
ALL INDIA SIKHISM URBAN MALEUSUAL ACTIVITY GENERAL EDUCATION PERSONS
STATUS INDUSTRY NOT LITE-RATE
LITE-RATE &
UPTO PRI-
MARY
MIDD-LE
SECO-NDARY
HIGH-ER SE-COND-
ARY
GRAD-UATE & AB-OVE
N.R. SECO-NDARY & AB-OVE
ALL ESTI-MATED
(00)
SAM-PLE
(1) (2) (3) (4) (5) (6) (7) (8) (9) (10) (11) (12) (13)11, 12, 21 0 419 224 107 113 102 35 - 250 1000 654 114
1-5 78 176 186 238 93 228 - 559 1000 1129 1426-9 135 151 159 261 136 158 - 556 1000 2810 4030-9 161 168 158 234 121 158 - 513 1000 4594 659
31 0 1000 - - - - - - - 1000 6 21-5 86 222 98 269 126 199 - 594 1000 923 1226-9 65 139 137 246 100 313 - 659 1000 2057 3280-9 73 164 125 253 108 277 - 638 1000 2985 452
41 X - - - - - - - - - - -51 0 736 264 - - - - - - 1000 196 23
1-5 479 230 216 75 - - - 75 1000 362 446-9 481 489 30 - - - - - 1000 83 120-9 558 274 126 42 - - - 42 1000 641 79
41 - 51 0-9 558 274 126 42 - - - 42 1000 641 7911 - 51 0 495 232 82 87 78 27 - 191 1000 855 139
1-5 141 202 157 225 92 183 - 500 1000 2415 3086-9 112 151 148 251 119 220 - 589 1000 4950 7430-9 160 175 143 226 107 189 - 522 1000 8220 1190
81 X 27 77 93 329 396 79 - 804 1000 325 4711 - 81 X 155 171 142 230 118 185 - 532 1000 8545 1237
91 X - 90 221 314 305 55 15 673 1000 1201 20392 X 476 - - - 305 219 - 524 1000 30 493 X - 48 810 60 - 82 - 142 1000 20 494 X 65 211 170 272 70 213 - 554 1000 355 5895 X 206 181 175 330 - 109 - 439 1000 148 2296 X - - - - - - - - - - -97 X 416 221 129 101 97 36 - 234 1000 428 5999 X - - - - - - - - - - -
91 - 99 X 113 140 194 260 202 83 8 545 1000 2183 35011 - 99 X 147 165 152 236 135 164 2 535 1000 10728 1587
ESTIMATED PERSONS (00) 1573 1766 1633 2533 1447 1758 18 5738 10728 X XSAMPLE PERSONS 212 250 217 382 236 288 2 906 1587 X X
A - 80

TABLE (12) : PER THOUSAND DISTRIBUTION OF PERSONS OF AGE 15 YEARS AND ABOVE BY GENERAL EDUCATION FOR EACH USUAL ACTIVITY CATEGORY TAKING ALSO INTO CONSIDERATION THE SUBSIDIARY ECONOMIC STATUS OF PERSONS CATEGORISED 'NOT WORKING' AND RELIGION
ALL INDIA SIKHISM URBAN FEMALEUSUAL ACTIVITY GENERAL EDUCATION PERSONS
STATUS INDUSTRY NOT LITE-RATE
LITE-RATE &
UPTO PRI-
MARY
MIDD-LE
SECO-NDARY
HIGH-ER SE-COND-
ARY
GRAD-UATE & AB-OVE
N.R. SECO-NDARY & AB-OVE
ALL ESTI-MATED
(00)
SAM-PLE
(1) (2) (3) (4) (5) (6) (7) (8) (9) (10) (11) (12) (13)11, 12, 21 0 528 205 111 133 - 24 - 156 1000 361 62
1-5 354 442 66 - - 138 - 138 1000 69 106-9 - 307 49 258 50 336 - 644 1000 237 340-9 322 266 84 164 18 146 - 328 1000 667 106
31 0 - - - - - - - - - - -1-5 922 - - 78 - - - 78 1000 6 26-9 57 33 17 198 141 554 - 893 1000 603 1060-9 65 33 17 197 140 549 - 885 1000 608 108
41 X - - - - - - - - - - -51 0 904 96 - - - - - - 1000 70 7
1-5 1000 - - - - - - - 1000 19 16-9 1000 - - - - - - - 1000 15 30-9 935 65 - - - - - - 1000 104 11
41 - 51 0-9 935 65 - - - - - - 1000 104 1111 - 51 0 589 187 93 111 - 20 - 131 1000 431 69
1-5 517 328 49 5 - 102 - 107 1000 94 136-9 58 109 26 211 113 484 - 808 1000 855 1430-9 255 148 48 166 70 313 - 549 1000 1380 225
81 X - - - 84 200 716 - 1000 1000 132 1611 - 81 X 233 135 44 159 81 348 - 588 1000 1512 241
91 X - 15 219 293 338 131 4 762 1000 1347 19192 X 265 226 129 156 80 143 - 380 1000 3677 46093 X 247 197 139 214 72 130 - 416 1000 3308 52094 X 284 370 42 266 - 38 - 304 1000 59 1495 X 1000 - - - - - - - 1000 7 296 X - - - - - - - - - - -97 X 536 312 122 7 8 16 - 30 1000 378 5299 X - - - - - - - - - - -
91 - 99 X 230 187 146 193 113 130 1 436 1000 8776 123911 - 99 X 230 180 131 188 108 162 1 458 1000 10288 1480
ESTIMATED PERSONS (00) 2370 1850 1346 1936 1114 1667 6 4716 10288 X XSAMPLE PERSONS 319 265 180 298 174 242 2 714 1480 X X
A - 81

TABLE (12) : PER THOUSAND DISTRIBUTION OF PERSONS OF AGE 15 YEARS AND ABOVE BY GENERAL EDUCATION FOR EACH USUAL ACTIVITY CATEGORY TAKING ALSO INTO CONSIDERATION THE SUBSIDIARY ECONOMIC STATUS OF PERSONS CATEGORISED 'NOT WORKING' AND RELIGION
ALL INDIA SIKHISM URBAN PERSONUSUAL ACTIVITY GENERAL EDUCATION PERSONS
STATUS INDUSTRY NOT LITE-RATE
LITE-RATE &
UPTO PRI-
MARY
MIDD-LE
SECO-NDARY
HIGH-ER SE-COND-
ARY
GRAD-UATE & AB-OVE
N.R. SECO-NDARY & AB-OVE
ALL ESTI-MATED
(00)
SAM-PLE
(1) (2) (3) (4) (5) (6) (7) (8) (9) (10) (11) (12) (13)11, 12, 21 0 458 218 108 120 65 31 - 217 1000 1015 176
1-5 94 192 179 224 88 223 - 535 1000 1199 1526-9 125 163 150 261 129 172 - 562 1000 3047 4370-9 182 180 149 225 108 156 - 489 1000 5261 765
31 0 1000 - - - - - - - 1000 6 21-5 91 221 97 267 125 198 - 591 1000 928 1246-9 63 115 110 235 109 367 - 712 1000 2660 4340-9 72 142 106 243 113 323 - 680 1000 3594 560
41 X - - - - - - - - - - -51 0 780 220 - - - - - - 1000 266 30
1-5 505 219 205 71 - - - 71 1000 381 456-9 560 415 25 - - - - - 1000 99 150-9 611 245 108 36 - - - 36 1000 745 90
41 - 51 0-9 611 245 108 36 - - - 36 1000 745 9011 - 51 0 527 217 85 95 52 24 - 171 1000 1287 208
1-5 155 207 153 217 88 180 - 485 1000 2508 3216-9 104 145 130 245 118 258 - 621 1000 5805 8860-9 174 171 130 217 101 207 - 525 1000 9600 1415
81 X 19 55 66 258 339 263 - 861 1000 456 6311 - 81 X 167 166 127 219 112 209 - 541 1000 10057 1478
91 X - 51 220 303 322 95 9 720 1000 2548 39492 X 267 224 128 155 82 144 - 381 1000 3707 46493 X 246 197 143 213 71 130 - 414 1000 3328 52494 X 96 234 152 271 60 188 - 519 1000 415 7295 X 242 172 167 315 - 104 - 419 1000 156 2496 X - - - - - - - - - - -97 X 472 264 126 57 55 26 - 139 1000 806 11199 X - - - - - - - - - - -
91 - 99 X 207 178 155 206 131 121 2 458 1000 10959 158911 - 99 X 188 172 142 213 122 163 1 497 1000 21016 3067
ESTIMATED PERSONS (00) 3943 3616 2979 4468 2561 3425 24 10454 21016 X XSAMPLE PERSONS 531 515 397 680 410 530 4 1620 3067 X X
A - 82

TABLE (12) : PER THOUSAND DISTRIBUTION OF PERSONS OF AGE 15 YEARS AND ABOVE BY GENERAL EDUCATION FOR EACH USUAL ACTIVITY CATEGORY TAKING ALSO INTO CONSIDERATION THE SUBSIDIARY ECONOMIC STATUS OF PERSONS CATEGORISED 'NOT WORKING' AND RELIGION
ALL INDIA JAINISM URBAN MALEUSUAL ACTIVITY GENERAL EDUCATION PERSONS
STATUS INDUSTRY NOT LITE-RATE
LITE-RATE &
UPTO PRI-
MARY
MIDD-LE
SECO-NDARY
HIGH-ER SE-COND-
ARY
GRAD-UATE & AB-OVE
N.R. SECO-NDARY & AB-OVE
ALL ESTI-MATED
(00)
SAM-PLE
(1) (2) (3) (4) (5) (6) (7) (8) (9) (10) (11) (12) (13)11, 12, 21 0 75 - 517 239 - 169 - 408 1000 35 6
1-5 19 16 123 389 113 340 - 842 1000 476 576-9 - 112 163 297 192 237 - 726 1000 2478 3370-9 4 95 161 311 177 252 - 740 1000 2988 400
31 0 - - - - - - - - - - -1-5 - 14 208 92 144 542 - 778 1000 508 536-9 29 127 126 327 83 307 - 717 1000 766 880-9 18 82 159 234 107 401 - 742 1000 1274 141
41 X - - - - - - - - - - -51 0 - - - - - - - - - - -
1-5 - - 166 583 251 - - 834 1000 35 56-9 - - - - - - - - - - -0-9 - - 166 583 251 - - 834 1000 35 5
41 - 51 0-9 - - 166 583 251 - - 834 1000 35 511 - 51 0 75 - 517 239 - 169 - 408 1000 35 6
1-5 9 14 167 247 133 429 - 810 1000 1018 1156-9 7 115 154 304 166 253 - 724 1000 3244 4250-9 8 90 160 290 157 294 - 742 1000 4297 546
81 X - 120 - - 287 594 - 880 1000 32 511 - 81 X 8 91 159 288 158 297 - 743 1000 4330 551
91 X - 32 136 381 361 91 - 833 1000 887 10892 X - 760 240 - - - - - 1000 7 393 X - 1000 - - - - - - 1000 2 194 X - 474 91 41 55 339 - 435 1000 178 1995 X - 225 741 - - 34 - 34 1000 45 696 X - - - - - - - - - - -97 X 147 577 55 45 4 172 - 221 1000 225 2699 X - - - - - - - - - - -
91 - 99 X 25 193 137 264 246 135 - 645 1000 1344 16311 - 99 X 12 115 154 283 179 258 - 720 1000 5674 714
ESTIMATED PERSONS (00) 67 652 872 1603 1014 1466 - 4083 5674 X XSAMPLE PERSONS 9 76 115 190 126 198 - 514 714 X X
A - 83

TABLE (12) : PER THOUSAND DISTRIBUTION OF PERSONS OF AGE 15 YEARS AND ABOVE BY GENERAL EDUCATION FOR EACH USUAL ACTIVITY CATEGORY TAKING ALSO INTO CONSIDERATION THE SUBSIDIARY ECONOMIC STATUS OF PERSONS CATEGORISED 'NOT WORKING' AND RELIGION
ALL INDIA JAINISM URBAN FEMALEUSUAL ACTIVITY GENERAL EDUCATION PERSONS
STATUS INDUSTRY NOT LITE-RATE
LITE-RATE &
UPTO PRI-
MARY
MIDD-LE
SECO-NDARY
HIGH-ER SE-COND-
ARY
GRAD-UATE & AB-OVE
N.R. SECO-NDARY & AB-OVE
ALL ESTI-MATED
(00)
SAM-PLE
(1) (2) (3) (4) (5) (6) (7) (8) (9) (10) (11) (12) (13)11, 12, 21 0 261 370 - - 370 - - 370 1000 10 3
1-5 - 547 - 275 - 178 - 453 1000 12 36-9 - 128 189 27 49 606 - 683 1000 193 220-9 12 162 170 39 62 555 - 656 1000 214 28
31 0 - - - - - - - - - - -1-5 - - - - 771 229 - 1000 1000 31 36-9 61 - - 99 67 773 - 939 1000 107 190-9 47 - - 77 225 651 - 953 1000 138 22
41 X - - - - - - - - - - -51 0 - - - - - - - - - - -
1-5 - - - - - - - - - - -6-9 - 1000 - - - - - - 1000 10 10-9 - 1000 - - - - - - 1000 10 1
41 - 51 0-9 - 1000 - - - - - - 1000 10 111 - 51 0 261 370 - - 370 - - 370 1000 10 3
1-5 - 150 - 75 560 215 - 850 1000 42 66-9 21 113 118 51 54 643 - 748 1000 310 420-9 25 124 101 52 122 576 - 750 1000 362 51
81 X - - - - - 1000 - 1000 1000 36 411 - 81 X 23 113 91 48 111 614 - 772 1000 398 55
91 X - 28 199 430 272 63 8 764 1000 747 9292 X 72 263 135 291 77 162 - 530 1000 3145 40993 X - 172 149 298 137 245 - 679 1000 469 6394 X 583 62 - 356 - - - 356 1000 19 495 X 586 117 68 229 - - - 229 1000 83 796 X - - - - - - - - - - -97 X 299 557 41 42 17 11 34 70 1000 317 4099 X - - - - - - - - - - -
91 - 99 X 79 234 139 296 108 141 4 545 1000 4778 61511 - 99 X 75 225 135 277 108 177 3 562 1000 5177 670
ESTIMATED PERSONS (00) 388 1162 699 1433 559 918 17 2910 5177 X XSAMPLE PERSONS 50 144 99 165 70 140 2 375 670 X X
A - 84

TABLE (12) : PER THOUSAND DISTRIBUTION OF PERSONS OF AGE 15 YEARS AND ABOVE BY GENERAL EDUCATION FOR EACH USUAL ACTIVITY CATEGORY TAKING ALSO INTO CONSIDERATION THE SUBSIDIARY ECONOMIC STATUS OF PERSONS CATEGORISED 'NOT WORKING' AND RELIGION
ALL INDIA JAINISM URBAN PERSONUSUAL ACTIVITY GENERAL EDUCATION PERSONS
STATUS INDUSTRY NOT LITE-RATE
LITE-RATE &
UPTO PRI-
MARY
MIDD-LE
SECO-NDARY
HIGH-ER SE-COND-
ARY
GRAD-UATE & AB-OVE
N.R. SECO-NDARY & AB-OVE
ALL ESTI-MATED
(00)
SAM-PLE
(1) (2) (3) (4) (5) (6) (7) (8) (9) (10) (11) (12) (13)11, 12, 21 0 117 83 401 186 83 131 - 399 1000 45 9
1-5 19 29 120 386 111 336 - 833 1000 487 606-9 - 113 164 279 181 263 - 723 1000 2674 3600-9 4 99 161 294 169 272 - 735 1000 3206 429
31 0 - - - - - - - - - - -1-5 - 13 196 87 179 524 - 791 1000 539 566-9 33 112 111 299 81 364 - 745 1000 873 1070-9 21 74 143 218 118 425 - 762 1000 1412 163
41 X - - - - - - - - - - -51 0 - - - - - - - - - - -
1-5 - - 166 583 251 - - 834 1000 35 56-9 - 1000 - - - - - - 1000 10 10-9 - 229 128 450 194 - - 643 1000 45 6
41 - 51 0-9 - 229 128 450 194 - - 643 1000 45 611 - 51 0 117 83 401 186 83 131 - 399 1000 45 9
1-5 9 20 160 240 150 421 - 812 1000 1061 1216-9 8 115 151 283 156 287 - 726 1000 3557 4680-9 9 93 155 272 154 316 - 742 1000 4663 598
81 X - 57 - - 136 807 - 943 1000 68 911 - 81 X 9 92 153 268 154 323 - 745 1000 4731 607
91 X - 30 165 403 320 78 4 802 1000 1634 20092 X 71 265 136 290 77 161 - 528 1000 3152 41293 X - 175 148 296 136 244 - 676 1000 471 6494 X 55 435 82 71 50 307 - 428 1000 196 2395 X 379 155 306 148 - 12 - 160 1000 128 1396 X - - - - - - - - - - -97 X 236 565 47 43 11 78 20 133 1000 541 6699 X - - - - - - - - - - -
91 - 99 X 67 225 138 289 138 140 3 567 1000 6123 77811 - 99 X 42 167 145 280 145 220 2 645 1000 10854 1385
ESTIMATED PERSONS (00) 455 1814 1572 3040 1572 2384 17 6996 10854 X XSAMPLE PERSONS 59 220 214 356 196 338 2 890 1385 X X
A - 85

TABLE (12) : PER THOUSAND DISTRIBUTION OF PERSONS OF AGE 15 YEARS AND ABOVE BY GENERAL EDUCATION FOR EACH USUAL ACTIVITY CATEGORY TAKING ALSO INTO CONSIDERATION THE SUBSIDIARY ECONOMIC STATUS OF PERSONS CATEGORISED 'NOT WORKING' AND RELIGION
ALL INDIA BUDDHISM URBAN MALEUSUAL ACTIVITY GENERAL EDUCATION PERSONS
STATUS INDUSTRY NOT LITE-RATE
LITE-RATE &
UPTO PRI-
MARY
MIDD-LE
SECO-NDARY
HIGH-ER SE-COND-
ARY
GRAD-UATE & AB-OVE
N.R. SECO-NDARY & AB-OVE
ALL ESTI-MATED
(00)
SAM-PLE
(1) (2) (3) (4) (5) (6) (7) (8) (9) (10) (11) (12) (13)11, 12, 21 0 - 233 - 154 10 603 - 767 1000 41 5
1-5 159 260 81 273 222 5 - 500 1000 114 96-9 96 213 284 279 45 84 - 407 1000 584 450-9 100 221 237 271 70 101 - 441 1000 739 59
31 0 - - - - - - - - - - -1-5 97 176 467 135 63 63 - 260 1000 631 546-9 70 250 245 210 103 121 - 434 1000 1661 1570-9 78 230 306 189 92 105 - 386 1000 2292 211
41 X - - - - - - - - - - -51 0 554 314 132 - - - - - 1000 282 20
1-5 284 328 243 125 20 - - 144 1000 625 456-9 360 307 213 - 29 91 - 120 1000 326 280-9 366 319 210 63 18 24 - 105 1000 1233 93
41 - 51 0-9 366 319 210 63 18 24 - 105 1000 1233 9311 - 51 0 483 303 115 20 1 77 - 98 1000 323 25
1-5 188 252 333 142 56 29 - 228 1000 1370 1086-9 113 249 250 199 80 109 - 388 1000 2572 2300-9 165 254 266 167 67 81 - 315 1000 4264 363
81 X - 123 411 171 216 79 - 466 1000 319 2311 - 81 X 153 245 277 167 77 81 - 325 1000 4584 386
91 X - 78 353 289 114 167 - 569 1000 1041 8192 X - 1000 - - - - - - 1000 13 193 X - - - - - - - - - - -94 X 29 333 244 254 42 97 - 394 1000 166 1595 X 864 136 - - - - - - 1000 37 596 X 1000 - - - - - - - 1000 31 197 X 384 453 164 - - - - - 1000 150 1199 X - - - - - - - - - - -
91 - 99 X 87 155 301 238 87 132 - 457 1000 1438 11411 - 99 X 138 223 282 184 79 93 - 357 1000 6022 500
ESTIMATED PERSONS (00) 829 1345 1700 1109 479 560 - 2148 6022 X XSAMPLE PERSONS 64 125 141 82 42 46 - 170 500 X X
A - 86

TABLE (12) : PER THOUSAND DISTRIBUTION OF PERSONS OF AGE 15 YEARS AND ABOVE BY GENERAL EDUCATION FOR EACH USUAL ACTIVITY CATEGORY TAKING ALSO INTO CONSIDERATION THE SUBSIDIARY ECONOMIC STATUS OF PERSONS CATEGORISED 'NOT WORKING' AND RELIGION
ALL INDIA BUDDHISM URBAN FEMALEUSUAL ACTIVITY GENERAL EDUCATION PERSONS
STATUS INDUSTRY NOT LITE-RATE
LITE-RATE &
UPTO PRI-
MARY
MIDD-LE
SECO-NDARY
HIGH-ER SE-COND-
ARY
GRAD-UATE & AB-OVE
N.R. SECO-NDARY & AB-OVE
ALL ESTI-MATED
(00)
SAM-PLE
(1) (2) (3) (4) (5) (6) (7) (8) (9) (10) (11) (12) (13)11, 12, 21 0 - 1000 - - - - - - 1000 9 1
1-5 608 194 - 199 - - - 199 1000 47 56-9 443 219 169 168 - - - 168 1000 257 290-9 455 238 139 168 - - - 168 1000 313 35
31 0 - - - - - - - - - - -1-5 - - 415 320 265 - - 585 1000 94 56-9 547 119 99 48 128 59 - 235 1000 547 470-9 466 101 146 88 148 50 - 286 1000 641 52
41 X 1000 - - - - - - - 1000 9 151 0 863 83 53 - - - - - 1000 396 28
1-5 913 87 - - - - - - 1000 200 176-9 638 362 - - - - - - 1000 71 90-9 854 114 32 - - - - - 1000 667 54
41 - 51 0-9 856 112 31 - - - - - 1000 676 5511 - 51 0 844 104 52 - - - - - 1000 405 29
1-5 628 76 112 113 72 - - 184 1000 350 286-9 524 168 112 80 80 37 - 196 1000 875 850-9 626 132 97 67 58 20 - 145 1000 1629 142
81 X - 175 - 373 251 201 - 825 1000 118 911 - 81 X 584 135 90 88 71 32 - 191 1000 1748 151
91 X - 71 465 173 229 62 - 464 1000 581 6192 X 371 246 223 110 29 20 - 160 1000 2893 24293 X 507 309 169 15 - - - 15 1000 218 2294 X 779 221 - - - - - - 1000 55 495 X 593 407 - - - - - - 1000 33 396 X 1000 - - - - - - - 1000 12 197 X 897 19 19 64 - - - 64 1000 248 2199 X - - - - - - - - - - -
91 - 99 X 366 211 237 109 54 23 - 186 1000 4040 35411 - 99 X 432 188 193 102 59 26 - 187 1000 5788 505
ESTIMATED PERSONS (00) 2500 1087 1116 593 342 150 - 1084 5788 X XSAMPLE PERSONS 206 92 101 55 35 16 - 106 505 X X
A - 87
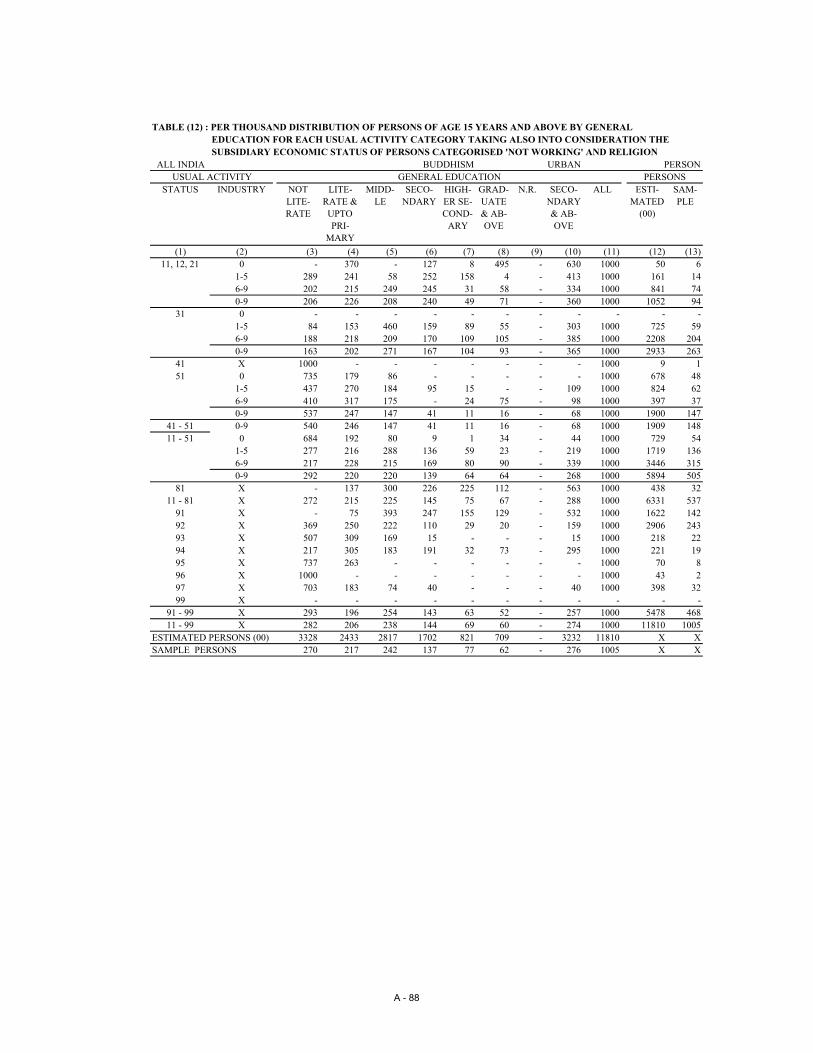
TABLE (12) : PER THOUSAND DISTRIBUTION OF PERSONS OF AGE 15 YEARS AND ABOVE BY GENERAL EDUCATION FOR EACH USUAL ACTIVITY CATEGORY TAKING ALSO INTO CONSIDERATION THE SUBSIDIARY ECONOMIC STATUS OF PERSONS CATEGORISED 'NOT WORKING' AND RELIGION
ALL INDIA BUDDHISM URBAN PERSONUSUAL ACTIVITY GENERAL EDUCATION PERSONS
STATUS INDUSTRY NOT LITE-RATE
LITE-RATE &
UPTO PRI-
MARY
MIDD-LE
SECO-NDARY
HIGH-ER SE-COND-
ARY
GRAD-UATE & AB-OVE
N.R. SECO-NDARY & AB-OVE
ALL ESTI-MATED
(00)
SAM-PLE
(1) (2) (3) (4) (5) (6) (7) (8) (9) (10) (11) (12) (13)11, 12, 21 0 - 370 - 127 8 495 - 630 1000 50 6
1-5 289 241 58 252 158 4 - 413 1000 161 146-9 202 215 249 245 31 58 - 334 1000 841 740-9 206 226 208 240 49 71 - 360 1000 1052 94
31 0 - - - - - - - - - - -1-5 84 153 460 159 89 55 - 303 1000 725 596-9 188 218 209 170 109 105 - 385 1000 2208 2040-9 163 202 271 167 104 93 - 365 1000 2933 263
41 X 1000 - - - - - - - 1000 9 151 0 735 179 86 - - - - - 1000 678 48
1-5 437 270 184 95 15 - - 109 1000 824 626-9 410 317 175 - 24 75 - 98 1000 397 370-9 537 247 147 41 11 16 - 68 1000 1900 147
41 - 51 0-9 540 246 147 41 11 16 - 68 1000 1909 14811 - 51 0 684 192 80 9 1 34 - 44 1000 729 54
1-5 277 216 288 136 59 23 - 219 1000 1719 1366-9 217 228 215 169 80 90 - 339 1000 3446 3150-9 292 220 220 139 64 64 - 268 1000 5894 505
81 X - 137 300 226 225 112 - 563 1000 438 3211 - 81 X 272 215 225 145 75 67 - 288 1000 6331 537
91 X - 75 393 247 155 129 - 532 1000 1622 14292 X 369 250 222 110 29 20 - 159 1000 2906 24393 X 507 309 169 15 - - - 15 1000 218 2294 X 217 305 183 191 32 73 - 295 1000 221 1995 X 737 263 - - - - - - 1000 70 896 X 1000 - - - - - - - 1000 43 297 X 703 183 74 40 - - - 40 1000 398 3299 X - - - - - - - - - - -
91 - 99 X 293 196 254 143 63 52 - 257 1000 5478 46811 - 99 X 282 206 238 144 69 60 - 274 1000 11810 1005
ESTIMATED PERSONS (00) 3328 2433 2817 1702 821 709 - 3232 11810 X XSAMPLE PERSONS 270 217 242 137 77 62 - 276 1005 X X
A - 88
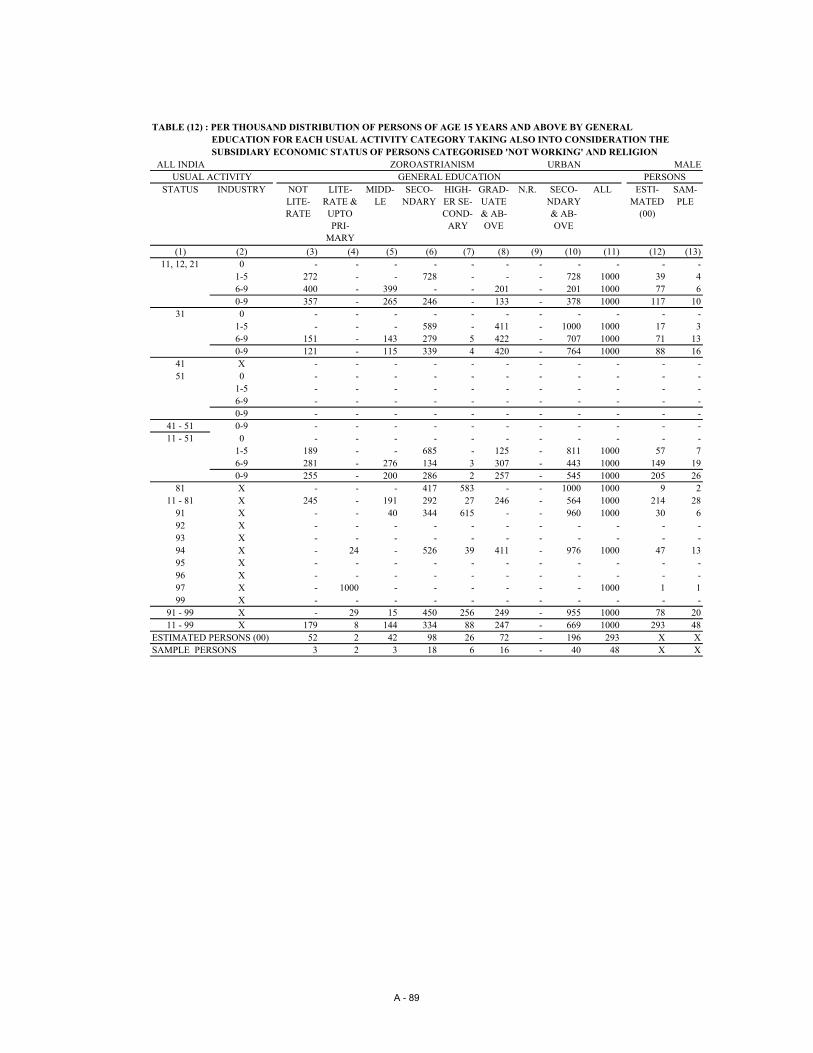
TABLE (12) : PER THOUSAND DISTRIBUTION OF PERSONS OF AGE 15 YEARS AND ABOVE BY GENERAL EDUCATION FOR EACH USUAL ACTIVITY CATEGORY TAKING ALSO INTO CONSIDERATION THE SUBSIDIARY ECONOMIC STATUS OF PERSONS CATEGORISED 'NOT WORKING' AND RELIGION
ALL INDIA ZOROASTRIANISM URBAN MALEUSUAL ACTIVITY GENERAL EDUCATION PERSONS
STATUS INDUSTRY NOT LITE-RATE
LITE-RATE &
UPTO PRI-
MARY
MIDD-LE
SECO-NDARY
HIGH-ER SE-COND-
ARY
GRAD-UATE & AB-OVE
N.R. SECO-NDARY & AB-OVE
ALL ESTI-MATED
(00)
SAM-PLE
(1) (2) (3) (4) (5) (6) (7) (8) (9) (10) (11) (12) (13)11, 12, 21 0 - - - - - - - - - - -
1-5 272 - - 728 - - - 728 1000 39 46-9 400 - 399 - - 201 - 201 1000 77 60-9 357 - 265 246 - 133 - 378 1000 117 10
31 0 - - - - - - - - - - -1-5 - - - 589 - 411 - 1000 1000 17 36-9 151 - 143 279 5 422 - 707 1000 71 130-9 121 - 115 339 4 420 - 764 1000 88 16
41 X - - - - - - - - - - -51 0 - - - - - - - - - - -
1-5 - - - - - - - - - - -6-9 - - - - - - - - - - -0-9 - - - - - - - - - - -
41 - 51 0-9 - - - - - - - - - - -11 - 51 0 - - - - - - - - - - -
1-5 189 - - 685 - 125 - 811 1000 57 76-9 281 - 276 134 3 307 - 443 1000 149 190-9 255 - 200 286 2 257 - 545 1000 205 26
81 X - - - 417 583 - - 1000 1000 9 211 - 81 X 245 - 191 292 27 246 - 564 1000 214 28
91 X - - 40 344 615 - - 960 1000 30 692 X - - - - - - - - - - -93 X - - - - - - - - - - -94 X - 24 - 526 39 411 - 976 1000 47 1395 X - - - - - - - - - - -96 X - - - - - - - - - - -97 X - 1000 - - - - - - 1000 1 199 X - - - - - - - - - - -
91 - 99 X - 29 15 450 256 249 - 955 1000 78 2011 - 99 X 179 8 144 334 88 247 - 669 1000 293 48
ESTIMATED PERSONS (00) 52 2 42 98 26 72 - 196 293 X XSAMPLE PERSONS 3 2 3 18 6 16 - 40 48 X X
A - 89

TABLE (12) : PER THOUSAND DISTRIBUTION OF PERSONS OF AGE 15 YEARS AND ABOVE BY GENERAL EDUCATION FOR EACH USUAL ACTIVITY CATEGORY TAKING ALSO INTO CONSIDERATION THE SUBSIDIARY ECONOMIC STATUS OF PERSONS CATEGORISED 'NOT WORKING' AND RELIGION
ALL INDIA ZOROASTRIANISM URBAN FEMALEUSUAL ACTIVITY GENERAL EDUCATION PERSONS
STATUS INDUSTRY NOT LITE-RATE
LITE-RATE &
UPTO PRI-
MARY
MIDD-LE
SECO-NDARY
HIGH-ER SE-COND-
ARY
GRAD-UATE & AB-OVE
N.R. SECO-NDARY & AB-OVE
ALL ESTI-MATED
(00)
SAM-PLE
(1) (2) (3) (4) (5) (6) (7) (8) (9) (10) (11) (12) (13)11, 12, 21 0 - - - - - - - - - - -
1-5 - - - - - - - - - - -6-9 - - - 1000 - - - 1000 1000 1 10-9 - - - 1000 - - - 1000 1000 1 1
31 0 - - - - - - - - - - -1-5 - - - - - 1000 - 1000 1000 12 26-9 - - 207 97 27 669 - 793 1000 29 90-9 - - 144 68 19 769 - 856 1000 41 11
41 X - - - - - - - - - - -51 0 - - - - - - - - - - -
1-5 - - - - - - - - - - -6-9 - - - - - - - - - - -0-9 - - - - - - - - - - -
41 - 51 0-9 - - - - - - - - - - -11 - 51 0 - - - - - - - - - - -
1-5 - - - - - 1000 - 1000 1000 12 26-9 - - 201 121 26 651 - 799 1000 29 100-9 - - 142 85 19 754 - 858 1000 42 12
81 X - - - - - - - - - - -11 - 81 X - - 142 85 19 754 - 858 1000 42 12
91 X - - 193 80 726 - - 807 1000 15 592 X - 179 116 509 - 196 - 706 1000 110 2293 X - 1000 - - - - - - 1000 3 194 X - - - 1000 - - - 1000 1000 6 195 X 1000 - - - - - - - 1000 3 196 X - - - - - - - - - - -97 X - 976 24 - - - - - 1000 51 499 X - - - - - - - - - - -
91 - 99 X 16 384 90 337 58 115 - 510 1000 187 3411 - 99 X 13 314 99 291 51 231 - 574 1000 229 46
ESTIMATED PERSONS (00) 3 72 23 67 12 53 - 131 229 X XSAMPLE PERSONS 1 7 6 15 4 13 - 32 46 X X
A - 90

TABLE (12) : PER THOUSAND DISTRIBUTION OF PERSONS OF AGE 15 YEARS AND ABOVE BY GENERAL EDUCATION FOR EACH USUAL ACTIVITY CATEGORY TAKING ALSO INTO CONSIDERATION THE SUBSIDIARY ECONOMIC STATUS OF PERSONS CATEGORISED 'NOT WORKING' AND RELIGION
ALL INDIA ZOROASTRIANISM URBAN PERSONUSUAL ACTIVITY GENERAL EDUCATION PERSONS
STATUS INDUSTRY NOT LITE-RATE
LITE-RATE &
UPTO PRI-
MARY
MIDD-LE
SECO-NDARY
HIGH-ER SE-COND-
ARY
GRAD-UATE & AB-OVE
N.R. SECO-NDARY & AB-OVE
ALL ESTI-MATED
(00)
SAM-PLE
(1) (2) (3) (4) (5) (6) (7) (8) (9) (10) (11) (12) (13)11, 12, 21 0 - - - - - - - - - - -
1-5 272 - - 728 - - - 728 1000 39 46-9 396 - 395 10 - 199 - 208 1000 78 70-9 355 - 263 250 - 132 - 382 1000 118 11
31 0 - - - - - - - - - - -1-5 - - - 344 - 656 - 1000 1000 30 56-9 108 - 161 227 12 493 - 731 1000 100 220-9 83 - 124 254 9 530 - 793 1000 129 27
41 X - - - - - - - - - - -51 0 - - - - - - - - - - -
1-5 - - - - - - - - - - -6-9 - - - - - - - - - - -0-9 - - - - - - - - - - -
41 - 51 0-9 - - - - - - - - - - -11 - 51 0 - - - - - - - - - - -
1-5 156 - - 563 - 281 - 844 1000 69 96-9 234 - 264 132 7 364 - 502 1000 178 290-9 212 - 190 252 5 341 - 597 1000 247 38
81 X - - - 417 583 - - 1000 1000 9 211 - 81 X 205 - 183 258 25 328 - 612 1000 256 40
91 X - - 92 255 653 - - 908 1000 45 1192 X - 179 116 509 - 196 - 706 1000 110 2293 X - 1000 - - - - - - 1000 3 194 X - 22 - 579 34 365 - 978 1000 53 1495 X 1000 - - - - - - - 1000 3 196 X - - - - - - - - - - -97 X - 977 23 - - - - - 1000 52 599 X - - - - - - - - - - -
91 - 99 X 11 280 68 370 117 155 - 642 1000 265 5411 - 99 X 106 142 125 315 72 240 - 627 1000 521 94
ESTIMATED PERSONS (00) 55 74 65 164 37 125 - 327 521 X XSAMPLE PERSONS 4 9 9 33 10 29 - 72 94 X X
A - 91

TABLE (12) : PER THOUSAND DISTRIBUTION OF PERSONS OF AGE 15 YEARS AND ABOVE BY GENERAL EDUCATION FOR EACH USUAL ACTIVITY CATEGORY TAKING ALSO INTO CONSIDERATION THE SUBSIDIARY ECONOMIC STATUS OF PERSONS CATEGORISED 'NOT WORKING' AND RELIGION
ALL INDIA OTHERS URBAN MALEUSUAL ACTIVITY GENERAL EDUCATION PERSONS
STATUS INDUSTRY NOT LITE-RATE
LITE-RATE &
UPTO PRI-
MARY
MIDD-LE
SECO-NDARY
HIGH-ER SE-COND-
ARY
GRAD-UATE & AB-OVE
N.R. SECO-NDARY & AB-OVE
ALL ESTI-MATED
(00)
SAM-PLE
(1) (2) (3) (4) (5) (6) (7) (8) (9) (10) (11) (12) (13)11, 12, 21 0 390 392 28 183 3 3 - 190 1000 122 31
1-5 269 275 147 69 168 72 - 309 1000 157 256-9 205 320 167 70 141 98 - 308 1000 449 510-9 250 322 139 89 124 76 - 289 1000 729 107
31 0 - - - - 1000 - - 1000 1000 - 11-5 113 526 131 164 20 46 - 230 1000 200 246-9 21 316 82 125 189 268 - 581 1000 311 780-9 57 398 101 140 124 181 - 445 1000 511 103
41 X 399 601 - - - - - - 1000 3 251 0 494 506 - - - - - - 1000 23 4
1-5 567 387 39 8 - - - 8 1000 106 136-9 414 394 192 - - - - - 1000 80 70-9 500 403 93 4 - - - 4 1000 210 24
41 - 51 0-9 499 405 92 4 - - - 4 1000 213 2611 - 51 0 405 409 23 153 6 3 - 162 1000 146 36
1-5 271 410 115 95 66 44 - 205 1000 466 646-9 157 325 138 83 145 151 - 380 1000 841 1360-9 218 361 119 94 106 102 - 302 1000 1453 236
81 X - 274 - - 552 175 - 726 1000 44 611 - 81 X 212 358 115 91 119 104 - 314 1000 1497 242
91 X 38 75 196 334 303 54 - 691 1000 286 5592 X 54 - - - - 946 - 946 1000 11 293 X - - - - - - - - - - -94 X - 425 123 337 - 115 - 452 1000 63 795 X 1000 - - - - - - - 1000 3 196 X - - - - - - - - - - -97 X 512 463 - - 26 - - 26 1000 19 599 X - - - - - - - - - - -
91 - 99 X 64 148 167 305 228 88 - 620 1000 383 7011 - 99 X 182 316 126 135 141 101 - 377 1000 1880 312
ESTIMATED PERSONS (00) 342 593 237 253 265 189 - 708 1880 X XSAMPLE PERSONS 46 74 49 59 47 37 - 143 312 X X
A - 92
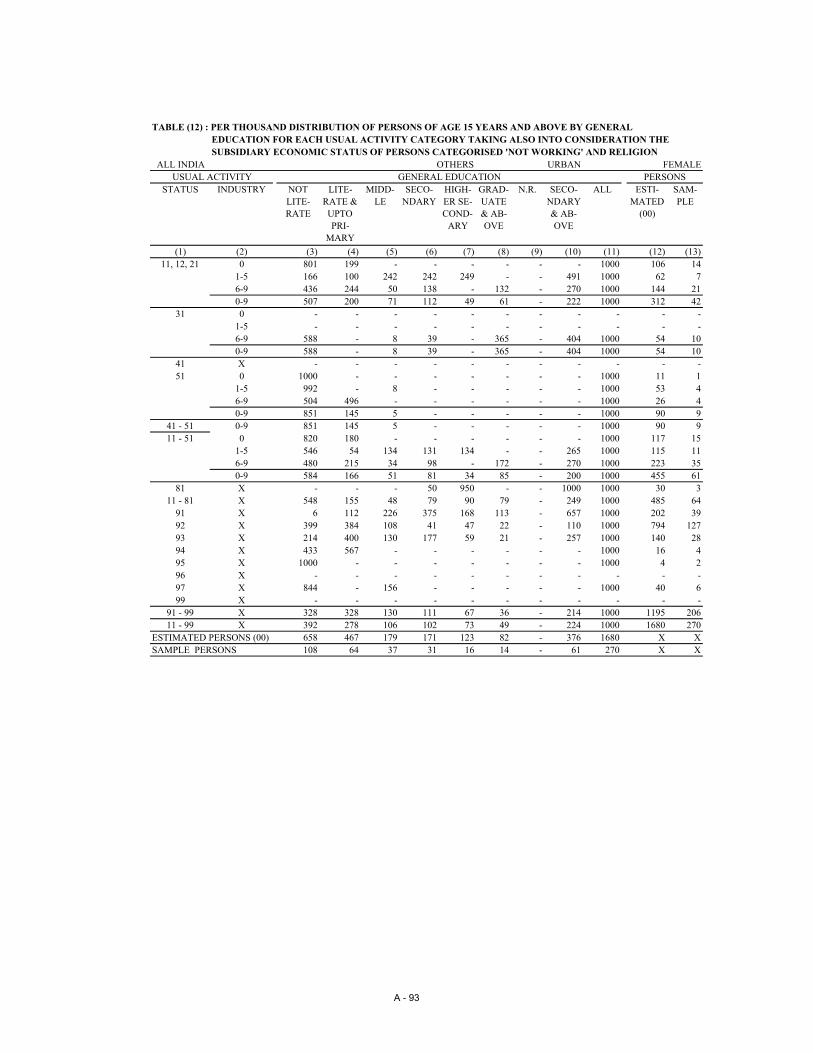
TABLE (12) : PER THOUSAND DISTRIBUTION OF PERSONS OF AGE 15 YEARS AND ABOVE BY GENERAL EDUCATION FOR EACH USUAL ACTIVITY CATEGORY TAKING ALSO INTO CONSIDERATION THE SUBSIDIARY ECONOMIC STATUS OF PERSONS CATEGORISED 'NOT WORKING' AND RELIGION
ALL INDIA OTHERS URBAN FEMALEUSUAL ACTIVITY GENERAL EDUCATION PERSONS
STATUS INDUSTRY NOT LITE-RATE
LITE-RATE &
UPTO PRI-
MARY
MIDD-LE
SECO-NDARY
HIGH-ER SE-COND-
ARY
GRAD-UATE & AB-OVE
N.R. SECO-NDARY & AB-OVE
ALL ESTI-MATED
(00)
SAM-PLE
(1) (2) (3) (4) (5) (6) (7) (8) (9) (10) (11) (12) (13)11, 12, 21 0 801 199 - - - - - - 1000 106 14
1-5 166 100 242 242 249 - - 491 1000 62 76-9 436 244 50 138 - 132 - 270 1000 144 210-9 507 200 71 112 49 61 - 222 1000 312 42
31 0 - - - - - - - - - - -1-5 - - - - - - - - - - -6-9 588 - 8 39 - 365 - 404 1000 54 100-9 588 - 8 39 - 365 - 404 1000 54 10
41 X - - - - - - - - - - -51 0 1000 - - - - - - - 1000 11 1
1-5 992 - 8 - - - - - 1000 53 46-9 504 496 - - - - - - 1000 26 40-9 851 145 5 - - - - - 1000 90 9
41 - 51 0-9 851 145 5 - - - - - 1000 90 911 - 51 0 820 180 - - - - - - 1000 117 15
1-5 546 54 134 131 134 - - 265 1000 115 116-9 480 215 34 98 - 172 - 270 1000 223 350-9 584 166 51 81 34 85 - 200 1000 455 61
81 X - - - 50 950 - - 1000 1000 30 311 - 81 X 548 155 48 79 90 79 - 249 1000 485 64
91 X 6 112 226 375 168 113 - 657 1000 202 3992 X 399 384 108 41 47 22 - 110 1000 794 12793 X 214 400 130 177 59 21 - 257 1000 140 2894 X 433 567 - - - - - - 1000 16 495 X 1000 - - - - - - - 1000 4 296 X - - - - - - - - - - -97 X 844 - 156 - - - - - 1000 40 699 X - - - - - - - - - - -
91 - 99 X 328 328 130 111 67 36 - 214 1000 1195 20611 - 99 X 392 278 106 102 73 49 - 224 1000 1680 270
ESTIMATED PERSONS (00) 658 467 179 171 123 82 - 376 1680 X XSAMPLE PERSONS 108 64 37 31 16 14 - 61 270 X X
A - 93

TABLE (12) : PER THOUSAND DISTRIBUTION OF PERSONS OF AGE 15 YEARS AND ABOVE BY GENERAL EDUCATION FOR EACH USUAL ACTIVITY CATEGORY TAKING ALSO INTO CONSIDERATION THE SUBSIDIARY ECONOMIC STATUS OF PERSONS CATEGORISED 'NOT WORKING' AND RELIGION
ALL INDIA OTHERS URBAN PERSONUSUAL ACTIVITY GENERAL EDUCATION PERSONS
STATUS INDUSTRY NOT LITE-RATE
LITE-RATE &
UPTO PRI-
MARY
MIDD-LE
SECO-NDARY
HIGH-ER SE-COND-
ARY
GRAD-UATE & AB-OVE
N.R. SECO-NDARY & AB-OVE
ALL ESTI-MATED
(00)
SAM-PLE
(1) (2) (3) (4) (5) (6) (7) (8) (9) (10) (11) (12) (13)11, 12, 21 0 581 302 15 98 2 2 - 102 1000 228 45
1-5 240 225 174 118 191 51 - 360 1000 219 326-9 261 301 139 86 107 106 - 299 1000 593 720-9 327 286 119 95 102 72 - 269 1000 1041 149
31 0 - - - - 1000 - - 1000 1000 - 11-5 113 526 131 164 20 46 - 230 1000 200 246-9 104 269 71 112 161 282 - 555 1000 364 880-9 107 360 92 130 112 198 - 441 1000 565 113
41 X 399 601 - - - - - - 1000 3 251 0 655 345 - - - - - - 1000 34 5
1-5 708 258 28 5 - - - 5 1000 159 176-9 436 419 145 - - - - - 1000 107 110-9 605 325 67 3 - - - 3 1000 300 33
41 - 51 0-9 603 328 66 3 - - - 3 1000 303 3511 - 51 0 589 308 13 85 3 2 - 90 1000 263 51
1-5 325 340 118 102 79 35 - 217 1000 581 756-9 225 302 116 86 115 156 - 357 1000 1064 1710-9 306 314 103 91 88 98 - 277 1000 1908 297
81 X - 164 - 20 711 105 - 836 1000 74 911 - 81 X 294 309 99 88 112 98 - 298 1000 1982 306
91 X 25 90 208 351 247 78 - 677 1000 488 9492 X 394 378 107 40 46 35 - 122 1000 805 12993 X 214 400 130 177 59 21 - 257 1000 140 2894 X 88 453 98 268 - 92 - 360 1000 79 1195 X 1000 - - - - - - - 1000 8 396 X - - - - - - - - - - -97 X 738 148 106 - 8 - - 8 1000 58 1199 X - - - - - - - - - - -
91 - 99 X 264 285 139 158 106 49 - 312 1000 1578 27611 - 99 X 281 298 117 119 109 76 - 305 1000 3559 582
ESTIMATED PERSONS (00) 999 1061 416 425 388 271 - 1084 3559 X XSAMPLE PERSONS 154 138 86 90 63 51 - 204 582 X X
A - 94

TABLE (12) : PER THOUSAND DISTRIBUTION OF PERSONS OF AGE 15 YEARS AND ABOVE BY GENERAL EDUCATION FOR EACH USUAL ACTIVITY CATEGORY TAKING ALSO INTO CONSIDERATION THE SUBSIDIARY ECONOMIC STATUS OF PERSONS CATEGORISED 'NOT WORKING' AND RELIGION
ALL INDIA ALL URBAN MALEUSUAL ACTIVITY GENERAL EDUCATION PERSONS
STATUS INDUSTRY NOT LITE-RATE
LITE-RATE &
UPTO PRI-
MARY
MIDD-LE
SECO-NDARY
HIGH-ER SE-COND-
ARY
GRAD-UATE & AB-OVE
N.R. SECO-NDARY & AB-OVE
ALL ESTI-MATED
(00)
SAM-PLE
(1) (2) (3) (4) (5) (6) (7) (8) (9) (10) (11) (12) (13)11, 12, 21 0 313 286 164 137 46 53 1 236 1000 27638 3668
1-5 182 319 174 138 76 110 - 324 1000 48407 50356-9 177 260 187 162 91 122 - 375 1000 140177 157680-9 196 277 181 153 82 110 - 346 1000 216222 24471
31 0 342 369 95 59 44 91 - 194 1000 2146 2271-5 119 246 184 198 107 146 1 451 1000 80812 76496-9 75 171 163 187 127 275 - 590 1000 137592 158340-9 94 200 170 190 119 226 - 535 1000 220550 23710
41 X 406 268 172 94 28 33 - 154 1000 877 15251 0 544 326 100 23 3 2 2 28 1000 16310 1574
1-5 359 384 170 69 12 6 - 87 1000 41807 38196-9 341 351 187 81 27 13 - 121 1000 24530 24920-9 390 363 161 63 15 7 - 85 1000 82647 7885
41 - 51 0-9 390 362 161 64 15 7 - 86 1000 83524 803711 - 51 0 396 304 138 93 31 36 1 160 1000 46094 5469
1-5 197 300 178 149 75 101 - 325 1000 171903 166556-9 144 227 176 167 103 183 - 452 1000 302299 340940-9 184 258 173 155 87 143 - 385 1000 520296 56218
81 X 41 141 232 217 166 204 - 587 1000 21920 238911 - 81 X 178 253 176 157 90 145 - 393 1000 542216 58607
91 X 4 84 268 295 262 83 3 640 1000 86497 976592 X 353 289 163 103 69 23 - 195 1000 2181 28793 X 408 178 197 98 76 42 - 216 1000 875 10794 X 87 191 129 273 107 212 1 592 1000 16662 184795 X 436 284 136 98 35 10 - 143 1000 5599 58296 X 740 260 - - - - - - 1000 297 2797 X 336 336 122 114 34 57 1 205 1000 22996 248899 X - - - - - - - - - - -
91 - 99 X 99 153 218 249 190 90 2 528 1000 135108 1510311 - 99 X 162 233 184 175 110 134 1 420 1000 677325 73710
ESTIMATED PERSONS (00) 109813 158004 124786 118721 74587 90968 445 284277 677325 X XSAMPLE PERSONS 10546 16301 13916 13367 8536 10991 53 32894 73710 X X
A - 95

TABLE (12) : PER THOUSAND DISTRIBUTION OF PERSONS OF AGE 15 YEARS AND ABOVE BY GENERAL EDUCATION FOR EACH USUAL ACTIVITY CATEGORY TAKING ALSO INTO CONSIDERATION THE SUBSIDIARY ECONOMIC STATUS OF PERSONS CATEGORISED 'NOT WORKING' AND RELIGION
ALL INDIA ALL URBAN FEMALEUSUAL ACTIVITY GENERAL EDUCATION PERSONS
STATUS INDUSTRY NOT LITE-RATE
LITE-RATE &
UPTO PRI-
MARY
MIDD-LE
SECO-NDARY
HIGH-ER SE-COND-
ARY
GRAD-UATE & AB-OVE
N.R. SECO-NDARY & AB-OVE
ALL ESTI-MATED
(00)
SAM-PLE
(1) (2) (3) (4) (5) (6) (7) (8) (9) (10) (11) (12) (13)11, 12, 21 0 626 228 81 48 12 5 1 65 1000 19530 2454
1-5 495 292 119 48 29 17 - 94 1000 18484 19306-9 414 229 134 88 45 89 - 222 1000 23082 26590-9 506 248 112 63 29 41 - 133 1000 61096 7043
31 0 576 368 25 4 2 26 - 32 1000 346 381-5 308 183 146 145 64 154 - 363 1000 6369 6626-9 222 114 59 153 127 326 - 606 1000 33431 40110-9 238 127 73 151 116 296 - 562 1000 40146 4711
41 X 662 80 4 184 19 50 - 254 1000 121 2651 0 823 134 33 8 - 2 - 10 1000 13991 1225
1-5 676 228 69 24 2 1 - 26 1000 14043 12566-9 721 214 44 10 4 7 1 21 1000 7420 7620-9 743 188 49 15 2 2 - 18 1000 35453 3243
41 - 51 0-9 743 188 49 15 2 3 - 19 1000 35574 326911 - 51 0 707 191 60 31 7 4 1 41 1000 33867 3717
1-5 530 251 105 56 25 34 - 114 1000 39016 38746-9 349 167 84 113 83 203 - 400 1000 63934 74320-9 489 197 84 76 47 106 - 230 1000 136817 15023
81 X 25 87 150 213 165 361 - 739 1000 9354 108311 - 81 X 459 190 89 85 55 122 - 262 1000 146171 16106
91 X 5 65 260 322 266 77 4 665 1000 58638 703292 X 349 257 159 121 52 62 1 235 1000 296015 3170793 X 362 222 137 125 63 91 1 279 1000 77218 873994 X 458 268 103 94 32 44 - 171 1000 4528 54295 X 704 218 36 34 4 3 - 42 1000 3570 36796 X 831 146 - 23 - - - 23 1000 520 5997 X 684 215 51 29 9 10 2 48 1000 28047 314299 X - - - - - - - - - - -
91 - 99 X 332 224 160 141 77 64 1 282 1000 468537 5158811 - 99 X 363 216 143 127 72 78 1 277 1000 614708 67694
ESTIMATED PERSONS (00) 222912 132850 87877 78285 44191 48053 539 170530 614708 X XSAMPLE PERSONS 22029 14753 10391 9210 5312 5928 71 20450 67694 X X
A - 96

TABLE (12) : PER THOUSAND DISTRIBUTION OF PERSONS OF AGE 15 YEARS AND ABOVE BY GENERAL EDUCATION FOR EACH USUAL ACTIVITY CATEGORY TAKING ALSO INTO CONSIDERATION THE SUBSIDIARY ECONOMIC STATUS OF PERSONS CATEGORISED 'NOT WORKING' AND RELIGION
ALL INDIA ALL URBAN PERSONUSUAL ACTIVITY GENERAL EDUCATION PERSONS
STATUS INDUSTRY NOT LITE-RATE
LITE-RATE &
UPTO PRI-
MARY
MIDD-LE
SECO-NDARY
HIGH-ER SE-COND-
ARY
GRAD-UATE & AB-OVE
N.R. SECO-NDARY & AB-OVE
ALL ESTI-MATED
(00)
SAM-PLE
(1) (2) (3) (4) (5) (6) (7) (8) (9) (10) (11) (12) (13)11, 12, 21 0 443 262 129 100 32 33 1 165 1000 47173 6123
1-5 269 312 159 113 63 84 - 260 1000 66898 69676-9 210 256 180 152 85 117 - 354 1000 163278 184300-9 264 270 166 134 71 95 - 299 1000 277349 31520
31 0 374 368 86 51 38 82 - 172 1000 2492 2651-5 133 241 181 194 104 147 1 445 1000 87180 83116-9 104 160 143 181 127 285 - 593 1000 171038 198490-9 116 189 155 184 119 237 - 539 1000 260711 28425
41 X 437 245 152 105 27 35 - 166 1000 998 17851 0 673 238 69 16 2 2 1 19 1000 30301 2799
1-5 439 345 145 58 9 5 - 72 1000 55855 50766-9 429 319 154 64 22 12 - 98 1000 31950 32540-9 496 310 128 49 11 6 - 65 1000 118106 11129
41 - 51 0-9 496 310 128 49 11 6 - 66 1000 119104 1130711 - 51 0 528 256 105 67 21 23 1 110 1000 79966 9187
1-5 258 291 164 132 66 89 - 286 1000 210932 205326-9 180 217 160 158 99 187 - 443 1000 366266 415330-9 247 245 155 138 79 135 - 352 1000 657164 71252
81 X 36 124 208 215 166 251 - 632 1000 31291 347311 - 81 X 238 240 157 142 83 140 - 365 1000 688455 74725
91 X 5 77 265 306 263 80 4 650 1000 145167 1680292 X 349 257 159 121 52 61 1 234 1000 298226 3199993 X 363 221 138 125 63 90 1 278 1000 78128 884894 X 168 207 123 234 91 176 1 501 1000 21213 239095 X 540 258 97 73 23 7 - 104 1000 9169 94996 X 798 188 - 15 - - - 15 1000 817 8697 X 527 269 83 67 20 31 2 119 1000 51073 563699 X - - - - - - - - - - -
91 - 99 X 280 208 173 165 102 70 1 337 1000 603792 6671011 - 99 X 258 225 165 152 92 108 1 352 1000 1292247 141435
ESTIMATED PERSONS (00) 332770 290893 212709 197009 118784 139046 1037 454839 1292247 X XSAMPLE PERSONS 32578 31057 24310 22579 13849 16924 138 53352 141435 X X
A - 97


![EMPLOYMENT RELATIONS ACT 2008labour.govmu.org/English/Documents/Legislations... · · 2017-06-01EMPLOYMENT RELATIONS ACT 2008 Act 32/2008 Proclaimed by [Proclamation No. 4 of 2009]](https://img.pdfslide.net/doc/110x75/5af7b6047f8b9a7444911f2d/employment-relations-act-relations-act-2008-act-322008-proclaimed-by-proclamation.jpg)