Embed Size (px)
Citation preview
Employment creation potential, labor skills requirements and skill gaps for young peopleA Uganda case study
Madina M. Guloba, Medard Kakuru, Sarah N. Ssewanyana, and Jakob Rauschendorfer
RESEARCH STREAMAddressing Africa’s youth unemployment through industries without smokestacks
July 2021
AGI Working Paper #37
Industries without smokestacks
Africa Growth Initiative at Brookings
Madina M. Guloba is a senior research fellow at the Economic Policy Research Centre (EPRC) in
Uganda.
Medard Kakuru is a research analyst at EPRC.
Sarah N. Ssewanyana is the executive director at EPRC
Jakob Rauschendorfer is a country economist at the International Growth Centre.
Corresponding author: Madina M. Guloba ([email protected])
Acknowledgements
The authors thank Vincent Ssennono of the Uganda Bureau of Statistics for his professionalism and
support towards availing data and in validating the estimates and Richard Newfarmer of IGC for
reviewing the original drafts of this study.
Brookings gratefully acknowledges the support provided by the Mastercard Foundation and Canada’s International Development Research Centre (IDRC). Brookings recognizes that the value it provides is
in its commitment to quality, independence, and impact. Activities supported by its donors reflect this commitment. The views expressed by Brookings do not necessarily represent those of the Mastercard
Foundation or its Board of Directors, or IDRC or its Board of Governors.
The Brookings Institution is a nonprofit organization devoted to independent research and policy solutions. Its mission is to conduct high-quality, independent research and, based on that research, to
provide innovative, practical recommendations for policymakers and the public. The conclusions and recommendations of any Brookings publication are solely those of its author(s), and do not reflect the
views of the Institution, its management, or its other scholars.
Cover photos (clockwise from left): A'Melody Lee/World Bank; Arne Hoel/World Bank; Dominic
Chavez/Word Bank
Industries without smokestacks
Contents
1. Introduction. . . . . . . . . . . . . . . . . . . . . . . . . . . . . . . . . . . . . . . . . . . . . . . . . . . . . . . . . . . . . . . . . . . . . . . . . . . . . . . . . . . . . . . . . . . . . . . . . . . . . . . . 1
2. Data ............................................................................................................................................ 3 3. Country context and background .................................................................................................. 4
3.1 Macroeconomic performance....................................................................................................... 4 3.2 Uganda’s labor market: Employment patterns and salient features.................................................. 4 3.3 A brief background on Uganda’s major IWOSS sectors.................................................................... 6 3.4 National policies and the regulatory framework affecting IWOSS sectors ........................................ 10
4. Patterns of growth and structural transformation: The role of IWOSS ........................................... 11
4.1 Employment at the broad industry level....................................................................................... 11 4.2 Productivity, employment, and export growth in Uganda’s IWOSS, non-IWOSS,
and manufacturing sectors .............................................................................................................. 12 4.3 Sectoral productivity and employment growth: Is there evidence for structural transformation?........ 16
5. Sectoral decomposition: IWOSS in comparative perspective with manufacturing and non-IWOSS.. 17
5.1 Employment in IWOSS, manufacturing, and non-IWOSS sectors .................................................... 18 5.2 Formal private employment in IWOSS, manufacturing and non-IWOSS sectors................................ 20 5.3 Demographic, occupational and skills profile of employment ........................................................ 22 5.4 Education profile of the youth employed in IWOSS and non-IWOSS sectors..................................... 23 5.5 Occupation/skills profile by sector .............................................................................................. 26
6. Constraints to growth in IWOSS.................................................................................................. 30
6.1 The investment climate ............................................................................................................. 30 6.2 Trade-related constraints ........................................................................................................... 34 6.3 Agglomeration .......................................................................................................................... 40
7. Uganda’s future employment: An illustrative 7 percent annual growth scenario ........................... 41 8. Employment potential: Firm survey case studies along IWOSS value chains ................................. 45
8.1 Overview of value chains ........................................................................................................... 45 8.2 Insights from IWOSS firm-level surveys: What are the impediments to realizing their potential? ........ 50
9. Policy implications: Unlocking Uganda’s IWOSS growth potential and overcoming skill gaps ........ 65
9.1 Policy recommendations to drive growth in selected IWOSS sectors............................................... 67
References.................................................................................................................................... 69 Annex 1. Other analytical tables on sectoral decomposition of employment ..................................... 72 Annex 2: Productivity growth in IWOSS sectors: An alternative perspective ...................................... 75 Annex 3: Additional tables related to the projections ...................................................................... 80
Employment creation potential, labor skills requirements, and skill gaps for young people: A Ugandan case study
Africa Growth Initiative at Brookings 1
1. Introduction
Over the course of the last decade, Uganda’s economic growth has ranked among sub-Saharan
Africa’s strongest; indeed, the country’s annualized average growth rate was 5.4 percent between
2010 and 2019 (World Bank, 2020). Despite this impressive growth, there has been limited creation
of productive and decent jobs1 to both absorb the burgeoning labor force and improve livelihoods. The
population growth rate (recorded at 3.1 percent per year) has consistently remained higher than the
jobs creation rate necessary for absorbing persons joining the labor market, resulting in increasing
unemployment and pervasive underemployment rates. Moreover, where jobs have been created, few
young Ugandans (especially young women) have benefited from such opportunities. Indeed, a study
conducted by the EPRC (2018) finds that, while the economy grew by 4.5 percent in 2016/17, this
growth was largely driven by the services sector,2 but services, in turn, contribute a mere 15 percent
to total employment. In addition, due to severe skill gaps, Ugandan youth are largely engaged in low-
value services (e.g., petty trade, food vending, etc.), and only few are able to secure employment in
high value-added economic activities like agro-processing, horticulture, or tourism.
Uganda’s economy-wide unemployment rate declined to 9.2 percent in 2016/17 from 11.1 percent
in 2012/13. Among youth3 (who represent 21.6 percent of Uganda’s population), unemployment
declined to 16.8 percent in 2016/17 from 20.3 percent in 2012/13, however, with less progress
recorded for female youth. Underemployment, a critical development challenge faced by the youth, is
widespread in Uganda and can partly be explained by low skills among job seekers (at 1 percent), time
(at 43.6 percent) as well as wage-related aspects (at 30.2 percent) (UBOS 2018). At the same time,
inequality of opportunity is also growing. Even among the employed youth, 21 percent are classified
as poor due to the precarious jobs in which they are engaged, especially if they work in the informal
sector.
In this regard, informality, underemployment, and unemployment persist in the country’s labor market;
as a result, many Ugandans are engaged in “vulnerable employment.”4 Vulnerable employment is
often characterized by inadequate earnings, low productivity, and difficult conditions of work that
undermine workers’ fundamental rights. According to the Uganda Bureau of Statistics (2018), 61
percent of employed persons in the country were classified as engaged in vulnerable employment with
the share being higher for female Ugandans (71 percent). Similarly, 68 percent of employed persons
living in Uganda’s rural areas are more likely to engage in vulnerable employment compared to 48
percent living in the country’s urban areas.
While agriculture employs nearly 77 percent of the rural population, recorded growth in the sector was
low at 2.8 percent in 2016/17 (UBOS 2018). However, sectors providing more productive and better-
paying jobs, like agro-processing and high value-added agro-industry have clear linkages to agriculture
sector’s overall performance in the country. Weak economic growth in agriculture, therefore, affects
agro-industrialization, which, in turn, has implications for the employment viability in the dominant
agro-industry. Sector-level performance is also deterred by irregularities and erratic decisions in the
business and policy environment. Consequently, the vast majority of Uganda’s labor force remains
1 By jobs, this paper refers to a status held by an individual, rather than the total number of opportunities. 2 Services accounts for 52 percent of GDP (UBOS, 2019). 3 This paper defines youth as per ILO to be those between 15-24 years. 4 According to the International Labor Organization (ILO), the employed workforce who are own-account workers or contributing family
workers are considered to be in vulnerable employment.

Industries without smokestacks
2 Africa Growth Initiative at Brookings
employed in labor intensive and less productive sectors. Even within agriculture, only a very small
proportion of agricultural workers are engaged in the cultivation of high-value, commercialized crops.
The above narrative is also exacerbated by the small and not expanding number of formal jobs,
especially in Uganda’s public sector. This lack of available “white collar jobs” is met by a significant
number of youth graduating annually either with a certificate, diploma, or degree who aspire to find
such employment. While the private sector is coming in to fill the gap in creating jobs for this segment
of the population, current efforts are not sufficient, and more opportunities for jobs to be created for
this segment of the labor force need to be identified and supported.
In order to create jobs, especially for the youth, there is need to raise private investment in labor-
intensive industries. Besides providing jobs, labor-intensive industries—historically manufacturing—
can pave the way for continuous upgrading to higher value-added economic activities. However, the
average share of manufacturing in Uganda’s GDP keeps declining, from 11 percent between 2000
and 2010 to 9 percent between 2011 and 2018. Therefore, manufacturing will not be able to absorb
the 600,000 young Ugandans entering the jobs market each year (AfDB, 2019).
In light of the slow growth of the manufacturing sector, Uganda needs to find alternatives for the
creation of productive jobs if the country is to achieve its Vision 2040. Service oriented industries that
share key firm characteristics with manufacturing firms have the potential to enhance growth and
create decent employment opportunities. Such industries are called “industries without smokestacks”
(IWOSS). Newfarmer et al. (2018) classify these as agro-industry, horticulture, tourism, business
services, transit trade, and some information and communication technology (ICT) based services.
This study contributes to the evidence base around this topic by analyzing the role of IWOSS in
generating large-scale employment opportunities for (young) workers in Uganda, especially in the
formal parts of the economy. The paper pays particular attention to three sectors: agro-processing,
horticulture, and tourism, as the earlier literature indicates that these sectors have considerable
potential to create large-scale formal employment opportunities for young people.5
Specifically, this study:
1. Assesses the current employment creation potential along the value chains of IWOSS
industries under their respective current sectoral growth trajectories;
2. Aims to identify the key constraints to growth in IWOSS sectors;
3. Estimates future labor demand in IWOSS sectors when identified constraints are removed;
4. Analyzes the occupation and labor skills requirements and gaps in IWOSS sectors; and
5. Pays particular attention to the need for soft and digital skills among youth (employed and
unemployed) to ensure that suggested policy interventions can bridge them.
The reminder of the paper is organized as follows: Section 2 presents the approaches adopted as well
as data sources and their limitations. Section 3 presents the country context and background with
emphasis on the performance of selected IWOSS sectors in Uganda. The section further delves into
employment patterns and other salient features of employment in the country. Section 4 analyzes
growth patterns in terms of output, productivity, and exports with emphasis on the role of IWOSS in
structural transformation. Section 5 analyzes the specific characteristics regarding sectoral
5 For example, Mbaye et al. (2019) estimate Uganda’s sector level average employment elasticity for IWOSS sectors to be 0.96. In the
same study, Ugandan manufacturing, transport, and tourism are found to have average employment elasticities of 0.80, 0.90, and 0.73
respectively.
Employment creation potential, labor skills requirements, and skill gaps for young people: A Ugandan case study
Africa Growth Initiative at Brookings 3
employment and comparisons are made between IWOSS and non-IWOSS sectors as well as
manufacturing. Section 6 presents the growth constraints that IWOSS sectors face. Section 7 provides
projections for the size of labor force by 2029/30 according to skill groups, projections that inform
discussion on the skills gaps that need to be filled to solve current employment gaps. Section 8
presents firm-level surveys that provide insights into future employment requirements and the need
for digital skills along the IWOSS value chains selected for this study (horticulture, agro-industry, and
tourism). Section 9 concludes with policy recommendations to leverage IWOSS sectors for employment
generation, especially for youth.
2. Data
This section discusses the different sources of data used for the objectives of this study while also
highlighting their limitations.
For consistency, when identifying economic activities in IWOSS, manufacturing, and non-IWOSS
sectors, this study exploits the availability of the International Standard Industrial Classification (ISIC)
level 4 codes in all data sets. Occupations were categorized using the International Standard
Classification of Occupations (ISCO) Level 1, which divides jobs into 10 major groups,6 classified by
skills level and specialization to perform tasks and duties of the occupations that cascade from Level
4, “occupations titles,” Level 3, “occupations class,” Level 2, “occupations category,” and Level 1
“occupation group.”
The paper at hand largely relies on the Uganda National Household survey (UNHS) 2012/13 and
2016/17 data sets and the labor module in particular for information on sectoral employment, skills,
and occupations. The surveys are conducted by the Uganda National Bureau of Statistics (UBOS). The
surveys are nationally representative despite differences in the number of sampled households.
Sampling weights have been utilized throughout the analysis to ensure the actual representativeness
of the sample to the population.
The World Bank Enterprise Survey data (2006 and 2013) were used for the constraints analysis of the
sectors as per the IWOSS framework paper on constraints to growth (Page 2019). A limitation of the
Enterprise Surveys is that they do not provide a disaggregation of sectors at the granular level required
to identify economic activities in IWOSS and non-IWOSS sectors. As such, this analysis is limited around
agro-based industries, especially agro-processors. A further disadvantage of these data sets is that
they are relatively old.
Additional administrative data were used to complement the analysis of constraints, structural growth,
and productivity for IWOSS sectors. Specifically, this study relies on goods and services trade data
from UNComtrade, survey data on non-tariff barriers from the International Trade Centre (ITC) and as
well as corporate income tax (CIT), pay-as-you-earn and value-added tax (VAT) declarations of formal
firms as well as transaction-level customs data (ASYCUDA) obtained from the Uganda Revenue
Authority (URA). Using URA data sets has the following limitations: First, the data cover only formal
firms reporting to URA. Second, since employment data is for workers reported by Ugandan firms to
the URA, it is highly likely that the formal employment data does not capture employment in the large
informal tail of agricultural sectors (e.g., farmers of export crops). Finally, the customs data only covers
6 These are: managers, professionals, technicians and associate professionals, clerical support workers, skilled agricultural, forestry and
fishery workers, craft and related trades workers, plant and machine operators, and assemblers, elementary occupations, and armed
forces occupations.
Industries without smokestacks
4 Africa Growth Initiative at Brookings
cross-border commodity trade, while information on services trade is not captured. Therefore, mainly
agro-processing and horticulture IWOSS sectors are analyzed using these data.
3. Country context and background
Leveraging various data sources, this section first provides some contextualizing information on
Uganda. Section 3.1 provides a brief overview of Uganda’s macroeconomic performance. Section 3.2
discusses employment patterns and other salient features such as demographics and unemployment,
while section 3.3 considers the performance of selected IWOSS sectors in the country. Section 3.4
analyzes IWOSS performance and the policy and regulatory frameworks that govern them.
3.1 Macroeconomic performance
Uganda has achieved macroeconomic stability with single-digit annual inflation rates and a stable
exchange rate. The country has registered strong economic growth averaging 6 percent since 2000,
though growth has not been as strong as that experienced in the 1990s. The Ugandan economy is
estimated to have grown by 6.5 percent in 2018/19 (UBOS 2020). At the same time, the country’s
economic growth has also led to growing income inequality and has not created enough jobs for its
burgeoning labor force. While the economy grew considerably in 2018/19, this growth was largely
driven by low-productivity services. Services, in turn, contribute less than 15 percent to total
employment. Low-wage agriculture continues to be the largest employer.
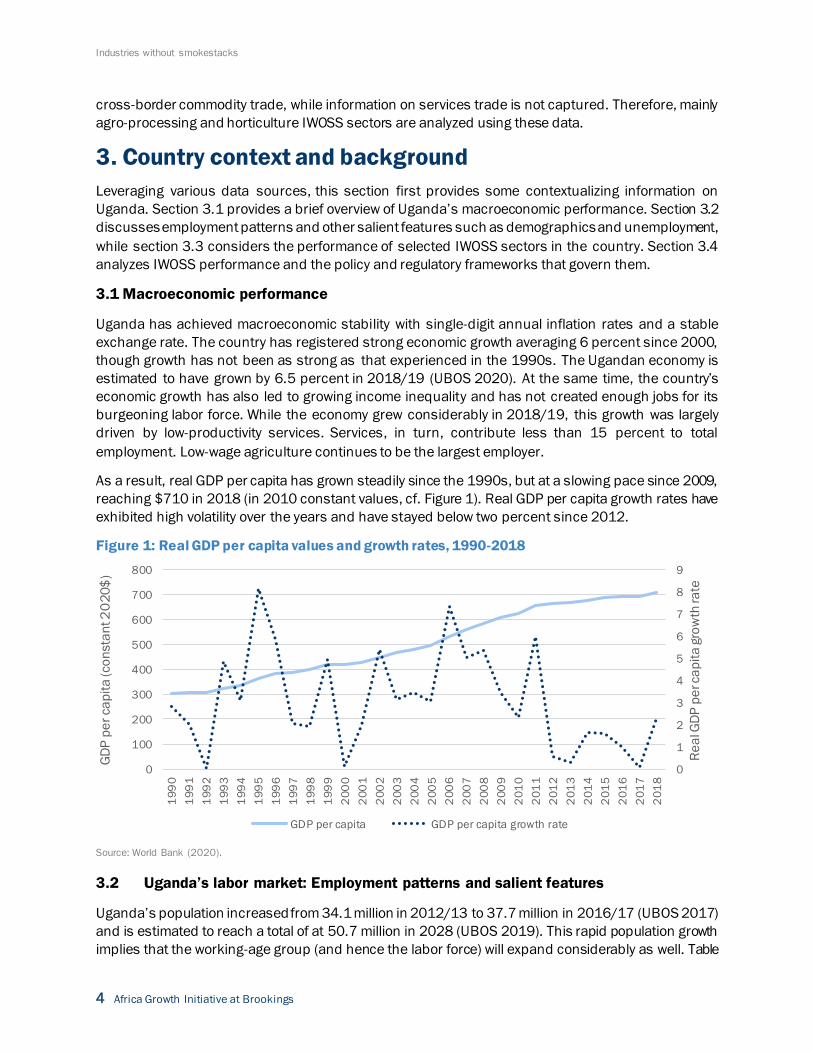
As a result, real GDP per capita has grown steadily since the 1990s, but at a slowing pace since 2009,
reaching $710 in 2018 (in 2010 constant values, cf. Figure 1). Real GDP per capita growth rates have
exhibited high volatility over the years and have stayed below two percent since 2012.
Figure 1: Real GDP per capita values and growth rates, 1990-2018
Source: World Bank (2020).
3.2 Uganda’s labor market: Employment patterns and salient features
Uganda’s population increased from 34.1 million in 2012/13 to 37.7 million in 2016/17 (UBOS 2017)
and is estimated to reach a total of at 50.7 million in 2028 (UBOS 2019). This rapid population growth
implies that the working-age group (and hence the labor force) will expand considerably as well. Table
0
1
2
3
4
5
6
7
8
9
0
100
200
300
400
500
600
700
800
19
90
19
91
19
92
19
93
19
94
19
95
19
96
19
97
19
98
19
99
20
00
20
01
20
02
20
03
20
04
20
05
20
06
20
07
20
08
20
09
20
10
20
11
20
12
20
13
20
14
20
15
20
16
20
17
20
18
Re
al G
DP
pe
r ca
pit
a g
row
th ra
te
GD
P p
er
ca
pit
a (co
nsta
nt 2
02
0$
)
GDP per capita GDP per capita growth rate
Employment creation potential, labor skills requirements, and skill gaps for young people: A Ugandan case study
Africa Growth Initiative at Brookings 5
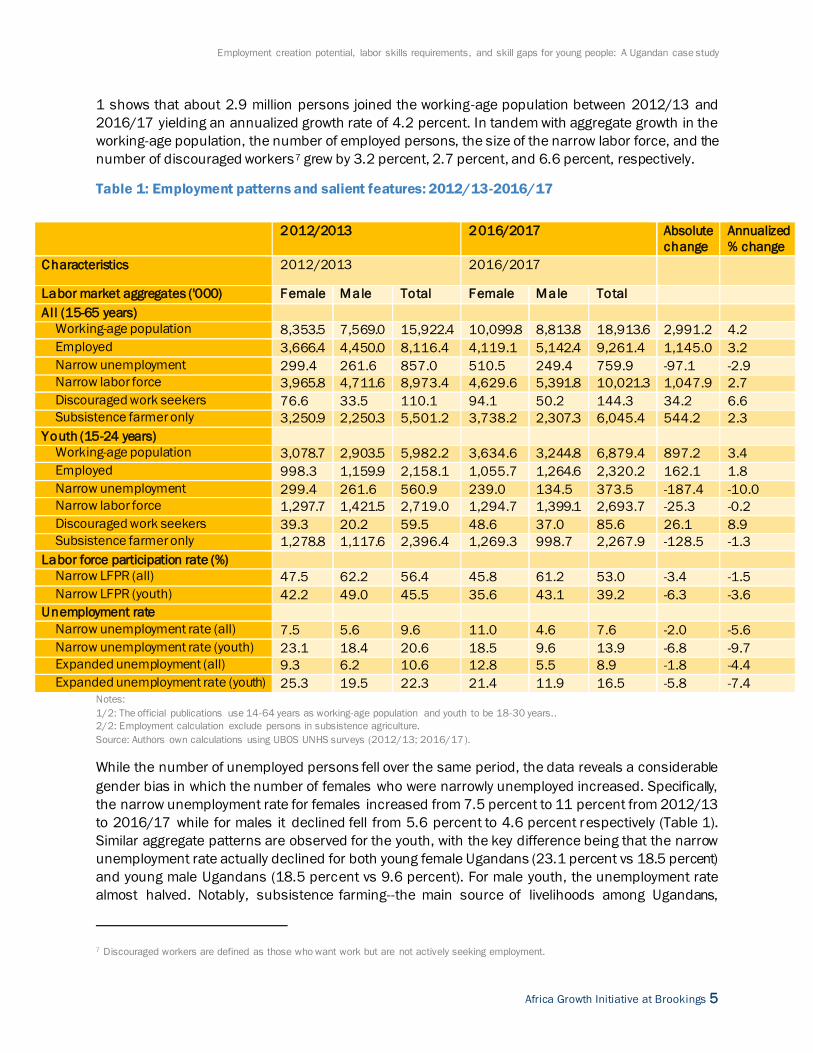
1 shows that about 2.9 million persons joined the working-age population between 2012/13 and
2016/17 yielding an annualized growth rate of 4.2 percent. In tandem with aggregate growth in the
working-age population, the number of employed persons, the size of the narrow labor force, and the
number of discouraged workers7 grew by 3.2 percent, 2.7 percent, and 6.6 percent, respectively.
Table 1: Employment patterns and salient features: 2012/13-2016/17
Notes:
1/2: The official publications use 14-64 years as working-age population and youth to be 18-30 years..
2/2: Employment calculation exclude persons in subsistence agriculture.
Source: Authors own calculations using UBOS UNHS surveys (2012/13; 2016/17).
While the number of unemployed persons fell over the same period, the data reveals a considerable
gender bias in which the number of females who were narrowly unemployed increased. Specifically,
the narrow unemployment rate for females increased from 7.5 percent to 11 percent from 2012/13
to 2016/17 while for males it declined fell from 5.6 percent to 4.6 percent respectively (Table 1).
Similar aggregate patterns are observed for the youth, with the key difference being that the narrow
unemployment rate actually declined for both young female Ugandans (23.1 percent vs 18.5 percent)
and young male Ugandans (18.5 percent vs 9.6 percent). For male youth, the unemployment rate
almost halved. Notably, subsistence farming--the main source of livelihoods among Ugandans,
7 Discouraged workers are defined as those who want work but are not actively seeking employment.
2012/2013 2016/2017 Absolute
change
Annualized
% change
Characteristics 2012/2013 2016/2017
Labor market aggregates ('000) Female Male Total Female Male Total
All (15-65 years)
Working-age population 8,353.5 7,569.0 15,922.4 10,099.8 8,813.8 18,913.6 2,991.2 4.2
Employed 3,666.4 4,450.0 8,116.4 4,119.1 5,142.4 9,261.4 1,145.0 3.2
Narrow unemployment 299.4 261.6 857.0 510.5 249.4 759.9 -97.1 -2.9
Narrow labor force 3,965.8 4,711.6 8,973.4 4,629.6 5,391.8 10,021.3 1,047.9 2.7
Discouraged work seekers 76.6 33.5 110.1 94.1 50.2 144.3 34.2 6.6
Subsistence farmer only 3,250.9 2,250.3 5,501.2 3,738.2 2,307.3 6,045.4 544.2 2.3
Youth (15-24 years)
Working-age population 3,078.7 2,903.5 5,982.2 3,634.6 3,244.8 6,879.4 897.2 3.4
Employed 998.3 1,159.9 2,158.1 1,055.7 1,264.6 2,320.2 162.1 1.8
Narrow unemployment 299.4 261.6 560.9 239.0 134.5 373.5 -187.4 -10.0
Narrow labor force 1,297.7 1,421.5 2,719.0 1,294.7 1,399.1 2,693.7 -25.3 -0.2
Discouraged work seekers 39.3 20.2 59.5 48.6 37.0 85.6 26.1 8.9
Subsistence farmer only 1,278.8 1,117.6 2,396.4 1,269.3 998.7 2,267.9 -128.5 -1.3
Labor force participation rate (%)
Narrow LFPR (all) 47.5 62.2 56.4 45.8 61.2 53.0 -3.4 -1.5
Narrow LFPR (youth) 42.2 49.0 45.5 35.6 43.1 39.2 -6.3 -3.6
Unemployment rate
Narrow unemployment rate (all) 7.5 5.6 9.6 11.0 4.6 7.6 -2.0 -5.6
Narrow unemployment rate (youth) 23.1 18.4 20.6 18.5 9.6 13.9 -6.8 -9.7
Expanded unemployment (all) 9.3 6.2 10.6 12.8 5.5 8.9 -1.8 -4.4
Expanded unemployment rate (youth) 25.3 19.5 22.3 21.4 11.9 16.5 -5.8 -7.4
Industries without smokestacks
6 Africa Growth Initiative at Brookings
especially women--grew by 2.3 percent. Among the youth, however, the number engaged in substance
farming declined, likely because this occupation is increasingly considered unbecoming for youth and
many are joining lower-end services sectors such as boda-boda businesses as riders and street
vendors.
Table 1 also shows that for the working-age population the (narrow) labor force participation rate
(LFPR)8 declined 3.4 percentage points translating into negative annualized growth rate of 1.5 percent.
The reduction was mainly driven by the decline in LFPR for the youth. Notably, the LFPR has remained
high for males despite females being the majority in the working-age population: In 2012/13, the LFPR
for females was 47.5 percent, while for males it was 62.2 percent. In 2016/17 it was 45.8 percent
and 61.2 percent for females and males, respectively. The decline was much observable among young
females (42.2 percent to 35.6) than young males (49.0 percent to 43.1 percent) over the same time
period.
Overall, Table 1 reveals that Uganda’s working-age population is growing rapidly, and the rate of entry
for women into the workforce has accelerated. However, the share of females actively employed in
2016/17 was less than half of the total female working-age group. While unemployment rates have
declined considerably (for both the working-age population and Uganda’s youth specifically), the
annualized growth rate of discouraged workers—in which a potential worker would like to work but is
unable to secure a job and so has given up in the process—is extremely high and more acute among
Uganda’s youth.
3.3 A brief background on Uganda’s major IWOSS sectors
Before considering employment in IWOSS and non-IWOSS sectors, this section aims at providing some
sector specific background on the three IWOSS activities under scrutiny in this study: tourism, agro-
processing, and horticulture.
1.3.1 Tourism
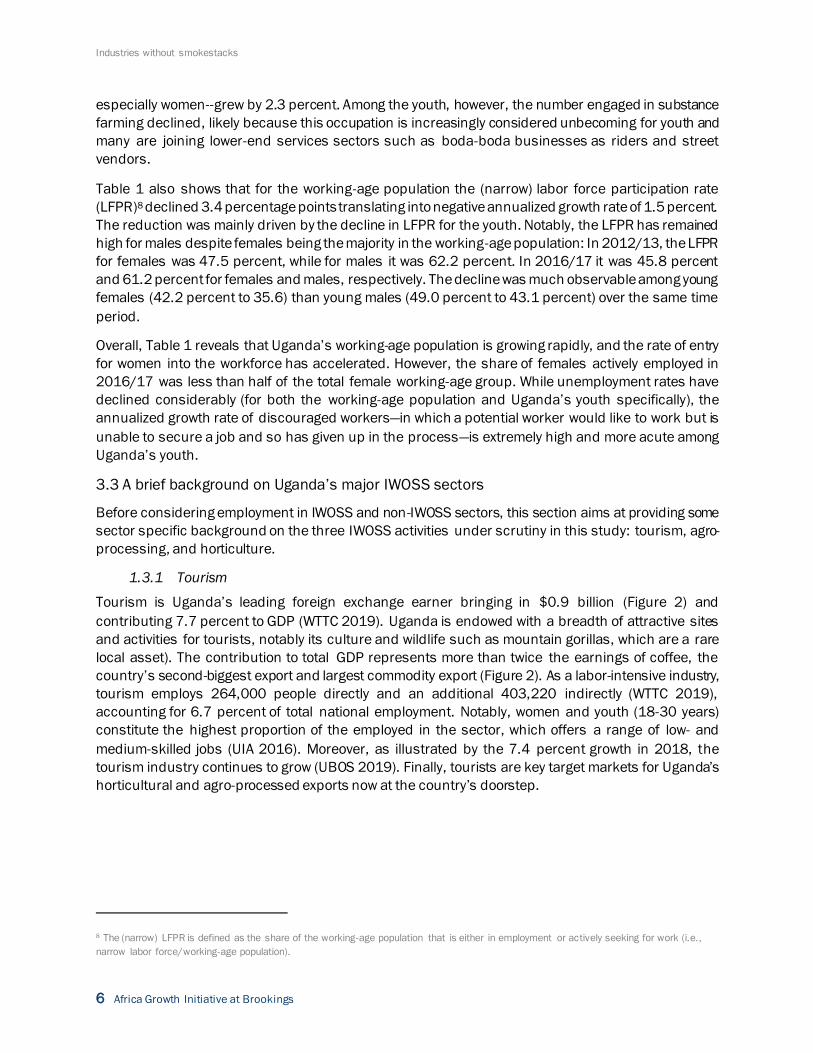
Tourism is Uganda’s leading foreign exchange earner bringing in $0.9 billion (Figure 2) and
contributing 7.7 percent to GDP (WTTC 2019). Uganda is endowed with a breadth of attractive sites
and activities for tourists, notably its culture and wildlife such as mountain gorillas, which are a rare
local asset). The contribution to total GDP represents more than twice the earnings of coffee, the
country’s second-biggest export and largest commodity export (Figure 2). As a labor-intensive industry,
tourism employs 264,000 people directly and an additional 403,220 indirectly (WTTC 2019),
accounting for 6.7 percent of total national employment. Notably, women and youth (18-30 years)
constitute the highest proportion of the employed in the sector, which offers a range of low- and
medium-skilled jobs (UIA 2016). Moreover, as illustrated by the 7.4 percent growth in 2018, the
tourism industry continues to grow (UBOS 2019). Finally, tourists are key target markets for Uganda’s
horticultural and agro-processed exports now at the country’s doorstep.
8 The (narrow) LFPR is defined as the share of the working-age population that is either in employment or actively seeking for work (i.e.,
narrow labor force/working-age population).
Employment creation potential, labor skills requirements, and skill gaps for young people: A Ugandan case study
Africa Growth Initiative at Brookings 7
Figure 2: Uganda’s tourism performance: 2000-2017
Source: World Development Indicators (World Bank, 2019), UnComtrade, (2019).
1.3.2 Agro-processing
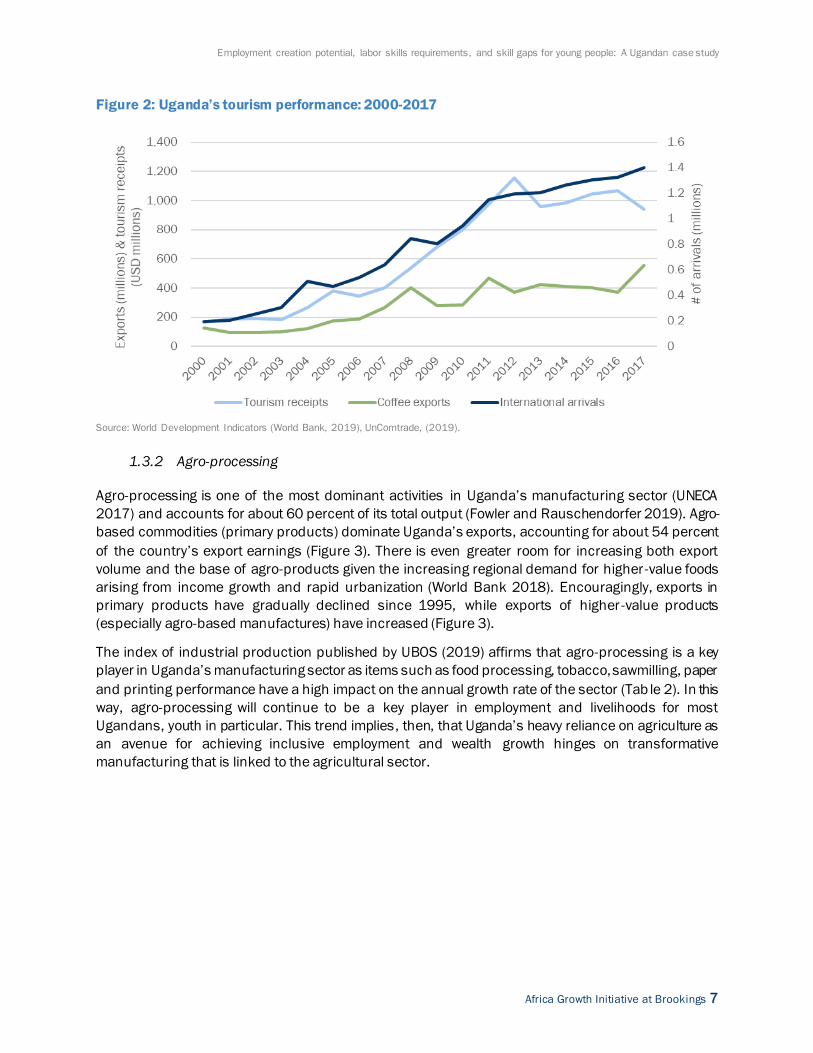
Agro-processing is one of the most dominant activities in Uganda’s manufacturing sector (UNECA
2017) and accounts for about 60 percent of its total output (Fowler and Rauschendorfer 2019). Agro-
based commodities (primary products) dominate Uganda’s exports, accounting for about 54 percent
of the country’s export earnings (Figure 3). There is even greater room for increasing both export
volume and the base of agro-products given the increasing regional demand for higher-value foods
arising from income growth and rapid urbanization (World Bank 2018). Encouragingly, exports in
primary products have gradually declined since 1995, while exports of higher -value products
(especially agro-based manufactures) have increased (Figure 3).
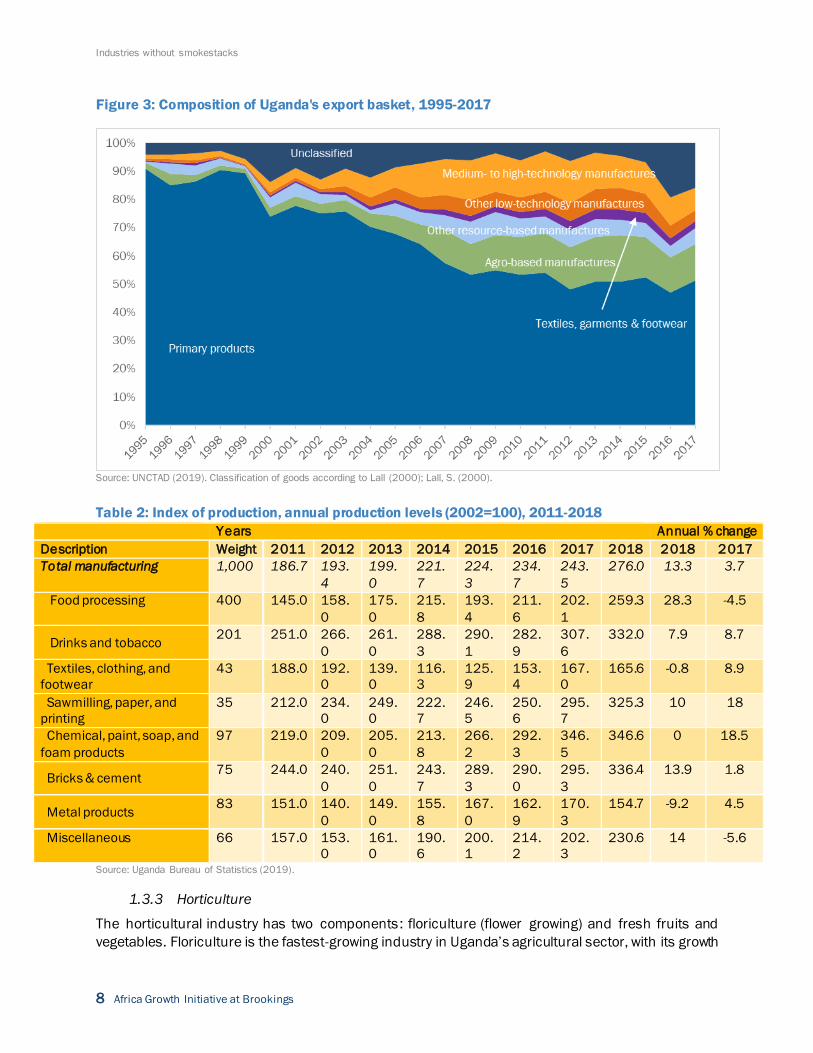
The index of industrial production published by UBOS (2019) affirms that agro-processing is a key
player in Uganda’s manufacturing sector as items such as food processing, tobacco, sawmilling, paper
and printing performance have a high impact on the annual growth rate of the sector (Tab le 2). In this
way, agro-processing will continue to be a key player in employment and livelihoods for most
Ugandans, youth in particular. This trend implies, then, that Uganda’s heavy reliance on agriculture as
an avenue for achieving inclusive employment and wealth growth hinges on transformative
manufacturing that is linked to the agricultural sector.
Industries without smokestacks
8 Africa Growth Initiative at Brookings
Figure 3: Composition of Uganda's export basket, 1995-2017
Source: UNCTAD (2019). Classification of goods according to Lall (2000); Lall, S. (2000).
Table 2: Index of production, annual production levels (2002=100), 2011-2018
Years Annual % change
Description Weight 2011 2012 2013 2014 2015 2016 2017 2018 2018 2017
Total manufacturing 1,000 186.7 193.
4
199.
0
221.
7
224.
3
234.
7
243.
5
276.0 13.3 3.7
Food processing 400 145.0 158.
0
175.
0
215.
8
193.
4
211.
6
202.
1
259.3 28.3 -4.5
Drinks and tobacco 201 251.0 266.
0
261.
0
288.
3
290.
1
282.
9
307.
6
332.0 7.9 8.7
Textiles, clothing, and
footwear
43 188.0 192.
0
139.
0
116.
3
125.
9
153.
4
167.
0
165.6 -0.8 8.9
Sawmilling, paper, and
printing
35 212.0 234.
0
249.
0
222.
7
246.
5
250.
6
295.
7
325.3 10 18
Chemical, paint, soap, and
foam products
97 219.0 209.
0
205.
0
213.
8
266.
2
292.
3
346.
5
346.6 0 18.5
Bricks & cement 75 244.0 240.
0
251.
0
243.
7
289.
3
290.
0
295.
3
336.4 13.9 1.8
Metal products 83 151.0 140.
0
149.
0
155.
8
167.
0
162.
9
170.
3
154.7 -9.2 4.5
Miscellaneous 66 157.0 153.
0
161.
0
190.
6
200.
1
214.
2
202.
3
230.6 14 -5.6
Source: Uganda Bureau of Statistics (2019).
1.3.3 Horticulture
The horticultural industry has two components: floriculture (flower growing) and fresh fruits and
vegetables. Floriculture is the fastest-growing industry in Uganda’s agricultural sector, with its growth
Employment creation potential, labor skills requirements, and skill gaps for young people: A Ugandan case study
Africa Growth Initiative at Brookings 9
attributed to a suitable climate for growing profitable chrysanthemums flowers.9 In fact, floricultural
products have become Uganda’s six-biggest non-traditional export after gold, coffee, fish, maize, beans
and tea, earning the country approximately $61 million in foreign exchange in 2018 (UBOS 2019).
According to the available information, Uganda is the fifth-largest exporter of cut flowers on the
continent (Cunningham, 2007). Uganda’s floriculture sub-sector largely produces cut flowers (roses)
and cuttings, which are almost exclusively grown for export markets. Flower exports rose from 1,150
metric tons in 1995 to 7,000 metric tons in 2015 and 7,500 metric tons in 2018. As a result, earnings
from flower exports have steadily grown from $2.3 million (8.4 billion Ugandan shillings, or UGX) to
$40 million (UGX 147 billion) and $55 million (UGX 202.8 billion), respectively. In addition, there has
been a tremendous increase in the number of people employed in floriculture from 4,000 workers in
2001 to 7,000 workers in 2011 (Evers et al. 2014) to over 9,000, mostly rural, workers. 10 The majority
of workers employed by the flower farms are unskilled and women account for up to 70 percent with
an estimated 60,000 individuals benefitting directly or indirectly (Flower Association, 2020; NAPE
2012)—indicating that the industry is capable of absorbing a large portion of unskilled and semi-skilled
workers. Moreover, currently, around 70 percent of all workers in the sector are women.
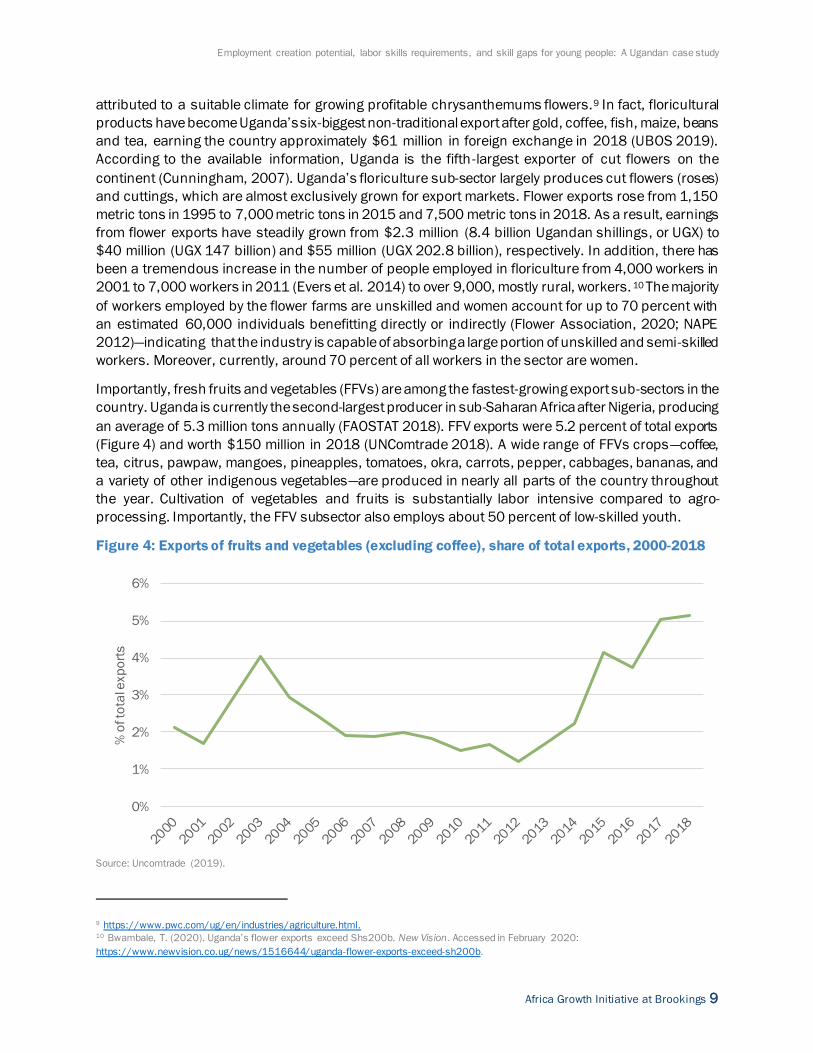
Importantly, fresh fruits and vegetables (FFVs) are among the fastest-growing export sub-sectors in the
country. Uganda is currently the second-largest producer in sub-Saharan Africa after Nigeria, producing
an average of 5.3 million tons annually (FAOSTAT 2018). FFV exports were 5.2 percent of total exports
(Figure 4) and worth $150 million in 2018 (UNComtrade 2018). A wide range of FFVs crops—coffee,
tea, citrus, pawpaw, mangoes, pineapples, tomatoes, okra, carrots, pepper, cabbages, bananas, and
a variety of other indigenous vegetables—are produced in nearly all parts of the country throughout
the year. Cultivation of vegetables and fruits is substantially labor intensive compared to agro-
processing. Importantly, the FFV subsector also employs about 50 percent of low-skilled youth.
Figure 4: Exports of fruits and vegetables (excluding coffee), share of total exports, 2000-2018
Source: Uncomtrade (2019).
9 https://www.pwc.com/ug/en/industries/agriculture.html. 10 Bwambale, T. (2020). Uganda’s flower exports exceed Shs200b. New Vision. Accessed in February 2020:
https://www.newvision.co.ug/news/1516644/uganda-flower-exports-exceed-sh200b.
0%
1%
2%
3%
4%
5%
6%
% o
f to
tal e
xp
ort
s
Industries without smokestacks
10 Africa Growth Initiative at Brookings
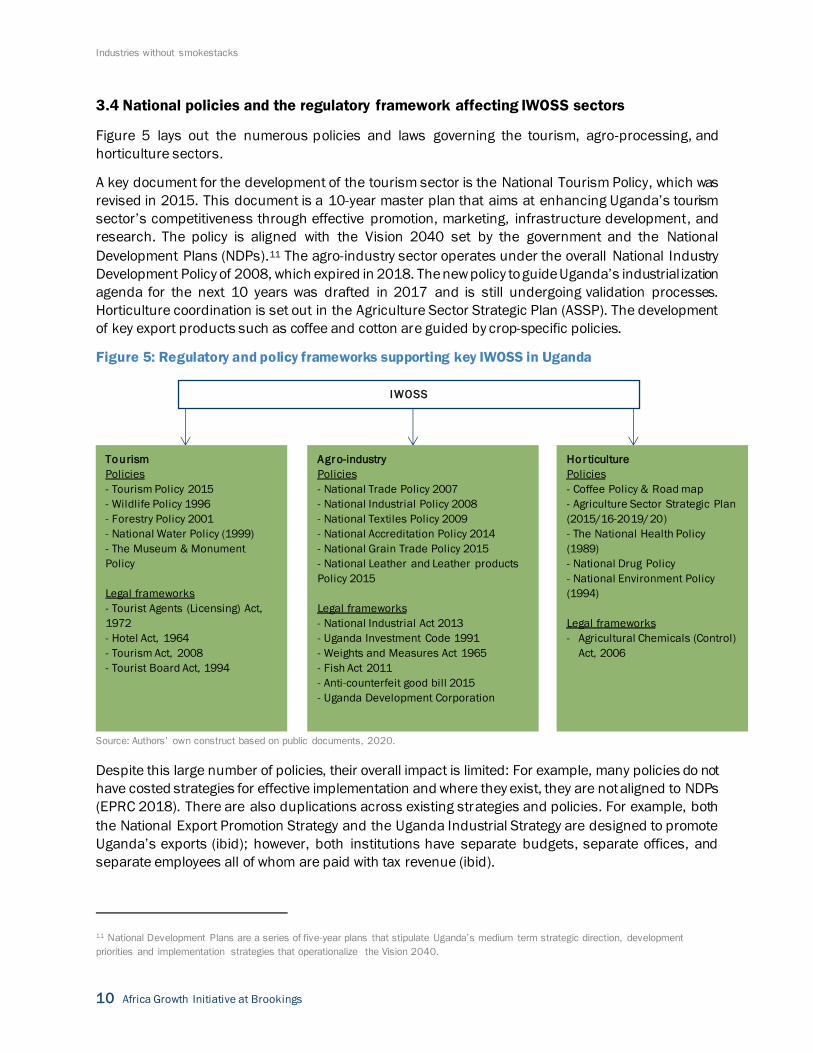
3.4 National policies and the regulatory framework affecting IWOSS sectors
Figure 5 lays out the numerous policies and laws governing the tourism, agro-processing, and
horticulture sectors.
A key document for the development of the tourism sector is the National Tourism Policy, which was
revised in 2015. This document is a 10-year master plan that aims at enhancing Uganda’s tourism
sector’s competitiveness through effective promotion, marketing, infrastructure development, and
research. The policy is aligned with the Vision 2040 set by the government and the National
Development Plans (NDPs).11 The agro-industry sector operates under the overall National Industry
Development Policy of 2008, which expired in 2018. The new policy to guide Uganda’s industrial ization
agenda for the next 10 years was drafted in 2017 and is still undergoing validation processes.
Horticulture coordination is set out in the Agriculture Sector Strategic Plan (ASSP). The development
of key export products such as coffee and cotton are guided by crop-specific policies.
Figure 5: Regulatory and policy frameworks supporting key IWOSS in Uganda
Source: Authors’ own construct based on public documents, 2020.
Despite this large number of policies, their overall impact is limited: For example, many policies do not
have costed strategies for effective implementation and where they exist, they are not aligned to NDPs
(EPRC 2018). There are also duplications across existing strategies and policies. For example, both
the National Export Promotion Strategy and the Uganda Industrial Strategy are designed to promote
Uganda’s exports (ibid); however, both institutions have separate budgets, separate offices, and
separate employees all of whom are paid with tax revenue (ibid).
11 National Development Plans are a series of five-year plans that stipulate Uganda’s medium term strategic direction, development
priorities and implementation strategies that operationalize the Vision 2040.
IWOSS
Tourism
Policies
- Tourism Policy 2015
- Wildlife Policy 1996
- Forestry Policy 2001
- National Water Policy (1999)
- The Museum & Monument
Policy
Legal frameworks
- Tourist Agents (Licensing) Act,
1972
- Hotel Act, 1964
- Tourism Act, 2008
- Tourist Board Act, 1994
Hor ticulture
Policies
- Coffee Policy & Road map
- Agriculture Sector Strategic Plan
(2015/16-2019/20)
- The National Health Policy
(1989)
- National Drug Policy
- National Environment Policy
(1994)
Legal frameworks
- Agricultural Chemicals (Control)
Act, 2006
Agr o-industry
Policies
- National Trade Policy 2007
- National Industrial Policy 2008
- National Textiles Policy 2009
- National Accreditation Policy 2014
- National Grain Trade Policy 2015
- National Leather and Leather products
Policy 2015
Legal frameworks
- National Industrial Act 2013
- Uganda Investment Code 1991
- Weights and Measures Act 1965
- Fish Act 2011
- Anti-counterfeit good bill 2015
- Uganda Development Corporation
Employment creation potential, labor skills requirements, and skill gaps for young people: A Ugandan case study
Africa Growth Initiative at Brookings 11
4. Patterns of growth and structural transformation: The role
of IWOSS
This section builds on the previous analysis and further expands the discussion beyond tourism, agro-
processing, and horticulture to cover the entire spectrum of other IWOSS sectors, manufacturing, and
non-IWOSS sectors. Section 4.1 first provides a snapshot of industry-level employment between
2012/13 and 2016/17. Section 4.2 provides a discussion on sectoral contribution to GDP,
employment elasticities, and export performance. Finally, Section 4.3 analyzes correlates within sector
changes in productivity and employment growth.
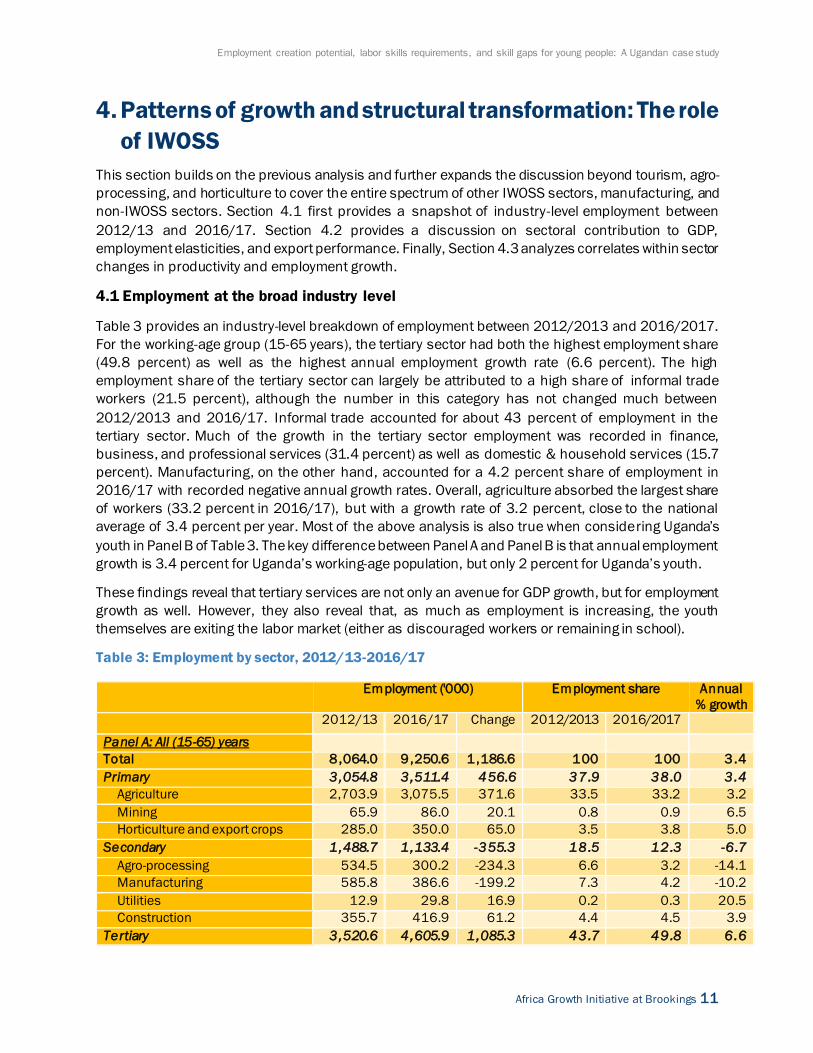
4.1 Employment at the broad industry level
Table 3 provides an industry-level breakdown of employment between 2012/2013 and 2016/2017.
For the working-age group (15-65 years), the tertiary sector had both the highest employment share
(49.8 percent) as well as the highest annual employment growth rate (6.6 percent). The high
employment share of the tertiary sector can largely be attributed to a high share of informal trade
workers (21.5 percent), although the number in this category has not changed much between
2012/2013 and 2016/17. Informal trade accounted for about 43 percent of employment in the
tertiary sector. Much of the growth in the tertiary sector employment was recorded in finance,
business, and professional services (31.4 percent) as well as domestic & household services (15.7
percent). Manufacturing, on the other hand, accounted for a 4.2 percent share of employment in
2016/17 with recorded negative annual growth rates. Overall, agriculture absorbed the largest share
of workers (33.2 percent in 2016/17), but with a growth rate of 3.2 percent, close to the national
average of 3.4 percent per year. Most of the above analysis is also true when considering Uganda’s
youth in Panel B of Table 3. The key difference between Panel A and Panel B is that annual employment
growth is 3.4 percent for Uganda’s working-age population, but only 2 percent for Uganda’s youth.
These findings reveal that tertiary services are not only an avenue for GDP growth, but for employment
growth as well. However, they also reveal that, as much as employment is increasing, the youth
themselves are exiting the labor market (either as discouraged workers or remaining in school).
Table 3: Employment by sector, 2012/13-2016/17
Employment ('000) Employment share Annual
% growth 2012/13 2016/17 Change 2012/2013 2016/2017
Panel A: All (15-65) years
Total 8 ,064.0 9 ,250.6 1 ,186.6 100 100 3.4
Primary 3,054.8 3 ,511.4 456.6 37.9 38.0 3.4
Agriculture 2,703.9 3,075.5 371.6 33.5 33.2 3.2
Mining 65.9 86.0 20.1 0.8 0.9 6.5
Horticulture and export crops 285.0 350.0 65.0 3.5 3.8 5.0
Secondary 1,488.7 1 ,133.4 -355.3 18.5 12.3 -6 .7
Agro-processing 534.5 300.2 -234.3 6.6 3.2 -14.1
Manufacturing 585.8 386.6 -199.2 7.3 4.2 -10.2
Utilities 12.9 29.8 16.9 0.2 0.3 20.5
Construction 355.7 416.9 61.2 4.4 4.5 3.9
Tertiary 3,520.6 4 ,605.9 1 ,085.3 43.7 49.8 6.6
Industries without smokestacks
12 Africa Growth Initiative at Brookings
ICT 35.9 39.2 3.3 0.4 0.4 2.2
Tourism 260.3 355.3 95.0 3.2 3.8 7.6
Trade formal (excl. tourism) 60.6 1.3 -59.3 0.8 0.0 -94.1
Trade informal (excl. tourism) 1,638.9 1,987.5 348.6 20.3 21.5 4.7
Transport 305.8 500.2 194.4 3.8 5.4 12.0
Maintenance and repairs 113.4 112.7 -0.7 1.4 1.2 -0.2
Finance, business, and professional services
120.6 435.3 314.7 1.5 4.7 31.4
Domestic and household services 97.7 185.2 87.5 1.2 2.0 15.7
Government 546.1 600.2 54.1 6.8 6.5 2.3
Other services 341.7 389.8 48.1 4.2 4.2 3.2
Panel B: Youth (15-24 years)
Overall total 2 ,140.0 2 ,317.8 177.8 100 100 2.0
Primary 938.4 1 ,019.8 81.4 43.9 44.0 2.0
Agriculture 805.4 882.5 77.1 37.6 38.1 2.2
Mining 22.5 28.0 5.5 1.1 1.2 5.4
Horticulture and export crops 110.6 109.4 -1.2 5.2 4.7 -0.3
Secondary 376.6 265.5 -111.1 17.6 11.5 -8 .6
Agro-processing 115.4 54.7 -60.7 5.4 2.4 -18.3
Manufacturing 162.5 109.6 -52.9 7.6 4.7 -9.6
Utilities 6.0 6.5 0.5 0.3 0.3 2.0
Construction 92.8 94.8 2.0 4.3 4.1 0.5
Tertiary 825.1 1 ,032.7 207.6 38.6 44.6 5.5
ICT 7.2 7.8 0.6 0.3 0.3 2.0
Tourism 74.8 110.6 35.8 3.5 4.8 9.6
Trade formal (excl. tourism) 8.5 0.7 -7.8 0.4 0.0 -61.1
Trade informal (excl. tourism) 368.9 384.7 15.8 17.2 16.6 1.0
Transport 70.0 99.1 29.1 3.3 4.3 8.5
Maintenance and repairs 35.5 37.4 1.9 1.7 1.6 1.3
Finance, business, and professional services
18.0 77.3 59.3 0.8 3.3 35.7
Domestic and household services 52.3 109.7 57.4 2.4 4.7 18.1
Government 78.2 94.2 16.0 3.7 4.1 4.6
Other services 112.0 111.6 -0.4 5.2 4.8 -0.1
Notes:
1/4: Estimates for 2016/17- Trade formal (excl. tourism) did not control for enterprises that submit VAT due to the variable not being
captured in the survey tool.
2/4: Employment calculations for agriculture exclude persons in subsistence agriculture
3/4: CVs are high for formal trade.
4/4: Inconsistencies in employment data arise due to some respondents indicating that they were employed but did not indicate the sector
of employment.
Source: Authors’ own calculations using UBOS UNHS surveys (2012/13; 2016/17).
4.2 Productivity, employment, and export growth in Uganda’s IWOSS, non-IWOSS, and
manufacturing sectors
This section considers key indicators of interest regarding the transformative potential of IWOSS and
non-IWOSS activities. The approach, taken directly, compares indicators such as labor productivity,
employment, and employment elasticities as well as export performance in IWOSS sectors with those
of non-IWOSS activities. Manufacturing, a sector that shares key properties with IWOSS activities, is
considered as a separate category.
Employment creation potential, labor skills requirements, and skill gaps for young people: A Ugandan case study
Africa Growth Initiative at Brookings 13
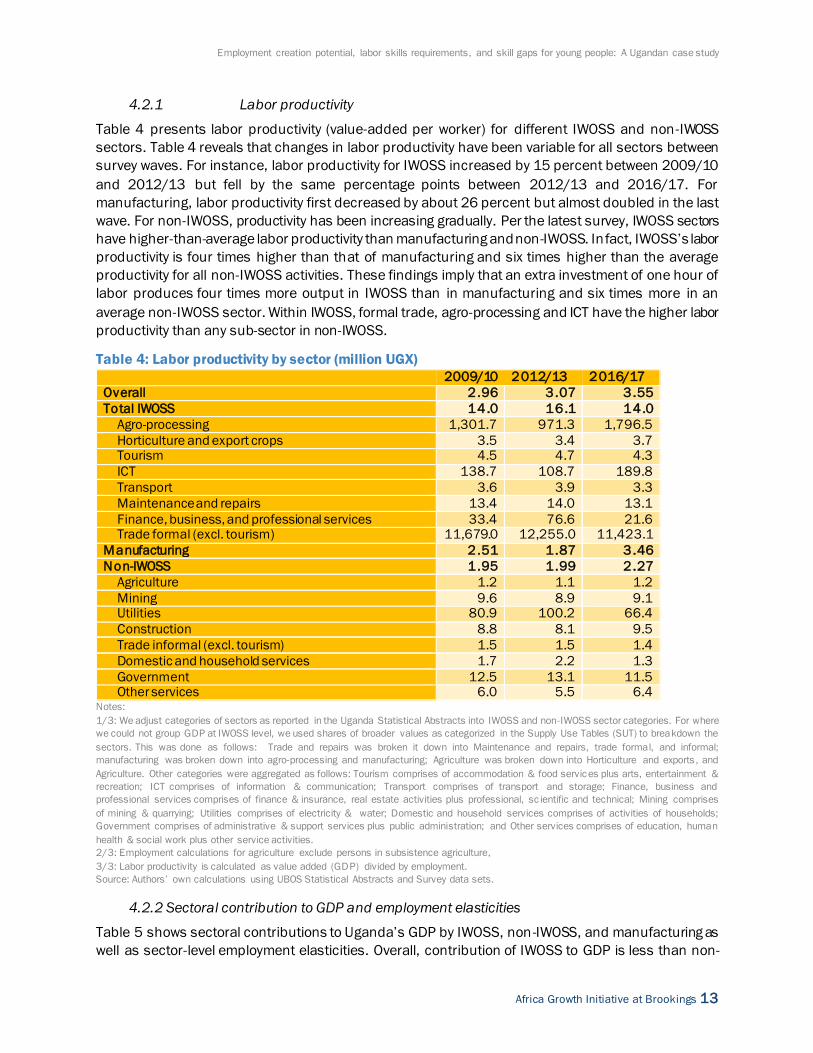
4.2.1 Labor productivity
Table 4 presents labor productivity (value-added per worker) for different IWOSS and non-IWOSS
sectors. Table 4 reveals that changes in labor productivity have been variable for all sectors between
survey waves. For instance, labor productivity for IWOSS increased by 15 percent between 2009/10
and 2012/13 but fell by the same percentage points between 2012/13 and 2016/17. For
manufacturing, labor productivity first decreased by about 26 percent but almost doubled in the last
wave. For non-IWOSS, productivity has been increasing gradually. Per the latest survey, IWOSS sectors
have higher-than-average labor productivity than manufacturing and non-IWOSS. In fact, IWOSS’s labor
productivity is four times higher than that of manufacturing and six times higher than the average
productivity for all non-IWOSS activities. These findings imply that an extra investment of one hour of
labor produces four times more output in IWOSS than in manufacturing and six times more in an
average non-IWOSS sector. Within IWOSS, formal trade, agro-processing and ICT have the higher labor
productivity than any sub-sector in non-IWOSS.
Table 4: Labor productivity by sector (million UGX)
2009/10 2012/13 2016/17
Overall 2 .96 3.07 3.55
Total IWOSS 14.0 16.1 14.0
Agro-processing 1,301.7 971.3 1,796.5
Horticulture and export crops 3.5 3.4 3.7 Tourism 4.5 4.7 4.3
ICT 138.7 108.7 189.8
Transport 3.6 3.9 3.3
Maintenance and repairs 13.4 14.0 13.1
Finance, business, and professional services 33.4 76.6 21.6 Trade formal (excl. tourism) 11,679.0 12,255.0 11,423.1
Manufacturing 2.51 1.87 3.46
Non-IWOSS 1.95 1.99 2.27
Agriculture 1.2 1.1 1.2
Mining 9.6 8.9 9.1 Utilities 80.9 100.2 66.4
Construction 8.8 8.1 9.5
Trade informal (excl. tourism) 1.5 1.5 1.4
Domestic and household services 1.7 2.2 1.3
Government 12.5 13.1 11.5 Other services 6.0 5.5 6.4
Notes:
1/3: We adjust categories of sectors as reported in the Uganda Statistical Abstracts into IWOSS and non-IWOSS sector categories. For where
we could not group GDP at IWOSS level, we used shares of broader values as categorized in the Supply Use Tables (SUT) to breakdown the
sectors. This was done as follows: Trade and repairs was broken it down into Maintenance and repairs, trade formal, and informal;
manufacturing was broken down into agro-processing and manufacturing; Agriculture was broken down into Horticulture and exports , and
Agriculture. Other categories were aggregated as follows: Tourism comprises of accommodation & food services plus arts, entertainment &
recreation; ICT comprises of information & communication; Transport comprises of transport and storage; Finance, business and
professional services comprises of finance & insurance, real estate activities plus professional, sc ientific and technical; Mining comprises
of mining & quarrying; Utilities comprises of electricity & water; Domestic and household services comprises of activities of households;
Government comprises of administrative & support services plus public administration; and Other services comprises of education, human
health & social work plus other service activities.
2/3: Employment calculations for agriculture exclude persons in subsistence agriculture,
3/3: Labor productivity is calculated as value added (GDP) divided by employment.
Source: Authors’ own calculations using UBOS Statistical Abstracts and Survey data sets.
4.2.2 Sectoral contribution to GDP and employment elasticities
Table 5 shows sectoral contributions to Uganda’s GDP by IWOSS, non -IWOSS, and manufacturing as
well as sector-level employment elasticities. Overall, contribution of IWOSS to GDP is less than non-
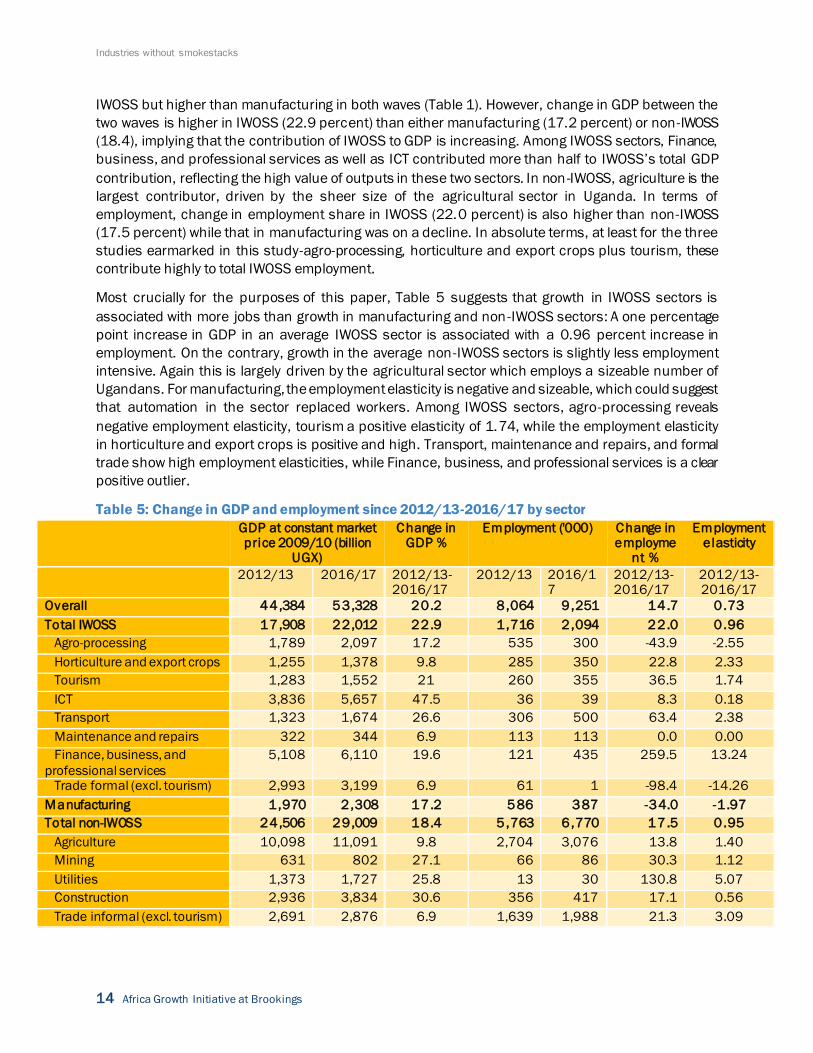
Industries without smokestacks
14 Africa Growth Initiative at Brookings
IWOSS but higher than manufacturing in both waves (Table 1). However, change in GDP between the
two waves is higher in IWOSS (22.9 percent) than either manufacturing (17.2 percent) or non-IWOSS
(18.4), implying that the contribution of IWOSS to GDP is increasing. Among IWOSS sectors, Finance,
business, and professional services as well as ICT contributed more than half to IWOSS’s total GDP
contribution, reflecting the high value of outputs in these two sectors. In non-IWOSS, agriculture is the
largest contributor, driven by the sheer size of the agricultural sector in Uganda. In terms of
employment, change in employment share in IWOSS (22.0 percent) is also higher than non-IWOSS
(17.5 percent) while that in manufacturing was on a decline. In absolute terms, at least for the three
studies earmarked in this study-agro-processing, horticulture and export crops plus tourism, these
contribute highly to total IWOSS employment.
Most crucially for the purposes of this paper, Table 5 suggests that growth in IWOSS sectors is
associated with more jobs than growth in manufacturing and non-IWOSS sectors: A one percentage
point increase in GDP in an average IWOSS sector is associated with a 0.96 percent increase in
employment. On the contrary, growth in the average non-IWOSS sectors is slightly less employment
intensive. Again this is largely driven by the agricultural sector which employs a sizeable number of
Ugandans. For manufacturing, the employment elasticity is negative and sizeable, which could suggest
that automation in the sector replaced workers. Among IWOSS sectors, agro-processing reveals
negative employment elasticity, tourism a positive elasticity of 1.74, while the employment elasticity
in horticulture and export crops is positive and high. Transport, maintenance and repairs, and formal
trade show high employment elasticities, while Finance, business, and professional services is a clear
positive outlier.
Table 5: Change in GDP and employment since 2012/13-2016/17 by sector
GDP at constant market price 2009/10 (billion
UGX)
Change in GDP %
Employment ('000) Change in employme
nt %
Employment elasticity
2012/13 2016/17 2012/13-2016/17
2012/13 2016/17
2012/13-2016/17
2012/13-2016/17
Overall 44,384 53,328 20.2 8,064 9,251 14.7 0.73
Total IWOSS 17,908 22,012 22.9 1,716 2,094 22.0 0.96
Agro-processing 1,789 2,097 17.2 535 300 -43.9 -2.55
Horticulture and export crops 1,255 1,378 9.8 285 350 22.8 2.33
Tourism 1,283 1,552 21 260 355 36.5 1.74
ICT 3,836 5,657 47.5 36 39 8.3 0.18
Transport 1,323 1,674 26.6 306 500 63.4 2.38
Maintenance and repairs 322 344 6.9 113 113 0.0 0.00
Finance, business, and
professional services
5,108 6,110 19.6 121 435 259.5 13.24
Trade formal (excl. tourism) 2,993 3,199 6.9 61 1 -98.4 -14.26
Manufacturing 1,970 2,308 17.2 586 387 -34.0 -1 .97
Total non-IWOSS 24,506 29,009 18.4 5,763 6,770 17.5 0.95
Agriculture 10,098 11,091 9.8 2,704 3,076 13.8 1.40
Mining 631 802 27.1 66 86 30.3 1.12
Utilities 1,373 1,727 25.8 13 30 130.8 5.07
Construction 2,936 3,834 30.6 356 417 17.1 0.56
Trade informal (excl. tourism) 2,691 2,876 6.9 1,639 1,988 21.3 3.09
Employment creation potential, labor skills requirements, and skill gaps for young people: A Ugandan case study
Africa Growth Initiative at Brookings 15
Domestic and household services
235 266 13.2 98 185 88.8 6.73
Government 2,062 2,659 28.9 546 600 9.9 0.34
Other services 4,481 5,753 28.4 342 390 14.0 0.49
Notes:
1/4: We adjust categories of sectors as reported in the Uganda Statistical Abstracts into IWOSS and non-IWOSS sector categories. For where
we could not group GDP at IWOSS level, we used shares of broader values as categorized in the Supply Use Tables (SUT) to breakdown the
sectors. This was done as follows: Trade and repairs was broken it down into Maintenance and repairs, trade formal, and informal;
manufacturing was broken down into agro-processing and manufacturing; Agriculture was broken down into Horticulture and exports, and
Agriculture. Other categories were aggregated as follows: Tourism comprises of accommodation & food services plus arts, entertainment &
recreation; ICT comprises of information & communication; Transport comprises of transport and storage; Finance, business and
professional services comprises of finance & insurance, real estate activities plus professional, scientific and technical; Mining comprises
of mining & quarrying; Utilities comprises of electricity & water; Domestic and household services comprises of activities of households;
Government comprises of administrative & support services plus public administration; and Other services comprises of education, human
health & social work plus other service activities..
2/4: The changes in employment in this table are slightly different from those directly generated from surveys at 4 -digit level as we
recalculated the employment as per the GDP grouping in SUT to ensure consistency.
3/4: The overall GDP excludes taxes on products.
4/4: Elasticity is calculated as percentage change in employment divided by percentage change in GDP
Source: Authors’ own calculations UBOS Statistical Abstracts and Survey data sets
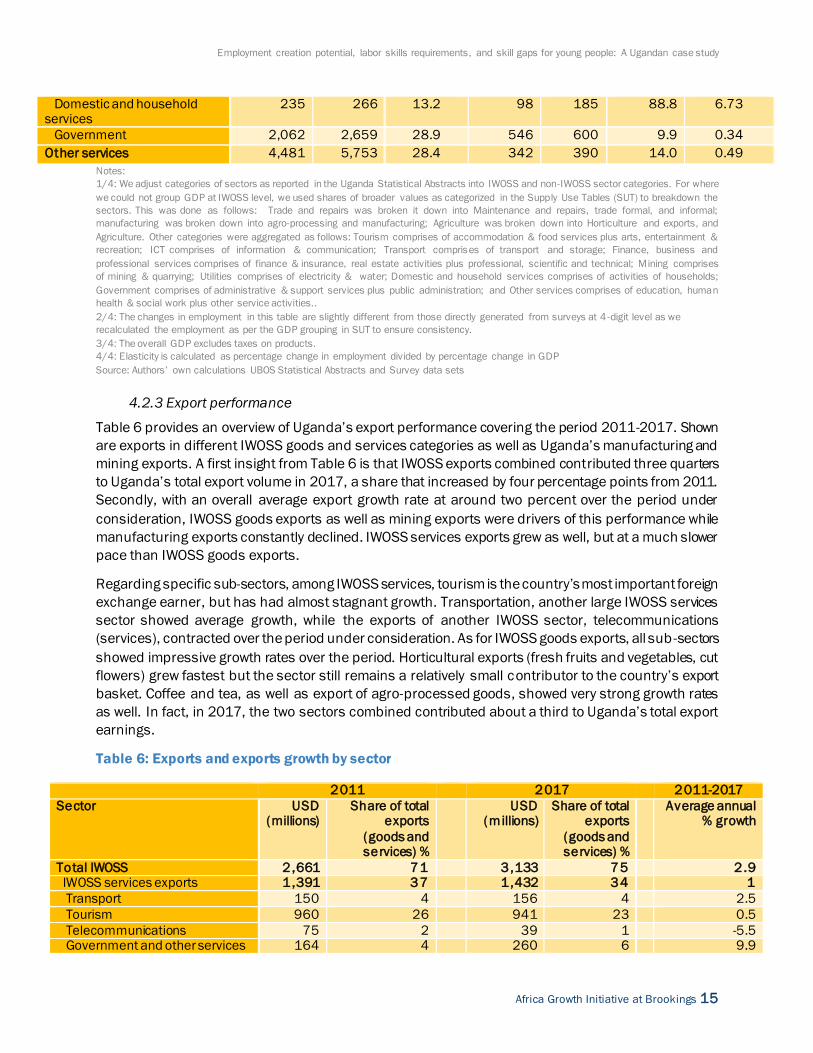
4.2.3 Export performance
Table 6 provides an overview of Uganda’s export performance covering the period 2011-2017. Shown
are exports in different IWOSS goods and services categories as well as Uganda’s manufacturing and
mining exports. A first insight from Table 6 is that IWOSS exports combined contributed three quarters
to Uganda’s total export volume in 2017, a share that increased by four percentage points from 2011.
Secondly, with an overall average export growth rate at around two percent over the period under
consideration, IWOSS goods exports as well as mining exports were drivers of this performance while
manufacturing exports constantly declined. IWOSS services exports grew as well, but at a much slower
pace than IWOSS goods exports.
Regarding specific sub-sectors, among IWOSS services, tourism is the country’s most important foreign
exchange earner, but has had almost stagnant growth. Transportation, another large IWOSS services
sector showed average growth, while the exports of another IWOSS sector, telecommunications
(services), contracted over the period under consideration. As for IWOSS goods exports, all sub-sectors
showed impressive growth rates over the period. Horticultural exports (fresh fruits and vegetables, cut
flowers) grew fastest but the sector still remains a relatively small contributor to the country’s export
basket. Coffee and tea, as well as export of agro-processed goods, showed very strong growth rates
as well. In fact, in 2017, the two sectors combined contributed about a third to Uganda’s total export
earnings.
Table 6: Exports and exports growth by sector
2011 2017 2011-2017
Sector USD (millions)
Share of total exports
(goods and services) %
USD (millions)
Share of total exports
(goods and services) %
Average annual % growth
Total IWOSS 2,661 71
3,133 75
2.9 IWOSS services exports 1,391 37
1,432 34
1
Transport 150 4
156 4
2.5
Tourism 960 26
941 23
0.5
Telecommunications 75 2
39 1
-5.5 Government and other services 164 4
260 6
9.9
Industries without smokestacks
16 Africa Growth Initiative at Brookings
Finance, business, and professional services
43 1
35 1
2.6
IWOSS goods exports 1,270 34
1,702 41
5.8 Horticulture 2 0
8 0
32.2
Coffee and tea 548 15
652 16
4.7
Other agricultural products 247 7
373 9
8
Agro-processing 473 13
669 16
7.1
Manufacturing total 390 10
334 8
-2 .4 Textiles 107 3
73 2
-0.3
Other manufacturing 283 8
261 6
-0.9
Total non-IWOSS 429 11
575 14
6.9
Mining 429 11
575 14
6.9
Total exports (goods and services) 3 ,760 4 ,177 1 .9 Notes:
1/3: Goods exports are identified through the codes of the World Customs Organization’s Harmonized System nomenclature, and services
are classified according to the United Nation’s Extended Balance of Payments Services Classification.
2/3: Tourism includes personal and business travel.
3/3 Total exports (goods and exports) also includes services categories not included in the table (e.g., exports of construction services).
Source: UNComtrade (2020).
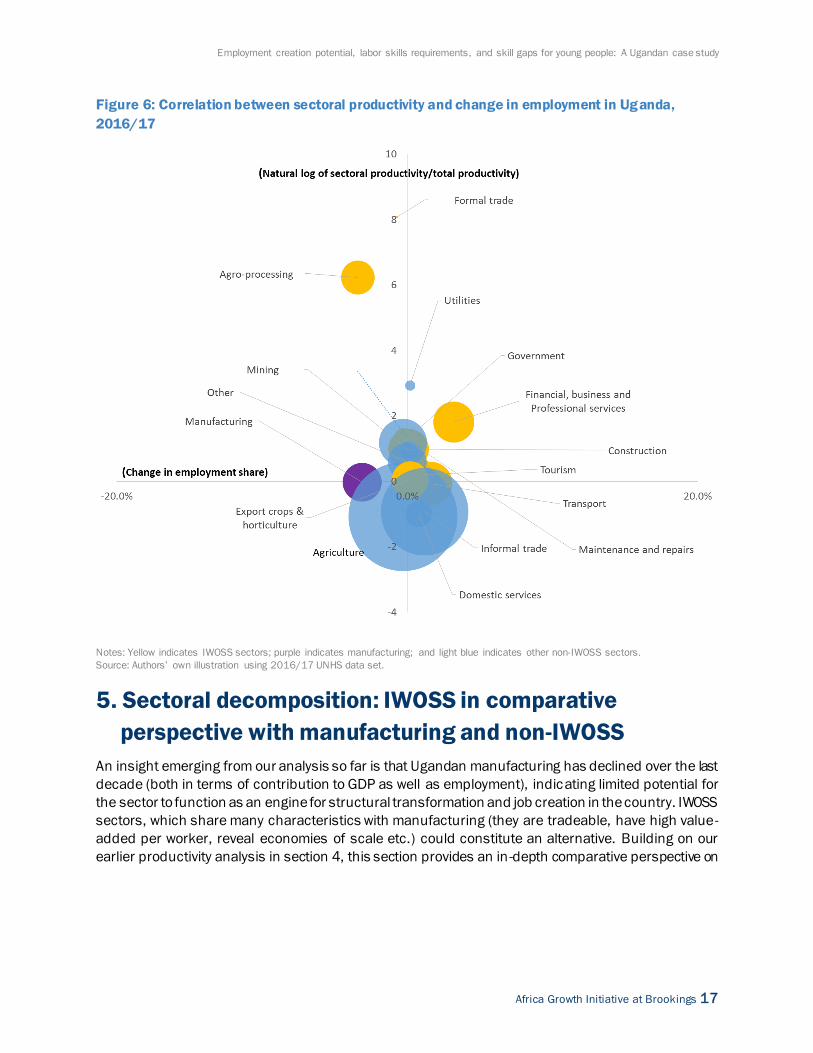
4.3 Sectoral productivity and employment growth: Is there evidence for structural
transformation?
Figure 6 combines GDP/output and employment growth to get a full picture of industry changes over
time. Following the methodology outlined by McMillan and Rodrik (2011), the figure shows the
correlation between the natural log of relative productivity (measured as value added per worker), and
the change in employment by industry for Uganda in 2016/17. The size of the bubble represents the
sector’s share of employment in 2016/17. The desired change over time would be declining shares
of employment in low-productivity sectors (the lower left quadrant) and increased shares of
employment in high productivity sectors (the top right quadrant). However, the only sector that can be
found in this quadrant is Finance, business, and professional services, while construction and tourism
are inconclusive, suggesting that, by and large, little structural transformation has taken place over
the time period under consideration. In other words, there has been no sizeable shift in labor resources
towards high-productivity activities like manufacturing, formal trade, tourism, export crops, and others.
Employment creation potential, labor skills requirements, and skill gaps for young people: A Ugandan case study
Africa Growth Initiative at Brookings 17
Figure 6: Correlation between sectoral productivity and change in employment in Uganda,
2016/17
Notes: Yellow indicates IWOSS sectors; purple indicates manufacturing; and light blue indicates other non-IWOSS sectors.
Source: Authors’ own illustration using 2016/17 UNHS data set.
5. Sectoral decomposition: IWOSS in comparative
perspective with manufacturing and non-IWOSS
An insight emerging from our analysis so far is that Ugandan manufacturing has declined over the last
decade (both in terms of contribution to GDP as well as employment), indicating limited potential for
the sector to function as an engine for structural transformation and job creation in the country. IWOSS
sectors, which share many characteristics with manufacturing (they are tradeable, have high value-
added per worker, reveal economies of scale etc.) could constitute an alternative. Building on our
earlier productivity analysis in section 4, this section provides an in-depth comparative perspective on
Industries without smokestacks
18 Africa Growth Initiative at Brookings
employment in IWOSS and non-IWOSS sectors to explore the potential of IWOSS in driving job creation
and inclusive economic growth in Uganda.12
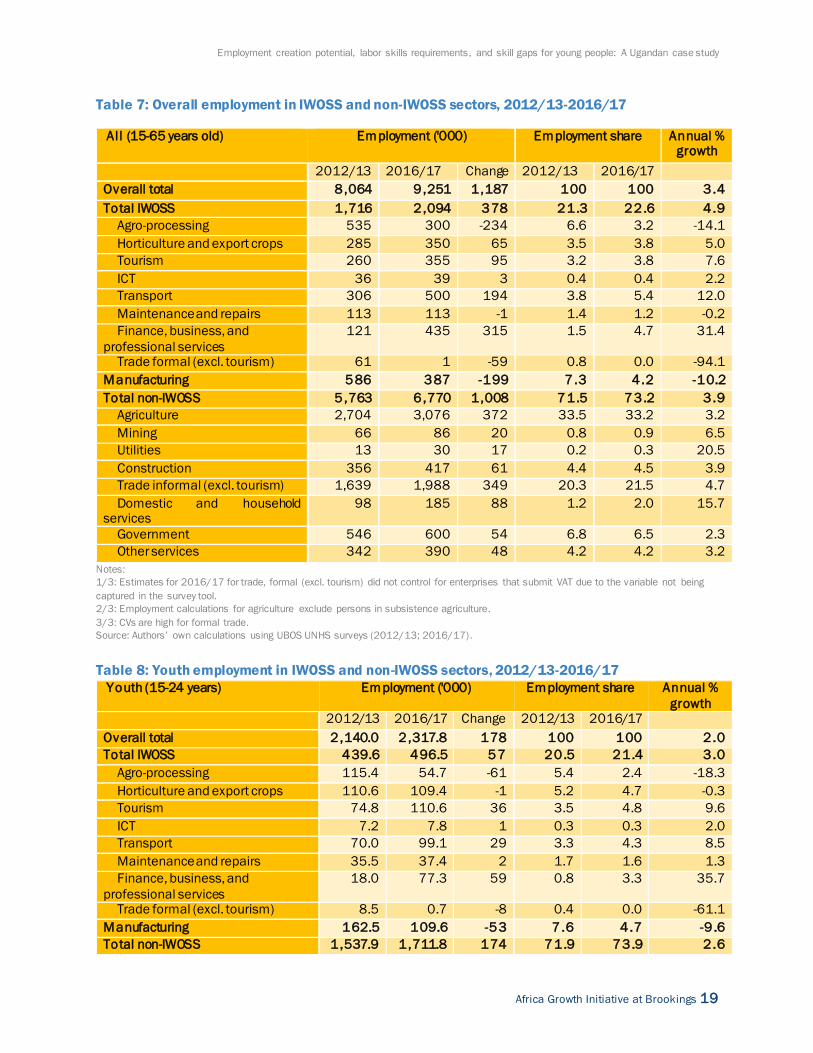
5.1 Employment in IWOSS, manufacturing, and non-IWOSS sectors
Table 7 presents employment figures for the working-age group (15-65 years) in IWOSS,
manufacturing, and non-IWOSS activities. The same analysis is presented for Uganda’s youth (15 –
24 years) in Table 8. The presented analysis includes both formal as well as informal jobs.
Table 7 shows that, in 2016/17, IWOSS sectors employed 22.6 percent of Uganda’s working-age
population, an increase from 2013 by 1.3 percentage points. Within IWOSS, most subsectors (agro-
processing; horticulture and export crops; tourism; transport; and finance, business, and professional
services) employed persons in more or less equal shares. In non-IWOSS sectors, agriculture as well as
informal trade accounted for most jobs (together these two sectors absorb 54.7 percent of all workers
in 2016/17). A key insight from Table 7 is that the importance of the manufacturing sector as an
employer decreased considerably between the two surveys: While in 2012/13 manufacturing
absorbed 7.3 percent of all workers, in 2016/17 this share declined to 4.2 percent, corresponding to
the loss of about 200,000 jobs. At the same time, the importance of informal services (non-IWOSS),
transport services as well as business and financial services (both IWOSS) in providing employment
grew; agro-processing became less important while employment in agriculture grew in line with the
economy-wide average.
In the aggregate, an important finding is that employment in IWOSS sectors grew faster (4.9 percent
annual growth) than the economy-wide average (3.4 percent annual growth) and non-IWOSS (3.9
percent annual growth), suggesting a potential of these sectors to provide employment opportunities—
in line with our above labor elasticity estimates for these activities.
Table 8 shows the same analysis for Uganda’s employed youth (15-24 years). The most salient feature
is that the overall annual employment growth rate is considerably lower for youth than for the working-
age population (2 percent annualized growth versus 3.4 percent), a pattern equally true for
employment growth in IWOSS and non-IWOSS sectors. The decrease in importance of the
manufacturing sector in providing jobs is similar in magnitude to the one presented in Table 7. Again,
in the aggregate, employment growth in IWOSS sectors is higher than both the economy-wide average
and growth in non-IWOSS sectors.
12 The IWOSS sectors include: agro-processing, horticulture and export crops, tourism, ICT, transport, maintenance & repairs, financial &
business services as well as formal trade (excl. tourism). The non-IWOSS sectors include agriculture, mining, utilities, construction, informal
trade (excl. tourism), domestic and household services, government and other services. Manufacturing is listed as a separate activity. To
recap, the sector categorization utilizes the International Standard Industrial Classification (ISIC) of economic activities and applies these
to the Uganda National Household Surveys from 2012/13 and 2016/17.
Employment creation potential, labor skills requirements, and skill gaps for young people: A Ugandan case study
Africa Growth Initiative at Brookings 19
Table 7: Overall employment in IWOSS and non-IWOSS sectors, 2012/13-2016/17
All (15-65 years old) Employment ('000) Employment share Annual % growth
2012/13 2016/17 Change 2012/13 2016/17
Overall total 8 ,064 9,251 1,187 100 100 3.4
Total IWOSS 1,716 2,094 378 21.3 22.6 4.9
Agro-processing 535 300 -234 6.6 3.2 -14.1
Horticulture and export crops 285 350 65 3.5 3.8 5.0
Tourism 260 355 95 3.2 3.8 7.6
ICT 36 39 3 0.4 0.4 2.2
Transport 306 500 194 3.8 5.4 12.0
Maintenance and repairs 113 113 -1 1.4 1.2 -0.2
Finance, business, and
professional services
121 435 315 1.5 4.7 31.4
Trade formal (excl. tourism) 61 1 -59 0.8 0.0 -94.1
Manufacturing 586 387 -199 7.3 4.2 -10.2
Total non-IWOSS 5,763 6,770 1,008 71.5 73.2 3.9
Agriculture 2,704 3,076 372 33.5 33.2 3.2
Mining 66 86 20 0.8 0.9 6.5
Utilities 13 30 17 0.2 0.3 20.5
Construction 356 417 61 4.4 4.5 3.9
Trade informal (excl. tourism) 1,639 1,988 349 20.3 21.5 4.7
Domestic and household services
98 185 88 1.2 2.0 15.7
Government 546 600 54 6.8 6.5 2.3
Other services 342 390 48 4.2 4.2 3.2
Notes:
1/3: Estimates for 2016/17 for trade, formal (excl. tourism) did not control for enterprises that submit VAT due to the variable not being
captured in the survey tool.
2/3: Employment calculations for agriculture exclude persons in subsistence agriculture.
3/3: CVs are high for formal trade. Source: Authors’ own calculations using UBOS UNHS surveys (2012/13; 2016/17).
Table 8: Youth employment in IWOSS and non-IWOSS sectors, 2012/13-2016/17
Youth (15-24 years) Employment ('000) Employment share Annual %
growth 2012/13 2016/17 Change 2012/13 2016/17
Overall total 2 ,140.0 2 ,317.8 178 100 100 2.0
Total IWOSS 439.6 496.5 57 20.5 21.4 3.0
Agro-processing 115.4 54.7 -61 5.4 2.4 -18.3
Horticulture and export crops 110.6 109.4 -1 5.2 4.7 -0.3
Tourism 74.8 110.6 36 3.5 4.8 9.6
ICT 7.2 7.8 1 0.3 0.3 2.0
Transport 70.0 99.1 29 3.3 4.3 8.5
Maintenance and repairs 35.5 37.4 2 1.7 1.6 1.3
Finance, business, and
professional services
18.0 77.3 59 0.8 3.3 35.7
Trade formal (excl. tourism) 8.5 0.7 -8 0.4 0.0 -61.1
Manufacturing 162.5 109.6 -53 7.6 4.7 -9 .6
Total non-IWOSS 1,537.9 1 ,711.8 174 71.9 73.9 2.6
Industries without smokestacks
20 Africa Growth Initiative at Brookings
Agriculture 805.4 882.5 77 37.6 38.1 2.2
Mining 22.5 28.0 6 1.1 1.2 5.4
Utilities 6.0 6.5 1 0.3 0.3 2.0
Construction 92.8 94.8 2 4.3 4.1 0.5
Trade informal (excl. tourism) 368.9 384.7 16 17.2 16.6 1.0
Domestic and household services 52.3 109.7 57 2.4 4.7 18.1
Government 78.2 94.2 16 3.7 4.1 4.6
Other services 112.0 111.6 -0.4 5.2 4.8 -0.1
Notes:
1/3: Estimates for 2016/17- Trade formal (excl. tourism) did not control for enterprises that submit VAT due to the variable not being
captured in the survey tool.
2/3: Employment calculations for agriculture exclude persons in subsistence agriculture.
3/3: CVs are high for formal trade. Source: Authors’ own calculations using UBOS UNHS surveys (2012/13; 2016/17).
Beyond the overall lower growth rate of employment, sector level employment patterns for Uganda’s
youth are almost identical to those documented for Uganda’s working-age population. For example,
referring to the 2016/17 findings, IWOSS contributed 21.4 percent of all jobs for youth compared to
22.6 percent for the working-age population. Almost all other patterns described above for the
country’s employed workers of working age (15-65 years), including the shifts between the two
surveys, are the same for Uganda’s youth.
In the aggregate, two key messages emerge from Tables 7 and 8. First, regardless of whether we
consider the working-age population or Uganda’s youth, the importance of manufacturing as a source
for jobs has declined rapidly between the two survey waves. This is a worrisome trend, as the sector is
considered to be a key driver for structural transformation and a source of decent jobs. Second, and
closely related, the findings also suggest that IWOSS sectors, which could have a similar potential for
structural transformation and are growing in importance, have not yet replaced non-IWOSS sectors as
the main source of employment for Ugandans, who are largely employed in low-value activities like
informal trade and low-productivity agriculture.
5.2 Formal private employment in IWOSS, manufacturing and non-IWOSS sectors
Table 9 provides a different perspective and considers the importance of IWOSS, manufacturing, and
non-IWOSS sectors in Uganda from the vantage point of providing formal private employment. Results
are again presented for the overall working-age population (15-65 years, Panel A) and Uganda’s youth
(15-24 years, Panel B).
A key insight from this table is that formal private sector employment in Uganda contracted
considerably between 2012/13 and 2016/17. While in 2012/13, total formal private employment
provided around 200,000 jobs in Uganda, by 2016/17 this number had contracted to 141,000, a
reduction of 29.5 percent. While the number of formal private sector jobs among Uganda’s youth is
considerably lower to begin with (e.g., in 2016/17 only 13,000 Ugandan youth had a formal private
sector job compared to around 141,000 for the overall population), the contraction of formal private
sector employment between the two survey waves was even stronger here: From 2012/13 to
2016/17, formal private employment among the youth fell by a staggering 50.8 percent.
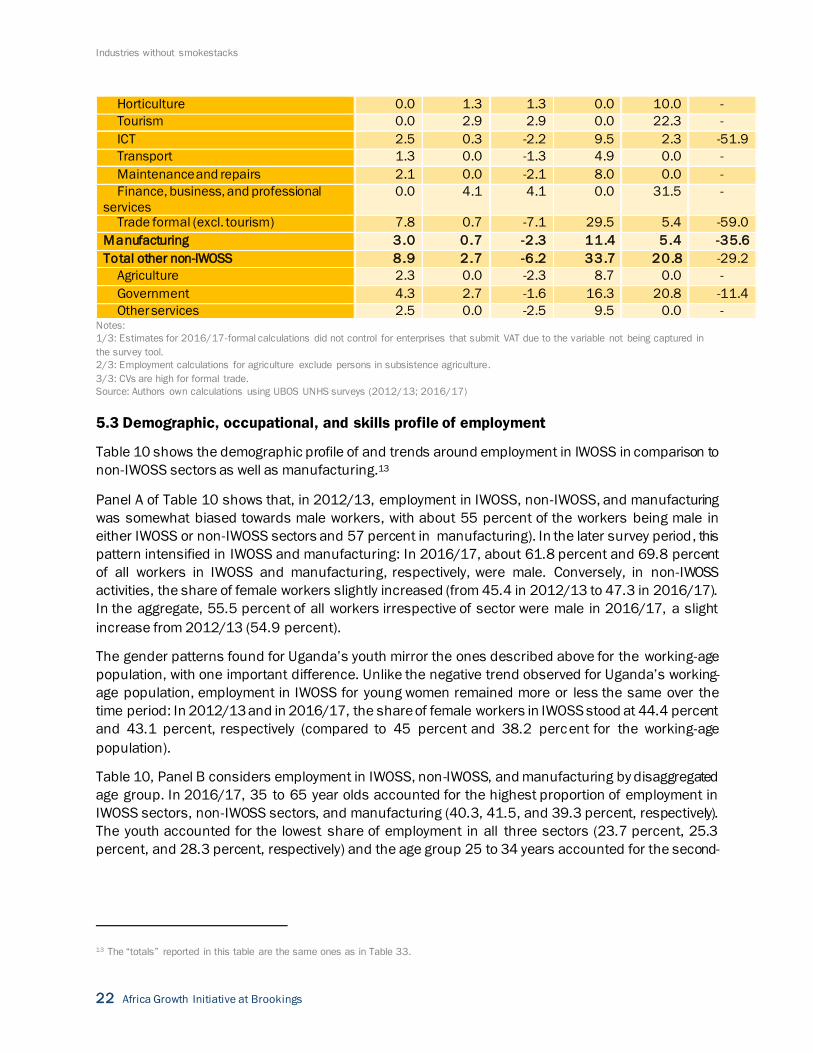
Table 9 reveals a number of employment trends under IWOSS, manufacturing, and non-IWOSS. First,
as seen in Table 7, the importance of the manufacturing sector as a source of employment declined
between the two periods for both the overall working-age population and Uganda’s youth. Second,
IWOSS sectors, in line with the higher degree of formalization of these sectors, provide significantly
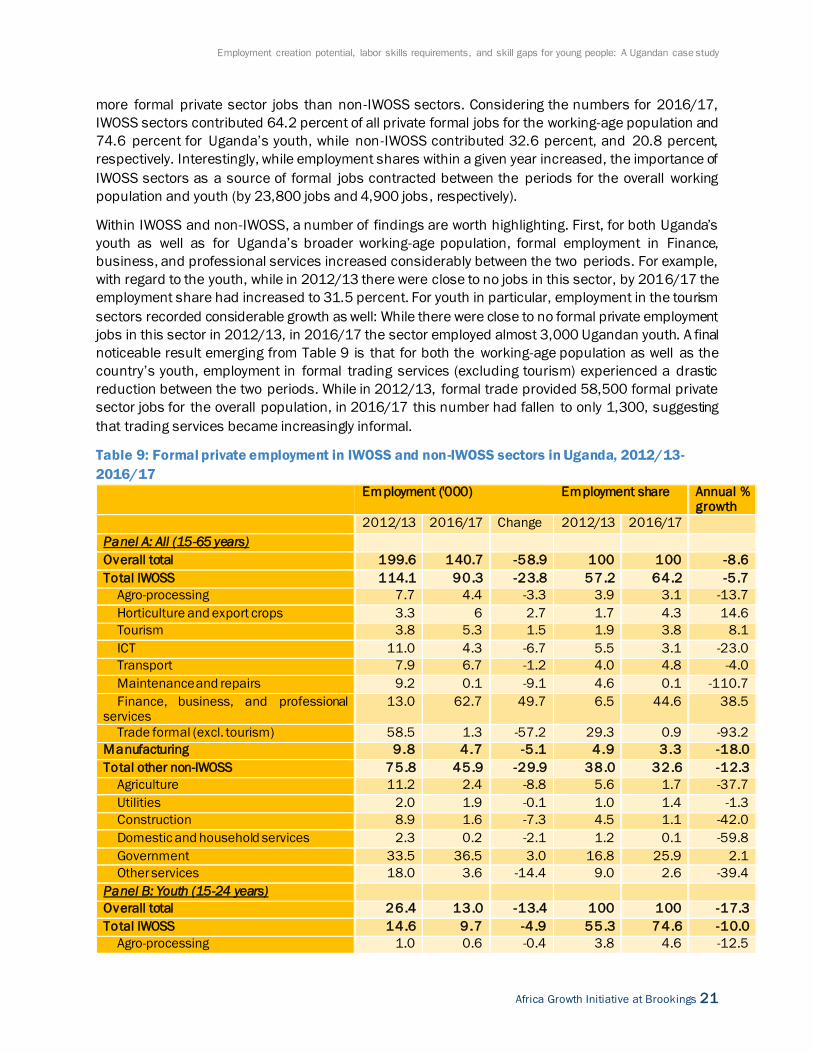
Employment creation potential, labor skills requirements, and skill gaps for young people: A Ugandan case study
Africa Growth Initiative at Brookings 21
more formal private sector jobs than non-IWOSS sectors. Considering the numbers for 2016/17,
IWOSS sectors contributed 64.2 percent of all private formal jobs for the working-age population and
74.6 percent for Uganda’s youth, while non -IWOSS contributed 32.6 percent, and 20.8 percent,
respectively. Interestingly, while employment shares within a given year increased, the importance of
IWOSS sectors as a source of formal jobs contracted between the periods for the overall working
population and youth (by 23,800 jobs and 4,900 jobs, respectively).
Within IWOSS and non-IWOSS, a number of findings are worth highlighting. First, for both Uganda’s
youth as well as for Uganda’s broader working-age population, formal employment in Finance,
business, and professional services increased considerably between the two periods. For example,
with regard to the youth, while in 2012/13 there were close to no jobs in this sector, by 2016/17 the
employment share had increased to 31.5 percent. For youth in particular, employment in the tourism
sectors recorded considerable growth as well: While there were close to no formal private employment
jobs in this sector in 2012/13, in 2016/17 the sector employed almost 3,000 Ugandan youth. A final
noticeable result emerging from Table 9 is that for both the working-age population as well as the
country’s youth, employment in formal trading services (excluding tourism) experienced a drastic
reduction between the two periods. While in 2012/13, formal trade provided 58,500 formal private
sector jobs for the overall population, in 2016/17 this number had fallen to only 1,300, suggesting
that trading services became increasingly informal.
Table 9: Formal private employment in IWOSS and non-IWOSS sectors in Uganda, 2012/13-
2016/17
Employment ('000) Employment share Annual % growth
2012/13 2016/17 Change 2012/13 2016/17
Panel A: All (15-65 years)
Overall total 199.6 140.7 -58.9 100 100 -8.6
Total IWOSS 114.1 90.3 -23.8 57.2 64.2 -5 .7
Agro-processing 7.7 4.4 -3.3 3.9 3.1 -13.7
Horticulture and export crops 3.3 6 2.7 1.7 4.3 14.6
Tourism 3.8 5.3 1.5 1.9 3.8 8.1
ICT 11.0 4.3 -6.7 5.5 3.1 -23.0
Transport 7.9 6.7 -1.2 4.0 4.8 -4.0
Maintenance and repairs 9.2 0.1 -9.1 4.6 0.1 -110.7
Finance, business, and professional services
13.0 62.7 49.7 6.5 44.6 38.5
Trade formal (excl. tourism) 58.5 1.3 -57.2 29.3 0.9 -93.2
Manufacturing 9.8 4.7 -5 .1 4.9 3.3 -18.0
Total other non-IWOSS 75.8 45.9 -29.9 38.0 32.6 -12.3
Agriculture 11.2 2.4 -8.8 5.6 1.7 -37.7
Utilities 2.0 1.9 -0.1 1.0 1.4 -1.3
Construction 8.9 1.6 -7.3 4.5 1.1 -42.0
Domestic and household services 2.3 0.2 -2.1 1.2 0.1 -59.8
Government 33.5 36.5 3.0 16.8 25.9 2.1
Other services 18.0 3.6 -14.4 9.0 2.6 -39.4
Panel B: Youth (15-24 years)
Overall total 26.4 13.0 -13.4 100 100 -17.3
Total IWOSS 14.6 9.7 -4 .9 55.3 74.6 -10.0
Agro-processing 1.0 0.6 -0.4 3.8 4.6 -12.5
Industries without smokestacks
22 Africa Growth Initiative at Brookings
Horticulture 0.0 1.3 1.3 0.0 10.0 -
Tourism 0.0 2.9 2.9 0.0 22.3 -
ICT 2.5 0.3 -2.2 9.5 2.3 -51.9
Transport 1.3 0.0 -1.3 4.9 0.0 -
Maintenance and repairs 2.1 0.0 -2.1 8.0 0.0 -
Finance, business, and professional
services
0.0 4.1 4.1 0.0 31.5 -
Trade formal (excl. tourism) 7.8 0.7 -7.1 29.5 5.4 -59.0
Manufacturing 3.0 0.7 -2 .3 11.4 5.4 -35.6
Total other non-IWOSS 8.9 2.7 -6 .2 33.7 20.8 -29.2
Agriculture 2.3 0.0 -2.3 8.7 0.0 -
Government 4.3 2.7 -1.6 16.3 20.8 -11.4
Other services 2.5 0.0 -2.5 9.5 0.0 - Notes:
1/3: Estimates for 2016/17-formal calculations did not control for enterprises that submit VAT due to the variable not being captured in
the survey tool.
2/3: Employment calculations for agriculture exclude persons in subsistence agriculture.
3/3: CVs are high for formal trade.
Source: Authors own calculations using UBOS UNHS surveys (2012/13; 2016/17)
5.3 Demographic, occupational, and skills profile of employment
Table 10 shows the demographic profile of and trends around employment in IWOSS in comparison to
non-IWOSS sectors as well as manufacturing.13
Panel A of Table 10 shows that, in 2012/13, employment in IWOSS, non-IWOSS, and manufacturing
was somewhat biased towards male workers, with about 55 percent of the workers being male in
either IWOSS or non-IWOSS sectors and 57 percent in manufacturing). In the later survey period, this
pattern intensified in IWOSS and manufacturing: In 2016/17, about 61.8 percent and 69.8 percent
of all workers in IWOSS and manufacturing, respectively, were male. Conversely, in non-IWOSS
activities, the share of female workers slightly increased (from 45.4 in 2012/13 to 47.3 in 2016/17).
In the aggregate, 55.5 percent of all workers irrespective of sector were male in 2016/17, a slight
increase from 2012/13 (54.9 percent).
The gender patterns found for Uganda’s youth mirror the ones described above for the working-age
population, with one important difference. Unlike the negative trend observed for Uganda’s working-
age population, employment in IWOSS for young women remained more or less the same over the
time period: In 2012/13 and in 2016/17, the share of female workers in IWOSS stood at 44.4 percent
and 43.1 percent, respectively (compared to 45 percent and 38.2 percent for the working-age
population).
Table 10, Panel B considers employment in IWOSS, non-IWOSS, and manufacturing by disaggregated
age group. In 2016/17, 35 to 65 year olds accounted for the highest proportion of employment in
IWOSS sectors, non-IWOSS sectors, and manufacturing (40.3, 41.5, and 39.3 percent, respectively).
The youth accounted for the lowest share of employment in all three sectors (23.7 percent, 25.3
percent, and 28.3 percent, respectively) and the age group 25 to 34 years accounted for the second-
13 The “totals” reported in this table are the same ones as in Table 33.
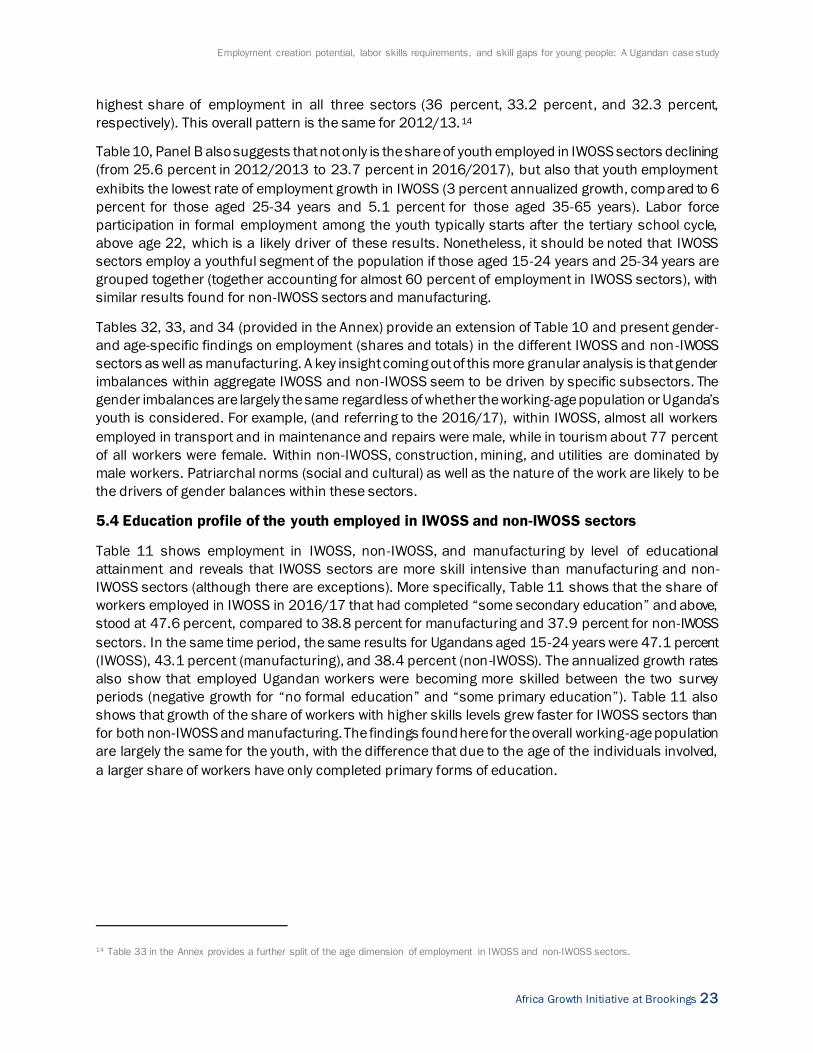
Employment creation potential, labor skills requirements, and skill gaps for young people: A Ugandan case study
Africa Growth Initiative at Brookings 23
highest share of employment in all three sectors (36 percent, 33.2 percent, and 32.3 percent,
respectively). This overall pattern is the same for 2012/13.14
Table 10, Panel B also suggests that not only is the share of youth employed in IWOSS sectors declining
(from 25.6 percent in 2012/2013 to 23.7 percent in 2016/2017), but also that youth employment
exhibits the lowest rate of employment growth in IWOSS (3 percent annualized growth, compared to 6
percent for those aged 25-34 years and 5.1 percent for those aged 35-65 years). Labor force
participation in formal employment among the youth typically starts after the tertiary school cycle,
above age 22, which is a likely driver of these results. Nonetheless, it should be noted that IWOSS
sectors employ a youthful segment of the population if those aged 15-24 years and 25-34 years are
grouped together (together accounting for almost 60 percent of employment in IWOSS sectors), with
similar results found for non-IWOSS sectors and manufacturing.
Tables 32, 33, and 34 (provided in the Annex) provide an extension of Table 10 and present gender-
and age-specific findings on employment (shares and totals) in the different IWOSS and non -IWOSS
sectors as well as manufacturing. A key insight coming out of this more granular analysis is that gender
imbalances within aggregate IWOSS and non-IWOSS seem to be driven by specific subsectors. The
gender imbalances are largely the same regardless of whether the working-age population or Uganda’s
youth is considered. For example, (and referring to the 2016/17), within IWOSS, almost all workers
employed in transport and in maintenance and repairs were male, while in tourism about 77 percent
of all workers were female. Within non-IWOSS, construction, mining, and utilities are dominated by
male workers. Patriarchal norms (social and cultural) as well as the nature of the work are likely to be
the drivers of gender balances within these sectors.
5.4 Education profile of the youth employed in IWOSS and non-IWOSS sectors
Table 11 shows employment in IWOSS, non-IWOSS, and manufacturing by level of educational
attainment and reveals that IWOSS sectors are more skill intensive than manufacturing and non-
IWOSS sectors (although there are exceptions). More specifically, Table 11 shows that the share of
workers employed in IWOSS in 2016/17 that had completed “some secondary education” and above,
stood at 47.6 percent, compared to 38.8 percent for manufacturing and 37.9 percent for non-IWOSS
sectors. In the same time period, the same results for Ugandans aged 15-24 years were 47.1 percent
(IWOSS), 43.1 percent (manufacturing), and 38.4 percent (non-IWOSS). The annualized growth rates
also show that employed Ugandan workers were becoming more skilled between the two survey
periods (negative growth for “no formal education” and “some primary education”). Table 11 also
shows that growth of the share of workers with higher skills levels grew faster for IWOSS sectors than
for both non-IWOSS and manufacturing. The findings found here for the overall working-age population
are largely the same for the youth, with the difference that due to the age of the individuals involved,
a larger share of workers have only completed primary forms of education.
14 Table 33 in the Annex provides a further split of the age dimension of employment in IWOSS and non-IWOSS sectors.
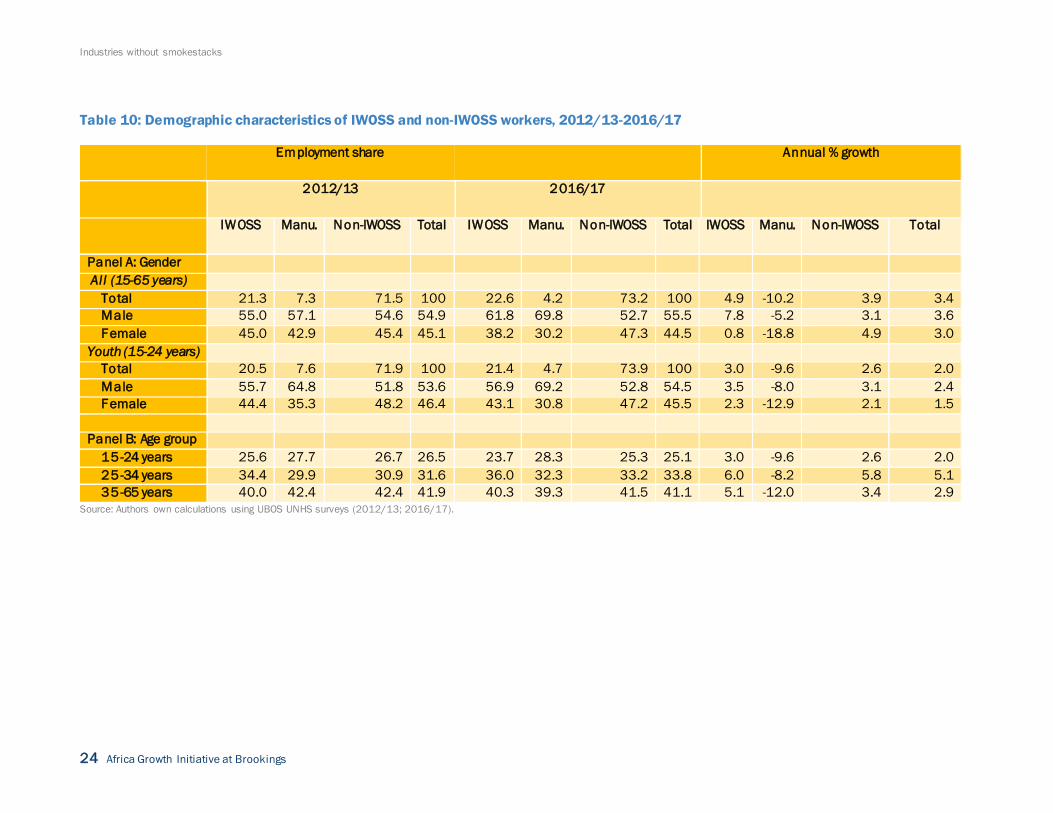
Industries without smokestacks
24 Africa Growth Initiative at Brookings
Table 10: Demographic characteristics of IWOSS and non-IWOSS workers, 2012/13-2016/17
Source: Authors own calculations using UBOS UNHS surveys (2012/13; 2016/17).
Employment share Annual % growth
2012/13 2016/17
IWOSS Manu. Non-IWOSS Total IWOSS Manu. Non-IWOSS Total IWOSS Manu. Non-IWOSS Total
Panel A: Gender
All (15-65 years)
Total 21.3 7.3 71.5 100 22.6 4.2 73.2 100 4.9 -10.2 3.9 3.4
Male 55.0 57.1 54.6 54.9 61.8 69.8 52.7 55.5 7.8 -5.2 3.1 3.6
Female 45.0 42.9 45.4 45.1 38.2 30.2 47.3 44.5 0.8 -18.8 4.9 3.0
Youth (15-24 years)
Total 20.5 7.6 71.9 100 21.4 4.7 73.9 100 3.0 -9.6 2.6 2.0
Male 55.7 64.8 51.8 53.6 56.9 69.2 52.8 54.5 3.5 -8.0 3.1 2.4
Female 44.4 35.3 48.2 46.4 43.1 30.8 47.2 45.5 2.3 -12.9 2.1 1.5
Panel B: Age group
15-24 years 25.6 27.7 26.7 26.5 23.7 28.3 25.3 25.1 3.0 -9.6 2.6 2.0
25-34 years 34.4 29.9 30.9 31.6 36.0 32.3 33.2 33.8 6.0 -8.2 5.8 5.1
35-65 years 40.0 42.4 42.4 41.9 40.3 39.3 41.5 41.1 5.1 -12.0 3.4 2.9
Employment creation potential, labor skills requirements, and skill gaps for young people: A Ugandan case study
Africa Growth Initiative at Brookings 25
Table 11: Educational profile of workers by IWOSS, non-IWOSS, and manufacturing, 2012/13-2016/17
Notes:
1/1: Differences in annual growth arise from when a person is reported to be employed but there is a missing education variable.
Source: Authors’ own calculations using UBOS UNHS surveys (2012/13; 2016/17).
Employment share Annual % growth 2012/13 2016/17
IWOSS Manu. Non-IWOSS
Total IWOSS Manu. Non-IWOSS
Total IWOSS Manu. Non-IWOSS
Total
Panel A: All (15-65 years)
No formal education 12.5 17.3 16.6 15.8 5.7 5.7 9.1 8.2 -14.3 -37.1 -10.4 -12.4
Some primary 45.1 40.5 44.7 44.5 34.3 35.6 38.3 37.3 -1.8 -13.0 0.6 -0.7
Completed primary 10.3 15.4 9.3 9.9 12.4 20.0 14.8 14.5 9.6 -3.5 15.8 12.9
Some secondary 15.2 17.3 15.6 15.6 17.4 17.2 16.8 16.9 8.2 -10.0 6.1 5.6
Completed secondary 8.0 5.0 5.7 6.1 12.1 10.3 9.1 9.8 14.9 8.0 15.9 15.2
Post-secondary plus 8.9 4.6 8.1 8.0 18.1 11.3 12.0 13.3 22.3 12.2 13.8 16.0
Total 100 100 100 100 100 100 100 100 4.9 -9.9 4.3 3.7
Panel B: Youth (15-24 years)
No formal education 5.4 9.7 8.0 7.4 3.0 1.7 4.9 4.7 -11.7 -52.9 -10.1 -9.6
Some primary 48.8 42.6 48.1 49.9 37.8 40.1 40.7 41.0 -3.2 -11.4 -2.1 -3.0
Completed primary 10.9 16.2 10.0 10.9 12.2 15.5 16.1 15.5 5.8 -11.1 13.7 10.5
Some secondary 19.5 20.6 19.9 18.6 20.6 18.6 19.3 19.1 4.4 -12.5 1.3 2.5
Completed secondary 9.7 5.1 7.3 6.6 16.3 12.7 11.2 11.7 15.8 12.4 12.5 15.8
Post-secondary plus 5.5 4.6 5.1 5.0 10.2 11.8 7.9 8.1 18.1 13.0 12.8 13.6
Total 100 100 100 100 100 100 100 100 3.1 -9.9 2.0 1.8
Industries without smokestacks
26 Africa Growth Initiative at Brookings
5.5 Occupation/skills profile by sector
To complement education level findings, Table 12 shows the composition of employment in IWOSS,
manufacturing and non-IWOSS sectors by occupation. Findings show that low-skilled employment
accounted for the largest share of employment in both IWOSS (56.7 percent) and non-IWOSS (58.7 percent)
in 2016/2017. In manufacturing, 89.1 percent of all employment can be categorized as low-skilled
employment. In the same period, and in line with the higher skill requirements of some IWOSS sectors, the
share of high-skilled employment in IWOSS stood at 10.8 percent compared to 1.4 percent in manufacturing
and 6.8 percent in non-IWOSS. Comparing employment shares of 2012/2013 and 2016/2017, there is
evidence of transition of employees in IWOSS from low skilled to high skilled, a pattern not found for
manufacturing and non-IWOSS sectors. In line with these findings, the average growth of employment is
highest for high skilled workers in IWOSS (36 percent).
Table 12: Skills and occupational structure in IWOSS, non-IWOSS, and manufacturing, 2012/13-
2016/17
2012/13
2016/17
Annual % growth
IWOSS Manu. Non-IWOSS
Total IWOSS Manu. Non-IWOSS
Total IWOSS Manu. Non-IWOSS
Total
Panel A: All (15-65 years)
Total 22.5 6 .3 71.3 100 22.2 4 .2 73.6 100 11.2 1 .7 12.3 11.5
High skilled 3.9 2.2 8.2 6.9 10.8 1.4 6.8 7.4 36.0 -9.2 7.6 13.5
Skilled 28.0 4.4 32.8 30.0 32.5 9.5 34.5 33.0 14.9 20.8 13.5 13.9
Low skilled 68.0 93.5 58.8 63.0 56.7 89.1 58.7 59.6 6.7 0.5 12.2 10.1
Panel B: Youth (15-24 years)
Total 20.6 7 .3 72.1 100 21.0 4 .8 74.2 100 10.6 (0 .4) 10.7 10.0
High skilled 0.6 0.9 4.5 3.4 4.8 0.5 3.8 3.9 61.4 (17.0) 7.0 13.2
Skilled 28.8 2.1 28.2 26.4 31.5 12.2 27.9 27.9 12.8 43.1 10.5 11.4
Low skilled 70.6 97.1 67.2 70.1 63.7 87.5 68.2 68.2 8.1 (2.9) 11.1 9.4
Notes:
1/3: High-skilled occupations include managers and professionals.
2/3: Skilled occupations include technicians and associate professionals; clerical support workers; and service and sales workers
3/3: Low-skilled occupations include skilled agricultural, forestry and fishery workers; craft and related trades workers; plant and machine
operators and assemblers; and elementary occupations
Source: Authors’ own calculations using UBOS UNHS surveys (2012/13; 2016/17).
Tables 13 and 14 go one step further and present disaggregated results (shares and totals) for high-skilled,
skilled, and low-skilled employment per the different IWOSS and non-IWOSS subsectors as well as
manufacturing. Again, analysis is shown for the working-age population (15-65 years) as well as the youth
(15-24 years) for 2016/17 only.
In line with the higher skills requirements in these jobs, finance, business, and professional services and
ICT (as well as government, under non-IWOSS) have, by far, the highest shares of high-skilled and skilled
employment, a pattern equally true for Uganda’s youth. The share of skilled employment in particular is also
high in utilities (non-IWOSS) as well as tourism, likely due to the fact that employment in this sector is
dependent on being able to interact adequately with demanding international customers. However, many
of the youth are employed as services and sales workers. In both Table 13 (overall) and 14 (youth), the
share of low-skilled employment is high for agriculture-related employment: 99.2 percent in horticulture and
export crops and 99.1 percent for agriculture (non-IWOSS). These shares are of similar magnitude for
Uganda’s youth.
Employment creation potential, labor skills requirements, and skill gaps for young people: A Ugandan case study
Africa Growth Initiative at Brookings 27
Other IWOSS activities are composed of persons in low-skilled and skilled employment in a ratio of about
3:1, such as agro-processing (72 percent low-skilled and 26.2 percent skilled), transport, maintenance and
repairs, and formal trade, although formal trade also provides high-skilled employment (15.4 percent of all
jobs in the sector). Again, at large the patterns found for the working-age population are the same
established in Table 14 which limits the sample to Uganda’s youth. Against the background that c ertain
IWOSS activities (like ICT or financial and business services) are often thought to require a higher skill set
than non-IWOSS activities, it is interesting to note that the majority of jobs in informal trade classify as
skilled employment (94.6 percent for the working-age population and 95.3 percent for the youth).
The key insights from the analysis in this section can be summarized as follows. Generally, IWOSS sectors
reveal a greater potential in providing employment than non-IWOSS and manufacturing, the importance of
which has declined rapidly over the last decades. However, the overall annual employment growth rate for
IWOSS is considerably lower for youth than for the working-age population. Furthermore, while IWOSS
sectors that are being championed as potential for structural transformation are increasingly becoming
important, in terms of absolute numbers of employment these are still below non-IWOSS sectors and most
Ugandans are still employed in less productive jobs like informal trade services and low-productivity
agriculture. Demographics show that male workers are overrepresented in aggregate sectors, a pattern also
true for the youth. However, at sector specific level (e.g. agro-processing or tourism) other patterns emerge.
For example, while almost all workers in transport and maintenance and repairs are male, in tourism the
majority of workers are female. Some non-IWOSS sectors such as construction, mining, and utilities are
mostly dominated by men. Considering skills, a clear finding is that the share of workers in IWOSS have
higher educational attainment than workers in non-IWOSS or manufacturing.
Industries without smokestacks
28 Africa Growth Initiative at Brookings
Table 13: Occupational structure of IWOSS and non-IWOSS employed persons by sector, 2016/17
All (15-65 years) Absolute ('000) Share
High skilled Sk illed Low skilled Total High skilled Sk illed Low skilled
Overall total 681.9 3,027.6 5,461.5 9,170.9 7.4 33.0 59.6
Total IWOSS 220.4 663.3 1,155.4 2,039.0 10.8 32.5 56.7
Agro-processing 5.4 78.6 215.9 299.7 1.8 26.2 72.0
Horticulture and export crops 0.5 2.3 347.2 350.0 0.1 0.7 99.2
Tourism 19.9 260.5 73.3 353.6 5.6 73.7 20.7
ICT 10.5 23.3 3.2 36.9 28.5 63.1 8.7
Transport 1.7 82.1 373.8 457.5 0.4 17.9 81.7
Maintenance and repairs 1.1 27.9 83.8 112.7 1.0 24.8 74.4
Finance, business, and professional services 181.4 188.8 57.5 427.7 42.4 44.1 13.4
Trade formal (excl. tourism) 0.2 0.1 1.0 1.3 15.4 7.7 76.9
Manufacturing 5.5 36.7 344.6 386.6 1.4 9.5 89.1
Total non-IWOSS 456.1 2,327.8 3,961.6 6,745.4 6.8 34.5 58.7
Agriculture 5.8 23.4 3,046.4 3,075.5 0.2 0.8 99.1
Mining 0.4 3.9 81.8 86.0 0.5 4.5 95.1
Utilities 2.7 12.5 14.7 29.8 9.1 41.9 49.3
Construction 11.2 13.8 391.4 416.3 2.7 3.3 94.0
Trade informal (excl. tourism) 13.1 1,880.9 93.5 1,987.5 0.7 94.6 4.7
Domestic and household services 0.0 24.4 160.8 185.1 0.0 13.2 86.9
Government 411.5 136.8 29.3 577.5 71.3 23.7 5.1
Other services 11.7 232.6 144.0 388.1 3.0 59.9 37.1
Notes:
1/3: Deviations in employments statistics for 2016/17 here arise due to some employed persons not indicating their occupations in the survey.
2/3: Youth in informal trade are in skilled in services and sales workers.
3/3: Employment in agriculture excludes persons in subsistence agriculture.
Source: Authors’ own calculations using UBOS UNHS surveys (2012/13; 2016/17).
Employment creation potential, labor skills requirements, and skill gaps for young people: A Ugandan case study
Africa Growth Initiative at Brookings 29
Table 14: Youth breakdown of sectoral employment by skill level, 2016/17
Youth (15-24 years) Absolute ('000) Share
High skilled Sk illed Low skilled Total High skilled Skilled Low skilled
Overall total 89.5 644.3 1,571.8 2,305.5 3.9 27.9 68.2
Total IWOSS 23.3 153.0 309.1 485.2 4.8 31.5 63.7
Agro-processing 0.6 12.9 41.0 54.4 1.1 23.7 75.4
Horticulture and export crops 0.0 1.3 108.1 109.4 0.0 1.2 98.8
Tourism 4.2 78.0 28.1 110.3 3.8 70.7 25.5
ICT 1.8 4.9 1.2 7.8 23.1 62.8 15.4
Transport 0.0 17.0 71.7 88.7 0.0 19.2 80.8
Maintenance and repairs 0.0 2.5 34.9 37.4 0.0 6.7 93.3
Finance, business, and professional services 16.7 36.6 23.7 76.9 21.7 47.6 30.8
Trade formal (excl. tourism) 0.0 0.0 0.7 0.7 0.0 0.0 100.0
Manufacturing 0.5 13.4 95.9 109.6 0.5 12.2 87.5
Total non-IWOSS 65.8 478.0 1,167.0 1,710.7 3.8 27.9 68.2
Agriculture 0.0 3.9 878.6 882.5 0.0 0.4 99.6
Mining 0.0 0.3 27.8 28.0 0.0 1.1 99.3
Utilities 0.0 2.3 4.3 6.5 0.0 35.4 66.2
Construction 0.0 0.5 94.4 94.8 0.0 0.5 99.6
Trade informal (excl. tourism) 1.3 366.5 17.0 384.7 0.3 95.3 4.4
Domestic and household services 0.0 15.9 93.9 109.7 0.0 14.5 85.6
Government 61.5 27.8 3.9 93.1 66.1 29.9 4.2
Other services 3.1 61.2 47.5 111.6 2.8 54.8 42.6
Notes:
1/3: Deviations in employment statistics for 2016/17 here arise due to some employed persons not indicating their occupations in the survey.
2/3: Youth in informal trade are considered skilled as they are mainly employed as services and sales workers (e.g., street hawkers and vendors, receptionists, sales marketers).
3/3: Employment in agriculture excludes persons in subsistence agriculture.
Source: Authors’ own calculations using UBOS UNHS surveys (2012/13; 2016/17).
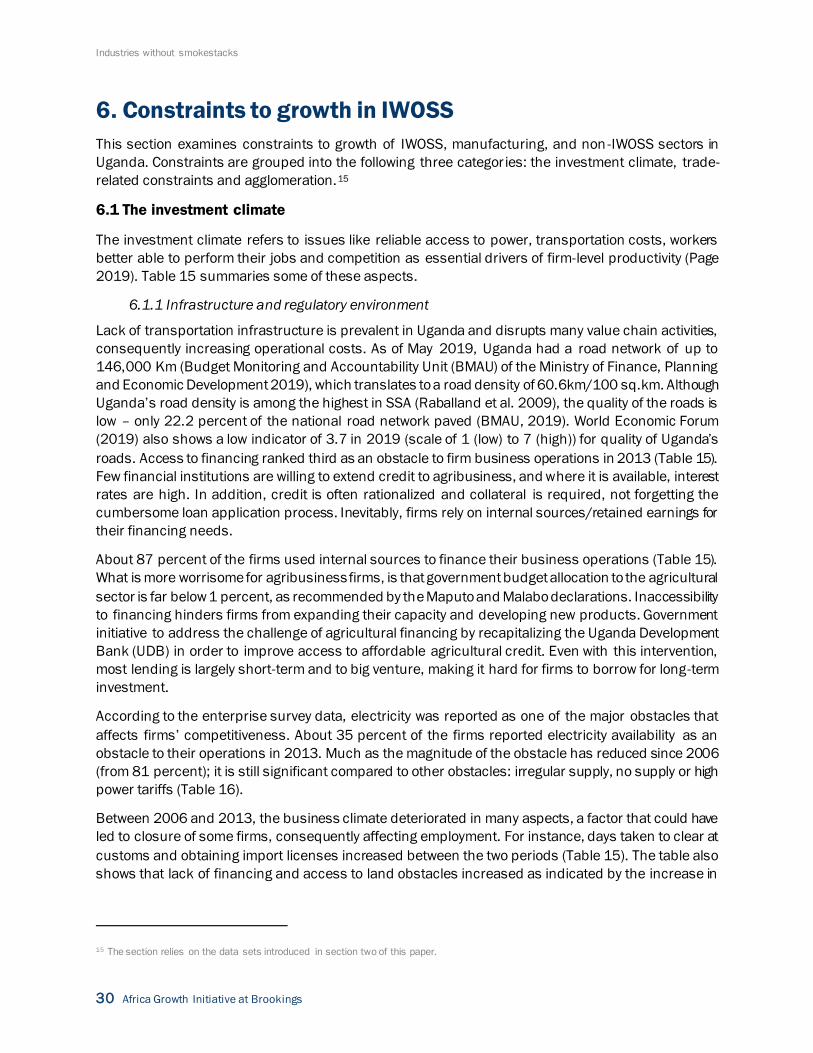
Industries without smokestacks
30 Africa Growth Initiative at Brookings
6. Constraints to growth in IWOSS
This section examines constraints to growth of IWOSS, manufacturing, and non -IWOSS sectors in
Uganda. Constraints are grouped into the following three categories: the investment climate, trade-
related constraints and agglomeration.15
6.1 The investment climate
The investment climate refers to issues like reliable access to power, transportation costs, workers
better able to perform their jobs and competition as essential drivers of firm-level productivity (Page
2019). Table 15 summaries some of these aspects.
6.1.1 Infrastructure and regulatory environment
Lack of transportation infrastructure is prevalent in Uganda and disrupts many value chain activities,
consequently increasing operational costs. As of May 2019, Uganda had a road network of up to
146,000 Km (Budget Monitoring and Accountability Unit (BMAU) of the Ministry of Finance, Planning
and Economic Development 2019), which translates to a road density of 60.6km/100 sq.km. Although
Uganda’s road density is among the highest in SSA (Raballand et al. 2009), the quality of the roads is
low – only 22.2 percent of the national road network paved (BMAU, 2019). World Economic Forum
(2019) also shows a low indicator of 3.7 in 2019 (scale of 1 (low) to 7 (high)) for quality of Uganda’s
roads. Access to financing ranked third as an obstacle to firm business operations in 2013 (Table 15).
Few financial institutions are willing to extend credit to agribusiness, and where it is available, interest
rates are high. In addition, credit is often rationalized and collateral is required, not forgetting the
cumbersome loan application process. Inevitably, firms rely on internal sources/retained earnings for
their financing needs.
About 87 percent of the firms used internal sources to finance their business operations (Table 15).
What is more worrisome for agribusiness firms, is that government budget allocation to the agricultural
sector is far below 1 percent, as recommended by the Maputo and Malabo declarations. Inaccessibility
to financing hinders firms from expanding their capacity and developing new products. Government
initiative to address the challenge of agricultural financing by recapitalizing the Uganda Development
Bank (UDB) in order to improve access to affordable agricultural credit. Even with this intervention,
most lending is largely short-term and to big venture, making it hard for firms to borrow for long-term
investment.
According to the enterprise survey data, electricity was reported as one of the major obstacles that
affects firms’ competitiveness. About 35 percent of the firms reported electricity availability as an
obstacle to their operations in 2013. Much as the magnitude of the obstacle has reduced since 2006
(from 81 percent); it is still significant compared to other obstacles: irregular supply, no supply or high
power tariffs (Table 16).
Between 2006 and 2013, the business climate deteriorated in many aspects, a factor that could have
led to closure of some firms, consequently affecting employment. For instance, days taken to clear at
customs and obtaining import licenses increased between the two periods (Table 15). The table also
shows that lack of financing and access to land obstacles increased as indicated by the increase in
15 The section relies on the data sets introduced in section two of this paper.
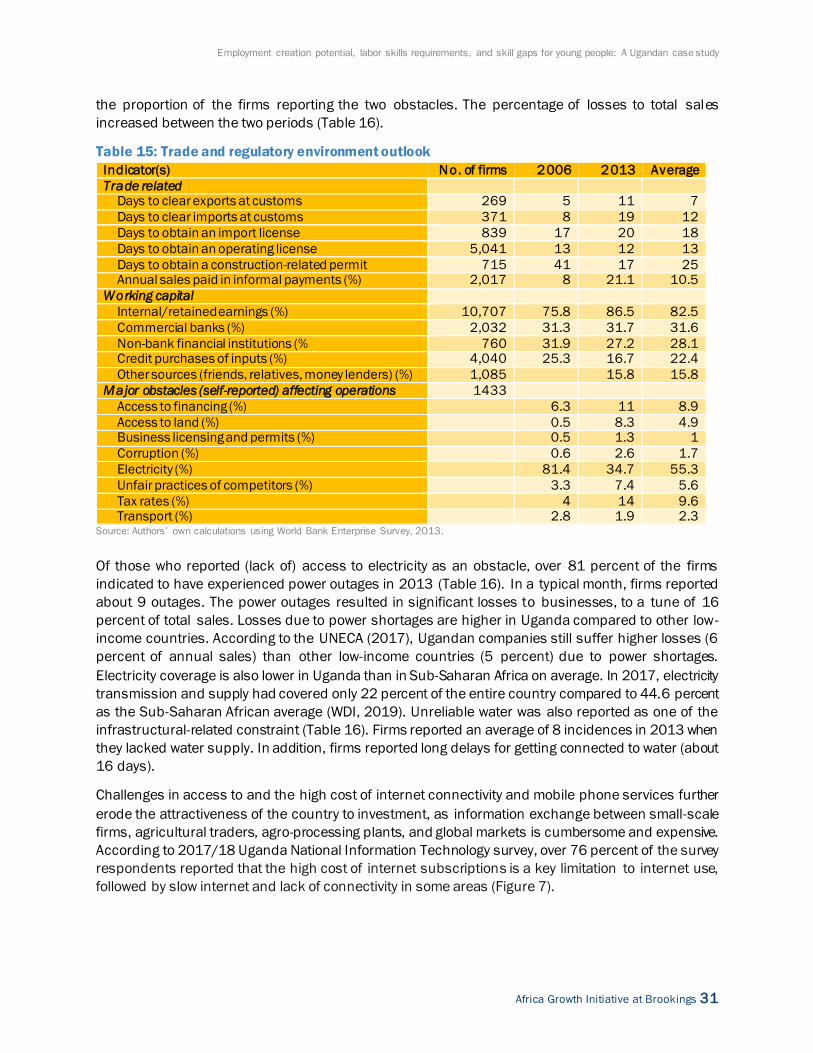
Employment creation potential, labor skills requirements, and skill gaps for young people: A Ugandan case study
Africa Growth Initiative at Brookings 31
the proportion of the firms reporting the two obstacles. The percentage of losses to total sales
increased between the two periods (Table 16).
Table 15: Trade and regulatory environment outlook
Indicator(s) No. of firms 2006 2013 Average
Trade related
Days to clear exports at customs 269 5 11 7
Days to clear imports at customs 371 8 19 12
Days to obtain an import license 839 17 20 18
Days to obtain an operating license 5,041 13 12 13
Days to obtain a construction-related permit 715 41 17 25 Annual sales paid in informal payments (%) 2,017 8 21.1 10.5
Working capital
Internal/retained earnings (%) 10,707 75.8 86.5 82.5
Commercial banks (%) 2,032 31.3 31.7 31.6
Non-bank financial institutions (% 760 31.9 27.2 28.1 Credit purchases of inputs (%) 4,040 25.3 16.7 22.4
Other sources (friends, relatives, money lenders) (%) 1,085
15.8 15.8
Major obstacles (self-reported) affecting operations 1433
Access to financing (%)
6.3 11 8.9
Access to land (%)
0.5 8.3 4.9 Business licensing and permits (%)
0.5 1.3 1
Corruption (%)
0.6 2.6 1.7
Electricity (%)
81.4 34.7 55.3
Unfair practices of competitors (%)
3.3 7.4 5.6
Tax rates (%)
4 14 9.6 Transport (%) 2.8 1.9 2.3
Source: Authors’ own calculations using World Bank Enterprise Survey, 2013.
Of those who reported (lack of) access to electricity as an obstacle, over 81 percent of the firms
indicated to have experienced power outages in 2013 (Table 16). In a typical month, firms reported
about 9 outages. The power outages resulted in significant losses to businesses, to a tune of 16
percent of total sales. Losses due to power shortages are higher in Uganda compared to other low-
income countries. According to the UNECA (2017), Ugandan companies still suffer higher losses (6
percent of annual sales) than other low-income countries (5 percent) due to power shortages.
Electricity coverage is also lower in Uganda than in Sub-Saharan Africa on average. In 2017, electricity
transmission and supply had covered only 22 percent of the entire country compared to 44.6 percent
as the Sub-Saharan African average (WDI, 2019). Unreliable water was also reported as one of the
infrastructural-related constraint (Table 16). Firms reported an average of 8 incidences in 2013 when
they lacked water supply. In addition, firms reported long delays for getting connected to water (about
16 days).
Challenges in access to and the high cost of internet connectivity and mobile phone services further
erode the attractiveness of the country to investment, as information exchange between small-scale
firms, agricultural traders, agro-processing plants, and global markets is cumbersome and expensive.
According to 2017/18 Uganda National Information Technology survey, over 76 percent of the survey
respondents reported that the high cost of internet subscriptions is a key limitation to internet use,
followed by slow internet and lack of connectivity in some areas (Figure 7).
Industries without smokestacks
32 Africa Growth Initiative at Brookings
Table 16: Infrastructure-related constraints
Indicator No. of interviewed firms 2006 2013 Average
Access to electricity
No. of days to be connected 1,179 33 22 26
Experienced power outages (%) 9,566 96.8 81.5 87
No. of outages/month 6,512 11 9 10
Percentage of losses to total sales (%) 5,522 12.8 15.7 14.3
Water availability
No. of days to be connected 589 23 16 16
Experienced insufficient water (%) 282 17.3 12.5 13.9
Incidents of insufficient water 170 4 8 6
Duration of the incidents (hours) 170 11 11 11 Source: Authors’ calculations using World Bank Enterprise Survey, 2013.
Figure 7: Perception on internet and mobile service availability, %
Source: Uganda National IT survey, 2017/18.
6.1.2 Skills deficits
Uganda’s labor market is plagued with skills mismatch: The skills level of labor supply does not match
labor demand. Feedback from employers indicates that current training programs are failing to equip
trainees with practical skills and job-relevant competencies (Belgium Development Cooperation, year
not shown). This mismatch affects the productivity of businesses: Indeed, poorly educated workers are
one of the most common business environment obstacles reported by business owners and top
managers (World Bank 2014). In the reformed 10-year Business, Technical, Vocational Education and
Training (BTVET) Strategic Plan (2012/13-2020/21), Uganda attempted to address the skills
0 10 20 30 40 50 60 70 80 90
Privacy or security concerns
Lack of local language content
Few people to communicate with
Having a phone with small screen
No interest
Difficult to do internet settings
Lack of network
Very slow
Expensive to use
Mo
bile
se
rvic
es
Inte
rne
t se
rvic
es
Percent
All Urban Rural
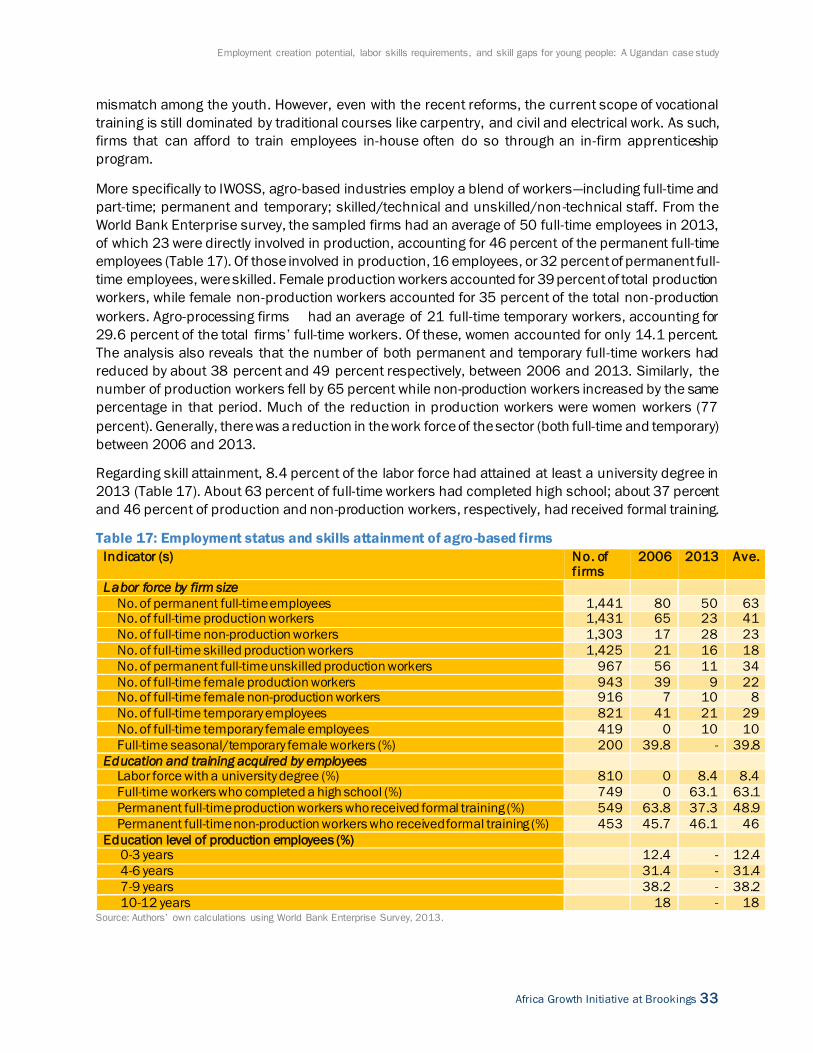
Employment creation potential, labor skills requirements, and skill gaps for young people: A Ugandan case study
Africa Growth Initiative at Brookings 33
mismatch among the youth. However, even with the recent reforms, the current scope of vocational
training is still dominated by traditional courses like carpentry, and civil and electrical work. As such,
firms that can afford to train employees in-house often do so through an in-firm apprenticeship
program.
More specifically to IWOSS, agro-based industries employ a blend of workers—including full-time and
part-time; permanent and temporary; skilled/technical and unskilled/non-technical staff. From the
World Bank Enterprise survey, the sampled firms had an average of 50 full-time employees in 2013,
of which 23 were directly involved in production, accounting for 46 percent of the permanent full-time
employees (Table 17). Of those involved in production, 16 employees, or 32 percent of permanent full-
time employees, were skilled. Female production workers accounted for 39 percent of total production
workers, while female non-production workers accounted for 35 percent of the total non-production
workers. Agro-processing firms had an average of 21 full-time temporary workers, accounting for
29.6 percent of the total firms’ full-time workers. Of these, women accounted for only 14.1 percent.
The analysis also reveals that the number of both permanent and temporary full-time workers had
reduced by about 38 percent and 49 percent respectively, between 2006 and 2013. Similarly, the
number of production workers fell by 65 percent while non-production workers increased by the same
percentage in that period. Much of the reduction in production workers were women workers (77
percent). Generally, there was a reduction in the work force of the sector (both full-time and temporary)
between 2006 and 2013.
Regarding skill attainment, 8.4 percent of the labor force had attained at least a university degree in
2013 (Table 17). About 63 percent of full-time workers had completed high school; about 37 percent
and 46 percent of production and non-production workers, respectively, had received formal training.
Table 17: Employment status and skills attainment of agro-based firms
Indicator (s) No. of f irms
2006 2013 Ave.
Labor force by firm size
No. of permanent full-time employees 1,441 80 50 63 No. of full-time production workers 1,431 65 23 41
No. of full-time non-production workers 1,303 17 28 23
No. of full-time skilled production workers 1,425 21 16 18
No. of permanent full-time unskilled production workers 967 56 11 34
No. of full-time female production workers 943 39 9 22 No. of full-time female non-production workers 916 7 10 8
No. of full-time temporary employees 821 41 21 29
No. of full-time temporary female employees 419 0 10 10
Full-time seasonal/temporary female workers (%) 200 39.8 - 39.8
Education and training acquired by employees
Labor force with a university degree (%) 810 0 8.4 8.4
Full-time workers who completed a high school (%) 749 0 63.1 63.1
Permanent full-time production workers who received formal training (%) 549 63.8 37.3 48.9
Permanent full-time non-production workers who received formal training (%) 453 45.7 46.1 46
Education level of production employees (%)
0-3 years
12.4 - 12.4
4-6 years
31.4 - 31.4
7-9 years
38.2 - 38.2
10-12 years 18 - 18 Source: Authors’ own calculations using World Bank Enterprise Survey, 2013.
Industries without smokestacks
34 Africa Growth Initiative at Brookings
6.2 Trade-related constraints
IWOSS firms are often exporters that harness regional and global opportunities to expand their
business activities. Firms in agro-processing and horticulture in particular are important for Uganda’s
success as an exporter. In both sectors combined, there are 300 exporters16 that together account for
almost 35 percent of Uganda’s export basket. Horticulture exports—dominated by coffee, tea, and cut
flowers—account for about 21 percent of Uganda’s export basket and agro-processed goods account
for another 14 percent (UN Comtrade 2020).
To assess constraints for further export growth in these sectors, we first focus on the importance of
different destination markets as well as the role that trade regimes and agreements play in Uganda’s
export success. Table 18 reveals the role of the East African Community (EAC) and its members in
shaping the success of Uganda’s horticultural and agro-processing sectors. Data from 2017 highlights
that the regional economic communities (REC) absorbed about 28 percent of Uganda’s total exports,
almost 30 percent of its agro-processed products, and roughly 12 percent of the its horticultural
exports. These figures are sizeable and reflect that access to the large and fast-growing markets of
Kenya and Tanzania became duty- and quota-free in 2005, accompanied by an increase in protection
of the customs union’s market through the introduction of the EAC Common External Tariff. The union
subsequently expanded to include Rwanda and Burundi in 2007. Within the EAC, Kenya and Rwanda
are the most important destination markets, absorbing 14 percent and 6 percent of Uganda’s total
export volume in 2017, respectively.17 Given that the EAC is an important export destination—
especially for Uganda’s agro-processed goods—a distinct threat to continued success can be found in
regional tensions such as the closing of the Katuna border with Rwanda for most of 2019, the civil
conflict in South Sudan, the outstanding review of the Common External Tariff as a pillar of the customs
union, and an ongoing feud over Uganda’s dairy and maize exports to Kenya.18
Column 2 considers the role of the Common Market for Eastern and Southern Africa (COMESA) free
trade area.19 The figures reveal that, while COMESA is not an important market for Ugandan exports
overall (absorbing only about 6 percent of the total export basket), about 10.3 percent of the country’s
agro-based exports flow to this country group—mainly driven by exports to the DRC. Unfortunately, data
on tariffs applied to Ugandan exports entering COMESA is incomplete in the WITS database, but
information from 2013 on tariffs applied by the DRC on Ugandan imports suggests that applied tariffs
are still sizeable for goods originating from Uganda (averaging 15 and 13 percent ad valorem for agro-
processed and horticultural goods, respectively).
16 Data on exporters by sector is taken from the Uganda Revenue Authority’s ASYCUDA data. Exporters are defined as firms that export
more than UGX 25 million worth of goods per year on average. This allows us to concentrate on those companies for which exporting is a
core component of their business activities. 17 South Sudan joined the EAC in 2016, but has not yet implemented the free trade agreement due to reliance on trade revenues to
finance government expenditure. The country is a major export destination for Uganda, absorbing about 9.1 percent of the country’s export
basket in 2017 (UNComtrade 2020), but is ridden by civil conflict undermining stable trade relationships. 18 Kenya recently banned Ugandan milk exports from accessing their market, claiming that they were not wholly produced in Uganda. In
early 2021, Kenya banned Ugandan maize over concerns related to the product’s safety for human consumption. 19 COMESA is a free trade area comprising of 21 member states. Crucially, all members of the EAC (except for Tanzania, which lef t
COMESA in 2000) are also members of COMESA. To avoid double counting, we subtract export flows from Uganda to EAC members from
the COMESA figures, as within EAC trade is duty- and quota-free while COMESA rates are lower than Most Favored Nation rates, but still
positive.
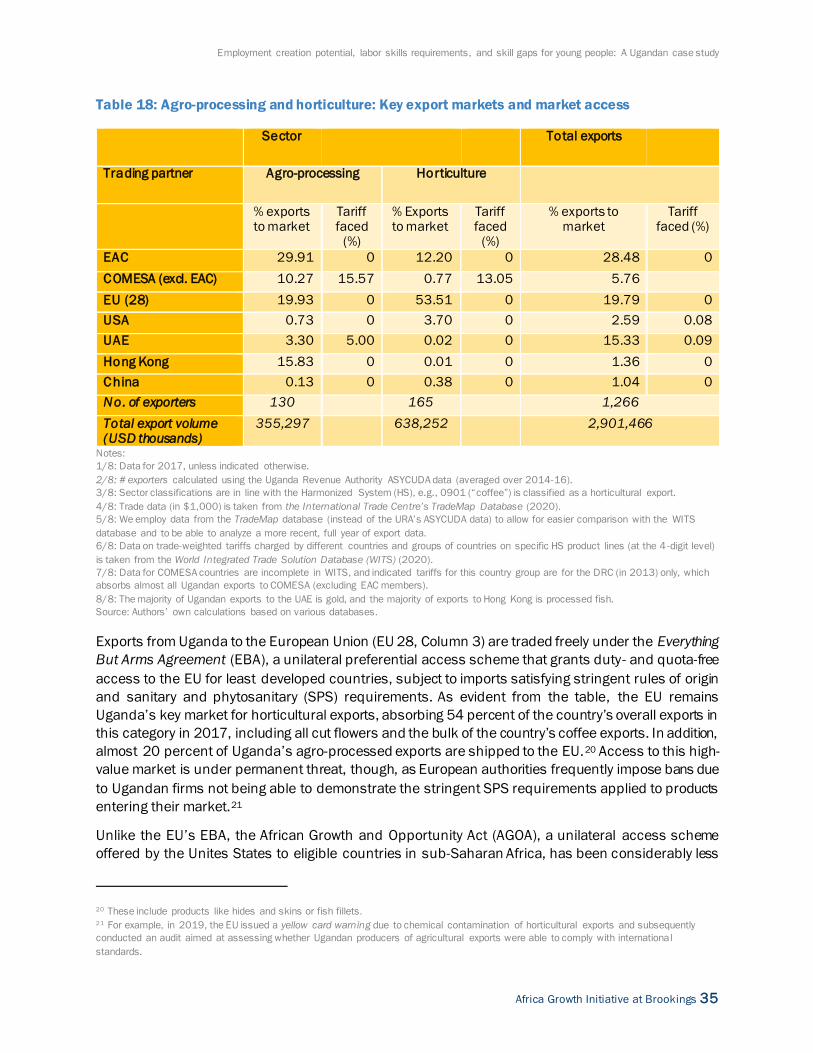
Employment creation potential, labor skills requirements, and skill gaps for young people: A Ugandan case study
Africa Growth Initiative at Brookings 35
Table 18: Agro-processing and horticulture: Key export markets and market access
Sector Total exports
Trading partner Agro-processing Horticulture
% exports to market
Tariff faced
(%)
% Exports to market
Tariff faced
(%)
% exports to market
Tariff faced (%)
EAC 29.91 0 12.20 0 28.48 0
COMESA (excl. EAC) 10.27 15.57 0.77 13.05 5.76
EU (28) 19.93 0 53.51 0 19.79 0
USA 0.73 0 3.70 0 2.59 0.08
UAE 3.30 5.00 0.02 0 15.33 0.09
Hong Kong 15.83 0 0.01 0 1.36 0
China 0.13 0 0.38 0 1.04 0
No. of exporters 130
165
1,266
Total export volume (USD thousands)
355,297
638,252
2,901,466
Notes:
1/8: Data for 2017, unless indicated otherwise.
2/8: # exporters calculated using the Uganda Revenue Authority ASYCUDA data (averaged over 2014-16).
3/8: Sector classifications are in line with the Harmonized System (HS), e.g., 0901 (“coffee”) is classified as a horticultural export.
4/8: Trade data (in $1,000) is taken from the International Trade Centre’s TradeMap Database (2020).
5/8: We employ data from the TradeMap database (instead of the URA’s ASYCUDA data) to allow for easier comparison with the WITS
database and to be able to analyze a more recent, full year of export data.
6/8: Data on trade-weighted tariffs charged by different countries and groups of countries on specific HS product lines (at the 4-digit level)
is taken from the World Integrated Trade Solution Database (WITS) (2020).
7/8: Data for COMESA countries are incomplete in WITS, and indicated tariffs for this country group are for the DRC (in 2013) only, which
absorbs almost all Ugandan exports to COMESA (excluding EAC members).
8/8: The majority of Ugandan exports to the UAE is gold, and the majority of exports to Hong Kong is processed fish.
Source: Authors’ own calculations based on various databases.
Exports from Uganda to the European Union (EU 28, Column 3) are traded freely under the Everything
But Arms Agreement (EBA), a unilateral preferential access scheme that grants duty- and quota-free
access to the EU for least developed countries, subject to imports satisfying stringent rules of origin
and sanitary and phytosanitary (SPS) requirements. As evident from the table, the EU remains
Uganda’s key market for horticultural exports, absorbing 54 percent of the country’s overall exports in
this category in 2017, including all cut flowers and the bulk of the country’s coffee exports. In addition,
almost 20 percent of Uganda’s agro-processed exports are shipped to the EU.20 Access to this high-
value market is under permanent threat, though, as European authorities frequently impose bans due
to Ugandan firms not being able to demonstrate the stringent SPS requirements applied to products
entering their market.21
Unlike the EU’s EBA, the African Growth and Opportunity Act (AGOA), a unilateral access scheme
offered by the Unites States to eligible countries in sub-Saharan Africa, has been considerably less
20 These include products like hides and skins or fish fillets. 21 For example, in 2019, the EU issued a yellow card warning due to chemical contamination of horticultural exports and subsequently
conducted an audit aimed at assessing whether Ugandan producers of agricultural exports were able to comply with international
standards.
Industries without smokestacks
36 Africa Growth Initiative at Brookings
successful. Despite the U.S. (Column 5 in Table 18) being another high-value destination market and
despite AGOA offering duty- and quota-free access as well, Uganda shipped less than 3 percent of its
exports to the U.S. in 2017. This small figure is driven by horticultural products like coffee and vanilla.
Underutilization of AGOA may be explained by a variety of factors like stringent rules of origin or an
inability of LDCs like Uganda to comply with the bureaucratic and documentary requirements that need
to be satisfied in order to take advantage of the preferential market access.
Finally, Columns 5, 6 and 7 reveal the role of the United Arab Emirates (UAE), China, and Hong Kong
as export destinations. First, the UAE (Column 5) does not play a large role for Uganda’s exports of
agro-processed and horticultural exports and only imports one key commodity from Uganda, gold,
which contributed about 15 percent to the country’s export basket in 2017. Hong Kong (Column 6) is
a major importer of processed fish from Uganda. Exports to China (Column 7) are negligible, despite
the existence of a unilateral scheme that grants preferential market access to LDCs.
A key insight from this analysis is that with the exception of COMESA (and the DRC as a crucial export
destination), Uganda’s exports of horticultural and agro-based products essentially enjoy duty- and
quota-free access to all key global markets. The International Trade Centre reports a similar finding,
corroborating our results: For those products Uganda actually exports, almost no trading partner
imposes tariffs (ITC 2018: 5).22 The existence of duty-and quota-free access to virtually all key markets
suggests that obstacles to improved export success and growth for the IWOSS sectors under
consideration in this study are to be identified in other trade and non-trade specific factors like the
enabling environment or non-tariff measures and barriers that hinder Ugandan firms from exploiting
the regional and global opportunities available to them. To shed some light on factors that hinder
Ugandan IWOSS firms from making full use of available regional and global market access, employed
is data on non-tariff measures reported by Ugandan firms as collected by the International Trade
Centre (ITC) in a survey in 2016. Non-tariff measures (NTMs) (or barriers, NTBs) are defined by the
UNCTAD (2010, xvi) as “[…] policy measures, other than ordinary customs tariffs, that can potentially
have an economic effect on international trade in goods, changing quantities traded, or prices or both.”
The ITC NTM survey on Ugandan firms was conducted in a two-step procedure. In a first stage,
surveyors compiled a list of 2,000 Ugandan exporters and importers using a registry compiled from
information provided by the Uganda National Export Promotion Board, the Uganda Revenue Authority,
and the Uganda Manufacturers Association. Surveyors then randomly selected a sample of 730 firms
stratified by sector to be contacted for a first stage phone interview.23 Out of the 730 firms, 493 firms
agreed to and completed a first stage phone interview. At this stage, 226 companies were identified
that “faced burdensome regulations or procedures over the course of the last 12 months” (ITC 2018,
11). In a second stage, surveyors conducted face-to-face interviews with 204 of these firms to
understand the exact nature and origin of obstacles to trading experienced by these firms (cf. ITC
2018, 10-11).
22 The exception is the UAE, a finding also reflected in Table 18. 23 Stratification by sector allows for the number of firms surveyed to be proportional to the size of sectors in the underlying population of
firms.
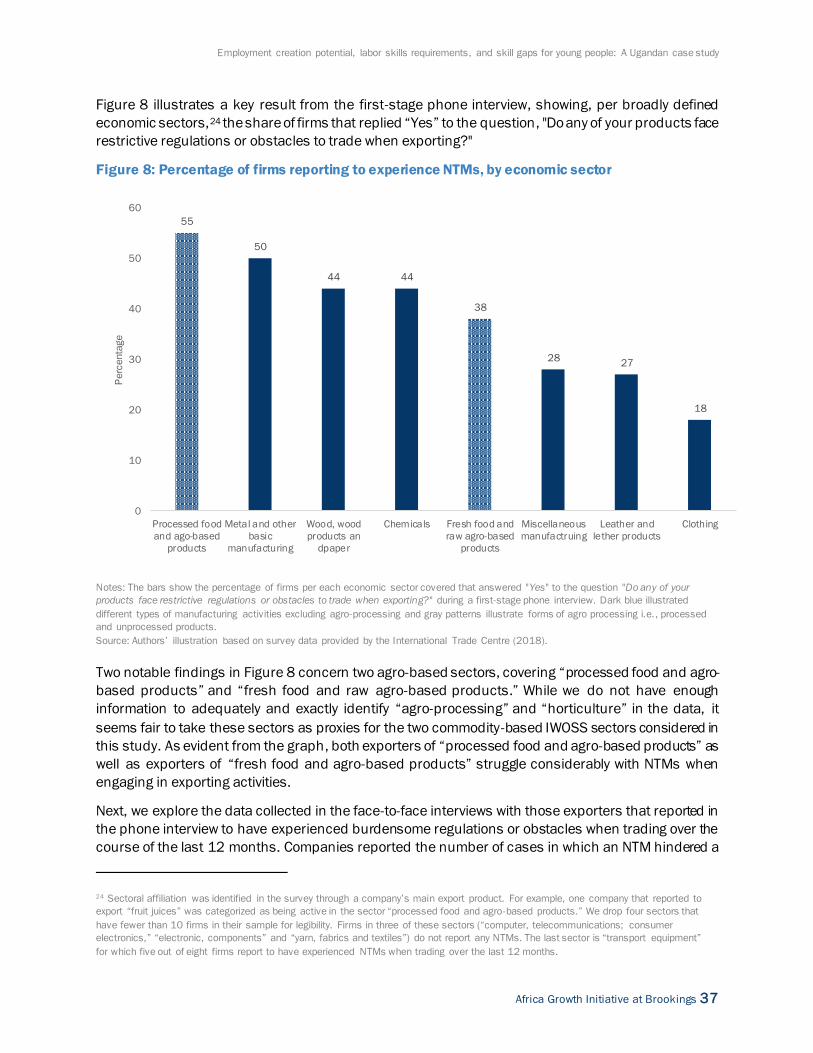
Employment creation potential, labor skills requirements, and skill gaps for young people: A Ugandan case study
Africa Growth Initiative at Brookings 37
Figure 8 illustrates a key result from the first-stage phone interview, showing, per broadly defined
economic sectors,24 the share of firms that replied “Yes” to the question, "Do any of your products face
restrictive regulations or obstacles to trade when exporting?"
Figure 8: Percentage of firms reporting to experience NTMs, by economic sector
Notes: The bars show the percentage of firms per each economic sector covered that answered "Yes" to the question "Do any of your
products face restrictive regulations or obstacles to trade when exporting?" during a first-stage phone interview. Dark blue illustrated
different types of manufacturing activities excluding agro-processing and gray patterns illustrate forms of agro processing i.e. , processed
and unprocessed products.
Source: Authors’ illustration based on survey data provided by the International Trade Centre (2018).
Two notable findings in Figure 8 concern two agro-based sectors, covering “processed food and agro-
based products” and “fresh food and raw agro-based products.” While we do not have enough
information to adequately and exactly identify “agro-processing” and “horticulture” in the data, it
seems fair to take these sectors as proxies for the two commodity-based IWOSS sectors considered in
this study. As evident from the graph, both exporters of “processed food and agro-based products” as
well as exporters of “fresh food and agro-based products” struggle considerably with NTMs when
engaging in exporting activities.
Next, we explore the data collected in the face-to-face interviews with those exporters that reported in
the phone interview to have experienced burdensome regulations or obstacles when trading over the
course of the last 12 months. Companies reported the number of cases in which an NTM hindered a
24 Sectoral affiliation was identified in the survey through a company’s main export product. For example, one company that reported to
export “fruit juices” was categorized as being active in the sector “processed food and agro-based products.” We drop four sectors that
have fewer than 10 firms in their sample for legibility. Firms in three of these sectors (“computer, telecommunications; consumer
electronics,” “electronic, components” and “yarn, fabrics and textiles”) do not report any NTMs. The last sector is “transport equipment”
for which five out of eight firms report to have experienced NTMs when trading over the last 12 months.
55
50
44 44
38
2827
18
0
10
20
30
40
50
60
Processed food
and ago-based
products
Metal and other
basic
manufacturing
Wood, wood
products an
dpaper
Chemicals Fresh food and
raw agro-based
products
Miscellaneous
manufactruing
Leather and
lether products
Clothing
Perc
enta
ge

Industries without smokestacks
38 Africa Growth Initiative at Brookings
trade transaction.25 Here, the data is limited to the 152 exporting companies in the sample and further
disaggregate the information into NTM cases resulting from measures imposed by trading partners
and those caused domestically by an Ugandan institution. The full list is presented in Table 19.
Table 19: Reports of inhibiting non-tariff measures reported by Ugandan exporters (2015-16)
# reported NTM
cases, per
category
# reported NTM cases for exports
shipped to the
EAC, per category Panel A: Categories of NTM trade obstacles for exporters: Caused by trading partners
Product characteristics, including quality or performance requirements 10 0
Tolerance limits for residues of or contamination by certain substances 6 0
Hygienic practices during production 3 0
Microbiological criteria on the final product 6 0 Fumigation 14 0
Labelling (e.g., product labels with information for consumers) 9 3
Packaging 4 1
Protection of human health or safety; environmental protection 10 1 Testing 10 2
Product certification 27 6
Inspection requirement 9 1
Origin of materials and parts 5 0
Processing history 3 1 Pre-shipment inspection 5 1
Other pre-shipment inspection and other entry formalities 8 1
Advance payment of customs duties 3 3
Rules of origin and related certificate of origin 33 12
Total 165 32 Panel B: Categories of NTM trade obstacles for exporters: Caused by Ugandan authorities
Export inspection 3
Certification required for exporting 52
Licensing or permit to export 4
Other export quantitative restrictions 3
Export taxes and charges 10
Other export related measures 12
Total 84 Notes: The data covers information collected in face-to-face interviews with 152 Ugandan exporters.
Source: Authors’ calculations based on survey data provided by the International Trade Centre (2018).
Table 19 reveals a number of important patterns. First and foremost, Ugandan exporters report that a
sizeable share (34 percent) of all NTM cases are caused by domestic institutions. For policy purposes,
this finding is relevant as NTMs/NTBs with trading partners can only be solved through international
dialogue, whereas solving domestic obstacles to trading (e.g., by cutting “red tape,” removing export
taxes and fees or simplifying licensing regimes) should be relatively easy in comparison. Notably,
among the NTM cases reported to have been caused by domestic institutions, 52 out of 84 are related
to certification required for exporting, requested for by Ugandan institutions like the Ministry of Trade,
Industry and Cooperatives. Second, among those NTM cases caused by trading partners, the causes
vary widely, with the only issues causing a large number of NTMs being related to rules of origin and
25 To illustrate, in the face-to-face interview, a firm reported to have experienced obstacles to export due to issues associated with rules of
origin and related certificate of origin for two different products and two different destination markets, thereby resulting in a total of four
NTM cases reported from this company.
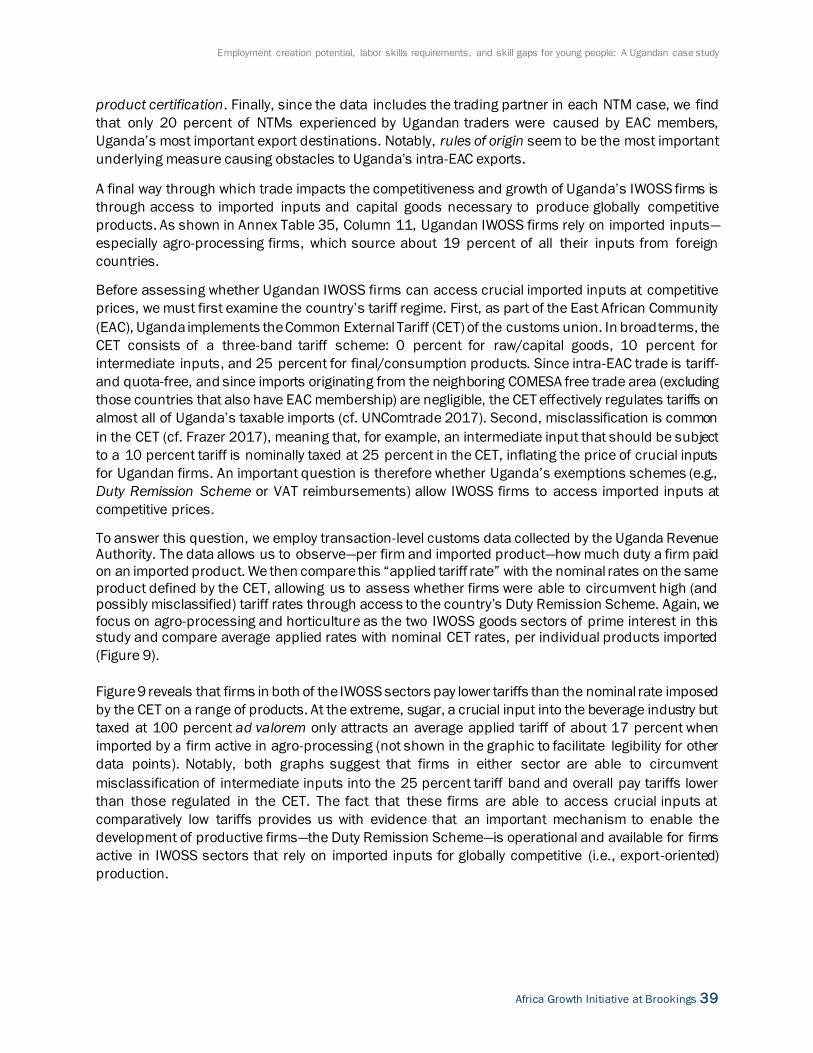
Employment creation potential, labor skills requirements, and skill gaps for young people: A Ugandan case study
Africa Growth Initiative at Brookings 39
product certification. Finally, since the data includes the trading partner in each NTM case, we find
that only 20 percent of NTMs experienced by Ugandan traders were caused by EAC members,
Uganda’s most important export destinations. Notably, rules of origin seem to be the most important
underlying measure causing obstacles to Uganda’s intra-EAC exports.
A final way through which trade impacts the competitiveness and growth of Uganda’s IWOSS firms is
through access to imported inputs and capital goods necessary to produce globally competitive
products. As shown in Annex Table 35, Column 11, Ugandan IWOSS firms rely on imported inputs—
especially agro-processing firms, which source about 19 percent of all their inputs from foreign
countries.
Before assessing whether Ugandan IWOSS firms can access crucial imported inputs at competitive
prices, we must first examine the country’s tariff regime. First, as part of the East African Community
(EAC), Uganda implements the Common External Tariff (CET) of the customs union. In broad terms, the
CET consists of a three-band tariff scheme: 0 percent for raw/capital goods, 10 percent for
intermediate inputs, and 25 percent for final/consumption products. Since intra-EAC trade is tariff-
and quota-free, and since imports originating from the neighboring COMESA free trade area (excluding
those countries that also have EAC membership) are negligible, the CET effectively regulates tariffs on
almost all of Uganda’s taxable imports (cf. UNComtrade 2017). Second, misclassification is common
in the CET (cf. Frazer 2017), meaning that, for example, an intermediate input that should be subject
to a 10 percent tariff is nominally taxed at 25 percent in the CET, inflating the price of crucial inputs
for Ugandan firms. An important question is therefore whether Uganda’s exemptions schemes (e.g.,
Duty Remission Scheme or VAT reimbursements) allow IWOSS firms to access imported inputs at
competitive prices.
To answer this question, we employ transaction-level customs data collected by the Uganda Revenue Authority. The data allows us to observe—per firm and imported product—how much duty a firm paid
on an imported product. We then compare this “applied tariff rate” with the nominal rates on the same
product defined by the CET, allowing us to assess whether firms were able to circumvent high (and possibly misclassified) tariff rates through access to the country’s Duty Remission Scheme. Again, we
focus on agro-processing and horticulture as the two IWOSS goods sectors of prime interest in this study and compare average applied rates with nominal CET rates, per individual products imported
(Figure 9).
Figure 9 reveals that firms in both of the IWOSS sectors pay lower tariffs than the nominal rate imposed
by the CET on a range of products. At the extreme, sugar, a crucial input into the beverage industry but
taxed at 100 percent ad valorem only attracts an average applied tariff of about 17 percent when
imported by a firm active in agro-processing (not shown in the graphic to facilitate legibility for other
data points). Notably, both graphs suggest that firms in either sector are able to circumvent
misclassification of intermediate inputs into the 25 percent tariff band and overall pay tariffs lower
than those regulated in the CET. The fact that these firms are able to access crucial inputs at
comparatively low tariffs provides us with evidence that an important mechanism to enable the
development of productive firms—the Duty Remission Scheme—is operational and available for firms
active in IWOSS sectors that rely on imported inputs for globally competitive (i.e., export-oriented)
production.
Industries without smokestacks
40 Africa Growth Initiative at Brookings
Figure 9: Applied vs. nominal tariff rates on imported inputs by sector: Agro-processing and
horticulture firms
Note: Each dot represents an import product and the size of circles is proportional to the import volume of the product over the course of
the fiscal year by all importing firms in the respective sector. The line indicates the 45-degree line. Observations below the line indicate
that the firm is paying less than the listed tariff.
Source: Authors’ calculations using Uganda Revenue Authority customs data for fiscal year 2015/16.
6.3 Agglomeration
Uganda, like other developing countries, still faces many barriers in the business environment that
discourage (foreign) investment, most notably poorly developed infrastructure; difficulty in accessing
land; and burdensome regulations. Special economic zones (SEZs) were created with in hope that they
would eliminate most of these barriers. A typical SEZ is well-serviced with dedicated industrial-load
electricity supply, roads, railway, fiber-optic internet, and water in order to facilitate quick set-up of
factories and industries. There are two programs in Uganda fall under SEZ policies: industrial parks
and free zones. Industrial parks are geographically delimited areas targeted at specific economic
activities, e.g., textiles, with infrastructure adapted accordingly. Free zones are geographically
delimited areas for production, where raw materials, goods, plants, and machinery are handled,
manufactured, or reconfigured for export without being subject to import and export duties. They are
both meant to provide an institutional framework, modern services, and physical infrastructure that
may not be available in the rest of the country. In addition, firms in both receive corporate income tax
incentives. The key difference between industrial parks and free zones is that the former still have to
comply with the customs regulations (import and export duties) while the latter are exempted provided
80 percent of their goods are for export.
The mandate of developing and regulating industrial parks lies with Uganda Investment Authority (UIA).
UIA’s industrial parks development strategy planned to set up 27 industrial parks country -wide
between 2009 and 2021, though the time frame has been extended to 2024. In May 2019, only 8
were operational while the rest were not yet developed. Notably, even those parks that are operating
do so below their capacity. Indeed, UIA is still looking for investors to fill the Kasese Industrial and
Business Park, while in Mbarara, 37 out of 41 workspaces are occupied (Uganda Update, 2019). The
Mbale district industrial park currently has four factories that are operational, out of 50 expected to
be housed. Firms in these parks are offered renewable land leases at a discounted rate, and the
government provides road, water, and power infrastructure. In cases where government is unable to
provide the infrastructure, land is offered free of charge to investors.
Employment creation potential, labor skills requirements, and skill gaps for young people: A Ugandan case study
Africa Growth Initiative at Brookings 41
Lack of adequate financing explains why most of the gazetted industrial parks are not yet
developed.29,30 For those that are developed, lack of adequate infrastructure hinders investment. In
some parks, the murram roads become impassable and the drainage challenges become visible in
the rainy season. In addition, power and water are inadequate for the heavy investors, hence the need
for upgrades. Relatedly, some investors have been frustrated by the slow and cumbersome process
of surveying and acquisition of deed plans, hence affecting the pace of development.
Free zones were introduced later in 2014 by an Act of Parliament, partly to increase Uganda’s trade
participation in the East African region. Today, there are 22 private licensed free zones in the country,
of which 18 are operational (Uganda Free Zones Authority, 2020). Like industrial parks, the development of and growth of free zones are also hindered by lack of adequate financing and poor
infrastructure. For example, the Arua free zone is constrained by financing and the narrow road leading to the establishment limits its accessibility (ibid). The Kasese free zone is reportedly not serviced with
piped water, and there is no power distribution. According to 2019/20 annual report of the Uganda
Free Zone Authority (UFZA), the general challenges facing free zones in Uganda include: high power tariffs; bureaucracy and administrative delays in documentation by the relevant Government
Institutions that issue certificates and clearances during exportation of agricultural products ; and limited access to long-term finance for investment (UFZA, 2020).
7. Uganda’s future employment: An illustrative 7 percent
annual growth scenario
The National Development Plan III formulates the government of Uganda’s highly ambitious goal of
reaching a GDP per capita of $1,198 by fiscal year 2024/25, propelling the country to middle-income
status.26 The government expects the economy to grow by 7 percent per year over this period in order
to achieve this goal (NDP III: xxi). This section adopts this growth ambition to provide an illustrative
scenario with a view on the likely distribution of jobs across sectors in 2029/30. To compute the likely
future distribution of jobs in Uganda, the forecasts rely on observed historical patterns and a number
of assumptions with respect to employment elasticities as well as the distribution of jobs across
various skill levels within an activity. The goal of this exercise is to make tentative statements regarding
the future number of jobs for each economic activity as well as the skills required to fill these positions.
We provide projections for aggregate and sectoral GDP in 2029/30 by combining observed sectoral
growth rates with Uganda’s 7 percent aspiration and forecast from our baseline year (2016/17) to
2029/30.27 To convert projected economic growth at the sectoral level into demand for labor, we
combine forecasted growth rates with sectoral employment elasticities, taking into account our
previous observation that IWOSS reveal greater employment elasticities than non-IWOSS activities.28
The results of this exercise are presented in Table 20.
In this scenario, IWOSS sectors—with 8 percent annual GDP growth per year—expand somewhat faster
than non-IWOSS (6 percent) and twice as fast as manufacturing (4 percent). Economy-wide
26 For context, in 2019, Uganda’s GDP per capita was $794 (World Bank 2021). 27 Since Uganda did not grow at the envisioned 7 percent rate between the two survey periods 2012/13 and 2016/17, we scale up
sectoral growth rates with a constant that results in 7 percent aggregate growth over the period 2016/17 to 2029/30. 28 As evident from the previous analysis, for many sectors, the elasticities obtained from using two waves of household survey data that
are only four years apart from each other suggest unrealistic employment elasticities, for example, due to declining sectoral employment
combined with positive GDP growth at the same level of aggregation (e.g., in manufacturing). Employment elasticities used for the
projection part of this paper are shown in Table 37 in the Annex alongside observed elasticities in the previous table.
Industries without smokestacks
42 Africa Growth Initiative at Brookings
employment grows at about 4.5 percent, outpaced by employment growth in the IWOSS sectors (6.3
percent). Employment in non-IWOSS (especially agriculture) is growing at a slower pace (3.8 percent)
while manufacturing grows at 4.6 percent. In the aggregate, this projection suggests that the Ugandan
economy will shift slightly towards the more productive IWOSS sectors, with the contribution of IWOSS
to employment increasing by a sizeable 5 percentage points in contrast to the declining importance of
non-IWOSS, and a close-to-stagnant contribution of manufacturing. Among the IWOSS sectors,
employment in sectors that demand higher skills of their workers—such as tourism, finance and
business services, ICT as well as agro-processing—grow at a faster pace than the country-wide average.
Next, we explore the educational background of the workers that are projected to hold these jobs
(Table 21).29 According to the estimates—and in line with the projected strong growth in skill-intensive
IWOSS sectors—within IWOSS activities, the skill profile of workers will shift distinctively towards skilled
and high-skilled workers: While in 2016/17 only about 46 percent of Ugandan workers in IWOSS were
skilled or high-skilled, the scenario in 2029/30 suggests that the same figure would increase to 54
percent, driven equally by an increased demand for skilled workers and high-skilled workers. In non-
IWOSS, the demand for skilled workers is projected to decrease slightly, while the demand for high-
skilled workers is projected to increase, although this is primarily driven by the government sector,
which has high demand with respect to educational attainment. In the aggregate, these trends indicate
a distinct shift in the Ugandan economy towards a more skilled labor force.
The key question is whether Uganda will be able to meet this emerging demand for higher -skilled
workers through an adequately educated and trained workforce. While recent labor market surveys
seem to suggest that job-education miss-matches are not yet a severe issue for Ugandan employers,30
future developments such as increasing automation in many agricultural activities or an emerging
demand for digital skills (e.g., marketing, online payments and booking activities) may well create
obstacles in the labor market going forward.
29 To compute the number of jobs per each skill-level and sector in 2029/30 we proceed as follows: First, we employ the number of
workers in 2016/17 per each sector and each of the three skill levels. To compute the distribution of additional/new jobs within a sector
per each different skill level, we obtain sector- and skill-specific employment growth rates computed from the two UNHS survey waves
(2012/13 and 2016/17). This provides us with projected employment at this level of disaggregation in the year 2029/30 for each of the
sectors. Since the resulting aggregate figures per sector are slightly larger than our sector-level employment projections, we apply the
resulting distribution of new jobs across the three skill levels to the previously calculated sectoral totals of new/additional jobs per sub-
sector and add these to the skill distribution found in 2016/17. Due to data-related inadequacies, we have to smooth out sector- and skill-
specific growth rates in a number of cases. For example, the values found in the data would suggest an annual growth rate for “skilled
labor in transport” of 57 percent. In some cases, we additionally rely on aggregates at the IWOSS/non-IWOSS aggregates for some of the
sub-sectors. These decisions are detailed in Table 38 in the Annex of this paper. 30 For example, Khamis (2019: 19) employs the recent Manpower Survey Uganda (MAPU) 2016/17. The author reports that when asked
the question “How many permanent/temporary/elementary employees do not have required qualification?” 96 percent of interviewed
employers report to have zero employees in this category.
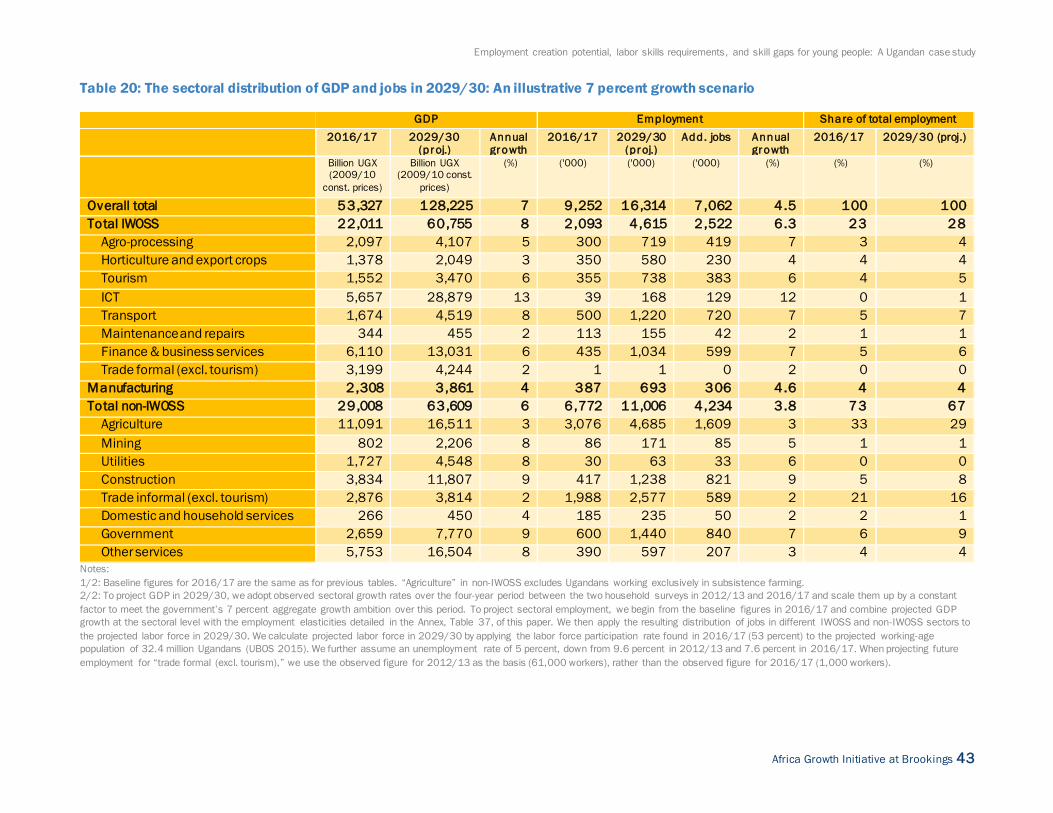
Employment creation potential, labor skills requirements, and skill gaps for young people: A Ugandan case study
Africa Growth Initiative at Brookings 43
Table 20: The sectoral distribution of GDP and jobs in 2029/30: An illustrative 7 percent growth scenario
GDP Employment Share of total employment 2016/17 2029/30
(proj.) Annual growth
2016/17 2029/30 (proj.)
Add. jobs Annual growth
2016/17 2029/30 (proj.)
Billion UGX (2009/10
const. prices)
Billion UGX (2009/10 const.
prices)
(%) ('000) ('000) ('000) (%) (%) (%)
Overall total 53,327 128,225 7 9,252 16,314 7,062 4.5 100 100
Total IWOSS 22,011 60,755 8 2,093 4,615 2,522 6.3 23 28
Agro-processing 2,097 4,107 5 300 719 419 7 3 4
Horticulture and export crops 1,378 2,049 3 350 580 230 4 4 4
Tourism 1,552 3,470 6 355 738 383 6 4 5
ICT 5,657 28,879 13 39 168 129 12 0 1
Transport 1,674 4,519 8 500 1,220 720 7 5 7
Maintenance and repairs 344 455 2 113 155 42 2 1 1
Finance & business services 6,110 13,031 6 435 1,034 599 7 5 6
Trade formal (excl. tourism) 3,199 4,244 2 1 1 0 2 0 0
Manufacturing 2,308 3,861 4 387 693 306 4.6 4 4
Total non-IWOSS 29,008 63,609 6 6,772 11,006 4,234 3.8 73 67
Agriculture 11,091 16,511 3 3,076 4,685 1,609 3 33 29
Mining 802 2,206 8 86 171 85 5 1 1
Utilities 1,727 4,548 8 30 63 33 6 0 0
Construction 3,834 11,807 9 417 1,238 821 9 5 8
Trade informal (excl. tourism) 2,876 3,814 2 1,988 2,577 589 2 21 16
Domestic and household services 266 450 4 185 235 50 2 2 1
Government 2,659 7,770 9 600 1,440 840 7 6 9
Other services 5,753 16,504 8 390 597 207 3 4 4
Notes:
1/2: Baseline figures for 2016/17 are the same as for previous tables. “Agriculture” in non-IWOSS excludes Ugandans working exclusively in subsistence farming.
2/2: To project GDP in 2029/30, we adopt observed sectoral growth rates over the four-year period between the two household surveys in 2012/13 and 2016/17 and scale them up by a constant
factor to meet the government’s 7 percent aggregate growth ambition over this period. To project sectoral employment, we begin from the baseline figures in 2016/17 and combine projected GDP
growth at the sectoral level with the employment elasticities detailed in the Annex, Table 37, of this paper. We then apply the resulting distribution of jobs in different IWOSS and non-IWOSS sectors to
the projected labor force in 2029/30. We calculate projected labor force in 2029/30 by applying the labor force participation rate found in 2016/17 (53 percent) to the projected working-age
population of 32.4 million Ugandans (UBOS 2015). We further assume an unemployment rate of 5 percent, down from 9.6 percent in 2012/13 and 7.6 percent in 2016/17. When projecting future
employment for “trade formal (excl. tourism),” we use the observed figure for 2012/13 as the basis (61,000 workers), rather than the observed figure for 2016/17 (1,000 workers).

Industries without smokestacks
44 Africa Growth Initiative at Brookings
Table 21: Uganda’s 7 percent growth scenario: Projected labor demand by skill level
Notes:
1/3: Baseline figures for 2016/17 are the same as for previous tables. “Agriculture” in Non-IWOSS excludes Ugandans working exclusively in subsistence farming.
2/3: Since in the original data not every survey respondent reported their skill level, we apply the shares obtained from these data to the total employment per sector reported in the previous table.
The only adjustment we make is for the distribution of workers per skill-level in “Trade informal (excl. tourism)” since we find an unrealistic distribution in the original data. To rectify, we employ the
skill distribution for this sector from a neighboring country (Rwanda): 0 percent high skilled workers, 4 percent skilled workers and 94 percent low skilled workers, and assume this distribution remains
constant over the forecasting period.
3/3: To compute the number of jobs per each skill-level and sector in 2029/30 we proceed as follows: First, we employ the number of workers in 2016/17 per each sector and each of the three skill
levels. To compute the distribution of additional/new jobs within a sector per each different skill level, we obtain sector- and skill-specific employment growth rates computed from the two UNHS
survey waves (2012/13 and 2016/17). This provides us with projected employment at this level of disaggregation in the year 2029/30 for each of the sectors. Since the resulting aggregate figures
per sector are slightly larger than our sector-level employment projections, we apply the resulting distribution of new jobs across the three skill levels to the previously calculated sectoral totals of
new/additional job per sub-sector and add these to the skill distribution found in 2016/17. Due to data-related inadequacies we have to smooth out sector- and skill-specific growth rates in a number
of cases. For example, the values found in the data would suggest an annual growth rate for “sk illed labor in transport” of 57 percent. In some cases, we additionally rely on aggregates at the
IWOSS/non-IWOSS aggregates for some of the sub-sectors. These decisions are detailed in Table 38 in the Annex of this paper.
Source: Authors’ calculations using UBOS data.
2016/17 2029/30 (projected) Annual % growth (2016/17 –
2029/30) High
skilled
Sk illed Low
sk illed
High
sk illed
Skilled Low
sk illed
High
sk illed
Sk illed Low
sk illed
High skilled Sk illed
Share (%) ( '000) Share (%) (%)
Overall total 7 13 79 2,300 2,842 11,172 14 17 68 10 7
Total IWOSS 11 33 57 670 1,812 2,133 15 39 46 9 8
Agro-processing 2 26 72 119 371 229 17 52 32 27 13
Horticulture and export crops 0 1 99 1 4 576 0 1 99 4 4
Tourism 6 74 21 52 572 114 7 78 15 8 6
ICT 28 63 9 46 115 7 27 68 4 12 13
Transport 0 18 82 1 237 982 0 19 80 -5 8
Maintenance and repairs 1 25 74 12 57 85 8 37 55 20 6
Finance & business services 42 44 13 439 456 139 42 44 13 7 7
Trade formal (excl. tourism) 15 8 77 0 0 1 15 8 77 2 2
Manufacturing 1 9 89 88 250 354 13 36 51 24 16
Total non-IWOSS 7 8 86 1,542 780 8,685 14 7 79 10 3
Agriculture 0 1 99 2 80 4,603 0 2 98 -10 10
Mining 0 5 95 1 7 164 0 4 96 5 5
Utilities 9 42 49 6 27 31 9 42 49 6 6
Construction 3 3 94 100 60 1,079 8 5 87 18 12
Trade informal (excl. tourism) 0 4 96 0 103 2,474 0 4 96 … 2
Domestic and household services 0 13 87 0 24 211 0 10 90 … 0
Government 71 24 5 1,425 14 1 99 1 0 10 -16
Other services 3 60 37 9 465 123 2 78 21 -2 5
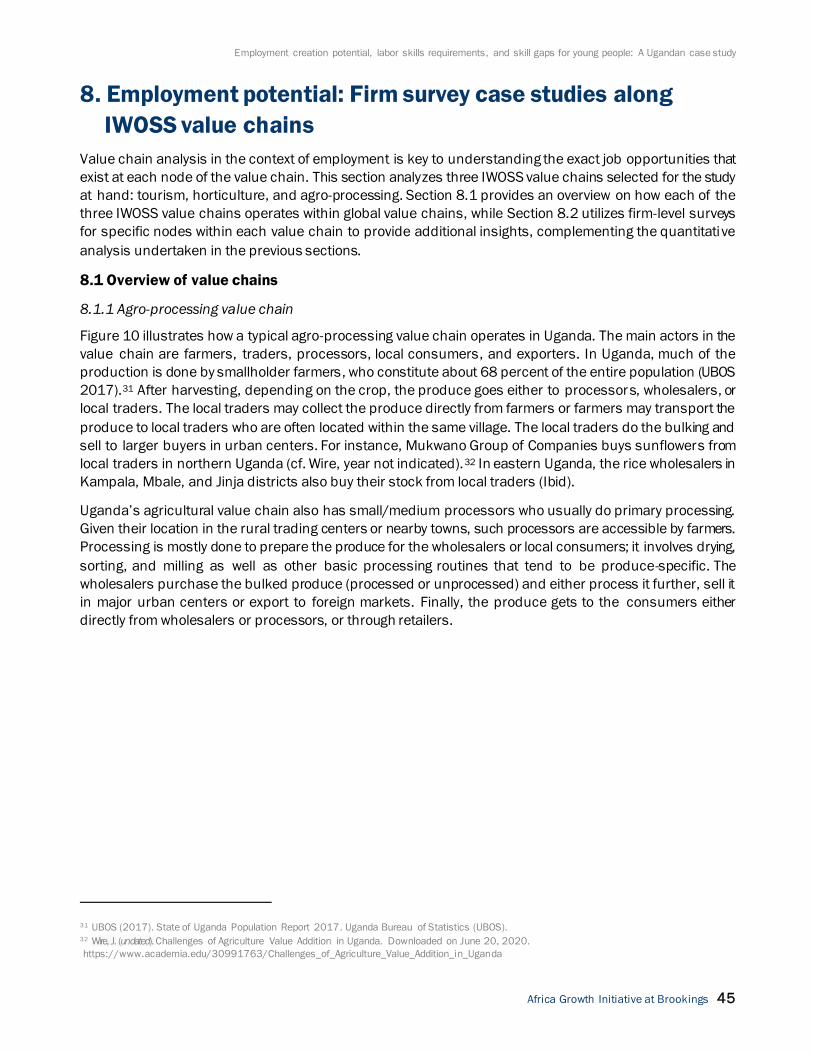
Employment creation potential, labor skills requirements, and skill gaps for young people: A Ugandan case study
Africa Growth Initiative at Brookings 45
8. Employment potential: Firm survey case studies along
IWOSS value chains
Value chain analysis in the context of employment is key to understanding the exact job opportunities that
exist at each node of the value chain. This section analyzes three IWOSS value chains selected for the study
at hand: tourism, horticulture, and agro-processing. Section 8.1 provides an overview on how each of the
three IWOSS value chains operates within global value chains, while Section 8.2 utilizes firm-level surveys
for specific nodes within each value chain to provide additional insights, complementing the quantitative
analysis undertaken in the previous sections.
8.1 Overview of value chains
8.1.1 Agro-processing value chain
Figure 10 illustrates how a typical agro-processing value chain operates in Uganda. The main actors in the
value chain are farmers, traders, processors, local consumers, and exporters. In Uganda, much of the
production is done by smallholder farmers, who constitute about 68 percent of the entire population (UBOS
2017).31 After harvesting, depending on the crop, the produce goes either to processors, wholesalers, or
local traders. The local traders may collect the produce directly from farmers or farmers may transport the
produce to local traders who are often located within the same village. The local traders do the bulking and
sell to larger buyers in urban centers. For instance, Mukwano Group of Companies buys sunflowers from
local traders in northern Uganda (cf. Wire, year not indicated).32 In eastern Uganda, the rice wholesalers in
Kampala, Mbale, and Jinja districts also buy their stock from local traders (Ibid).
Uganda’s agricultural value chain also has small/medium processors who usually do primary processing.
Given their location in the rural trading centers or nearby towns, such processors are accessible by farmers.
Processing is mostly done to prepare the produce for the wholesalers or local consumers; it involves drying,
sorting, and milling as well as other basic processing routines that tend to be produce-specific. The
wholesalers purchase the bulked produce (processed or unprocessed) and either process it further, sell it
in major urban centers or export to foreign markets. Finally, the produce gets to the consumers either
directly from wholesalers or processors, or through retailers.
31 UBOS (2017). State of Uganda Population Report 2017. Uganda Bureau of Statistics (UBOS). 32 Wire, J. (undated). Challenges of Agriculture Value Addition in Uganda. Downloaded on June 20, 2020.
https://www.academia.edu/30991763/Challenges_of_Agriculture_Value_Addition_in_Uganda
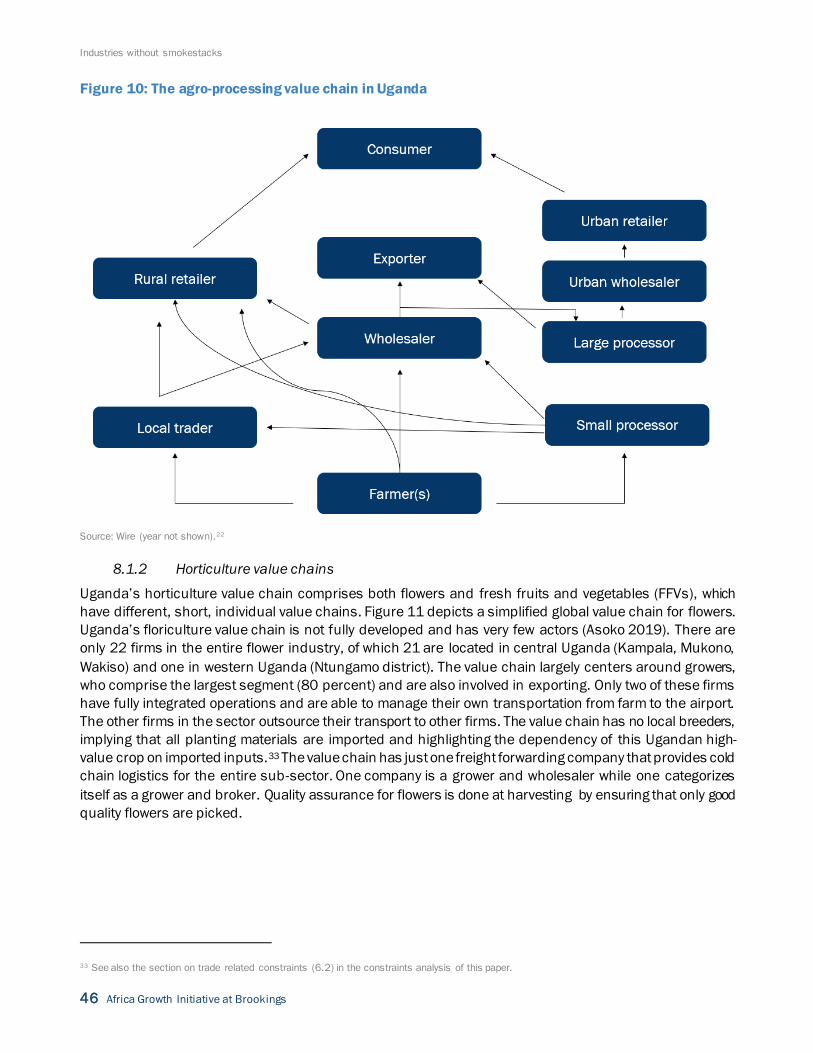
Industries without smokestacks
46 Africa Growth Initiative at Brookings
Figure 10: The agro-processing value chain in Uganda
Source: Wire (year not shown).22
8.1.2 Horticulture value chains
Uganda’s horticulture value chain comprises both flowers and fresh fruits and vegetables (FFVs), which
have different, short, individual value chains. Figure 11 depicts a simplified global value chain for flowers.
Uganda’s floriculture value chain is not fully developed and has very few actors (Asoko 2019). There are
only 22 firms in the entire flower industry, of which 21 are located in central Uganda (Kampala, Mukono,
Wakiso) and one in western Uganda (Ntungamo district). The value chain largely centers around growers,
who comprise the largest segment (80 percent) and are also involved in exporting. Only two of these firms
have fully integrated operations and are able to manage their own transportation from farm to the airport.
The other firms in the sector outsource their transport to other firms. The value chain has no local breeders,
implying that all planting materials are imported and highlighting the dependency of this Ugandan high-
value crop on imported inputs.33 The value chain has just one freight forwarding company that provides cold
chain logistics for the entire sub-sector. One company is a grower and wholesaler while one categorizes
itself as a grower and broker. Quality assurance for flowers is done at harvesting by ensuring that only good
quality flowers are picked.
33 See also the section on trade related constraints (6.2) in the constraints analysis of this paper.
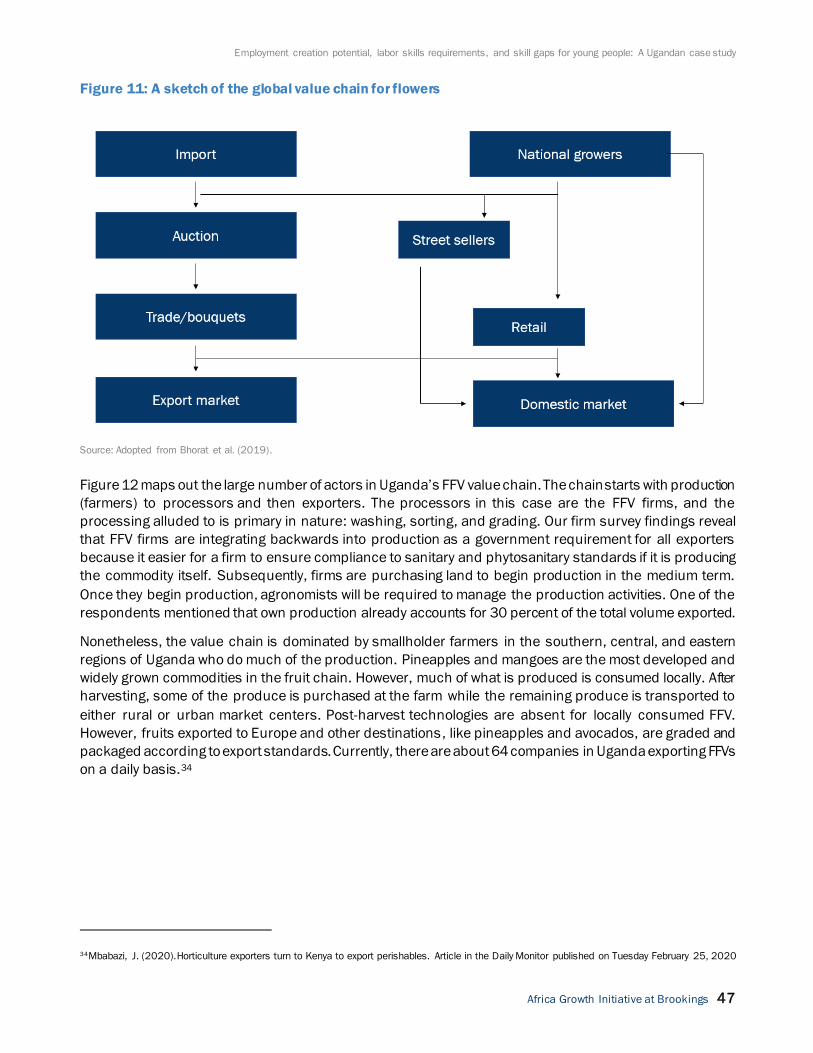
Employment creation potential, labor skills requirements, and skill gaps for young people: A Ugandan case study
Africa Growth Initiative at Brookings 47
Figure 11: A sketch of the global value chain for flowers
Source: Adopted from Bhorat et al. (2019).
Figure 12 maps out the large number of actors in Uganda’s FFV value chain. The chain starts with production
(farmers) to processors and then exporters. The processors in this case are the FFV firms, and the
processing alluded to is primary in nature: washing, sorting, and grading. Our firm survey findings reveal
that FFV firms are integrating backwards into production as a government requirement for all exporters
because it easier for a firm to ensure compliance to sanitary and phytosanitary standards if it is producing
the commodity itself. Subsequently, firms are purchasing land to begin production in the medium term.
Once they begin production, agronomists will be required to manage the production activities. One of the
respondents mentioned that own production already accounts for 30 percent of the total volume exported.
Nonetheless, the value chain is dominated by smallholder farmers in the southern, central, and eastern
regions of Uganda who do much of the production. Pineapples and mangoes are the most developed and
widely grown commodities in the fruit chain. However, much of what is produced is consumed locally. After
harvesting, some of the produce is purchased at the farm while the remaining produce is transported to
either rural or urban market centers. Post-harvest technologies are absent for locally consumed FFV.
However, fruits exported to Europe and other destinations, like pineapples and avocados, are graded and
packaged according to export standards. Currently, there are about 64 companies in Uganda exporting FFVs
on a daily basis.34
34Mbabazi, J. (2020).Horticulture exporters turn to Kenya to export perishables. Article in the Daily Monitor published on Tuesday February 25, 2020
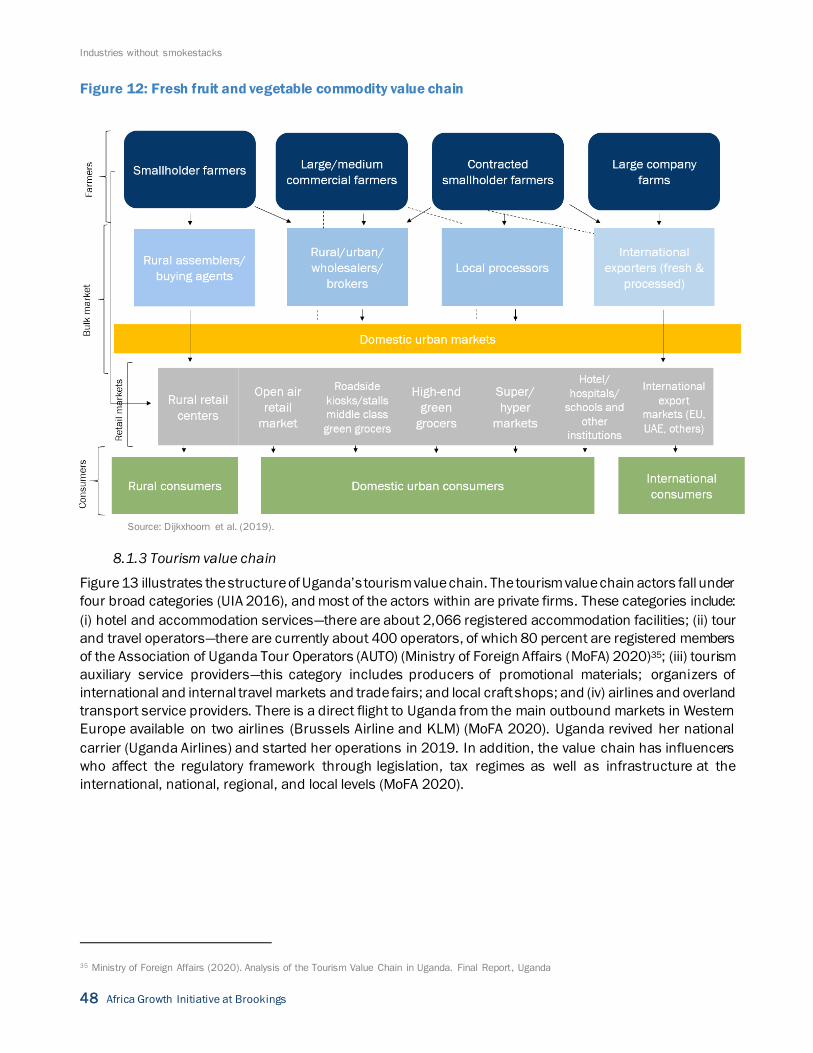
Industries without smokestacks
48 Africa Growth Initiative at Brookings
Figure 12: Fresh fruit and vegetable commodity value chain
Source: Dijkxhoorn et al. (2019).
8.1.3 Tourism value chain
Figure 13 illustrates the structure of Uganda’s tourism value chain. The tourism value chain actors fall under
four broad categories (UIA 2016), and most of the actors within are private firms. These categories include:
(i) hotel and accommodation services—there are about 2,066 registered accommodation facilities; (ii) tour
and travel operators—there are currently about 400 operators, of which 80 percent are registered members
of the Association of Uganda Tour Operators (AUTO) (Ministry of Foreign Affairs (MoFA) 2020)35; (iii) tourism
auxiliary service providers—this category includes producers of promotional materials; organizers of
international and internal travel markets and trade fairs; and local craft shops; and (iv) airlines and overland
transport service providers. There is a direct flight to Uganda from the main outbound markets in Western
Europe available on two airlines (Brussels Airline and KLM) (MoFA 2020). Uganda revived her national
carrier (Uganda Airlines) and started her operations in 2019. In addition, the value chain has influencers
who affect the regulatory framework through legislation, tax regimes as well as infrastructure at the
international, national, regional, and local levels (MoFA 2020).
35 Ministry of Foreign Affairs (2020). Analysis of the Tourism Value Chain in Uganda. Final Report, Uganda
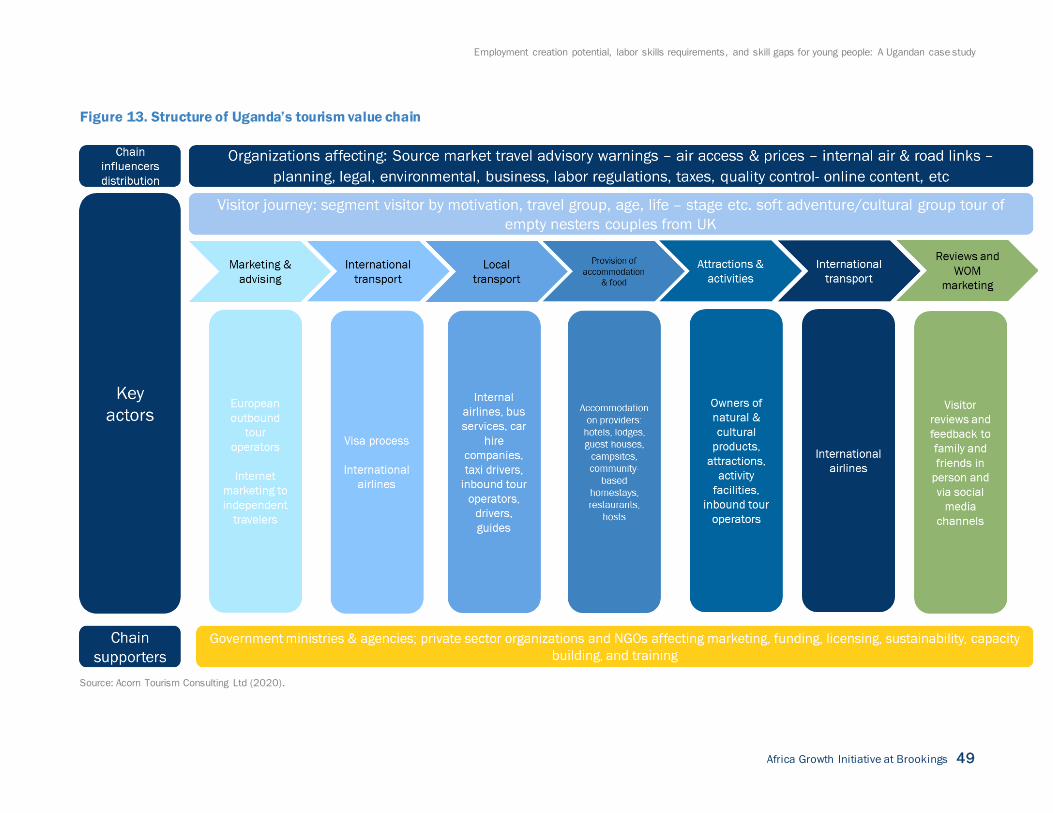
Employment creation potential, labor skills requirements, and skill gaps for young people: A Ugandan case study
Africa Growth Initiative at Brookings 49
Figure 13. Structure of Uganda’s tourism value chain
Source: Acorn Tourism Consulting Ltd (2020).
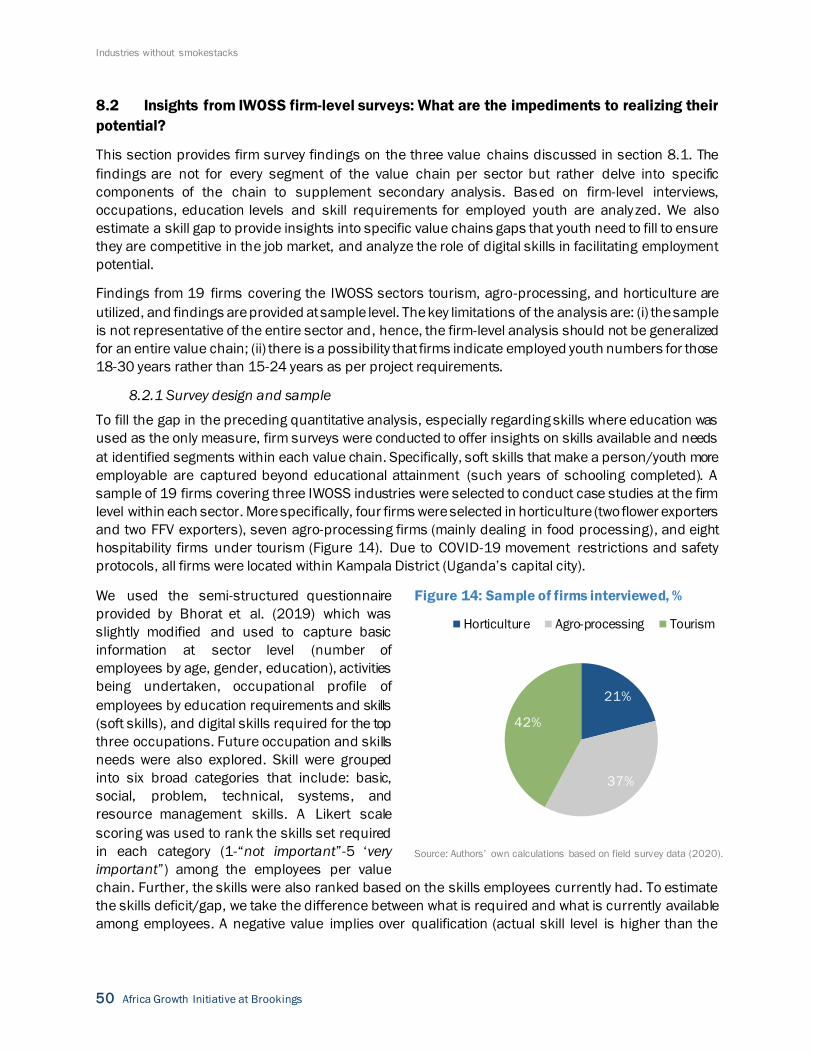
Industries without smokestacks
50 Africa Growth Initiative at Brookings
8.2 Insights from IWOSS firm-level surveys: What are the impediments to realizing their
potential?
This section provides firm survey findings on the three value chains discussed in section 8.1. The
findings are not for every segment of the value chain per sector but rather delve into specific
components of the chain to supplement secondary analysis. Based on firm-level interviews,
occupations, education levels and skill requirements for employed youth are analyzed. We also
estimate a skill gap to provide insights into specific value chains gaps that youth need to fill to ensure
they are competitive in the job market, and analyze the role of digital skills in facilitating employment
potential.
Findings from 19 firms covering the IWOSS sectors tourism, agro-processing, and horticulture are
utilized, and findings are provided at sample level. The key limitations of the analysis are: (i) the sample
is not representative of the entire sector and, hence, the firm-level analysis should not be generalized
for an entire value chain; (ii) there is a possibility that firms indicate employed youth numbers for those
18-30 years rather than 15-24 years as per project requirements.
8.2.1 Survey design and sample
To fill the gap in the preceding quantitative analysis, especially regarding skills where education was
used as the only measure, firm surveys were conducted to offer insights on skills available and needs
at identified segments within each value chain. Specifically, soft skills that make a person/youth more
employable are captured beyond educational attainment (such years of schooling completed). A
sample of 19 firms covering three IWOSS industries were selected to conduct case studies at the firm
level within each sector. More specifically, four firms were selected in horticulture (two flower exporters
and two FFV exporters), seven agro-processing firms (mainly dealing in food processing), and eight
hospitability firms under tourism (Figure 14). Due to COVID-19 movement restrictions and safety
protocols, all firms were located within Kampala District (Uganda’s capital city).
We used the semi-structured questionnaire
provided by Bhorat et al. (2019) which was
slightly modified and used to capture basic
information at sector level (number of
employees by age, gender, education), activities
being undertaken, occupational profile of
employees by education requirements and skills
(soft skills), and digital skills required for the top
three occupations. Future occupation and skills
needs were also explored. Skill were grouped
into six broad categories that include: basic,
social, problem, technical, systems, and
resource management skills. A Likert scale
scoring was used to rank the skills set required
in each category (1-“not important”-5 ‘very
important”) among the employees per value
chain. Further, the skills were also ranked based on the skills employees currently had. To estimate
the skills deficit/gap, we take the difference between what is required and what is currently available
among employees. A negative value implies over qualification (actual skill level is higher than the
Figure 14: Sample of firms interviewed, %
Source: Authors’ own calculations based on field survey data (2020).
21%
37%
42%
Horticulture Agro-processing Tourism
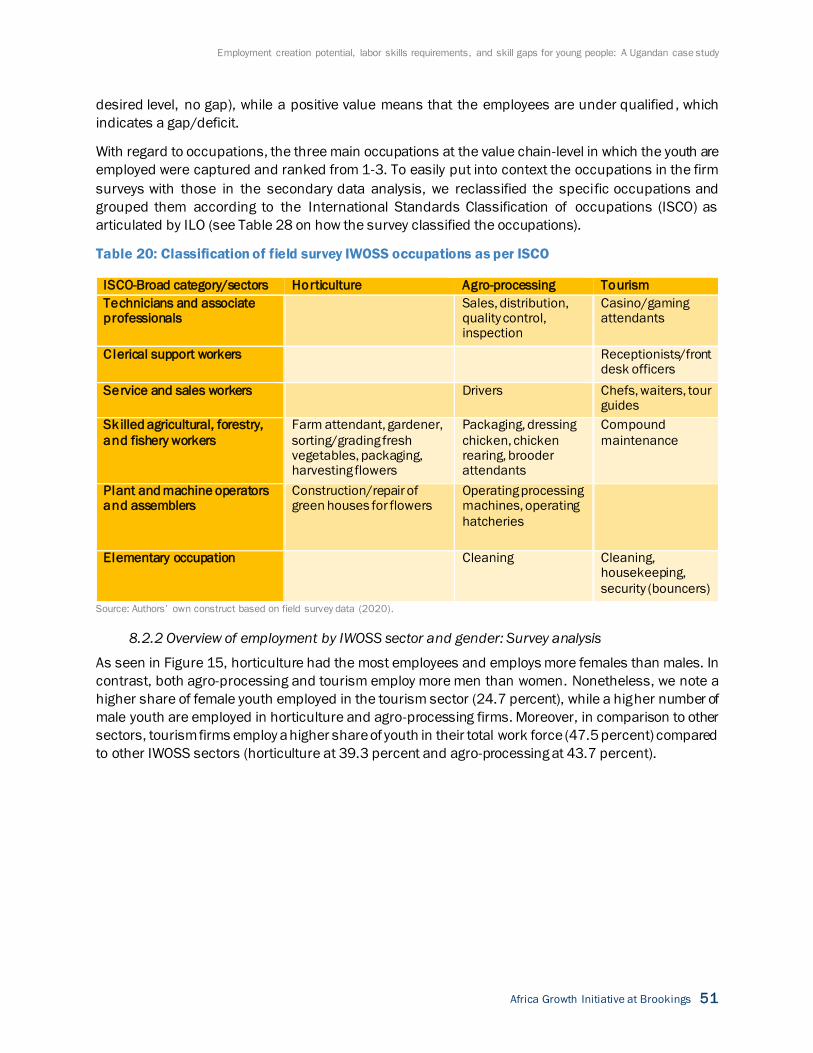
Employment creation potential, labor skills requirements, and skill gaps for young people: A Ugandan case study
Africa Growth Initiative at Brookings 51
desired level, no gap), while a positive value means that the employees are under qualified , which
indicates a gap/deficit.
With regard to occupations, the three main occupations at the value chain-level in which the youth are
employed were captured and ranked from 1-3. To easily put into context the occupations in the firm
surveys with those in the secondary data analysis, we reclassified the specific occupations and
grouped them according to the International Standards Classification of occupations (ISCO) as
articulated by ILO (see Table 28 on how the survey classified the occupations).
Table 20: Classification of field survey IWOSS occupations as per ISCO
ISCO-Broad category/sectors Horticulture Agro-processing Tourism
Technicians and associate professionals
Sales, distribution, quality control, inspection
Casino/gaming attendants
C lerical support workers
Receptionists/front desk officers
Service and sales workers
Drivers Chefs, waiters, tour guides
Sk illed agricultural, forestry,
and fishery workers
Farm attendant, gardener,
sorting/grading fresh vegetables, packaging, harvesting flowers
Packaging, dressing
chicken, chicken rearing, brooder attendants
Compound
maintenance
Plant and machine operators and assemblers
Construction/repair of green houses for flowers
Operating processing machines, operating
hatcheries
Elementary occupation Cleaning Cleaning, housekeeping,
security (bouncers)
Source: Authors’ own construct based on field survey data (2020).
8.2.2 Overview of employment by IWOSS sector and gender: Survey analysis
As seen in Figure 15, horticulture had the most employees and employs more females than males. In
contrast, both agro-processing and tourism employ more men than women. Nonetheless, we note a
higher share of female youth employed in the tourism sector (24.7 percent), while a higher number of
male youth are employed in horticulture and agro-processing firms. Moreover, in comparison to other
sectors, tourism firms employ a higher share of youth in their total work force (47.5 percent) compared
to other IWOSS sectors (horticulture at 39.3 percent and agro-processing at 43.7 percent).
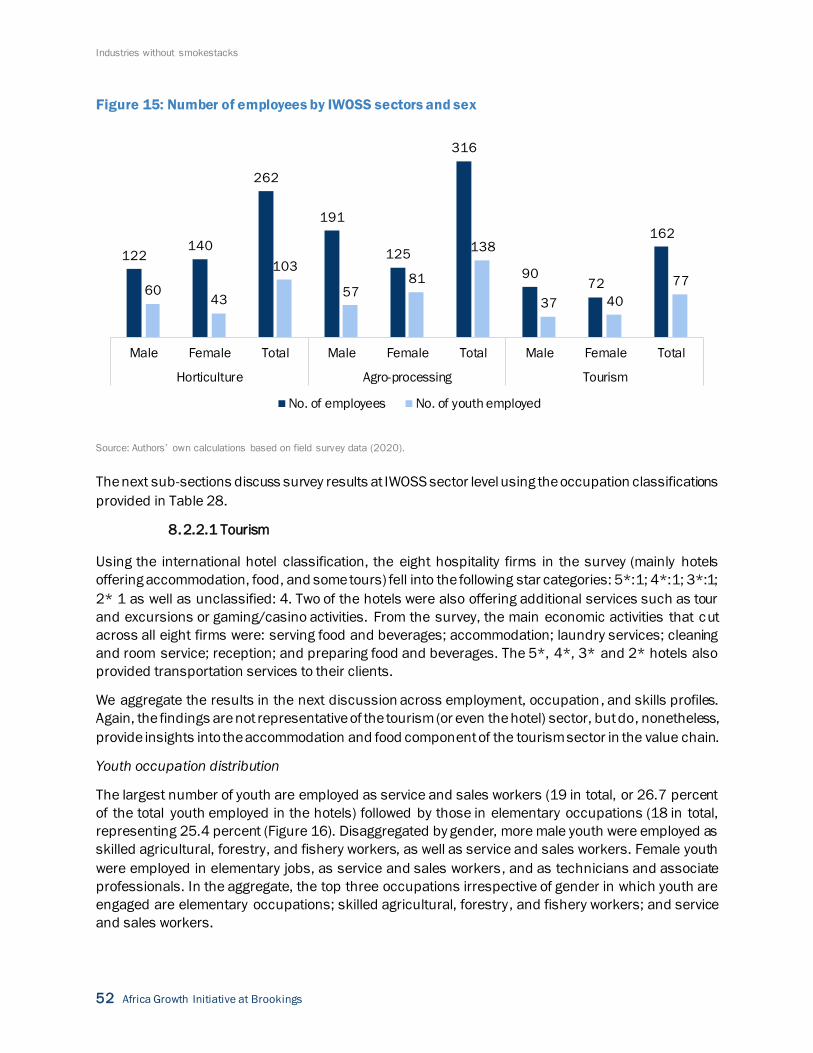
Industries without smokestacks
52 Africa Growth Initiative at Brookings
Figure 15: Number of employees by IWOSS sectors and sex
Source: Authors’ own calculations based on field survey data (2020).
The next sub-sections discuss survey results at IWOSS sector level using the occupation classifications
provided in Table 28.
8.2.2.1 Tourism
Using the international hotel classification, the eight hospitality firms in the survey (mainly hotels
offering accommodation, food, and some tours) fell into the following star categories: 5*:1; 4*:1; 3*:1;
2* 1 as well as unclassified: 4. Two of the hotels were also offering additional services such as tour
and excursions or gaming/casino activities. From the survey, the main economic activities that cut
across all eight firms were: serving food and beverages; accommodation; laundry services; cleaning
and room service; reception; and preparing food and beverages. The 5*, 4*, 3* and 2* hotels also
provided transportation services to their clients.
We aggregate the results in the next discussion across employment, occupation, and skills profiles.
Again, the findings are not representative of the tourism (or even the hotel) sector, but do, nonetheless,
provide insights into the accommodation and food component of the tourism sector in the value chain.
Youth occupation distribution
The largest number of youth are employed as service and sales workers (19 in total, or 26.7 percent
of the total youth employed in the hotels) followed by those in elementary occupations (18 in total,
representing 25.4 percent (Figure 16). Disaggregated by gender, more male youth were employed as
skilled agricultural, forestry, and fishery workers, as well as service and sales workers. Female youth
were employed in elementary jobs, as service and sales workers, and as technicians and associate
professionals. In the aggregate, the top three occupations irrespective of gender in which youth are
engaged are elementary occupations; skilled agricultural, forestry, and fishery workers; and service
and sales workers.
122140
262
191
125
316
9072
162
6043
103
5781
138
37 40
77
Male Female Total Male Female Total Male Female Total
Horticulture Agro-processing Tourism
No. of employees No. of youth employed

Employment creation potential, labor skills requirements, and skill gaps for young people: A Ugandan case study
Africa Growth Initiative at Brookings 53
Figure 16: Youth occupational distribution by gender in tourism
Source: Authors’ own calculations based on field survey data (2020).
Expected new jobs
During the survey, firms were asked whether they had plans of expanding their operations in the
medium and long term, and the new occupations that might come up as a result of the expansion. In
tourism, hoteliers reported that three main new occupations expected to be created were
housekeepers/baristas (2), concierge (1), and IT (3) persons. IT persons would be required to do
digital-related tasks.
Skills availability levels
The current skills (education) levels by hotel classification indicate that at least for the classified hotels,
none employ youth without any formal education and a vast majority of the youth employed in 2*, 3*
and 5* hotels also have completed secondary education. The majority of the youth employed by the
4* hotels in the sample had some secondary education (Figure 17). Generally, there was variation in
skills/education requirements by hotel classification. For example, the unclassified hotels employ
workers with a range of skills, including degree level.
Given that staff professionalism is one of the criteria used to classify hotels, employees in such
classified hotels have completed at least a secondary level of education while unclassified hotels have
some employees with no education. Furthermore, hotel classification has implications on wages paid
to employees. Although there is no established minimum wage in the sector, there is an established
salary range provided for each occupation.36 Consequently, wages in classified hotels are higher than
those in unclassified ones. Importantly, the issue of employment in Uganda is not only a matter of
unemployment but also one of decent employment. These surveys reveal that, in order to secure
36 Paylab (undated). Salaries in the category: Tourism, Gastronomy, Hotel Business in Uganda. Available at:
https://www.paylab.com/ug/salaryinfo/tourism-gastronomy-hotel-business
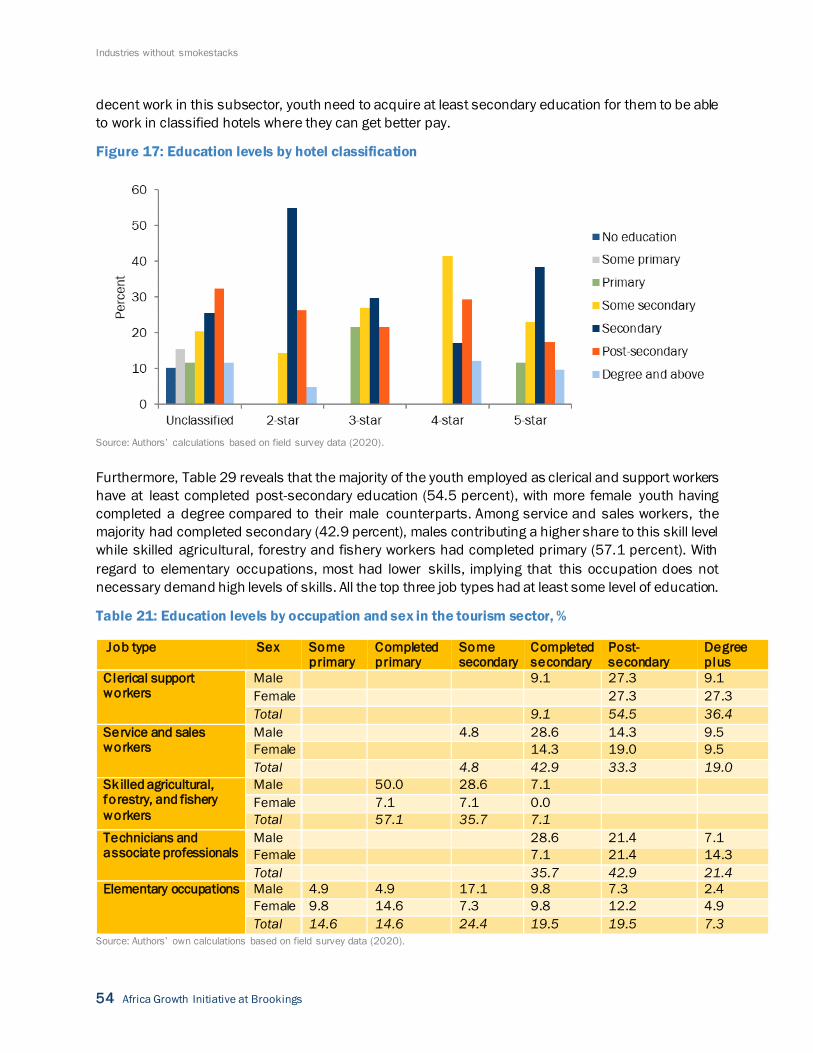
Industries without smokestacks
54 Africa Growth Initiative at Brookings
decent work in this subsector, youth need to acquire at least secondary education for them to be able
to work in classified hotels where they can get better pay.
Figure 17: Education levels by hotel classification
Source: Authors’ calculations based on field survey data (2020).
Furthermore, Table 29 reveals that the majority of the youth employed as clerical and support workers
have at least completed post-secondary education (54.5 percent), with more female youth having
completed a degree compared to their male counterparts. Among service and sales workers, the
majority had completed secondary (42.9 percent), males contributing a higher share to this skill level
while skilled agricultural, forestry and fishery workers had completed primary (57.1 percent). With
regard to elementary occupations, most had lower skills, implying that this occupation does not
necessary demand high levels of skills. All the top three job types had at least some level of education.
Table 21: Education levels by occupation and sex in the tourism sector, %
Job type Sex Some primary
Completed primary
Some secondary
Completed secondary
Post-secondary
Degree plus
C lerical support workers
Male
9.1 27.3 9.1
Female
27.3 27.3
Total
9.1 54.5 36.4
Service and sales workers
Male
4.8 28.6 14.3 9.5
Female
14.3 19.0 9.5
Total
4.8 42.9 33.3 19.0
Skilled agricultural, forestry, and fishery
workers
Male
50.0 28.6 7.1
Female
7.1 7.1 0.0
Total
57.1 35.7 7.1
Technicians and associate professionals
Male
28.6 21.4 7.1
Female
7.1 21.4 14.3
Total
35.7 42.9 21.4
Elementary occupations
Male 4.9 4.9 17.1 9.8 7.3 2.4
Female 9.8 14.6 7.3 9.8 12.2 4.9
Total 14.6 14.6 24.4 19.5 19.5 7.3
Source: Authors’ own calculations based on field survey data (2020).
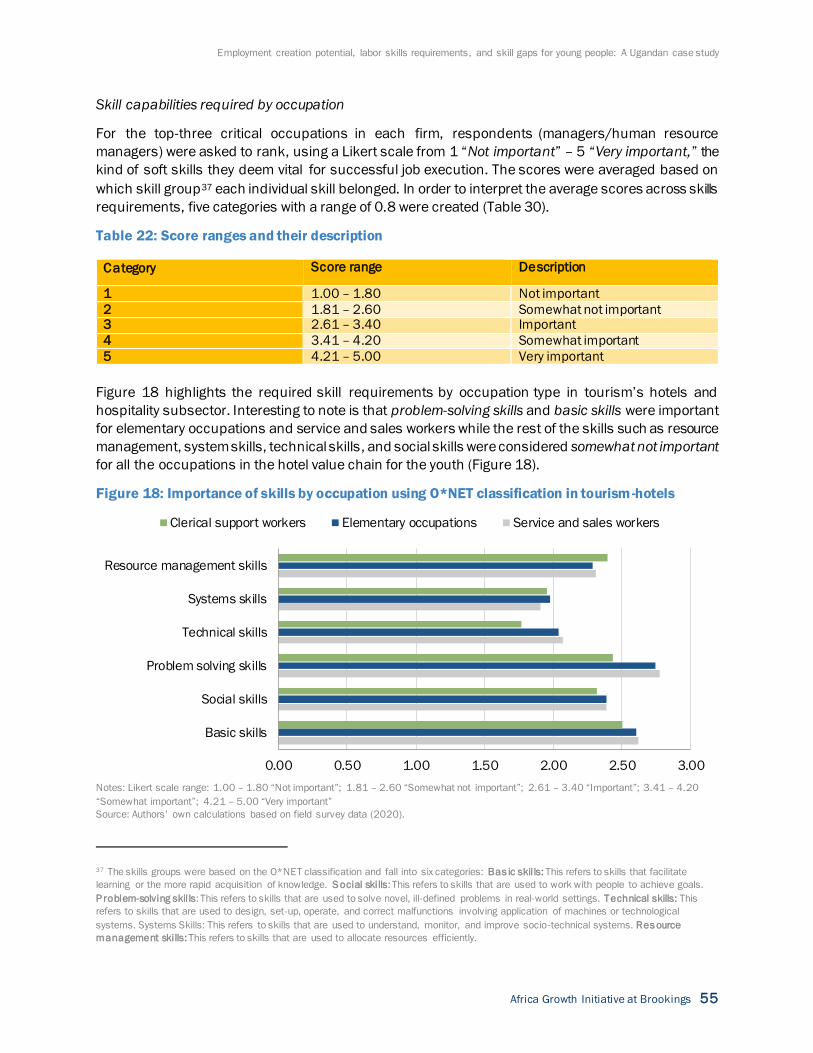
Employment creation potential, labor skills requirements, and skill gaps for young people: A Ugandan case study
Africa Growth Initiative at Brookings 55
Skill capabilities required by occupation
For the top-three critical occupations in each firm, respondents (managers/human resource
managers) were asked to rank, using a Likert scale from 1 “Not important” – 5 “Very important,” the
kind of soft skills they deem vital for successful job execution. The scores were averaged based on
which skill group37 each individual skill belonged. In order to interpret the average scores across skills
requirements, five categories with a range of 0.8 were created (Table 30).
Table 22: Score ranges and their description
Category Score range Description
1 1.00 – 1.80 Not important
2 1.81 – 2.60 Somewhat not important 3 2.61 – 3.40 Important
4 3.41 – 4.20 Somewhat important
5 4.21 – 5.00 Very important
Figure 18 highlights the required skill requirements by occupation type in tourism’s hotels and
hospitality subsector. Interesting to note is that problem-solving skills and basic skills were important
for elementary occupations and service and sales workers while the rest of the skills such as resource
management, system skills, technical skills, and social skills were considered somewhat not important
for all the occupations in the hotel value chain for the youth (Figure 18).
Figure 18: Importance of skills by occupation using O*NET classification in tourism-hotels
Notes: Likert scale range: 1.00 – 1.80 “Not important”; 1.81 – 2.60 “Somewhat not important”; 2.61 – 3.40 “Important”; 3.41 – 4.20
“Somewhat important”; 4.21 – 5.00 “Very important”
Source: Authors’ own calculations based on field survey data (2020).
37 The skills groups were based on the O*NET classification and fall into six categories: Bas ic skills: This refers to skills that facilitate
learning or the more rapid acquisition of knowledge. S ocial skills: This refers to skills that are used to work with people to achieve goals.
P roblem-solving skills: This refers to skills that are used to solve novel, ill-defined problems in real-world settings. Technical skills: This
refers to skills that are used to design, set-up, operate, and correct malfunctions involving application of machines or technological
systems. Systems Skills: This refers to skills that are used to understand, monitor, and improve socio-technical systems. Res ource
management skills: This refers to skills that are used to allocate resources efficiently.
0.00 0.50 1.00 1.50 2.00 2.50 3.00
Basic skills
Social skills
Problem solving skills
Technical skills
Systems skills
Resource management skills
Clerical support workers Elementary occupations Service and sales workers
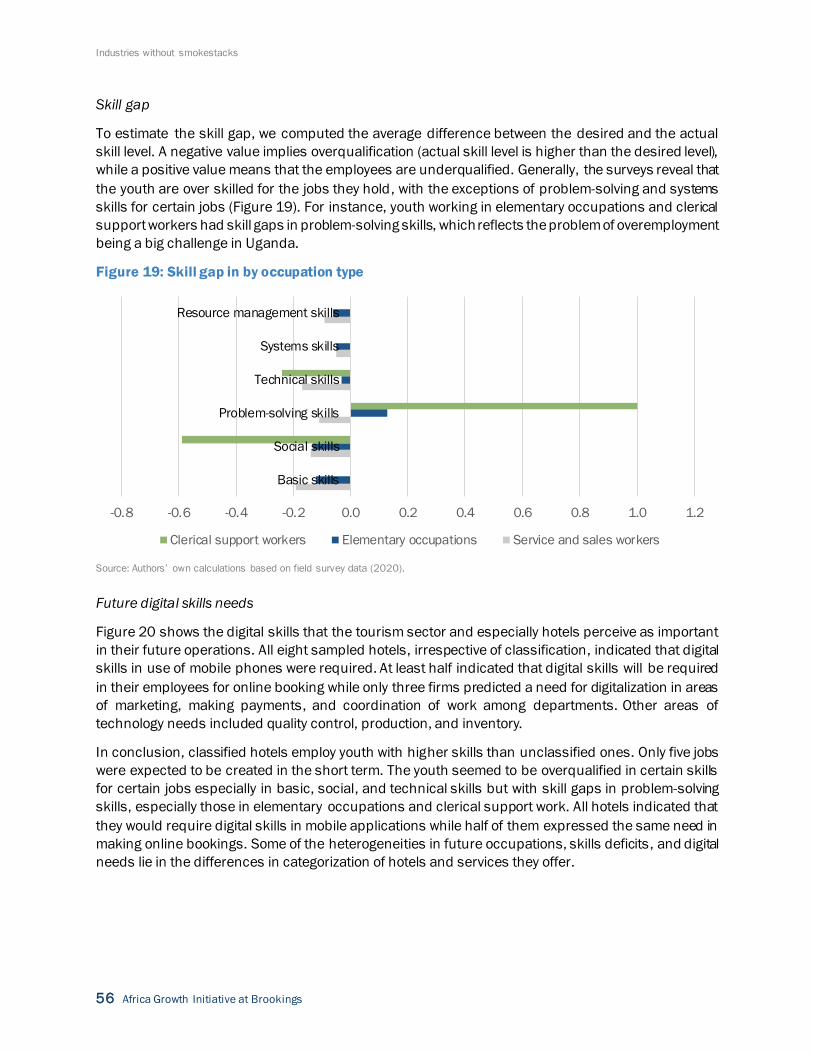
Industries without smokestacks
56 Africa Growth Initiative at Brookings
Skill gap
To estimate the skill gap, we computed the average difference between the desired and the actual
skill level. A negative value implies overqualification (actual skill level is higher than the desired level),
while a positive value means that the employees are underqualified. Generally, the surveys reveal that
the youth are over skilled for the jobs they hold, with the exceptions of problem-solving and systems
skills for certain jobs (Figure 19). For instance, youth working in elementary occupations and clerical
support workers had skill gaps in problem-solving skills, which reflects the problem of overemployment
being a big challenge in Uganda.
Figure 19: Skill gap in by occupation type
Source: Authors’ own calculations based on field survey data (2020).
Future digital skills needs
Figure 20 shows the digital skills that the tourism sector and especially hotels perceive as important
in their future operations. All eight sampled hotels, irrespective of classification, indicated that digital
skills in use of mobile phones were required. At least half indicated that digital skills will be required
in their employees for online booking while only three firms predicted a need for digitalization in areas
of marketing, making payments, and coordination of work among departments. Other areas of
technology needs included quality control, production, and inventory.
In conclusion, classified hotels employ youth with higher skills than unclassified ones. Only five jobs
were expected to be created in the short term. The youth seemed to be overqualified in certain skills
for certain jobs especially in basic, social, and technical skills but with skill gaps in problem-solving
skills, especially those in elementary occupations and clerical support work. All hotels indicated that
they would require digital skills in mobile applications while half of them expressed the same need in
making online bookings. Some of the heterogeneities in future occupations, skills deficits, and digital
needs lie in the differences in categorization of hotels and services they offer.
-0.8 -0.6 -0.4 -0.2 0.0 0.2 0.4 0.6 0.8 1.0 1.2
Basic skills
Social skills
Problem-solving skills
Technical skills
Systems skills
Resource management skills
Clerical support workers Elementary occupations Service and sales workers
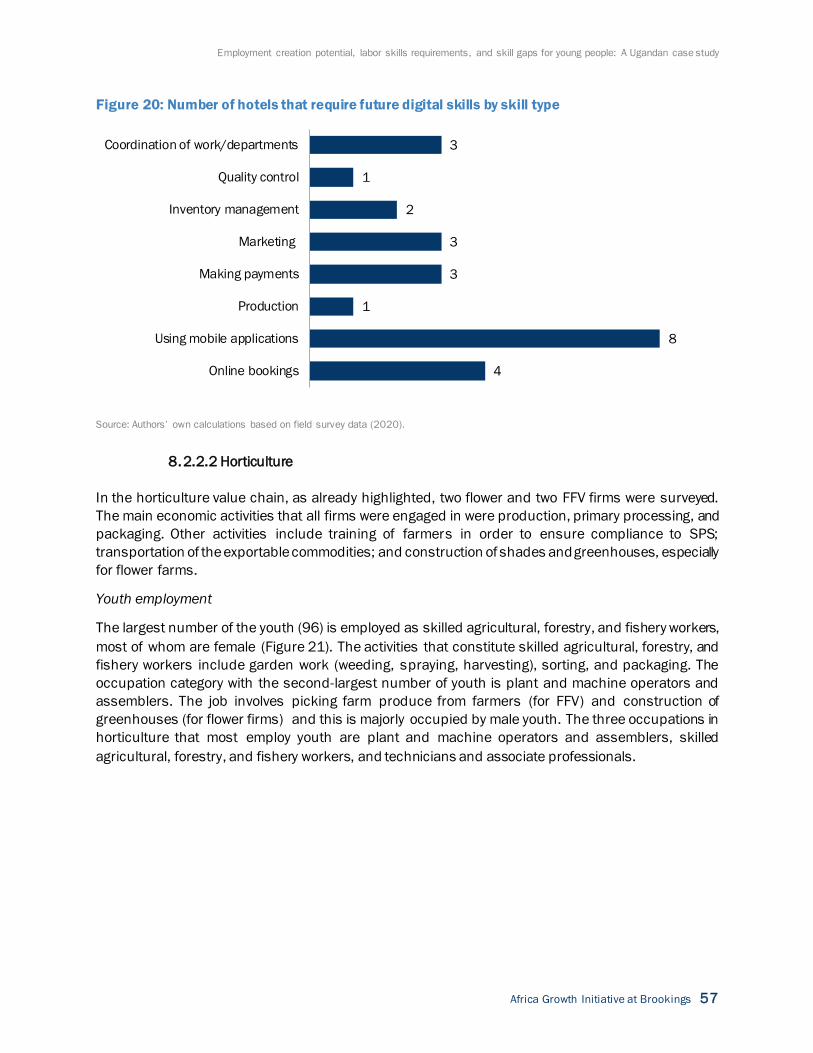
Employment creation potential, labor skills requirements, and skill gaps for young people: A Ugandan case study
Africa Growth Initiative at Brookings 57
Figure 20: Number of hotels that require future digital skills by skill type
Source: Authors’ own calculations based on field survey data (2020).
8.2.2.2 Horticulture
In the horticulture value chain, as already highlighted, two flower and two FFV firms were surveyed.
The main economic activities that all firms were engaged in were production, primary processing, and
packaging. Other activities include training of farmers in order to ensure compliance to SPS;
transportation of the exportable commodities; and construction of shades and greenhouses, especially
for flower farms.
Youth employment
The largest number of the youth (96) is employed as skilled agricultural, forestry, and fishery workers,
most of whom are female (Figure 21). The activities that constitute skilled agricultural, forestry, and
fishery workers include garden work (weeding, spraying, harvesting), sorting, and packaging. The
occupation category with the second-largest number of youth is plant and machine operators and
assemblers. The job involves picking farm produce from farmers (for FFV) and construction of
greenhouses (for flower firms) and this is majorly occupied by male youth. The three occupations in
horticulture that most employ youth are plant and machine operators and assemblers, skilled
agricultural, forestry, and fishery workers, and technicians and associate professionals.
4
8
1
3
3
2
1
3
Online bookings
Using mobile applications
Production
Making payments
Marketing
Inventory management
Quality control
Coordination of work/departments
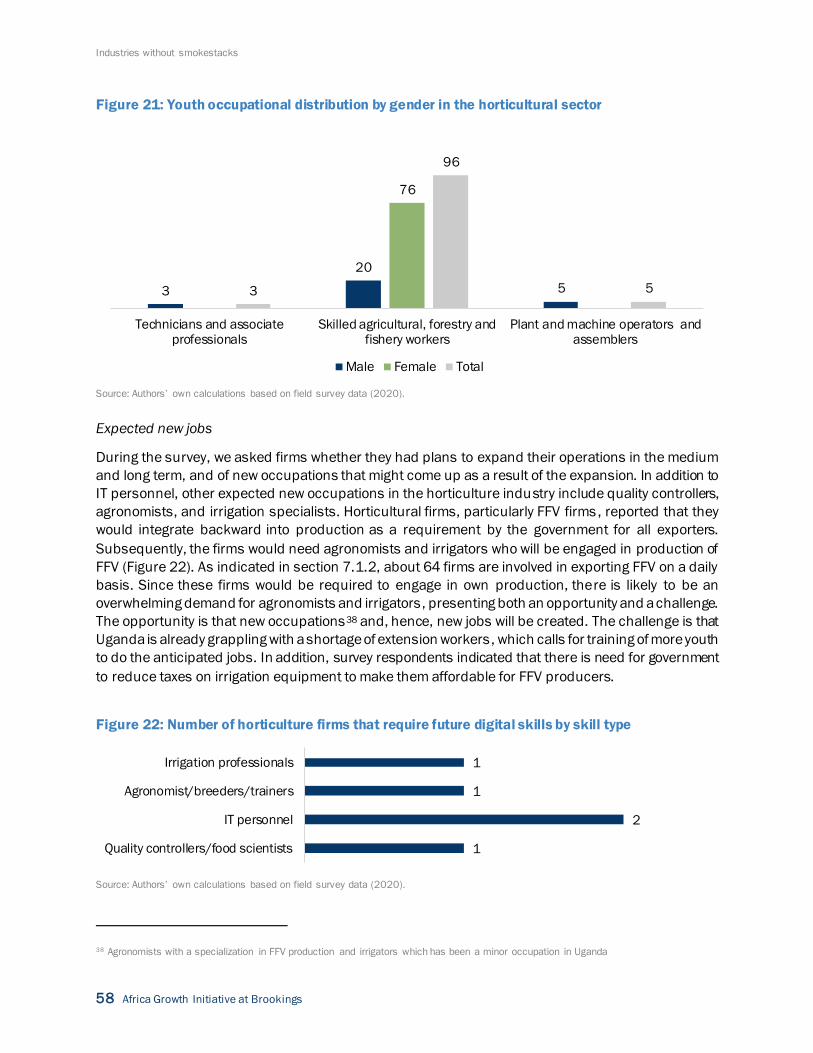
Industries without smokestacks
58 Africa Growth Initiative at Brookings
Figure 21: Youth occupational distribution by gender in the horticultural sector
Source: Authors’ own calculations based on field survey data (2020).
Expected new jobs
During the survey, we asked firms whether they had plans to expand their operations in the medium
and long term, and of new occupations that might come up as a result of the expansion. In addition to
IT personnel, other expected new occupations in the horticulture industry include quality controllers,
agronomists, and irrigation specialists. Horticultural firms, particularly FFV firms, reported that they
would integrate backward into production as a requirement by the government for all exporters.
Subsequently, the firms would need agronomists and irrigators who will be engaged in production of
FFV (Figure 22). As indicated in section 7.1.2, about 64 firms are involved in exporting FFV on a daily
basis. Since these firms would be required to engage in own production, there is likely to be an
overwhelming demand for agronomists and irrigators, presenting both an opportunity and a challenge.
The opportunity is that new occupations38 and, hence, new jobs will be created. The challenge is that
Uganda is already grappling with a shortage of extension workers, which calls for training of more youth
to do the anticipated jobs. In addition, survey respondents indicated that there is need for government
to reduce taxes on irrigation equipment to make them affordable for FFV producers.
Figure 22: Number of horticulture firms that require future digital skills by skill type
Source: Authors’ own calculations based on field survey data (2020).
38 Agronomists with a specialization in FFV production and irrigators which has been a minor occupation in Uganda
3
20
5
76
3
96
5
Technicians and associateprofessionals
Skilled agricultural, forestry andfishery workers
Plant and machine operators andassemblers
Male Female Total
1
2
1
1
Quality controllers/food scientists
IT personnel
Agronomist/breeders/trainers
Irrigation professionals
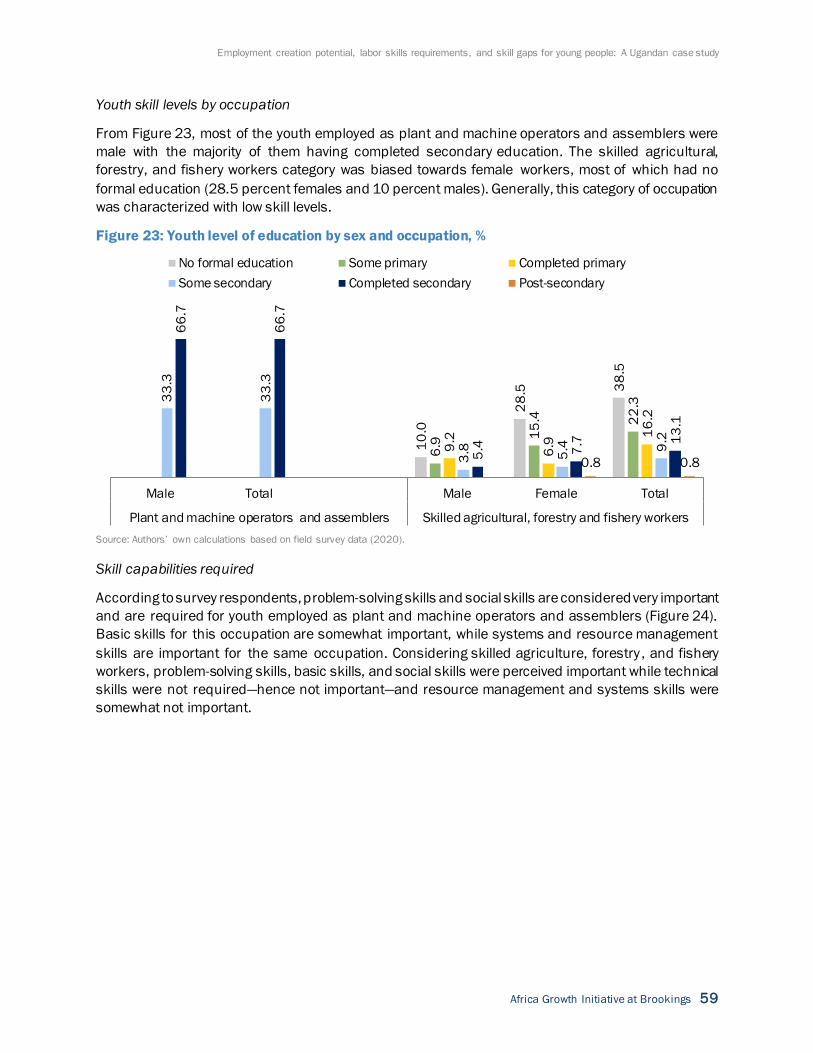
Employment creation potential, labor skills requirements, and skill gaps for young people: A Ugandan case study
Africa Growth Initiative at Brookings 59
Youth skill levels by occupation
From Figure 23, most of the youth employed as plant and machine operators and assemblers were
male with the majority of them having completed secondary education. The skilled agricultural,
forestry, and fishery workers category was biased towards female workers, most of which had no
formal education (28.5 percent females and 10 percent males). Generally, this category of occupation
was characterized with low skill levels.
Figure 23: Youth level of education by sex and occupation, %
Source: Authors’ own calculations based on field survey data (2020).
Skill capabilities required
According to survey respondents, problem-solving skills and social skills are considered very important
and are required for youth employed as plant and machine operators and assemblers (Figure 24).
Basic skills for this occupation are somewhat important, while systems and resource management
skills are important for the same occupation. Considering skilled agriculture, forestry , and fishery
workers, problem-solving skills, basic skills, and social skills were perceived important while technical
skills were not required—hence not important—and resource management and systems skills were
somewhat not important.
10
.0
28
.5 38
.5
6.9
15
.4 22
.3
9.2
6.9
16
.2
33
.3
33
.3
3.8 5.4 9
.2
66
.7
66
.7
5.4 7.7 1
3.1
0.8 0.8
Male Total Male Female Total
Plant and machine operators and assemblers Skilled agricultural, forestry and fishery workers
No formal education Some primary Completed primary
Some secondary Completed secondary Post-secondary
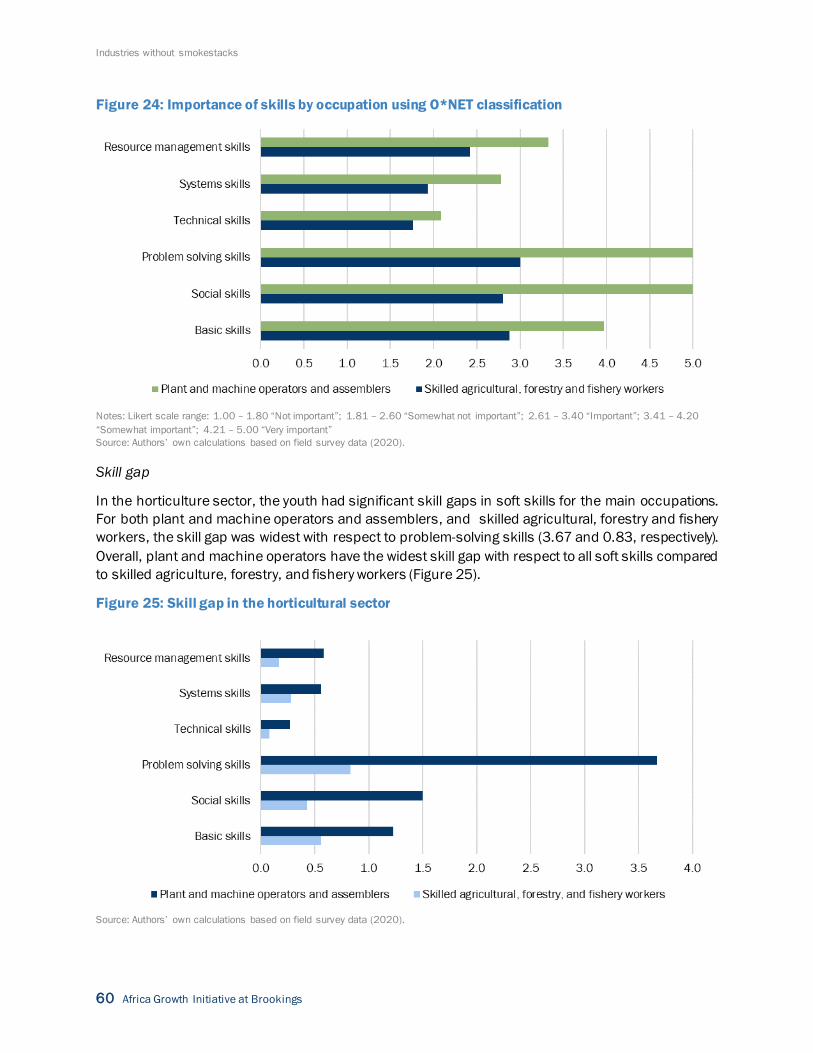
Industries without smokestacks
60 Africa Growth Initiative at Brookings
Figure 24: Importance of skills by occupation using O*NET classification
Notes: Likert scale range: 1.00 – 1.80 “Not important”; 1.81 – 2.60 “Somewhat not important”; 2.61 – 3.40 “Important”; 3.41 – 4.20
“Somewhat important”; 4.21 – 5.00 “Very important”
Source: Authors’ own calculations based on field survey data (2020).
Skill gap
In the horticulture sector, the youth had significant skill gaps in soft skills for the main occupations.
For both plant and machine operators and assemblers, and skilled agricultural, forestry and fishery
workers, the skill gap was widest with respect to problem-solving skills (3.67 and 0.83, respectively).
Overall, plant and machine operators have the widest skill gap with respect to all soft skills compared
to skilled agriculture, forestry, and fishery workers (Figure 25).
Figure 25: Skill gap in the horticultural sector
Source: Authors’ own calculations based on field survey data (2020).
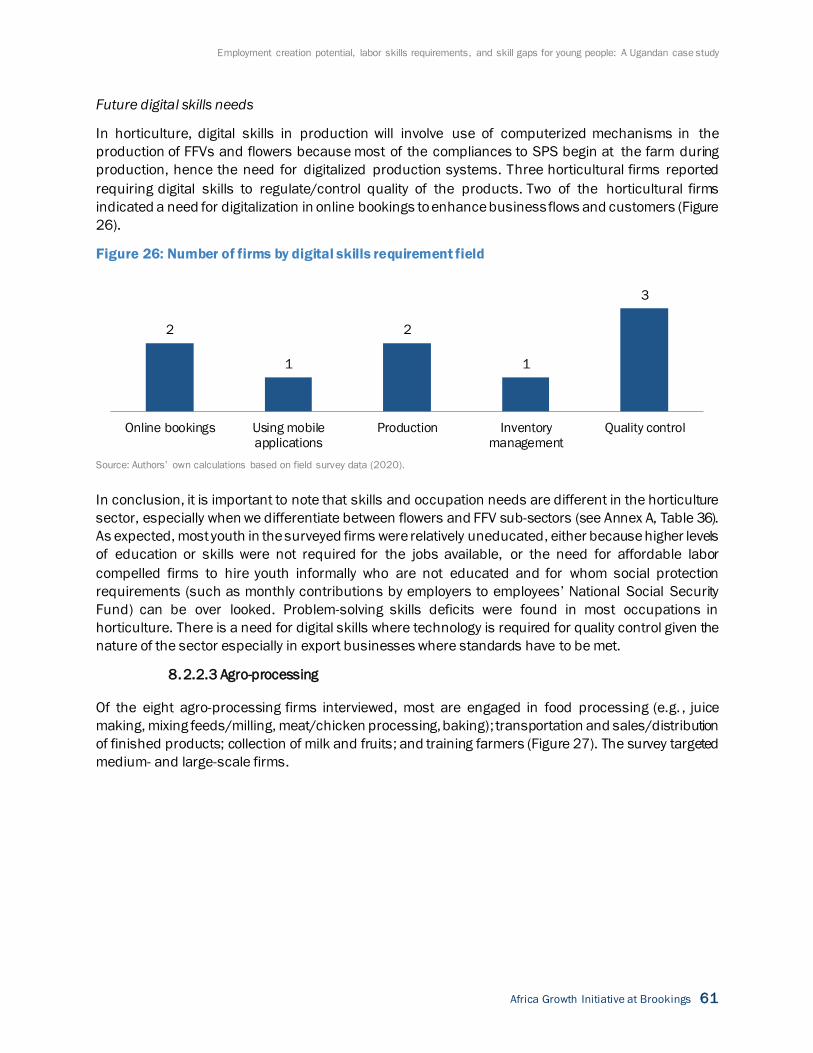
Employment creation potential, labor skills requirements, and skill gaps for young people: A Ugandan case study
Africa Growth Initiative at Brookings 61
Future digital skills needs
In horticulture, digital skills in production will involve use of computerized mechanisms in the
production of FFVs and flowers because most of the compliances to SPS begin at the farm during
production, hence the need for digitalized production systems. Three horticultural firms reported
requiring digital skills to regulate/control quality of the products. Two of the horticultural firms
indicated a need for digitalization in online bookings to enhance business flows and customers (Figure
26).
Figure 26: Number of firms by digital skills requirement field
Source: Authors’ own calculations based on field survey data (2020).
In conclusion, it is important to note that skills and occupation needs are different in the horticulture
sector, especially when we differentiate between flowers and FFV sub-sectors (see Annex A, Table 36).
As expected, most youth in the surveyed firms were relatively uneducated, either because higher levels
of education or skills were not required for the jobs available, or the need for affordable labor
compelled firms to hire youth informally who are not educated and for whom social protection
requirements (such as monthly contributions by employers to employees’ National Social Security
Fund) can be over looked. Problem-solving skills deficits were found in most occupations in
horticulture. There is a need for digital skills where technology is required for quality control given the
nature of the sector especially in export businesses where standards have to be met.
8.2.2.3 Agro-processing
Of the eight agro-processing firms interviewed, most are engaged in food processing (e.g. , juice
making, mixing feeds/milling, meat/chicken processing, baking); transportation and sales/distribution
of finished products; collection of milk and fruits; and training farmers (Figure 27). The survey targeted
medium- and large-scale firms.
2
1
2
1
3
Online bookings Using mobileapplications
Production Inventorymanagement
Quality control
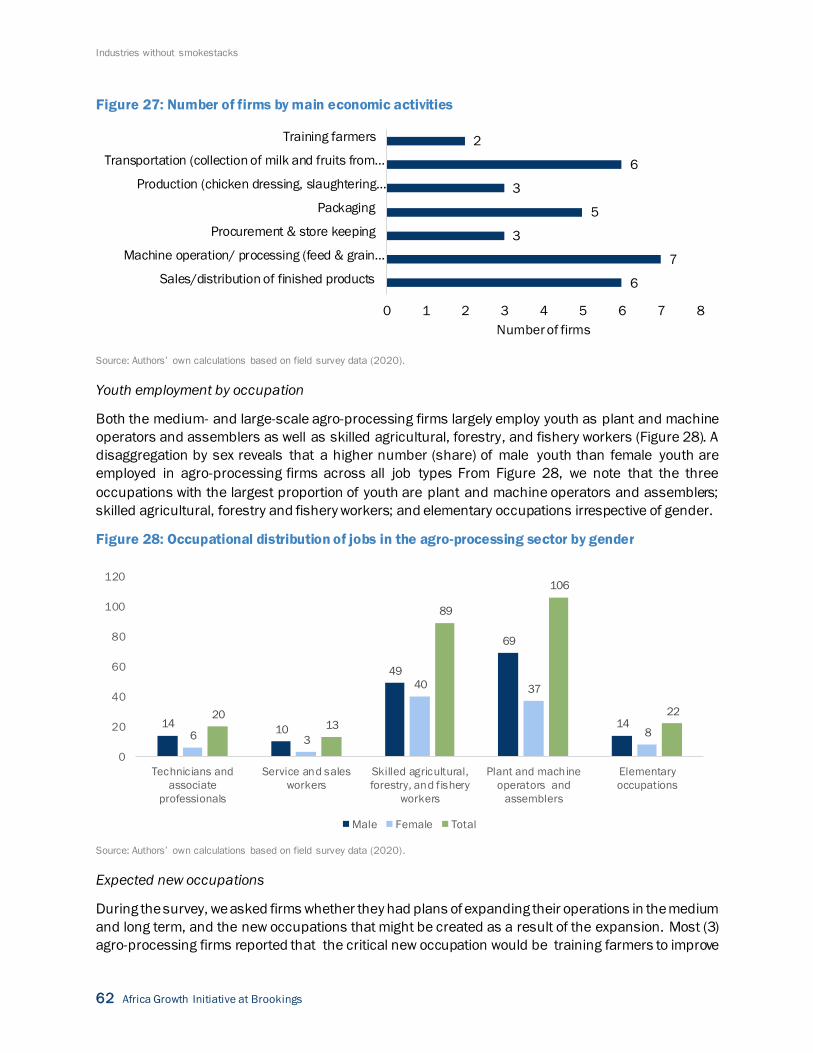
Industries without smokestacks
62 Africa Growth Initiative at Brookings
Figure 27: Number of firms by main economic activities
Source: Authors’ own calculations based on field survey data (2020).
Youth employment by occupation
Both the medium- and large-scale agro-processing firms largely employ youth as plant and machine
operators and assemblers as well as skilled agricultural, forestry, and fishery workers (Figure 28). A
disaggregation by sex reveals that a higher number (share) of male youth than female youth are
employed in agro-processing firms across all job types From Figure 28, we note that the three
occupations with the largest proportion of youth are plant and machine operators and assemblers;
skilled agricultural, forestry and fishery workers; and elementary occupations irrespective of gender.
Figure 28: Occupational distribution of jobs in the agro-processing sector by gender
Source: Authors’ own calculations based on field survey data (2020).
Expected new occupations
During the survey, we asked firms whether they had plans of expanding their operations in the medium
and long term, and the new occupations that might be created as a result of the expansion. Most (3)
agro-processing firms reported that the critical new occupation would be training farmers to improve
6
7
3
5
3
6
2
0 1 2 3 4 5 6 7 8
Sales/distribution of finished products
Machine operation/ processing (feed & grain…
Procurement & store keeping
Packaging
Production (chicken dressing, slaughtering…
Transportation (collection of milk and fruits from…
Training farmers
Number of firms
1410
49
69
146 3
40 37
8
2013
89
106
22
0
20
40
60
80
100
120
Technicians and
associate
professionals
Service and sales
workers
Skilled agricultural,
forestry, and fishery
workers
Plant and machine
operators and
assemblers
Elementary
occupations
Male Female Total
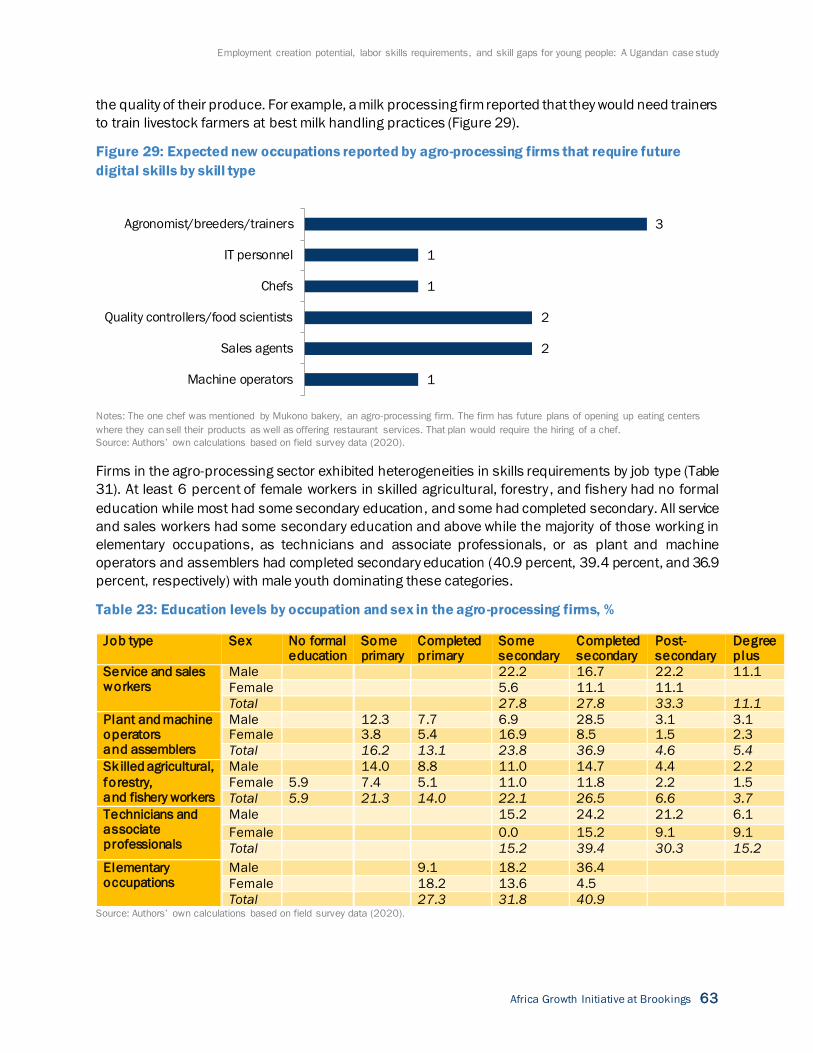
Employment creation potential, labor skills requirements, and skill gaps for young people: A Ugandan case study
Africa Growth Initiative at Brookings 63
the quality of their produce. For example, a milk processing firm reported that they would need trainers
to train livestock farmers at best milk handling practices (Figure 29).
Figure 29: Expected new occupations reported by agro-processing firms that require future
digital skills by skill type
Notes: The one chef was mentioned by Mukono bakery, an agro-processing firm. The firm has future plans of opening up eating centers
where they can sell their products as well as offering restaurant services. That plan would require the hiring of a chef.
Source: Authors’ own calculations based on field survey data (2020).
Firms in the agro-processing sector exhibited heterogeneities in skills requirements by job type (Table
31). At least 6 percent of female workers in skilled agricultural, forestry, and fishery had no formal
education while most had some secondary education, and some had completed secondary. All service
and sales workers had some secondary education and above while the majority of those working in
elementary occupations, as technicians and associate professionals, or as plant and machine
operators and assemblers had completed secondary education (40.9 percent, 39.4 percent, and 36.9
percent, respectively) with male youth dominating these categories.
Table 23: Education levels by occupation and sex in the agro-processing firms, %
Job type Sex No formal education
Some primary
Completed primary
Some secondary
Completed secondary
Post-secondary
Degree plus
Service and sales workers
Male
22.2 16.7 22.2 11.1
Female
5.6 11.1 11.1
Total
27.8 27.8 33.3 11.1
Plant and machine operators and assemblers
Male
12.3 7.7 6.9 28.5 3.1 3.1 Female
3.8 5.4 16.9 8.5 1.5 2.3
Total
16.2 13.1 23.8 36.9 4.6 5.4
Skilled agricultural,
forestry, and fishery workers
Male
14.0 8.8 11.0 14.7 4.4 2.2
Female 5.9 7.4 5.1 11.0 11.8 2.2 1.5
Total 5.9 21.3 14.0 22.1 26.5 6.6 3.7
Technicians and associate professionals
Male
15.2 24.2 21.2 6.1
Female
0.0 15.2 9.1 9.1
Total
15.2 39.4 30.3 15.2
Elementary occupations
Male
9.1 18.2 36.4
Female
18.2 13.6 4.5
Total 27.3 31.8 40.9 Source: Authors’ own calculations based on field survey data (2020).
1
2
2
1
1
3
Machine operators
Sales agents
Quality controllers/food scientists
Chefs
IT personnel
Agronomist/breeders/trainers
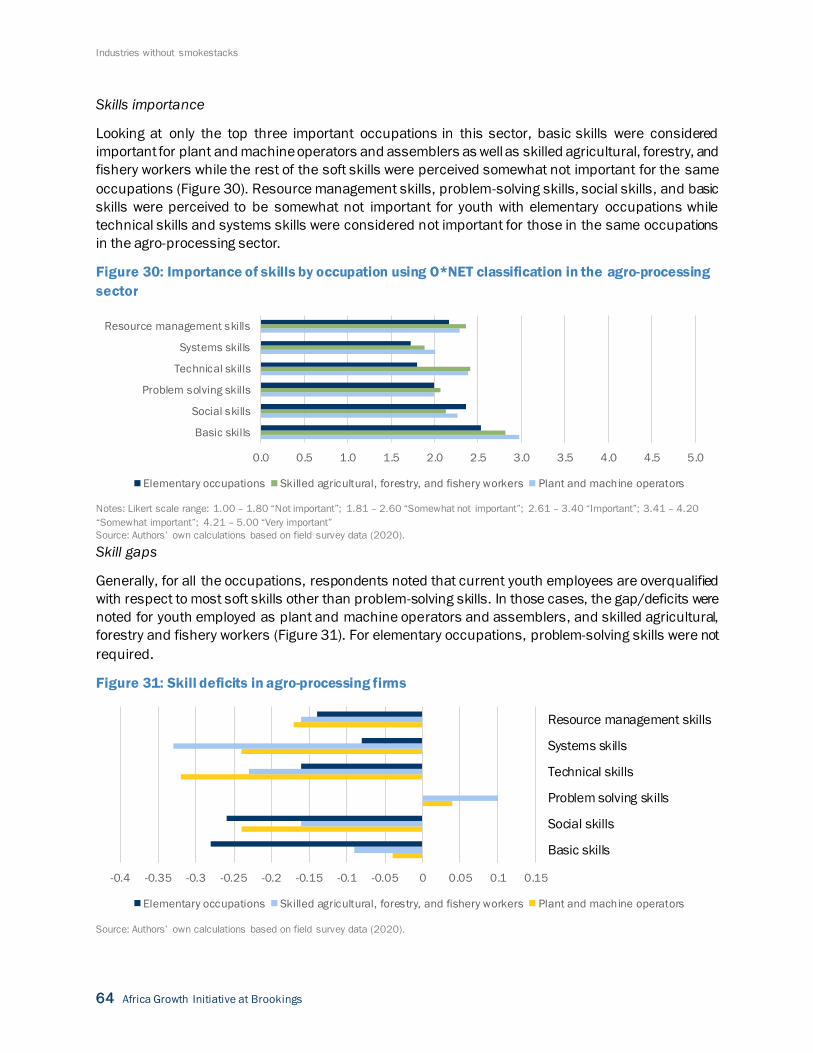
Industries without smokestacks
64 Africa Growth Initiative at Brookings
Skills importance
Looking at only the top three important occupations in this sector, basic skills were considered
important for plant and machine operators and assemblers as well as skilled agricultural, forestry, and
fishery workers while the rest of the soft skills were perceived somewhat not important for the same
occupations (Figure 30). Resource management skills, problem-solving skills, social skills, and basic
skills were perceived to be somewhat not important for youth with elementary occupations while
technical skills and systems skills were considered not important for those in the same occupations
in the agro-processing sector.
Figure 30: Importance of skills by occupation using O*NET classification in the agro-processing
sector
Notes: Likert scale range: 1.00 – 1.80 “Not important”; 1.81 – 2.60 “Somewhat not important”; 2.61 – 3.40 “Important”; 3.41 – 4.20
“Somewhat important”; 4.21 – 5.00 “Very important”
Source: Authors’ own calculations based on field survey data (2020).
Skill gaps
Generally, for all the occupations, respondents noted that current youth employees are overqualified
with respect to most soft skills other than problem-solving skills. In those cases, the gap/deficits were
noted for youth employed as plant and machine operators and assemblers, and skilled agricultural,
forestry and fishery workers (Figure 31). For elementary occupations, problem-solving skills were not
required.
Figure 31: Skill deficits in agro-processing firms
Source: Authors’ own calculations based on field survey data (2020).
0.0 0.5 1.0 1.5 2.0 2.5 3.0 3.5 4.0 4.5 5.0
Basic skills
Social skills
Problem solving skills
Technical skills
Systems skills
Resource management skills
Elementary occupations Skilled agricultural, forestry, and fishery workers Plant and machine operators
-0.4 -0.35 -0.3 -0.25 -0.2 -0.15 -0.1 -0.05 0 0.05 0.1 0.15
Basic skills
Social skills
Problem solving skills
Technical skills
Systems skills
Resource management skills
Elementary occupations Skilled agricultural, forestry, and fishery workers Plant and machine operators
Employment creation potential, labor skills requirements, and skill gaps for young people: A Ugandan case study
Africa Growth Initiative at Brookings 65
Future digital skills needs
As automatization progresses, digital skills will be needed for the production of primary raw materials.
In agro-processing, digital skills for production involve knowledge on how to use automated machines.
Agro-processing firms also highlight the need for digital skills in sales and marketing. Firms also
mentioned the need to advance to digital advertising, which requires digital skills to expand market
for their products (Figure 32). The firms mentioned that the regulations for health and safe food
products are becoming more and more stringent, hence the need for technology helps to ensure
compliance as well.
Figure 32: Number of firms by digital skills requirement field
Source: Authors’ own calculations based on field survey data (2020).
In conclusion, there was a skills deficit with regard to problem solving in agro-processing firms. The
sector requires a diverse set of future digital skills, especially in use of mobile phone applications.
More future jobs are expected for agronomists as firms expand to start own-production to meet export
needs. By and large, there is still room for employment of low-skilled workers in IWOSS industries, as
indicated by a substantial number of youth employees with no/low levels education. IWOSS firms have
future plans of recruiting IT personnel, which is an indicator that firms plan to digitalize their
operations. However, this might have implications for the number of youth employed. There is no skill
gap for most occupations except problem solving which is reported in all the industries.
9. Policy implications: Unlocking Uganda’s IWOSS growth
potential and overcoming skill gaps
Uganda continues to be still plagued with persistently high unemployment and underemployment
challenges. Jobs being created (especially for the youth) are not enough to absorb the rapidly growing
labor force. The analysis presented in this paper furthermore indicates that structural transformation
in the country has been stagnant and the importance of the manufacturing sector as an employer has
been declining considerably over the years. IWOSS sectors might be a viable substitute in the role of
manufacturing in Africa given they are tradeable, have high value-added per worker, and reveal
economies of scale, but they are currently not growing fast enough to replace the role of non-IWOSS
sectors like low-productivity agriculture in providing jobs or to make up for the role of manufacturing
2
6
4
3
4
2
3
4
Online bookings
Using mobile applications
Production
Making payments
Marketing
Inventory management
Quality control
Coordination of work/departments
Industries without smokestacks
66 Africa Growth Initiative at Brookings
in driving the structural transformation process in Uganda, although employment in these sectors is
growing faster than in non-IWOSS sectors.39
The insufficient growth of IWOSS sectors could be attributed to a number of challenges, most of which
relate to the business environment. In fact, IWOSS sectors are largely formal enterprises and hence
feel challenges in the business environment more keenly, particular ly those that relate to trade and
the regulatory environment.
Nonetheless, Uganda is on a growth path in which IWOSS sectors are increasingly driving the process
of structural transformation. For example, it is evident from the findings that there has been a shift
towards services, especially finance, business and professional services, transport, ICTs, and tourism.
Employment creation in the formal sector activities is slow and sometimes even declining while a shift
to informal sector activities mainly in trade (excl. tourism) is taking place. Like with the rest of the
working-age population (15-64 years), many youth (15-24 years) are increasingly engaging in informal
activities. We also note gender differences in participation, particularly in construction, mining, and
agro-processing, as they have very few female workers. Altogether our analysis suggests stagnant
worker participation in low-productivity services.
IWOSS activities such as finance, business, and professional services in this analysis are found to
employ workers in jobs that require higher-level skills, while non-IWOSS activities mainly provide
employment for low-skilled workers. Overall, non-IWOSS sectors still employ the majority of Ugandans—
as sectors such as agriculture and informal trade (categorized as non-IWOSS) are Uganda’s biggest
employers, including of the youth. However, some IWOSS sectors—including ICTs, finance, business
and professional services, and agro-processing—exhibited higher potential for employment than
manufacturing.
This paper analyzes eight IWOSS sectors using labor force surveys, including agro-processing;
horticulture and export crops; tourism; transport; maintenance and repairs; finance, business and
professional services; and formal trade (excl. tourism). Here, we estimate future employment potential
and occupation and skill gaps.
Furthermore, the paper considers three specific IWOSS sectors primed to drive sustainable and
inclusive structural transformation in Uganda: horticulture, agro-processing, and tourism.
Unfortunately, employment creation in the three specific IWOSS sectors is slow, suggesting a slow
future labor demand in these sectors. All three sectors, and tourism in particular, employ and will
require skilled workers in the future. This paper also shares the results of firm surveys within each
value chain of the three selected IWOSS sectors and estimates the potential employment, occupation,
and skills requirements and gaps among the youth. The nature of digital skills required for future/new
occupations was identified. Tourism and horticulture increasingly employ low-skilled youth. Drawing
from these firm survey results, with respect to soft skills, we find a gap in problem-solving skills and
that digital skills will be paramount for future occupations. Therefore, the government should ensure
that both learning and training curriculums incorporate both digital and problem-solving skills. Such a
push could eradicate the skills mismatch reported by employers as one of the obstacles to their
operations.
39 4.9 percent annualized increase for IWOSS versus 3.9 percent for non-IWOSS (cf. Table 7 of this paper).
Employment creation potential, labor skills requirements, and skill gaps for young people: A Ugandan case study
Africa Growth Initiative at Brookings 67
Through the establishment of special economic zones (SEZs), the Ugandan government introduced
fiscal incentives that would improve the performance of firms and/or attract new ones. However, the
incentives have not achieved the intended goal. A 2019/20 performance report revealed that free
zone operators still face challenges including high cost of finance, poor roads, volatile exchange rates,
high cost of water and electricity and persistent outages, administrative delays including licensing,
allocation of land. Dealing with such challenges requires public investment and policy interventions:
For instance, there is need for improving transport and communication infrastructure through
increasing and improving the roads network and reducing the cost of internet and mobile phone usage;
reducing the cost of electricity and power outages; and increasing budget allocation to agriculture,
which will eventually increase financing to agribusiness firms. In addition, government needs to adopt
technologies that can reduce the number to days required to make clearance at customs and shorten
the licensing application procedures.
9.1 Policy recommendations to drive growth in selected IWOSS sectors
Having noted that the importance of manufacturing in Uganda is declining in many ways (e.g., GDP,
employment, and exports) while IWOSS sectors are gaining ground (though at a slow pace), there is
need to channel support towards select IWOSS sectors to increase their pace of growth and realize
their job creation potential. The following considers each of the three selected sectors and provides
specific policy recommendations to achieve this goal.
Horticulture
As a first priority, government needs to intensify training for extension workers with a specialization in
horticulture. Extension workers will also need to be equipped with irrigation technology necessary for
most horticultural production.
Since the majority of the sector’s produce (e.g., cut flowers, fresh fruit and vegetables, coffee, and tea)
is exported to high-value markets in the EU or the U.S., it is paramount that government addresses
barriers to continuously access these markets. The following should be priorities:
• Address non-tariff barriers, such as delays, high transport costs, and burdensome procedures
when trading;
• Increase testing capacities in the country, allowing producers to verify that products are safe
for human consumption;
• Ensure that access to inputs (e.g. Kraft paper for packaging cut flowers) is possible at
affordable cost through a sensible tariff regime.
Agro-processing
The current government focus of offering fiscal incentives (e.g., tax holidays) does not appear to be
effective in stimulating investment in the agro-processing sector and also comes at considerable fiscal
costs to the public in the form of revenue foregone that could be used to invest in infrastructure or
education.40 Additionally, there is evidence that the investment floor for local investors is too high
(currently at $10 million) and should be lowered so that more willing investors qualify for these
incentives.
Given these concerns, the government should instead concentrate on solving the rampant supply-side
constraints (most notably in the special economic zones and industrial parks) as well as ensuring
40 See Eissa, Manwaring, Ntungire and Rauschendorfer (2020) who estimate that the fiscal costs of tax incentives in Uganda is just below
1 percent of the country’s GDP.
Industries without smokestacks
68 Africa Growth Initiative at Brookings
access to key markets for firms in the sector, allowing firms to develop economies of scale and employ
more workers in the future. Specifically, government should concentrate on the following key issues:
• Provide avenues for more affordable access to credit (e.g., through reform of the banking
sector, or financing schemes executed by the Uganda Development Bank);
• Provide a cheap and stable supply of water and electricity and reduce the cost of internet
usage;
• Improve physical infrastructure (e.g., roads, border crossings etc.);
• Ensure that access to key growth market in the region is maintained and expanded through
working with the East African Community and towards the implementation of the African
Continental Free Trade Area;
• Reducing the cost of trading through investing in physical and digital trade infrastructure (e.g.,
One Stop Border Posts with neighboring countries, and an expansion of digital initiatives like
the Uganda Electronic Single Window); and
• Ensure that agro-processors have access to imported inputs through an adequate tariff policy.
In addition, agro-processing is heavily reliant on the performance of the agriculture sector as a whole.
Low productivity in agriculture ultimately leads to fewer raw materials for agro-processing firms to
operate sustainably. Public and private investment in research and development and improved links
between agriculture and businesses and markets are key for boosting production and productivity.
While agriculture continues to be the- country’s biggest employer, its structural growth is still low. Thus,
revamping agro-processing along the value chain for higher value addition might encourage
transitional employment from agriculture to agro-processing.
Tourism
To boost growth of the tourism sector, there is need to enhance the skills capacity of workers in the
sector to ensure that the high demands of international clients are met with an adequately skilled
work force. Government needs to invest in education to enhance the skills of the youth so that they
are suitable for the available jobs. Specifically, government should incorporate problem-solving and
digital skills in the training curriculum starting at the lower levels of education, particularly because
even the sectors that employ low-skilled workers require these skills. Skilled workers are particularly
needed in the tourism industry since employees have to relate/communicate with people from
different parts of the world. Given that education influences the competitiveness of the tourism
industry, it is worthy of government investment efforts. Digital skills in particular are needed for
marketing efforts, managing online booking systems, and the like.
Beyond this focus on training the labor force, there is scope for the government to boost growth in the
tourism sectors through the following recommendations (cf. Ahebwa and English 2018):
• Improve access roads to key attractions like Bwindi National Park;
• Manage and preserve the country’s wildlife, by preventing poaching and enabling local villages
to benefit from tourism; and
• Strengthen the brand of Uganda as a tourism destination through targeted marketing actions.
Across all sectors, in an effort to avoid future skill mismatches, policymakers must know where future
jobs will be. This knowledge will enable the government to decide where to best devote resources
intended to improve training. For instance, this study reveals that horticulture and tourism will require
many skilled workers by 2029/30, meaning that government should target training efforts enabling
youth to work in these sectors.
Employment creation potential, labor skills requirements, and skill gaps for young people: A Ugandan case study
Africa Growth Initiative at Brookings 69
References
Adesina, A. (2017). Using agriculture and agribusiness to bring about industrialisation in Africa.
Available on: http://www.ipsnews.net/2017/05/using-agriculture-and-agribusiness-to-bring-
about-industrialisation-in-africa/, Accessed on 21/03/2020.
Ahebwa, W. and P. English (2018) How can tourism become a driver of economic growth in Uganda?
IGC Working Paper, S-43437-UGA-1, November 2019.
Asoko (2019). Uganda's Floriculture Industry. Market insight.
Belgium Development Cooperation (no year). Project identification proposal - Support to the
implementation of Skilling Uganda.
Bhorat, H., C. Allen, Z. Asmal, R. Hill and C. Rooney. (2019). Employment Creation Potential, Labour
Skills Requirements and Skill gaps for Young People: A Methodological Framework.
Brookings Institution: Washington, D.C.
Cunningham, E. (2007). Uganda: Good labour practices bloom in flower industry.
https://allafrica.com/stories/200708230528.html. Accessed on 24/02/2020
de Vries, G. J., Timmer, M. P. and de Vries, K. (2013). Structural transformation in Africa: Static gains,
dynamic losses’. GGDC Research Memorandum 136, University of
Duarte, M., and Restuccia, D. (2010). The role of the structural transformation in aggregate
productivity. Quarterly Journal of Economics, 125(1): 129–73.
Eissa, N., Manwaring, P. Ntungire, N. and J. Rauschendorfer (2020) What is the fiscal cost of tax
incentives in Uganda? IGC Working Paper, forthcoming.
EPRC, (2018). Fostering a sustainable agro-industrialisation agenda in Uganda. Research Report
Economic Policy Research Centre.
Evers, B., Amoding, F. and Krishnan, A. (2014). Social and economic upgrading in floriculture global
value chains: flowers and cuttings GVCs in Uganda. Working Paper 42.
Fatah, L. (2007). The Potentials of Agro-Industry for Growth Promotion and Equality Improvement in
Indonesia. Asian Journal of Agriculture and Development, 3(1):1-17.
Food and Agriculture Organization of the United Nations. (2019). FAOSTAT statistical database.
[Rome]::FAO
Fowler, M. and Rauschendorfer, J. (2019). An ABC of industrialisation in Uganda. Achievements,
bottlenecks and challenges.
Frazer, G. (2017). Examining the Impact of the Common External Tariff of the East African
Community in Uganda, IGC Policy Brief, Washington, DC.
International Trade Centre (2018). Uganda: Company Perspectives. An ITC Series on Non-Tariff
Measures. ITC, Geneva.
International Trade Centre (2020). TradeMap Database: Ugandan exports by product (HS4 digits)
and country of destination. Accessible online at: https://www.trademap.org/.
Industries without smokestacks
70 Africa Growth Initiative at Brookings
International Monetary Fund (2019) IMF Country Report No. 19/126 – Uganda, May 2019.
International Monetary Fund, Washington D.C.
Kapsos, S. (2005) The employment intensity of growth: Trends and macroeconomic determinants.
International Labor Organisation, Employment Strategy Papers, 2005.
Khamis, M. (2019) Uganda Skills and Job Analysis, World Bank 2019.
Mbaye, A. A., Coulibaly, B. S. and Gandhi, D. (2019). Job creation for youth in Africa: Assessing the
potential of industries without smokestacks, draft Framing Paper I under Addressing Africa’s
youth unemployment through industries without smokestacks Project, Africa Growth Institute
at Brookings.
McMillan, M., Rodrik, D. and Verduzco-Gallo, I. (2014). Globalization, structural change and
productivity growth, with an update on Africa. World Development, 63(1): 11–32.
NAPE. (2012). The impacts of the flower industry on environment and peoples livelihoods in Uganda
Newfarmer, R., Page, J. and Tarp, F. (2018). Industries without Smokestacks: Industrialization in
Africa Reconsidered. WIDER Studies in Development Economics. Oxford University Press.
PAGE, J. (2019) Industries without Smokestacks-Firm Characteristics and Constraints to Growth,
draft Framing Paper II, Under Addressing Africa’s Youth unemployment through industries
without smokestacks. Brookings Institution: Washington, D.C.
Salem, T. M.; Twining-Ward, L. D. (2018). The voice of travellers: Leveraging user-generated content
for tourism development 2018. Washington, D.C. World Bank Group
Tussyadiah, I. P., and Pesonen, J. (2016). Impacts of peer-to-peer accommodation use on travel
patterns. Journal of Travel Research, 55(8): 1022-1040.
UBOS (2015) Uganda population forecasts. Online at: https://www.ubos.org/publications/statistical/
UBOS (2017). Statistical Abstract.
UBOS (2019). Statistical Abstract.
Uganda Free Zones Authority (UFZA) (2020). Annual report for the financial year 2019/20.
Uganda Bureau of Statistics (UBOS) (2018). Uganda National Household Survey 2016/17. Uganda
Bureau of Statistics (UBOS), Statistics House, Kampala
Uganda Investment Authority (UIA) (2016). Tourism sector Report
United Nations Commodity Trade Database (UNComtrade) (2020) Ugandan imports (total, at HS4
digit level). Accessible online at: https://comtrade.un.org/.
United Nations Conference on Trade and Development (UNCTAD) (2010). Non-Tariff Measures:
Evidence from Selected Developing Countries and Future Research Agenda
(UNCTAD/DITC/TAB/2009/3). New York and Geneva.
United Nations Economic Commission for Africa (2017). An ABC of industrialisation in Uganda.
Achievements, bottlenecks and challenges.
United Nations. (2018). UNComtrade.

Employment creation potential, labor skills requirements, and skill gaps for young people: A Ugandan case study
Africa Growth Initiative at Brookings 71
Woldemichael, A., Salami, A., Mukasa, A., Simpasa, A., and Abebe Shimeles, A. (2017). Transforming
Africa’s agriculture through agro-industrialisation. African Development Bank.
World Bank (2014). Doing Business 2015: Going Beyond Efficiency. Washington, DC: World Bank.
DOI: 10.1596/978-1-4648-0351-2.
World Bank (2018). Making farming more productive and profitable for Ugandan farmers. Available
at: https://www.worldbank.org/en/country/uganda/publication/making-farming-more-
productive-and-profitable-for-ugandan-farmers, accessed on 24/02/2020
World Bank (2018). World Bank collection of development indicators.
World Bank (2019). World Bank collection of development indicators.
World Economic Forum. (2019). Uganda: Roads quality: 2006-2019. Available at:
https://www.theglobaleconomy.com/Uganda/roads_quality/
World Integrated Trade Solution (WITS) Database (2020) Tariffs charged on Ugandan exports, by
product (HS4 digit) and receiving country. Accessible online at:
https://wits.worldbank.org/Default.aspx?lang=en.
World Travel and Tourism Council (WTTC) (2019). Uganda 2019 Annual Research: Key highlights
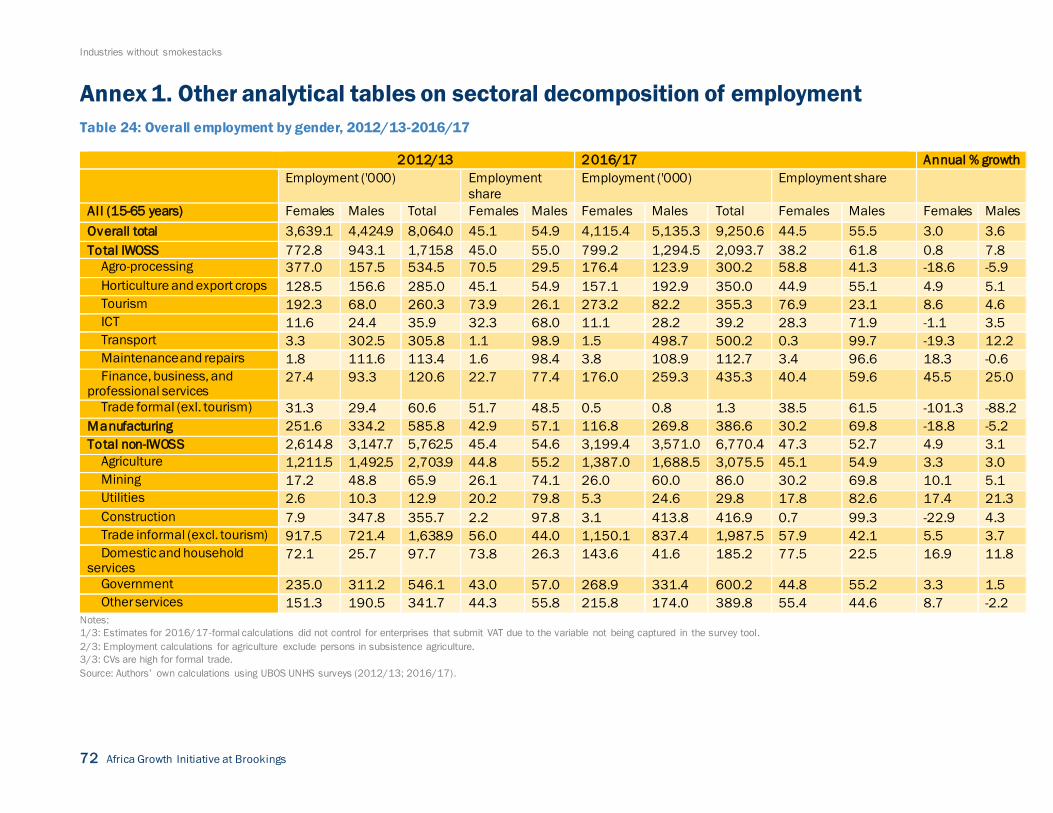
Industries without smokestacks
72 Africa Growth Initiative at Brookings
Annex 1. Other analytical tables on sectoral decomposition of employment
Table 24: Overall employment by gender, 2012/13-2016/17
2012/13 2016/17 Annual % growth Employment ('000) Employment
share
Employment ('000) Employment share
All (15-65 years) Females Males Total Females Males Females Males Total Females Males Females Males
Overall total 3,639.1 4,424.9 8,064.0 45.1 54.9 4,115.4 5,135.3 9,250.6 44.5 55.5 3.0 3.6
Total IWOSS 772.8 943.1 1,715.8 45.0 55.0 799.2 1,294.5 2,093.7 38.2 61.8 0.8 7.8
Agro-processing 377.0 157.5 534.5 70.5 29.5 176.4 123.9 300.2 58.8 41.3 -18.6 -5.9
Horticulture and export crops 128.5 156.6 285.0 45.1 54.9 157.1 192.9 350.0 44.9 55.1 4.9 5.1
Tourism 192.3 68.0 260.3 73.9 26.1 273.2 82.2 355.3 76.9 23.1 8.6 4.6
ICT 11.6 24.4 35.9 32.3 68.0 11.1 28.2 39.2 28.3 71.9 -1.1 3.5
Transport 3.3 302.5 305.8 1.1 98.9 1.5 498.7 500.2 0.3 99.7 -19.3 12.2
Maintenance and repairs 1.8 111.6 113.4 1.6 98.4 3.8 108.9 112.7 3.4 96.6 18.3 -0.6
Finance, business, and professional services
27.4 93.3 120.6 22.7 77.4 176.0 259.3 435.3 40.4 59.6 45.5 25.0
Trade formal (exl. tourism) 31.3 29.4 60.6 51.7 48.5 0.5 0.8 1.3 38.5 61.5 -101.3 -88.2
Manufacturing 251.6 334.2 585.8 42.9 57.1 116.8 269.8 386.6 30.2 69.8 -18.8 -5.2
Total non-IWOSS 2,614.8 3,147.7 5,762.5 45.4 54.6 3,199.4 3,571.0 6,770.4 47.3 52.7 4.9 3.1
Agriculture 1,211.5 1,492.5 2,703.9 44.8 55.2 1,387.0 1,688.5 3,075.5 45.1 54.9 3.3 3.0
Mining 17.2 48.8 65.9 26.1 74.1 26.0 60.0 86.0 30.2 69.8 10.1 5.1
Utilities 2.6 10.3 12.9 20.2 79.8 5.3 24.6 29.8 17.8 82.6 17.4 21.3
Construction 7.9 347.8 355.7 2.2 97.8 3.1 413.8 416.9 0.7 99.3 -22.9 4.3
Trade informal (excl. tourism) 917.5 721.4 1,638.9 56.0 44.0 1,150.1 837.4 1,987.5 57.9 42.1 5.5 3.7
Domestic and household services
72.1 25.7 97.7 73.8 26.3 143.6 41.6 185.2 77.5 22.5 16.9 11.8
Government 235.0 311.2 546.1 43.0 57.0 268.9 331.4 600.2 44.8 55.2 3.3 1.5
Other services 151.3 190.5 341.7 44.3 55.8 215.8 174.0 389.8 55.4 44.6 8.7 -2.2
Notes:
1/3: Estimates for 2016/17-formal calculations did not control for enterprises that submit VAT due to the variable not being captured in the survey tool.
2/3: Employment calculations for agriculture exclude persons in subsistence agriculture.
3/3: CVs are high for formal trade.
Source: Authors’ own calculations using UBOS UNHS surveys (2012/13; 2016/17).
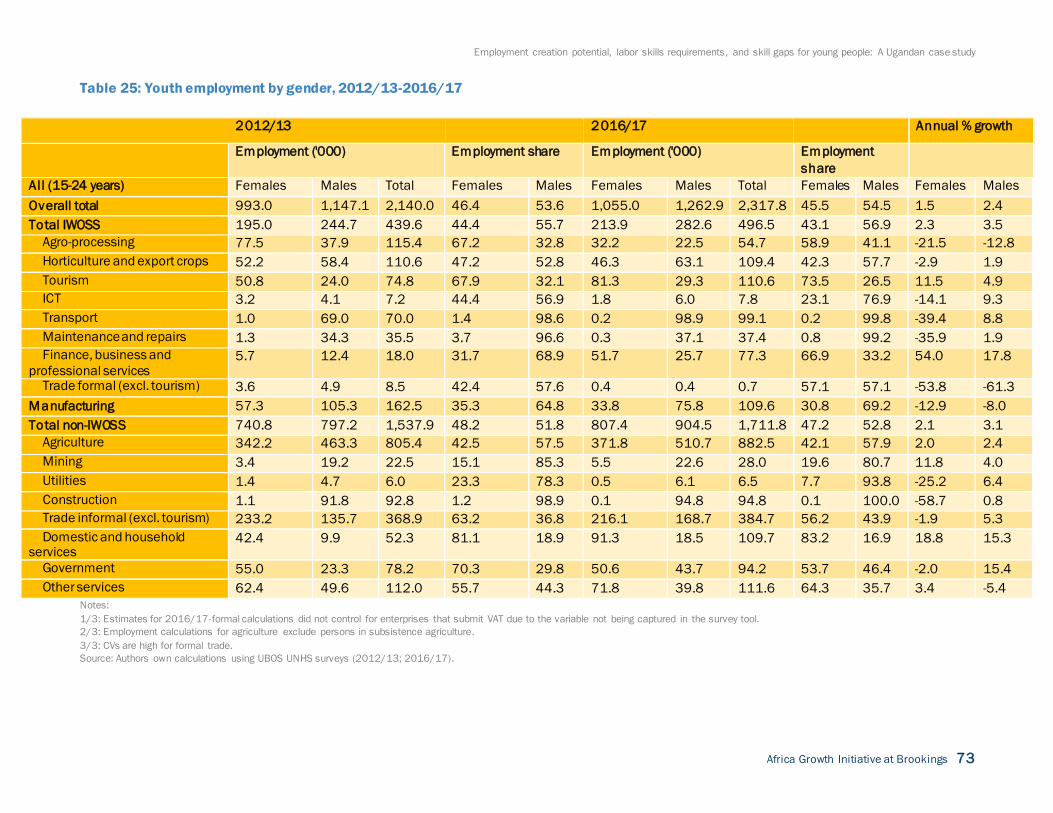
Employment creation potential, labor skills requirements, and skill gaps for young people: A Ugandan case study
Africa Growth Initiative at Brookings 73
Table 25: Youth employment by gender, 2012/13-2016/17
2012/13 2016/17 Annual % growth
Employment ('000) Employment share Employment ('000) Employment
share
All (15-24 years) Females Males Total Females Males Females Males Total Females Males Females Males
Overall total 993.0 1,147.1 2,140.0 46.4 53.6 1,055.0 1,262.9 2,317.8 45.5 54.5 1.5 2.4
Total IWOSS 195.0 244.7 439.6 44.4 55.7 213.9 282.6 496.5 43.1 56.9 2.3 3.5
Agro-processing 77.5 37.9 115.4 67.2 32.8 32.2 22.5 54.7 58.9 41.1 -21.5 -12.8
Horticulture and export crops 52.2 58.4 110.6 47.2 52.8 46.3 63.1 109.4 42.3 57.7 -2.9 1.9
Tourism 50.8 24.0 74.8 67.9 32.1 81.3 29.3 110.6 73.5 26.5 11.5 4.9
ICT 3.2 4.1 7.2 44.4 56.9 1.8 6.0 7.8 23.1 76.9 -14.1 9.3
Transport 1.0 69.0 70.0 1.4 98.6 0.2 98.9 99.1 0.2 99.8 -39.4 8.8
Maintenance and repairs 1.3 34.3 35.5 3.7 96.6 0.3 37.1 37.4 0.8 99.2 -35.9 1.9
Finance, business and
professional services 5.7 12.4 18.0 31.7 68.9 51.7 25.7 77.3 66.9 33.2 54.0 17.8
Trade formal (excl. tourism) 3.6 4.9 8.5 42.4 57.6 0.4 0.4 0.7 57.1 57.1 -53.8 -61.3
Manufacturing 57.3 105.3 162.5 35.3 64.8 33.8 75.8 109.6 30.8 69.2 -12.9 -8.0
Total non-IWOSS 740.8 797.2 1,537.9 48.2 51.8 807.4 904.5 1,711.8 47.2 52.8 2.1 3.1
Agriculture 342.2 463.3 805.4 42.5 57.5 371.8 510.7 882.5 42.1 57.9 2.0 2.4
Mining 3.4 19.2 22.5 15.1 85.3 5.5 22.6 28.0 19.6 80.7 11.8 4.0
Utilities 1.4 4.7 6.0 23.3 78.3 0.5 6.1 6.5 7.7 93.8 -25.2 6.4
Construction 1.1 91.8 92.8 1.2 98.9 0.1 94.8 94.8 0.1 100.0 -58.7 0.8
Trade informal (excl. tourism) 233.2 135.7 368.9 63.2 36.8 216.1 168.7 384.7 56.2 43.9 -1.9 5.3
Domestic and household services
42.4 9.9 52.3 81.1 18.9 91.3 18.5 109.7 83.2 16.9 18.8 15.3
Government 55.0 23.3 78.2 70.3 29.8 50.6 43.7 94.2 53.7 46.4 -2.0 15.4
Other services 62.4 49.6 112.0 55.7 44.3 71.8 39.8 111.6 64.3 35.7 3.4 -5.4
Notes:
1/3: Estimates for 2016/17-formal calculations did not control for enterprises that submit VAT due to the variable not being captured in the survey tool.
2/3: Employment calculations for agriculture exclude persons in subsistence agriculture.
3/3: CVs are high for formal trade.
Source: Authors own calculations using UBOS UNHS surveys (2012/13; 2016/17).
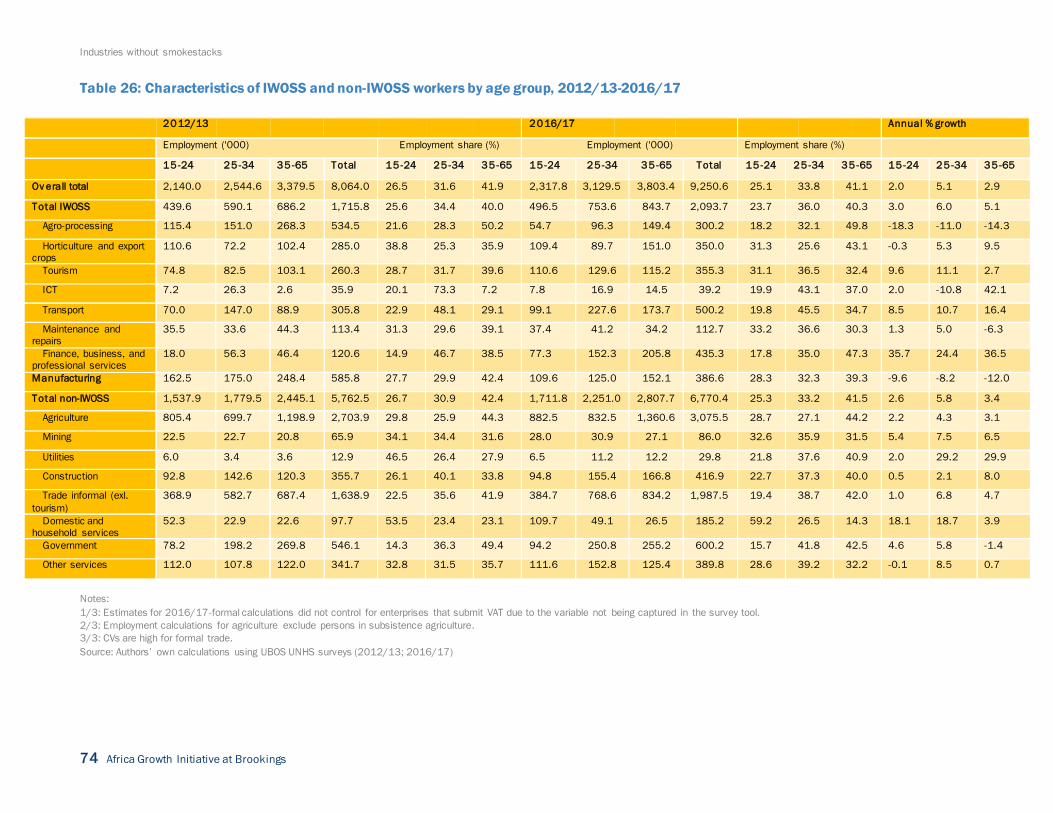
Industries without smokestacks
74 Africa Growth Initiative at Brookings
Table 26: Characteristics of IWOSS and non-IWOSS workers by age group, 2012/13-2016/17
2012/13 2016/17 Annual % growth
Employment ('000) Employment share (%) Employment ('000) Employment share (%)
15 -24 25-34 35-65 Total 15-24 25-34 35-65 15-24 25-34 35-65 Total 15-24 25-34 35-65 15-24 25-34 35-65
Ov erall total 2,140.0 2,544.6 3,379.5 8,064.0 26.5 31.6 41.9 2,317.8 3,129.5 3,803.4 9,250.6 25.1 33.8 41.1 2.0 5.1 2.9
Total IWOSS 439.6 590.1 686.2 1,715.8 25.6 34.4 40.0 496.5 753.6 843.7 2,093.7 23.7 36.0 40.3 3.0 6.0 5.1
Agro-processing 115.4 151.0 268.3 534.5 21.6 28.3 50.2 54.7 96.3 149.4 300.2 18.2 32.1 49.8 -18.3 -11.0 -14.3
Horticulture and export crops
110.6 72.2 102.4 285.0 38.8 25.3 35.9 109.4 89.7 151.0 350.0 31.3 25.6 43.1 -0.3 5.3 9.5
Tourism 74.8 82.5 103.1 260.3 28.7 31.7 39.6 110.6 129.6 115.2 355.3 31.1 36.5 32.4 9.6 11.1 2.7
ICT 7.2 26.3 2.6 35.9 20.1 73.3 7.2 7.8 16.9 14.5 39.2 19.9 43.1 37.0 2.0 -10.8 42.1
Transport 70.0 147.0 88.9 305.8 22.9 48.1 29.1 99.1 227.6 173.7 500.2 19.8 45.5 34.7 8.5 10.7 16.4
Maintenance and repairs
35.5 33.6 44.3 113.4 31.3 29.6 39.1 37.4 41.2 34.2 112.7 33.2 36.6 30.3 1.3 5.0 -6.3
Finance, business, and professional services
18.0 56.3 46.4 120.6 14.9 46.7 38.5 77.3 152.3 205.8 435.3 17.8 35.0 47.3 35.7 24.4 36.5
Manufacturing 162.5 175.0 248.4 585.8 27.7 29.9 42.4 109.6 125.0 152.1 386.6 28.3 32.3 39.3 -9.6 -8.2 -12.0
Total non-IWOSS 1,537.9 1,779.5 2,445.1 5,762.5 26.7 30.9 42.4 1,711.8 2,251.0 2,807.7 6,770.4 25.3 33.2 41.5 2.6 5.8 3.4
Agriculture 805.4 699.7 1,198.9 2,703.9 29.8 25.9 44.3 882.5 832.5 1,360.6 3,075.5 28.7 27.1 44.2 2.2 4.3 3.1
Mining 22.5 22.7 20.8 65.9 34.1 34.4 31.6 28.0 30.9 27.1 86.0 32.6 35.9 31.5 5.4 7.5 6.5
Utilities 6.0 3.4 3.6 12.9 46.5 26.4 27.9 6.5 11.2 12.2 29.8 21.8 37.6 40.9 2.0 29.2 29.9
Construction 92.8 142.6 120.3 355.7 26.1 40.1 33.8 94.8 155.4 166.8 416.9 22.7 37.3 40.0 0.5 2.1 8.0
Trade informal (exl.
tourism)
368.9 582.7 687.4 1,638.9 22.5 35.6 41.9 384.7 768.6 834.2 1,987.5 19.4 38.7 42.0 1.0 6.8 4.7
Domestic and household services
52.3 22.9 22.6 97.7 53.5 23.4 23.1 109.7 49.1 26.5 185.2 59.2 26.5 14.3 18.1 18.7 3.9
Government 78.2 198.2 269.8 546.1 14.3 36.3 49.4 94.2 250.8 255.2 600.2 15.7 41.8 42.5 4.6 5.8 -1.4
Other services 112.0 107.8 122.0 341.7 32.8 31.5 35.7 111.6 152.8 125.4 389.8 28.6 39.2 32.2 -0.1 8.5 0.7
Notes:
1/3: Estimates for 2016/17-formal calculations did not control for enterprises that submit VAT due to the variable not being captured in the survey tool.
2/3: Employment calculations for agriculture exclude persons in subsistence agriculture.
3/3: CVs are high for formal trade.
Source: Authors’ own calculations using UBOS UNHS surveys (2012/13; 2016/17)
Employment creation potential, labor skills requirements, and skill gaps for young people: A Ugandan case study
Africa Growth Initiative at Brookings 75
Annex 2: Productivity growth in IWOSS sectors: An alternative
perspective
It is useful to characterize and contrast firms active in IWOSS and non-IWOSS sectors. How many IWOSS
firms are there in Uganda? How labor intensive is the average IWOSS firms and how productively is labor
used in these firms? What is the relationship of IWOSS firms with the external sector?
To answer these and related questions, we employ administrative data sets collected by the Uganda
Revenue Authority (URA) for the purposes of taxation. Specifically, we use four different data sets that we
link to each other at the firm level using masked TIN numbers. Our first source of data is annual Corporate
Income Tax (CIT) returns, from which we take data on a firm’s output and total wage bill. Second, we use
monthly Pay-As-You-Earn41 declarations, holding information on a firm’s staffing to calculate the number of
employees per firm. Third, transaction-level customs data (ASYCUDA) allow us to explore the relationship of
a firm with the external sector through its exports. Finally, we employ monthly value-added tax (VAT)
declarations from which we take information on a firm’s inputs (sourced both domestically as well as
internationally). We also use data from the VAT declarations to amend information on a firm’s annual output
from the CIT returns. As some firms submit their declarations only irregularly, we build three-year averages
(2014-2016) of key variables of interest in order to improve the coverage of our data.
Next, we identify a firm’s affiliation to IWOSS sectors of interest in this study. Here, we employ information
on firms’ four-digit International Standard Industry Classification (ISIC) code, which are reported in the
Corporate Income Tax returns. While the ISIC classification is useful for identifying a firm’s sectoral affiliation
in most cases, we improve the accuracy of the ISIC identification of IWOSS and non-IWOSS firms by using
the information on a firm’s exports held by the customs data. Specifically, we identify firms that export key
horticultural (and some agro-processing) export commodities in the customs data through the standardized
codes provided for by the Harmonized System and update sectoral affiliation of a firm accordingly. 42 After
cleaning, our final data set holds information on sectoral affiliation, output, staffing, and salaries as well as
the relationship of a firm with the external sector for a total of 38,249 Ugandan firms, capturing the entire
formal Ugandan economy.
Before presenting firm characteristics on IWOSS and non-IWOSS firms using this data set, it is important to
highlight its limitations. First, and most crucially, the data only holds information on formal firms reporting
to Uganda’s tax authority.43 Second, since we only observe employees reported by the firms to the tax
authority, it is highly likely that we are unable to capture employment numbers in the large informal tail of
the agricultural sectors. Finally, as the customs data only covers cross-border commodity trade, information
on services trade is not captured by this type of data.44 Table 35 employs the data set to present
characteristics of firms active in IWOSS and non-IWOSS sectors.
41 Pay-As-You-Earn is a tax on income payments withheld by the employer. 42 The Harmonized System is an international nomenclature of traded goods assigning standardized codes to goods traded between countries.
Employing information on the type of goods exported by a firm allows us to improve the accuracy of the sector information captured by the ISIC
codes that we take from the Corporate Income Tax returns. These are self-reported at the time of registration for a TIN and as such often do not
accurately reflect the type of business activity of a firm. For example, in our customs data we find a large exporter of coffee. When registering for
Corporate Income Tax this firm put down “Coffee Trading Processing an Exporting” as their main business activity in an unstructured text field, but
selected ISIC code 8299 (“Other business support service activities n.e.c.”). Consequently, only relying on ISIC code information in the CIT returns
would let us classify this company as “Other non-IWOSS,” despite the firm being active in the horticultural sector as evident from its coffee
exports. 43 The threshold for companies having to register for Corporate Income Tax payments (which we primarily use in this study to identify a firm’s
sector affiliation) was UGX 50 million (ca. $18,000) up to 2015, when it was raised to UGX 150 million. 44 We do find some exports by firms that have registered in a services sector, but examining the customs data reveals that all of these are goods
exports and not related to the services sector a firm is active in.
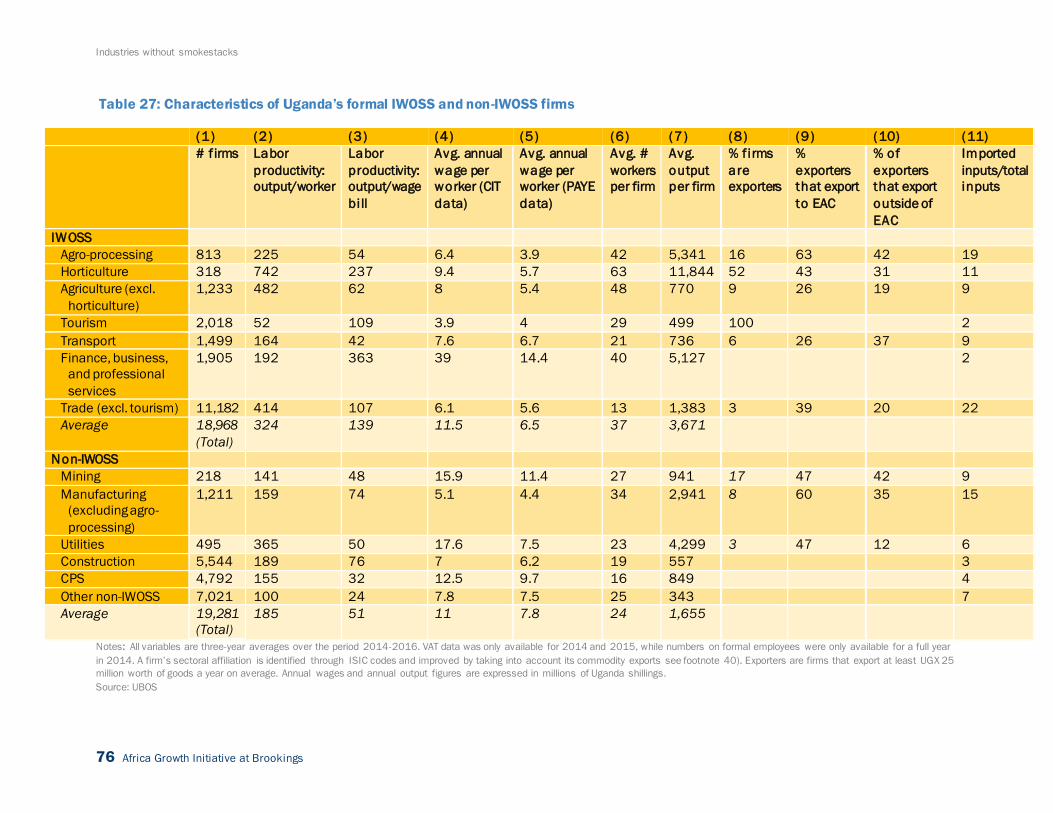
Industries without smokestacks
76 Africa Growth Initiative at Brookings
Table 27: Characteristics of Uganda’s formal IWOSS and non-IWOSS firms
(1) (2) (3) (4) (5) (6) (7) (8) (9) (10) (11)
# f irms Labor
productivity:
output/worker
Labor
productivity:
output/wage
bill
Avg. annual
wage per
worker (CIT
data)
Avg. annual
wage per
worker (PAYE
data)
Avg. #
workers
per firm
Avg.
output
per firm
% firms
are
exporters
%
exporters
that export
to EAC
% of
exporters
that export
outside of
EAC
Imported
inputs/total
inputs
IWOSS
Agro-processing 813 225 54 6.4 3.9 42 5,341 16 63 42 19
Horticulture 318 742 237 9.4 5.7 63 11,844 52 43 31 11
Agriculture (excl.
horticulture)
1,233 482 62 8 5.4 48 770 9 26 19 9
Tourism 2,018 52 109 3.9 4 29 499 100
2
Transport 1,499 164 42 7.6 6.7 21 736 6 26 37 9
Finance, business,
and professional
services
1,905 192 363 39 14.4 40 5,127
2
Trade (excl. tourism) 11,182 414 107 6.1 5.6 13 1,383 3 39 20 22
Average 18,968
(Total)
324 139 11.5 6.5 37 3,671
Non-IWOSS
Mining 218 141 48 15.9 11.4 27 941 17 47 42 9
Manufacturing
(excluding agro-
processing)
1,211 159 74 5.1 4.4 34 2,941 8 60 35 15
Utilities 495 365 50 17.6 7.5 23 4,299 3 47 12 6
Construction 5,544 189 76 7 6.2 19 557
3
CPS 4,792 155 32 12.5 9.7 16 849
4
Other non-IWOSS 7,021 100 24 7.8 7.5 25 343
7
Average 19,281
(Total)
185 51 11 7.8 24 1,655
Notes: All variables are three-year averages over the period 2014-2016. VAT data was only available for 2014 and 2015, while numbers on formal employees were only available for a full year
in 2014. A firm’s sectoral affiliation is identified through ISIC codes and improved by taking into account its commodity exports see footnote 40). Exporters are firms that export at least UGX 25
million worth of goods a year on average. Annual wages and annual output figures are expressed in millions of Uganda shillings.
Source: UBOS
Employment creation potential, labor skills requirements, and skill gaps for young people: A Ugandan case study
Africa Growth Initiative at Brookings 77
First, in Column 1 we employ information on sectoral affiliation of a firm constructed from ISIC codes
as well as a firm’s export commodities and categorize firms into different IWOSS and non -IWOSS
sectors. A key insight from this exercise is that IWOSS and Non-IWOSS firms make up equal parts of
Uganda’s formal firms network. Less than 1 percent of all firms are registered as being active in a
horticultural business, while by far the most companies are registered in trade (excluding tourism).
Next, in Columns 2 and 3 we provide two measures for labor productivity: The average output per
worker in million Uganda Shilling (Column 2) and the average ratio of a firm’s wage bill to total output
(Column 3).45 While using either of the indicators results in different rankings of sectors, both suggest
that IWOSS industries are (on average) more productive than non-IWOSS sectors, although this
difference seems partly driven by a few high productivity sectors. A useful insight from the comparison
of both indicators is that the employment numbers provided in the PAYE data do not reflect
casual/seasonal workers in agriculture and other sectors characterized to a large degree by informal
labor. For example, when considering productivity in the IWOSS sector agriculture (excl. horticulture),
using the output/worker ratio suggests that the sector is the second-most productive of all 13 sectors
included in this study. When using output/wage bill instead, the sector ranks well below the average
for IWOSS industries, suggesting that the labor figure reported in the PAYE data really only includes
formal employees and not seasonal/causal labor, whereas the total wage bill reported in the annual
CIT returns seems to capture all wage payments made by a firm. Supporting this assessment, and in
line with the known cost of labor, educational requirements, and high degree of formality of this sector,
financial and business services ranks highest among all industries when using the ratio of firm output
to wage bill instead of the output to labor ratio.
In Columns 4 and 5, we show that average annual wages (in millions of Ugandan shillings) in IWOSS
and non-IWOSS firms are largely the same, although there is a higher degree of disparity among non-
IWOSS sectors.46 Agro-processing and tourism pay moderate salaries, while horticulture companies
pay salaries somewhat higher than most other sectors. As would be expected by high demands with
respect to working in the sector, annual wages per worker are highest in financial and business
services. In Column 6, we consider PAYE data on average (formal) employment per firm in different
sectors. A key takeaway here is that the average IWOSS firm employs more formal workers than the
average non-IWOSS firm (37 employees versus 25), with horticulture being the most employment
intensive of all sectors considered. Similarly, IWOSS firms are larger in terms of annual output as
shown in Column 7. Again, Uganda’s few horticulture companies rank highest with an average annual
turnover of about 11.8 billion Uganda Shilling (ca. $3.18 million).
In Columns 8, 9, and 10, we consider the importance of exporting to IWOSS and non-IWOSS firms, by
tracking the number of firms in a sector that engage in exporting activities. 47 Using traditional
manufacturing (excluding agro-processing) as a benchmark, we find that IWOSS firms are much more
likely to engage in exporting: 16 percent of all agro-processing firms export, 9 percent of all firms active
45 Average labor productivity of a sector is calculated by averaging the annual labor (wage bill)/output ratios of individual firms across
sectors. 46 To ensure these findings are accurate, we again take advantage of all information available in our data sets, employing the wage bill
reported in the Corporate Income Tax returns in Column 4 and the one found in the PAYE data in Column 5. 47 We set a threshold of an annual export volume of UGX 25 million (ca. $8,000) to count a company as an exporter. We set this threshold
to account for the fact that many companies engage in export transactions sporadically (e.g., when sending packages abroad to business
affiliates), but exporting is not part of their core business. For tourism, we assume that, by definition, all business is from exporting, but
evidently this is not captured in the formal customs data on goods trade.
Industries without smokestacks
78 Africa Growth Initiative at Brookings
in agriculture (excluding horticulture), and a staggering 56 percent of all horticulture firms.48 The East
African Community is an important export destination for exporters in all sectors (Column 9), but many
exporters also reach markets outside of the customs union (Column 10).
Finally, in Column 11, we explore the other dimension through which firms engage in international
trade, namely by sourcing inputs from foreign countries. To assess how much IWOSS firms rely on
imported inputs for their activities, we compute the ratio of imported inputs to total inputs as reported
by firms in their VAT declaration. The results suggest that IWOSS firms rely on imported inputs to a
much higher degree than non-IWOSS firms. Firms active in agro-processing source 19 percent of their
total inputs from abroad (compared to “normal” manufacturing firms with 15 percent). Firms active in
the horticulture sector import about 9 percent of their inputs from foreign countries. Unsurprisingly,
trade (excluding tourism) is the most import intensive sector, while financial and business services do
not rely on imported good inputs at all. Somewhat surprisingly, although these firms need to cater to
an international customer base with very high demands and expectations, firms active in the tourism
sector do not seem to rely on imported inputs to any noteworthy degree.
In sum, our analysis of tax administrative data for Uganda’s formal firms network suggests that on
average IWOSS firms are larger (in terms of output and number of formal employees), are more
productive, and engage much more with the external sector through both exporting as well as sourcing
inputs from abroad. When assessing constraints to growth in IWOSS sectors it seems advisable to take
into account the high interaction and dependence of these firms with the external sector. Our initial
analysis seems to suggest that solving constraints to trading is especially relevant for two key sectors
of interest considered in this study: agro-processing and horticulture.
48 This partly reflects the fact that this sector includes coffee as a commodity, which is almost exclusively sold to foreign countries and is
not consumed domestically.

Employment creation potential, labor skills requirements, and skill gaps for young people: A Ugandan case study
Africa Growth Initiative at Brookings 79
Table 28: Skills analysis for horticulture firms (FFV & flower firms)
FFV firms F lower firms Sk illed agricultural, forestry, and fishery
workers
Plant and machine operators and
assemblers
Skilled agricultural, forestry, and fishery
workers
Importance Actual Desired Gap Importance Actual Desired Gap Importance Actual Desired Gap
Basic skills 3.14 2.32 3.06 0.74 3.97 2.70 3.93 1.23 2.64 1.90 2.28 0.38
Social skills 2.70 2.20 2.53 0.33 5.00 3.44 4.94 1.50 2.90 2.11 2.62 0.51
Problem-solving skills 2.60 2.60 2.80 0.20 5.00 1.00 4.67 3.67 3.40 1.20 2.67 1.47
Technical skills 1.82 1.65 1.87 0.22 2.09 1.79 2.06 0.27 1.70 1.52 1.46 -0.06
Systems skills 1.80 1.53 1.87 0.34 2.78 2.22 2.78 0.56 2.05 1.49 1.71 0.22
Resource management skills 2.00 1.65 2.00 0.35 3.33 2.75 3.33 0.58 2.83 2.30 2.29 -0.01 Source: Authors’ own calculations based on field survey data (2020).
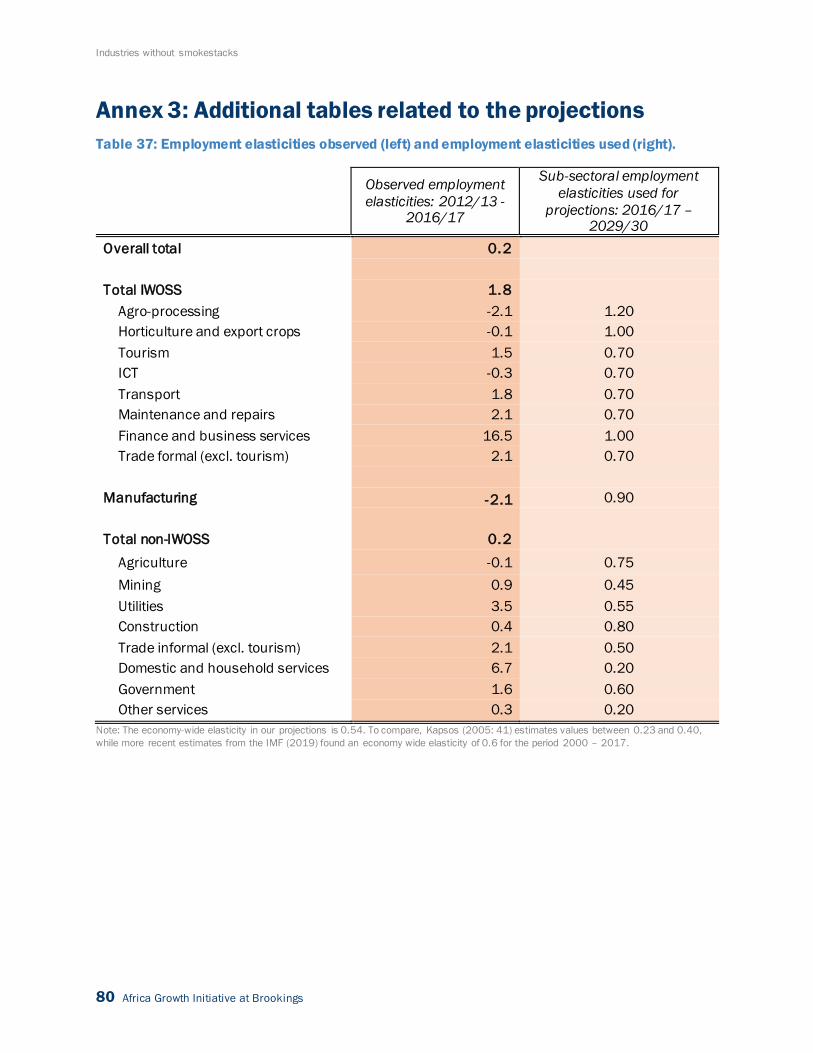
Industries without smokestacks
80 Africa Growth Initiative at Brookings
Annex 3: Additional tables related to the projections
Table 37: Employment elasticities observed (left) and employment elasticities used (right).
Observed employment
elasticities: 2012/13 - 2016/17
Sub-sectoral employment
elasticities used for
projections: 2016/17 – 2029/30
Overall total 0.2
Total IWOSS 1.8
Agro-processing -2.1 1.20
Horticulture and export crops -0.1 1.00
Tourism 1.5 0.70
ICT -0.3 0.70
Transport 1.8 0.70
Maintenance and repairs 2.1 0.70
Finance and business services 16.5 1.00
Trade formal (excl. tourism) 2.1 0.70
Manufacturing -2.1 0.90
Total non-IWOSS 0.2
Agriculture -0.1 0.75
Mining 0.9 0.45
Utilities 3.5 0.55
Construction 0.4 0.80
Trade informal (excl. tourism) 2.1 0.50
Domestic and household services 6.7 0.20
Government 1.6 0.60
Other services 0.3 0.20
Note: The economy-wide elasticity in our projections is 0.54. To compare, Kapsos (2005: 41) estimates values between 0.23 and 0.40,
while more recent estimates from the IMF (2019) found an economy wide elasticity of 0.6 for the period 2000 – 2017.
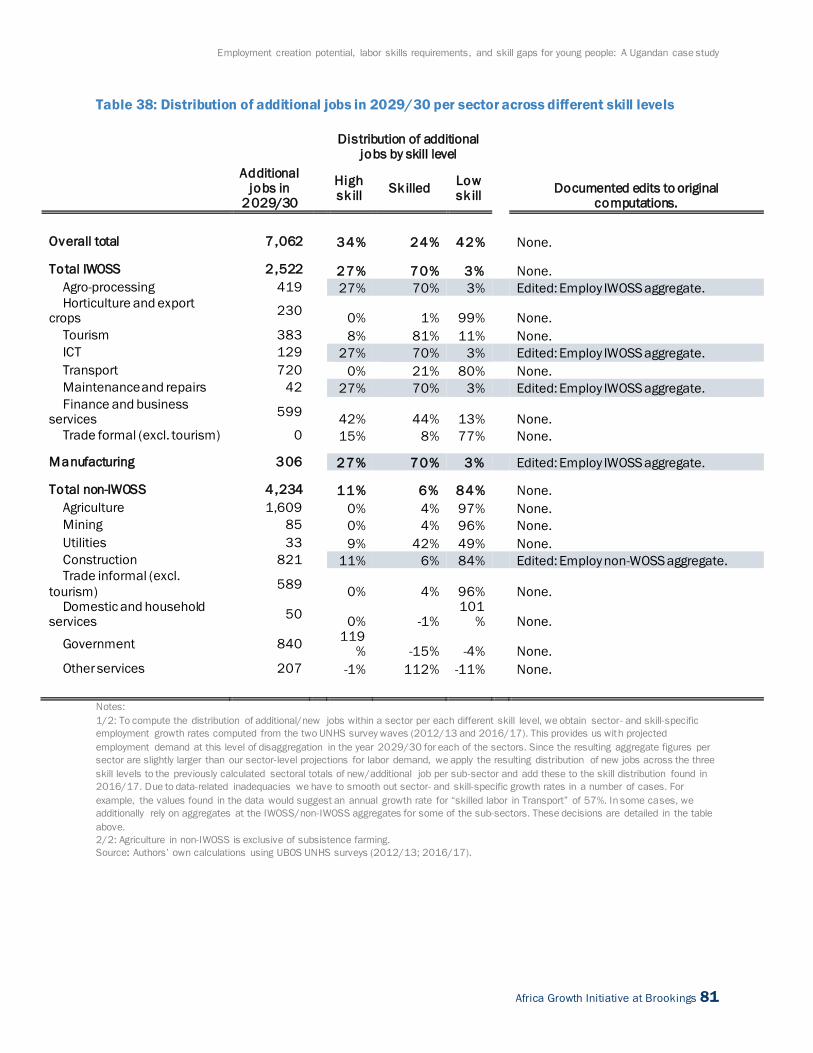
Employment creation potential, labor skills requirements, and skill gaps for young people: A Ugandan case study
Africa Growth Initiative at Brookings 81
Table 38: Distribution of additional jobs in 2029/30 per sector across different skill levels
Distribution of additional jobs by skill level
Additional jobs in
2029/30
High sk ill
Sk illed Low sk ill
Documented edits to original computations.
Overall total 7 ,062 34% 24% 42% None. Total IWOSS 2,522 27% 70% 3% None.
Agro-processing 419 27% 70% 3% Edited: Employ IWOSS aggregate. Horticulture and export
crops 230
0% 1% 99% None.
Tourism 383 8% 81% 11% None.
ICT 129 27% 70% 3% Edited: Employ IWOSS aggregate.
Transport 720 0% 21% 80% None.
Maintenance and repairs 42 27% 70% 3% Edited: Employ IWOSS aggregate.
Finance and business services
599 42% 44% 13% None.
Trade formal (excl. tourism) 0 15% 8% 77% None. Manufacturing 306 27% 70% 3% Edited: Employ IWOSS aggregate. Total non-IWOSS 4,234 11% 6% 84% None.
Agriculture 1,609 0% 4% 97% None.
Mining 85 0% 4% 96% None.
Utilities 33 9% 42% 49% None.
Construction 821 11% 6% 84% Edited: Employ non-WOSS aggregate. Trade informal (excl.
tourism) 589
0% 4% 96% None. Domestic and household
services 50
0% -1% 101
% None.
Government 840 119% -15% -4% None.
Other services 207 -1% 112% -11% None.
Notes:
1/2: To compute the distribution of additional/new jobs within a sector per each different skill level, we obtain sector- and skill-specific
employment growth rates computed from the two UNHS survey waves (2012/13 and 2016/17). This provides us with projected
employment demand at this level of disaggregation in the year 2029/30 for each of the sectors. Since the resulting aggregate figures per
sector are slightly larger than our sector-level projections for labor demand, we apply the resulting distribution of new jobs across the three
skill levels to the previously calculated sectoral totals of new/additional job per sub-sector and add these to the skill distribution found in
2016/17. Due to data-related inadequacies we have to smooth out sector- and skill-specific growth rates in a number of cases. For
example, the values found in the data would suggest an annual growth rate for “skilled labor in Transport” of 57%. In some cases, we
additionally rely on aggregates at the IWOSS/non-IWOSS aggregates for some of the sub-sectors. These decisions are detailed in the table
above.
2/2: Agriculture in non-IWOSS is exclusive of subsistence farming.
Source: Authors’ own calculations using UBOS UNHS surveys (2012/13; 2016/17).