Embed Size (px)
Citation preview

October 2012
Perspectives from Bangladesh
EMPLOYMENT EFFECTS OF FTA AGREEMENTS
InternationalLabourOrganization
Selim Raihan

Employment E�ects of FTA Agreements
Perspectives from Bangladesh
Selim Raihan
October 2012InternationalLabourOrganization

Selim Raihan
Copyright © International Labour Organization 2013First published 2013
Publications of the International Labour Office enjoy copyright under Protocol 2 of the Universal Copyright Convention. Nevertheless, short excerpts from them may be reproduced without authorization, on condition that the source is indicated. For rights of reproduction or translation, application should be made to ILO Publications (Rights and Permissions), International Labour Office, CH-1211 Geneva 22, Switzerland, or by email: [email protected]. The International Labour Office welcomes such applications.
Libraries, institutions and other users registered with reproduction rights organizations may make copies in accordance with the licences issued to them for this purpose. Visit www.ifrro.org to find the reproduction rights organization in your country.
ILO Cataloguing in Publication Data
Raihan, Selim
Employment Effects of FTA Agreements: Perspective from Bangladesh / Selim Raihan; International Labour Organization; ILO Country Office for Bangladesh. - Dhaka: ILO, 2013
ISBN:9789221276128 (Print); 9789221276135 (web pdf)
International Labour Organization; ILO Country Office for Bangladesh
employment / free trade / trade agreement / service sector / Bangladesh
The designations employed in ILO publications, which are in conformity with United Nations practice, and the presentation of material therein do not imply the expression of any opinion whatsoever on the part of the International Labour Office concerning the legal status of any country, area or territory or of its authorities, or concerning the delimitation of its frontiers.
The responsibility for opinions expressed in signed articles, studies and other contributions rests solely with their authors, and publication does not constitute an endorsement by the International Labour Office of the opinions expressed in them.
Reference to names of firms and commercial products and processes does not imply their endorsement by the International Labour Office, and any failure to mention a particular firm, commercial product or process is not a sign of disapproval.
ILO publications and electronic products can be obtained through major booksellers or ILO local offices in many countries, or direct from ILO Publications, International Labour Office, CH-1211 Geneva 22, Switzerland. Catalogues or lists of new publications are available free of charge from the above address, or by email: [email protected]
Visit our web site: www.ilo.org/publns
Design & layout: Masuma Pia/Matri
A matri production from Bangladesh

Trade reforms, trade policies and trade openness have important implications on employment. As the economy of Bangladesh is becoming increasingly dependent on trade, the effects of trade on employment and other labour market correlates have become of great interest as well as concern for the country
Bangladesh has entered into several regional Free Trade Agreement (FTA) agreements and is in the process of signing bilateral FTA agreements with a number of countries. Underlying these initiatives is the assumption that trade will have a positive impact on Bangladesh’s firms and work-ers. However, the research evidence suggests that, especially in the developing countries, trade has very uneven effects on the labour market in terms of job creation, shifting jobs from one sector to another, wages and worker’s rights.
This report looks at economy-wide impacts of three different FTA agreements: (a) a Bangladesh-India bilateral FTA (b) a Bangladesh-Malaysia bilateral FTA and (c) the Bay of Bengal Initiative for Multi-Sectoral Technical and Economic Cooperation (BIMSTEC) agreement. The report explores how these bilateral and regional FTAs would affect the Bangladesh economy in terms of impact on consumer prices, exports, real wages and employment. The results of the research conducted for this report point to some important policy implications. They underline the need for Bangladesh to take appropriate policy measures to find ways to mitigate adjustment costs. They also emphasize the need for complementary policies to improve supply side capacity, which would require a significant improvement of physical infrastructure, a reduction in cost of doing business, a rise in labour productivity and an improvement in economic governance.
This publication is an outcome of a European Union funded project, which is being implemented by the International Labour Organization (ILO), entitled “Assessing and Addressing the Effects of Trade on Employment (ETE)”. This project aims to provide its constituents with capacity building, sound research evidence and a platform for discussion and formulation of national policies related to trade and employment. We believe that the findings of this report will be of great interest to all, particularly policymakers and the social partners in Bangladesh, who are concerned about the challenges that developing countries face in a globalized world. We would like to thank Dr. Selim Raihan for conducting this study. We hope that this report will generate useful discussions and contribute to policy reforms for inclusive and job-rich growth in Bangladesh.
Srinivas B. Reddy David CheongCountry Director Chief Technical AdviserILO Country Office for Bangladesh Assessing and Addressing the Effects of Trade on Employment (ETE) Project ILO Geneva
FOREWORD

This research publication has been produced with the assistance of the European Union in the context of the ILO project “Assessing and Addressing the Effects of Trade on Employment (ETE)”.
The author wishes to thank Ms Hasina Begum (National Project Coordinator, ETE) and Mr David Cheong, (Chief Technical Advisor, ETE) for their comments and continuous support in undertaking the study. This work would not have been possible without the support of Ms Marion Jansen (former Head, ILO Trade and Employment Programme), Mr. Srinivas B. Reddy (Country Director, ILO Bangladesh Office) and Mr. Gagan Rajbhandari (Deputy Director, ILO Bangladesh office)
This paper was presented at the ICITE Conference on “Labor, Trade and Inclusive Growth: Sustaining a Dynamic Asia”, on 18-19 April 2011 at the ADB HQ, Manila. The author is grateful for the useful comments received at that conference.
Substantial inputs were received from: Mr Shafique Alam Mehedi (Former Secretary, Ministry of Labour and Employment), Mr Ghulam Hussain (Chairman, National Board of Revenue and former Secretary, Ministry of Commerce), Mr André Bogui (former Country Director, ILO Bangladesh office), Mr Faizur Rahman (Joint Secretary, Ministry of Labour and Employment), Mr Khondker Mostan Hossain (Deputy Secretary, Ministry of Labour and Employment) and Members of the ETE Policy Working Group.
Logistics and assistance were provided by Mr Abdullah Mohammad Tawsif (Administrative Assistant, ETE) and Mr Ashibur Rahman and Pear Ali (SANEM) provided excellent assistance.
All errors and omissions remain the responsibility of the author.
ACKNOWLEDGEMENTS

Bangladesh has entered into several regional Free Trade Area (FTA) agreements and is in the process of signing bilateral FTA agreements with a number of countries. In recent years, there has been increased interest in regional economic integration in South Asia. In early 2004, the South Asian Association for Regional Cooperation (SAARC) member countries agreed to form a South Asian Free Trade Area (SAFTA), which has come into force since July 01, 2006. Bangladesh is also a member of the Bay of Bengal Initiative for Multi-Sectoral Technical and Economic Cooperation (BIMSTEC) comprising countries from South Asia and South-East Asia. Recently, Bangladesh is negotiating with India and Malaysia for bilateral FTAs.
Any FTA deal has two important aspects: the market access aspect (the export side) and the trade liberalisation aspect (the import side). The employment effects of these two aspects might go in different directions. While increased exports may create new employment in the export-oriented sectors, increased imports through liberalisation of trade may contract employment in the import-competing sectors. The net effect may depend on the relative strength of the aforementioned two effects. Against this backdrop, this paper investigates the economy-wide impacts of three different FTA agreements on the Bangladesh economy. These FTA agreements are the Bangladesh-India bilateral FTA, the Bangladesh-Malaysia bilateral FTA, and BIMSTEC.
The analysis of the macro impacts of the FTA scenarios suggests that such bilateral and regional FTAs would be beneficial for Bangladesh in terms of impact on consumer prices, exports, real wages and employment. At the sectoral level, a number of export-oriented sectors would gain from such FTAs. However, the sectoral level impacts also suggest that a large number of sectors would experience a fall in production because of a large inflow of imports, which will result in a loss in employment in these sectors. Therefore, these FTAs have important sectoral implications in terms of production, exports, imports and employment.
The study finds that at the aggregate level employment would rise as the loss in employment in some sectors would be more than compensated by the rise in employment in other sectors. There-fore, the net effect on employment is likely to be positive. The largest impact on total employment would be under the BIMSTEC scenario, where the employment of unskilled and skilled labour would rise by 1.18 per cent and 0.26 per cent, respectively, over their base numbers. The rises in employment would come mainly from the agriculture and services sectors. Under all three scenarios, the rises in employment of unskilled labour would be much higher than those of skilled labour, implying that production would become more unskilled-labour-intensive. Although the simulation results indicate positive net employment effects in all three scenarios, there are likely to be important adjustment costs in reality. Policy makers should be aware of these adjustment costs and find ways to mitigate them.
The study notes that there are several aspects of FTA agreements that could impede trade flows and deny prospects of employment creation through trade. These aspects include sensitive lists, rules of origin, and non-tariff barriers. The study suggests that policy makers and trade negotiators should design these aspects of FTA agreements strategically in order to increase export market access and raise productive efficiency with the use of imported intermediates while minimizing the negative consequences of import displacement.
SUMMARY

Within the framework of FTA negotiations, the study proposes that Bangladesh and the partner-countries involved form a Joint Council that would assess and address the potential impact of an FTA agreement and, subsequent to an agreement, monitor its implementation. The study also recommends that the respective trade-related government agencies of Bangladesh hold regular consultations with other government departments, including the Ministry of Labour and Employ-ment, as well as the private sector, particularly employers’ and workers’ groups, on ways and means to enhance the benefits derived from an FTA agreement. These consultations would help to identify problems in Bangladesh’s trade-related capacity. Addressing inadequacies in these areas would, in part, require important government interventions in worker training and human resources development.

CONTENTS
1. INTRODUCTION 1
2. METHODOLOGY 3
3. STRUCTURE OF THE BANGLADESH ECONOMY 5
4. QUANTITATIVE RESULTS 9
4.1. Changes in Net Exports 9
4.2. Changes in ‘Implicit Tariff Rates” 11
4.3. Macroeconomic Results 11
4.4. Sectoral Results 12
4.5. Employment Effects 14
5. STAKEHOLDERS' VIEWS: CHALLENGES OF THE FTAS 17
6. POLICY RECOMMENDATIONS AND CONCLUSION 19
REFERENCES 23
Annex 1: Description of the Models 25
Annex 2: Social Accounting Matrix of Bangladesh for the year 2007 29
Annex 3: Mapping and Classification Scheme in the SAM 31

LIST OF TABLES Table 1: Structure of the Bangladesh Economy in 2007 as derived from the SAM 6
Table 2: Sectoral Employment Numbers and Shares from the Employment Satellite
Matrix 7
Table 3: Per cent Changes in Net Exports from Base from the WITS/SMART
Simulations 10
Table 4: Per cent Change in “Implicit Tariff Rates” from Base 11
Table 5: Impacts on Macroeconomic Variables (Per cent change from base) 12
Table 6: Impacts on Sectoral Production, Export and Import
(Per cent change from base) 13
Table 7: Impacts on Sectoral Value-added by Unskilled labour, Skilled Labour
and Composite Capital (Per cent change from base) 14
Table 8: Employments effects 15
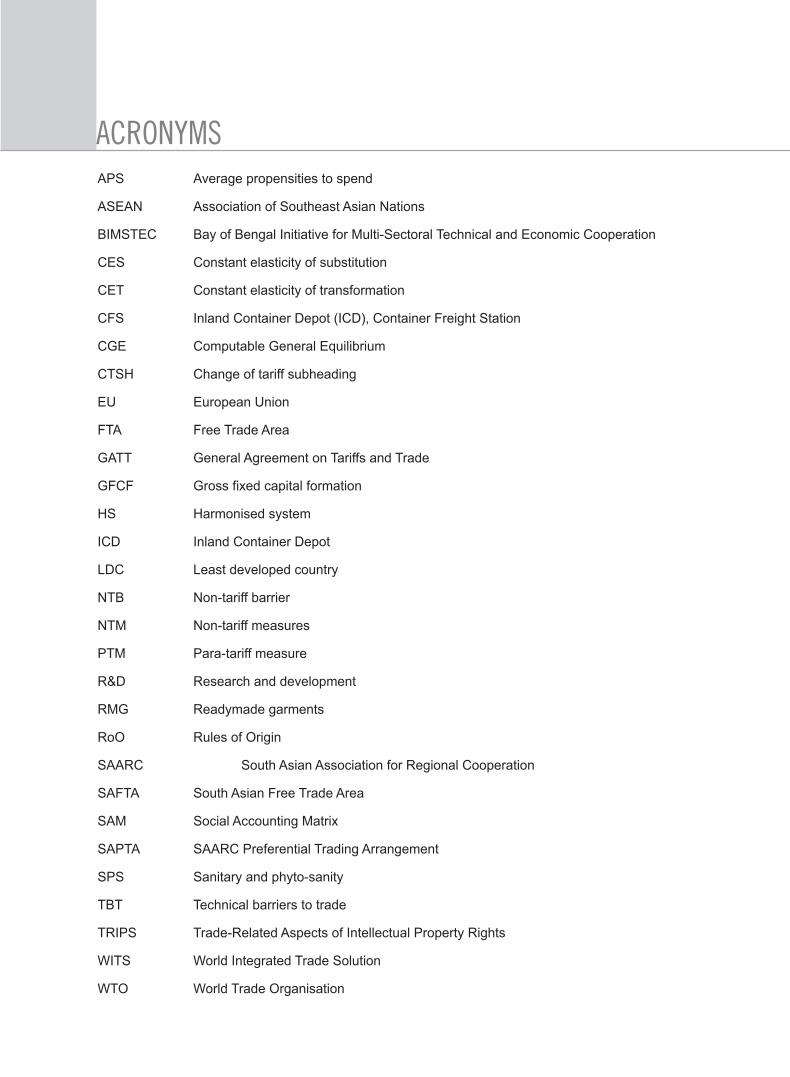
ACRONYMSAPS Average propensities to spend
ASEAN Association of Southeast Asian Nations
BIMSTEC Bay of Bengal Initiative for Multi-Sectoral Technical and Economic Cooperation
CES Constant elasticity of substitution
CET Constant elasticity of transformation
CFS Inland Container Depot (ICD), Container Freight Station
CGE Computable General Equilibrium
CTSH Change of tariff subheading
EU European Union
FTA Free Trade Area
GATT General Agreement on Tariffs and Trade
GFCF Gross fixed capital formation
HS Harmonised system
ICD Inland Container Depot
LDC Least developed country
NTB Non-tariff barrier
NTM Non-tariff measures
PTM Para-tariff measure
R&D Research and development
RMG Readymade garments
RoO Rules of Origin
SAARC South Asian Association for Regional Cooperation
SAFTA South Asian Free Trade Area
SAM Social Accounting Matrix
SAPTA SAARC Preferential Trading Arrangement
SPS Sanitary and phyto-sanity
TBT Technical barriers to trade
TRIPS Trade-Related Aspects of Intellectual Property Rights
WITS World Integrated Trade Solution
WTO World Trade Organisation
1
1 . INTRODUCT ION
Bangladesh has entered into several regional Free Trade Area (FTA) agreements and is in the process of signing bilateral FTA agreements with a number of countries. In recent years, there has been increased interest in regional economic integration in South Asia. With the stalemate of the World Trade Organisation (WTO) negotiations, it is expected that the interest in regional trading arrangements will increase further. Regional integration in South Asia gained momentum in 1995 when the South Asian Association for Regional Cooperation (SAARC) Preferential Trading Arrangement (SAPTA) was signed. In early 2004, the SAARC member countries agreed to form a South Asian Free Trade Area (SAFTA), which came into force on July 01, 2006. Bangladesh is also a member of the Bay of Bengal Initiative for Multi-Sectoral Technical and Economic Cooperation (BIMSTEC) comprising countries from South Asia and South-East Asia. Recently, Bangladesh has been negotiating with India and Malaysia for bilateral FTAs.
Standard trade theories argue for trade liberalisation for the efficient allocation of resources, including labour. However, theories have looked more at the import liberalisation effect and there has been less emphasis on market access effects. Empirical studies on the effect of trade liberalisation on employment appear to be inconclusive. At the aggregate level, trade reform has no significant effect on employment (Hoekman and Winters, 2005). Effects of trade on employment highly depend on regional and institutional factors; case-studies are needed to capture country-specific peculiarities (Lee, 2005; Jansen and Lee, 2007). Also, case studies show mixed results.
Any FTA deal has two important aspects: the market access aspect (the export side) and the trade liberalisation aspect (the import side). The employment effects of these two aspects might go in different directions. While increased exports may create new employment in the export-oriented sectors, increased imports through liberalisation of trade may contract employment in the import-competing sectors. The net effect may depend on the relative strength of the aforementioned two effects.
Against this backdrop, this paper investigates the economy-wide impacts of three different FTA agreements on the Bangladesh economy. These FTA agreements are the Bangladesh-India bilateral FTA, the Bangladesh-Malaysia bilateral FTA, and BIMSTEC.
Bangladesh and India are now negotiating to form a bilateral Free Trade Area (FTA) which will allow tariff-free trade between these two South Asian countries. Despite the fact that there is a South Asian Free Trade Area (SAFTA), progress in SAFTA is quite slow, which has compelled the South Asian member countries like India and Bangladesh to negotiate a bilateral FTA. This bilateral FTA is supposed to increase the market access of Bangladesh’s export products in India, whereas there will be increased import flows from India to Bangladesh. Since 1996-97, Indian exports to Bangladesh have been growing at 9.1 per cent annually, above the general rate of growth of its total merchandise exports (8.4 per cent). However, India’s imports from Bangladesh over the same period have grown on average at only 3 per cent annually, compared to average growth of its total imports of 9.2 per cent. Consequently Bangladesh’s bilateral trade deficit with India has been increasing rapidly, on average at about 9.5 per cent annually.
Malaysia is one of the most advanced developing countries, propelled forward by a thriving economy. It is expected that the FTA agreement with Malaysia in goods, services (including manpower, mode 4, and mode 3 as well), and investment will be of immense benefit for

2
Bangladesh. Bangladesh has a trade deficit with Malaysia. Bangladesh’s total exports to Malaysia - its largest investment partner among the Association of Southeast Asian Nations (ASEAN) - were worth just US$16.9 million in 2006-7, while its imports from Malaysia totalled US$384.16 million.
The Bay of Bengal Initiative for Multi-Sectoral Technical and Economic Cooperation (BIMSTEC) is comprised of Bangladesh, Bhutan, Myanmar, India, Nepal, Sri Lanka, and Thailand. An important element of this economic cooperation are the FTA deals among the member countries. For Bangladesh, the market access in India, Myanmar and Thailand is important.
The aforementioned three FTAs are likely to increase market access of Bangladesh’s export products to its partner countries. Such increased market access will allow exports to rise, which will have positive implications for employment in a number of sectors. However, one important concern is that the increased imports because of FTAs may lead to contraction of the domestic import-competing industries, leading to a loss in employment in those sectors. Increased imports may, on the other hand, lead to a rise in the availability of cheap raw materials for the export sectors, which may result in a rise in exports.
The objective of this paper is to investigate the links between trade liberalisation and employment in Bangladesh in the context of the aforementioned three FTA scenarios. In doing so, the paper also explores the mechanisms which influence such links. This paper also investigates the impact of such FTAs on the distribution of employment, wages, and composition of skill and unskilled labour in the sectors. Finally, this paper draws relevant policy implications.
The organisation of the paper is as follows: Section II discusses the methodology of the research; Section III presents an analysis of the structure of the Bangladesh economy; Section IV provides simulation results from the WITS/SMART model; Section V presents simulation results using the multiplier model; Section VI offers an analysis using the computable general equilibrium (CGE) model; Section VII provides a summary of the stakeholders' view on challenges; and, finally, Section VIII suggests the policy recommendations and concludes.
3
2 . METHODOLOGY
The study uses both quantitative and qualitative techniques to answer the research questions at hand.
For the quantitative estimates, this study uses the WITS/SMART3 global partial equilibrium model together with a single-country CGE model for Bangladesh. A brief description of the WITS/SMART model and the CGE model are provided in Annex 1. At first, the FTA scenarios are run in the WITS/SMART partial equilibrium model. The paper models FTA agreements as a reduction of tariffs to zero on goods traded between members of the agreements. There is no consideration of sensitive products or NTBs. The changes in exports, imports, and import revenues are obtained at the 6-digit Harmonised System (HS) code level from the WITS/SMART model and they are aggregated to 41 Social Accounting Matrix (SAM) sectors in Bangladesh.
The percentage changes in net exports (changes in export minus imports) are calculated from the WITS/SMART model. Also, the changes in import revenues from the WITS/SMART model are used to calculate the changes in implicit tariff rates at the sectoral level. Implicit tariff rates are defined as the ratios of import revenues to imports. In the context of the CGE model, changes in export demand and changes in implicit tariff rates are introduced as elements of each FTA scenario. Through the above mentioned procedures we establish links between a global trade model and a single-country model. The establishment of such links allows the simulation of regional or bilateral trade reform scenarios in a single-country CGE model. In the context of the single-country CGE model, we are thus able to obtain macroeconomic and results, including employment effects.
The employment effects of export changes and reduction in tariffs are derived in the following way: in each sector, the base value-addition by labour is divided by the base number of workers employed to calculate the base ‘derived wage rate’.4 The CGE simulation produces a new vector of value-addition of labour and the percentage change in the wage rate. The percentage change in the wage rate is used to derive the ‘new derived wage rate’. By dividing the new value addition of labour with the ‘new derived wage rate’, we obtain the new number of workers employed. The change in employment is the difference between the base number of workers employed and the new number of workers employed.
To also provide a qualitative assessment, we conducted several interviews of the different stakeholders in Bangladesh. These interviews helped identify major issues from Bangladesh's perspective concerning the negotiations of the bilateral and regional FTA agreements.
3 WITS refer to the World Integrated Trade Solution
4 The base number of workers employed in each sector is taken from the Bangladesh Labour Force Survey of 2005-2006.

5
3 . STRUCTURE OF THE BANGLADESH ECONOMYThe structure of the Bangladesh economy in 2007, as derived from the Bangladesh Social Accounting Matrix (SAM) of the same year, is briefly presented in Table 1. Column 1 shows the shares of sectoral value-added in total value-added. The share of agriculture in total value-added is 19.88 per cent with cereal crop and commercial crop sectors as the leading sectors. The share of industry is 18 per cent and the sectors with high shares are rice milling, woven readymade garments (woven RMG), and knit readymade garments (knit RMG). The share of the services sector (including construction) is 62.12 per cent and the leading services sectors are wholesale and retail trade, construction, and other services.
Column 2 of Table 1 shows the sectoral export orientation. The woven and knit RMG sectors are more than 80 per cent export-oriented. The other major export-oriented sectors are jute, leather, information technology, public administration and defence, fishing, furniture industry, and fertiliser industry.
Bangladesh’s export basket is highly concentrated as is evident from the fact that around 74 per cent of the total export comes from woven and knit RMG (Column 3 of Table 1). The share of fishing is 5.3 per cent. Jute, leather and miscellaneous industries constitute 3.3, 1.8 and, 4 per cent of the total exports, respectively. In the services sectors, public administration and defence constitute 5 per cent of the total export5 and the IT sector has a very low share, only 0.16 per cent.
Column 4 of Table 1 suggests that the major import-oriented sectors are chemical industry, petroleum, fertilizer industry, paper, printing and publishing industry, miscellaneous industry, toiletries, and yarn. According to Column 5, the sectors with high import shares are miscellaneous industry, petroleum, food process, and commercial crops. Finally, Column 6 presents the sectors with respective tariff rates. The leading protected sectors (the sectors with high tariff rates) are toiletries, cigarette industry, furniture industry, paper, printing and publishing industry, jute and yarn, cloth milling, woven RMG, poultry rearing, fishing, and grain milling.
5 The export of public administration and defence refers to the foreign exchange earnings thorough the UN peace commission.

6
Table 1: Structure of the Bangladesh Economy in 2007 as derived from the SAM
Note: Vi = sectoral value-added, TV = total value-added, Ei = sectoral export, Oi = sectoral output, TE = total export, Mi = sectoral import, TM = total import, TAR = tariff rate. All figures are expressed in percentageSource: Social Accounting Matrix of Bangladesh for 2007
Table 2 presents the structure of employment in the economy of Bangladesh. Despite the fact that the agricultural sector contributes less than 20 per cent of the value-addition (Table 1), it constitutes nearly 47 per cent of the total employed labour force of the country. The shares of industry and services sectors are 11.1 per cent and 41.9 per cent respectively.
Sectors 1 2 3 4 5 6
Vi/TV Ei/Oi Ei/TE Mi/Oi Mi/TM TAR Cereal Crop sectors 7.44 0.00 0.00 4.72 2.42 6.33 Commercial crops 4.53 2.24 1.16 20.59 7.50 5.53 Livestock Rearing 1.45 0.01 0.00 0.01 0.00 6.78 Poultry Rearing 0.90 0.00 0.00 0.58 0.06 15.09 Fishing 4.03 10.30 5.31 0.07 0.03 33.35 Forestry 1.54 0.00 0.00 0.00 0.00 0.00 Agriculture 19.88
6.47
10.00
Rice Milling 3.09 0.03 0.02 1.21 0.69 6.23 Grain Milling 0.36 0.08 0.01 0.11 0.01 24.28 Food Process 1.24 0.72 0.37 22.11 8.00 12.07 Leather Industry 0.39 23.10 1.77 4.25 0.23 11.74 Jute and Yarn 0.20 35.91 3.33 48.49 3.16 18.23 Cloth milling 1.72 0.01 0.01 14.62 3.76 27.43 Woven RMG 2.39 80.93 37.40 10.27 3.34 21.27 Knitting 3.26 90.42 36.26 1.28 0.36 1.17 Toiletries 0.00 1.60 0.02 45.14 0.32 31.97 Cigarette Industry 0.09 1.02 0.11 1.40 0.10 30.40 Furniture Industry 0.21 20.80 1.11 22.83 0.86 16.31 Paper, printing and publishing Industry 0.06 1.38 0.05 57.80 1.50 20.76 Pharmaceuticals 0.34 1.72 0.15 15.55 0.95 2.05 Fertilizer Industry 0.05 9.52 0.31 74.34 1.69 4.04 Petroleum 0.05 1.51 0.42 69.94 13.80 16.63 Chemical Industry 0.11 2.17 0.28 71.14 6.44 14.62 Glass Industry 0.04 4.07 0.05 23.58 0.20 21.03 Earth-ware and clay industry 0.19 0.05 0.00 12.01 0.30 7.22 Cement 0.16 0.26 0.02 6.09 0.39 11.07 Metal 0.96 2.84 0.75 13.53 2.51 14.12 Miscellaneous Industry 1.91 5.77 3.99 56.89 27.67 14.40 Mining and Quarrying 1.19 0.05 0.01 0.52 0.05 20.12 Industry 18.00
86.43
76.32
Construction 8.42 0.05 0.05 0.53 0.38 21.15 Electricity and Water Generation 0.89 0.35 0.03 7.46 0.41 6.77 Gas Extraction and Distribution 0.28 0.00 0.00 0.00 0.00 0.00 Wholesale and retail trade 14.63 0.00 0.00 0.00 0.00 0.00 Transport 9.44 1.11 0.82 15.58 8.13 0.00 Health Service 2.30 0.00 0.00 0.00 0.00 0.00 Education Service 2.63 0.00 0.00 0.00 0.00 0.00 Public Administration and Defence 2.84 18.83 5.03 11.72 2.20 0.00 Bank Insurance and Real estate 1.63 1.08 0.16 12.90 1.34 0.00 Hotel and Restaurant 0.70 0.00 0.00 0.00 0.00 0.00 Communication 1.32 2.75 0.32 1.89 0.15 0.00 Information Technology and E-Commerce 0.07 27.56 0.16 7.04 0.03 0.00 Other Services 16.98 0.48 0.54 1.30 1.03 0.00 Services 62.12
7.11
13.68
Total 100.00
100.00
100.00

7
Table 2: Sectoral Employment Numbers and Shares from the Employment Satellite Matrix
Note: UL = unskilled labour; SL = skilled labourSource: Employment Satellite Matrix (data from Labour Force Survey 2005-06)
Sectors Number % Share in Total % Share in Total
(UL+SL) UL SL UL SL Cereal Crop sectors 13165730 9270 29.91 0.28 27.83 Commercial crops 3239420 1580 7.36 0.05 6.85 Livestock Rearing 2077557 356443 4.72 10.70 5.14 Poultry Rearing 1562291 238709 3.55 7.17 3.80 Fishing 943285 151715 2.14 4.56 2.31 Forestry 423142 76858 0.96 2.31 1.06 Agriculture 21411425 834575 48.65 25.06 46.99 Rice Milling 248550 450 0.56 0.01 0.53 Grain Milling 10590 3910 0.02 0.12 0.03 Food Process 245770 21130 0.56 0.63 0.56 Leather Industry 91960 7040 0.21 0.21 0.21 Jute and Yarn 183590 17410 0.42 0.52 0.42 Cloth milling 650190 23810 1.48 0.72 1.42 Woven RMG 1008370 103630 2.29 3.11 2.35 Knitting 93170 4830 0.21 0.15 0.21 Toiletries 14990 2010 0.03 0.06 0.04 Cigarette Industry 121660 7340 0.28 0.22 0.27 Furniture Industry 946720 19280 2.15 0.58 2.04 Paper, printing and publishing Industry 89640 28360 0.20 0.85 0.25 Pharmaceuticals 54700 9300 0.12 0.28 0.14 Fertilizer Industry 38540 10460 0.09 0.31 0.10 Petroleum 7460 2540 0.02 0.08 0.02 Chemical Industry 113060 13940 0.26 0.42 0.27 Glass Industry 5700 2800 0.01 0.08 0.02 Earth-ware and clay industry 243920 3000 0.55 0.09 0.52 Cement 37100 2900 0.08 0.09 0.08 Metal 190540 29460 0.43 0.88 0.46 Miscellaneous Industry 493290 61710 1.12 1.85 1.17 Mining and Quarrying 2700 500 0.01 0.02 0.01 Industry 4892210 375810 11.12 11.29 11.13 Construction 1453000 71000 3.30 2.13 3.22 Electricity and Water Generation 48510 11490 0.11 0.35 0.13 Gas Extraction and Distribution 4770 3230 0.01 0.10 0.02 Wholesale and retail trade 7035780 72220 15.99 2.17 15.01 Transport 3316660 29540 7.54 0.89 7.07 Health Service 61920 272080 0.14 8.17 0.71 Education Service 247020 1058980 0.56 31.80 2.76 Public Administration and Defence 784890 96110 1.78 2.89 1.86 Bank Insurance and Real estate 291529 216471 0.66 6.50 1.07 Hotel and Restaurant 695680 16320 1.58 0.49 1.50 Communication 136380 1620 0.31 0.05 0.29 Information Technology and E-Commerce 4250 4750 0.01 0.14 0.02 Other Services 3626440 265560 8.24 7.98 8.22 Services 17706829 2119371 40.23 63.65 41.88 Total 44010464 3329756 100.00 100.00 100.00

9
4 . RESULTS FROM THE QUANTITATIVE ANALYSIS
4.1. Changes in Net ExportsIn the WITS/SMART model, three FTA scenarios are run which assume full elimination of bilateral tariffs on goods between Bangladesh and India (under the Bangladesh-India bilateral FTA), full elimination of bilateral tariffs on goods between Bangladesh and Malaysia (under the Bangladesh-Malaysia bilateral FTA), and full elimination of tariffs on goods among the BIMSTEC member countries (under BIMSTEC). The resultant changes in net exports are reported in Table 3. The percentage changes in sectoral net exports appear to be most prominent under BIMSTEC and the least impact is observed under the Bangladesh-Malaysia FTA. The reason behind minimal impact under the Bangladesh-Malaysia FTA is that Bangladesh’s base trade (both exports and imports) with Malaysia is much lower than its trade with India or the BIMSTEC region. Therefore, based on the pattern of existing trade, though an FTA with Malaysia will increase Bangladesh’s trade with Malaysia significantly, it is unlikely to increase Bangladesh’s total trade by a large margin. The WITS/SMART model predicts that Bangladesh’s net exports under this FTA deal would decline by 0.03 per cent. This suggests that though the imports from Malaysia would rise more than the exports to Malaysia, net exports would decline only by a small margin. Under the Bangladesh-India FTA, there is a small positive impact on the net exports, indicating that under this scenario, the rise in exports to India would be higher than the rise in imports from India. Under BIMSTEC, there would be the largest impact on net exports among all three scenarios and the impact would be negative, suggesting that the rise in imports from the BIMSTEC region would be larger than the rise in exports to the BIMSTEC region. However, the relatively small impact on net exports of all three FTA scenarios is because India, Malaysia, and BIMSTEC partners are not major export destinations of Bangladesh. Another important observation is that under all of these scenarios there is very little impact on the net exports of Bangladesh’s major export item, namely woven and knit RMG, since more than 90 per cent of the exports of these two items are destined for the European Union (EU) and North America.

10
Table 3: Per cent Changes in Net Exports from Base from the WITS/SMART Simulations
Source: Calculated from WITS/SMART simulation
Sectors Bangladesh-
India FTA Bangladesh- Malaysia FTA BIMSTEC
Cereal Crop sectors -453045.90 -4.91 -453131.65 Commercial crops -4.08 -0.03 -4.95 Livestock Rearing 0.00 -3.05 -0.02 Poultry Rearing -631.41 -1725.13 -1164.49 Fishing 14.30 0.00 14.38 Forestry 0.00 0.00 0.00 Rice Milling -59.40 0.00 -74.27 Grain Milling 0.11 -0.06 0.08 Food Process 108.99 -26.27 113.82 Leather Industry 2.61 0.00 2.58 Jute and Yarn 3.00 0.72 2.14 Cloth milling -7832.69 -850.44 -12880.20 Woven RMG -0.03 0.05 -0.05 Knitting 0.01 0.02 0.01 Toiletries -4.67 -3.60 -44.69 Cigarette Industry 3.51 0.00 3.51 Furniture Industry -43.40 -1.61 -52.55 Paper, printing and publishing Industry -87.58 -6.78 1.46 Pharmaceuticals 1.74 -0.09 1.62 Fertilizer Industry 33.90 0.00 33.90 Petroleum -84.52 -1.62 -84.53 Chemical Industry -9.14 -10.98 -25.75 Glass Industry 60.49 8.23 1.28 Earth-ware and clay industry -326.70 -25.00 -395.65 Cement 278.31 -65.72 234.05 Metal -0.53 10.57 -0.95 Miscellaneous Industry -8.30 0.48 -12.20 Total 0.08 -0.03 -0.33

11
4.2. Changes in ‘Implicit Tariff Rates”The WITS/SMART simulations also provide results for changes in import and import revenues based on which it is possible to calculate the changes in implicit tariff rates. As expected, the BIMSTEC scenario would result in the largest reduction in overall tariff rates; under this scenario, the overall tariff rate is reduced by 39.5 per cent (Table 4). Under the Bangladesh-India FTA scenario, the overall tariff rate is reduced by 33.6 per cent. However, under the Bangladesh-Malaysia FTA scenario, the overall tariff rate is reduced only by 28.6 per cent.
Table 4: Per cent Change in “Implicit Tariff Rates” from Base
Source: Calculated from WITS/SMART simulation
4.3. Macroeconomic ResultsThe macroeconomic impacts of the three FTA scenarios are reported in Table 5 – the consumer price index would fall, both exports and imports would rise, and wage rates of unskilled and skilled labour would fall under all three scenarios. However, the largest impacts are observed under the BIMSTEC scenario while the lowest impacts are witnessed under the Bangladesh-Malaysia FTA scenario. The impacts of the Bangladesh-India FTA scenario are closer to those of the BIMSTEC scenario. Since the fall in the consumer price index is higher than the falls in the wage rates, real wages would rise.
Sectors Bangladesh-
India FTA Bangladesh- Malaysia FTA BIMSTEC
Cereal Crop sectors -59.20 -26.27 -59.22 Commercial crops -61.46 -40.58 -62.56 Livestock Rearing -80.94 -96.91 -81.05 Poultry Rearing -27.32 -29.10 -28.08 Fishing -37.69 -26.27 -47.93 Rice Milling -90.68 -26.27 -99.73 Grain Milling -26.28 -26.37 -26.44 Food Process -30.93 -37.80 -33.46 Leather Industry -36.89 -26.38 -42.31 Jute and Yarn -53.57 -29.42 -57.79 Cloth milling -33.99 -25.28 -37.38 Woven RMG -30.21 -26.52 -32.36 Knit RMG -36.25 -26.34 -36.78 Toiletries -49.42 -27.25 -58.90 Cigarette Industry -38.44 -26.28 -38.44 Furniture Industry -60.00 -35.08 -71.86 Paper, printing and publishing Industry -42.35 -27.33 -45.54 Pharmaceuticals -33.29 -26.83 -34.55 Fertilizer Industry -26.42 -26.27 -26.42 Petroleum -34.24 -24.23 -34.25 Chemical Industry -21.03 -32.59 -22.14 Glass Industry -37.26 -28.83 -38.00 Earth-ware and clay industry -34.98 -29.51 -59.63 Cement -49.74 -34.57 -72.03 Metal -44.62 -28.35 -46.51 Miscellaneous Industry -37.82 -28.23 -40.10

12
It is interesting to observe that although the WITS/SMART model predicts an initial 0.85 per cent rise in exports under the Bangladesh-India FTA scenario (see Table 3) because of increased market access in India, the CGE model foresees a much larger consequent rise in exports (7.03 per cent). This additional rise in exports comes from own trade liberalisation, as a result of which the export sectors can enjoy access to raw materials at cheaper prices. The Bangladesh-Malaysia FTA and BIMSTEC scenario also generate a much larger rise in exports under the CGE framework than the initial predictions of the WITS/SMART model.
The FTAs also lead to a rise in imports because of own trade liberalisation. Under BIMSTEC, since Bangladesh would have to liberalise its imports with respect to a number of countries of South Asia and South-east Asia, the rise in imports under this scenario would be larger than those under the other two bilateral FTA scenarios.
Table 5: Impacts on Macroeconomic Variables (Per cent change from base)
Source: CGE Simulations
4.4. Sectoral ResultsThe sectoral impacts of the CGE simulations of the three FTA scenarios are reported in Table 6. Under all three scenarios domestic production would fall but by a small margin. This is a result of the rise in imports which replaces domestic production. Under the Bangladesh-India FTA and BIMSTEC, production in the aggregate agricultural and aggregate industrial sectors would rise and that of aggregate services sector would fall. However, under the Bangladesh-Malaysia FTA scenario, production in both the aggregate agricultural and aggregate services sectors would fall and that of the aggregate industrial sector would rise. There are significant differences among the sectors in terms of changes in production. In the case of agricultural sectors, under all three scenarios, there is a reduction in the production in the forestry sector. Although the Bangladesh-Malaysia FTA would lead to a small rise in production of cereal crops, the other two scenarios would result in a reduction in this sector’s production in by small a margin. In the case of industrial sectors, all three scenarios predict robust rises in production and exports of woven and knit RMGs. Other sectors, such as jute and yarn and fertiliser industry would experience notable rises in production under the Bangladesh-India FTA and BIMSTEC. The furniture industry would experience a rise in production only under the Bangladesh-Malaysia FTA scenario and its production would fall under the other two scenarios. Major sectors, which will experience falls in production because of increased imports, under all three scenarios, are toiletries, paper-printing and publishing, chemical, glass, earth-ware, cement, metal, and miscellaneous industries. In the case of services sectors, production in construction, communication, and other services would fall and the remaining services sectors would rise. The magnitudes of the impacts are, in general, most pronounced under the BIMSTEC scenario and least pronounced under the Bangladesh-Malaysia FTA scenario.
Bangladesh- India FTA
Bangladesh- Malaysia FTA
BIMSTEC
Consumer Price Index -1.96 -1.33 -2.04 Total Export 7.03 4.41 7.41 Total Import 3.50 2.05 3.68 Wage rate of unskilled labour -1.05 -0.75 -1.10 Wage rate of skilled labour -0.44 -0.39 -0.47

13
Table 6: Impacts on Sectoral Production, Export and Import (Per cent change from base)
Note: O = production, E = export, M = importSource: CGE simulation
The impacts on sectoral value-added by unskilled labour, skilled labour, and composite capital are reported in Table 7. These impacts are, in general, in line with the impacts on sectoral production as reported in Table 6.
Sectors Bangladesh-India FTA Bangladesh-Malaysia FTA BIMSTEC O E M O E M O E M
Cereal Crop sectors -0.14 1.42 6.39 0.05 1.10 2.15 -0.14 1.47 6.28 Commercial crops 0.42 2.34 5.95 0.10 1.19 3.52 0.44 2.24 6.02 Livestock Rearing 0.39 2.15 10.89 0.17 1.47 14.67 0.39 2.24 10.75 Poultry Rearing 0.47 2.74 5.60 0.24 1.70 7.58 0.48 2.84 5.73 Fishing 1.59 7.22 23.80 0.40 1.71 15.79 1.61 7.38 32.76 Forestry -2.72
-1.63 -2.85
Agriculture 0.18 6.34 6.10 -0.02 1.62 3.25 0.18 6.46 6.16 Rice Milling 0.27 1.92 11.57 0.18 1.31 2.04 0.26 1.98 13.02 Grain Milling 0.40 2.07 11.12 0.21 1.36 12.00 0.41 2.14 11.09 Food Process 0.22 28.01 4.04 -1.22 0.98 6.15 0.10 27.43 4.48 Leather Industry 1.80 4.39 6.04 0.91 2.26 4.27 1.80 4.52 7.33 Jute and Yarn 8.35 10.29 5.85 3.70 4.57 3.60 8.06 10.10 6.19 Cloth milling -0.09 3.20 14.93 -0.30 119.28 10.88 -0.27 3.56 16.64 RMG 7.15 7.68 2.57 4.86 5.29 2.47 7.61 8.18 2.78 Knitting 7.89 8.33 -5.43 5.04 5.32 -3.58 8.32 8.79 -5.75 Toiletries -10.06 15.03 8.81 -6.08 -1.18 4.55 -13.13 12.58 11.00 Cigarette Industry 0.42 4.57 21.36 0.23 1.91 13.82 0.47 4.72 21.16 Furniture Industry -2.24 2.41 9.14 0.65 5.37 4.60 -3.08 2.27 11.54 Paper, printing and publishing Industry -7.60 -0.79 4.69 -4.79 -1.24 2.90 -8.25 -1.02 5.06 Pharmaceuticals 1.56 4.99 -2.25 1.12 3.16 -1.69 1.61 5.31 -2.33 Fertilizer Industry 12.43 20.32 -0.92 1.21 2.15 -0.01 12.61 20.54 -0.94 Petroleum -0.86 4.26 1.52 -0.69 2.84 1.01 -0.80 4.34 1.51 Chemical Industry -5.07 4.91 0.07 -5.37 -1.84 0.35 -5.26 4.79 0.01 Glass Industry -2.76 3.15 8.24 -2.17 2.97 7.46 -3.06 3.00 9.21 Earth-ware and clay industry -3.09 16.11 3.62 -1.71 0.17 0.71 -3.18 15.73 3.44 Cement -7.32 52.97 1.18 -4.79 -2.13 1.50 -8.17 50.46 6.00 Metal -7.05 0.23 4.15 -3.90 1.90 1.68 -7.24 0.23 4.09 Miscellaneous Industry -7.43 -2.82 5.16 -3.35 -0.50 1.73 -7.50 -2.63 5.14 Mining and Quarrying -4.88 -1.79 19.05 -2.92 -0.85 6.33 -5.06 -1.85 19.84 Industry 0.57 7.47 4.16 0.34 4.83 2.50 0.58 7.88 4.39 Construction -5.14 17.12 4.87 -3.18 18.14 7.71 -5.35 17.07 8.42 Electricity and Water Generation 0.61 3.16 0.46 0.33 2.11 1.30 0.62 3.25 0.54 Gas Extraction and Distribution 0.40
0.26 0.41
Wholesale and retail trade 0.45
0.21 0.45 Transport 0.81 2.45 -2.45 0.52 1.70 -1.79 0.84 2.55 -2.54 Health Service 0.52
0.33 0.54
Education Service 0.66
0.45 0.69 Public Administration and Defence 1.45 2.43 -1.57 1.06 1.78 -1.15 1.52 2.56 -1.64 Bank Insurance and Real estate -0.41 1.04 -2.74 -0.24 0.81 -1.98 -0.43 1.09 -2.87 Hotel and Restaurant 0.59
0.39 0.61
Communication -0.19 1.38 -2.91 -0.05 1.07 -2.04 -0.21 1.44 -3.05 Information Technology and ECom 1.19 2.40 -2.59 0.85 1.71 -1.87 1.25 2.52 -2.71 Other Services -0.04 1.74 -3.07 -0.02 1.23 -2.18 -0.04 1.83 -3.23 Services -0.77 2.40 -2.10 -0.47 1.78 -1.38 -0.80 2.51 -2.09 Total -0.12 7.04 3.50 -0.10 4.41 2.05 -0.13 7.41 3.68

14
Table 7: Impacts on Sectoral Value-added by Unskilled labour, Skilled Labour and Composite Capital (Per cent change from base)
Note: VUL = value-added by unskilled labour, VSL = value-added by skilled labour and VK= value added by composite capitalSource: CGE simulation
4.5. Employment Effects The CGE simulation results are linked to the employment satellite matrix and the resulting employment effects are reported in Table 8.
Sectors Bangladesh-
India FTA Bangladesh- Malaysia FTA
BIMSTEC
VUL VSL VK VUL VSL VK VUL VSL VK Cereal Crop sectors 0.08 -0.41 -0.27 0.18 -0.11 -0.04 0.09 -0.42 -0.04 Commercial crops 0.68 0.19 0.33 0.26 -0.03 0.04 0.71 0.20 0.04 Livestock Rearing 0.20 -0.28 0.54 0.04 -0.25 0.28 0.20 -0.31 0.28 Poultry Rearing 0.27 -0.22 0.60 0.09 -0.20 0.33 0.27 -0.23 0.33 Fishing 1.43 0.94 1.95 0.29 0.00 0.64 1.45 0.93 0.64 Forestry -2.99 -3.46 -2.65 -1.82 -2.11 -1.59 -3.13 -3.62 -1.59 Agriculture 0.29 0.18 0.17 0.14 -0.10 -0.01 0.30 0.18 -0.01 Rice Milling 0.16 -0.33 0.58 0.10 -0.19 0.38 0.14 -0.37 0.38 Grain Milling 0.32 -0.17 0.78 0.15 -0.15 0.46 0.32 -0.19 0.46 Food Process 0.10 -0.39 0.56 -1.31 -1.60 -1.00 -0.03 -0.53 -1.00 Leather Industry 1.70 1.20 2.11 0.83 0.54 1.11 1.69 1.17 1.11 Jute and Yarn 8.48 7.95 8.97 3.77 3.46 4.08 8.20 7.65 4.08 Cloth milling -0.06 -0.54 0.40 -0.28 -0.58 0.02 -0.23 -0.74 0.02 RMG 7.11 6.59 7.59 4.82 4.51 5.14 7.57 7.02 5.14 Knitting 7.85 7.33 8.35 5.00 4.69 5.33 8.29 7.74 5.33 Toiletries -10.27 -10.71 -9.83 -6.23 -6.51 -5.92 -13.35 -13.79 -5.92 Cigarette Industry 0.20 -0.29 0.68 0.07 -0.22 0.39 0.23 -0.28 0.39 Furniture Industry -2.43 -2.90 -1.97 0.52 0.23 0.83 -3.27 -3.76 0.83 Paper, printing and publishing Industry -7.75 -8.20 -7.32 -4.89 -5.17 -4.60 -8.41 -8.87 -4.60 Pharmaceuticals 1.33 0.84 1.81 0.96 0.66 1.28 1.37 0.86 1.28 Fertilizer Industry 12.08 11.54 12.60 0.99 0.69 1.30 12.24 11.68 1.30 Petroleum -1.46 -1.94 -0.80 -1.08 -1.37 -0.65 -1.43 -1.93 -0.65 Chemical Industry -5.28 -5.74 -4.84 -5.52 -5.80 -5.22 -5.48 -5.96 -5.22 Glass Industry -2.92 -3.39 -2.46 -2.28 -2.57 -1.97 -3.23 -3.72 -1.97 Earth-ware and clay industry -3.30 -3.77 -2.85 -1.86 -2.15 -1.55 -3.39 -3.88 -1.55 Cement -7.60 -8.05 -7.16 -4.98 -5.26 -4.68 -8.45 -8.92 -4.68 Metal -7.17 -7.62 -6.74 -3.99 -4.28 -3.70 -7.38 -7.85 -3.70 Miscellaneous Industry -7.52 -7.97 -7.09 -3.43 -3.71 -3.13 -7.60 -8.07 -3.13 Mining and Quarrying -5.22 -5.68 -4.64 -3.15 -3.44 -2.77 -5.42 -5.90 -2.77 Industry 1.75 0.99 0.58 1.18 0.72 0.47 1.84 1.06 0.47 Construction -5.29 -5.75 -4.92 -3.28 -3.56 -3.03 -5.50 -5.98 -3.03 Electricity and Water Generation 0.17 -0.32 0.77 0.03 -0.26 0.43 0.15 -0.36 0.43 Gas Extraction and Distribution -0.07 -0.56 0.53 -0.05 -0.35 0.34 -0.08 -0.59 0.34 Wholesale and retail trade 0.48 -0.01 1.03 0.22 -0.07 0.59 0.49 -0.02 0.59 Transport 0.71 0.22 1.14 0.45 0.15 0.74 0.73 0.22 0.74 Health Service 0.42 -0.07 1.08 0.26 -0.04 0.68 0.44 -0.07 0.68 Education Service 0.94 0.45 1.60 0.62 0.32 1.04 0.98 0.47 1.04 Public Administration and Defence 1.69 1.20 2.34 1.20 0.90 1.62 1.77 1.26 1.62 Bank Insurance and Real estate -0.39 -0.88 0.24 -0.24 -0.53 0.17 -0.41 -0.91 0.17 Hotel and Restaurant 0.57 0.08 1.05 0.36 0.07 0.68 0.59 0.08 0.68 Communication -0.29 -0.78 0.30 -0.12 -0.42 0.27 -0.32 -0.82 0.27 Information Technology and ECom 1.09 0.60 1.69 0.77 0.48 1.16 1.14 0.63 1.16 Other Services -0.16 -0.65 0.18 -0.11 -0.40 0.13 -0.17 -0.68 0.13 Services -0.66 -0.27 -0.24 -0.42 -0.16 -0.14 -0.69 -0.29 -0.14

15
Table 8: Employments effects of CGE Simulation
Note: UL = unskilled labour, SL = skilled labourSource: Employment Satellite Matrix
Table 8 suggests that total employment of unskilled and skilled labour would rise under all three scenarios. The largest impact on total employment would be under the BIMSTEC scenario, where there would be additional employment of 520,503 unskilled and 8,514 skilled labourers, which means, under this scenario, the employment of unskilled and skilled labour would rise by 1.18 per cent and 0.26 per cent, respectively, over their base numbers. The major rise in employment
Sectors
Bangladesh- India FTA
Bangladesh- Malaysia FTA
BIMSTEC
Change in no. of employment
% change in no. of employment
Change in no. of employment
% change in no. of employment
Change in no. of employment
% change in no. of employment
UL SL UL SL UL SL UL SL UL SL UL SL Cereal Crop sectors 149993 3 1.14 0.03 124015 26 0.94 0.28 158404 5 1.20 0.05 Commercial crops 56687 10 1.75 0.64 33217 6 1.03 0.36 59404 11 1.83 0.68 Livestock Rearing 26334 572 1.27 0.16 16622 483 0.80 0.14 27301 582 1.31 0.16 Poultry Rearing 20852 542 1.33 0.23 13369 455 0.86 0.19 21704 567 1.39 0.24 Fishing 23637 2102 2.51 1.39 9960 591 1.06 0.39 24301 2141 2.58 1.41 Forestry -8281 -2328 -1.96 -3.03 -4547 -1327 -1.07 -1.73 -8682 -2432 -2.05 -3.16 Agriculture 269221 901 1.26 0.11 192636 234 0.90 0.03 282431 873 1.32 0.10 Rice Milling 3028 1 1.22 0.11 2140 1 0.86 0.20 3117 0 1.25 0.10 Grain Milling 147 11 1.39 0.28 96 10 0.91 0.25 152 11 1.44 0.28 Food Process 2849 11 1.16 0.05 -1377 -257 -0.56 -1.22 2669 -13 1.09 -0.06 Leather Industry 2554 116 2.78 1.65 1471 65 1.60 0.93 2593 116 2.82 1.65 Jute and Yarn 17685 1468 9.63 8.43 8369 674 4.56 3.87 17269 1421 9.41 8.16 Cloth milling 6529 -24 1.00 -0.10 3084 -45 0.47 -0.19 5710 -64 0.88 -0.27 RMG 83147 7319 8.25 7.06 56657 5101 5.62 4.92 88352 7800 8.76 7.53 Knitting 8382 377 9.00 7.81 5405 247 5.80 5.10 8843 398 9.49 8.25 Toiletries -1397 -207 -9.32 -10.31 -828 -123 -5.52 -6.14 -1856 -269 -12.38 -13.38 Cigarette Industry 1532 11 1.26 0.15 1012 12 0.83 0.17 1630 14 1.34 0.19 Furniture Industry -13158 -476 -1.39 -2.47 12164 119 1.28 0.62 -20760 -637 -2.19 -3.30 Paper, printing & publishing -6068 -2209 -6.77 -7.79 -3736 -1361 -4.17 -4.80 -6622 -2393 -7.39 -8.44 Pharmaceuticals 1317 120 2.41 1.29 945 98 1.73 1.06 1366 124 2.50 1.33 Fertilizer Industry 5115 1259 13.27 12.03 677 114 1.76 1.09 5200 1276 13.49 12.20 Petroleum -31 -38 -0.41 -1.50 -24 -25 -0.33 -0.98 -25 -37 -0.33 -1.47 Chemical Industry -4837 -742 -4.28 -5.32 -5429 -757 -4.80 -5.43 -5012 -769 -4.43 -5.52 Glass Industry -108 -83 -1.89 -2.96 -88 -61 -1.54 -2.19 -123 -91 -2.15 -3.26 Earth-ware and clay industry -5538 -100 -2.27 -3.34 -2708 -53 -1.11 -1.76 -5658 -103 -2.32 -3.43 Cement -2455 -221 -6.62 -7.64 -1579 -142 -4.26 -4.89 -2758 -246 -7.43 -8.48 Metal -11788 -2125 -6.19 -7.21 -6218 -1149 -3.26 -3.90 -12093 -2183 -6.35 -7.41 Miscellaneous Industry -32255 -4666 -6.54 -7.56 -13284 -2058 -2.69 -3.33 -32419 -4711 -6.57 -7.63 Mining and Quarrying -114 -26 -4.21 -5.26 -65 -15 -2.42 -3.06 -118 -27 -4.37 -5.46 Industry 54537 -224 1.11 -0.06 56685 394 1.16 0.10 49458 -383 1.01 -0.10 Construction -62209 -3783 -4.28 -5.33 -36978 -2263 -2.54 -3.19 -64693 -3932 -4.45 -5.54 Electricity and Water 596 14 1.23 0.12 386 15 0.79 0.13 614 13 1.27 0.11 Gas Extraction & Distribution 47 -4 0.99 -0.12 34 1 0.71 0.04 49 -4 1.03 -0.12 Wholesale and retail trade 108901 316 1.55 0.44 69294 230 0.98 0.32 113162 328 1.61 0.45 Transport 58867 196 1.77 0.66 40151 161 1.21 0.54 61330 204 1.85 0.69 Health Service 922 1034 1.49 0.38 632 966 1.02 0.36 962 1088 1.55 0.40 Education Service 4970 9498 2.01 0.90 3423 7598 1.39 0.72 5205 10033 2.11 0.95 Public Administration & Def. 21759 1585 2.77 1.65 15471 1248 1.97 1.30 22805 1669 2.91 1.74 Bank Insurance and Real est. 1941 -941 0.67 -0.43 1508 -314 0.52 -0.15 2039 -962 0.70 -0.44 Hotel and Restaurant 11414 86 1.64 0.53 7844 75 1.13 0.46 11904 91 1.71 0.56 Communication 1045 -5 0.77 -0.34 868 0 0.64 -0.03 1082 -6 0.79 -0.35 IT and ECom 92 50 2.17 1.05 65 41 1.54 0.87 96 53 2.27 1.11 Other Services 32619 -541 0.90 -0.20 23645 -31 0.65 -0.01 34059 -551 0.94 -0.21 Service 180963 7506 1.02 0.35 126341 7727 0.71 0.36 188614 8024 1.07 0.38 Total 504721 8182 1.15 0.25 375663 8355 0.85 0.26 520503 8514 1.18 0.26

16
would come from the agriculture and services sectors. The impact on employment under the Bangladesh-India FTA scenario would be similar but relatively smaller in magnitude compared to that under the BIMSTEC scenario. The Bangladesh-Malaysia FTA would generate the lowest impact on employment.
It is also interesting to observe that under all three simulations, the rises in employment of unskilled labour are much higher than those of skilled labour. The reason behind such an impact is that the fall in the wage-rate of unskilled labour would be larger than the fall in the wage-rate of skilled labour under all three scenarios. This would lead to some substitution of skilled labour by unskilled labour in the production sectors. This suggests that production would become more unskilled-labour-intensive because of these FTA scenarios.

17
5. STAKEHOLDERS' VIEWS: CHALLENGES OF THE FTAs
As part of this study, interviews were conducted with a number of stakeholders including officials at the Ministry of Commerce, Government of Bangladesh, businessmen from the private sector, and researchers. These interviews identified a number of challenges to be addressed while pursuing FTAs. The stakeholders suggested that to maximize Bangladesh's benefit, the proposals of bilateral FTAs with India and Malaysia and the FTA under BIMSTEC should, in the first place, take stock of the prevailing levels of preferences enjoyed by Bangladesh from the partner countries by way of regional and bilateral arrangements, so that these FTAs would indeed be a step forward in terms of meaningful benefits for Bangladesh. They suggested that these FTAs should provide further deepening of preferences which Bangladesh had already obtained.
The stakeholders were of the view that one of the most crucial areas where FTAs should concentrate was how best to address the barriers emerging out of non-tariff and para-tariff measures prevailing in these countries. Non-tariff barriers refer to the wide and heterogeneous range of policy interventions other than border tariffs that affect and distort the trade of goods, services and factors of production. These non-tariff barriers are in the form of standard requirement, testing requirement, post-shipment inspection requirement, sanitary and phyto-sanitary requirements, and so on.
The stakeholders identified the significance of the presence of the sensitive list in the FTAs. A sensitive list covers products which will be kept out of tariff liberalisation. All three FTA scenarios are likely to have important sensitive lists. Though currently, India holds a virtually zero sensitive list for the imports from least developed countries (LDCs), Bangladesh’s sensitive list in the SAFTA includes 1,254 products for non-LDCs and 1,249 products for LDCs.6 This suggests that India’s sensitive list would not restrict the potential of the rise in exports from Bangladesh to India under such an FTA as far as the current pattern of trade is concerned. No final negotiation has taken place with respect to the size of sensitive lists under the Bangladesh-Malaysia FTA and BIMSTEC, but it is clear that the existence of such sensitive lists would hold back much of the prospects of the rise in market access for Bangladesh’s products in its partner countries.
There are also concerns about the Rules of Origin (RoO). In order to have a meaningful market access in India, other BIMSTEC partners, and Malaysia, the RoO of the FTA agreements should be very liberal, simple, transparent, and remain the same for all products. Bangladesh, as a least developed country, will be unable to meet stringent RoO criteria. Therefore, in the FTA negotiation, Bangladesh should pursue a liberal and simplified RoO for its export products.
The stakeholders also emphasized some other issues. It was suggested that the FTAs should recognize that effective protection and enforcement of intellectual property rights encourage technological innovation, transfer of technology, and investment under the respective terms and obligations of the WTO Agreements. The FTAs should also affirm ILO core labour standards and recognize the importance of providing adequate and effective protection and enforcement of worker rights in accordance with each FTA partner’s obligations and domestic labour laws. The FTAs should affirm commitments made in the WTO's Doha Declaration that expansion of trade and investment and the promotion of sustainable development and protection of the environment can and must be mutually supportive. The stakeholders also highlighted that there was tremendous potential for developing regional and sub-regional energy resources in an integrated
6 These are at 6 digit HS code level.

18
manner and noted the efforts being made to strengthen regional cooperation in capacity development, technology transfer, and the trade in energy. Also, being increasingly aware of global warming, climate change, and environmental challenges facing the region, which mainly include a rising sea-level, deforestation, soil erosion, siltation, droughts, storms, cyclones, floods, glacier melting and resultant glacial lake outburst floods, and urban pollution, there is a need to intensify cooperation within an expanded regional environmental protection framework, to deal in particular with climate change issues. Finally, the critical importance of an efficient multi-modal transport system in the region for integration and for sustaining the region’s economic growth and competitiveness cannot be overemphasized. Regarding trade in services, the stakeholders were of the view that following progressive and sequential liberalization may best serve the country’s interests.

19
6. POLICY RECOMMENDATIONS AND CONCLUSION
The analysis of the macro impacts of the FTA scenarios suggest that such bilateral and regional FTAs would be beneficial for Bangladesh in terms of impact on consumer prices, exports, real wages and employment. At the sectoral level, a number of export-oriented sectors would gain from such FTAs. However, the sectoral level impacts also suggest that a large number of sectors would experience a fall in production because of a large inflow of imports, which will result in a loss in employment in these sectors. Therefore, these FTAs have important sectoral implications in terms of production, exports, imports, and employment. It however appears that, at the aggregate level, employment would rise, which would mean that the loss in employment in some sectors will be more than compensated by the rise in employment in other sectors. Therefore, the net effect on employment is likely to be positive. It should, however, be mentioned that there might be some important costs for such adjustments of employment at the sectoral level. In reality, such adjustment costs could be big. Therefore, policy makers should be aware of such adjustment costs and find ways to mitigate them. Measures like temporary and time-bound fiscal support and gradual and slower liberalisation in those sectors could be considered.
Under the proposed FTAs, sensitive lists should be shortened, with longer transition periods for Bangladesh. Also, if Bangladesh maintains a long sensitive list, there would be fewer prospects for the export sector to access cheaper imported raw materials. On the other hand, it is true that sensitive lists would also help some sectors to enjoy protection, and, therefore, there would be a lesser loss in production and employment after forming an FTA in those sectors. On the basis of this argument the case for maintaining a sensitive list in the FTA could be justified. However, it should be considered that prolonged protection may work against raising efficiency in the protected sectors, and as a result consumers are likely to suffer because of high prices. It is therefore imperative for policy makers to devise the sensitive list in such a way so that it remains a small list of products and it is time-bound.
It is important that the RoO should be simple, non-restrictive as far as practicable, and should be based on value-addition criteria. As an LDC, Bangladesh should enjoy a more relaxed RoO. The provision of additional 10 percentage points for Bangladesh (as an LDC) should be there in case of non-originating inputs, while the value-addition norm should be set at 25 per cent for Bangladesh and 35 per cent for the others with a derogation of 20 per cent value-addition for RMG and other such labour-intensive export products. An alternative strategy could be a relaxation of the SAFTA model. The SAFTA RoO provide for a single criterion for all products, barring 191 products for which product-specific rules are applied. In order to enjoy preferences under SAFTA, a product must undergo sufficient processing for changing its tariff heading for non-originating inputs and should have at least 40 per cent value-addition measured as a percentage of the FOB value. Value-addition requirements are lower for Sri Lanka and the LDCs i.e., 35 per cent and 30 per cent, respectively. Product Specific Rules (PSRs) apply to 191 products (at the 6-digit level). 189 products out of these 191 are subject to CTSH (change of tariff subheading) plus 30 per cent value-addition and the other 2 items (HS Codes 481820 and 481840) are subject to only CTH (change of tariff heading). In the case of proposed bilateral FTAs with India and Sri Lanka, and for BIMSTEC, Bangladesh may ask for CTSH plus 30 per cent value-addition for all products. As for theadministrative mechanism for the RoO, trade remedy measures, dispute settlement mechanism, and provisions of SAFTA may be adopted.

20
As has already been mentioned, there are problems of non-tariff barriers (NTBs) for Bangladesh’s export products as far as their market accesses in India, other BIMSTEC partners, and Malaysia are concerned. For Bangladesh, NTBs are crucial in the context of intensifying its trade with partner countries under the said FTA agreements. One of the main reasons of SAFTA not being able to enhance intra-regional trade at the desired level is the presence of NTBs as SAFTA is yet to address the NTB issues directly. The NTBs, which distort exports from Bangladesh to her neighbouring countries, mostly have to do with standards, testing, and certification procedures in food processing, textiles, and other such areas. Other major NTBs faced by Bangladeshi exporters include licensing, classification of goods, custom valuation, countervailing duties. Besides, the lack of trade facilitation is also acting as an NTB. Therefore, in order to make the Bangladesh-India bilateral FTA, the Bangladesh-Malaysia bilateral FTA, and BIMSTEC effective, the policy makers and negotiators of Bangladesh should negotiate hard with the partner countries with a view to minimising the presence of NTBs. To do away with the trade-impeding effects of NTBs, there should be mutual recognition agreements among respective organizations of Bangladesh and its trading partners. There is also a need for harmonization of TBT and SPS measures. It can further be argued that the accreditation bodies or agencies of partner countries may set up accreditation centres in Dhaka in collaboration with a designated National Agency of Bangladesh to facilitate mutual cooperation with necessary capacity building under technical and financial assistance. Non-acceptability of conformity assessment certificates of any particular product, if and when this issue arises, should be resolved by mutual cooperation programmes without restricting trade. It is also important to note that non-tariff measures (NTMs) and para-tariff measures (PTMs) not notified in WTO should be prohibited. To ensure a level playing field for a fair and competitive transaction of goods it is important that: (i) the value of imported products are assessed only on the basis of WTO Customs Valuation Agreement; (ii) the acceptance of certificates issued by the respective designated national institutions is ensured in all ports of entry; (iii) national treatment is accorded to all products in respect of registration, labelling, and testing requirements along with charges and fees thereof; and (iv) fees levied are only on the cost of services rendered and not be used for fiscal purposes or as protection for domestic products.
To do away with the trade-impeding effects of these measures, proposed FTAs should clearly provide for mutual recognition agreements among respective organizations. Precise mechanisms for the execution of such agreements may be sorted out during negotiations. In addition to the NTBs, there may be a host of bottlenecks at the functional level, which vary with respect to products and are often port-specific. For example, the longstanding problem of Bangladeshi trucks not being allowed to reach up to the Indian Customs shed at Petrapole, the lack of a warehousing facility for perishable goods at the major Indian land ports, etc. should figure prominently in discussions towards a permanent solution. Similarly, Bangladesh should also be prepared to remove trade-distorting barriers, if any.
It should also be mentioned that the current state of inland transportation and road infrastructure in Bangladesh is inefficient and corrupt. Inland transportation suffers from such problems as illegal toll collection, bad road communication, congestion at river-ports, and frequent disruption in transportation due to political programmes and labour unrest. Inefficient and corrupt ports and inland transportation increase the cost of production substantially. Under these circumstances, many Bangladesh exporters find it extremely difficult to compete in the global market. The state of

21
physical infrastructure is weak in Bangladesh. Poor infrastructure requires firms to devote more resources to such tasks as procuring inputs and getting their products to market. All this can undermine the competitiveness of exporting enterprises. There are two dimensions of poor infrastructure – one is the unavailability of a certain service or utility (such as telephone, water, electricity, roads and highways, etc.) and the other is the unreliability of the services provided. In Bangladesh there are problems on both fronts. Therefore, in order to reap the maximum benefit out of the bilateral and regional FTA agreements, there is a need to improve the supply side capacity of the Bangladesh economy, which will require significant improvement of the physical infrastructure, reduction in cost of doing business, rise in labour productivity, and improvement in economic governance.
The FTA Parties could establish a respective Joint Council on Trade. The Joint Council would be composed of representatives of both Parties. The Joint Council could meet at least once a year and at such times to be mutually agreed upon, for the purpose of overseeing the implementation of the Free Trade Agreements, reviewing the bilateral trade relationship, organising consultations on specific trade-related issues such as labour-market effects, and resolving amicably any issues that might arise from implementing the provisions of the FTA agreement. The Joint Council may establish ad hoc working groups, which could include a group to assess and address the impact of an FTA agreement on employment and other labour-market conditions.
Within the framework of an FTA agreement, it would be beneficial for the respective trade-related government agencies of Bangladesh to hold regular consultations with other government departments, including the Ministry of Labour and Employment, as well as the private sector, particularly employers’ and workers’ groups, on ways and means to enhance the benefits derived from trade. These consultations would help to identify problems in Bangladesh’s trade-related capacity in areas such as: (i) technical regulations and standards, (ii) product testing, quality management, accreditation and certification, (iii) customs procedures and administration of legislative and trade-policy measures such as anti-dumping, safeguards, SPS, TBT, etc., (iv) physical infrastructure such as an Inland Container Depot (ICD), Container Freight Station (CFS), (v) banking and insurance services and export financing mechanisms, (vi) product-specific research and development (R&D), particularly in the areas of fashion and design, finishing and packaging, etc., and (vii) export promotion. Addressing inadequacies in these areas would, in part, require important government interventions in worker training and human resources development.

23
REFERENCES
Alarcon, J.V. (2002), “Social Accounting Matrix-Based Modelling: Extension to Wellbeing and Environment and Computable General Equilibrium Models: Applications using the 1975 and 1980 Ecuador and Bolivian 1989 and 1997 SAMs”, Institute of Social Studies, The Hague, The Netherlands
ECA (2000), Economic Commission for Africa, “The Economic and Welfare Impacts of the EU-Africa Economic Partnership Agreements: The Analytical Methodology - the GTAP and SMART Models and related Databases,” 2000.
Hoekman, B. and Winters, L. A. (2005), "Trade and employment : stylized facts and research findings," Policy Research Working Paper Series 3676, The World Bank.
Jansen, M. and Lee, E. (2007), “Trade and employment: Challenges for Policy Research”. A joint ILO-WTO Study, Geneva, ILO/WTO.
Laird, S. and Yeats, A. (1986), “The UNCTAD Trade Policy Simulation Model: A Note on Methodology, Data and Uses,” UNCTAD Discussion Paper No. 19, Geneva, 1986.
Lee, E. (2005), “Trade Liberalization and Employment”, DESA Working Paper No. 5
Milner, C., Morrissey, O. and McKay, A. (2002), “Some Simple Analytics of the Trade and Welfare Effects of Economic Partnership Agreements: The Case of the EU-EAC”, mimeo, CREDIT, University of Nottingham.
Raihan, S. (2011), “Economic Corridors in South Asia: Exploring the Benefits of Market Access and Trade Facilitation”, Paper prepared for RIS, New Delhi under the Asian Development Bank RETA 6472

26
Annex 1: Description of the Models
A.1.1. The WITS/SMART ModelMilner et al. (2002) provides a simple analytical framework explaining the theory behind partial equilibrium. The World Integrated Trade Solution (WITS) brings together various databases ranging from bilateral trade, commodity trade flows and various levels and types of protection. WITS also integrate analytical tools that support simulation analysis. The SMART simulation model is one of the analytical tools in WITS for simulation purposes. SMART contains in-built analytical modules that support trade policy analysis such as effects of multilateral tariff cuts, preferential trade liberalization and ad hoc tariff changes. The underlying analytics of the theory are defined in Laird and Yeats (1986) and ECA (2000). The derivation begins with a basic trade model composed of simplified import demand and export supply functions and an equilibrating identity:
A simplified import demand function for country j from country k of commodity i:
(1)
The export supply function of commodity i of country k can be simplified as:
(2)
The equilibrium in the trade between the countries is the standard partial equilibrium equation:
(3)
In a free trade environment, the domestic price of the commodity i in country j from country k would change with the change in an ad valorem tariff as follows:
(4)
In order to get the price equation, differentiating (4) we obtain:
(5)
Equations (4) and (5) are substituted into the elasticity of import demand function:
(6)
Using this, one obtains the change in imports:
(7)
),,( ikijjijk PPYfM =
)( ikjijk PfX =
ikjijk XM =
)1( ikjikjijk tPP +=
ikjikjikjikjijk dPtdtPdP )1( ++=
)()( ijk
ijkmi
ijk
ijk
PP
MM ∆
=∆
α
+
+=
ijk
ijk
ijk
ijkmi
ijk
ijk
PdP
tdt
MdM
)1(α
26
In the similar process one can obtain, with the elasticity of export supply function, the change in exports:
WITS/ SMART has a very precise and elegant methodology for calculating revenue effects. The tariff revenue is the product of the tariff rate and the tariff base (value of imports). Thus, before the change in the ad valorem incidence of trade barriers, the revenue is given as:
(8)
After the change in tariff rate, the new revenue collection will be given by:
(9)
The revenue loss as a result of the implementation of any RTA is the difference between and oo.
A.1.2. The CGE ModelThe Bangladesh CGE model is built using the PEP standard static model. In the Bangladesh CGE model representative firm in each industry maximizes profits subject to its production technology. The sectoral output follows a Leontief production function. Each industry’s value added consists of composite labour and composite capital, following a constant elasticity of substitution (CES) specification. Different categories of labour are combined following a CES technology with imperfect substitutability between different types of labour. Composite capital is a CES combination of the different categories of capital. It is assumed that intermediate inputs are perfectly complementary, and are combined following a Leontief production function.
Household incomes come from labour income, capital income, and transfers received from other agents. Subtracting direct taxes yields household’s disposable income. Household savings are a linear function of disposable income, which allows for the marginal propensity to save being different from the average propensity.
Corporation income consists of its share of capital income and of transfers received from other agents. Deducting business income taxes from total income yields the disposable income of each type of business. Likewise, business savings are the residual that remains after subtracting transfers to other agents from disposable income.
The government draws its income from household and business income taxes, taxes on products and on imports, and other taxes on production. Income taxes are described as a linear function of total income, whether it be for households or for businesses. The current government budget
)(
ikj
ikjxi
ijk
ijk
PdP
XdX
α=
∑∑=i k
ijk ijkijkMPtR 000
0
∑∑=i k
jkijk ijkMPtR 111
1
0R
1R

27
surplus or deficit (positive or negative savings) is the difference between its revenue and its expenditures. The latter consist of transfers to agents and current expenditures on goods and services.
The rest of the world receives payments for the value of imports, part of the income of capital, and transfers from domestic agents. Foreign spending in the domestic economy consists of the value of exports, and transfers to domestic agents. The difference between foreign receipts and spending is the amount of rest-of-the-world savings, which are equal in absolute value to the current account balance, but of opposite sign.
The demand for goods and services, whether domestically produced or imported, consists of household consumption demand, investment demand, demand by government, and demand as transport or trade margins. It is assumed that households have Stone-Geary utility functions (from which derives the Linear Expenditure System). Investment demand includes both gross fixed capital formation (GFCF) and changes in inventories. .
Producers’ supply behaviour is represented by nested constant elasticity of transformation (CET) functions: on the upper level, aggregate output is allocated to individual products; on the lower level, the supply of each product is distributed between the domestic market and exports. The model departs from the ‘pure’ form of the small-country hypothesis. A local producer can increase his share of the world market only by offering a price that is advantageous relative to the (exogenous) world price. The ease with which his share can be increased depends on the degree of substitutability of the proposed product to competing products; in other words, it depends on the price-elasticity of export demand. Commodities demanded on the domestic market are composite goods, combinations of locally produced goods and imports. The imperfect substitutability between the two is represented by a CES aggregator function. Naturally, for goods with no competition from imports, the demand for the composite commodity is the demand for the domestically produced good.
The system requires that there is equilibrium between the supply and demand of each commodity on the domestic market. Also there are equilibriums in the factor markets. Total investment expenditure must be equal to the sum of agents’ savings. The sum of supplies of every commodity by local producers must be equal to domestic demand for that commodity produced locally. And finally, supply to the export market of each good must be matched by demand.

29
Annex 2: Social Accounting Matrix of Bangladesh for the year 2007
The 2007 SAM identifies the economic relations through four types of accounts: (i) production activity and commodity accounts for 41 sectors; (ii) 4 factors of productions with 2 different types of labour and 2 types of capital; (iii) current account transactions between 4 main institutional agents; household-members and unincorporated capital, corporation, government and the rest of the world; and (iv) two consolidated capital accounts distinguished by public and private origins to capture the flows of savings and investment. The disaggregation of activities, commodities, factors and institutions in the 41-sector SAM is given in Table A2.
Table A2: Disaggregation and Description of Bangladesh SAM Accounts
Source: The Bangladesh SAM
Set Description of Elements Commodities (41) Agriculture (6) Cereal crop; commercial crop; Livestock Rearing; Poultry Rearing; Fishing; and
Forestry Manufacturing (22) Rice Milling; Grain Milling; Food products; Leather Industry; Jute and Yarn Industry;
Cloth Industry; Woven RMG; Knit RMG; Toiletries; Cigarette and Bidi Industry; Furniture Industry; Paper, Printing and Publishing industry; Pharmaceuticals; Fertiliser Industry; Petroleum; Chemical Industry; Glass Industry; Earth-ware Industry; Cement; Metal Industry; Miscellaneous Industry; Mining and Quarrying
Services (13) Construction; Electricity and Water Generation; Gas Extraction and Distribution; Wholesale and Retail Trade; Transport; Health Service; Education Service; Public Administration and Defence; Bank Insurance and Real estate; Hotel and Restaurant; Communication; Information Technology and E-Communication; and Other Services
Factors of Production (4) Labour (2) Labour Unskilled, and Labour Skilled Capital (2) Capital and Land Current Institutions (11) Households (7) Rural: landless, Agricultural marginal, Agricultural small, Agricultural large, Non-farm
Urban: Households with low educated heads, and households with high educated heads
Others (3) Government, Corporation and Rest of the World Capital Institution (1) Consolidated Capital Account

31
Annex 3: Mapping and Classification Scheme in the SAM
Source: The Bangladesh SAM
Activity-Commodity 41 Activity-Commodity 86 Cereal Crop sectors Paddy Cultivation, wheat Cultivation, Other Grain Cultivation Commercial crops Jute Cultivation, Sugarcane Cultivation, Potato Cultivation, Vegetable Cultivation,
Pulses Cultivation, Oilseed Cultivation, Fruit Cultivation, Cotton Cultivation, Tobacco Cultivation, Tea Cultivation, Spice Cultivation, Other Crop Cultivation
Livestock Rearing Livestock Rearing Poultry Rearing Poultry Rearing Fishing Shrimp Farming, Fishing Forestry Forestry Rice Milling Rice Milling Grain Milling Grain Milling Food Process Fish Process, Oil Industry, Sweetener Industry, Tea Product, Salt Refining, Food
Process Leather Industry Tanning and Finishing, Leather Industry Jute and Yarn Baling, Jute Fabrication, Yarn Industry Cloth milling Cloth Milling, Handloom Cloth, Dyeing and Bleaching RMG RMG Knitting Knitting Toiletries Toiletries Cigarette Industry Cigarette Industry, Bidi Industry Furniture Industry Saw and Plane, Furniture Industry Paper, printing & publishing Paper Industry, Printing and Publishing Pharmaceuticals Pharmaceuticals Fertilizer Industry Fertilizer Industry Petroleum Petroleum Chemical Industry Basic Chemical, Chemical Industry Glass Industry Glass Industry Earth-ware and clay industry Earthware Industry, Clay Industry Cement Cement Metal Basic Metal, Metal Manufacturers Miscellaneous Industry Machinery and Equipments, Transport Equipments, Miscellaneous Industry Construction Urban Building, Rural Building, Power Plant Building, Rural Road Building, Port
Road Railway Building, Canal Dyke Other Buildings Electricity and Water Electricity and Water Gas Extraction & Distribution Gas Extraction & Distribution Mining and Quarrying Mining and Quarrying Wholesale and retail trade Wholesale trade, retail trade Transport Air Transport, Water Transport, Land Transport, Railway Transport, Other
Transport Health Service Health Service Education Service Education Service Public Administration & Def. Public Administration & Def. Bank Insurance and Real est. Bank Insurance and Real est. Hotel and Restaurant Hotel and Restaurant Communication Communication IT and ECom IT and ECom Other Services Housing Service, Professional Service, Entertainment, Other Services
Project funded bythe European Union
Perspectives from Bangladesh EMPLOYMENT EFFECTS OF FTA AGREEMENTS


![Impacts of a possible FTA with Mercosur on EU farm income and agricultural employment [EU]](https://img.pdfslide.net/doc/110x75/5562f3afd8b42a38778b5882/impacts-of-a-possible-fta-with-mercosur-on-eu-farm-income-and-agricultural-employment-eu.jpg)

