Embed Size (px)
Citation preview

www.ecn.nl
Employment in renewables: a
literature review and case study
Presenter: Lachlan Cameron
Co-authors: Bob van der Zwaan and Tom Kober
Paris, IEW 2013 21 June 2013

Literature review

Summary
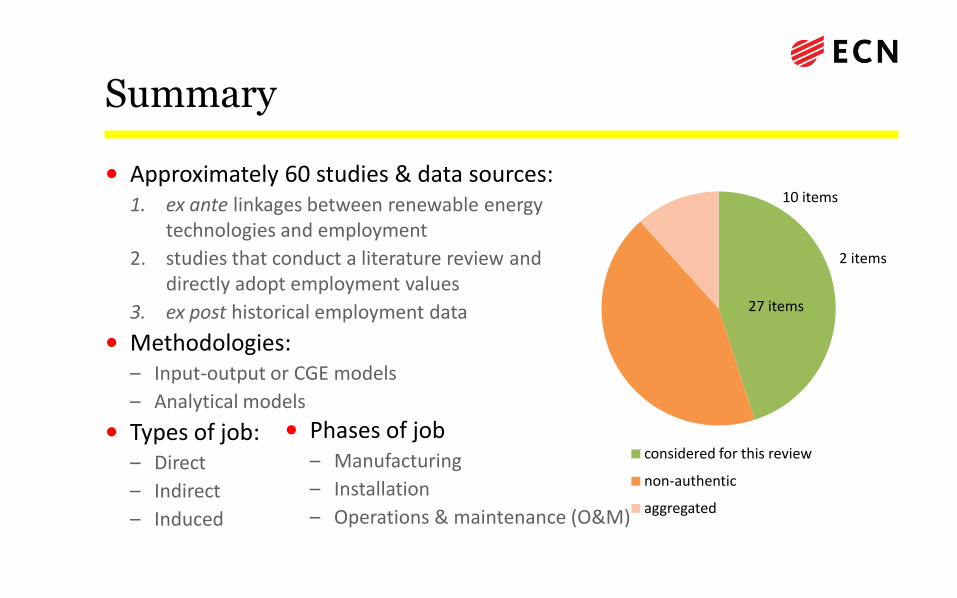
• Approximately 60 studies & data sources: 1. ex ante linkages between renewable energy
technologies and employment
2. studies that conduct a literature review and directly adopt employment values
3. ex post historical employment data 27 items
peer-reviewed
peer-reviewed lit. review
'grey' literature
2 items
10 items
Summary
• Approximately 60 studies & data sources: 1. ex ante linkages between renewable energy
technologies and employment
2. studies that conduct a literature review and directly adopt employment values
3. ex post historical employment data
• Methodologies: – Input-output or CGE models
– Analytical models
• Types of job: – Direct
– Indirect
– Induced
considered for this review
non-authentic
aggregated
27 items
• Phases of job – Manufacturing
– Installation
– Operations & maintenance (O&M)
2 items
10 items

Results: direct employment
factors
0
0.5
1
1.5
2
2.5
3
0
10
20
30
40
50
60
0.5 1.5 2.5
Emp
loym
en
t fa
cto
r [j
ob
s/M
W]
Emp
loym
en
t fa
cto
r [p
ers
on-
year
s/M
W]
Wind - manufacturing & installation Wind - operation & maintenance
PV - manufacturing & installation PV - operation & maintenance
CSP - manufacturing & installation CSP - operation & maintenance
Figure 1: Comparison of direct employment factors for manufacturing and installation (in person-years/MW, left half) and operation and maintenance (in jobs/MW, right half) for three renewable energy technologies across 27 publications
source: Cameron and van der Zwaan, 2013

Learning in employment?
Figure 2: Cumulative installed capacities for wind and PV in Germany (left axis) compared to the corresponding O&M employment factors in the German wind and PV industries (right axis)
0
0.1
0.2
0.3
0.4
0.5
0.6
0.7
0.8
0
5,000
10,000
15,000
20,000
25,000
30,000
35,000
40,000
2007 2008 2009 2010 2011
Emp
loym
ent
fact
or
[jo
bs/
MW
]
Cu
mu
lati
ve in
stal
led
cap
acit
y [M
W]
Germany
Wind - installed capacity Wind - O&M employment factor
PV - installed capacity PV - O&M employment factor
source: Cameron and van der Zwaan, 2013

Employment factors: normalised
Figure 3: Direct and indirect jobs per deployment phase (in jobs/MW) for different technologies based on minimum, median and maximum values for employment factors in the available literature.
0
1
2
3
4
5
6
7
8
9
min med Wind
max min med PV
max min med CSP
max
Emp
loym
en
t fa
cto
r [j
ob
s/M
W]
O&M - indirect
O&M - direct
Installation - indirect
Installation - direct
Manufacturing - indirect
Manufacturing - direct
source: Cameron and van der Zwaan, 2013

Case study: Middle East

Starting point – capacity results
Figure 4: Cumulative capacity for three renewable energy technologies until 2050 for the Middle East calculated with TIAM-ECN
source: van der Zwaan et al., 2013
0.0
50.0
100.0
150.0
200.0
250.0
2005 2010 2015 2020 2025 2030 2035 2040 2045 2050
cum
ula
tive
inst
alle
d c
apac
ity
[GW
]
Wind PV CSP
Estimating local content
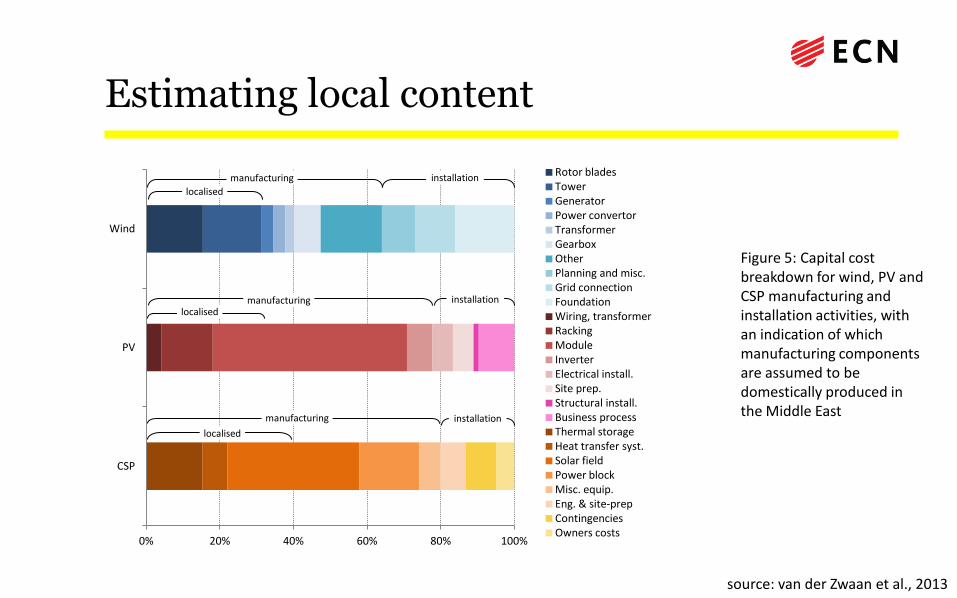
Figure 5: Capital cost breakdown for wind, PV and CSP manufacturing and installation activities, with an indication of which manufacturing components are assumed to be domestically produced in the Middle East
source: van der Zwaan et al., 2013
0% 20% 40% 60% 80% 100%
CSP
PV
Wind
Rotor blades Tower Generator Power convertor Transformer Gearbox Other Planning and misc. Grid connection Foundation Wiring, transformer Racking Module Inverter Electrical install. Site prep. Structural install. Business process Thermal storage Heat transfer syst. Solar field Power block Misc. equip. Eng. & site-prep Contingencies Owners costs
localised
manufacturing
localised manufacturing
localised
manufacturing installation
installation
installation

Results – uncertainty range
Figure 6: Direct employment until 2050 for our Middle East renewable electricity scenario, with uncertainty ranges, in two cases: (1) all manufacturing is performed locally (green) and (2) the local content is 49% for wind, 46% for PV and 50% for CSP (hatched grey).
source: van der Zwaan et al., 2013
-
50,000
100,000
150,000
200,000
250,000
300,000
350,000
400,000
450,000
2005 2010 2015 2020 2025 2030 2035 2040 2045 2050
emp
loym
ent
imp
act
[dir
ect
job
s]
Total jobs partly localised Total jobs fully localised

Results – median figures
-
2,000
4,000
6,000
8,000
10,000
12,000
14,000
16,000
18,000
20
05
20
10
20
15
20
20
20
25
20
30
20
35
20
40
20
45
20
50
emp
loym
ent
imp
act
[dir
ect
job
s]
-
10,000
20,000
30,000
40,000
50,000
60,000
70,000
80,000
90,000
100,000
20
05
20
10
20
15
20
20
20
25
20
30
20
35
20
40
20
45
20
50
emp
loym
ent
imp
act
[dir
ect
job
s]
-
10,000
20,000
30,000
40,000
50,000
60,000
70,000
80,000
90,000
100,000
20
05
20
10
20
15
20
20
20
25
20
30
20
35
20
40
20
45
20
50
emp
loym
ent
imp
act
[dir
ect
job
s]
-
20,000
40,000
60,000
80,000
100,000
120,000
140,000
160,000
180,000
200,000
20
05
20
10
20
15
20
20
20
25
20
30
20
35
20
40
20
45
20
50
emp
loym
ent
imp
act
[dir
ect
job
s]
Wind - manufacturing - remainder localised Wind - manufacturing - partly localised Wind - installation Wind - O&M
PV - manufacturing - remainder localised PV - manufacturing - partly localised PV - installation PV - O&M
CSP - manufacturing - remainder localised CSP - manufacturing - partly localised CSP - installation CSP - O&M
Total - manufacturing - remainder localised Total - manufacturing - partly localised Total - installation Total - O&M
Figure 7: Direct employment until 2050 for our Middle East renewable power scenario split by project phase and technology. Median employment factors are assumed and partly localised manufacturing of 49% for wind, 46% for PV and 50% for CSP
source: van der Zwaan et al., 2013

Results – total & with learning
source: van der Zwaan et al., 2013
0
50,000
100,000
150,000
200,000
250,000
300,000
350,000
2005 2010 2015 2020 2025 2030 2035 2040 2045 2050
Emp
loym
ent
imp
act
direct and indirect jobs
Total - O&M Total - installation Total - manufacturing - partly localised Total - manufacturing - remainder localised Total jobs - yearly employment factor reduction Total jobs - doubling employment factor reduction
Figure 8: Total direct and indirect employment until 2050 in our Middle East renewable power scenario split by project phase. Median employment factors and partly localised manufacturing.

Conclusions
• Limited original data, frequent recursive referencing;
• Wide range of reported employment factors;
• Limited comparison of renewables versus conventional generation;
• Focus on OECD countries in current literature
• In the Middle East, renewable energy is estimated to stimulate 155,000 to 180,000 direct jobs by 2050.
• A domestic manufacturing and installation industry creates as many jobs as O&M in 2050;
• Job creation can be an important co-benefit of renewable energy deployment, but is less convincing as a core argument

Thank you
References:
van der Zwaan, B., Cameron, L. and Kober, T., Potential for renewable energy jobs in the Middle East. Energy Policy (2013),
http://dx.doi.org/10.1016/j.enpol.2013.05.014
Cameron, L. and van der Zwaan, B., Employment in Renewables: a Literature Review. Renewable & Sustainable Energy
Review (2013), submitted
ECN Policy Studies
Radarweg 60
1043 NT Amsterdam
The Netherlands
T +31 88 515 42 27 [email protected]
F +31 88 515 44 80 www.ecn.nl