Embed Size (px)
Citation preview
EMT MET☤CRC
MET overexpression as a hallmark of the epithelial-mesenchymal transition
(EMT) phenotype in colorectal cancer
K. Raghav, W. Wang, G.C. Manyam, B.M. Broom, C. Eng,
M.J. Overman, S. KopetzThe University of Texas M D Anderson Cancer Center, Houston TX
Disclosures
• No relevant relationships to disclose.
Learning Objectives
• Recognize epithelial-mesenchymal transition
(EMT) as a principal molecular subtype in
colorectal cancers.
• Identify MET protein overexpression as a key
clinical biomarker of EMT physiology in
colorectal cancers.
Overview• Introduction
• Epithelial-mesenchymal transition (EMT)• Challenges & Research question• MET/HGF Axis
• Study• Objective• Methodology• Results• Conclusions
• Future
Overview• Introduction
• Epithelial-mesenchymal transition (EMT)• Challenges & Research question• MET/HGF Axis
• Study• Objective• Methodology• Results• Conclusions
• Future
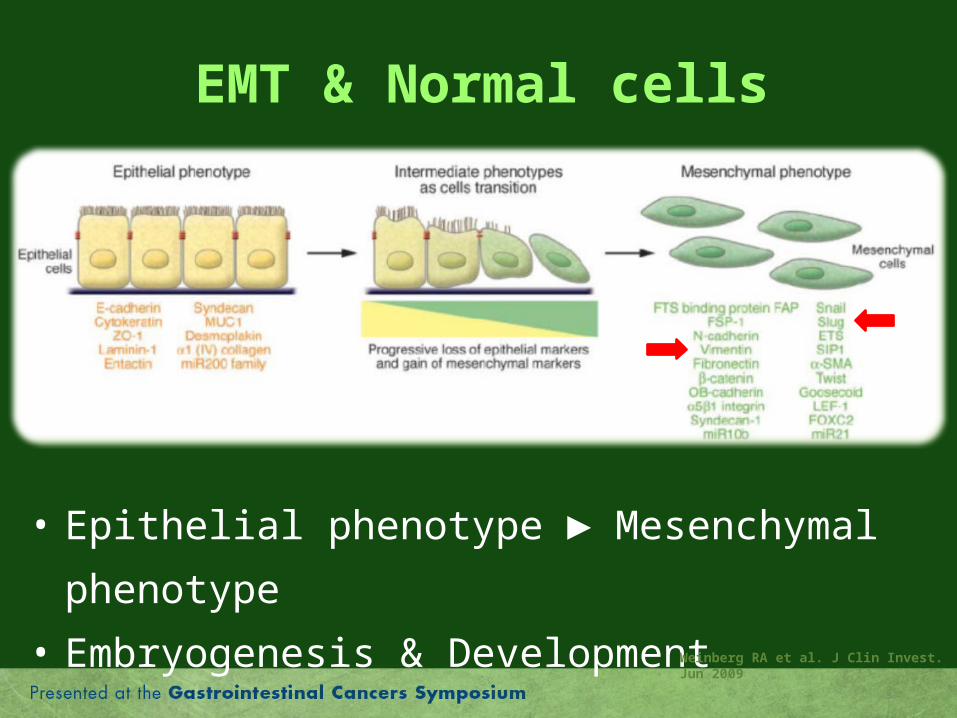
EMT & Normal cells
• Epithelial phenotype ► Mesenchymal
phenotype
• Embryogenesis & Development Weinberg RA et al. J Clin Invest. Jun 2009
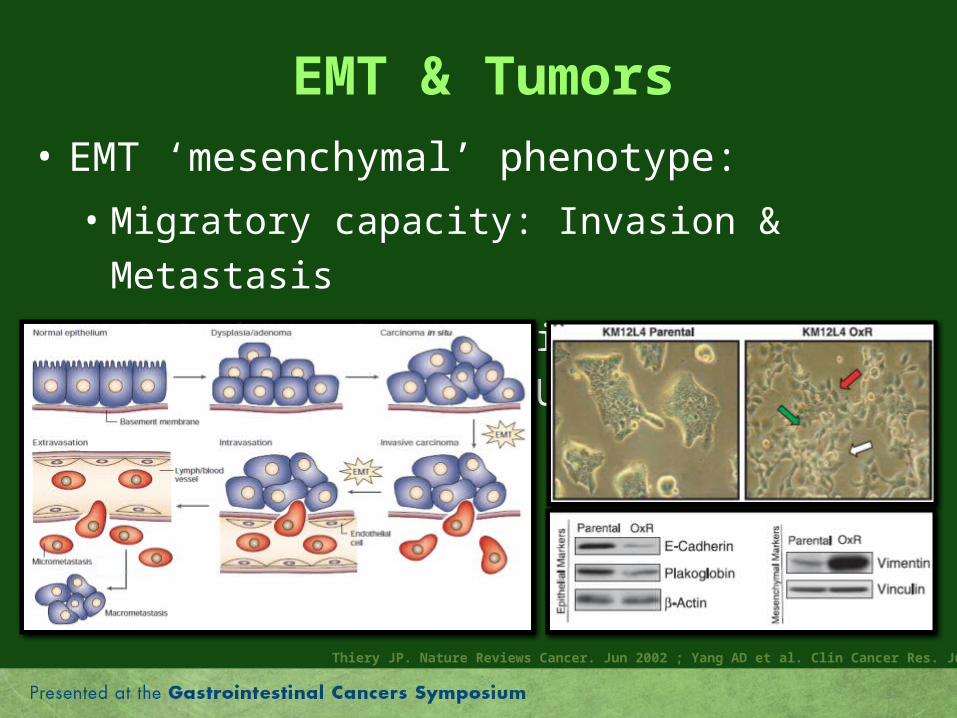
EMT & Tumors
• EMT ‘mesenchymal’ phenotype:
• Migratory capacity: Invasion & Metastasis
• Linked to chemo-resistance (oxaliplatin and 5FU)
Thiery JP. Nature Reviews Cancer. Jun 2002 ; Yang AD et al. Clin Cancer Res. Jul 2006
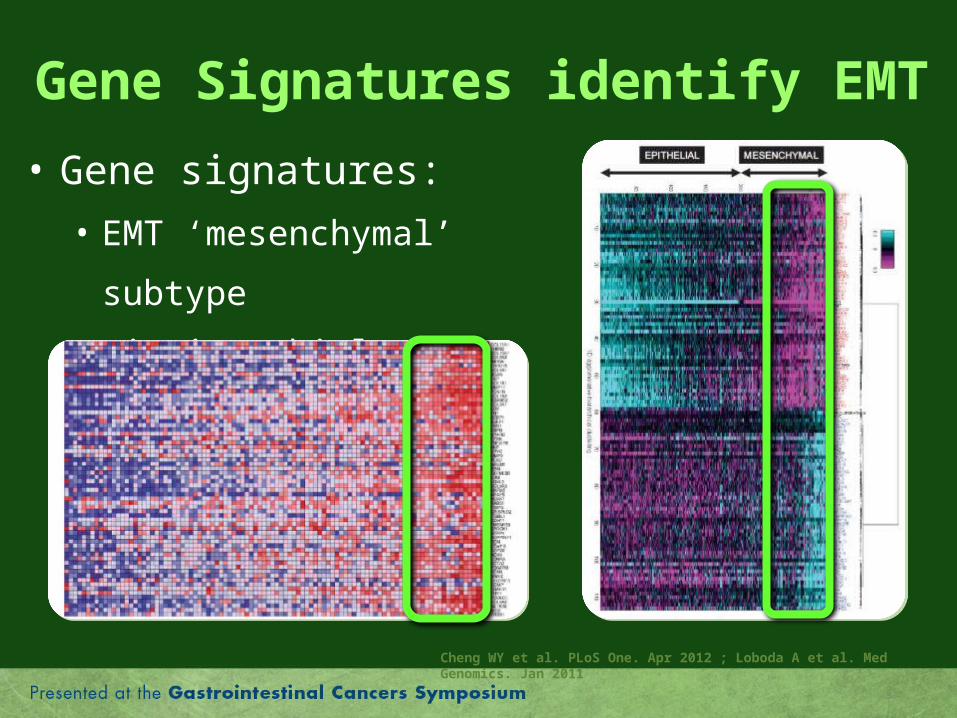
Gene Signatures identify EMT
• Gene signatures:
• EMT ‘mesenchymal’ subtype
• Distinct biology
Cheng WY et al. PLoS One. Apr 2012 ; Loboda A et al. Med Genomics. Jan 2011
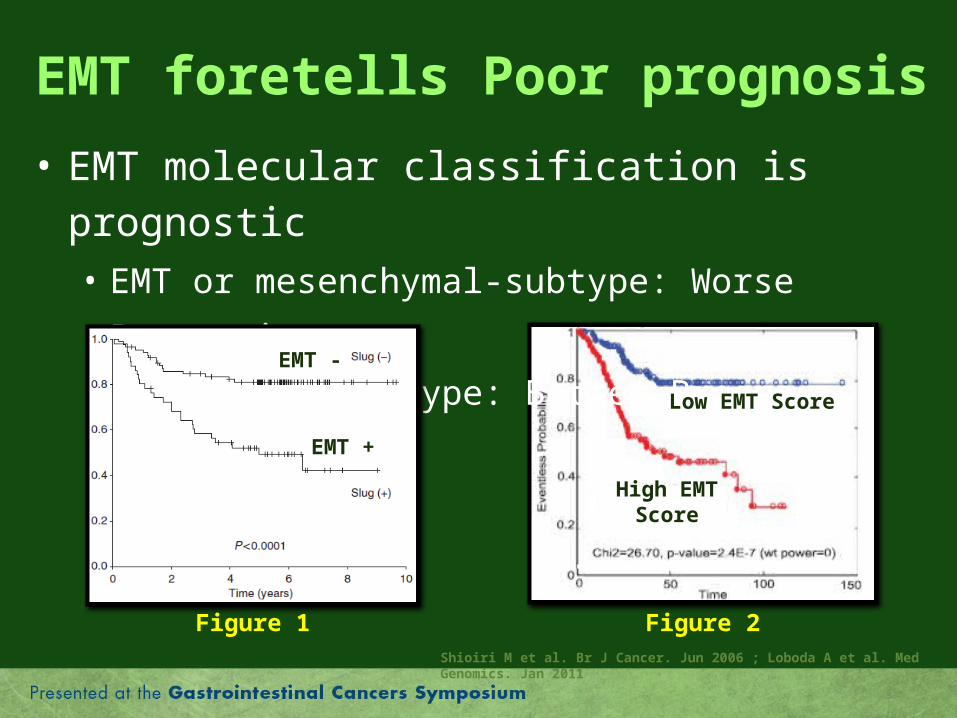
EMT foretells Poor prognosis
• EMT molecular classification is prognostic• EMT or mesenchymal-subtype: Worse Prognosis
• Epithelial-Subtype: Better Prognosis
Figure 1 Figure 2Shioiri M et al. Br J Cancer. Jun 2006 ; Loboda A et al. Med Genomics. Jan 2011
High EMTScore
Low EMT Score
EMT +
EMT -
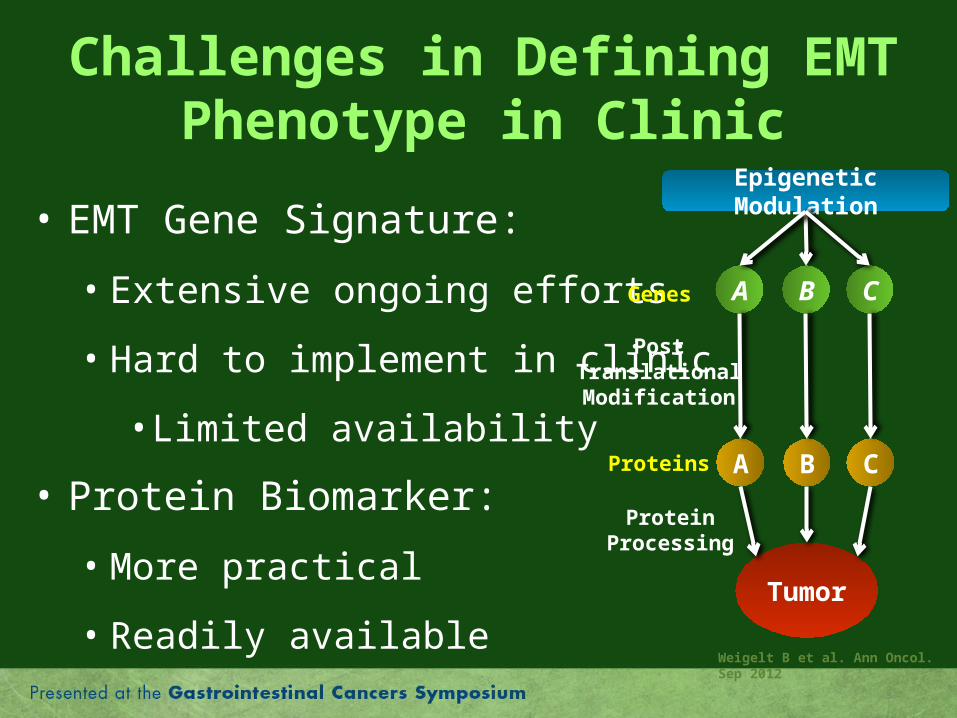
Challenges in Defining EMT Phenotype in Clinic
• EMT Gene Signature:
• Extensive ongoing efforts
• Hard to implement in clinic
• Limited availability
• Protein Biomarker:
• More practical
• Readily available
A B C
Epigenetic Modulation
Tumor
A B C
Genes
Proteins
PostTranslationalModification
Weigelt B et al. Ann Oncol. Sep 2012
ProteinProcessing
Research Question
• Possibility of using a clinical biomarker, to reflect
EMT biology to recognize EMT “mesenchymal”
subtype as identified by EMT gene signatures ?
• Possible marker: MET
• MET is motogenic: + Cell mobility & invasiveness
• First EMT cell lines transformed using MET activation.
• Common signaling pathways with EMT
• Optimized assays & integrated as a biomarkerThiery JP. Nature Reviews Cancer. Jun 2002
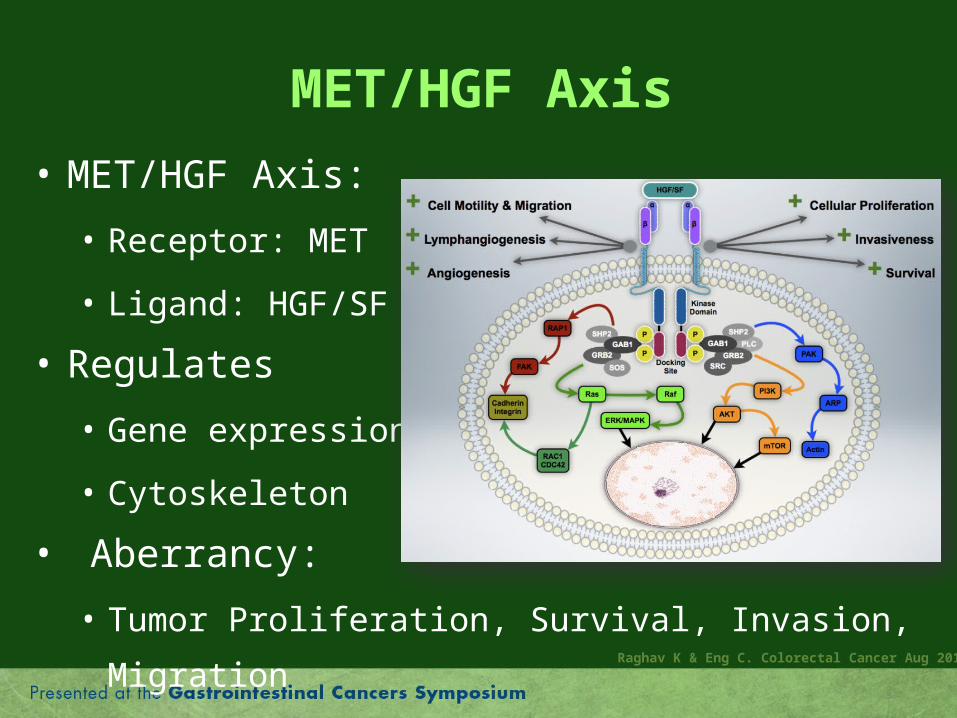
MET/HGF Axis
• MET/HGF Axis:
• Receptor: MET
• Ligand: HGF/SF
• Regulates
• Gene expression
• Cytoskeleton
• Aberrancy:
• Tumor Proliferation, Survival, Invasion, MigrationRaghav K & Eng C. Colorectal Cancer Aug 2012
Overview• Introduction
• Epithelial-mesenchymal transition (EMT)• Challenges & Research question• MET/HGF Axis
• Study• Objective• Methodology• Results• Conclusions
• Future
Study Objective
• To identify association between MET protein
expression and gene/protein expression of
EMT markers and EMT gene signatures in
human colorectal cancers.
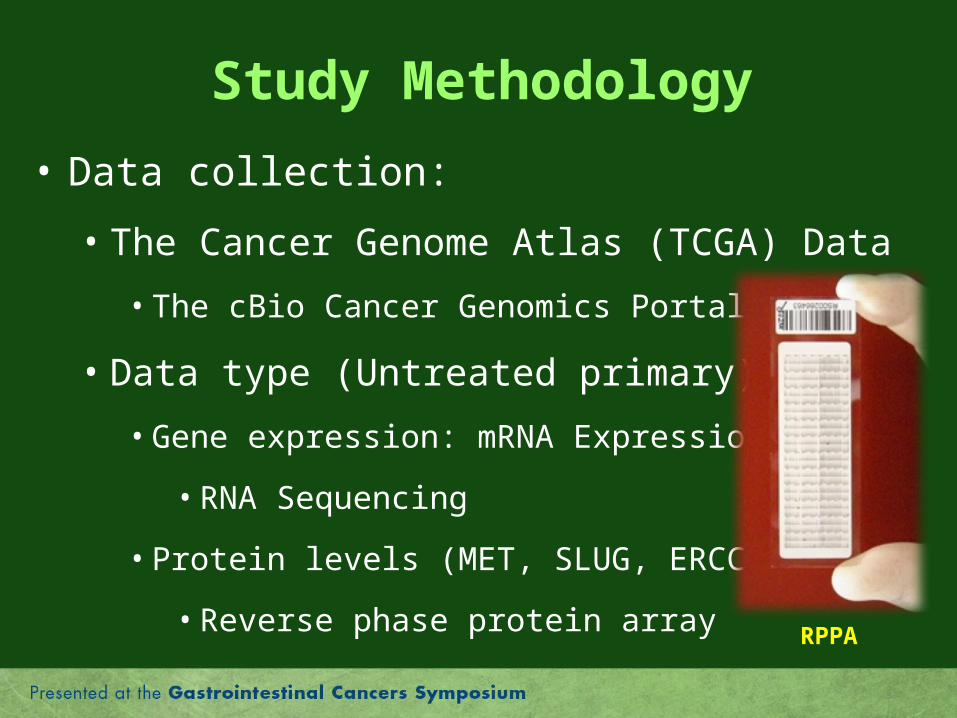
Study Methodology
• Data collection:
• The Cancer Genome Atlas (TCGA) Data
• The cBio Cancer Genomics Portal
• Data type (Untreated primary):
• Gene expression: mRNA Expression
• RNA Sequencing
• Protein levels (MET, SLUG, ERCC1):
• Reverse phase protein array RPPA
Study Methodology
• Tumors classified as per MET protein levels:
• MET High/Overexpressed: Protein in top quartile
• MET Low: Protein level < 3rd Quartile
• 58 genes associated with EMT phenotypes evaluated:
• Unsupervised: ≥ 2 EMT signatures (N = 41)
• Loboda, Taube, Salazar & Cheng EMT profiles
• Nominated: Common EMT markers (N = 17)Salazar R et al. J Clin Oncol. Jan 2011 ; Cheng WY et al. PLoS One. Apr 2012 ; Taube JH et al. Proc Natl Acad Sci U S A. Aug 2010
Study Methodology
• Statistical methods:
• Non-parametric Spearman rank correlation
• Mann-Whitney unpaired two-sample U test
• Regression tree method
• Kaplan-Meier estimates
• P < 0.05: Statistically significant
• All tests were two-sided
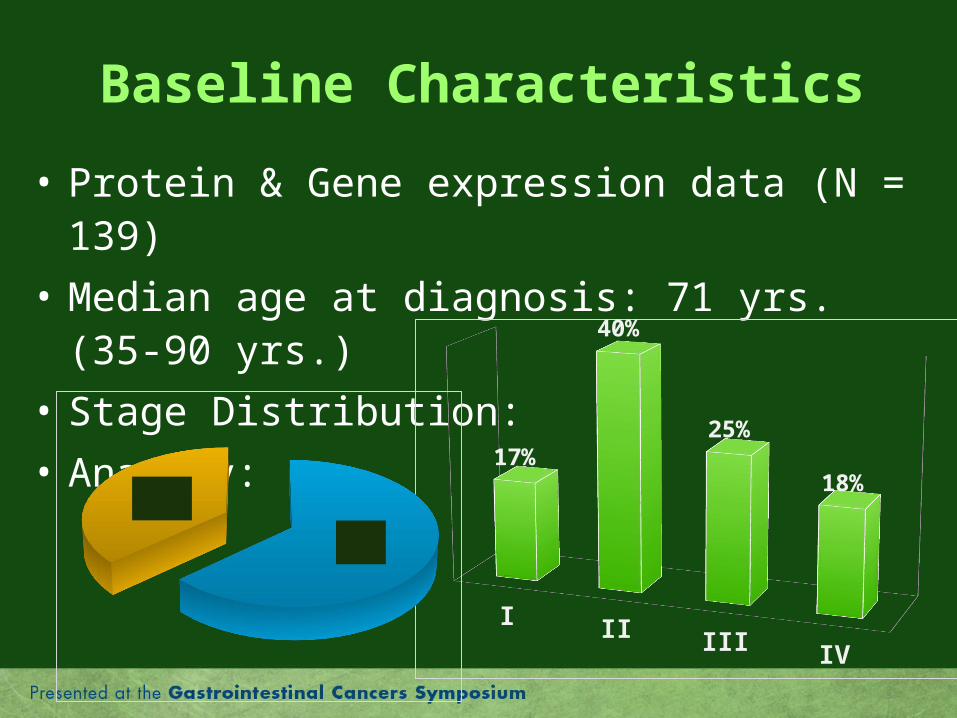
Baseline Characteristics
• Protein & Gene expression data (N = 139)
• Median age at diagnosis: 71 yrs. (35-90 yrs.)
• Stage Distribution:
• Anatomy:
I II III IV
17%
40%
25%
18%
Colon63%
Rectum37%
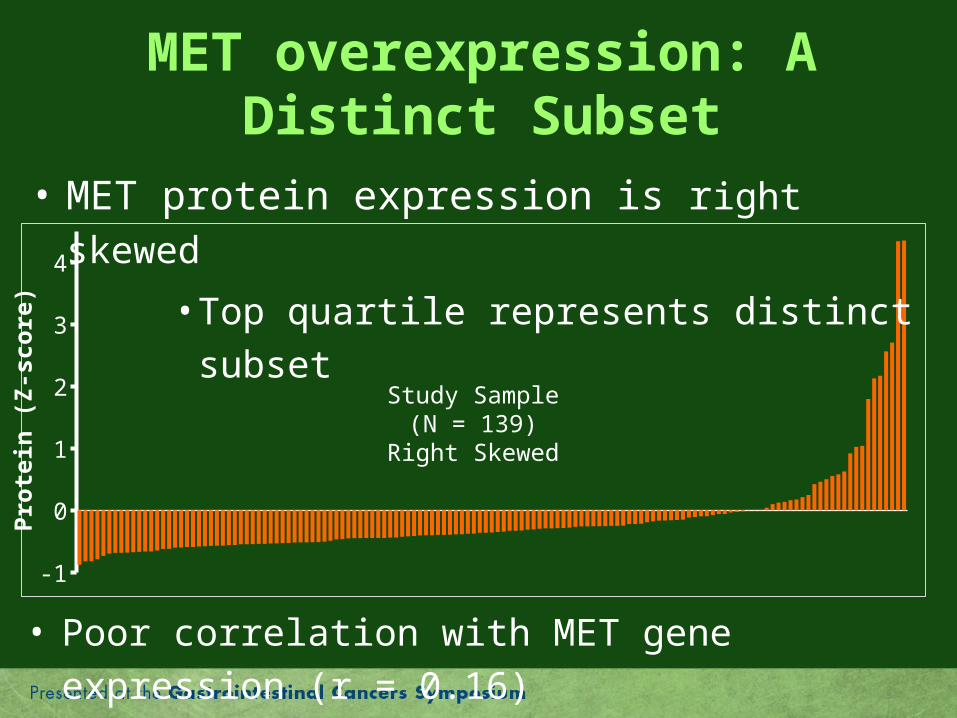
MET overexpression: A Distinct Subset
-1
0
1
2
3
4
Study Sample(N = 139)
Right Skewed
• MET protein expression is right skewed
• Top quartile represents distinct subset
• Poor correlation with MET gene expression (r = 0.16)
Pro
tein
(Z
-sco
re)
-1
0
1
2
3
4
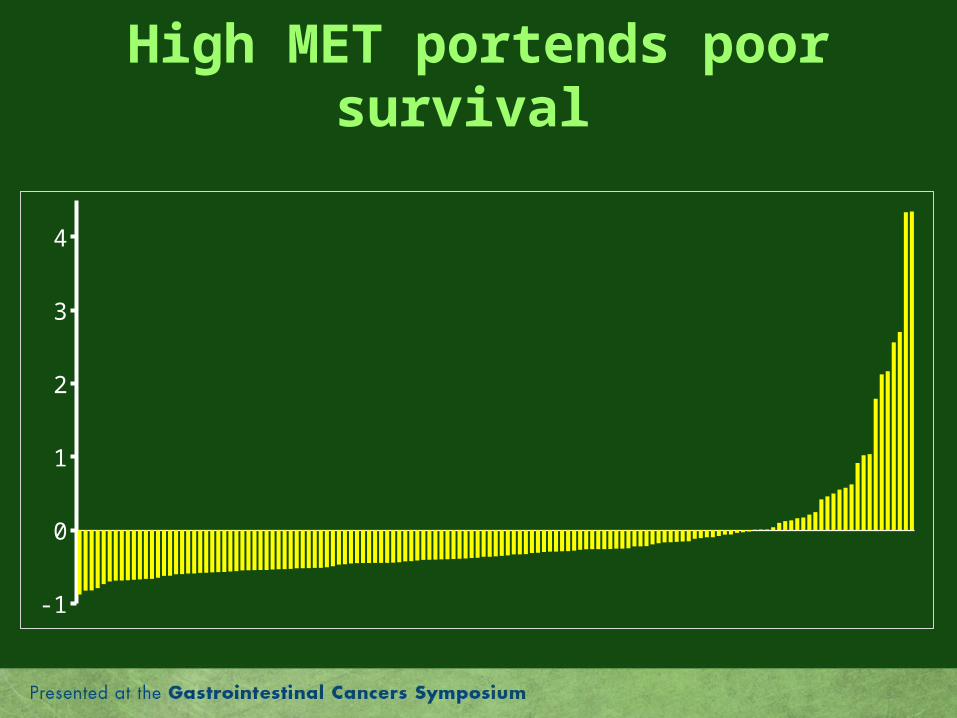
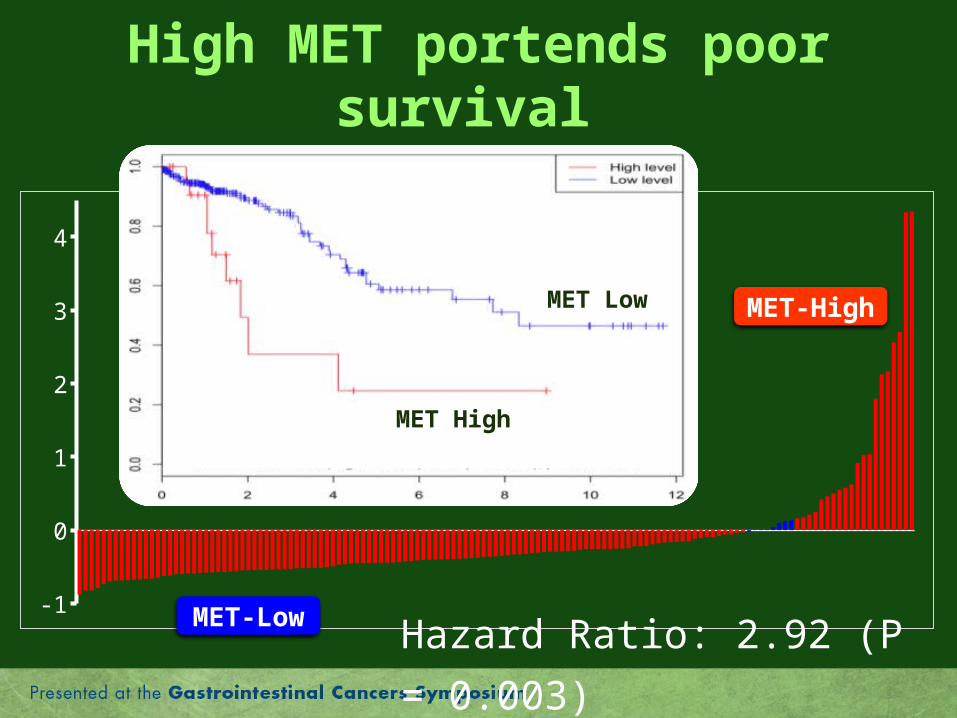
High MET portends poor survival
-1
0
1
2
3
4
High MET portends poor survival
Hazard Ratio: 2.92 (P = 0.003)
MET High
MET Low MET-High
MET-Low
MET RPPA-0.5 0.0 0.5 1.0
Co
lon
Re
cta
l
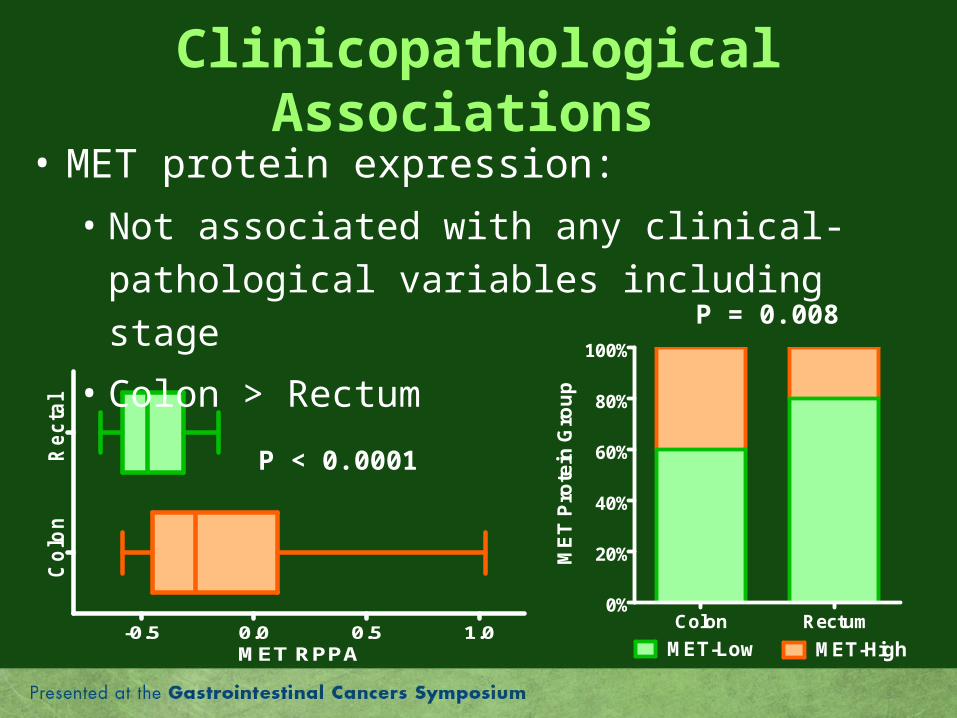
Clinicopathological Associations
• MET protein expression:
• Not associated with any clinical-pathological
variables including stage
• Colon > Rectum
P < 0.0001
P = 0.008
ME
T P
rote
in G
rou
p
Colon Rectum0%
20%
40%
60%
80%
100%
MET-Low MET-High
Protein-Protein Associations
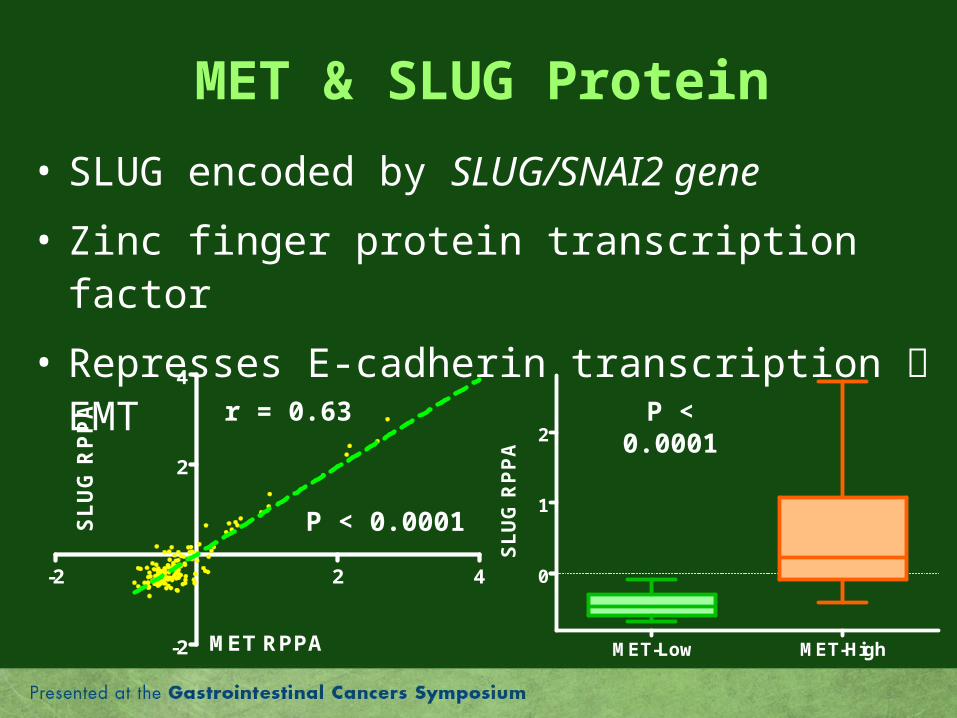
MET & SLUG Protein
• SLUG encoded by SLUG/SNAI2 gene
• Zinc finger protein transcription factor
• Represses E-cadherin transcription EMT
MET RPPA
S
LU
G R
PP
A
-2 2 4
-2
2
4
r = 0.63
P < 0.0001
P < 0.0001
SL
UG
RP
PA
MET-Low MET-High
0
1
2
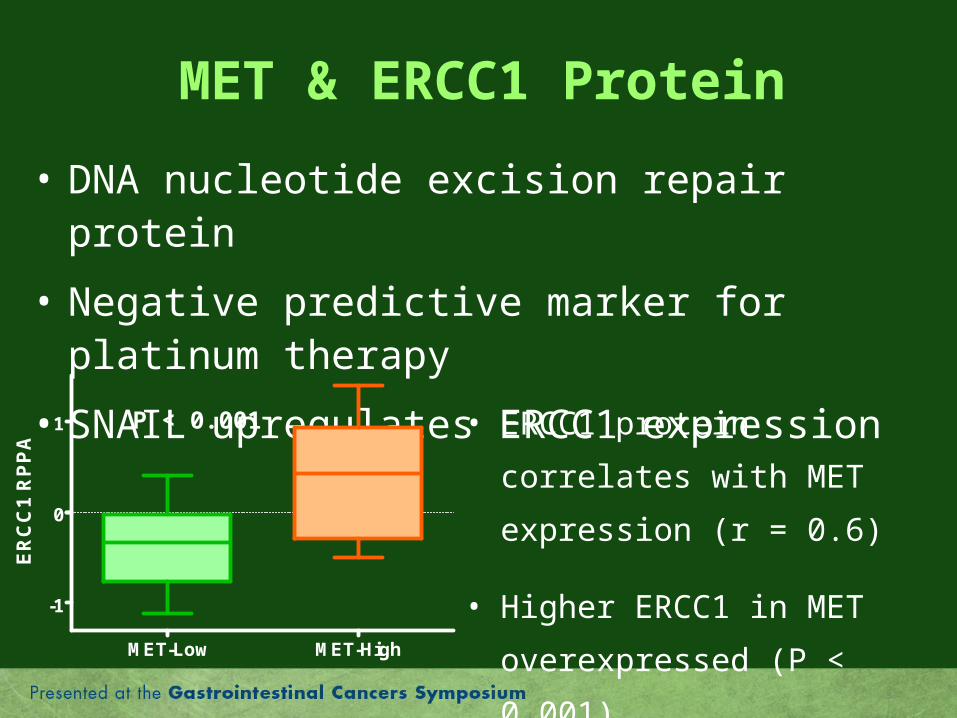
MET & ERCC1 Protein
• DNA nucleotide excision repair protein
• Negative predictive marker for platinum therapy
• SNAIL upregulates ERCC1 expression
P < 0.001 • ERCC1 protein correlates with
MET expression (r = 0.6)
• Higher ERCC1 in MET
overexpressed (P < 0.001)
ER
CC
1 R
PP
A
MET-Low MET-High
-1
0
1
Protein-Gene Associations
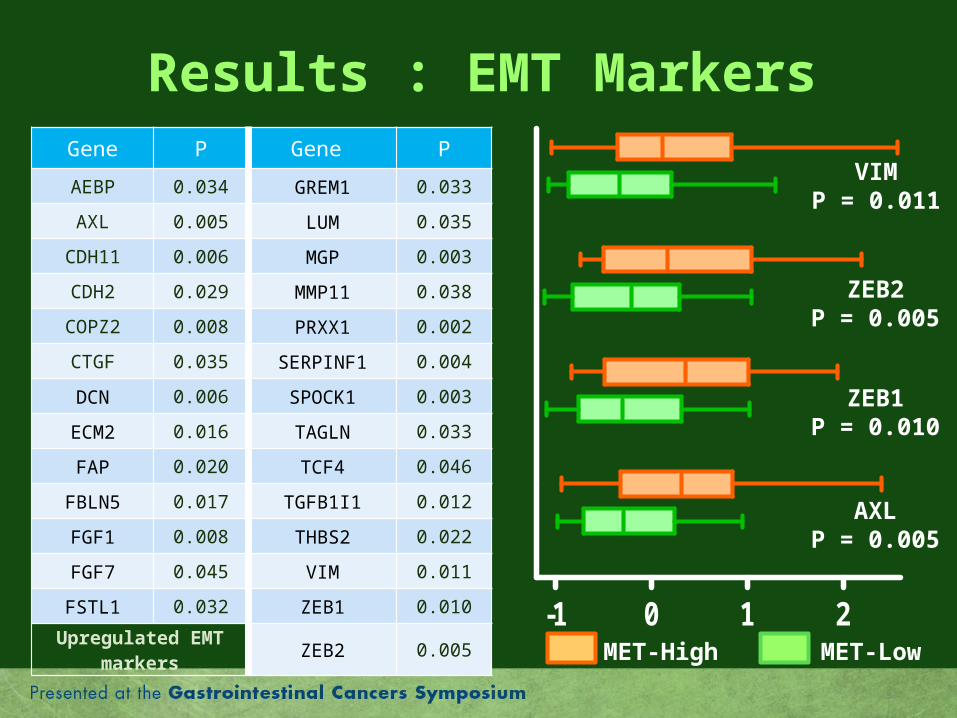
Results : EMT MarkersGene P Gene P
AEBP 0.034 GREM1 0.033
AXL 0.005 LUM 0.035
CDH11 0.006 MGP 0.003
CDH2 0.029 MMP11 0.038
COPZ2 0.008 PRXX1 0.002
CTGF 0.035 SERPINF1 0.004
DCN 0.006 SPOCK1 0.003
ECM2 0.016 TAGLN 0.033
FAP 0.020 TCF4 0.046
FBLN5 0.017 TGFB1I1 0.012
FGF1 0.008 THBS2 0.022
FGF7 0.045 VIM 0.011
FSTL1 0.032 ZEB1 0.010
Upregulated EMT markers
ZEB2 0.005-1 0 1 2
AXLP = 0.005
ZEB1P = 0.010
ZEB2P = 0.005
VIMP = 0.011
MET-LowMET-High
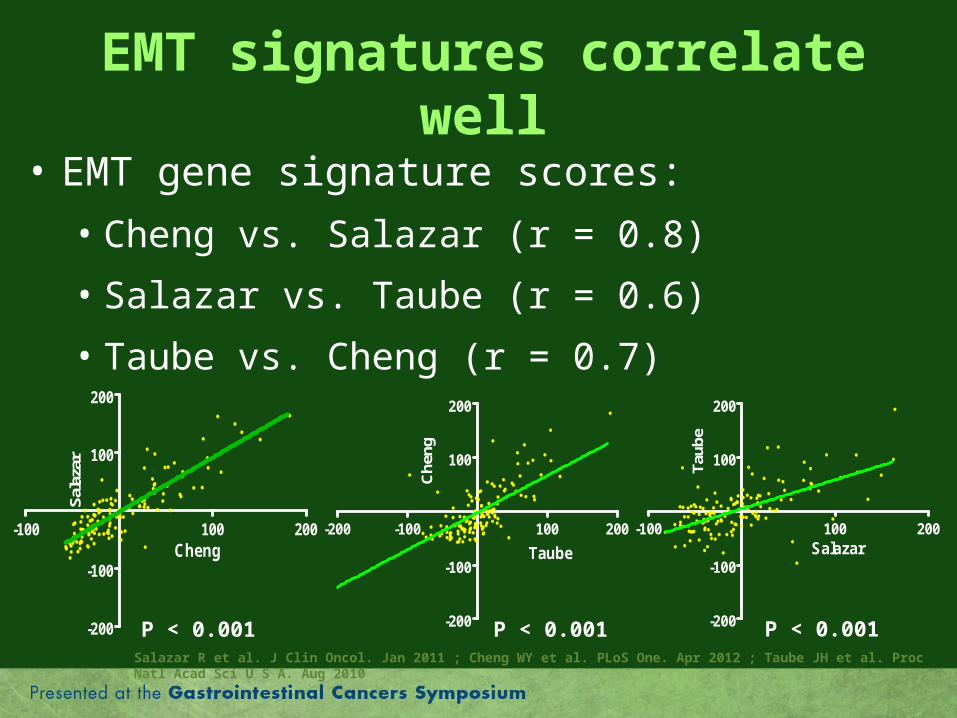
EMT signatures correlate well
• EMT gene signature scores:
• Cheng vs. Salazar (r = 0.8)
• Salazar vs. Taube (r = 0.6)
• Taube vs. Cheng (r = 0.7)
Salazar
T
aube
-100 100 200
-200
-100
100
200
P < 0.001
Taube
C
heng
-200 -100 100 200
-200
-100
100
200
P < 0.001Salazar R et al. J Clin Oncol. Jan 2011 ; Cheng WY et al. PLoS One. Apr 2012 ; Taube JH et al. Proc Natl Acad Sci U S A. Aug 2010
P < 0.001
Cheng
Sal
azar
-100 100 200
-200
-100
100
200
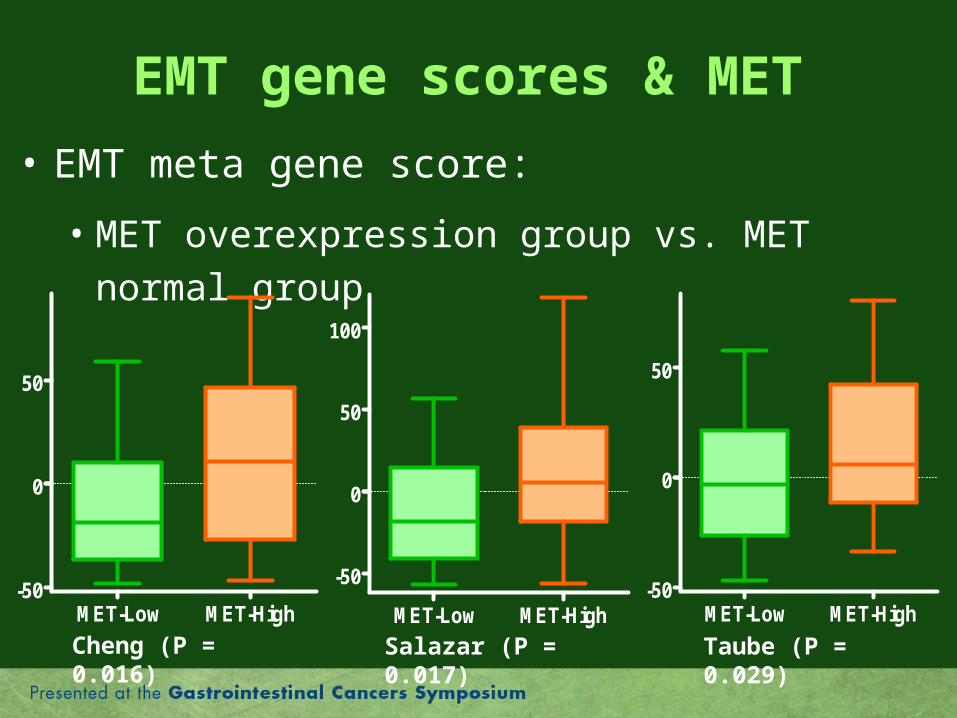
EMT gene scores & MET
• EMT meta gene score:
• MET overexpression group vs. MET normal group
Cheng (P = 0.016) Taube (P = 0.029)Salazar (P = 0.017)
MET-Low MET-High-50
0
50
MET-Low MET-High
-50
0
50
100
MET-Low MET-High-50
0
50
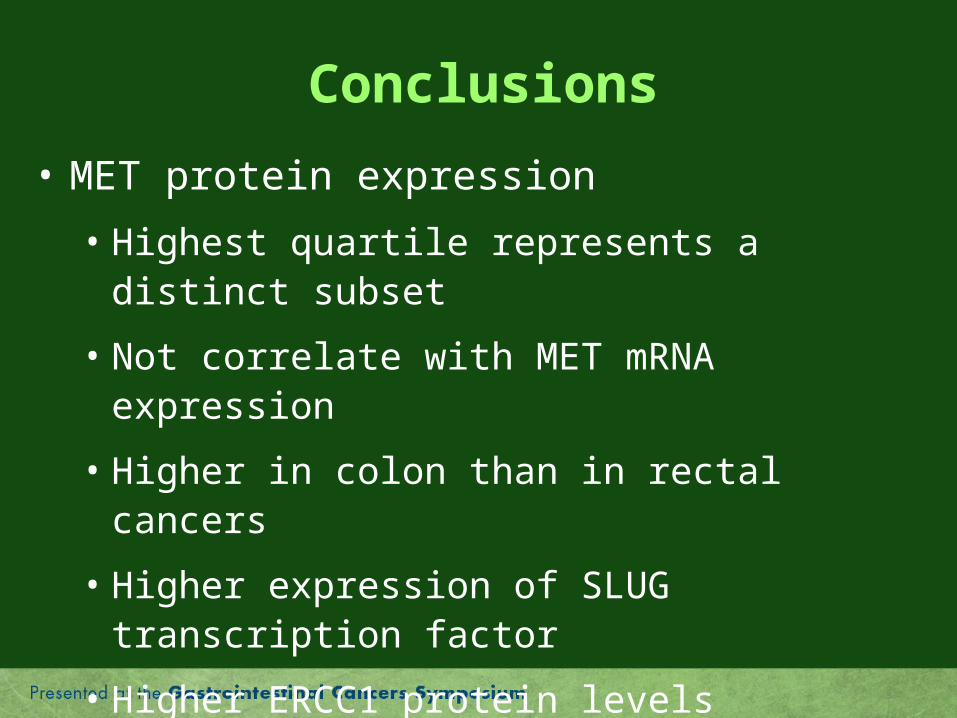
Conclusions
• MET protein expression
• Highest quartile represents a distinct subset
• Not correlate with MET mRNA expression
• Higher in colon than in rectal cancers
• Higher expression of SLUG transcription factor
• Higher ERCC1 protein levels
• Increased gene expression of EMT markers
• Higher EMT gene signature scores
Take Home Message
• MET protein expression can potentially be
used as a clinical biomarker representative of
the EMT “mesenchymal” phenotype in CRC.
Overview• Introduction
• Epithelial-mesenchymal transition (EMT)• Problem at hand & Research question• MET/HGF Axis
• Study• Objective• Methodology• Results• Conclusions
• Future
Future
• Validation of these results on an independent dataset is currently being performed.
• Evaluation of IHC in assessing MET protein expression is underway.
• MET can be used as a clinical bio-marker for patient selection for trials targeting EMT.
• Unique approach for biomarker search
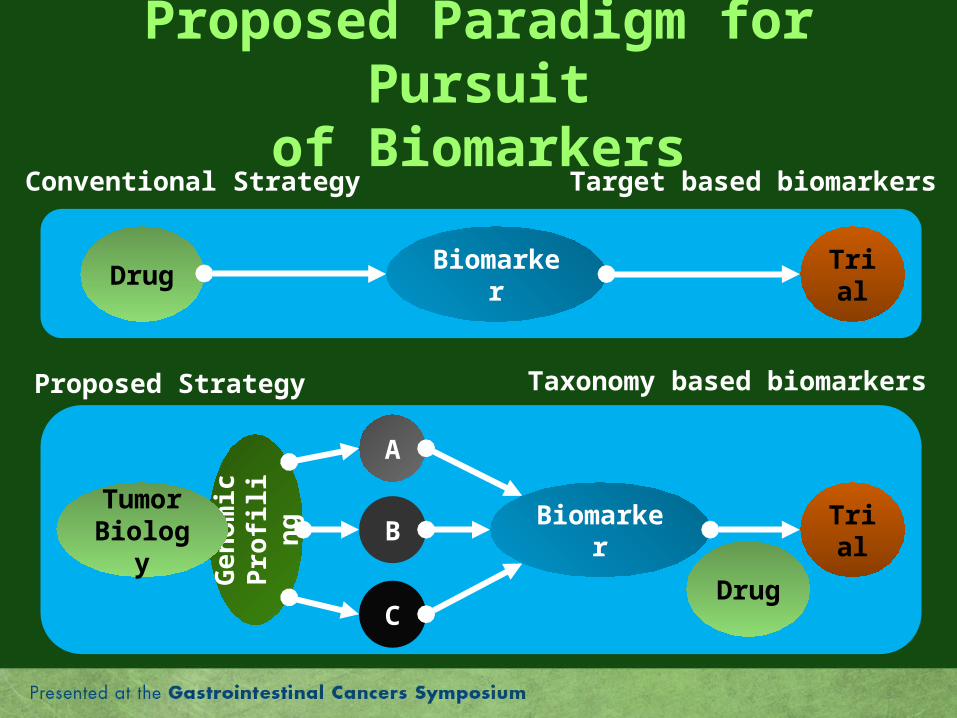
Proposed Paradigm for Pursuitof Biomarkers
Ge
no
mic
Pro
filin
g
Biomarker
Proposed Strategy
TrialDrug Biomarker
Conventional Strategy
Tumor Biology
TrialB
C
A
Target based biomarkers
Taxonomy based biomarkers
Drug
Acknowledgement
KOPETZ LAB TEAM
Dr. Ali Kazmi, M.D.
Dr. Arvind Dasari, M.D.
Maria Pia Morelli, M.D., Ph.D.
Shweta Aggarwal, M.D.
Feng Tian, Ph.D.
Zhi-Qin Jiang, M.D., Ph.D.
NCI
TCGA initiative
Collaborators
CO-INVESTIGATORS
Wenting Wang, Ph.D.
Ganiraju C Manyam, Ph.D.
Bradley M Broom, Ph.D.
Cathy Eng, M.D., FACP
Michael J. Overman, M.D.
Scott Kopetz, M.D., Ph.D., FACP
COLLABORATORS
Dr. Amin Hesham, M.D., M.Sc.
Dr. David S. Hong, M.D.