Embed Size (px)
Citation preview

Institut de Recerca en Economia Aplicada Regional i Pública Document de Treball 2011/07 pàg. 1 Research Institute of Applied Economics Working Paper 2011/07 pag .1
1
Institut de Recerca en Economia Aplicada Regional i Pública Document de Treball 2014/02 31 pàg. Research Institute of Applied Economics Working Paper 2014/02 31 pag.
“EMU sovereign debt market crisis:
Fundamentals-based or pure contagion?”
Marta Gómez-Puig and Simón Sosvilla-Rivero
Institut de Recerca en Economia Aplicada Regional i Pública Document de Treball 2014/02 pàg. 2 Research Institute of Applied Economics Working Paper 2014/02 pag. 2
2
WEBSITE: www.ub.edu/irea/ • CONTACT: [email protected]
The Research Institute of Applied Economics (IREA) in Barcelona was founded in 2005, as a research institute in applied economics. Three consolidated research groups make up the institute: AQR, RISK and GiM, and a large number of members are involved in the Institute. IREA focuses on four priority lines of investigation: (i) the quantitative study of regional and urban economic activity and analysis of regional and local economic policies, (ii) study of public economic activity in markets, particularly in the fields of empirical evaluation of privatization, the regulation and competition in the markets of public services using state of industrial economy, (iii) risk analysis in finance and insurance, and (iv) the development of micro and macro econometrics applied for the analysis of economic activity, particularly for quantitative evaluation of public policies.
IREA Working Papers often represent preliminary work and are circulated to encourage discussion. Citation of such a paper should account for its provisional character. For that reason, IREA Working Papers may not be reproduced or distributed without the written consent of the author. A revised version may be available directly from the author.
Any opinions expressed here are those of the author(s) and not those of IREA. Research published in this series may include views on policy, but the institute itself takes no institutional policy positions.
Institut de Recerca en Economia Aplicada Regional i Pública Document de Treball 2014/02 pàg. 3 Research Institute of Applied Economics Working Paper 2014/02 pag. 3
3
Abstract
We empirically investigate whether the transmission of the recent crisis in euro area sovereign debt markets was due to fundamentals-based or pure contagion. To do so, we examine the behaviour of EMU sovereign bond yield spreads with respect to the German bund for a sample of both central and peripheral countries from January 1999 to December 2012. First we apply a dynamic approach to analyse the evolution of the degree of Granger-causality within the 90 pairs of sovereign bond yield spreads in our sample, in order to detect episodes of significantly increased causality between them (which we associate with contagion) and episodes of significantly reduced interconnection (which we associate with immunisation). We then use an ordered logit model to assess the determinants of the occurrence of the episodes detected. Our results suggest the importance of variables proxying market sentiment and of variables proxying macrofundamentals in determining contagion and immunisation outcomes. Therefore, our findings underline the coexistence of “pure” and “fundamentals-based contagion” during the recent European debt crisis.
JEL classification: C35, C53, E44, F36, G15 Keywords: Sovereign bond spreads, contagion, Granger-causality, time-varying approach, euro area, ordered logit model.
Marta Gómez-Puig: Department of Economic Theory, Universitat de Barcelona, Av. Diagonal 696, 08034 Barcelona, Spain. E-mail: [email protected]. Simón Sosvilla-Rivero: Department of Quantitative Economics, Universidad Complutense de Madrid, Campus de Somosaguas, 28223 Madrid, Spain. E-mail: [email protected] Acknowledgements We are very grateful to Analistas Financieros Internacionales for kindly providing the credit rating and the European 5-year CDS indices datasets. We also thank the following authors who provided datasets built up by themselves: Scott R. Baker, Nicholas Bloom, and Steven J. Davis; Craig S. Hakkio and William R. Keeton; Jens Klose and Benjamin Weigert; Raquel López and Eliseo Navarro; André Lucas, Bernd Schwaab and Xin Zhang; and Vito Polito and Michael R. Wickens. Thanks are also due to Maria del Carmen Ramos-Herrera for research assistance. This paper is based upon work supported by the Government of Spain and FEDER under grant numbers ECO2010-21787-C03-01 and ECO2008-05565. Simón Sosvilla-Rivero thanks the Universitat de Barcelona and RFA-IREA for their hospitality. Responsibility for any remaining errors rests with the authors.

Institut de Recerca en Economia Aplicada Regional i Pública Document de Treball 2014/02 pàg. 4 Research Institute of Applied Economics Working Paper 2014/02 pag. 4
4
1. Introduction The announcement of Greece’s distressed debt position in late 2009 triggered a sudden loss of investor
confidence and marked the beginning of the euro area sovereign debt crisis. Indeed, in May 2010 Greece’s
financial problems became so severe that the country needed to be bailed out. An important reason for
providing financial support to Greece was fear of contagion (see, for instance, Constâncio, 2012), not only
because several European Union banks had a high exposure to Greece (see Gómez-Puig and Sosvilla-
Rivero, 2013a), but also because the investors now turned their attention to the macroeconomic and fiscal
imbalances within European Economic and Monetary Union (EMU) countries, which had largely been
ignored until then (see Beirne and Fratzscher, 2013). So, from late 2009 onwards, in parallel with the
higher demand for the German bund which benefited from its safe haven status, yield spreads of euro area
issues with respect to Germany spiralled (see Figure 1). Besides, since May 2010, not only has Greece been
rescued twice, but also Ireland, Portugal and Cyprus have needed bailouts to stay afloat.
These events raised some important questions for economists, policymakers, and practitioners. To what
extent was the sovereign risk premium increase in the euro area during the European sovereign debt crisis
due only to deteriorated debt sustainability in member countries? Did contagion play any significant role in
the increase in the sovereign risk premium? In fact the sovereign debt crisis in Europe has rekindled the
literature on contagion applied to the euro area [see Kalbaska and Gatkowski (2012), Metiu (2012),
Caporin et al. (2013), Beirne and Fratzscher (2013) and Mink and Haan (2013) to name a few], even
though the empirical evidence is not conclusive. The discrepancies and inconsistencies between studies
using different empirical approaches and applying different definitions of the crisis transmission channel
have made it difficult to compare results and therefore to reach meaningful conclusions (Dungey et al.,
2005). The main objective of this paper is to shed some light on this challenging avenue of research.
The first challenge is to provide a precise definition of contagion, since at present the term is used quite
ambiguously in the literature. Nor is there any agreement on the econometric methodology to be used. So,
the second challenge is an empirical one: contagion is an unobservable shock, and therefore most
empirical techniques have problems dealing with latent variables.
In this paper, in order to evaluate the extent of contagion in the euro area, we first test for the existence of
possible Granger-causal relationships between 10-year sovereign yield spreads over Germany of 10 EMU
countries, both central (Austria, Belgium, Finland, France and The Netherlands) and peripheral (Greece,
Ireland, Italy, Portugal and Spain). Secondly, we examine the time-varying nature of these relationships in
order to detect episodes of significant intensification or reduction in the causality between them. Finally,
we explore whether there is evidence of “pure contagion” or “fundamentals-based contagion” in the euro
Institut de Recerca en Economia Aplicada Regional i Pública Document de Treball 2014/02 pàg. 5 Research Institute of Applied Economics Working Paper 2014/02 pag. 5
5
area sovereign debt crisis, by trying to determine which factors (changes in local risk sentiment in each
different country, fundamental variables, financial linkages, or common regional/global risk factors) might
have been behind these intensification/reduction episodes.
The rest of the paper is organised as follows. Section 2 reviews the literature on financial contagion and on
the determinants of euro-area sovereign bond spreads. The Granger-causality analysis and our approach
for the detection of episodes of intensification/reduction of causality are presented in Section 3. In
Section 4 we carry out the empirical exploration of the determinants of these episodes. Finally, Section 5
summarises the findings and offers some concluding remarks.
2. Literature review
2. 1. Financial contagion
Considerable ambiguity surrounds the precise definition of contagion. There is no theoretical or empirical
definition on which all researchers agree; therefore, the debate on exactly how to define contagion is not
just academic, but has important implications for measuring the concept and for evaluating policy
responses. Pericoli and Sbracia (2003) note five definitions of contagion used in the literature, whilst The
World Bank defines three layers within contagion1. First, in a broad sense, contagion is the cross-country
transmission of shocks or general cross-country spillover effects; in this sense, contagion can take place
both during “good” and “bad” times and does not need to be related to crises. Second, in a restrictive
sense, contagion is the transmission of shocks to other countries, or the cross-country correlation, beyond
any fundamental link2 between the countries and beyond common shocks. When either fundamentals or
common shocks do not fully explain the relationship between countries, spillover effects are attributed to
herding behaviour, either rational or irrational. Finally, in a very restrictive sense, according to the World
Bank, contagion refers to increases in cross-country correlations during “crisis times” relative to
correlations during “tranquil times”.
The second and third definitions of contagion proposed by the World Bank (contagion in a restrictive, and
in a very restrictive sense) have predominantly been used in empirical studies analysing the concept in
financial markets and have been adopted in common usage by governments, citizens and policymakers.
The third defines contagion depending on whether the transmission mechanisms are stable through time,
1http://go.worldbank.org/JIBDRK3YC0 2 The World Bank distinguishes three different categories of fundamental links: financial, real, and political. The first ones exist when two economies are connected through the international financial system. Real links are fundamental economic relationships between countries. These links have usually been associated with international trade, but other types of real links, like foreign direct investment across countries, may also be present. Finally, political links are the political relationships between countries. Although this link is much less stressed in the literature, when a group of countries share an exchange rate arrangement – a common currency in the case of the euro area countries – crises tend to be clustered.
Institut de Recerca en Economia Aplicada Regional i Pública Document de Treball 2014/02 pàg. 6 Research Institute of Applied Economics Working Paper 2014/02 pag. 6
6
whilst the second defines it depending on the channels of transmission that are used to spread the effects
of the crisis.
According to the very restrictive definition, which was proposed in a seminal paper by Forbes and
Rigobon (2002), contagion is a significant increase in cross-market linkages after a shock to one country
(or group of countries). Therefore, if two markets show a high degree of co-movement during periods of
stability, even if they continue to be highly correlated after a shock to one market this may not constitute
contagion. This definition implies the presence of a tranquil, pre-crisis period. The distinction between
contagion which occurs at times of crisis, and the interdependence which is the result of normal market
interaction, has become the focal point of many contagion studies (see, e.g., Corsetti et al., 2005 or Bae et
al., 2003).
By contrast, Calvo and Reinhart (1996), Masson (1999), and Kaminsky and Reinhart (2000) explore the
restrictive definition of contagion, arguing that contagion arises when common shocks and all channels of
potential interconnection are either not present or have been controlled for. According to these authors,
“pure or true contagion” should be distinguished from “fundamentals-based contagion” which is caused
by “monsoonal effects” and “linkages”. “Monsoonal effects” are random aggregate shocks that hit a
number of countries in a similar way (such as a major economic shift in industrial countries, a significant
change in oil prices or changes in US interest rates) that may adversely affect the economic fundamentals
of several economies simultaneously and, therefore, may cause a crisis (Eichengreen et. al., 1996).
“Linkages” are normal interdependencies, such as those produced by trade and financial relations between
countries and which can easily become a carrier of crisis (Kaminsky and Reinhart, 2000).
Conversely, the term “pure contagion” is only applied when the transmission process itself changes when
entering crisis periods: when a crisis in one country may conceivably trigger a crisis elsewhere for reasons
unexplained by macroeconomic fundamentals – perhaps because it leads to shifts in market sentiment, or
changes the interpretation given to existing information, or triggers herding behaviour (Claessens et al.,
2001). Different mechanisms have been proposed to explain herding behaviour by international investors
and other cases of extreme market sentiment (see Lux, 1995; or Akerlof and Shiller, 2009). The literature
has emphasised that asymmetric information is at the root of these market reactions. Information is costly,
so investors do not know enough about the countries in which they invest and therefore try to infer future
price changes based on how the rest of the market is reacting. The relatively uninformed investors follow
the supposedly informed investors, and all the market moves jointly.
All in all, then, the literature includes two groups of theories (not necessarily mutually exclusive – see
Dungey and Gajurel, 2013) to explain crisis transmission mechanisms. One group argues that the

Institut de Recerca en Economia Aplicada Regional i Pública Document de Treball 2014/02 pàg. 7 Research Institute of Applied Economics Working Paper 2014/02 pag. 7
7
economic fundamentals of different countries are interconnected by their cross-border flows of goods,
services, and capital. When a crisis originates in one country, this interdependence of economies through
real and financial linkages may become a conveyor of crisis. In addition, global phenomena or common
shocks may adversely affect the economic fundamentals of several economies simultaneously, and may
therefore cause a crisis. These fundamentals-based effects are also known as ‘spillovers’ (Masson, 1999),
‘interdependence’ (Forbes and Rigobon, 2002), or ‘fundamentals-based contagion’ (Kaminsky and
Reinhart, 2000).
The other group of theories argues that financial crisis spreads from one country to another due to market
imperfection or the behaviour of international investors (Masson, 1999). Information asymmetries make
investors more uncertain about the actual economic fundamentals of a country. A crisis in one country
may give a “wake-up call” to international investors to reassess the risks in other countries; uninformed or
less informed investors may find it difficult to extract the informed signal from the falling price and follow
the strategies of better informed investors, thus generating excess co-movements across the markets. The
degree of non-anticipation of a crisis by investors or sudden shifts in market confidence and expectations
have been identified as important factors causing “pure contagion” (see Masson, 1999 and Mondria and
Quintana-Domeque, 2013).
The initial empirical literature on financial crisis and contagion was focused on fundamentals-based
mechanisms and directed towards developing an early warning system (Eichengreen et al., 1996; Kaminsky
et al., 2000) while later empirical works have focused on investor behaviour-based mechanisms (Dungey et
al., 2005; Bekaert et al., 2011). The aim of this paper is to explore the extent to which the transmission of
euro area debt crisis could be attributed to common shocks and/or interconnected markets (through real
and financial linkages), to idiosyncratic factors (shifts in market participants behaviour during the crisis
period), or to both types of factor. To this end, we will analyse which variables could be behind the crisis
transmission in order to assess whether there is empirical evidence of “fundamentals-based contagion”, or
“pure contagion”, or of a mixture of the two during the euro area sovereign debt crisis.
In addition, among the five general strategies3 that have been used in the empirical literature, our analysis
will be related to one of the most conventional methodologies for testing for contagion: the analysis of
cross-market correlations. However, we not only investigate changes in cross-market interdependencies
via cointegration analysis, but also explore changes in the existence and direction of pair-wise causal
3 Probability analysis, cross-market correlations, VAR models, latent factor/GARCH models, and extreme value/co-exceedance/jump approach (see Forbes, 2013).

Institut de Recerca en Economia Aplicada Regional i Pública Document de Treball 2014/02 pàg. 8 Research Institute of Applied Economics Working Paper 2014/02 pag. 8
8
relationships among euro area sovereign bond yield spreads vis-à-vis the German bund4. Hence, the two
operational definitions of contagion that we will explore in the remainder of this paper are the following.
We will identify “fundamentals-based contagion” as an abnormal increase in the intensity of causal
relationships explained by macroeconomic fundamentals, financial linkages or common regional/global
shocks, and “pure contagion” as an abnormal increase in the intensity of causal relationships only
triggered by a shift in idiosyncratic market sentiments.
2.2. Determinants of the evolution of euro-area sovereign yield spreads.
In order to analyse the factors behind episodes of intensification/reduction of causality within sovereign
yield spreads, we focused on the literature on the determinants of the evolution of euro-area sovereign
yield spread. This literature, combined with that of financial contagion, suggests that we should not only
include variables that measure macroeconomic fundamentals or some potential channels of crisis
transmission, but also those that capture changes in market sentiment: either idiosyncratic, regional, or
global5. A summary with the definition and sources of all the explanatory variables used in the ordered
logit model is presented in Appendix A.
Specifically, four variables have been used to gauge regional, global or local market sentiment in each
different country: stock returns, stock volatility, an index of economic policy uncertainty, and an index of
the fiscal stance.
Monthly stock returns are used in order to reflect portfolio allocation effects between stocks and bonds in
each country (see among others, Aizenman, 2013 and Georgoutsos and Migiakis, 2013). Since periods of
financial turmoil and negative stock returns may be accompanied by rises in sovereign bond spreads
because of an increased propensity to hold safer assets (the German bund in our case), we expect a
negative association between them. To this end, differences of logged stock index prices of the last and
the first day of the month have been calculated for the benchmark stock index in each country; whilst the
Eurostoxx-50 and the Standard and Poor’s 500 have been used to calculate, respectively, the evolution of
regional and global stock returns. Volatility is a measure of the level of uncertainty prevailing in stock
markets. Two different approaches are used to estimate it; while historical volatility involves measuring the
standard deviation of closing returns for any particular security over a given period of time, implied
volatility is derived from option prices. The latter represents the estimates and assumptions of market
participants involved in a trade, on the basis of a given option price, and has been used to gauge both
regional and global stock market volatility. In particular, the variables VSTOXX and VIX which measure
4 Forbes and Rigobon (2002) suggest the use of this methodology and note that, if the source of the crisis is not well identified and endogeneity may be severe, it may be useful to utilise Granger-causality tests to determine the extent of any feedback from each country in the sample to the initial crisis country. 5 We expect the same sign for the effect of each of these variables on spreads and on the occurrence of a contagion episode.
Institut de Recerca en Economia Aplicada Regional i Pública Document de Treball 2014/02 pàg. 9 Research Institute of Applied Economics Working Paper 2014/02 pag. 9
9
implied volatility in Eurostoxx-50 and Standard and Poor’s 500 index options and have been widely used
in the literature by other authors (see, e.g., Afonso, 2012, Aizenman et al., 2013, and Battistini et al., 2013)
have been incorporated as measures of uncertainty in the Eurozone and the global financial markets
respectively. However, since the implied volatility indices were not available for all countries, we opted for
the monthly standard deviation of equity returns in each country to capture local stock market volatility.
The increased stock market volatility is usually accompanied by an increase in other risk components and,
thus, leads to increases in bond yield spreads; as a result, we expect a positive sign for the respective
coefficient.
Some authors (see, e.g. Ades and Chua, 1993) find that political instability has strong negative effects on a
country’s per capita growth rate. Thus, to assess whether policy uncertainty has an influence on the
decisions of bond market investors, we have used the index of economic policy uncertainty (EPU), built
up by Baker et. al. (2013), which draws on the frequency of newspaper references to policy uncertainty and
other indicators and which is available for Germany, France, Italy, Spain, Europe and the United States. A
positive sign is also expected for the respective coefficient since policy uncertainty may discourage
investments in sovereign debt markets. A related question is the analysis of the impact of the fiscal stance
of each country on sovereign debt spreads. Therefore, the index of the fiscal stance suggested by Polito
and Wickens (2011, 2012) is also included in the analysis. Unlike the standard econometric tests of fiscal
sustainability, this index is suitable for assessing fiscal policy in the short and medium term as it can
measure the fiscal consolidation needed to achieve a pre-specified debt target at any future time horizon.
To capture regional and global risk we have used the European and United States indices of the fiscal
stance respectively. Since, by construction, the higher the index, the worse the fiscal stance, we expect a
positive sign for its coefficient.
Another variable, the consumer confidence indicator6, has been used to measure either regional
(Eurozone) or local market sentiment in each different country. This index is used to gauge economic
agents’ perceptions of future economic activity and it seems reasonable to expect a negative relationship
between it and spreads, since an increase in consumer confidence may lead to a rise in investor confidence
in the economy’s potential for growth.
Finally, the analysis of the influence of local, regional and global market sentiment on sovereign yield
spreads has been completed by the inclusion of one more variable in the first case, five additional variables
in the second, and two supplementary variables in the third.
6 According to some authors (see, e.g., Rua, 2002), the Economic Sentiment Indicator (ESI) has informative content for the GDP growth rate and can therefore be used to gauge economic agents’ perceptions of future economic activity. However, since this indicator was not available for Ireland, and the correlation between the Consumer Confidence Indicator and the ESI is very high, we decided to include the former in the analysis.
Institut de Recerca en Economia Aplicada Regional i Pública Document de Treball 2014/02 pàg. 10 Research Institute of Applied Economics Working Paper 2014/02 pag. 10
10
Credit rating has been included as a proxy of the market perception of default risk in each local market.
So, following Blanco (2001), we built up a monthly scale to estimate the effect of investor sentiment based
on the rating offered by the three most important agencies (Standard &Poor’s, Moody’s and Fitch). Since
this variable is considered an ex post measure of fiscal sustainability it should have a positive impact on
sovereign spreads (by construction, the higher the scale, the worse the rating categories).
Five variables have been added to explore the impact of regional market sentiment on sovereign spreads.
First, we have accounted for the effects of the prevailing credit risk conditions in the European corporate
bond market. Following Georgoutsos and Migiakis (2013), the indices (iBoxx) of European corporate
bonds with a rating of BBB have been used in order to obtain the spread between their yields, since they
are commonly used as a proxy of the effects that changes in credit risk conditions in the European
corporate bond market exercise on European sovereign bond spreads. Furthermore, to capture the full
spectrum of credit quality in the euro area corporate market, we have also included the evolution of two
indices: the ITRAXXFIN and the ITRAXXNF. These are European 5-year CDS indices in the financial and
the non-financial sector respectively (the corresponding indices for the United States have been widely
used in the literature: see, for instance, Gilchrist et. al., 2013). Considering the ‘‘safe haven’’ status of the
German bund, we expect these two variables, which measure credit risk in the corporate bond market, to
be positively related to the spreads.
Moreover, one- and ten-year interest rate volatility indices for the Eurozone (EIRVIXs) based on the
implied volatility quotes of caps (floors) – one of the most liquid interest rate derivatives, constructed by
López and Navarro (2013) – have also been incorporated in the analysis. A positive sign is also expected
for these variables, since increased interest rate volatility is usually accompanied by an increase in yield
spread volatility. To account for the concerns for the stability of the euro we have used the indicator built
up by Klose and Weigert (2012) which reflects the market expectation of the probability that at least one
euro area country will have left the currency union by the end of 2013. Finally, to measure the joint default
risk in the euro area, we include the time-varying probability of two or more credit events (out of ten) over
a one-year horizon calculated by Lucas et al. (2013). A positive relationship is also expected between the
last two variables (which measure uncertainty and default risk in the euro area) and sovereign yield
spreads.
As mentioned, two supplementary variables have also been introduced in the model in order to assess
global market risk aversion. Firstly, following the empirical literature on sovereign bond spreads in
emerging markets, which shows that yields on US government bonds are the main determinants of
sovereign spreads, the spread between 10-year fixed interest rates on US swaps and the yield on 10-year

Institut de Recerca en Economia Aplicada Regional i Pública Document de Treball 2014/02 pàg. 11 Research Institute of Applied Economics Working Paper 2014/02 pag. 11
11
Moody’s Seasoned AAA US corporate bonds is also introduced as a proxy of international risk factors (see
Codogno et al., 2003 and Gómez-Puig, 2008). Secondly, we have included the Kansas City Financial Stress
Index built by Hakkio and Keeton (2009), which is a monthly measure of stress in the U.S. financial
system based on 11 financial market variables (a positive value indicates that financial stress is above the
long-run average, while a negative value signifies that financial stress is below the long-run average).
Therefore, a positive relationship is also expected between these two variables and sovereign spreads.
On the other hand, in order to measure the impact of fundamental variables (at both the local and the
regional level) on sovereign spreads behaviour, we use instruments that gauge not only each country’s
fiscal position, but the market liquidity in each country, its foreign debt, its potential rate of growth, and
the loss of competitiveness as well. The private sector level of indebtedness has been added in the analysis
of the effect of local fundamental variables and, finally, we have included foreign claims on sectoral private
debt and cross-border banking system linkages as measures of the degree of crisis transmission through
the financial system (see Gómez-Puig and Sosvilla-Rivero, 2013a).
Specifically, the variables used to measure the country’s fiscal position are the government debt-to-GDP
and the government deficit-to-GDP. These two variables have been widely used in the literature by other
authors (see, e.g., Bayoumi et al., 1995) and present an advantage over the credit rating in that they cannot
be considered ex post measures of fiscal sustainability. Since they are measures of credit risk, they should be
directly related with sovereign spreads increase.
Regarding the liquidity premium in each sovereign debt market, empirical papers examining the influence
of market liquidity in bond markets use a variety of measures to gauge its three main dimensions of
tightness, depth and resiliency. These measures include trading volume, bid-ask spreads, the outstanding
amount of debt securities, and the issue size of the specific bond. However, several studies have shown
that all liquidity measures are closely related to each other [Gómez-Puig (2006), Korajczyk and Sadka
(2008), and Gerlach et al. (2010) to name a few]. Therefore, we think that the overall outstanding volume
of sovereign debt – which is considered a measure of market depth because larger markets may present
lower information costs as their securities are likely to trade frequently, and a relatively large number of
investors may own or may have analysed their features – might be a good proxy of liquidity differences
between markets. Since liquidity premium decreases with market size, we would expect a negative effect of
this variable on sovereign spreads.
Besides, the current-account-balance-to-GDP ratio is the instrument used as a proxy of the foreign debt
and the net position of the country vis-à-vis the rest of the world. Note that this variable is defined as the
difference between exports and imports. Therefore an increase would signal an improvement in the net
Institut de Recerca en Economia Aplicada Regional i Pública Document de Treball 2014/02 pàg. 12 Research Institute of Applied Economics Working Paper 2014/02 pag. 12
12
position of the country towards the rest of the world, reducing sovereign spreads. The importance of this
variable has been underlined by the IMF (2010) and Barrios et al. (2009). In view of Mody (2009)’s
argument that countries’ sensitivity to the financial crisis is more pronounced the greater the loss of their
growth potential and competitiveness, we include instruments that measure these features. The
unemployment rate is the variable used to capture the country’s growth potential, whilst the Harmonized
Index of Consumer Prices monthly interannual rate of growth is the inflation rate measure we use as a
proxy of the appreciation of the real exchange rate and, thus, the country’s loss of competitiveness. An
increase in either unemployment or inflation represents a deterioration of growth potential and
competitiveness; so, it should augment sovereign spreads.
To assess the role of private debt in the euro area sovereign debt crisis, we also incorporate instruments
that capture the level of indebtedness of each country’s private sector in the analysis. To that end, we
make use of a unique dataset on private debt-to-GDP by sector in each EMU country. In particular, we
use three variables: banks’ debt-to-GDP, non-financial corporations’ debt-to-GDP, and households’ debt-
to-GDP, which have been constructed with data obtained from the European Central Bank Statistics.
Since high leverage levels in the private sector have a negative impact on the public sector’s sustainability,
an increase in these three variables would positively affect sovereign yield spreads.
Finally, according to certain authors [Bolton and Jeanne (2011) and Allen et al. (2011) among them], in a
scenario of increased international financial activity in the euro area, not only are public finance
imbalances key determinants of the probability that the sovereign debt crisis could spill over from one
country to another, but the transmission of the crisis through the banking system can also be a major
issue. As a result, in our analysis we also include variables that capture the important cross-border banking
system linkages in euro area countries. These linkages are measured using the consolidated claims on an
immediate borrower basis of Bank for International Settlements (BIS) reporting banks in the public,
banking and non-financial private sectors as a proportion of GDP. Moreover, we also explore the role of
consolidated claims on an immediate borrower basis provided by BIS by nationality of reporting banks as
a proportion of total foreign claims on each country. We expect that higher banking sector exposure and
cross-border banking system linkages will be associated with an increase in sovereign spreads7.
3. Granger-causality analysis
3. 1. Econometric strategy
7 The construction and evolution of sectoral private debt, foreign banks claims by sector and by nationality of reporting banks are explained in Gómez-Puig and Sosvilla-Rivero (2013a).

Institut de Recerca en Economia Aplicada Regional i Pública Document de Treball 2014/02 pàg. 13 Research Institute of Applied Economics Working Paper 2014/02 pag. 13
13
The concept of Granger-causality was introduced by Granger (1969) and Sims (1972) and is widely used to
ascertain the importance of the interaction between two series. The central notion is one of predictability
(Hoover, 2001): a variable Y is said to Granger-cause another variable X if past values of Y help predict
the current level of X better than past values of X alone, indicating that past values of Y have some
informational content that is not present in past values of X. Therefore, knowledge of the evolution of the
variable Y reduces the forecast errors of the variable X, suggesting that X does not evolve independently
of Y.
Tests of Granger causality typically use the same lags for all variables. This poses a potential problem,
since Granger-causality tests are sensitive to lag length8. In determining the optimal lag structure for each
variable, we follow Hsiao’s (1981) sequential method to test for causality, which combines Akaike’s final
predictive error (FPE, from now on) and the definition of Granger-causality9. Essentially, the FPE
criterion trades off the bias that arises from under-parameterisation of a model against a loss in efficiency
resulting from its over-parameterisation, removing the ambiguities of the conventional procedure.
Consider the following models,
t 01
m
i t i ti
X X� � ���
� � �� (1)
01 1
m n
t i t i j t j ti j
X X Y� � �� �� �
� � � �� � (2)
where Xt and Yt are stationary variables [i.e., they are I(0) variables]. The following steps are used to apply
Hsiao’s procedure for testing Granger-causality:
i) Treat Xt as a one-dimensional autoregressive process (1), and compute its FPE with the order of
lags m varying from 1 to m10. Choose the order which yields the smallest FPE, say m, and denote
the corresponding FPE as FPEX (m, 0).
ii) Treat Xt as a controlled variable with m number of lags, and treat Yt as a manipulated variable as in
(2). Compute again the FPE of (2) by varying the order of lags of Yt from 1 to n, and determine
the order which gives the smallest FPE, say n, and denote the corresponding FPE as FPEX
(m,n)11.
8 The general principle is that smaller lag lengths have smaller variance but run a risk of bias, while larger lags reduce the bias problem but may lead to inefficiency. 9 Thornton and Batten (1985) show that Akaike’s FPE criterion performs well relative to other statistical techniques. 10 FPEX(m,0) is computed using the formula: 1( ,0) · ,
1XT m SSRFPE mT m T� �
�� �
where T is the total number of observations and SSR is the sum of squared
residuals of OLS regression (1) 11 FPEX(m,n) is computed using the formula: 1( , ) · ,
1XT m n SSRFPE m nT m n T� � �
�� � �
where T is the total number of observations and SSR is the sum of
squared residuals of OLS regression (2)

Institut de Recerca en Economia Aplicada Regional i Pública Document de Treball 2014/02 pàg. 14 Research Institute of Applied Economics Working Paper 2014/02 pag. 14
14
iii) Compare FPEX (m, 0) with FPEX (m,n) [i.e., compare the smallest FPE in step (i) with the smallest
FPE in step (ii)]. If FPEX (m,0) > FPEX (m,n), then Yt is said to cause Xt. If FPEX (m,0) < FPEX
(m,n), then Xt is an independent process.
iv) Repeat steps i) to iii) for the Yt variable, treating Xt as the manipulated variable.
When Xt and Yt are not stationary variables, but are first-difference stationary [i.e., they are I(1) variables]
and cointegrated (see Dolado et al., 1990), it is possible to investigate the existence of Granger-causal
relationships from �Xt to �Yt and from �Yt to �Xt, using the following error correction models:
01
m
t i t i ti
X X� � ���
� � �� (3)
0 11 1
m n
t t i t i j t j ti j
X Z X Y� � � �� � �� �
� � � � �� � (4)
where Zt is the OLS residual of the cointegrating regression ( t tX Y� � � ), known as the error-
correction term. Note that, if Xt and Yt are I (1) variables, but they are not cointegrated, then � in (4) is
assumed to be equal to zero.
In both cases [i.e., Xt and Yt are I(1) variables, and they are or are not cointegrated], we can use Hsiao’s
sequential procedure substituting Xt with �Xt and Yt with �Yt in steps i) to iv), as well as substituting
expressions (1) and (2) with equations (3) and (4). Proceeding in this way, we ensure efficiency since the
system is congruent and encompassing (Hendry and Mizon, 1999).
3. 2. Data
The dependent variables in our empirical analysis are bond yield spreads, derived as differences between
10-year sovereign bond yields of EMU-founding countries and Greece and yields of the equivalent
German bund. Therefore, our sample contains both central (Austria, Belgium, Finland, France and the
Netherlands) and peripheral countries (Greece, Ireland, Italy, Portugal and Spain) 12.
We use daily data from 1 January 1999 to 31 December 2012 collected from Thomson Reuters
Datastream. Figure 1 plots the evolution of daily 10-year sovereign bond spreads for each country in our
sample. A simple look at this figure indicates the differences in the yield behaviour before and after the
outbreak of the Greek sovereign debt crisis at the end of 2009.
[Insert Figure 1 here]
12 Luxembourg is exempted from the present analysis, because of its very low level of outstanding sovereign bonds.

Institut de Recerca en Economia Aplicada Regional i Pública Document de Treball 2014/02 pàg. 15 Research Institute of Applied Economics Working Paper 2014/02 pag. 15
15
Specifically, it is striking that between the introduction of the euro in January 1999 and November 2009,
when it became clear that the Greek economy faced the bleak reality of being unable to finance its
sovereign debt, spreads on bonds of EMU countries moved in a narrow range with only slight
differentiation across countries. In fact, the stability and convergence of spreads was considered a
hallmark of successful financial integration inside the euro area (neither the subprime crisis nor the
Lehman Brothers collapse bit significantly into euro sovereign spreads).
Nevertheless, once the global financial crisis began to affect the real sector, the imbalances within euro
area countries were plain to see. Spreads, which had reached levels close to zero between the launch of the
euro and October 2009 (the average value of the 10-year yield spread against the German bund moved
between 10 and 47 basis points in the case of France and Greece respectively), have risen ever since.
Indeed, the risk premium on EMU government bonds increased strongly from November 2009, reflecting
investor perceptions of upcoming risks. Figure 1 shows that by late 2011 and beginning 2012 it reached
maximum levels of 4680 basis points in Greece, 1141 in Portugal, 1125 in Ireland, 635 in Spain and 550 in
Italy. This widespread increase in sovereign spreads meant that certain euro area Member States were
under enormous pressure to finance their debt, and funding costs rose significantly. This led to an increase
in rollover risk as debt had to be refinanced at unusually high costs and, in extreme cases, could not be
rolled over at all, which triggered the need for a rescue (see Caceres, 2010).
3.3. Preliminary results
As a first step, we tested the order of integration of the 10-year bond yields by means of the Augmented
Dickey-Fuller (ADF) tests. Then, following Cheung and Chinn (1997)’s suggestion, we confirmed the
results using the Kwiatkowski et al. (1992) (KPSS) tests, where the null is a stationary process against the
alternative of a unit root. The results, not shown here to save space but available from the authors upon
request, decisively reject the null hypothesis of non-stationarity in the first regressions. They do not reject
the null hypothesis of stationarity in first differences, but strongly reject it in levels, in the second ones. So,
they suggest that both variables can be treated as first-difference stationary.
As a second step, we tested for cointegration between each of the 45 pair combinations13 of EMU yields
using Johansen (1991, 1995)’s approach. The results suggest14 that only for the Greece-Ireland and
Greece-Portugal cases does the trace test indicate the existence of one cointegrating equation at (at least)
13 Recall that the number of possible pairs between our sample of ten EMU yield spreads with respect to Germany is given by the following formula
! 10! 45.!( )! 2!(10 2)!n
r n r� �
� �
14 Again, the results are not presented in the interests of space, but are available from the authors upon request.

Institut de Recerca en Economia Aplicada Regional i Pública Document de Treball 2014/02 pàg. 16 Research Institute of Applied Economics Working Paper 2014/02 pag. 16
16
the 0.05 level. Therefore, for these two pairs we test for Granger-causality in first differences of the
variables, with an error-correction term added [i. e., equations (3) and (4)], whereas for the remaining
cases, we test for Granger-causality in first differences of the variables, with no error-correction term
added [i. e., equations (3) and (4) with �=0]
3.4. Empirical results
The resulting FPE statistics for the whole sample suggest bidirectional Granger-causality in almost all
cases15. However, there are some exceptions. We do not find unidirectional Granger-causality in the
relationships running from Austria to Ireland, from Finland to France, from France to Ireland and from
Greece to Ireland. Nor do we find bidirectional Granger-causality relationships between Austria and
Portugal, or between Finland and Greece. However, in order to assess the dynamic Granger-causality
between the 90 possible EMU yield spreads relationships, we carried out 309,500 rolling regressions using
a window of 200 observations16. In each estimation, we apply Hsiao (1981)’s sequential procedure outlined
above to determine the optimum FPE (m, 0) and FPE (m, n) statistics in each case. We find sub-periods
of Granger-causality in all pair-wise relationships, even for those relationships where we found rejection
when performing the tests for the whole sample.
After examining the time-varying nature of causal relationships, we proceed further by identifying sub-
periods of significant increase/decrease in Granger-causality in order to identify the factors that may have
been behind them. To this end, we identify episodes of Granger-causality intensification such as those in
which the time-varying Granger-causality indicator is greater than its average plus two standard errors17.
Therefore, we look for episodes where there is evidence of an enhancement in the information content of
the yield spread series that significantly improves the explanatory power of the future evolution of the
other yield spread series, suggesting a strengthening of their interdependence. Likewise, we identify
episodes of reduction in the interconnection between the series under study as those in which the time-
varying Granger-causality indicator is lower than its average minus two standard errors. Hence, in this
latter case, we search for episodes where there is evidence that the information content of the yield spread
series significantly reduces the explanatory power of future evolution of the other yield spread series18. We
15 These results are also available from the authors upon request. The results were confirmed using both Wald statistics to test the joint hypothesis
1 2ˆ ˆ ˆ... 0n � � � � in equations (2) or (4) and the Williams-Kloot test for forecasting accuracy (Williams, 1959). 16 To the best of our knowledge, there is no statistical method to set the optimal window size. The chosen value of 200 observations is representative of the one used in practice and seems appropriate for our empirical application since it represents 6.36% of the sample. We have also used a value of 100 observations. The results (not shown here to save space but available from the authors upon request) render the same qualitative conclusions as when 200 observations were used.17 We perform formal tests to evaluate whether the series have the same mean during the detected episodes and the rest of the observations. The results of these tests (not shown here, but available from the authors upon request) strongly reject the null hypothesis of equal mean across sub-samples, and provide additional support for the presence of increased Granger-causality. 18 Indeed, the manipulated variable in equations (2) or (4) not only does not contribute to a better prediction of the controlled variable, but its inclusion actually renders the prediction worse, signaling that its information content is not relevant for the future evolution of the manipulated variable.
Institut de Recerca en Economia Aplicada Regional i Pública Document de Treball 2014/02 pàg. 17 Research Institute of Applied Economics Working Paper 2014/02 pag. 17
17
associate episodes of Granger-causality intensification with episodes of contagion, and episodes of
causality reduction with episodes of immunisation19.
The graphs in Figures 2 suggest that these episodes are concentrated around the first year of the existence
of the EMU in 1999, the introduction of euro coins and banknotes in 2002, and the global financial crisis
of the late 2000s. Specifically, Figures 2a to 2e represent the time-varying evolution of these
intensification/reduction episodes within all EMU countries (Figure 2a), within peripheral countries
(Figure 2b), from peripheral to central countries (Figure 2c), within central countries (Figure 2d), and from
central to peripheral countries (Figure 2e). All in all, contagion episodes more than triple immunisation
ones and register a significant increase coinciding with the recent crisis in sovereign debt markets from
2009 onwards, providing evidence of a reinforcement of the interconnection between debt markets. It is
also notable that whilst contagion episodes are more frequent when the triggering countries in the causal
relationships are peripheral (57% of the total, see Figures 2b and 2c), immunisation episodes are more
usual when central countries are the triggers (65% of the total, see Figures 2d and 2e).
[Insert Figures 2 here]
4. Determinants of episodes of Granger-causality intensification/reduction
4.1. Econometric methodology
Once the episodes of intensification/reduction have been detected, we use ordered logit models to analyse
their determinants. We define a new dependent variable (y) that takes the value 1 if we have detected an
episode of Granger-causality reduction, 2 if there is no evidence of reduction or intensification (i. e., a
“normal” relationship), and 3 if we have found a episode of intensification.
The ordered logit model is based on a continuous latent variable specified as:
* 'it it ity x u�� � (5)
where *ity measures the degree of interconnection between EMU yield spreads, itx is a vector of
explanatory variables20, � is an unknown parameter vector and uit is the error term, which is assumed to
follow a standard logistic distribution. In (5) the index i (i=1, ...., N) denotes the country pair and the
index t (t=1, ...., T) indicates the period21. Unfortunately, *ity is an unobserved variable. Let us assume that
ity is the observed discrete variable that reflects the different degrees of interrelationship for EMU country
19 Using the framework for grading the strength of the Granger-causality relationship proposed by Atukeren (2005) we obtain the same classification of episodes of intensification and reduction. Atukeren (2005)’s framework uses Postkitt and Tremayne (1987)’s posterior odds ratio test and Jeffreys (1961)’s Bayesian concept of grades of evidence. 20 The regressors are listed in Appendix A. No intercept is included. 21 As we will see in Section 4.2, in our case N=90 (the number of pair-wise relationships between sovereign bond yield spreads) and T=168 (monthly observations for 14 years).

Institut de Recerca en Economia Aplicada Regional i Pública Document de Treball 2014/02 pàg. 18 Research Institute of Applied Economics Working Paper 2014/02 pag. 18
18
pair i at time t. The relationship between the latent variable and the observed discrete one will be obtained
from the model according to
ity =1 if *1,ity ��� � � i=1, ...., N
ity =2 if *1 2 ,ity� �� � i=1, ...., N
ity =3 if *2 ,ity� � � �� i=1, ...., N
where 1� and 2� denote the threshold points that must satisfy that 1� < 2.� Then
1
1Pr( 1)1 exp( ' )it
it
yx� �
� �� �
2 1
1 1Pr( 2)1 exp( ' ) 1 exp( ' )it
it it
yx x� � � �
� � �� � � �
2
1Pr( 3) 11 exp( ' )it
it
yx� �
� � �� �
4.2. Empirical evidence
Given that the instruments used as independent variables have been constructed with a monthly
frequency, we also need to compute the dependent variable in the ordered logit models on a monthly
basis. We calculate the monthly data by assigning a value of 1 if at least for half of the month there is
evidence of reduction in the interconnection between yield spreads, a value of 3 if at least for half of the
month there is evidence of Granger-causality intensification, and a value of 2 if at least for half of the
month there is no evidence of either intensification or reduction.
We follow the general-to-specific approach (Hendry, 1995): our empirical analysis starts with a general
unrestricted statistical model including all explanatory variables to capture the essential characteristics of
the underlying dataset, testing it down by eliminating statistically insignificant variables, and checking the
validity of the reductions at each stage to ensure congruence of the finally selected model22. We have also
considered the possibility of both individual-specific effects (in each pair-wise relationship) and time-
specific effects, by incorporating dummy variables, testing the joint significance of these dummies
separately and once they are taken together. In Table 1 we report the final results of the ordered logit
models estimated by maximum likelihood for five groups of countries: the first correspond to
intensification/reduction causal relationship episodes within pairs of all EMU countries, the second within
22 Note that this commonly used approach is a process driven by the data. We have also explored the possibility of adopting an alternative theory-driven approach using a specific-to-general modeling process by estimating equation (5) with each potential category of determinants having only one representative variable, leading to a multiplicity of models by the successive incorporation of additional variables. Interestingly, this alternative approach that explicitly acknowledges that there may be several models that are generated by the same data set (Hendry, 1995, 501) renders final specifications that are very close to the one obtained from the general-to-specific approach, giving further support to our results.

Institut de Recerca en Economia Aplicada Regional i Pública Document de Treball 2014/02 pàg. 19 Research Institute of Applied Economics Working Paper 2014/02 pag. 19
19
pairs of peripheral countries, the third from peripheral to central countries, the fourth within central
countries, and lastly, the fifth from central to peripheral countries23. The z-statistics in that table are based
on robust standard errors computed using the Huber-White quasi-maximum likelihood method. As can be
seen, all the estimated coefficients are significant at the 1% level, and the individual and time dummies are
jointly significant for the relationships between yield spreads in central countries, in peripheral countries
and in those from peripheral to central countries, while for the relationships within all country pairs and
those from central to peripheral countries we only find that the individual dummies are statistically
significant.
The sign of the regression parameters can be immediately interpreted as determining whether the latent
variable increases with the regressor. As can be seen, most of the estimated coefficients are positive,
suggesting that an increase in the variable necessarily decreases the probability of being in the lowest
category ( ity =1, i. e., immunisation) and increases the probability of being in the highest category ( ity =3,
i. e., contagion). The converse is true for the negative sign coefficients associated with the consumer
confidence indicator, the net position towards the rest of the world, and the market liquidity24.
The empirical evidence presented in Table 1 does not support the occurrence of either “fundamentals-
based” or “pure” contagion in euro area countries, but it suggests that a mixture of the two might have
taken place. Specifically, when examining all pair-wise relationships, we find that not only some of the
variables which capture both local and regional market sentiment are statistically significant, but that some
local macroeconomic variables together with the instrument which gauges financial linkages are also
relevant.
These findings are in line with the literature that states that the two types of contagion are not necessary
mutually exclusive (see Dungey and Gajurel, 2013), and also with the results of Caporin et al. (2013), who,
using a Bayesian quantile regression approach to measure contagion, obtain that there is no change in the
intensity of the transmission of shocks between European countries during the onset of the sovereign
debt crisis. Accordingly, the common shift observed in spreads might be the outcome of the
“interdependence” (or “fundamentals-based” contagion) that has always been present in the markets.
Indeed, recent European events have encouraged a new discussion of contagion. Unlike previous crises, in
which the country responsible for spreading the shock was relatively clear, in the euro area sovereign debt
23 All estimated threshold parameters differ significantly from each other, justifying our use of the ordered logit model since it indicates that the three categories should not be collapsed into two categories. 24 Recall that an increase in consumer confidence may lead to a rise in investor confidence, so it seems reasonable to expect a negative relationship between it and the probability of occurrence of a contagion episode. Regarding the current-account-balance-to-GDP ratio, which is the instrument used as a proxy of the net position of the country towards the rest of the world, since this variable is defined as the difference between exports and imports an increase would have a negative effect on the probability of contagion. Finally, given that our measure of market liquidity is the overall amount of outstanding debt and that liquidity premium decreases with market size, one would expect a negative impact between this variable and contagion.

Institut de Recerca en Economia Aplicada Regional i Pública Document de Treball 2014/02 pàg. 20 Research Institute of Applied Economics Working Paper 2014/02 pag. 20
20
crisis several peripheral countries entered a fiscal crisis at roughly the same time. Indeed, when a group of
countries share an exchange rate agreement (a common currency in the case of the euro area countries),
crises tend to be clustered. It seems reasonable that, since the economic fundamentals of EMU countries
are interconnected by their cross-border flows of goods, services, and capital, other variables beyond
herding behaviour or sudden shifts in market confidence might also be at the origin of crisis propagation.
Nevertheless, we observe some disparities when analysing crisis transmission from the different groups of
countries, peripheral or central. In the first case, the empirical evidence shows that, with the sole exception
of Klose and Weigert (2012)’s index of euro instability, the variables that are significant are idiosyncratic
(either shifts in market sentiment or in macrofundamentals). However in the second, regional market
sentiment variables are much more relevant. These results suggest that, even though fundamental reasons
are still present, transmission of the crisis when peripheral countries are the triggers is closer to the
definition of “pure contagion” than when central countries are the triggers. An abnormal increase in the
intensity of causal relationships from peripheral to other EMU countries (both peripheral and central) is
mainly explained by idiosyncratic variables, although spillover effects cannot be attributed to herding
behaviour alone. Conversely, transmission of the crisis from central countries is not only affected by local
variables (market sentiment or fundamentals), but also by shifts in common regional variables. So, in the
latter case, the abnormal increase in the intensity of causal relationships can clearly be identified as
“fundamentals-based” contagion.
Looking across the columns25, we see that, with regard to the variables measuring local market sentiment,
we find a positive and significant effect for the stock-market volatility, the index of the fiscal stance and
the credit rating (as expected, the consumer confidence indicator presents a negative sign). As for the local
macrofundamentals, our results suggest a negative impact on contagion for both the net position towards
the rest of the world and the market liquidity variable, and a positive effect for the country growth
potential (proxied by the unemployment rate), the competitiveness (captured by the inflation rate) and the
fiscal position (measured by the debt/GDP or the deficit/GDP ratios). In relation to indicators of
regional market sentiment, we detect that the credit spread in European corporate bond market plays a
decisive role in contagion episodes triggered by central countries, while the European 5-year CDS index in
the financial and non-financial sectors (ITRAXXFIN and ITRAXXNF) are relevant when examining all the
pair relations and those from central countries. The variable euro instability which reflects the market
expectation of the probability that at least one euro area country would have left the currency union at the
end of 2013 is found to be positive and statistically significant in all cases, except for pairs relating central
to peripheral countries. As regards the potential role of financial linkages in the contagion/immunisation
25 We summarise the results by pointing out the main regularities. The reader is asked to browse through Table 1 to find evidence for particular group of countries of her/his special interest.

Institut de Recerca en Economia Aplicada Regional i Pública Document de Treball 2014/02 pàg. 21 Research Institute of Applied Economics Working Paper 2014/02 pag. 21
21
episodes, we find a significant effect for the variable measuring cross-border banking linkages when
analysing the whole sample, supporting the close interconnection between the banking and the sovereign
sectors.
Interestingly, none of variables measuring global market sentiment or regional macroeconomic variables
was found to be statistically significant. With respect to the latter result, the fact that the dependent
variable used in the analysis is the yield spread over the German bund might have cancelled out all
common regional macroeconomic effects that might have adversely affected the economic fundamentals
of several economies simultaneously, since they may have been captured by the evolution of the German
yield. As for the global market sentiment, the result suggests that shifts in local or regional rather than
global market sentiment are behind euro area debt crisis transmission. These results are in line with
Gómez-Puig and Sosvilla-Rivero (2013b) who explore the breakpoints in EMU yield evolution and find
that not only are half of the breakpoints directly connected to the euro sovereign debt crisis, but that 63%
of them occur after November 2009 (once Papandreou’s government announced the Greece’s distressed
debt position). Additionally, the absence of global market sentiment in the final regressions could also
suggest that EMU has effectively acted as a true system, in which common conditions have had priority
over global ones, and where only real differences (at least as perceived by market participants) could have
explained the dissimilar evolution in sovereign yield spreads.
Finally, in Table 1 we also report the McFadden pseudo-R2 statistic as a measure of goodness of the fit. As
can be seen, it ranges from 0.3012 to 0.4123, suggesting the relative success of the estimated ordered logit
regression models in predicting the values of the dependent variable within the sample when set against
previous work with these models. Note that �2 and log likelihood diagnostic statistics are also satisfactory.
As a further test to evaluate how well our estimated models account for the observations, in Table 1 we
also present the proportion of outcomes correctly predicted by the estimated models, denoted as Count
R2. As can be seen, it ranges from 0.6015 to 0.7005, which can be considered a fairly good result.
5. Concluding remarks
In this paper, we have empirically investigated whether the transmission of the recent crisis in euro area
sovereign debt markets was due to fundamentals-based or pure contagion. To this end, we have examined
the behaviour of EMU sovereign bond yield spreads with respect to the German bund for a sample of
both central (Austria, Belgium, Finland, France and the Netherlands) and peripheral countries (Greece,
Ireland, Italy, Portugal and Spain) from January 1999 to December 2012.
Institut de Recerca en Economia Aplicada Regional i Pública Document de Treball 2014/02 pàg. 22 Research Institute of Applied Economics Working Paper 2014/02 pag. 22
22
Using daily data, we first applied a dynamic approach to analyse the evolution of the degree of Granger-
causality within the 90 pairs of sovereign bond yield spreads in our sample. We aimed to detect episodes
of significantly increased causality between them (which we associate with contagion) as well as episodes
of significantly reduced interconnection (which we associate with immunisation).
We then used an ordered logit model with monthly data to assess whether a set of variables proposed in
the theoretical and empirical literature measuring market sentiment (either global, regional and local), as
well as macrofundamentals (both regional and local) and financial linkages have a significant influence in
the occurrence of the detected episodes. The findings underline the importance of both variables proxying
market sentiment and macrofundamentals in determining contagion and immunisation outcomes.
Therefore, sovereign risk premium increase in the euro area during the European sovereign crisis was not
due only to deteriorated debt sustainability in member countries; nor can it be explained only by herding
behaviour or sudden shifts in market confidence and expectations. Nevertheless, our analysis highlights
the relative importance of market participants’ perceptions in episodes triggered by peripheral countries,
while macroeconomic fundamentals seemed to play a major role in episodes where central countries are
the triggers.
Our results may have some practical implications for investors and policymakers, and may provide
theoretical insights for academic scholars interested in the behaviour of sovereign debt markets. Our
methodology can be used as a tool to provide information regarding the factors underlying crisis
transmission and related risks.

Institut de Recerca en Economia Aplicada Regional i Pública Document de Treball 2014/02 pàg. 23 Research Institute of Applied Economics Working Paper 2014/02 pag. 23
23
Appendix A: Definition of the explanatory variables in the ordered logistic regressions and data sources A.1. Variables that measure local market sentiment.
Variable Description Source
Stock Returns Differences of logged stock indices prices of the last and the
first day of the month for each country.
Datastream
Stock Volatility Monthly standard deviation of the daily returns of each
country’s stock market general index
Datastream Index of Economic Policy Uncertainty
(Germany, France, Italy, and Spain) This index draws on the frequency of newspaper references to
policy uncertainty and was created by Baker et al., 2013.
www.policyuncertainty.com
Index of the Fiscal stance
This indicator compares a target level of the debt-GDP ratio at a given point in the future with a forecast based on the
government budget constraint. It was created by Polito and Wickens (2011, 2012). Monthly data were linearly interpolated
from yearly observations for the available data: 1999-2011
Provided by the authors.
Consumer Confidence Indicator
This index is built up by the European Commission which conducts regular harmonised surveys to consumers in each
country.
European Commission (DG
ECFIN)
Rating Credit rating scale built up from Fitch, Moody’s, S&P ratings
for each country.
Bloomberg A.2. Variables that measure regional market sentiment.
Variable Description Source
Stock Returns Differences of logged stock indices (Eurostoxx-50) prices of
the last and the first day of the month for each country.
Yahoo-finance Stock Volatility (VSTOXX) Eurostoxx-50 implied stock market volatility index. Monthly
average of daily data. www.stoxx.com
Index of Economic Policy Uncertainty
(Europe) Baker et al., 2013. www.policyuncertainty.com
Index of the Fiscal stance
(Europe) Polito and Wickens (2011, 2012). Monthly data were linearly interpolated from yearly observations for the available data:
1999-2011.
Provided by the authors.
Consumer Confidence Indicator (Eurozone)
European Commission European Commission (DG ECFIN)
Credit Spread
Difference between the yields of the iBoxx indices containing BBB-rated European corporate bonds against the yields of the respective iBoxx index of AAA-rated European
corporate bonds. Monthly average of daily data.
Datastream
ITRAXXFIN ITRAXXNF
European 5-year CDS index in the financial and non-financial sectors: 2010:9-2012:12.
Monthly average of daily data.
Bloomberg
EIRVIX-1Y EIRVIX-10Y
1-year and 10-year interest rate volatility index for the Eurozone based on the implied volatility quotes of caps (floors). This index was created by López and Navarro
(2013) for the period 2004:1-2012:4.
Provided by the authors.
Euro Instability
Market expectation of the probability that at least one Euro area country will have left the currency union at the end of 2013, built up by Klose and Weigert (2012) for the period
2010:8-2012:8. Monthly average of daily data.
Provided by the authors.
Euro area default risk
Probability of two or more credit events, calculated by Lucas et. al. (2013): 2008:1-2012:12
Provided by the authors.
A.3. Variables that measure global market sentiment. Variable Description Source
Stock Returns Differences of logged stock indices (S&P 500) prices of the last and the first day of the month.
Datastream
Stock Volatility (VIX)
Chicago Board Options Exchange Market Volatility Index. (Implied volatility of S&P 500 index options),
Monthly average of daily data.
Yahoo-Finance
Index of Economic Policy Uncertainty (United States)
Baker et al., 2013. www.policyuncertainty.com
Index of the Fiscal stance
(United States)
Polito and Wickens (2011, 2012). Monthly data were linearly interpolated from yearly observations for the
available data: 1999-2011
Provided by the authors.
Global Risk Aversion
The spread between 10-year fixed interest rates on US swaps and the yield on 10-year Moody’s Seasoned AAA
US corporate bonds. Monthly average of daily data.
Datastream
Kansas City Financial Stress Index
This measure is based on 11 financial market variables, each of which captures one or more key features of
financial stress. It was created by Hakkio and Keeton (2009)
http://www.kansascityfed.org

Institut de Recerca en Economia Aplicada Regional i Pública Document de Treball 2014/02 pàg. 24 Research Institute of Applied Economics Working Paper 2014/02 pag. 24
24
A.4. Variables that measure local macrofundamentals. Variable Description Source
Net position vis-à-vis the rest of the world
Current-account-balance-to-GDP Monthly data are linearly interpolated from quarterly
observations.
OECD
Growth potential Unemployment rate Eurostat Competitiveness Inflation rate. HICP monthly interannual rate of growth Eurostat
Fiscal Position
Government deficit-to-GDP and Government debt-to-GDP. Monthly data are linearly interpolated from quarterly
observations.
Eurostat
Market liquidity
Domestic Debt Securities. Public Sector Amounts Outstanding (billions of US dollars)
Monthly data are linearly interpolated from quarterly observations.
BIS Debt securities statistics. Table 18
Bank’s debt
Banks’ debt-to-GDP. Monthly data are linearly interpolated from quarterly
observations for the GDP.
ECB’s Monetary Financial Institutions balance sheets and own estimates.
GDP has been obtained from Eurostat
Non-financial corporation’s debt
Non-financial corporations’ debt-to-GDP. Monthly data are linearly interpolated from quarterly
observations for the GDP.
ECB’s Monetary Financial Institutions balance sheets and own estimates.
GDP has been obtained from Eurostat
Household’s debt Households’ debt-to-GDP of country.
Monthly data are linearly interpolated from quarterly observations for the GDP.
ECB’s Monetary Financial Institutions balance sheets and own estimates.
GDP has been obtained from Eurostat A.5. Variables that measure regional macrofundamentals.
Variable Description Source Net position vis-à-vis the rest of the world.
Current-account-balance-to-GDP Monthly data are linearly interpolated from quarterly
observations.
OECD
Growth potential Unemployment rate Eurostat Competitiveness Inflation rate. HICP monthly interannual rate of growth Eurostat
Fiscal Position
Government deficit-to-GDP and Government debt-to-GDP. Monthly data are linearly interpolated from quarterly
observations.
Eurostat
Market liquidity
Domestic Debt Securities. Public Sector Amounts Outstanding (billions of US dollars)
Monthly data are linearly interpolated from quarterly observations.
BIS Debt securities statistics. Table 18
A.6. Variables that measure financial linkages. Variable Description Source
Foreign claims on bank debt
Foreign bank claims on banks debt-to-GDP. Monthly data are linearly interpolated from quarterly
observations.
BIS Consolidated banking statistics. Table 9C. GDP has been obtained from the
OECD.
Foreign claims on public debt Foreign bank claims on government debt-to-GDP.
Monthly data are linearly interpolated from quarterly observations.
BIS Consolidated banking statistics. Table 9C. GDP has been obtained from the
OECD Foreign claims on non-financial
private debt. Foreign bank claims on non-financial private debt-
to-GDP. Monthly data are linearly interpolated from quarterly observations.
BIS Consolidated banking statistics. Table 9C. GDP has been obtained from the
OECD. Cross-border banking linkages
Percentage of the total foreign claims on country
XX held by country YY's banks BIS Consolidated banking statistics. Table
9D and own estimates.

Institut de Recerca en Economia Aplicada Regional i Pública Document de Treball 2014/02 pàg. 25 Research Institute of Applied Economics Working Paper 2014/02 pag. 25
25
References Ades, A., Chua, H.B., 1993. Regional instability and economic growth: Thy neigbor’s curse. Center Discussion Paper 704,. Economic Growth Center, Yale University. Aizenman, J., Binici, M., Hutchison, M.M. 2013. Credit ratings and the pricing of sovereign debt during the euro crisis. Working Papers 19125, National Bureau of Economic Research. Akaike, H., 1974. A new look at the statistical model identification. IEEE Transactions on Automatic Control 19, 716–723 Allen, F.; Beck; T., Carletti; E., Lane; P. L., Schoenmaker, D., Wagner, W., 2011. Cross-border Banking in Europe: Implications for Financial Stability and Macroeconomic Policies. Centre for Economic Policy Research, London. Afonso, A., Arghyrou, M.G., Kontonikas, A., 2012. The determinants of sovereign bond yield spreads in the EMU. Working Paper 36, Department of Economics, Technical University of Lisbon. Akerlof, G. A. , Shiller, R. J. , 2009. Animal Spirits. Princeton University Press, Princeton. Atukeren, E., 2005. Measuring the strength of cointegration and Granger-causality, Applied Economics Letters 37, 1607-1614. Bae, K. H., Karolyi, G. A, Stulz, R. M., 2003. A new approach to measuring financial contagion. Review of Financial Studies 16, 717–763. Baker, S.R., Bloom, N., Davis, S.J., 2013. Measuring economic policy uncertainty. Working Paper No. 13-02, Booth School of Business, The University of Chicago. Banerjee, A., Dolado, J., Galbraith, J., Hendry, D., 1993. Cointegration, Error Correction and the Econometric Analysis of Nonstationary Series. Oxford University Press, Oxford. Barrios, S.; Iversen; P., Lewandowska M., Setze, R., 2009. Determinants of intra-euro area government bond spreads during the financial crisis. Economic Paper 388, European Commission. Battistini, N., Pagano, M. Simonelli, S. 2013. Systemic risk, sovereign risk and bank exposures in the euro crisis. Working Paper 345, Centre for Studies in Economics and Finance. Bayoumi, T., Goldstein, M., Woglom, G., 1995. Do credit markets discipline sovereign borrowers? Evidence from the US States. Journal of Money, Credit and Banking 27, 1046-1059. Beirne, J., Fratzscher, M., 2013. The pricing of sovereign risk and contagion during the European sovereign debt crisis. Journal of International Money and Finance 34, 60-82. Bekaert, G., Ehrmann, M., Fratzscher, M., Mehl, A. J., 2011. Global crises and equity market contagion. Working Paper 17121, National Bureau of Economic Research. Blanco, R., 2001. The Euro-area government securities markets. Recent developments and implications for market functioning. Working Paper 0120, Banco de España. Bolton, P., Jeanne, O., 2011. Sovereign default risk and bank fragility in financially integrated economies. Discussion Paper 8368, Centre for Economic Policy Research. Calvo, S., Reinhart, C., 1996. Capital flows to Latin America: is there evidence of contagion effects. In: Calvo, G.A., Golstein, M., Hochreitter, E. (Eds.), Private Capital Flows to Emerging Markets, Institute for International Economics, Washington DC. Caporin, M., Pelizzon, L., Ravazzolo, F., Rigobon, R., 2013. Measuring sovereign contagion in Europe. Working Paper 18741, National Bureau of Economic Research. Cheung, Y.-W., Chinn, M. D., 1997. Further investigation of the uncertain unit root in GNP. Journal of Business and Economic Statistics 15, 68-73. Claessens, S., Dornbusch, R., Park, Y.C., 2001. Contagion: Why crises spread and how this can be stopped. In: Claessens, S., Forbes, K. (Eds.), International Financial Contagion. Kluwer Academic Publishers, Boston, pp. 19- 42. Codogno, L., Favero, C., Missale, A., 2003. Yield spreads on EMU government bonds. Economic Policy 18, 503-532. Constâncio, V., 2012.Contagion and the European debt crisis. Financial Stability Review 16, 109-119. Corsetti, G., Pericoli, M. Sbracia, M., 2005. Some contagion, some interdependence: More pitfalls in tests of financial contagion. Journal of International Money and Finance 24, 1177-1199.

Institut de Recerca en Economia Aplicada Regional i Pública Document de Treball 2014/02 pàg. 26 Research Institute of Applied Economics Working Paper 2014/02 pag. 26
26
Dolado, J. J., Jenkinson, T., Sosvilla-Rivero, S., 1990. Cointegration and unit roots. Journal of Economic Surveys 4, 149-173. Dungey, M., Fry, R., Gonzalez-Hermosillo, B., Martin, V., 2005. Empirical modelling of contagion: a review of methodologies. Quantitative Finance 5, 9–24. Dungey, M., Gajurel, D., 2013. Equity market contagion during the global financial crisis: Evidence from the World’s eight largest economies. Working Paper 15, UTAS School of Economics and Finance. Eichengreen, B., Rose, A. K., Wyplosz, C., 1996. Contagious currency crises: First tests. Scandinavian Journal of Economics 98, 463-484. Elliott, G., Thomas, J.R., Stock, J.H., 1996. Efficient tests for an autoregressive unit root. Econometrica 64, 813–836. Forbes, K., 2013. The big C: Identifying and mitigating contagion. In: The Changing Policy Landscape. Economic Simposium Conference Procedings. Federal Reserve Bank of Kansas City, 23-87. Forbes, K., Rigobon, R., 2002. No contagion, only interdependence: Measuring stock market comovements. Journal of Finance 57, 2223-2261. Gerlach, S., Schulz, A., Wolff, G. B., 2010. Banking and sovereign risk in the euro area. Discussion Paper 1, Deutsche Bundesbank. Gilchrist, S., Zakrajsek, E., 2013. The impact of the Federal Reserve’s large-scale asset purchase programs on corporate credit risk. Working Paper 19337, National Bureau of Economic Research. Gómez-Puig, M., 2006. Size matters for liquidity: Evidence from EMU sovereign yield spreads. Economics Letters 90, 156-162. Gómez-Puig, M., 2008. Monetary integration and the cost of borrowing. Journal of International Money and Finance 27, 455-479. Gómez-Puig, M,. Sosvilla-Rivero, S., 2013a. Granger-causality in peripheral EMU public debt markets: A dynamic Approach. Journal of Banking and Finance 37, 4627-4649. Gómez-Puig, M,. Sosvilla-Rivero, S., 2013b. Causality and contagion in EMU sovereign debt markets. Mimeo. Georgoutsos, D.A., Migiakis, P.M., 2013. Heterogeneity of the determinants of euro-area sovereign bond spreads: What does it tell us about financial stability? Journal of Banking and Finance 37, 4650-4664. Granger, C. W. J., 1969. Investigating causal relations by econometric models and cross-spectral methods. Econometrica 37, 24-36. Hakkio, C.S., Keeton, W. R., 2009. Financial stress: What is it, how can it be measured, and why does it matter? Federal Reserve Bank of Kansas City Economic Review, second quarter, 5-50. Hendry, D.F., 1995. Dynamic Econometrics. Oxford University Press, Oxford. Hendry, D. F., Mizon, G. E., 1999. The pervasiveness of Granger causality in Econometrics. In Engle, R. F., White, H. (Eds.) Cointegration, Causality, and Forecasting. A Festsschrift in Honour of Clive W. J. Granger, Oxford University Press, Oxford. Hoover, K. D., 2001. Causality in Macroeconomics. Cambridge University Press, Cambridge. Hsiao, C., 1981. Autoregressive modelling and money-income causality detection. Journal of Monetary Economics 7, 85–106. International Monetary Fund, 2010. Global Financial Stability Report, April, International Monetary Fund, Washington, D. C. Jeffreys, H., 1961. Theory of Probability. 3rd edition. Oxford University Press, London. Johansen, S., 1991. Estimation and hypothesis testing of cointegration vectors in Gaussian vector autoregressive models. Econometrica 59, 1551-1580. Johansen, S., 1994. The role of the constant and linear terms in cointegration analysis of nonstationary variables. Econometric Reviews 13, 205-229. Johansen, S., 1995. Likelihood-based Inference in Cointegrated Vector Autoregressive Models. Oxford University Press, Oxford. Kalbaska, A. & Gatkowski, M., 2012. Eurozone sovereign contagion: Evidence from the CDS market (2005–2010). Journal of Economic Behaviour and Organization 83, 657-673. Kaminsky, G. L., Reinhart, C. M., 2000. On crises, contagion, and confusion. Journal of International Economics, 51, 145-168.

Institut de Recerca en Economia Aplicada Regional i Pública Document de Treball 2014/02 pàg. 27 Research Institute of Applied Economics Working Paper 2014/02 pag. 27
27
Klose, J. & Weigert, B., 2012. Determinants of sovereign yield spreads during the Euro-crisis–Fundamental factors versus systemic risk. Working Paper 07/2012, German Council of Economic Experts. Korajczyk, R., Sadka, R., 2008. Pricing the commonality across alternative measures of liquidity. Journal of Financial Economics 87, 45–72. Kwiatkowski, D., Phillips, P.C.B., Schmidt, P., Shin, P., 1992. Testing the null hypothesis of stationarity against the alternative of a unit root. Journal of Econometrics 54, 159–178. López, R., Navarro, E., 2013. Interest rate and stock return volatility indices for the Eurozone. Investors' gauges of fear during the recent financial crisis. Applied Financial Economics, 23, 1419-1432. Lucas, A., Schwaab, B., Zhang, X., 2013. Conditional euro area sovereign default risk. Working Paper 269, Sveriges Riksbank. Lux, T., 1995. Herd behaviour, bubbles and crashes. The Economic Journal 105, 881-896. MacKinnon, J.G., 1996. Numerical distribution functions for unit root and cointegration tests. Journal of Applied Econometrics 11, 601–618. MacKinnon, J.G., Haug, A.A., Michelis, L., 1999. Numerical distribution functions of likelihood ratio tests for cointegration. Journal of Applied Econometrics 14, 563–577. Masson, P., 1999. Contagion: Macroeconomic models with multiple equilibria. Journal of International Money and Finance 18, 587–602. Metieu, N., 2012. Sovereign risk contagion in the eurozone. Economics Letters 117, 35-38. Mink, M., De Haan, J., 2013. Contagion during the Greek sovereign debt crisis. Journal of International Money and Finance 34, 102-113. Mody, A., 2009. From bear sterns to Anglo Irish: How Eurozone sovereign spreads related to financial sector vulnerability. Working Paper 09/108, International Monetary Fund. Mondria, J., Quintana-Domeque, C., 2013. Financial contagion and attention allocation. The Economic Journal 123, 429-454. Ng, S., Perron, P., 2001. Lag length selection and the construction of unit root tests with good size and power. Econometrica 69, 1519-1554. Nielsen, B., Rahbek, A., 2000. Similarity issues in cointegration analysis. Oxford Bulletin of Economics and Statistics 62, 5-22. Pericoli, M., Sbracia, M., 2003. A primer on financial contagion. Journal of Economic Surveys 17, 571-608. Phillips, P. C. B., Perron, P., 1988. Testing for a unit root in times series regression. Biometrika 75, 335-346. Polito, V., Wickens, M. 2011. Assessing the fiscal stance in the European Union and the United States, 1970–2011. Economic Policy 26, 599-647. Polito, V., Wickens, M. 2012. A model-based indicator of the fiscal stance. European Economic Review 56, 526-551. Poskitt, D. S., Tremayne, A. R., 1987. Determining a portfolio of linear time series models. Biometrika 74, 125-137. Rua, A., 2002. Composite indicators for the Euro area economic activity. Economic Bulletin, Banco de Portugal, September, pp. 87–100. Sims, C. A., 1972. Money, income, and causality. American Economic Review 62, 540-552. Thornton, D. L., Batten, D. S., 1985. Lag-length selection and tests of Granger causality between money and income. Journal of Money, Credit, and Banking 27, 164-178. Williams, E. J., 1959. Regression analysis. Wiley, New York.
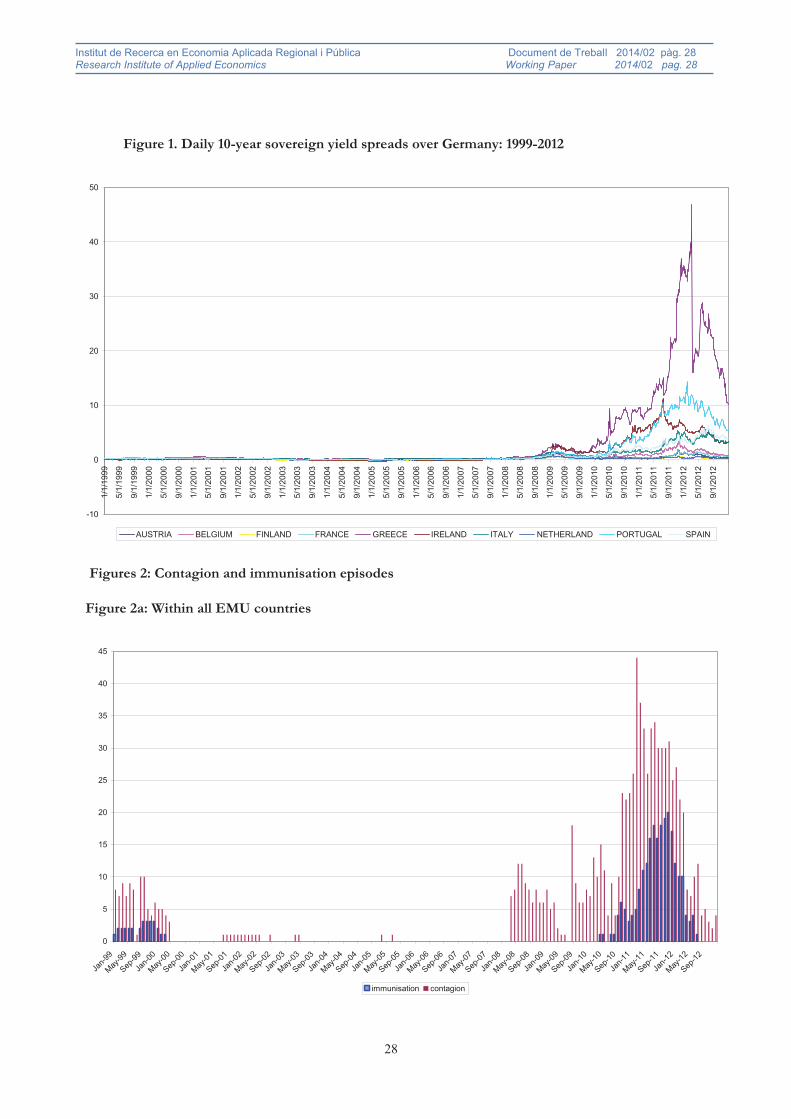
Institut de Recerca en Economia Aplicada Regional i Pública Document de Treball 2014/02 pàg. 28 Research Institute of Applied Economics Working Paper 2014/02 pag. 28
28
Figure 1. Daily 10-year sovereign yield spreads over Germany: 1999-2012
-10
0
10
20
30
40
50
1/1/
1999
5/1/
1999
9/1/
1999
1/1/
2000
5/1/
2000
9/1/
2000
1/1/
2001
5/1/
2001
9/1/
2001
1/1/
2002
5/1/
2002
9/1/
2002
1/1/
2003
5/1/
2003
9/1/
2003
1/1/
2004
5/1/
2004
9/1/
2004
1/1/
2005
5/1/
2005
9/1/
2005
1/1/
2006
5/1/
2006
9/1/
2006
1/1/
2007
5/1/
2007
9/1/
2007
1/1/
2008
5/1/
2008
9/1/
2008
1/1/
2009
5/1/
2009
9/1/
2009
1/1/
2010
5/1/
2010
9/1/
2010
1/1/
2011
5/1/
2011
9/1/
2011
1/1/
2012
5/1/
2012
9/1/
2012
AUSTRIA BELGIUM FINLAND FRANCE GREECE IRELAND ITALY NETHERLAND PORTUGAL SPAIN
Figures 2: Contagion and immunisation episodes
Figure 2a: Within all EMU countries
0
5
10
15
20
25
30
35
40
45
Jan-9
9
May-99
Sep-99
Jan-0
0
May-00
Sep-00
Jan-0
1
May-01
Sep-01
Jan-0
2
May-02
Sep-02
Jan-0
3
May-03
Sep-03
Jan-0
4
May-04
Sep-04
Jan-0
5
May-05
Sep-05
Jan-0
6
May-06
Sep-06
Jan-0
7
May-07
Sep-07
Jan-0
8
May-08
Sep-08
Jan-0
9
May-09
Sep-09
Jan-1
0
May-10
Sep-10
Jan-1
1
May-11
Sep-11
Jan-1
2
May-12
Sep-12
immunisation contagion

Inst
itut d
e R
ecer
ca e
n E
cono
mia
Apl
icad
a R
egio
nal i
Púb
lica
Doc
umen
t de
Treb
all
201
4/02
pàg
. 29
Res
earc
h In
stitu
te o
f App
lied
Eco
nom
ics
Wor
king
Pap
er
2014
/02
pag.
29
29
Fig
ure
2b
: Wit
hin
per
iph
eral
cou
ntr
ies
F
igu
re 2
c: F
rom
per
iph
eral
to
cen
tral
cou
ntr
ies
024681012 Jan-9
9 May-99 Sep-99 Jan-0
0 May-00 Sep-00 Jan-0
1 May-01 Sep-01 Jan-0
2 May-02 Sep-02 Jan-0
3 May-03 Sep-03 Jan-0
4 May-04 Sep-04 Jan-0
5 May-05 Sep-05 Jan-0
6 May-06 Sep-06 Jan-0
7 May-07 Sep-07 Jan-0
8 May-08 Sep-08 Jan-0
9 May-09 Sep-09 Jan-1
0 May-10 Sep-10 Jan-1
1 May-11 Sep-11 Jan-1
2 May-12 Sep-12
imm
unis
atio
nco
ntag
ion
Fig
ure
2d
: Wit
hin
cen
tral
cou
ntr
ies
Fig
ure
2e:
Fro
m c
entr
al t
o p
erip
her
al c
oun
trie
s
024681012 Jan-9
9 May-99 Sep-99 Jan-0
0 May-00 Sep-00 Jan-0
1 May-01 Sep-01 Jan-0
2 May-02 Sep-02 Jan-0
3 May-03 Sep-03 Jan-0
4 May-04 Sep-04 Jan-0
5 May-05 Sep-05 Jan-0
6 May-06 Sep-06 Jan-0
7 May-07 Sep-07 Jan-0
8 May-08 Sep-08 Jan-0
9 May-09 Sep-09 Jan-1
0 May-10 Sep-10 Jan-1
1 May-11 Sep-11 Jan-1
2 May-12 Sep-12
imm
unis
atio
nco
ntag
ion

Institut de Recerca en Economia Aplicada Regional i Pública Document de Treball 2014/02 pàg. 30 Research Institute of Applied Economics Working Paper 2014/02 pag. 30
30
Table 1
Notes: In the brackets below the parameter estimates are the corresponding z-statistics. * and ** denote significance at the 1% and 5% level, respectively Count R2 is the proportion of outcomes correctly predicted by the model XX denotes trigger country and YY receiver country in the pair-wise causal relationship
Variables
All Countries
Peripheral countries
Peripheral-Central
Countries
Central Countries
Central-Peripheral countries
Local market sentiment
Stock Volatility
XXStockVol 40.0591*(2.2770)
- - 232.4702* (2.2603)
129.9954*(2.3215)
YYStockVol 110.6452*(4.6831)
- - - 112.6743*(2.6441)
Index of the Fiscal
stance
XXIFS - - 0.3692*(3.2514)
- 7.2646*(4.0722)
YYIFS 5.2485*(3.5523)
1.6541*(4.8106)
- - 9.2914*(3.4619)
Consumer Confidence Indicator
XXCCI - -0.0071*(-3.8117)
- -0.0636* (-2.5813)
-0 .2616*(-4.9239)
YYCCI - - - 0.0857* (2.5512)
-
Rating
XXRating 0.0848*(3.1810)
0.1693*(2.7731)
1.0637* (6.1112)
1.5381*(3.9901)
YYRating 0.0936*(3.1421)
0.1135*(2.3218)
- 0.1050*(2.2348)
Local macro fundamentals
Net position towards
the rest of the world
XXCA
- - -
-0 .4219* (-2.9531)
-0.4478*(-2.8938)
Growth potential
XXU 0.0872*(2.7941)
- - 0 5567* (4.2046)
1.0412*(2.3647)
YYU 0.0755*(2.0913)
0.1316*(2.1608)
- 0.6882* (2.9593)
0.0079*(2.4184)
Competitiveness
XXINF - - - 1.5741* (4.2012)
1.1760*(2.3647)
YYINF - 0.6720*(6.6105)
0 .1228*(2.6581)
- -
Fiscal Position
XXDEBT 0.0198*(2.7706)
- 13.8750*(2.8711)
0.2144* (2.7204)
0. 3124*(2.8453)
YYDEBT 0.0151*(3.6103)
0.0574*(4.3457)
- - 0.0152*(2.7915)
XXDEF 0.0307*(2.9341)
- - - 0.1309*(2.4351)
Market liquidity
XXLIQ - -0.0007*(-2.3510)
- -0 .0122* (-2.6392)
-0.0082*(-2.4261)
YYLIQ -0.0005*(-2.8042)
- - -0 .0113* (-3.0032)
-
Regional market
sentiment
Credit Spread EURCreditSpread - - - 0.5759* (2.9323)
0.7639*(2.8115)
ITRAXXFIN EURITRAXXFIN 0.0116*(2.1513)
- - 0 .0706* (2.4239)
0.0169*(2.7514)
ITRAXXNF EURITRAXXNF 0.0407*(3.9031)
- - - 0.1448*(2.8941)
Euro Instability EURInstability 4.8159*(3.0452)
5.9879*(2.8215)
13.8750*(3.1422)
21.5812* (2.8635)
-
Financial Linkages
Cross-border banking linkages
XXYYBAN 0.0341*(3.0541)
- - - -
Individual dummies YES YES YES YES YESTime dummies NO YES YES YES NO
Pseudo R2 0.3993 0.3535 0.3012 0.3733 0.4123Count R2 0.6015 0.6554 0.6490 0.7065 0.6552
Log likelihood -992.8748 -579.6895 -540.0211 -259.3379 -226.4079�2 601.76* 639.22* 298.30* 176.34* 200.01*
Prob individual dummies = 0 0.0000* 0.0000* 0.0000* 0.0000* 0.0000*Prob time dummies = 0 0.8721 0.0000* 0.0000* 0.0458** 0.1558
Prob individual dummies and time dummies = 0
- 0.0000* 0.0000* 0.0000* -
Observations 1408 864 1200 560 368Countries 90 20 25 20 25
Institut de Recerca en Economia Aplicada Regional i Pública Document de Treball 2014/03 pàg. 29 Research Institute of Applied Economics Working Paper 2014/03 pag. 29
29


![Causality and contagion in EMU sovereign debt marketsfirst definition of contagion [(Masson, 1999) and Kaminsky and Reinhart (2000) among others]. Concretely, they examine whether](https://img.pdfslide.net/doc/110x75/5eb86a8c9ce3030c4127be8b/causality-and-contagion-in-emu-sovereign-debt-first-definition-of-contagion-masson.jpg)