Embed Size (px)
Citation preview
Application ReportSPRA439E–January 2011
Emulation Fundamentals for TI's DSP SolutionsChuck Brokish - Distinguished Member, Technical Staff ................................... Field Design and Applications
ABSTRACT
In software development, perhaps the most critical, yet least predictable stage in the process isdebugging. Of the many factors that come into play when debugging software applications, time is ofutmost importance. The time required to set up and debug a software application can have major impactson time-to-market, meeting customer expectations, and ultimately the financial impact of a well-developedproduct.
This paper will explain the fundamentals of how the emulation logic and emulation tools work together withthe TI digital signal processors. By understanding the fundamentals of emulation, you will be able toaccelerate the process of setting up and performing software debug, as well as aid in troubleshootingpotential problems in the debugging setup.
A detailed explanation of the setup of the emulator hardware systems for single and multi-processorapplications, along with a discussion of how the system components interact during debug will bediscussed in the sections to follow. Also included is a troubleshooting guide to assist in common setupproblems.
Topic ........................................................................................................................... Page
1 Introduction ........................................................................................................ 22 Software Setup ................................................................................................. 103 Establishing Communication With Your Emulation Hardware and Target ................. 244 Troubleshooting Emulation Setup Errors ............................................................. 265 Troubleshooting Guide ...................................................................................... 286 Other Debugging Diagnostic Tools ...................................................................... 297 References ....................................................................................................... 30
1SPRA439E–January 2011 Emulation Fundamentals for TI's DSP SolutionsSubmit Documentation Feedback
© 2011, Texas Instruments Incorporated
Introduction www.ti.com
1 Introduction
Texas Instruments' debuggers allow extensive visibility into the processors, their registers, and theapplication's software. This visibility enables the software engineer to:• understand what changes are taking place inside of the processor as the application executes• set breakpoints in the application, based on hardware signal values or software locations within the
application
At these breakpoints, you can:• understand the state of the processor and data and determine if the application is still operating
correctly• perform benchmarking (timing analysis) and profiling (CPU loading) of the application software within
the emulator
Additionally, multiprocessor debug allows you to:• debug software on several processors at the same time• provide a method of stopping one or multiple processors based on a condition set in another processor• capture the entire system state at the time in question
These capabilities, along with many more within the Texas Instruments debuggers, can greatly reducedebugging time in the software development cycle.
1.1 Hardware System Requirements
To understand the workings of the emulation logic on TI processors, it is first necessary to understand thebasic components of emulation. The following hardware components are required to properly debug thetarget system:
• A personal computer (refer to your Code Composer Studio™ (CCS) manual for minimumrequirements)
• Windows™2000 SP4 or Windows™ XP SP2• Code Composer Studio™(appropriate version)• Emulator ( XDS560™, XDS510™ or XDS560/510 class emulator)• Emulation interface pod (XDS560T, XDS560, XDS510 or XDS560/510 class emulation pod)• Target (not required if using TI simulator)
1.2 Hardware Setup
When using the TI debugger for software debugging on a hardware platform, it is necessary to perform afew setup procedures to ensure that the target processor works properly with the XDS510, XDS560, orthird-party emulation hardware.
The emulation setup is comprised of two tools: the emulator (i.e., XDS510 or XDS560) which controls theinformation flow to and from the target, and the debugger, which is the user interface to this information.Beyond the emulation setup is the target processor. TI uses several common interface connectionsbetween the target and the emulation HW. The protocol used within the emulation logic of TI processors isthe Joint Test Action Group (JTAG).
This section covers the basics of ensuring proper communication setup between the emulation hardwareand the target processor.
1.3 General Understandings
Debug of the hardware is performed by stopping the core to enable information to be scanned into and outof the device via the JTAG header. This information is transferred serially through the JTAG port followingthe IEEE 1149.1 JTAG specifications. It is important to understand that this debug method is nearreal-time, but is intrusive, as it may require that the core be halted to scan the information.
Code Composer Studio, XDS560, XDS510 are trademarks of Texas Instruments.Windows is a trademark of other.All other trademarks are the property of their respective owners.
2 Emulation Fundamentals for TI's DSP Solutions SPRA439E–January 2011Submit Documentation Feedback
© 2011, Texas Instruments Incorporated
www.ti.com Introduction
While the connection to the JTAG header may be the same, the scan chains used for emulation purposesare different from those used for boundary scan. Internal to the processor, there are various serial scanchains through which the information can be scanned. The emulator card controls which scan chain isused, and what information is contained in each scan chain. Traditionally referred to as the ScanManager, this function assumes the task of controlling all information scanned into and out of the variousprocessors in the scan chain. Further, it directs this information to and from the various debuggerwindows.
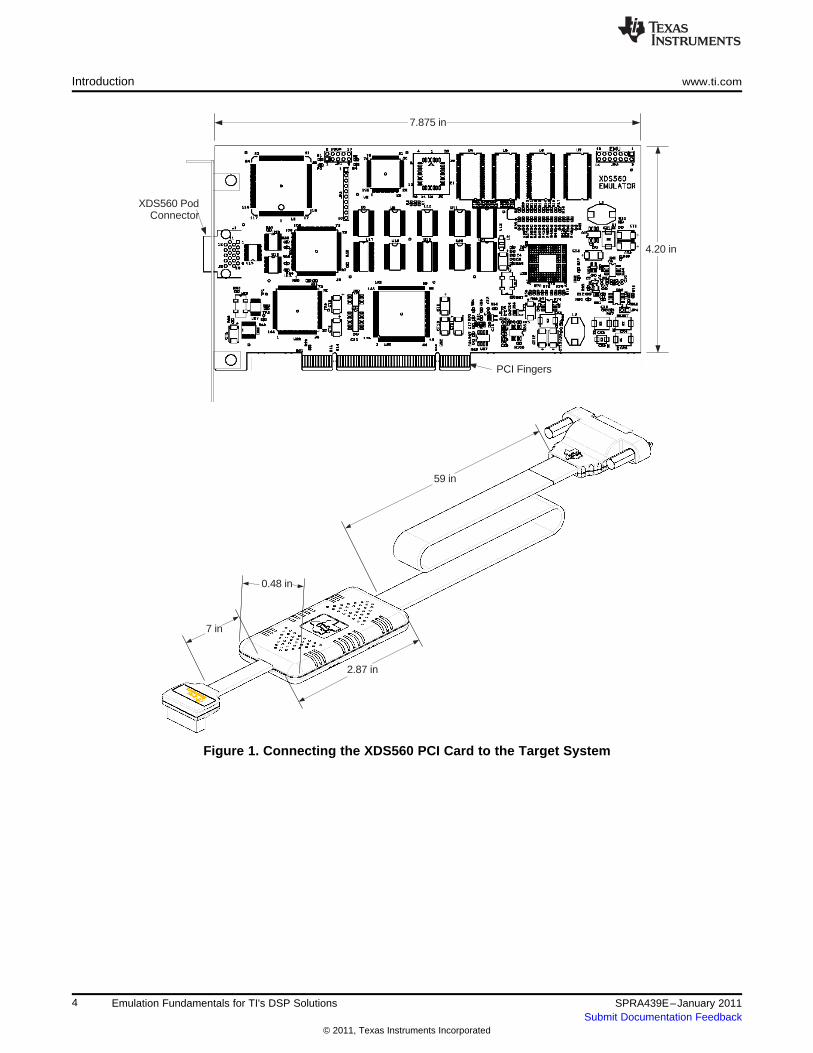
When using a personal computer (PC), the JTAG connection to the target processor can be made throughseveral options including a PCI card (Figure 1), ISA card, (Figure 2), USB, PCMCIA, Ethernet, or manyother options. This information regarding the scan control is available to the PC host via dynamicallylinked libraries (DLLs).
Additional information regarding physical connection of the XDS510 and XDS560 debugger interfaces isavailable in the documentation that is shipped with the product. Other helpful information, can be found atother locations within Texas Instruments, such as the TI Bulletin Board and the TI Internet Homepage,http://www.ti.com.
TI third parties are making other emulation interfaces available, including PCMCIA, USB, and Ethernetconnections. With these connection methods, scan management is performed by the CPU of the hostcomputer and an external processor, respectively.
3SPRA439E–January 2011 Emulation Fundamentals for TI's DSP SolutionsSubmit Documentation Feedback
© 2011, Texas Instruments Incorporated
7.875 in
4.20 in
PCI Fingers
XDS560 PodConnector
7 in
59 in
2.87 in
0.48 in
Introduction www.ti.com
Figure 1. Connecting the XDS560 PCI Card to the Target System
4 Emulation Fundamentals for TI's DSP Solutions SPRA439E–January 2011Submit Documentation Feedback
© 2011, Texas Instruments Incorporated
www.ti.com Introduction
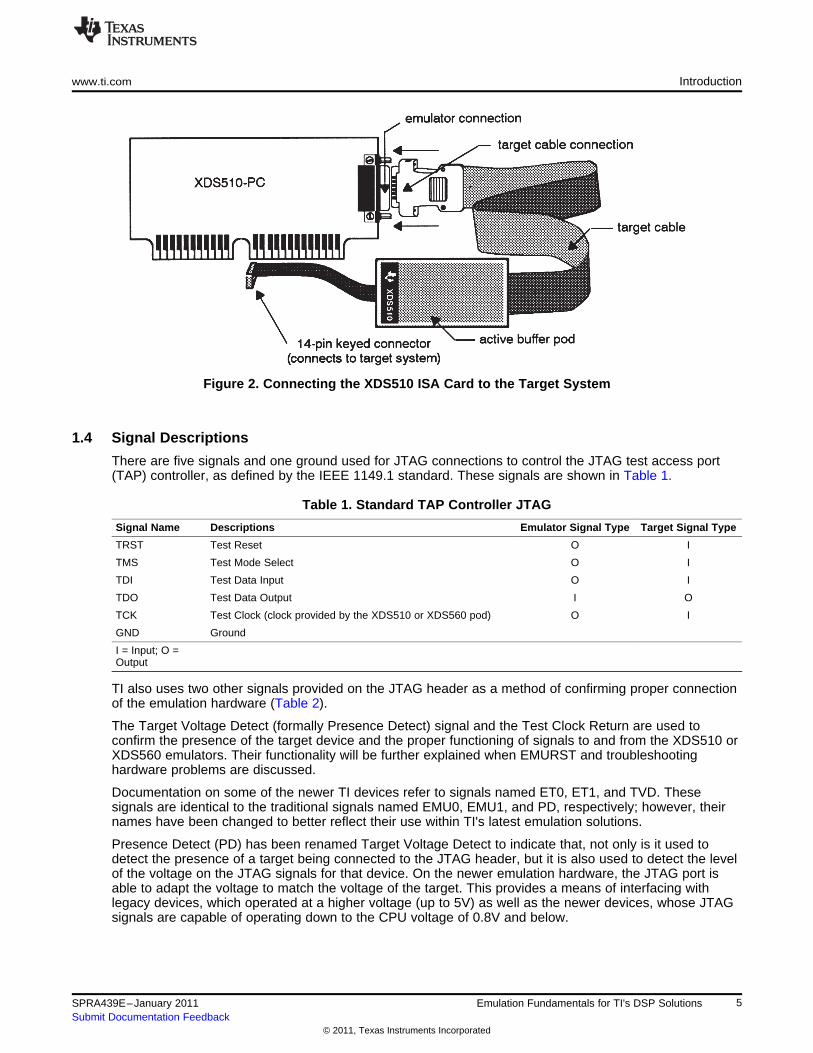
Figure 2. Connecting the XDS510 ISA Card to the Target System
1.4 Signal Descriptions
There are five signals and one ground used for JTAG connections to control the JTAG test access port(TAP) controller, as defined by the IEEE 1149.1 standard. These signals are shown in Table 1.
Table 1. Standard TAP Controller JTAG
Signal Name Descriptions Emulator Signal Type Target Signal Type
TRST Test Reset O I
TMS Test Mode Select O I
TDI Test Data Input O I
TDO Test Data Output I O
TCK Test Clock (clock provided by the XDS510 or XDS560 pod) O I
GND Ground
I = Input; O =Output
TI also uses two other signals provided on the JTAG header as a method of confirming proper connectionof the emulation hardware (Table 2).
The Target Voltage Detect (formally Presence Detect) signal and the Test Clock Return are used toconfirm the presence of the target device and the proper functioning of signals to and from the XDS510 orXDS560 emulators. Their functionality will be further explained when EMURST and troubleshootinghardware problems are discussed.
Documentation on some of the newer TI devices refer to signals named ET0, ET1, and TVD. Thesesignals are identical to the traditional signals named EMU0, EMU1, and PD, respectively; however, theirnames have been changed to better reflect their use within TI's latest emulation solutions.
Presence Detect (PD) has been renamed Target Voltage Detect to indicate that, not only is it used todetect the presence of a target being connected to the JTAG header, but it is also used to detect the levelof the voltage on the JTAG signals for that device. On the newer emulation hardware, the JTAG port isable to adapt the voltage to match the voltage of the target. This provides a means of interfacing withlegacy devices, which operated at a higher voltage (up to 5V) as well as the newer devices, whose JTAGsignals are capable of operating down to the CPU voltage of 0.8V and below.
5SPRA439E–January 2011 Emulation Fundamentals for TI's DSP SolutionsSubmit Documentation Feedback
© 2011, Texas Instruments Incorporated
Introduction www.ti.com
The TCK_RET signal is used to clock the logic within the emulator. It is not typically a signal which isactually present on the chip being debugged. Rather, it is a representation of the TCK signal supplied tothe target board, but routed through the target board such that it can accurately represent any delays orsignal effects observed by other JTAG signals.
If the other JTAG signals are buffered (as shown in Figure 4), then the TCK pin should be buffered as wellbefore being brought out on the TCK_RET pin. This ensures that the clock within the pod is properlysynchronized with the associated signals which it is clocking internal to the pod.
However, on devices that include an ARM core of version ARM926 and above, the TCK_RET signal mustactually come from a dedicated pin of the chip itself. This is because ARM Ltd varies from the IEEE1149.1 specification and makes the JTAG clock dependent on the CPU clock. Therefore, the RTCK signalfrom the ARM core is actually in internal synchronization with both the TCK signal from the JTAG headeras well as the CPU clock.
Table 2. Connection Verification JTAG Signals
Signal Name Descriptions Emulator Signal Type Target Signal Type
Signals connectedTCK_RET (or Test Clock Return (buffered or unbuffered connection of TCK I to target board; notRTCK) coming back from the target board) to the chip
Fro devices using ARM core revision 926 and above, RTCK is I Obrought ut of a dedicated pin on the device.
TDV or PD_(VCC ) Target Voltage Detect I O
I = Input; O =Output
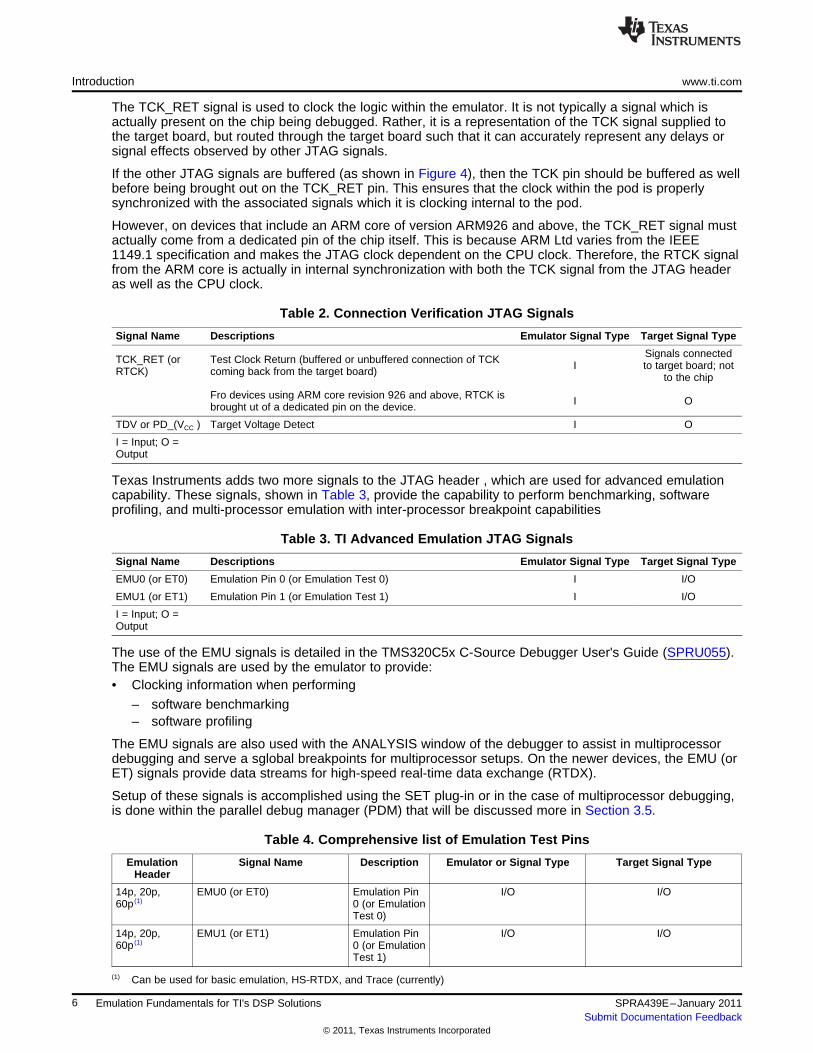
Texas Instruments adds two more signals to the JTAG header , which are used for advanced emulationcapability. These signals, shown in Table 3, provide the capability to perform benchmarking, softwareprofiling, and multi-processor emulation with inter-processor breakpoint capabilities
Table 3. TI Advanced Emulation JTAG Signals
Signal Name Descriptions Emulator Signal Type Target Signal Type
EMU0 (or ET0) Emulation Pin 0 (or Emulation Test 0) I I/O
EMU1 (or ET1) Emulation Pin 1 (or Emulation Test 1) I I/O
I = Input; O =Output
The use of the EMU signals is detailed in the TMS320C5x C-Source Debugger User's Guide (SPRU055).The EMU signals are used by the emulator to provide:• Clocking information when performing
– software benchmarking– software profiling
The EMU signals are also used with the ANALYSIS window of the debugger to assist in multiprocessordebugging and serve a sglobal breakpoints for multiprocessor setups. On the newer devices, the EMU (orET) signals provide data streams for high-speed real-time data exchange (RTDX).
Setup of these signals is accomplished using the SET plug-in or in the case of multiprocessor debugging,is done within the parallel debug manager (PDM) that will be discussed more in Section 3.5.
Table 4. Comprehensive list of Emulation Test Pins
Emulation Signal Name Description Emulator or Signal Type Target Signal TypeHeader
14p, 20p, EMU0 (or ET0) Emulation Pin I/O I/O60p (1) 0 (or Emulation
Test 0)
14p, 20p, EMU1 (or ET1) Emulation Pin I/O I/O60p (1) 0 (or Emulation
Test 1)
(1) Can be used for basic emulation, HS-RTDX, and Trace (currently)
6 Emulation Fundamentals for TI's DSP Solutions SPRA439E–January 2011Submit Documentation Feedback
© 2011, Texas Instruments Incorporated
www.ti.com Introduction
Table 4. Comprehensive list of Emulation Test Pins (continued)
Emulation Signal Name Description Emulator or Signal Type Target Signal TypeHeader
20p, 60p (2), (3) EMU2 (or ET2) Emulation Pin I/O I/O0 (or EmulationTest 2)
20p, 60p (2), (3) EMU3 (or ET3) Emulation Pin I/O I/O0 (or EmulationTest 3)
20p, 60p (2), (3) EMU4 (or ET4) Emulation Pin I/O I/O0 (or EmulationTest 4)
60p (3) EMU5 (or ET5) Emulation Pin I O0 (or EmulationTest 5)
60p (3) EMU6 (or ET6) Emulation Pin I O0 (or EmulationTest 6)
60p (3) EMU7 (or ET7) Emulation Pin I O0 (or EmulationTest 7)
60p (4) EMU8 (or ET8) Emulation Pin I O0 (or EmulationTest 8)
60p (4) EMU9 (or ET9) Emulation Pin I O0 (or EmulationTest 9)
60p (4) EMU10 (or ET10) Emulation Pin I O0 (or EmulationTest 10)
60p (4) EMU11 (or ET11) Emulation Pin I O0 (or EmulationTest 11)
60p (4) EMU12 (or ET12) Emulation Pin I O0 (or EmulationTest 12)
60p (4) EMU13 (or ET13) Emulation Pin I O0 (or EmulationTest 13)
60p (4) EMU14 (or ET14) Emulation Pin I O0 (or EmulationTest 14)
60p (4) EMU15 (or ET15) Emulation Pin I O0 (or EmulationTest 15)
60p (4) EMU16 (or ET16) Emulation Pin I O0 (or EmulationTest 16)
60p (4) EMU17 (or ET17) Emulation Pin I O0 (or EmulationTest 17)
60p (4) EMU18 (or ET18) Emulation Pin I O0 (or EmulationTest 18)
14p refers to the tradition 14 pin [7x2] header with 0.1" pitch; 20p refers to TI's compact 20 pin [2x10] header with 0.1" x 0.050"pitch; 60p refers to TI's 60 pin [4x15] header with 0.25" x 0.050" pitch
(2) Can be used for HS-RTDX or Trace (currently)(3) Can be used for Trace only (currently)(4) Can be used for Trace only (currently)
7SPRA439E–January 2011 Emulation Fundamentals for TI's DSP SolutionsSubmit Documentation Feedback
© 2011, Texas Instruments Incorporated
VCC I/O
VCC I/O
Emulation Header
13142137119
468
1012
5 EMU0EMU1TRSTTMSTDI
TDOTCK
TCK_RET
GNDGNDGNDGNDGND
TVD
Target Device
EMU0EMU1TRSTTMSTDITDOTCK
Greater Than6 inches
Introduction www.ti.com
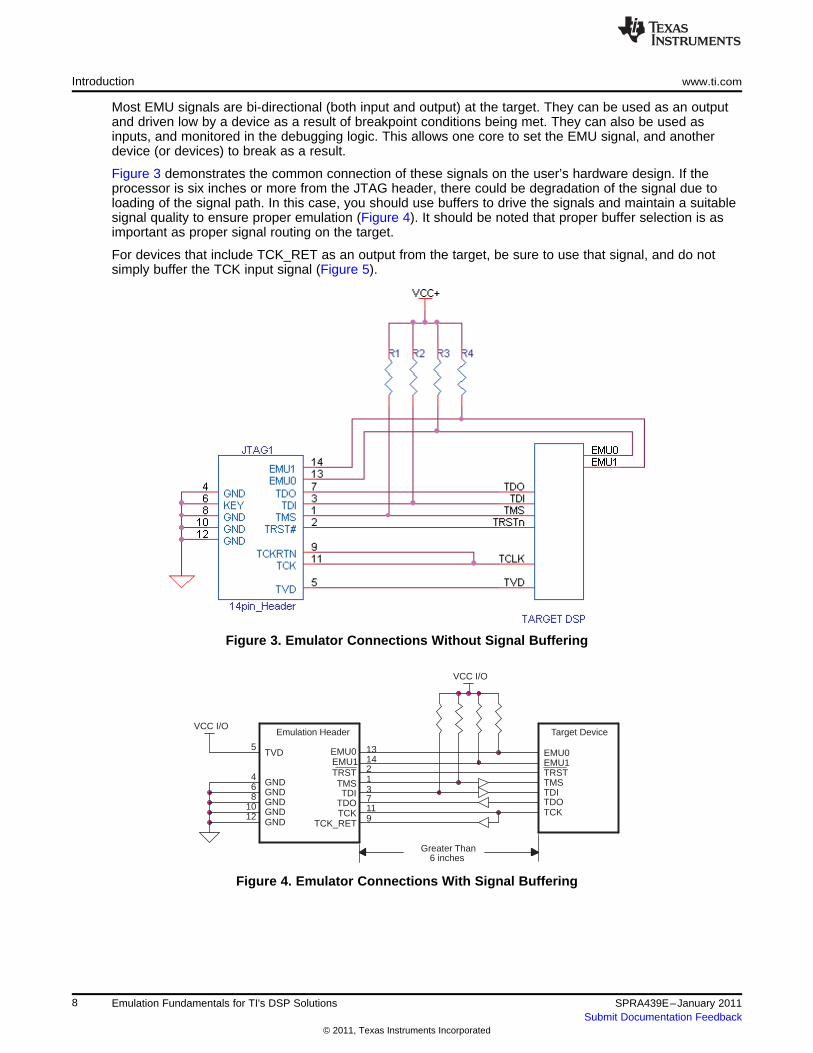
Most EMU signals are bi-directional (both input and output) at the target. They can be used as an outputand driven low by a device as a result of breakpoint conditions being met. They can also be used asinputs, and monitored in the debugging logic. This allows one core to set the EMU signal, and anotherdevice (or devices) to break as a result.
Figure 3 demonstrates the common connection of these signals on the user’s hardware design. If theprocessor is six inches or more from the JTAG header, there could be degradation of the signal due toloading of the signal path. In this case, you should use buffers to drive the signals and maintain a suitablesignal quality to ensure proper emulation (Figure 4). It should be noted that proper buffer selection is asimportant as proper signal routing on the target.
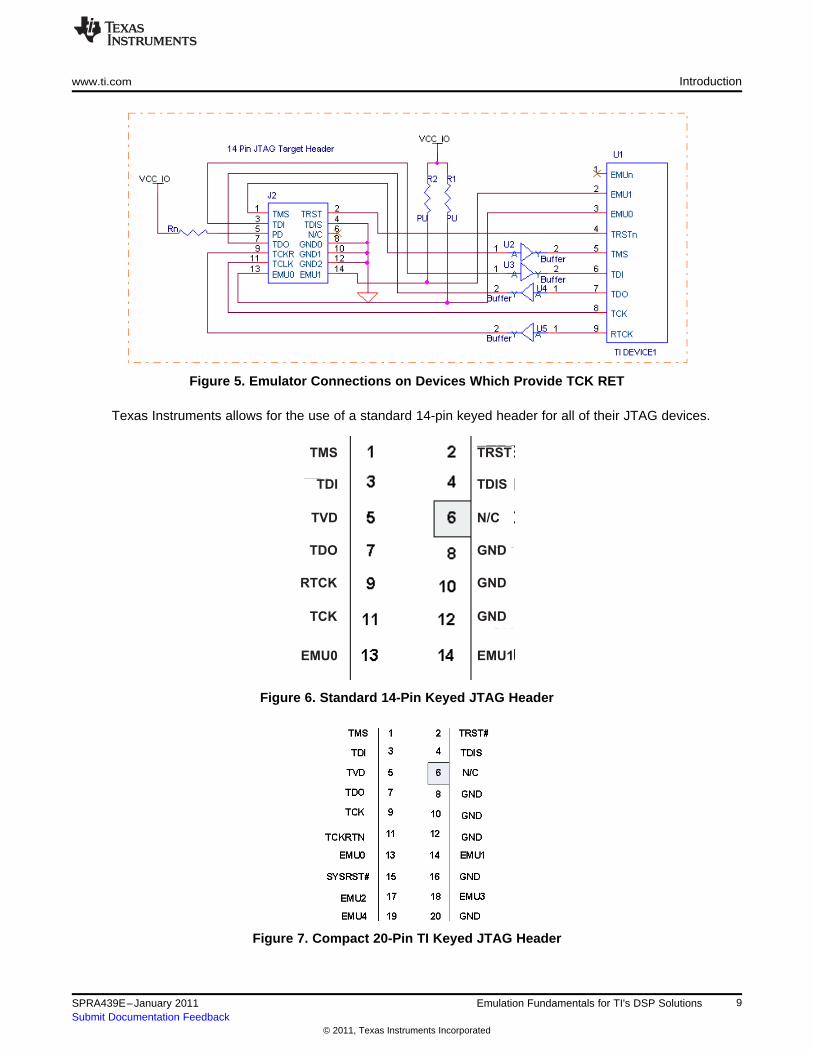
For devices that include TCK_RET as an output from the target, be sure to use that signal, and do notsimply buffer the TCK input signal (Figure 5).
Figure 3. Emulator Connections Without Signal Buffering
Figure 4. Emulator Connections With Signal Buffering
8 Emulation Fundamentals for TI's DSP Solutions SPRA439E–January 2011Submit Documentation Feedback
© 2011, Texas Instruments Incorporated
TMS
TDI
TVD
TDO
RTCK
TCK
EMU0
TRST
TDIS
N/C
GND
GND
GND
EMU1
www.ti.com Introduction
Figure 5. Emulator Connections on Devices Which Provide TCK RET
Texas Instruments allows for the use of a standard 14-pin keyed header for all of their JTAG devices.
Figure 6. Standard 14-Pin Keyed JTAG Header
Figure 7. Compact 20-Pin TI Keyed JTAG Header
9SPRA439E–January 2011 Emulation Fundamentals for TI's DSP SolutionsSubmit Documentation Feedback
© 2011, Texas Instruments Incorporated
Software Setup www.ti.com
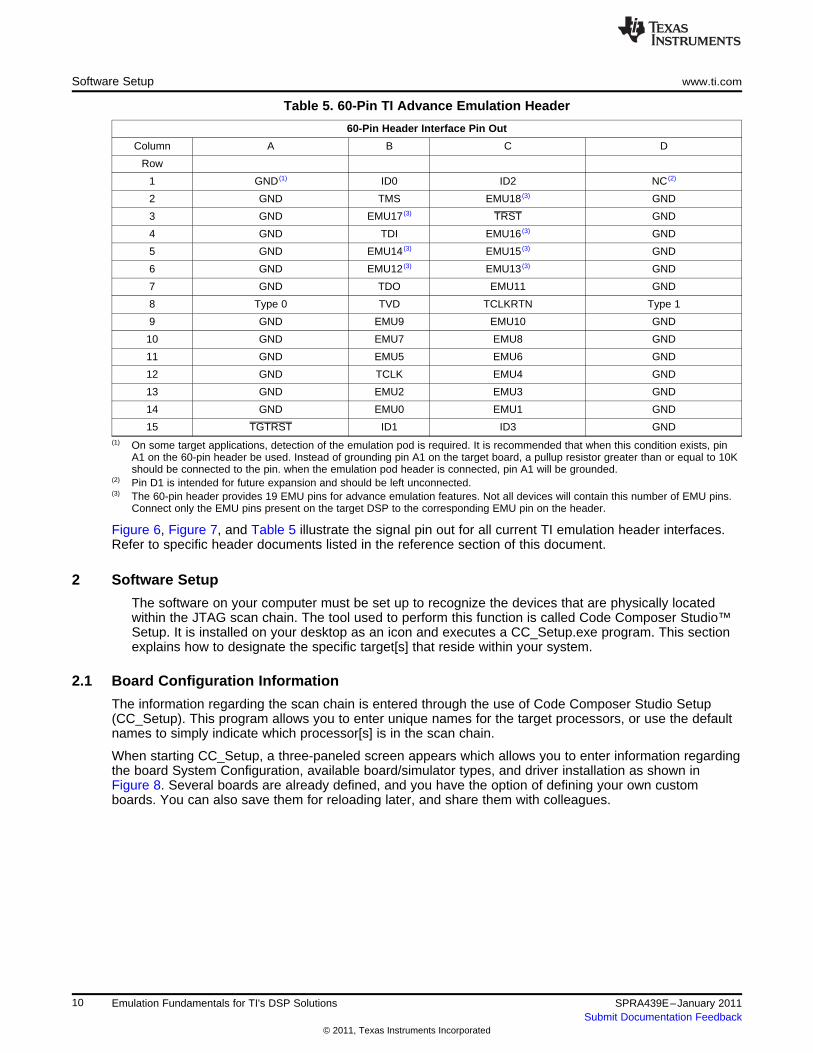
Table 5. 60-Pin TI Advance Emulation Header
60-Pin Header Interface Pin Out
Column A B C D
Row
1 GND (1) ID0 ID2 NC (2)
2 GND TMS EMU18 (3) GND
3 GND EMU17 (3) TRST GND
4 GND TDI EMU16 (3) GND
5 GND EMU14 (3) EMU15 (3) GND
6 GND EMU12 (3) EMU13 (3) GND
7 GND TDO EMU11 GND
8 Type 0 TVD TCLKRTN Type 1
9 GND EMU9 EMU10 GND
10 GND EMU7 EMU8 GND
11 GND EMU5 EMU6 GND
12 GND TCLK EMU4 GND
13 GND EMU2 EMU3 GND
14 GND EMU0 EMU1 GND
15 TGTRST ID1 ID3 GND(1) On some target applications, detection of the emulation pod is required. It is recommended that when this condition exists, pin
A1 on the 60-pin header be used. Instead of grounding pin A1 on the target board, a pullup resistor greater than or equal to 10Kshould be connected to the pin. when the emulation pod header is connected, pin A1 will be grounded.
(2) Pin D1 is intended for future expansion and should be left unconnected.(3) The 60-pin header provides 19 EMU pins for advance emulation features. Not all devices will contain this number of EMU pins.
Connect only the EMU pins present on the target DSP to the corresponding EMU pin on the header.
Figure 6, Figure 7, and Table 5 illustrate the signal pin out for all current TI emulation header interfaces.Refer to specific header documents listed in the reference section of this document.
2 Software Setup
The software on your computer must be set up to recognize the devices that are physically locatedwithin the JTAG scan chain. The tool used to perform this function is called Code Composer Studio™Setup. It is installed on your desktop as an icon and executes a CC_Setup.exe program. This sectionexplains how to designate the specific target[s] that reside within your system.
2.1 Board Configuration Information
The information regarding the scan chain is entered through the use of Code Composer Studio Setup(CC_Setup). This program allows you to enter unique names for the target processors, or use the defaultnames to simply indicate which processor[s] is in the scan chain.
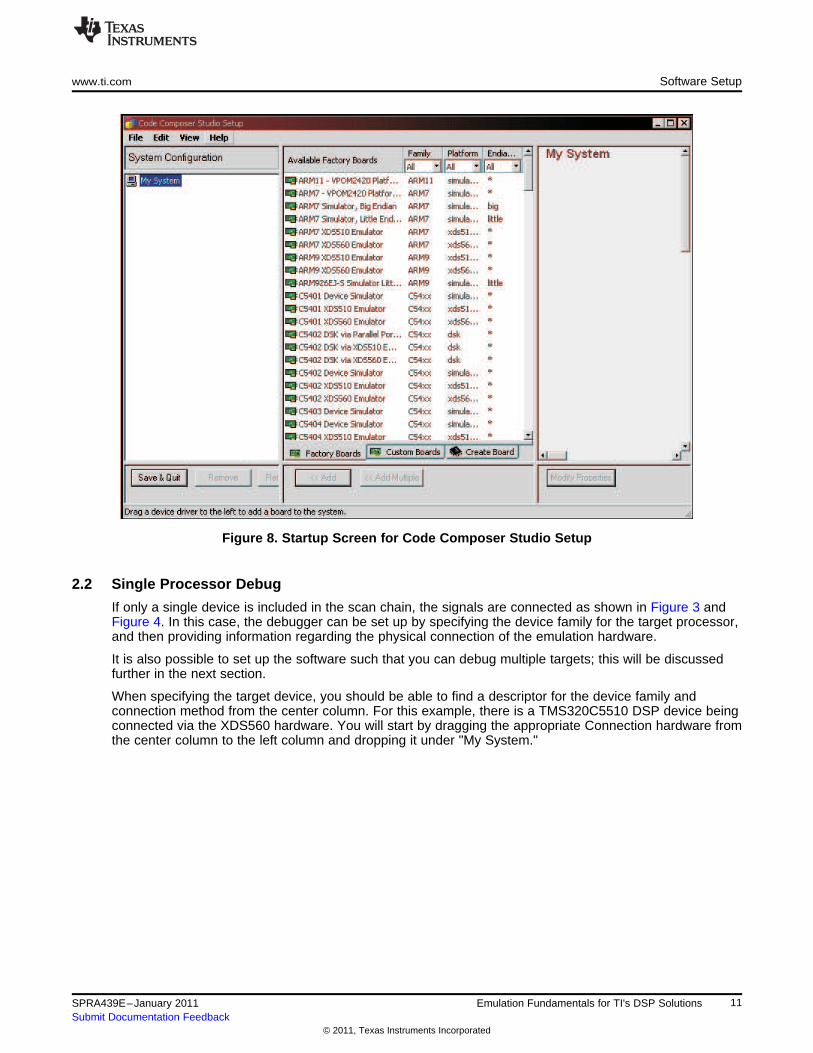
When starting CC_Setup, a three-paneled screen appears which allows you to enter information regardingthe board System Configuration, available board/simulator types, and driver installation as shown inFigure 8. Several boards are already defined, and you have the option of defining your own customboards. You can also save them for reloading later, and share them with colleagues.
10 Emulation Fundamentals for TI's DSP Solutions SPRA439E–January 2011Submit Documentation Feedback
© 2011, Texas Instruments Incorporated
www.ti.com Software Setup
Figure 8. Startup Screen for Code Composer Studio Setup
2.2 Single Processor Debug
If only a single device is included in the scan chain, the signals are connected as shown in Figure 3 andFigure 4. In this case, the debugger can be set up by specifying the device family for the target processor,and then providing information regarding the physical connection of the emulation hardware.
It is also possible to set up the software such that you can debug multiple targets; this will be discussedfurther in the next section.
When specifying the target device, you should be able to find a descriptor for the device family andconnection method from the center column. For this example, there is a TMS320C5510 DSP device beingconnected via the XDS560 hardware. You will start by dragging the appropriate Connection hardware fromthe center column to the left column and dropping it under "My System."
11SPRA439E–January 2011 Emulation Fundamentals for TI's DSP SolutionsSubmit Documentation Feedback
© 2011, Texas Instruments Incorporated
Software Setup www.ti.com
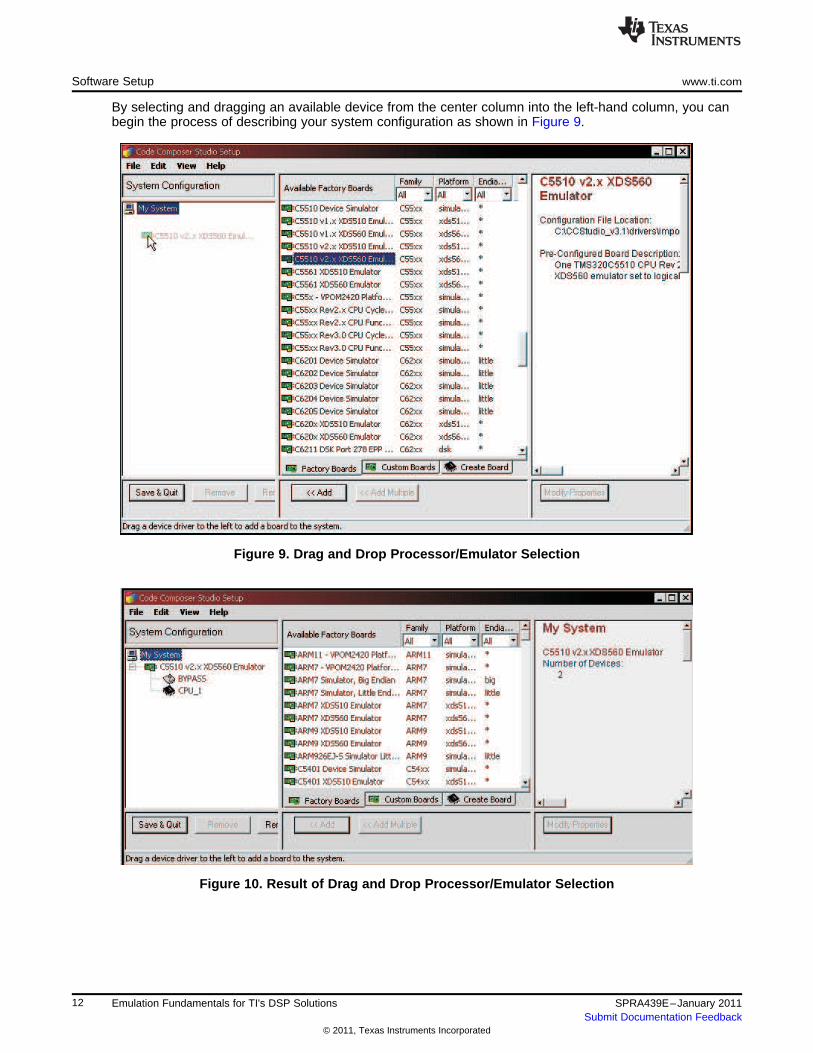
By selecting and dragging an available device from the center column into the left-hand column, you canbegin the process of describing your system configuration as shown in Figure 9.
Figure 9. Drag and Drop Processor/Emulator Selection
Figure 10. Result of Drag and Drop Processor/Emulator Selection
12 Emulation Fundamentals for TI's DSP Solutions SPRA439E–January 2011Submit Documentation Feedback
© 2011, Texas Instruments Incorporated
www.ti.com Software Setup
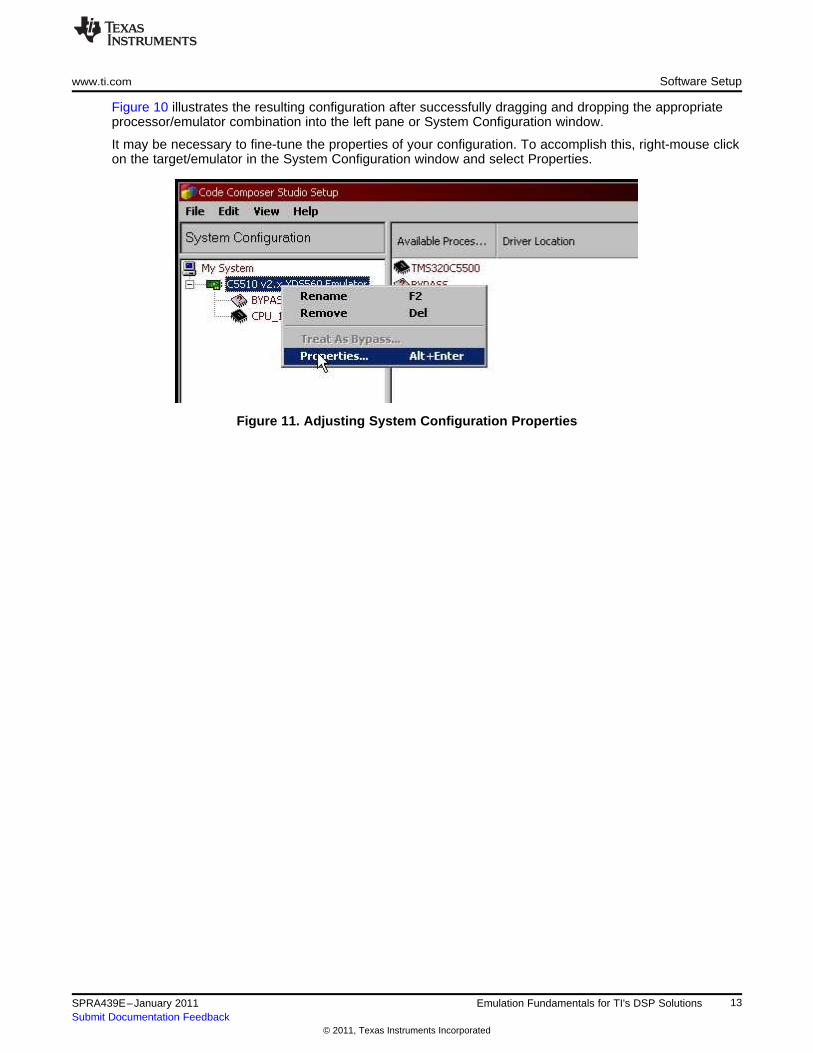
Figure 10 illustrates the resulting configuration after successfully dragging and dropping the appropriateprocessor/emulator combination into the left pane or System Configuration window.
It may be necessary to fine-tune the properties of your configuration. To accomplish this, right-mouse clickon the target/emulator in the System Configuration window and select Properties.
Figure 11. Adjusting System Configuration Properties
13SPRA439E–January 2011 Emulation Fundamentals for TI's DSP SolutionsSubmit Documentation Feedback
© 2011, Texas Instruments Incorporated
Software Setup www.ti.com
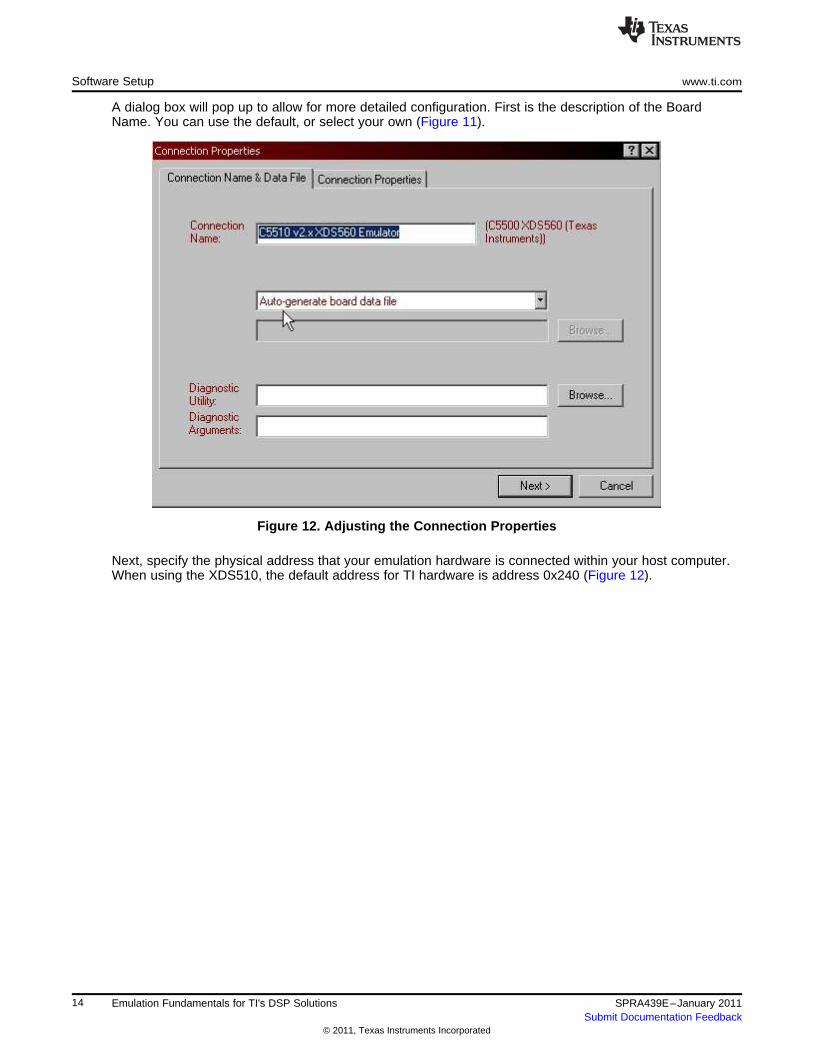
A dialog box will pop up to allow for more detailed configuration. First is the description of the BoardName. You can use the default, or select your own (Figure 11).
Figure 12. Adjusting the Connection Properties
Next, specify the physical address that your emulation hardware is connected within your host computer.When using the XDS510, the default address for TI hardware is address 0x240 (Figure 12).
14 Emulation Fundamentals for TI's DSP Solutions SPRA439E–January 2011Submit Documentation Feedback
© 2011, Texas Instruments Incorporated
www.ti.com Software Setup
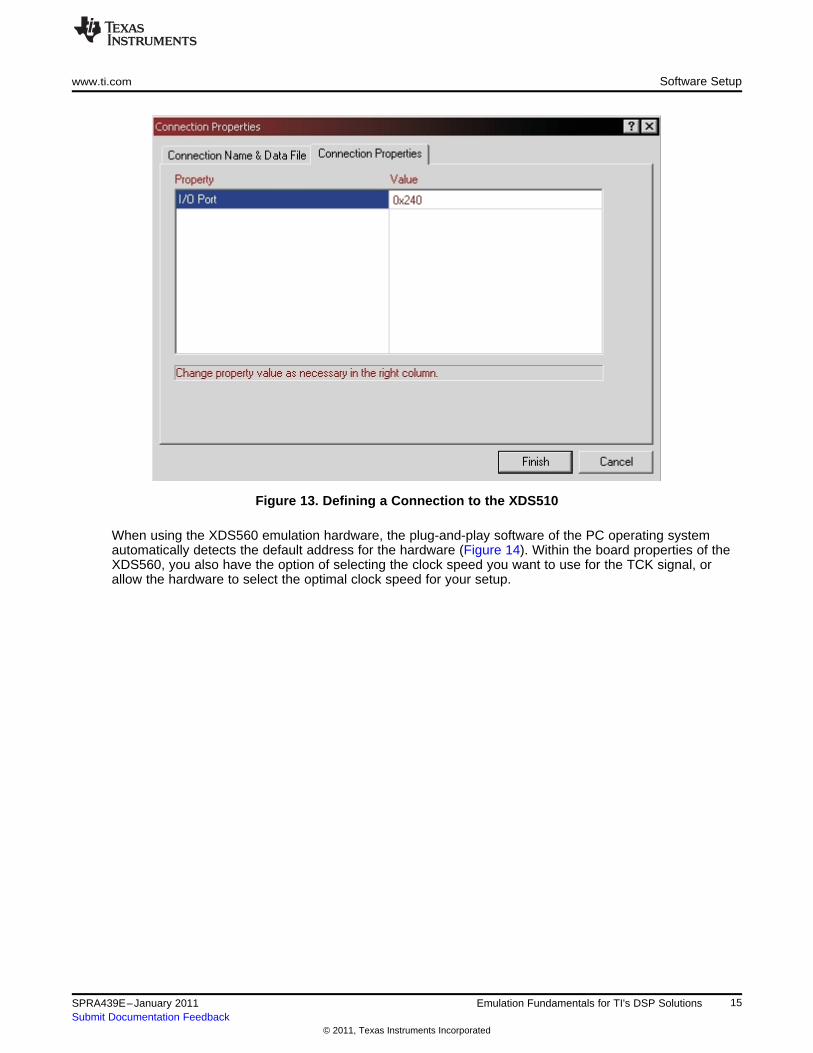
Figure 13. Defining a Connection to the XDS510
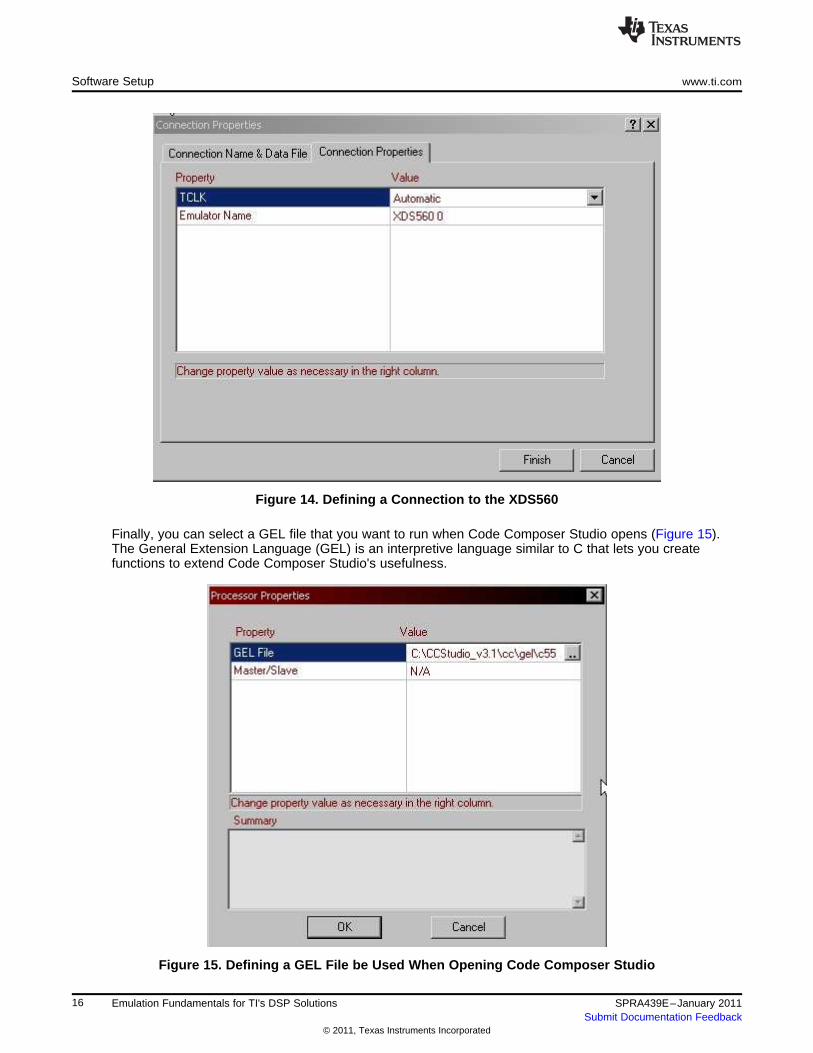
When using the XDS560 emulation hardware, the plug-and-play software of the PC operating systemautomatically detects the default address for the hardware (Figure 14). Within the board properties of theXDS560, you also have the option of selecting the clock speed you want to use for the TCK signal, orallow the hardware to select the optimal clock speed for your setup.
15SPRA439E–January 2011 Emulation Fundamentals for TI's DSP SolutionsSubmit Documentation Feedback
© 2011, Texas Instruments Incorporated
Software Setup www.ti.com
Figure 14. Defining a Connection to the XDS560
Finally, you can select a GEL file that you want to run when Code Composer Studio opens (Figure 15).The General Extension Language (GEL) is an interpretive language similar to C that lets you createfunctions to extend Code Composer Studio's usefulness.
Figure 15. Defining a GEL File be Used When Opening Code Composer Studio
16 Emulation Fundamentals for TI's DSP Solutions SPRA439E–January 2011Submit Documentation Feedback
© 2011, Texas Instruments Incorporated
VCC
Target Device
EMU0EMU1TRSTTMSTDITDOTCK
Target Device
EMU0EMU1TRSTTMSTDITDOTCK
VCC Emulation Header
13142137119
468
1012
5EMU0EMU1TRST
TMSTDI
TDOTCK
TCK_RET
GNDGNDGNDGNDGND
TVD
www.ti.com Software Setup
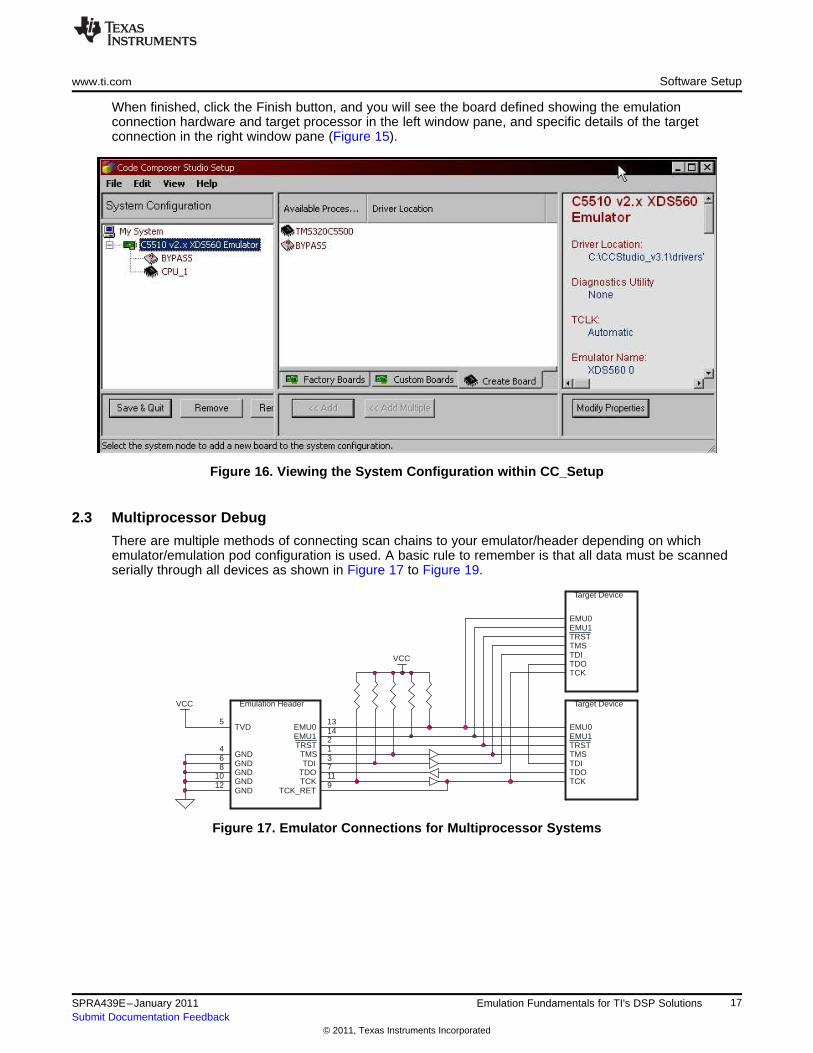
When finished, click the Finish button, and you will see the board defined showing the emulationconnection hardware and target processor in the left window pane, and specific details of the targetconnection in the right window pane (Figure 15).
Figure 16. Viewing the System Configuration within CC_Setup
2.3 Multiprocessor Debug
There are multiple methods of connecting scan chains to your emulator/header depending on whichemulator/emulation pod configuration is used. A basic rule to remember is that all data must be scannedserially through all devices as shown in Figure 17 to Figure 19.
Figure 17. Emulator Connections for Multiprocessor Systems
17SPRA439E–January 2011 Emulation Fundamentals for TI's DSP SolutionsSubmit Documentation Feedback
© 2011, Texas Instruments Incorporated
Software Setup www.ti.com
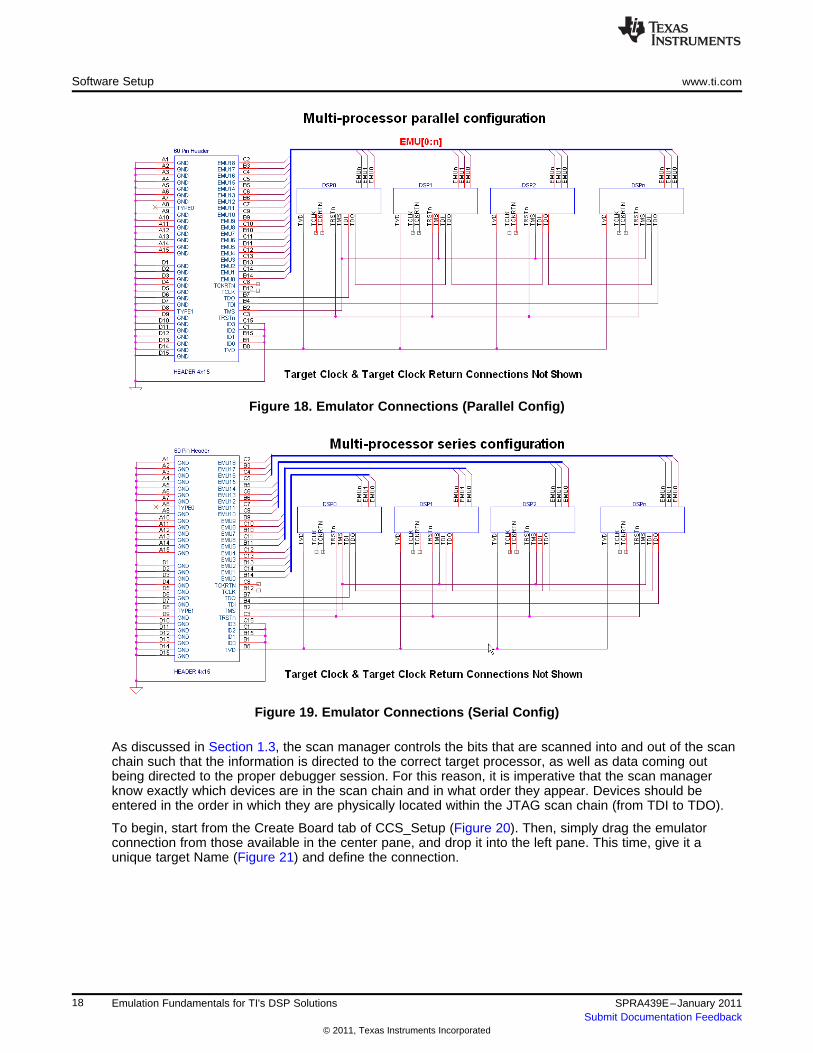
Figure 18. Emulator Connections (Parallel Config)
Figure 19. Emulator Connections (Serial Config)
As discussed in Section 1.3, the scan manager controls the bits that are scanned into and out of the scanchain such that the information is directed to the correct target processor, as well as data coming outbeing directed to the proper debugger session. For this reason, it is imperative that the scan managerknow exactly which devices are in the scan chain and in what order they appear. Devices should beentered in the order in which they are physically located within the JTAG scan chain (from TDI to TDO).
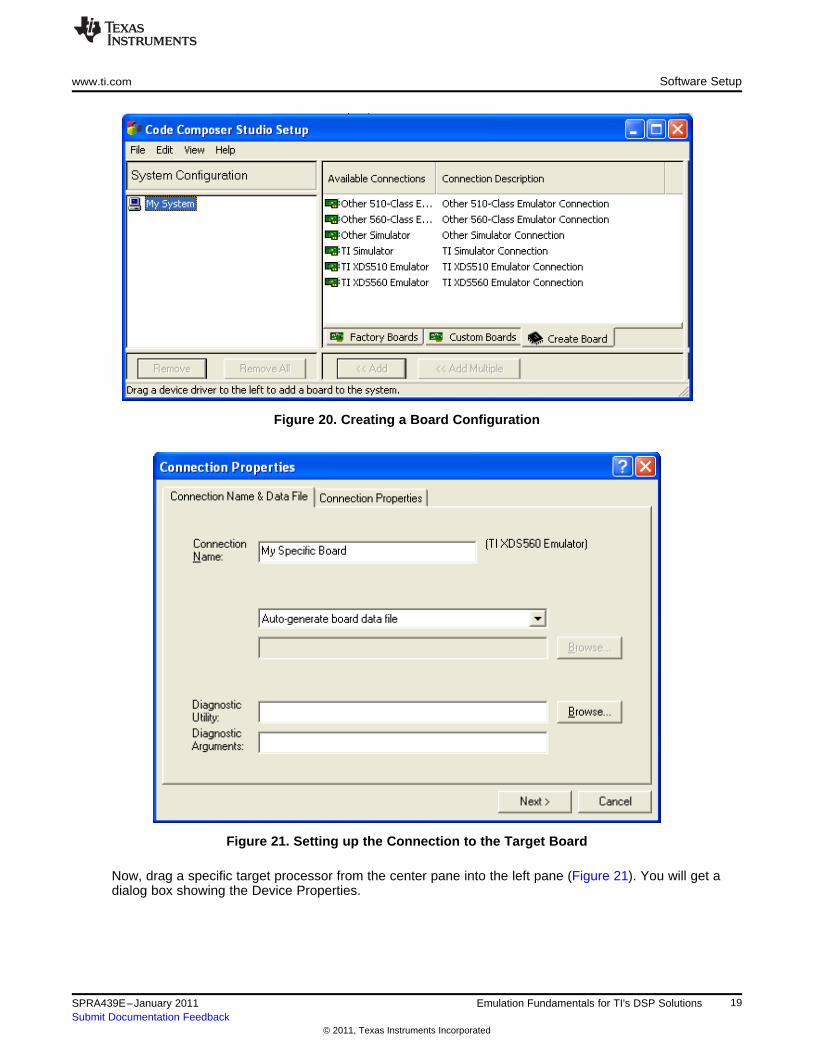
To begin, start from the Create Board tab of CCS_Setup (Figure 20). Then, simply drag the emulatorconnection from those available in the center pane, and drop it into the left pane. This time, give it aunique target Name (Figure 21) and define the connection.
18 Emulation Fundamentals for TI's DSP Solutions SPRA439E–January 2011Submit Documentation Feedback
© 2011, Texas Instruments Incorporated
www.ti.com Software Setup
Figure 20. Creating a Board Configuration
Figure 21. Setting up the Connection to the Target Board
Now, drag a specific target processor from the center pane into the left pane (Figure 21). You will get adialog box showing the Device Properties.
19SPRA439E–January 2011 Emulation Fundamentals for TI's DSP SolutionsSubmit Documentation Feedback
© 2011, Texas Instruments Incorporated
Software Setup www.ti.com
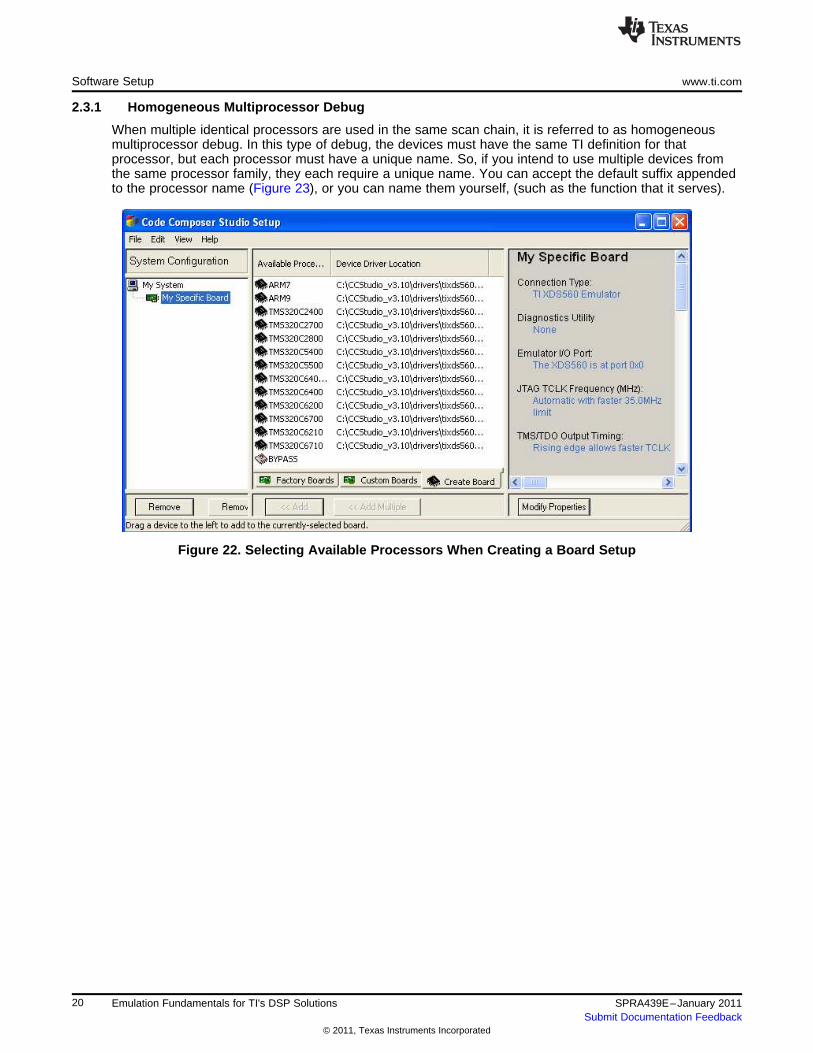
2.3.1 Homogeneous Multiprocessor Debug
When multiple identical processors are used in the same scan chain, it is referred to as homogeneousmultiprocessor debug. In this type of debug, the devices must have the same TI definition for thatprocessor, but each processor must have a unique name. So, if you intend to use multiple devices fromthe same processor family, they each require a unique name. You can accept the default suffix appendedto the processor name (Figure 23), or you can name them yourself, (such as the function that it serves).
Figure 22. Selecting Available Processors When Creating a Board Setup
20 Emulation Fundamentals for TI's DSP Solutions SPRA439E–January 2011Submit Documentation Feedback
© 2011, Texas Instruments Incorporated
www.ti.com Software Setup
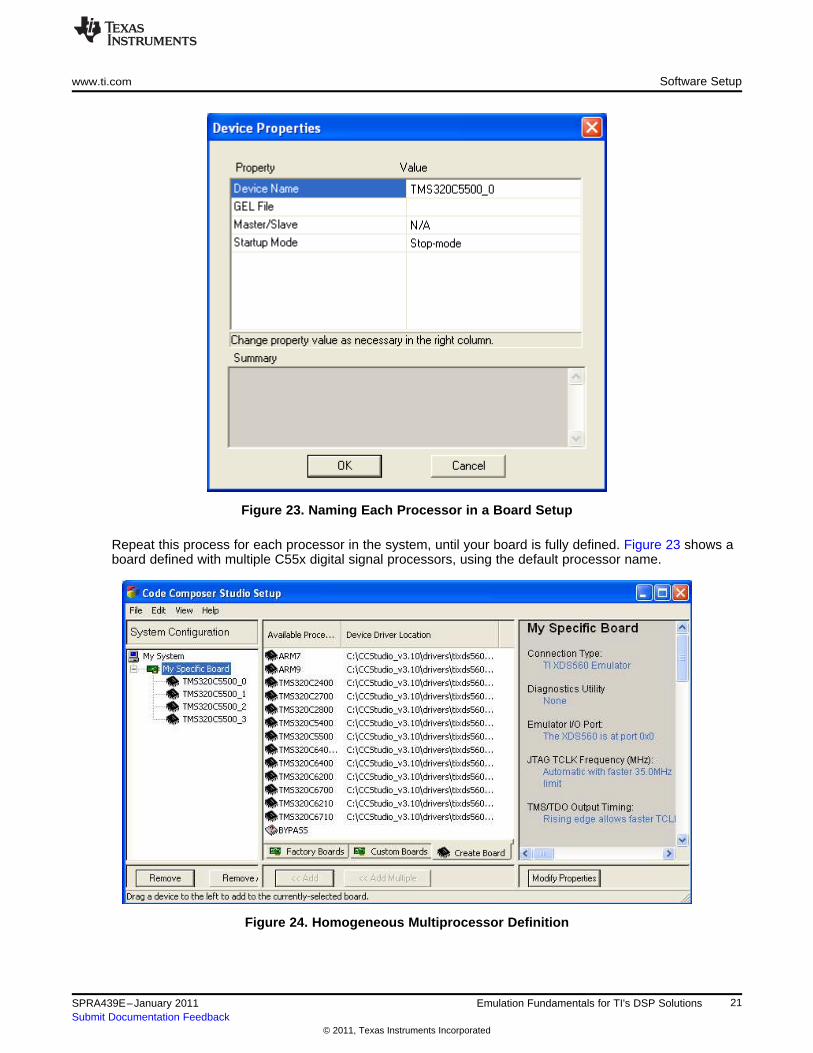
Figure 23. Naming Each Processor in a Board Setup
Repeat this process for each processor in the system, until your board is fully defined. Figure 23 shows aboard defined with multiple C55x digital signal processors, using the default processor name.
Figure 24. Homogeneous Multiprocessor Definition
21SPRA439E–January 2011 Emulation Fundamentals for TI's DSP SolutionsSubmit Documentation Feedback
© 2011, Texas Instruments Incorporated
Software Setup www.ti.com
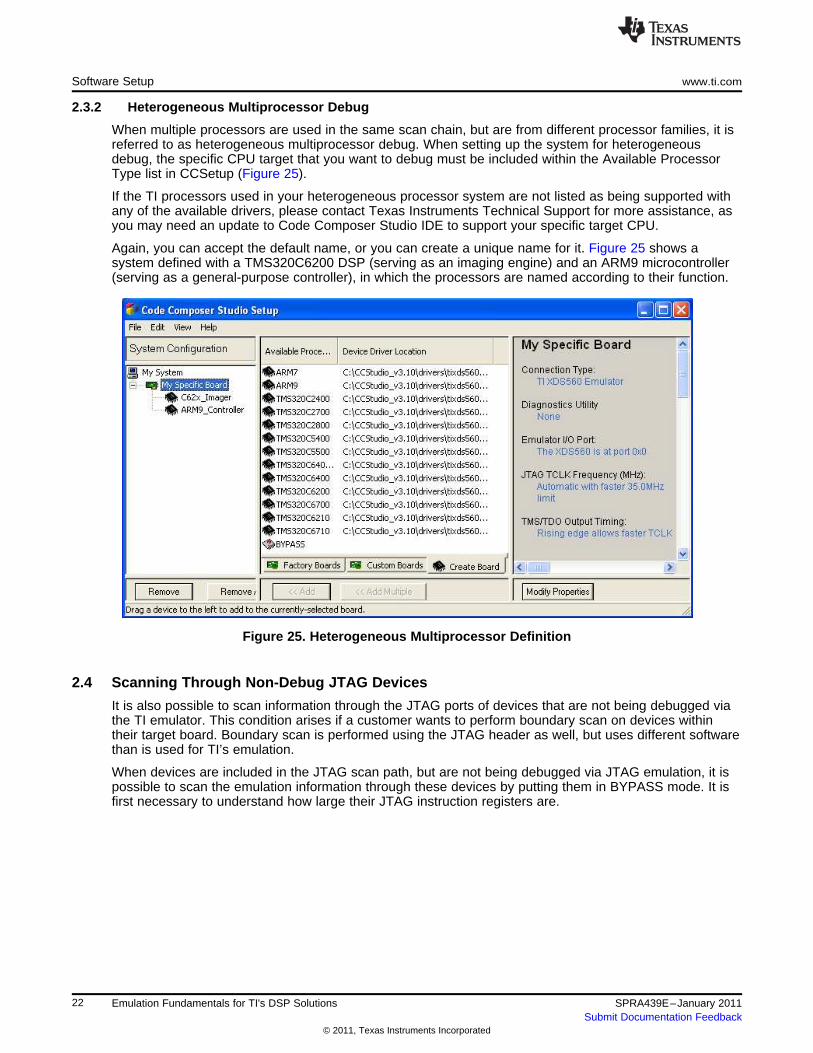
2.3.2 Heterogeneous Multiprocessor Debug
When multiple processors are used in the same scan chain, but are from different processor families, it isreferred to as heterogeneous multiprocessor debug. When setting up the system for heterogeneousdebug, the specific CPU target that you want to debug must be included within the Available ProcessorType list in CCSetup (Figure 25).
If the TI processors used in your heterogeneous processor system are not listed as being supported withany of the available drivers, please contact Texas Instruments Technical Support for more assistance, asyou may need an update to Code Composer Studio IDE to support your specific target CPU.
Again, you can accept the default name, or you can create a unique name for it. Figure 25 shows asystem defined with a TMS320C6200 DSP (serving as an imaging engine) and an ARM9 microcontroller(serving as a general-purpose controller), in which the processors are named according to their function.
Figure 25. Heterogeneous Multiprocessor Definition
2.4 Scanning Through Non-Debug JTAG Devices
It is also possible to scan information through the JTAG ports of devices that are not being debugged viathe TI emulator. This condition arises if a customer wants to perform boundary scan on devices withintheir target board. Boundary scan is performed using the JTAG header as well, but uses different softwarethan is used for TI’s emulation.
When devices are included in the JTAG scan path, but are not being debugged via JTAG emulation, it ispossible to scan the emulation information through these devices by putting them in BYPASS mode. It isfirst necessary to understand how large their JTAG instruction registers are.
22 Emulation Fundamentals for TI's DSP Solutions SPRA439E–January 2011Submit Documentation Feedback
© 2011, Texas Instruments Incorporated
www.ti.com Software Setup
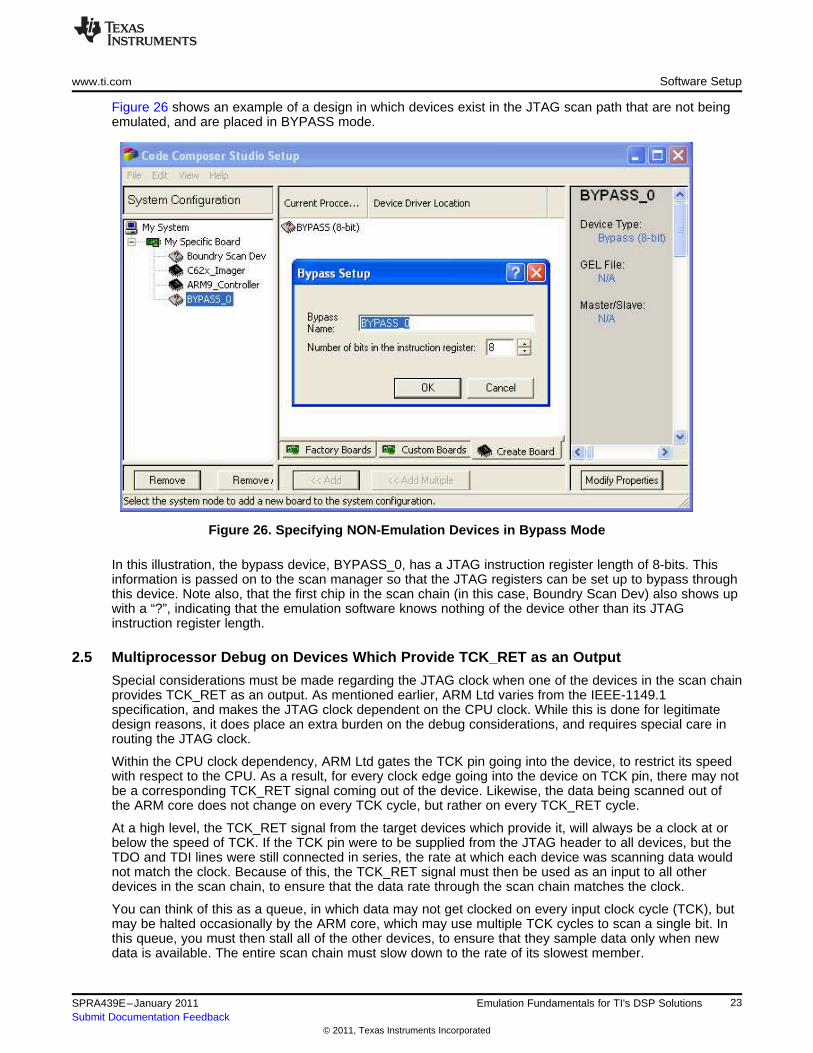
Figure 26 shows an example of a design in which devices exist in the JTAG scan path that are not beingemulated, and are placed in BYPASS mode.
Figure 26. Specifying NON-Emulation Devices in Bypass Mode
In this illustration, the bypass device, BYPASS_0, has a JTAG instruction register length of 8-bits. Thisinformation is passed on to the scan manager so that the JTAG registers can be set up to bypass throughthis device. Note also, that the first chip in the scan chain (in this case, Boundry Scan Dev) also shows upwith a “?”, indicating that the emulation software knows nothing of the device other than its JTAGinstruction register length.
2.5 Multiprocessor Debug on Devices Which Provide TCK_RET as an Output
Special considerations must be made regarding the JTAG clock when one of the devices in the scan chainprovides TCK_RET as an output. As mentioned earlier, ARM Ltd varies from the IEEE-1149.1specification, and makes the JTAG clock dependent on the CPU clock. While this is done for legitimatedesign reasons, it does place an extra burden on the debug considerations, and requires special care inrouting the JTAG clock.
Within the CPU clock dependency, ARM Ltd gates the TCK pin going into the device, to restrict its speedwith respect to the CPU. As a result, for every clock edge going into the device on TCK pin, there may notbe a corresponding TCK_RET signal coming out of the device. Likewise, the data being scanned out ofthe ARM core does not change on every TCK cycle, but rather on every TCK_RET cycle.
At a high level, the TCK_RET signal from the target devices which provide it, will always be a clock at orbelow the speed of TCK. If the TCK pin were to be supplied from the JTAG header to all devices, but theTDO and TDI lines were still connected in series, the rate at which each device was scanning data wouldnot match the clock. Because of this, the TCK_RET signal must then be used as an input to all otherdevices in the scan chain, to ensure that the data rate through the scan chain matches the clock.
You can think of this as a queue, in which data may not get clocked on every input clock cycle (TCK), butmay be halted occasionally by the ARM core, which may use multiple TCK cycles to scan a single bit. Inthis queue, you must then stall all of the other devices, to ensure that they sample data only when newdata is available. The entire scan chain must slow down to the rate of its slowest member.
23SPRA439E–January 2011 Emulation Fundamentals for TI's DSP SolutionsSubmit Documentation Feedback
© 2011, Texas Instruments Incorporated
Establishing Communication With Your Emulation Hardware and Target www.ti.com
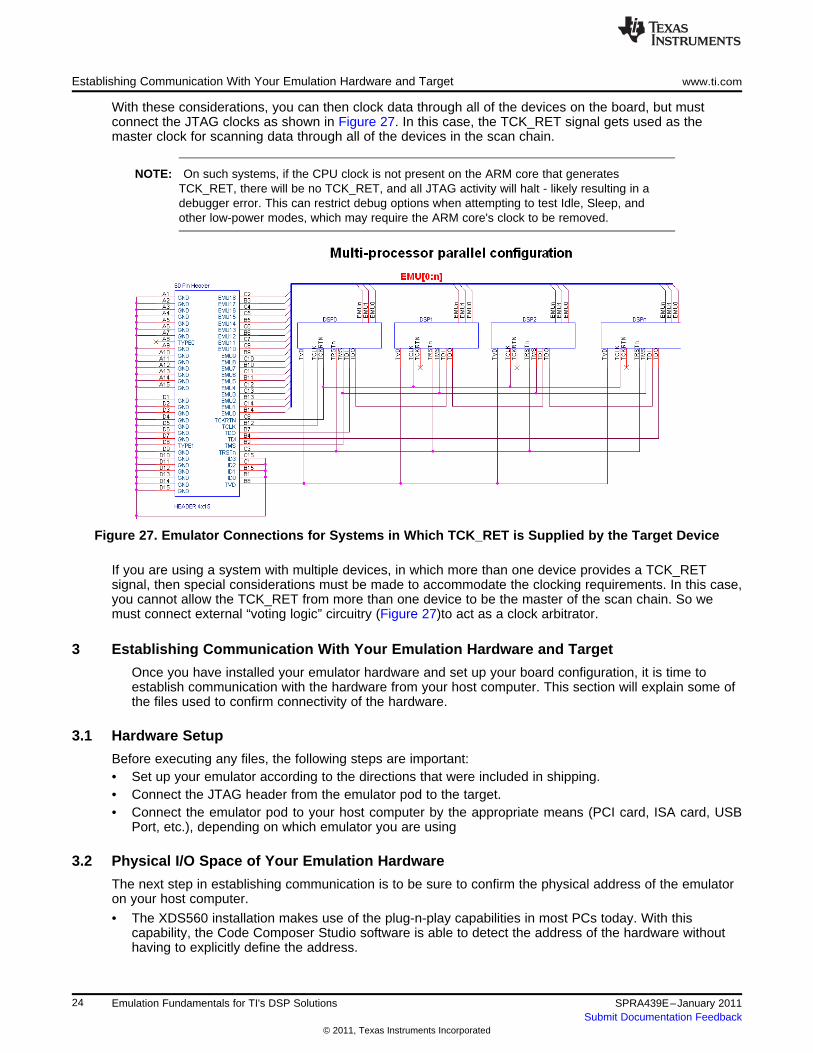
With these considerations, you can then clock data through all of the devices on the board, but mustconnect the JTAG clocks as shown in Figure 27. In this case, the TCK_RET signal gets used as themaster clock for scanning data through all of the devices in the scan chain.
NOTE: On such systems, if the CPU clock is not present on the ARM core that generatesTCK_RET, there will be no TCK_RET, and all JTAG activity will halt - likely resulting in adebugger error. This can restrict debug options when attempting to test Idle, Sleep, andother low-power modes, which may require the ARM core's clock to be removed.
Figure 27. Emulator Connections for Systems in Which TCK_RET is Supplied by the Target Device
If you are using a system with multiple devices, in which more than one device provides a TCK_RETsignal, then special considerations must be made to accommodate the clocking requirements. In this case,you cannot allow the TCK_RET from more than one device to be the master of the scan chain. So wemust connect external “voting logic” circuitry (Figure 27)to act as a clock arbitrator.
3 Establishing Communication With Your Emulation Hardware and Target
Once you have installed your emulator hardware and set up your board configuration, it is time toestablish communication with the hardware from your host computer. This section will explain some ofthe files used to confirm connectivity of the hardware.
3.1 Hardware Setup
Before executing any files, the following steps are important:• Set up your emulator according to the directions that were included in shipping.• Connect the JTAG header from the emulator pod to the target.• Connect the emulator pod to your host computer by the appropriate means (PCI card, ISA card, USB
Port, etc.), depending on which emulator you are using
3.2 Physical I/O Space of Your Emulation Hardware
The next step in establishing communication is to be sure to confirm the physical address of the emulatoron your host computer.
• The XDS560 installation makes use of the plug-n-play capabilities in most PCs today. With thiscapability, the Code Composer Studio software is able to detect the address of the hardware withouthaving to explicitly define the address.
24 Emulation Fundamentals for TI's DSP Solutions SPRA439E–January 2011Submit Documentation Feedback
© 2011, Texas Instruments Incorporated
www.ti.com Establishing Communication With Your Emulation Hardware and Target
• If you are using an ISA slot in a PC, the XDS510 will require 32 bytes of IO space on the PC, andcomes shipped with a default setting of 0x0240 – 0x025F. If this space is already taken within your PC,you can set the board to be addressed elsewhere in the I/O space (0x0280, 0x0320, 0x0340)
• The XDS510 ISA card will require changing switches on the hardware if the default location is notavailable on the host computer.
3.3 Invoking Emulation Reset
You are now able to invoke the emulation-reset software. This software resets the internal emulationdebugging logic as well as several other functions. Depending on which debugging software you areusing, the emulation-reset software may have a different name. The program that ships with CodeComposer Studio is XDSReset.exe, while the older debuggers included the software as EMURST.exe.Among the functions performed by the emulation-reset software are:
1. Check for the correct I/O address of the emulator hardware2. Verify that there is no debugger currently running in multi-processor mode3. Reset the Test Bus Controller4. Check if power exists on the Target Voltage Detect (or Presence Detect) pin. If not, pull TRST_ high
and generate error message “CANNOT DETECT TARGET POWER”. If TVD has power, then pullTRST_ low and then high.
5. Put the device in Test Logic Reset (TLR).6. Check if the device is in TLR. If not, create the error message “XDS510 RESET FAILED.”
In most cases, this setup goes smoothly, and you are now ready to begin debugging your software bystarting the emulator
3.4 Invoking the Emulation Debugger
When invoking the emulation debugger, you simply need to double-click the Code Composer Studio icon– which should execute CC_App.exe. There are several parameters that can be passed when invokingCC_App, including specification of a desired GEL-file, and other options. But most of these options can bespecified from within CC_Setup, as explained earlier. Please refer to the User’s Guide that shipped withyour debugging software for more information on these options.
3.5 Using the Parallel Debug Manager
When debugging systems have more than one TI device defined, you will be required to use the ParallelDebug Manager (PDM), which provides a method of synchronous debugging of your multiprocessorapplication. If you have configured a multiprocessor system within CC_Setup, the PDM will automaticallybe invoked when you start CC_App.
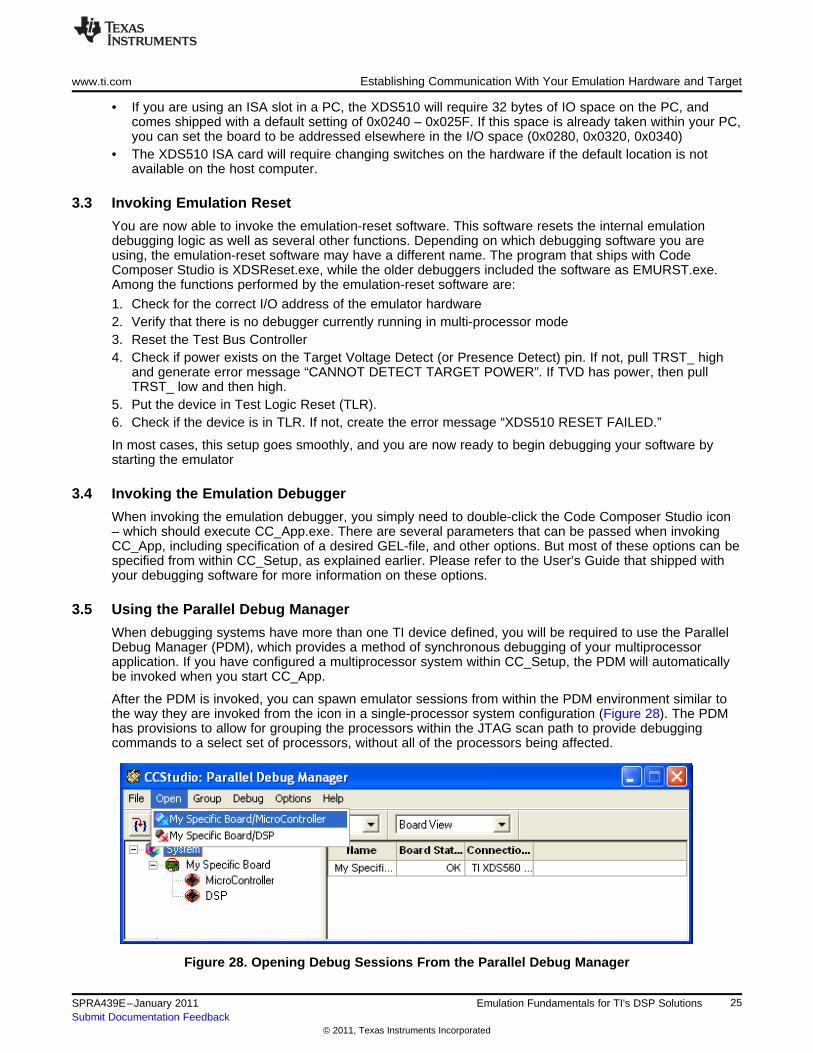
After the PDM is invoked, you can spawn emulator sessions from within the PDM environment similar tothe way they are invoked from the icon in a single-processor system configuration (Figure 28). The PDMhas provisions to allow for grouping the processors within the JTAG scan path to provide debuggingcommands to a select set of processors, without all of the processors being affected.
Figure 28. Opening Debug Sessions From the Parallel Debug Manager
25SPRA439E–January 2011 Emulation Fundamentals for TI's DSP SolutionsSubmit Documentation Feedback
© 2011, Texas Instruments Incorporated
Troubleshooting Emulation Setup Errors www.ti.com
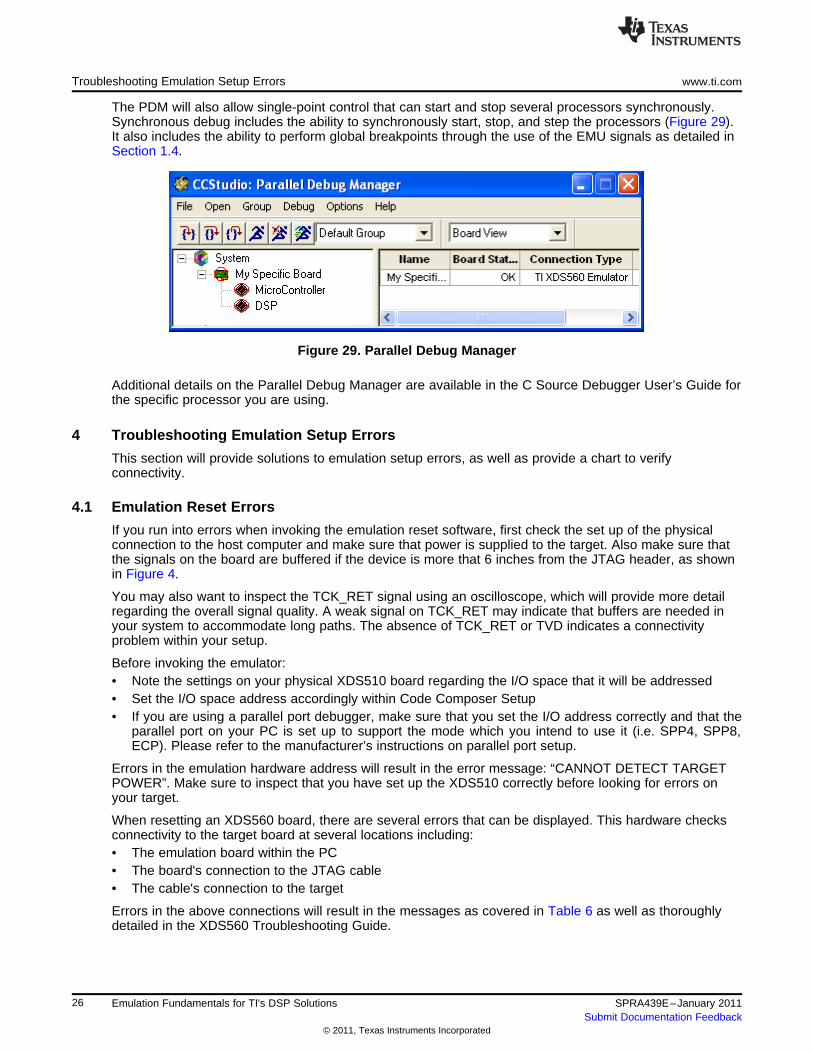
The PDM will also allow single-point control that can start and stop several processors synchronously.Synchronous debug includes the ability to synchronously start, stop, and step the processors (Figure 29).It also includes the ability to perform global breakpoints through the use of the EMU signals as detailed inSection 1.4.
Figure 29. Parallel Debug Manager
Additional details on the Parallel Debug Manager are available in the C Source Debugger User’s Guide forthe specific processor you are using.
4 Troubleshooting Emulation Setup Errors
This section will provide solutions to emulation setup errors, as well as provide a chart to verifyconnectivity.
4.1 Emulation Reset Errors
If you run into errors when invoking the emulation reset software, first check the set up of the physicalconnection to the host computer and make sure that power is supplied to the target. Also make sure thatthe signals on the board are buffered if the device is more that 6 inches from the JTAG header, as shownin Figure 4.
You may also want to inspect the TCK_RET signal using an oscilloscope, which will provide more detailregarding the overall signal quality. A weak signal on TCK_RET may indicate that buffers are needed inyour system to accommodate long paths. The absence of TCK_RET or TVD indicates a connectivityproblem within your setup.
Before invoking the emulator:• Note the settings on your physical XDS510 board regarding the I/O space that it will be addressed• Set the I/O space address accordingly within Code Composer Setup• If you are using a parallel port debugger, make sure that you set the I/O address correctly and that the
parallel port on your PC is set up to support the mode which you intend to use it (i.e. SPP4, SPP8,ECP). Please refer to the manufacturer’s instructions on parallel port setup.
Errors in the emulation hardware address will result in the error message: “CANNOT DETECT TARGETPOWER”. Make sure to inspect that you have set up the XDS510 correctly before looking for errors onyour target.
When resetting an XDS560 board, there are several errors that can be displayed. This hardware checksconnectivity to the target board at several locations including:• The emulation board within the PC• The board's connection to the JTAG cable• The cable's connection to the target
Errors in the above connections will result in the messages as covered in Table 6 as well as thoroughlydetailed in the XDS560 Troubleshooting Guide.
26 Emulation Fundamentals for TI's DSP Solutions SPRA439E–January 2011Submit Documentation Feedback
© 2011, Texas Instruments Incorporated
www.ti.com Troubleshooting Emulation Setup Errors
4.2 Emulator Errors
Occasionally, a target will pass emulation-reset, but yield errors when invoking the emulator. We willaddress some of these errors and possible setup conditions that might yield the errors.
Among the most common problems encountered when starting the emulator are simply systemconfiguration errors. System configuration errors will cause a variety of errors. For example, if the devicesthat are defined within CC_Setup are not the same, or even in the wrong order as those on the physicaltarget, you may see data errors. These errors may include all zeros, all ones (or F's if viewing HEX data),or repetitive bit patterns throughout registers and memory displays.
The emulator is still sometimes able to start with an incorrect board configuration. However, it will not scanout the correct information. This is due to the fact that the scan manager is distributing the informationcoming out of the TDO pin to the corresponding debugger window. If the device ordering in the systemconfiguration is incorrect, the bit-stream coming out of TDO will be incorrectly broken up and the debuggerwindow will not get the correct information for the target device you are intending to debug.
If it appears that the board configuration is correct within CC_Setup and the bits being displayed in theemulator are all zeros or all ones, the physical connection of the JTAG signals should be investigated. Asolder short across a JTAG header can cause signals to be shorted and give erroneous information at theTDO pin. Make sure to test each of the JTAG signals described in Table 1, Table 2, and Table 3.
On some of the newer TI devices, you will see documentation referring to signals called ET0, ET1, andTVD. These signals are identical to the traditional signals called EMU0, EMU1, and PD, respectively.However, there names have been changed to better reflect their use within TI's emulation solutions.
Presence detect (PD) has been re-named target voltage detect to indicate that, not only is it used todetect the presence of a target being connected to the JTAG header, but it is also used to detect the levelof the voltage on the JTAG signals for that device. On the newer emulation hardware, the JTAG pod isable to adapt the voltage to match the voltage of the target. This provides a means of interfacing withlegacy devices, which operated at a higher voltage (up to 5V) as well as the newer devices, whose JTAGsignals are capable of operating down to the CPU voltage of 0.8V.
Monitor each signal using an oscilloscope to determine if it is at the appropriate level, or if it is changingas it should be. (WARNING: Selection of scope and scope probe may impact your measurements, due toprobe capacitance).
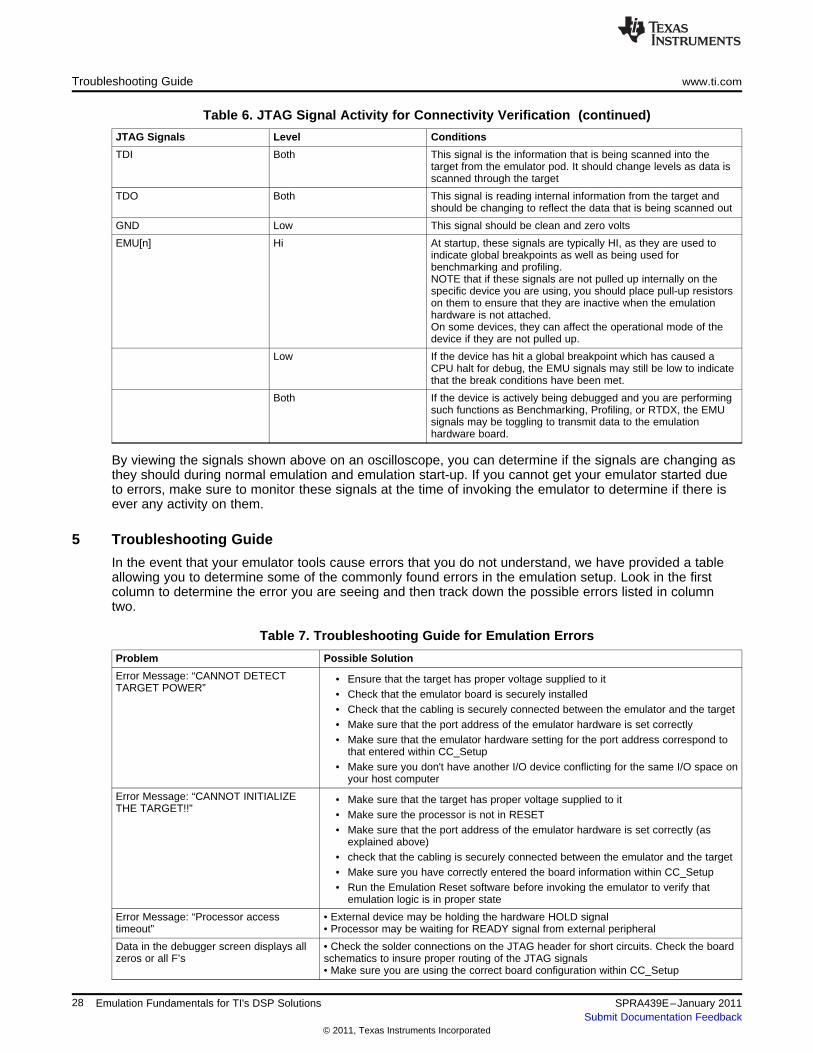
Table 6 shows the standard signals included on the JTAG header that should be investigated and whatlevel should be expected at each pin, depending on the mode of operation.
Table 6. JTAG Signal Activity for Connectivity Verification
JTAG Signals Level Conditions
TVD (PD) Hi VCC or I/O voltage (if different than CPU) of the device if targetboard has power
TCK Both 10.368 MHz square wave clock signal coming from the JTAGpod on the XDS510. Variable clocks possible on XDS560, andother third party emulation HW.
TCK_RET Both Derived from TCK. If this signal is dirty or attenuated, buffersshould be used on the JTAG signals as shown in Figure 4.If this signal is not present, make sure that TCK is present.If this signal is not present on devices that provide TCK_RETfrom the target, make sure that the cores on the device arepowered, clocked and released from reset.
TMS Both Controls the state machine, so it should change every timeanother debug operation is performed
Low When the device is in Run Test/Idle mode
Hi When the device is set in Test Logic Reset state
TRST Active-Low signal: Emulation logic should be out of reset toperform emulation.NOTE that if this signal is not pulled down internally on thespecific device you are using, this signal should have apull-down resistor on it to ensure that the emulation logic isRESET when the emulation hardware is not attached.
27SPRA439E–January 2011 Emulation Fundamentals for TI's DSP SolutionsSubmit Documentation Feedback
© 2011, Texas Instruments Incorporated
Troubleshooting Guide www.ti.com
Table 6. JTAG Signal Activity for Connectivity Verification (continued)
JTAG Signals Level Conditions
TDI Both This signal is the information that is being scanned into thetarget from the emulator pod. It should change levels as data isscanned through the target
TDO Both This signal is reading internal information from the target andshould be changing to reflect the data that is being scanned out
GND Low This signal should be clean and zero volts
EMU[n] Hi At startup, these signals are typically HI, as they are used toindicate global breakpoints as well as being used forbenchmarking and profiling.NOTE that if these signals are not pulled up internally on thespecific device you are using, you should place pull-up resistorson them to ensure that they are inactive when the emulationhardware is not attached.On some devices, they can affect the operational mode of thedevice if they are not pulled up.
Low If the device has hit a global breakpoint which has caused aCPU halt for debug, the EMU signals may still be low to indicatethat the break conditions have been met.
Both If the device is actively being debugged and you are performingsuch functions as Benchmarking, Profiling, or RTDX, the EMUsignals may be toggling to transmit data to the emulationhardware board.
By viewing the signals shown above on an oscilloscope, you can determine if the signals are changing asthey should during normal emulation and emulation start-up. If you cannot get your emulator started dueto errors, make sure to monitor these signals at the time of invoking the emulator to determine if there isever any activity on them.
5 Troubleshooting Guide
In the event that your emulator tools cause errors that you do not understand, we have provided a tableallowing you to determine some of the commonly found errors in the emulation setup. Look in the firstcolumn to determine the error you are seeing and then track down the possible errors listed in columntwo.
Table 7. Troubleshooting Guide for Emulation Errors
Problem Possible Solution
Error Message: “CANNOT DETECT • Ensure that the target has proper voltage supplied to itTARGET POWER”
• Check that the emulator board is securely installed• Check that the cabling is securely connected between the emulator and the target• Make sure that the port address of the emulator hardware is set correctly• Make sure that the emulator hardware setting for the port address correspond to
that entered within CC_Setup• Make sure you don't have another I/O device conflicting for the same I/O space on
your host computer
Error Message: “CANNOT INITIALIZE • Make sure that the target has proper voltage supplied to itTHE TARGET!!”
• Make sure the processor is not in RESET• Make sure that the port address of the emulator hardware is set correctly (as
explained above)• check that the cabling is securely connected between the emulator and the target• Make sure you have correctly entered the board information within CC_Setup• Run the Emulation Reset software before invoking the emulator to verify that
emulation logic is in proper state
Error Message: “Processor access • External device may be holding the hardware HOLD signaltimeout” • Processor may be waiting for READY signal from external peripheral
Data in the debugger screen displays all • Check the solder connections on the JTAG header for short circuits. Check the boardzeros or all F’s schematics to insure proper routing of the JTAG signals
• Make sure you are using the correct board configuration within CC_Setup
28 Emulation Fundamentals for TI's DSP Solutions SPRA439E–January 2011Submit Documentation Feedback
© 2011, Texas Instruments Incorporated
www.ti.com Other Debugging Diagnostic Tools
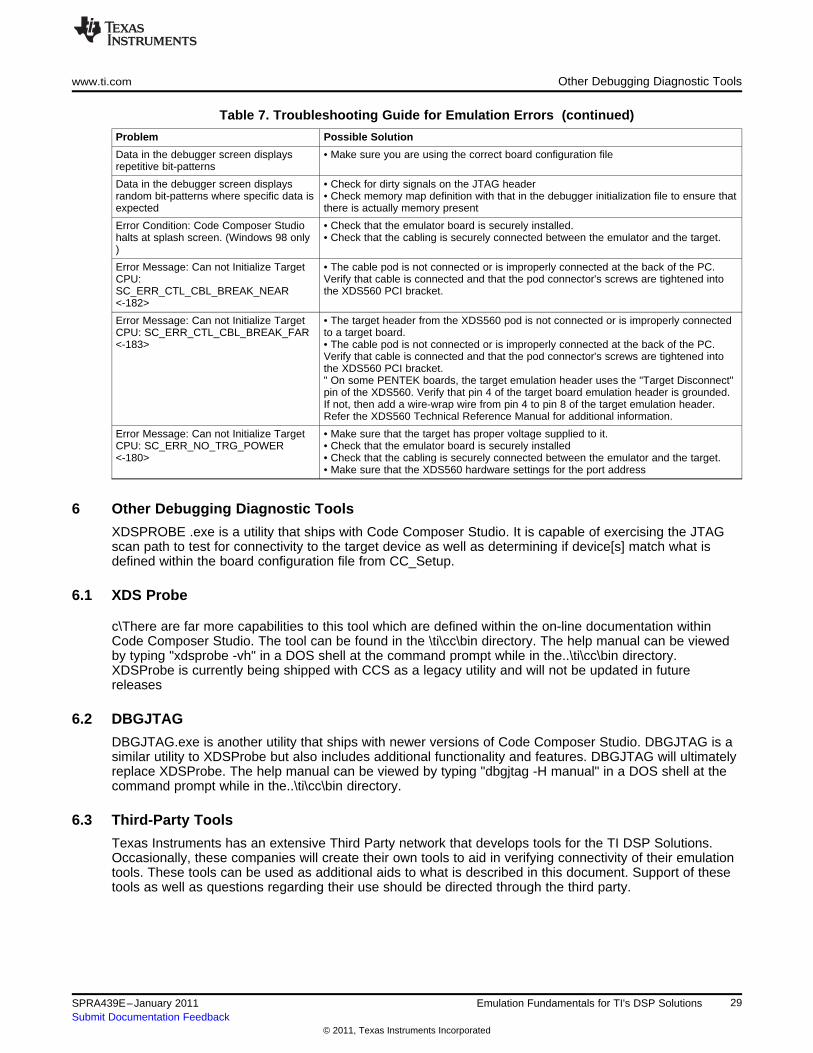
Table 7. Troubleshooting Guide for Emulation Errors (continued)
Problem Possible Solution
Data in the debugger screen displays • Make sure you are using the correct board configuration filerepetitive bit-patterns
Data in the debugger screen displays • Check for dirty signals on the JTAG headerrandom bit-patterns where specific data is • Check memory map definition with that in the debugger initialization file to ensure thatexpected there is actually memory present
Error Condition: Code Composer Studio • Check that the emulator board is securely installed.halts at splash screen. (Windows 98 only • Check that the cabling is securely connected between the emulator and the target.)
Error Message: Can not Initialize Target • The cable pod is not connected or is improperly connected at the back of the PC.CPU: Verify that cable is connected and that the pod connector's screws are tightened intoSC_ERR_CTL_CBL_BREAK_NEAR the XDS560 PCI bracket.<-182>
Error Message: Can not Initialize Target • The target header from the XDS560 pod is not connected or is improperly connectedCPU: SC_ERR_CTL_CBL_BREAK_FAR to a target board.<-183> • The cable pod is not connected or is improperly connected at the back of the PC.
Verify that cable is connected and that the pod connector's screws are tightened intothe XDS560 PCI bracket." On some PENTEK boards, the target emulation header uses the "Target Disconnect"pin of the XDS560. Verify that pin 4 of the target board emulation header is grounded.If not, then add a wire-wrap wire from pin 4 to pin 8 of the target emulation header.Refer the XDS560 Technical Reference Manual for additional information.
Error Message: Can not Initialize Target • Make sure that the target has proper voltage supplied to it.CPU: SC_ERR_NO_TRG_POWER • Check that the emulator board is securely installed<-180> • Check that the cabling is securely connected between the emulator and the target.
• Make sure that the XDS560 hardware settings for the port address
6 Other Debugging Diagnostic Tools
XDSPROBE .exe is a utility that ships with Code Composer Studio. It is capable of exercising the JTAGscan path to test for connectivity to the target device as well as determining if device[s] match what isdefined within the board configuration file from CC_Setup.
6.1 XDS Probe
c\There are far more capabilities to this tool which are defined within the on-line documentation withinCode Composer Studio. The tool can be found in the \ti\cc\bin directory. The help manual can be viewedby typing "xdsprobe -vh" in a DOS shell at the command prompt while in the..\ti\cc\bin directory.XDSProbe is currently being shipped with CCS as a legacy utility and will not be updated in futurereleases
6.2 DBGJTAG
DBGJTAG.exe is another utility that ships with newer versions of Code Composer Studio. DBGJTAG is asimilar utility to XDSProbe but also includes additional functionality and features. DBGJTAG will ultimatelyreplace XDSProbe. The help manual can be viewed by typing "dbgjtag -H manual" in a DOS shell at thecommand prompt while in the..\ti\cc\bin directory.
6.3 Third-Party Tools
Texas Instruments has an extensive Third Party network that develops tools for the TI DSP Solutions.Occasionally, these companies will create their own tools to aid in verifying connectivity of their emulationtools. These tools can be used as additional aids to what is described in this document. Support of thesetools as well as questions regarding their use should be directed through the third party.
29SPRA439E–January 2011 Emulation Fundamentals for TI's DSP SolutionsSubmit Documentation Feedback
© 2011, Texas Instruments Incorporated
References www.ti.com
6.4 Bulletinboard Tools
Texas Instruments also occasionally develops special tools to perform specific tasks and places them onthe TI Electronic Bulletin Board for free access. These tools can be downloaded and used at the user'sdiscretion. These tools are provided for free, and as such, are not supported. Among these tools on theBulletin Board is a tool called XDS_DIAG.EXE. This tool is an older tool, which performs similar functionsto XDSPROBE.
6.5 Future Tools Development
Texas Instruments is dedicated to the development of industry leading development and debug tools. Assuch, TI is continually developing new capabilities, which allow customers increased flexibility and visibilityin software development. Updates to these and other tools may be available upon occasion via theUpdate Advisor within Code Composer Studio. Be sure to check for updates occasionally. Keep in touchwith your local distributor and/or TI representative to stay abreast of the newest tools and technologyavailable. You can also monitor the Bulletin Board and Internet Homepage for DSP Solutions to find newcapabilities as TI announces additional developments
7 References1. IEEE Std 1149.1 (JTAG) Testability Primer (SSYA002)2. JTAG/MPSD Emulation Technical Reference (SPDU079)3. TMS320C5x C-Source Debugger User's Guide (SPRU055)
30 Emulation Fundamentals for TI's DSP Solutions SPRA439E–January 2011Submit Documentation Feedback
© 2011, Texas Instruments Incorporated
IMPORTANT NOTICE
Texas Instruments Incorporated and its subsidiaries (TI) reserve the right to make corrections, modifications, enhancements, improvements,and other changes to its products and services at any time and to discontinue any product or service without notice. Customers shouldobtain the latest relevant information before placing orders and should verify that such information is current and complete. All products aresold subject to TI’s terms and conditions of sale supplied at the time of order acknowledgment.
TI warrants performance of its hardware products to the specifications applicable at the time of sale in accordance with TI’s standardwarranty. Testing and other quality control techniques are used to the extent TI deems necessary to support this warranty. Except wheremandated by government requirements, testing of all parameters of each product is not necessarily performed.
TI assumes no liability for applications assistance or customer product design. Customers are responsible for their products andapplications using TI components. To minimize the risks associated with customer products and applications, customers should provideadequate design and operating safeguards.
TI does not warrant or represent that any license, either express or implied, is granted under any TI patent right, copyright, mask work right,or other TI intellectual property right relating to any combination, machine, or process in which TI products or services are used. Informationpublished by TI regarding third-party products or services does not constitute a license from TI to use such products or services or awarranty or endorsement thereof. Use of such information may require a license from a third party under the patents or other intellectualproperty of the third party, or a license from TI under the patents or other intellectual property of TI.
Reproduction of TI information in TI data books or data sheets is permissible only if reproduction is without alteration and is accompaniedby all associated warranties, conditions, limitations, and notices. Reproduction of this information with alteration is an unfair and deceptivebusiness practice. TI is not responsible or liable for such altered documentation. Information of third parties may be subject to additionalrestrictions.
Resale of TI products or services with statements different from or beyond the parameters stated by TI for that product or service voids allexpress and any implied warranties for the associated TI product or service and is an unfair and deceptive business practice. TI is notresponsible or liable for any such statements.
TI products are not authorized for use in safety-critical applications (such as life support) where a failure of the TI product would reasonablybe expected to cause severe personal injury or death, unless officers of the parties have executed an agreement specifically governingsuch use. Buyers represent that they have all necessary expertise in the safety and regulatory ramifications of their applications, andacknowledge and agree that they are solely responsible for all legal, regulatory and safety-related requirements concerning their productsand any use of TI products in such safety-critical applications, notwithstanding any applications-related information or support that may beprovided by TI. Further, Buyers must fully indemnify TI and its representatives against any damages arising out of the use of TI products insuch safety-critical applications.
TI products are neither designed nor intended for use in military/aerospace applications or environments unless the TI products arespecifically designated by TI as military-grade or "enhanced plastic." Only products designated by TI as military-grade meet militaryspecifications. Buyers acknowledge and agree that any such use of TI products which TI has not designated as military-grade is solely atthe Buyer's risk, and that they are solely responsible for compliance with all legal and regulatory requirements in connection with such use.
TI products are neither designed nor intended for use in automotive applications or environments unless the specific TI products aredesignated by TI as compliant with ISO/TS 16949 requirements. Buyers acknowledge and agree that, if they use any non-designatedproducts in automotive applications, TI will not be responsible for any failure to meet such requirements.
Following are URLs where you can obtain information on other Texas Instruments products and application solutions:
Products Applications
Audio www.ti.com/audio Communications and Telecom www.ti.com/communications
Amplifiers amplifier.ti.com Computers and Peripherals www.ti.com/computers
Data Converters dataconverter.ti.com Consumer Electronics www.ti.com/consumer-apps
DLP® Products www.dlp.com Energy and Lighting www.ti.com/energy
DSP dsp.ti.com Industrial www.ti.com/industrial
Clocks and Timers www.ti.com/clocks Medical www.ti.com/medical
Interface interface.ti.com Security www.ti.com/security
Logic logic.ti.com Space, Avionics and Defense www.ti.com/space-avionics-defense
Power Mgmt power.ti.com Transportation and www.ti.com/automotiveAutomotive
Microcontrollers microcontroller.ti.com Video and Imaging www.ti.com/video
RFID www.ti-rfid.com Wireless www.ti.com/wireless-apps
RF/IF and ZigBee® Solutions www.ti.com/lprf
TI E2E Community Home Page e2e.ti.com
Mailing Address: Texas Instruments, Post Office Box 655303, Dallas, Texas 75265Copyright © 2011, Texas Instruments Incorporated


![Apple ][ Emulation on an AVR Microcontroller Emulation ... · Apple ][ Emulation on an AVR Microcontroller Emulation eines Apple ][ auf einem AVR Mikrocontroller Maximilian Strauch](https://img.pdfslide.net/doc/110x75/5d494b4588c99334058bd1f6/apple-emulation-on-an-avr-microcontroller-emulation-apple-emulation.jpg)