Embed Size (px)
Citation preview

The C
lim
ate
Fre
sk-
EN
-US -
Adult
s–
V7.3
.1–
06/07/2021
AdultsEN-US

The C
lim
ate
Fre
sk-
EN
-US -
Adult
s–
V7.3
.1–
06/07/2021
DebriefReviewCreativityReflective
Time indications: one hour to place the cards, one hour to decorate the Fresk
and one hour to sit down together and discuss what we have learned.
Deal the cards set by set and wait until all cards are down on the table before
dealing the next set.
The aim is for each team to place the cards on the table, find the cause-and-
effect relationships between them and draw arrows between the cards to
illustrate what climate change is about.
You need one deck of cards per team of 6 to 8 ppl, 36'' x 80'' paper roll or paper
tablecloth, pencils, erasers, color felt tip pens and some tape.
How to play
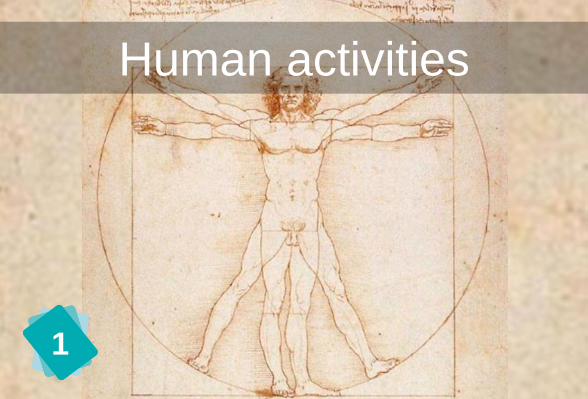
Human activities
1

Set 1
www.climatefresk.org1
This is where it all begins.

Fossil Fuels
9 GtC/yr
Target: zero
CO2 in 2070
Source: IPCC5

Set 1
www.climatefresk.org5
Fossil fuels are coal, petroleum and
natural gas. They are used mainly
for transportation, industry and the
usage of buildings. They emit CO2
when burned.

7
CO2 Emissions
Deforestation
Fossil fuels

Set 1
www.climatefresk.org7
CO2, or carbon dioxide, is the #1
human-made greenhouse gas
in terms of emissions.
CO2 emissions come from our use
of fossil fuels and from
deforestation.

Reflection
Insolation
Infrared radiation
Greenhouse
effect
59°F (15°C)
-0.4°F
(-18°C)
°F
Additional Greenhouse Effect
13

Set 1
www.climatefresk.org13
The greenhouse effect is a natural phenomenon
- and incidentally, the first of the GHGs is water
vapor. Without greenhouse effect, the planet
would be 59°F (33°C) colder and life as we
know it would not be possible.
But CO2 and other GHGs related to human
activity increase the natural greenhouse effect
and unbalance the climate.

+ 9°F (5°C)
+ 3.6°F (2°C)
+ 1.8°F (1°C)
Temperature Rise
21S
ourc
e:
IPC
C

Set 1
www.climatefresk.org21
Here we are referring to the average air temperature
above ground.
It has increased by 1.8°F (1°C) since 1900.
Depending on the scenarios, the rise in temperature
could reach 3.6°F (2°C) to 9°F (5°C) by 2100.
At the end of the last ice age, the average
temperature was only 9°F (5°C) lower than today...
and deglaciation took 10,000 years!

Melting of Sea Ice
18Photo: NASA

Set 1
www.climatefresk.org18
Sea ice melting does not make the sea
level rise (just as a melting ice cube does
not make a glass overflow).
However, when it melts, it gives way to the
much darker sea, which goes on to absorb
more sun rays than white ice.

Sea Level Rise
22
31 inches
(80 cm )
16 inches
(40 cm )
Sourc
e:
IPC
C

Set 1
www.climatefresk.org
Since 1900, sea level has risen by
7.9'' (20 cm). Sea level rise is caused
by the thermal expansion of ocean
waters, and the melting of glaciers
and continental glaciers.
22

2
Industry

Set 2
www.climatefresk.org2
Industry uses fossil fuels and
electricity. It accounts for 40% of
greenhouse gas emissions.

Building Usage
3

Set 2
www.climatefresk.org3
Buildings (housing and
commercial use) use fossil fuels
and electricity. They account for
20% of greenhouse gas
emissions.

Transportation
4

Set 2
www.climatefresk.org4
The transportation sector is
highly dependent on petroleum.
It accounts for 15% of
greenhouse gas emissions.

Deforestation
6

Set 2
www.climatefresk.org6
Deforestation consists in cutting or
burning down trees beyond the
forest's natural ability to regrow.
80% of deforestation is driven by
the expansion of agriculture.
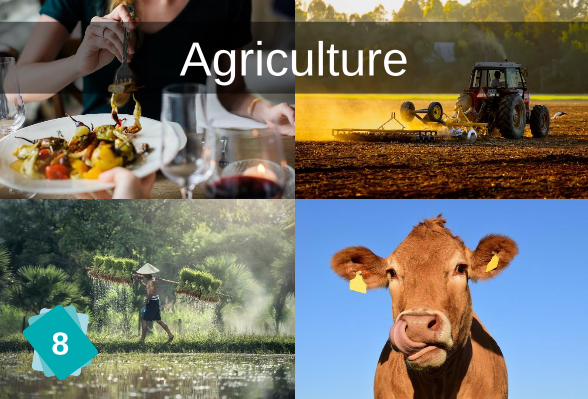
Agriculture
8
Set 2
www.climatefresk.org8
Agriculture does not emit a lot of CO2, but is
responsible for the emission of large quantities
of methane (from cows and rice paddies) and of
nitrous oxide (from fertilizers).
In all, agriculture amounts for 25% of GHGs if
we include induced deforestation.

Other GHGs
9

Set 2
www.climatefresk.org9
CO2 is not the only greenhouse gas
(GHG). Among others are methane
(CH4), and nitrous oxide (N2O), two
gases mainly emitted by agricultural
activities.

Concentration of CO2 in parts per
million (ppm)1000 ppm
280 ppm
410 ppm
400 ppm
Sourc
e:
IPC
C
11

Set 2
www.climatefresk.org11
About half of our CO2 emissions are
captured by natural carbon sinks. The other
half stays in the atmosphere.
Concentrations of CO2 in the air have
increased from 280 to 410 ppm (parts per
million) over the past 150 years.

Carbon SinksS
ourc
e :
GIE
C
12
Atmosphere
Photosynthesis
1/2
1/4
Ocean 1/4
Set 2
www.climatefresk.org12
Half of the CO2 we emit every year is
absorbed by carbon sinks:
- 1/4 by vegetation (through
photosynthesis)
- 1/4 by the ocean
The remaining half stays in the
atmosphere.

Ocean Acidification
Source : GIECOcean a
cid
ific
atio
n a
ccord
ing to
RC
P s
cenario
s (
pH
)
24

Set 2
www.climatefresk.org24
When CO2 dissolves in the ocean, it
turns into acid ions (H2CO3 and
HCO3-). The effect of this
transformation is ocean acidification
(the pH decreases).

Aerosols
10

Set 3
www.climatefresk.org10
Nothing to do with aerosol spray cans.
Aerosols are a type of local pollution that
comes from the incomplete combustion of
fossil fuels. They are bad for human health
and they contribute negatively to radiative
forcing (they cool the climate).

Energy Budget
Ice melting
Soil
dissipation
0,03
0,03
Ocean
Atmosphere0,01
0,93
Sourc
e:
IPC
C
14

Set 3
www.climatefresk.org14
This graph explains where the
energy accumulated on Earth due
to radiative forcing goes: it warms
up the ocean, melts ice, dissipates
into the ground and warms up the
atmosphere.

2,3 W/m²
Source: IPCC
15
Aerosols
Greenhouse
Effect
Radiative Forcing

Set 3
www.climatefresk.org15
Radiative forcing represents the difference between
the energy that arrives on Earth each second and the
energy that is released. In the 5th assessment report
of IPCC, the increase of radiative forcing from human
activities since 1750 is estimated at 2.3 W/m² (Watts
per square meter), with potentially much greater
increases on the way if GHG emissions are not
reduced.

Melting of Glaciers
16

Set 3
www.climatefresk.org16
Almost all glaciers have lost mass.
Hundreds of them have already
disappeared. These glaciers play a
regulating role in the provision of
fresh water.

Increase in Water Temperature
17

Set 3
www.climatefresk.org17
Oceans absorb 93% of the energy
accumulated on Earth. Their
temperature has therefore
increased, especially in the upper
layers. The water expands as it
warms up.

Melting of Ice Caps
19
+ 23 ft (7m)
+ 177 ft (54m)Source: IPCC

Set 3
www.climatefresk.org19
Continental glaciers (or ice sheets) are in
Greenland and Antarctica. If they were to melt
completely, they would cause the ocean to rise
by 23 feet (7 meters) for Greenland and 177
feet (54 meters) for Antarctica.
During the last ice age, ice caps were so much
larger that the sea level was 390 feet (120 m)
lower than today.

Disruption of the Water Cycle
Precipitation variations for scenario RPC 8.5 in
2081-2100 relative to 1986-200520

Set 3
www.climatefresk.org20
If the oceans and the atmosphere are
hotter, the evaporation that takes place at
the ocean surface increases. This means
more rain clouds and more rain. If this
happens on land, then the soil dries out.

Hindered calcification process
© n
oaa
23

Set 4
www.climatefresk.org23
When the pH drops, the formation
of calcium carbonate (and more
specifically, of calcified shells)
becomes more difficult.

Terrestrial Biodiversity
25

Set 4
www.climatefresk.org25
Animals and plants are affected by
the changes in temperature and the
disruption of the water cycle. They
may migrate, become extinct or,
more rarely, proliferate.

River Flooding
26

Set 4
www.climatefresk.org26
The disruption of the water cycle can
bring more water or less water. More
water can lead to river flooding. If the
soil has been dried out by a drought, it
makes things worse because the water
runs off.
Marine Biodiversity
27

Set 4
www.climatefresk.org27
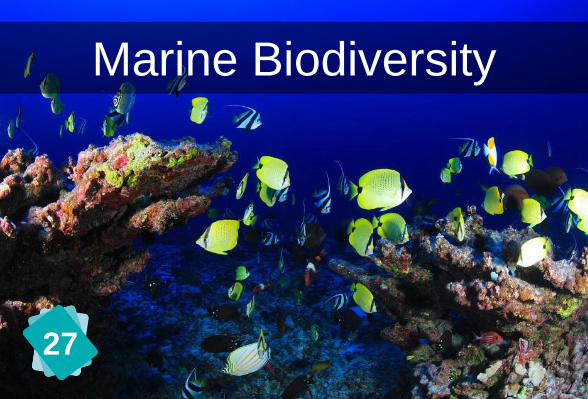
Pteropods and coccolithophores are at
the base of the ocean food chain.
Therefore, if they disappear, all marine
biodiversity is threatened. The warming
of ocean waters also threatens marine
biodiversity.

Hurricanes
34

Set 4
www.climatefresk.org34
Hurricanes use energy from warm
waters at the ocean surface.
Because of global warming, they
are becoming stronger.
Pteropods and Coccolithophores
29

Set 4
www.climatefresk.org29
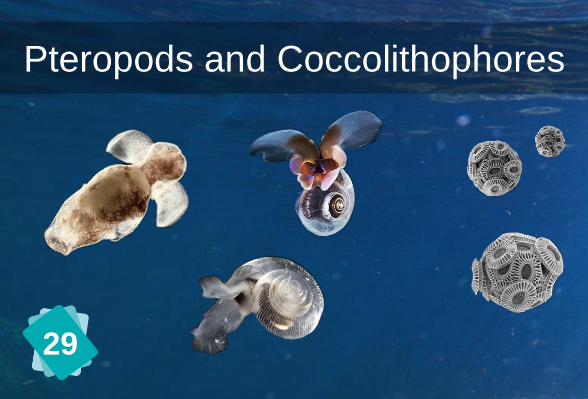
Pteropods are a kind of zooplankton
and Coccolithophores a kind of
phytoplankton. These organisms
have a calcified shell.
Droughts
30
Set 4
www.climatefresk.org30
The disruption of the water cycle can bring
more water or less water. Less water is a
drought. Droughts are likely to become
more frequent in the future.

Coastal flooding
33

Set 4
www.climatefresk.org33
Hurricanes and weather disturbances cause
wind, waves and low pressure conditions. A 1
mB (0,03 inHg) pressure decrease causes a 0.4
inch (1 cm) sea level rise. Therefore hurricanes
can cause coastal flooding (or marine
submersions), amplified by the sea level rise
already caused by global warming.

Vectors of Disease
28

Set 5
www.climatefresk.org28
With global warming, animals
migrate. Some of them carry
diseases and can reach areas
where the population is not
immunized against these diseases.

Freshwater Resources
31

Set 5
www.climatefresk.org31
Freshwater resources are affected
by changes in rainfall and by the
disappearance of glaciers that
regulate the flow of rivers.

Decline in Agricultural Yields
32

Set 5
www.climatefresk.org32
Food production can be affected by
temperature, droughts, extreme
weather events, floods and coastal
flooding (e.g. the Nile Delta).

Forest Fires
35
Set 5
www.climatefresk.org35
Forest fires start more easily during
droughts and heat waves.

Heat Waves
36

Set 5
www.climatefresk.org36
A manifestation of temperature
increase is the multiplication of heat
waves.
Famines
37
Set 5
www.climatefresk.org37
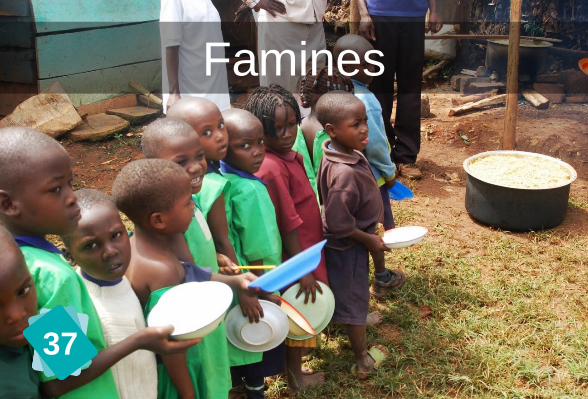
Famines can be caused by lower
agricultural yields and by the
reduction of marine biodiversity.

Human Health
38

Set 5
www.climatefresk.org38
Famines, migration of disease
vectors, heat waves and armed
conflicts can affect human health.

Climate Refugees
39

Set 5
www.climatefresk.org39
Imagine that you live in a place that
has been miraculously spared by
climate change. Several billions of
human beings might want to share this
space with you.
Armed Conflicts
40

Set 5
www.climatefresk.org40
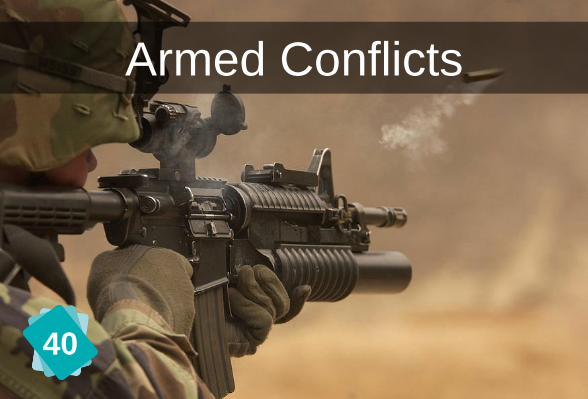
This is how we don't want it to
end...

Permafrost
41

Set 5
www.climatefresk.org41
Permafrost is permanently frozen ground.
Permafrost thawing leads to the decomposition
of organic matter previously frozen
underground, a phenomenon that releases
methane and CO2 into the atmosphere. Beyond
+3.6°F (+2°C), it is almost certain this
phenomenon will accelerate and make the
climate spiral out of control.

Methane Hydrates
42

Set 5
www.climatefresk.org42
Methane hydrates (or methane clathrates)
are a form of ice on the ocean floor, along
continental slopes, that traps methane
molecules. They can become unstable
above +3.6°F (+2°C) .

1
43
10
2
5
6
8 9
14
16 1718
19
20
21
22
27
25
26
28
30
31
32
33
34
35
36
37 38
39 40
4241
https://prezi.com/view/tJJYWcXs12lz9cXCngmH/
11
13
15
Key
Key

The C
lim
ate
Fre
sk-
EN
-US -
Adult
s–
V7.3
.1–
06/07/2021
Scan to join us !
Contact the organisation "La Fresque du Climat"
+33 7 52 10 59 44 / [email protected]
Contact the author Cédric Ringenbach
+33 7 54 57 86 65 / [email protected]
Using this game for business purposes is allowed, and subject to the
payment of a 10% royalty fee or 3€ per participant in the case of
internal use. Comprehensive license available at
https://climatefresk.org/licence/
Payment can be made at:https://climatefresk.org/regler-vos-droits-
dutilisation/
The non commercial use of this game is protected by the Creative Commons
BY-NC-ND license.
The Climate Fresk was developed by Cédric Ringenbach.
Its distribution is managed by the non-profit association "La Fresque
du Climat".
English
EN-GB


![[en-us] bosch-home.com/us/mybosch mybosch [en-us] Dishwasher](https://img.pdfslide.net/doc/110x75/615cc8afbe7e0d1e5a38c77e/en-us-bosch-homecomusmybosch-mybosch-en-us-dishwasher.jpg)