Embed Size (px)
Citation preview
Enable Midstream Partners, LP
First Quarter 2018 Conference Call
May 2, 2018
Forward-looking Statements
Some of the information in this presentation may contain forward-looking statements. Forward-looking statements give our current
expectations, contain projections of results of operations or of financial condition, or forecasts of future events. Words such as
“could,” “will,” “should,” “may,” “assume,” “forecast,” “position,” “predict,” “strategy,” “expect,” “intend,” “plan,” “estimate,” “anticipate,”
“believe,” “project,” “budget,” “potential,” or “continue,” and similar expressions are used to identify forward-looking statements.
Without limiting the generality of the foregoing, forward-looking statements contained in this presentation include our expectations of
plans, strategies, objectives, growth and operational performance, including revenue projections, capital expenditures and tax
position. Forward-looking statements can be affected by assumptions used or by known or unknown risks or uncertainties.
Consequently, no forward-looking statements can be guaranteed.
A forward-looking statement may include a statement of the assumptions or bases underlying the forward-looking statement. We
believe that we have chosen these assumptions or bases in good faith and that they are reasonable. However, when considering
these forward-looking statements, you should keep in mind the risk factors and other cautionary statements in this presentation and
in our Annual Report on Form 10-K for the year ended December 31, 2017 (“Annual Report”), and in our Quarterly Report on Form
10-Q for the quarterly period ended March 31, 2018 (“Quarterly Report”). Those risk factors and other factors noted throughout this
presentation and in our Annual Report and Quarterly Report could cause our actual results to differ materially from those disclosed
in any forward-looking statement. You are cautioned not to place undue reliance on any forward-looking statements.
Any forward-looking statements speak only as of the date on which such statement is made and we undertake no obligation to
correct or update any forward-looking statement, whether as a result of new information or otherwise, except as required by
applicable law.
2
Non-GAAP Financial Measures
3
Gross margin, Adjusted EBITDA, Adjusted interest expense, Distributable cash flow and Distribution coverage ratio are not financial
measures presented in accordance with GAAP. Enable has included these non-GAAP financial measures in this presentation
based on information in its condensed consolidated financial statements.
Gross margin, Adjusted EBITDA, Adjusted interest expense, Distributable cash flow and Distribution coverage ratio are
supplemental financial measures that management and external users of Enable’s financial statements, such as industry analysts,
investors, lenders and rating agencies may use, to assess:
• Enable’s operating performance as compared to those of other publicly traded partnerships in the midstream energy industry,
without regard to capital structure or historical cost basis;
• The ability of Enable’s assets to generate sufficient cash flow to make distributions to its partners;
• Enable’s ability to incur and service debt and fund capital expenditures; and
• The viability of acquisitions and other capital expenditure projects and the returns on investment of various investment
opportunities.
This presentation includes a reconciliation of Gross margin to total revenues, Adjusted EBITDA and Distributable cash flow to net
income attributable to limited partners, Adjusted EBITDA to net cash provided by operating activities and Adjusted interest expense
to interest expense, the most directly comparable GAAP financial measures, as applicable, for each of the periods indicated.
Distribution coverage ratio is a financial performance measure used by management to reflect the relationship between Enable's
financial operating performance and cash distributions. Enable believes that the presentation of Gross margin, Adjusted EBITDA,
Adjusted interest expense, Distributable cash flow and Distribution coverage ratio provides information useful to investors in
assessing its financial condition and results of operations. Gross margin, Adjusted EBITDA, Adjusted interest expense, Distributable
cash flow and Distribution coverage ratio should not be considered as alternatives to net income, operating income, revenue, cash
flow from operating activities, interest expense or any other measure of financial performance or liquidity presented in accordance
with GAAP. Gross margin, Adjusted EBITDA, Adjusted interest expense, Distributable cash flow and Distribution coverage ratio
have important limitations as analytical tools because they exclude some but not all items that affect the most directly comparable
GAAP measures. Additionally, because Gross margin, Adjusted EBITDA, Adjusted interest expense, Distributable cash flow and
Distribution coverage ratio may be defined differently by other companies in Enable’s industry and Enable’s definitions of these
measures may not be comparable to similarly titled measures of other companies, thereby diminishing their utility.
Enable Highlights
4
• Record quarterly natural gas gathered
volumes, processed volumes, natural
gas liquids (NGLs) production and
intrastate transported volumes1
• Record quarterly Adjusted EBITDA and
DCF1,2
• Updated 2018 outlook as a result of
strong business performance
expectations for 2018
• Enable does not expect to access the
equity markets in 2018
• Declared quarterly cash distributions of
$0.318 per unit on all outstanding common
units and $0.625 on all Series A Preferred
Units
1. Since Enable’s formation in May 20132. Gross margin, Adjusted EBITDA and Distributable Cash Flow (DCF) are non-GAAP measures and are reconciled to the nearest GAAP financial measures on
slides 23-25
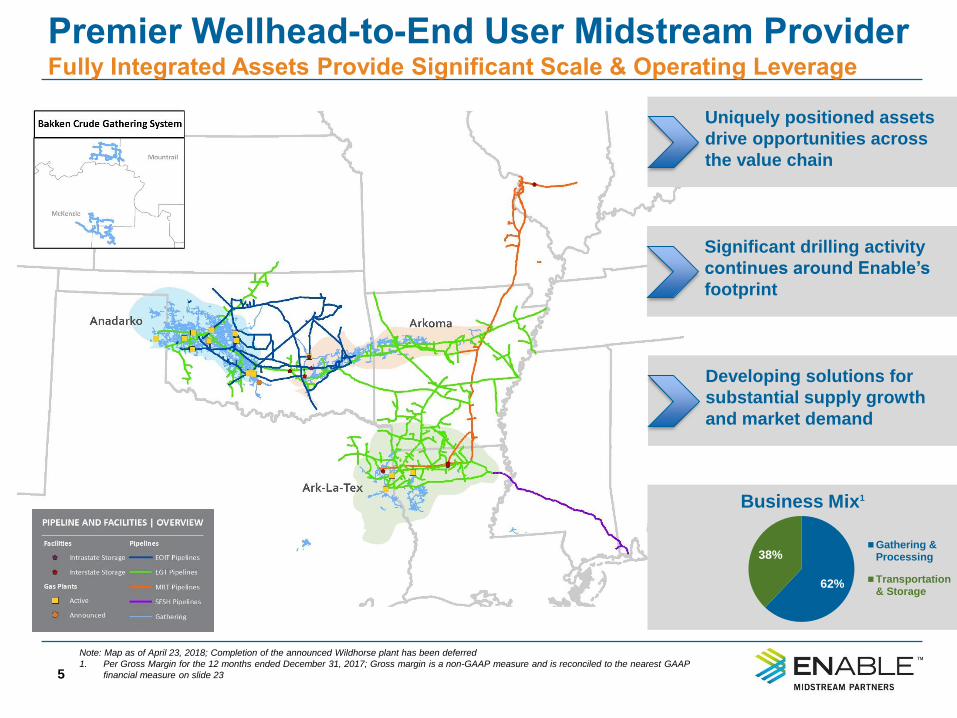
Business Mix1
Premier Wellhead-to-End User Midstream ProviderFully Integrated Assets Provide Significant Scale & Operating Leverage
5
Note: Map as of April 23, 2018; Completion of the announced Wildhorse plant has been deferred
1. Per Gross Margin for the 12 months ended December 31, 2017; Gross margin is a non-GAAP measure and is reconciled to the nearest GAAP
financial measure on slide 23
Uniquely positioned assets
drive opportunities across
the value chain
Significant drilling activity
continues around Enable’s
footprint
Developing solutions for
substantial supply growth
and market demand
62%
38% Gathering &Processing
Transportation& Storage
SCOOP & STACK Driving Anadarko Basin Growth
6
Overview Anadarko Gathered & Processed Volumes
Note: Map as of April 23, 2018 and rigs are per DrillingInfo as of April 25, 2018; Completion of the announced Wildhorse plant has been deferred
1. Processing capacity in the SCOOP and STACK plays; SCOOP designated as Caddo, Carter, Cleveland, Comanche, Garvin, Grady, Jefferson, Love,
McClain, Murray and Stephens counties of Oklahoma; STACK designated as Blaine, Canadian, Custer, Dewey, Garfield, Kingfisher, Logan, Major,
Oklahoma and Woodward counties of Oklahoma
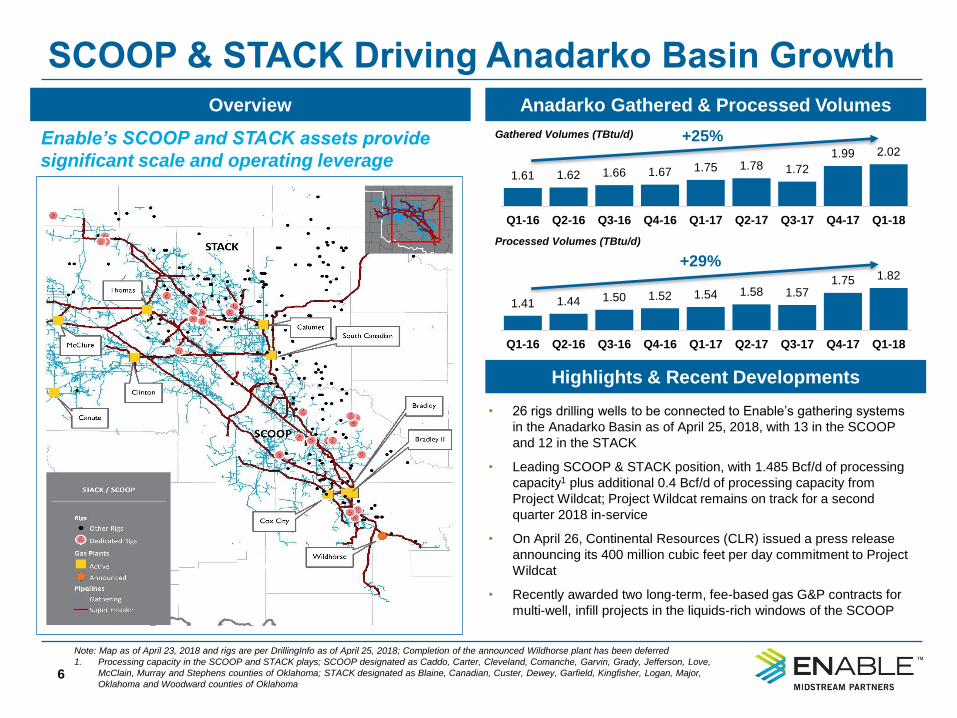
• 26 rigs drilling wells to be connected to Enable’s gathering systems
in the Anadarko Basin as of April 25, 2018, with 13 in the SCOOP
and 12 in the STACK
• Leading SCOOP & STACK position, with 1.485 Bcf/d of processing
capacity1 plus additional 0.4 Bcf/d of processing capacity from
Project Wildcat; Project Wildcat remains on track for a second
quarter 2018 in-service
• On April 26, Continental Resources (CLR) issued a press release
announcing its 400 million cubic feet per day commitment to Project
Wildcat
• Recently awarded two long-term, fee-based gas G&P contracts for
multi-well, infill projects in the liquids-rich windows of the SCOOP
Highlights & Recent Developments
1.61 1.62 1.66 1.67 1.75 1.78 1.72
1.99 2.02
Q1-16 Q2-16 Q3-16 Q4-16 Q1-17 Q2-17 Q3-17 Q4-17 Q1-18
+25%
1.41 1.44 1.50 1.52 1.54 1.58 1.571.75 1.82
Q1-16 Q2-16 Q3-16 Q4-16 Q1-17 Q2-17 Q3-17 Q4-17 Q1-18
+29%
Enable’s SCOOP and STACK assets provide
significant scale and operating leverage
Gathered Volumes (TBtu/d)
Processed Volumes (TBtu/d)
Ark-La-Tex Basin Growth Trend Continues
7
Overview Ark-La-Tex Gathered Volumes
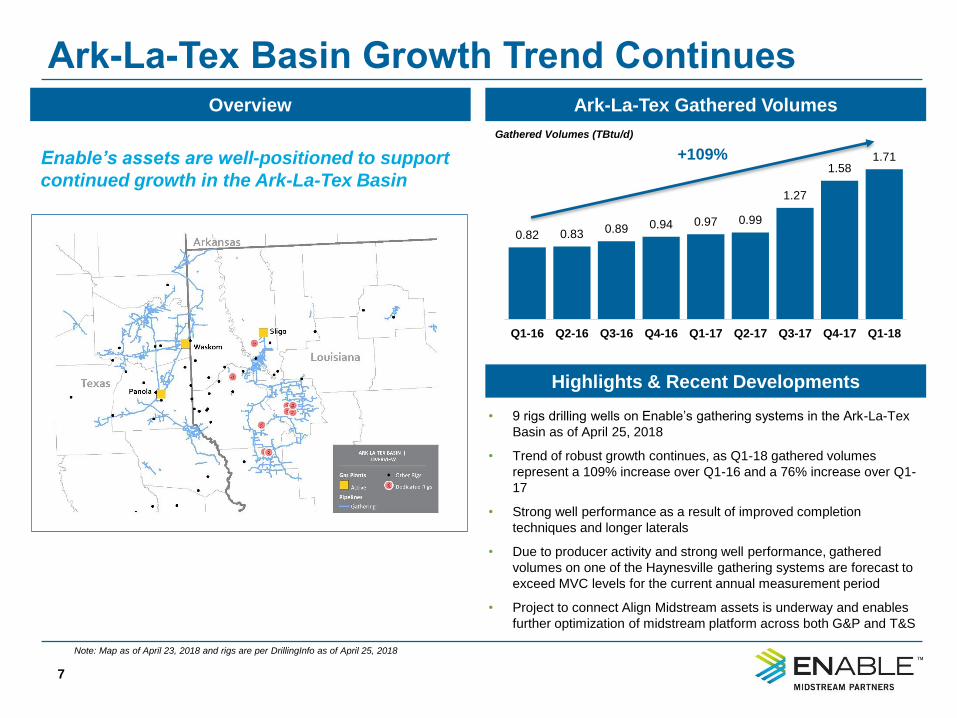
• 9 rigs drilling wells on Enable’s gathering systems in the Ark-La-Tex
Basin as of April 25, 2018
• Trend of robust growth continues, as Q1-18 gathered volumes
represent a 109% increase over Q1-16 and a 76% increase over Q1-
17
• Strong well performance as a result of improved completion
techniques and longer laterals
• Due to producer activity and strong well performance, gathered
volumes on one of the Haynesville gathering systems are forecast to
exceed MVC levels for the current annual measurement period
• Project to connect Align Midstream assets is underway and enables
further optimization of midstream platform across both G&P and T&S
Note: Map as of April 23, 2018 and rigs are per DrillingInfo as of April 25, 2018
0.82 0.83 0.89 0.94 0.97 0.99
1.27
1.581.71
Q1-16 Q2-16 Q3-16 Q4-16 Q1-17 Q2-17 Q3-17 Q4-17 Q1-18
Highlights & Recent Developments
Enable’s assets are well-positioned to support
continued growth in the Ark-La-Tex Basin
+109%
Gathered Volumes (TBtu/d)
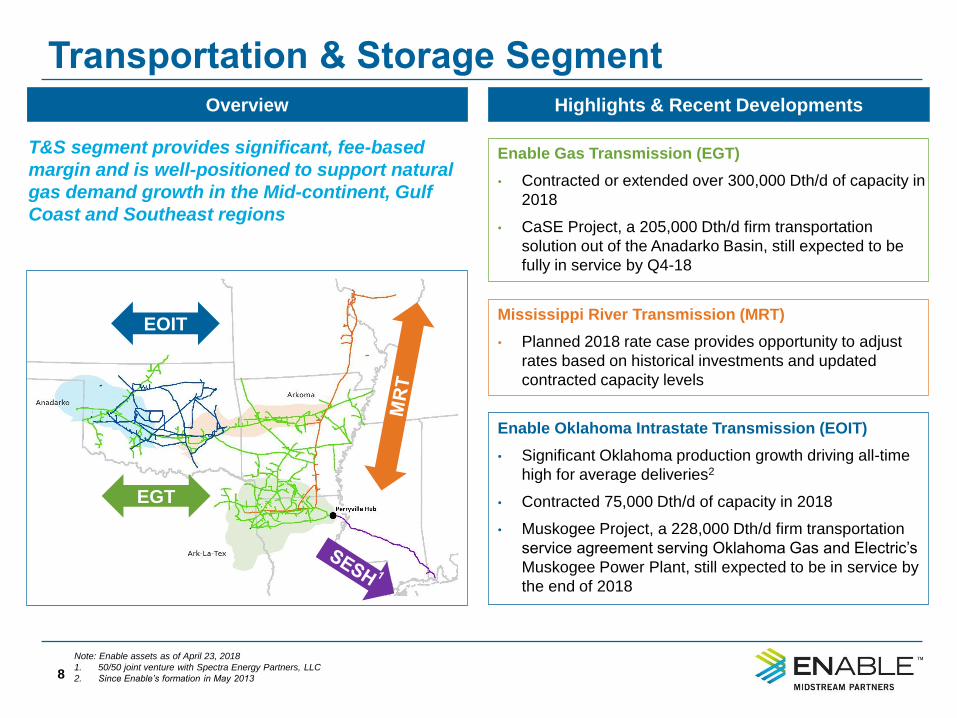
Transportation & Storage Segment
8
Overview
T&S segment provides significant, fee-based
margin and is well-positioned to support natural
gas demand growth in the Mid-continent, Gulf
Coast and Southeast regions
Enable Gas Transmission (EGT)
• Contracted or extended over 300,000 Dth/d of capacity in
2018
• CaSE Project, a 205,000 Dth/d firm transportation
solution out of the Anadarko Basin, still expected to be
fully in service by Q4-18
Highlights & Recent Developments
Note: Enable assets as of April 23, 2018
1. 50/50 joint venture with Spectra Energy Partners, LLC
2. Since Enable’s formation in May 2013
EOIT
EGT
Mississippi River Transmission (MRT)
• Planned 2018 rate case provides opportunity to adjust
rates based on historical investments and updated
contracted capacity levels
Enable Oklahoma Intrastate Transmission (EOIT)
• Significant Oklahoma production growth driving all-time
high for average deliveries2
• Contracted 75,000 Dth/d of capacity in 2018
• Muskogee Project, a 228,000 Dth/d firm transportation
service agreement serving Oklahoma Gas and Electric’s
Muskogee Power Plant, still expected to be in service by
the end of 2018
First Quarter Results
1.84
1.97
Q1-17 Q1-18
21.18
24.83
Q1-17 Q1-18
1.87
2.22
Q1-17 Q1-18
3.29
4.28
Q1-17 Q1-18
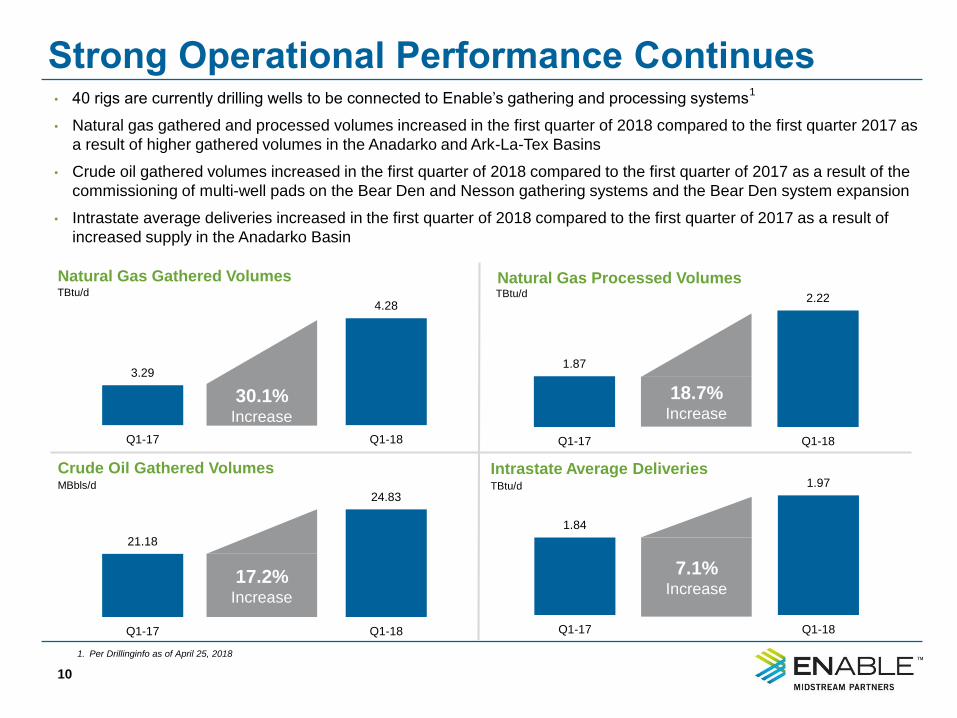
Strong Operational Performance Continues
10
Intrastate Average Deliveries
Natural Gas Gathered Volumes Natural Gas Processed Volumes
TBtu/d
TBtu/d TBtu/d
7.1%Increase
• 40 rigs are currently drilling wells to be connected to Enable’s gathering and processing systems1
• Natural gas gathered and processed volumes increased in the first quarter of 2018 compared to the first quarter 2017 as
a result of higher gathered volumes in the Anadarko and Ark-La-Tex Basins
• Crude oil gathered volumes increased in the first quarter of 2018 compared to the first quarter of 2017 as a result of the
commissioning of multi-well pads on the Bear Den and Nesson gathering systems and the Bear Den system expansion
• Intrastate average deliveries increased in the first quarter of 2018 compared to the first quarter of 2017 as a result of
increased supply in the Anadarko Basin
30.1%Increase
18.7% Increase
17.2% Increase
Crude Oil Gathered VolumesMBbls/d
1. Per Drillinginfo as of April 25, 2018
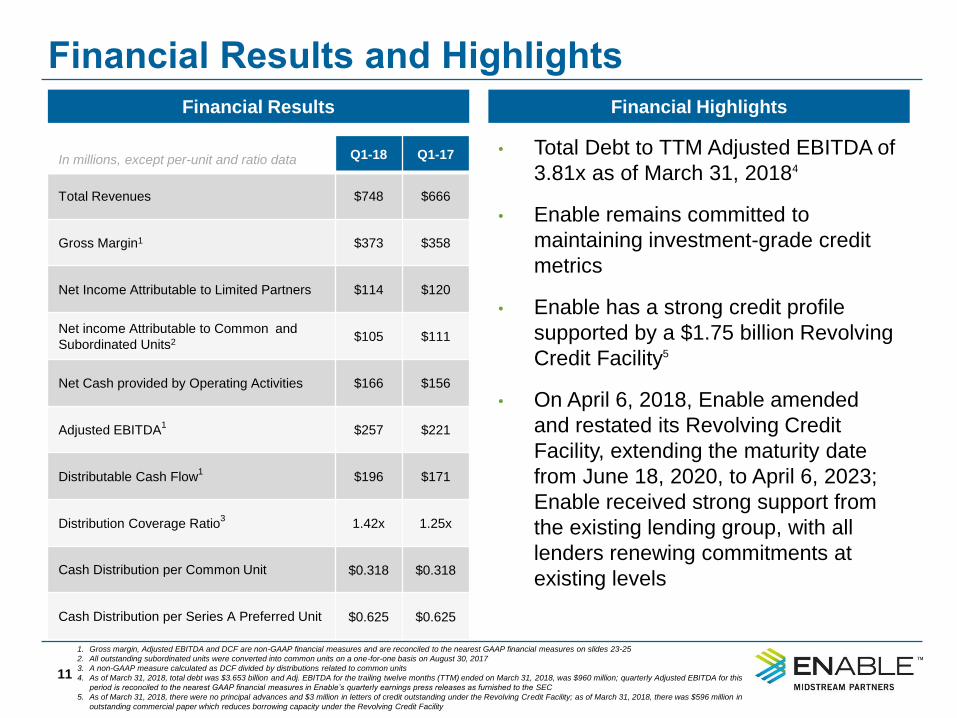
Financial Results and Highlights
11
1. Gross margin, Adjusted EBITDA and DCF are non-GAAP financial measures and are reconciled to the nearest GAAP financial measures on slides 23-25
2. All outstanding subordinated units were converted into common units on a one-for-one basis on August 30, 2017
3. A non-GAAP measure calculated as DCF divided by distributions related to common units
4. As of March 31, 2018, total debt was $3.653 billion and Adj. EBITDA for the trailing twelve months (TTM) ended on March 31, 2018, was $960 million; quarterly Adjusted EBITDA for this
period is reconciled to the nearest GAAP financial measures in Enable’s quarterly earnings press releases as furnished to the SEC
5. As of March 31, 2018, there were no principal advances and $3 million in letters of credit outstanding under the Revolving Credit Facility; as of March 31, 2018, there was $596 million in
outstanding commercial paper which reduces borrowing capacity under the Revolving Credit Facility
In millions, except per-unit and ratio data Q1-18 Q1-17
Total Revenues $748 $666
Gross Margin1 $373 $358
Net Income Attributable to Limited Partners $114 $120
Net income Attributable to Common and
Subordinated Units2 $105 $111
Net Cash provided by Operating Activities $166 $156
Adjusted EBITDA1
$257 $221
Distributable Cash Flow1
$196 $171
Distribution Coverage Ratio3
1.42x 1.25x
Cash Distribution per Common Unit $0.318 $0.318
Cash Distribution per Series A Preferred Unit $0.625 $0.625
Financial Results Financial Highlights
• Total Debt to TTM Adjusted EBITDA of
3.81x as of March 31, 20184
• Enable remains committed to
maintaining investment-grade credit
metrics
• Enable has a strong credit profile
supported by a $1.75 billion Revolving
Credit Facility5
• On April 6, 2018, Enable amended
and restated its Revolving Credit
Facility, extending the maturity date
from June 18, 2020, to April 6, 2023;
Enable received strong support from
the existing lending group, with all
lenders renewing commitments at
existing levels
FERC Announcement and
2018 Outlook
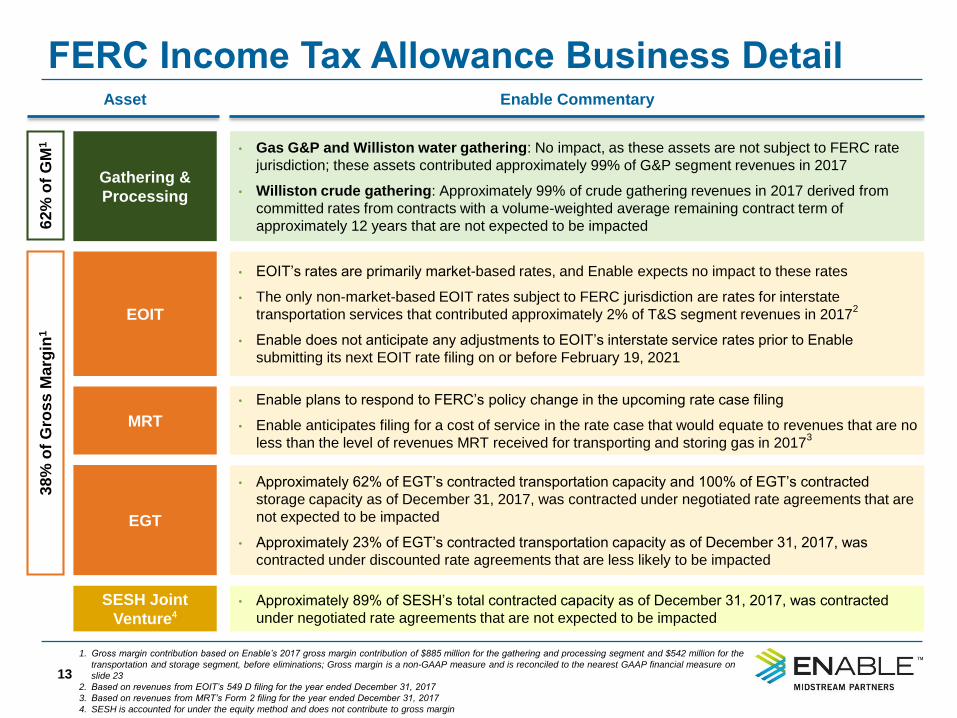
FERC Income Tax Allowance Business Detail
13
Gathering &
Processing
EOIT
EGT
MRT
• Gas G&P and Williston water gathering: No impact, as these assets are not subject to FERC rate
jurisdiction; these assets contributed approximately 99% of G&P segment revenues in 2017
• Williston crude gathering: Approximately 99% of crude gathering revenues in 2017 derived from
committed rates from contracts with a volume-weighted average remaining contract term of
approximately 12 years that are not expected to be impacted
• EOIT’s rates are primarily market-based rates, and Enable expects no impact to these rates
• The only non-market-based EOIT rates subject to FERC jurisdiction are rates for interstate
transportation services that contributed approximately 2% of T&S segment revenues in 20172
• Enable does not anticipate any adjustments to EOIT’s interstate service rates prior to Enable
submitting its next EOIT rate filing on or before February 19, 2021
• Approximately 62% of EGT’s contracted transportation capacity and 100% of EGT’s contracted
storage capacity as of December 31, 2017, was contracted under negotiated rate agreements that are
not expected to be impacted
• Approximately 23% of EGT’s contracted transportation capacity as of December 31, 2017, was
contracted under discounted rate agreements that are less likely to be impacted
• Enable plans to respond to FERC’s policy change in the upcoming rate case filing
• Enable anticipates filing for a cost of service in the rate case that would equate to revenues that are no
less than the level of revenues MRT received for transporting and storing gas in 20173
Asset Enable Commentary
SESH Joint
Venture4
• Approximately 89% of SESH’s total contracted capacity as of December 31, 2017, was contracted
under negotiated rate agreements that are not expected to be impacted
62
% o
f G
M1
38
% o
f G
ros
s M
arg
in1
1. Gross margin contribution based on Enable’s 2017 gross margin contribution of $885 million for the gathering and processing segment and $542 million for the
transportation and storage segment, before eliminations; Gross margin is a non-GAAP measure and is reconciled to the nearest GAAP financial measure on
slide 23
2. Based on revenues from EOIT’s 549 D filing for the year ended December 31, 2017
3. Based on revenues from MRT’s Form 2 filing for the year ended December 31, 2017
4. SESH is accounted for under the equity method and does not contribute to gross margin
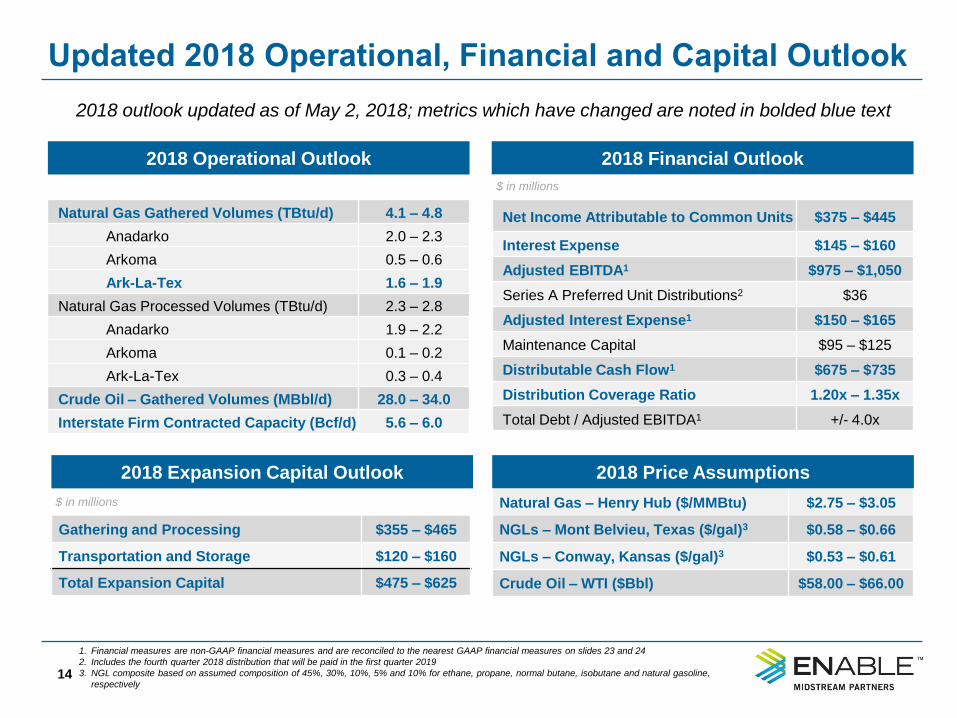
Updated 2018 Operational, Financial and Capital Outlook
14
Natural Gas Gathered Volumes (TBtu/d) 4.1 – 4.8
Anadarko 2.0 – 2.3
Arkoma 0.5 – 0.6
Ark-La-Tex 1.6 – 1.9
Natural Gas Processed Volumes (TBtu/d) 2.3 – 2.8
Anadarko 1.9 – 2.2
Arkoma 0.1 – 0.2
Ark-La-Tex 0.3 – 0.4
Crude Oil – Gathered Volumes (MBbl/d) 28.0 – 34.0
Interstate Firm Contracted Capacity (Bcf/d) 5.6 – 6.0
2018 Operational Outlook 2018 Financial Outlook
$ in millions
Net Income Attributable to Common Units $375 – $445
Interest Expense $145 – $160
Adjusted EBITDA1 $975 – $1,050
Series A Preferred Unit Distributions2 $36
Adjusted Interest Expense1 $150 – $165
Maintenance Capital $95 – $125
Distributable Cash Flow1 $675 – $735
Distribution Coverage Ratio 1.20x – 1.35x
Total Debt / Adjusted EBITDA1 +/- 4.0x
2018 Expansion Capital Outlook
$ in millions
Gathering and Processing $355 – $465
Transportation and Storage $120 – $160
Total Expansion Capital $475 – $625
2018 Price Assumptions
Natural Gas – Henry Hub ($/MMBtu) $2.75 – $3.05
NGLs – Mont Belvieu, Texas ($/gal)3 $0.58 – $0.66
NGLs – Conway, Kansas ($/gal)3 $0.53 – $0.61
Crude Oil – WTI ($Bbl) $58.00 – $66.00
1. Financial measures are non-GAAP financial measures and are reconciled to the nearest GAAP financial measures on slides 23 and 24
2. Includes the fourth quarter 2018 distribution that will be paid in the first quarter 2019
3. NGL composite based on assumed composition of 45%, 30%, 10%, 5% and 10% for ethane, propane, normal butane, isobutane and natural gasoline,
respectively
2018 outlook updated as of May 2, 2018; metrics which have changed are noted in bolded blue text
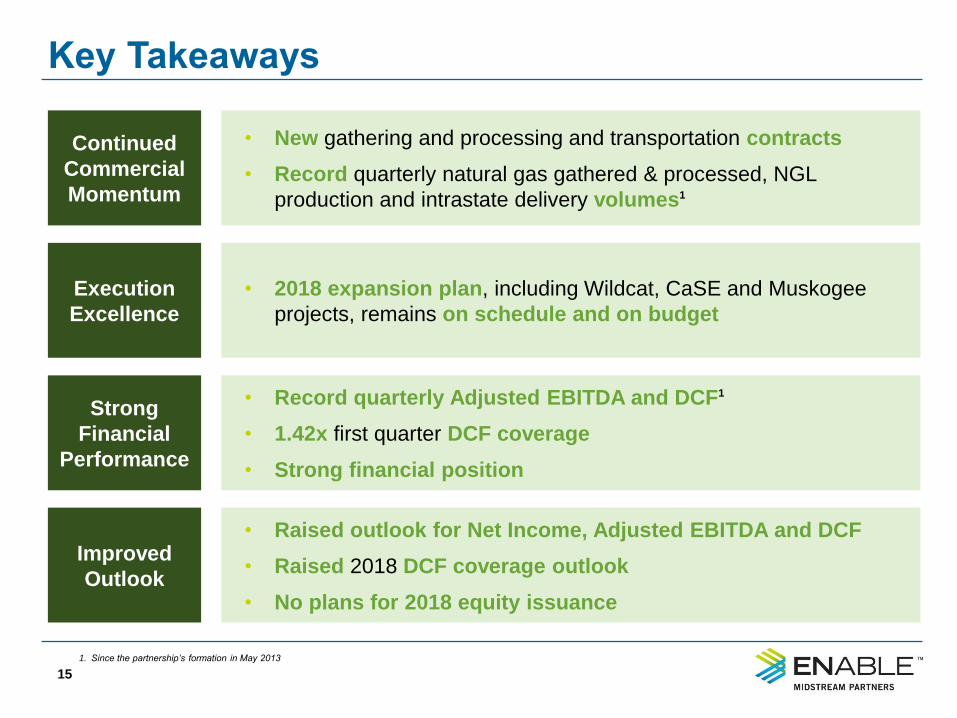
Key Takeaways
15
• New gathering and processing and transportation contracts
• Record quarterly natural gas gathered & processed, NGL
production and intrastate delivery volumes1
• 2018 expansion plan, including Wildcat, CaSE and Muskogee
projects, remains on schedule and on budget
• Record quarterly Adjusted EBITDA and DCF1
• 1.42x first quarter DCF coverage
• Strong financial position
• Raised outlook for Net Income, Adjusted EBITDA and DCF
• Raised 2018 DCF coverage outlook
• No plans for 2018 equity issuance
1. Since the partnership’s formation in May 2013
Continued
Commercial
Momentum
Execution
Excellence
Strong
Financial
Performance
Improved
Outlook
Question and AnswerQuestion and Answer
AppendixAppendix
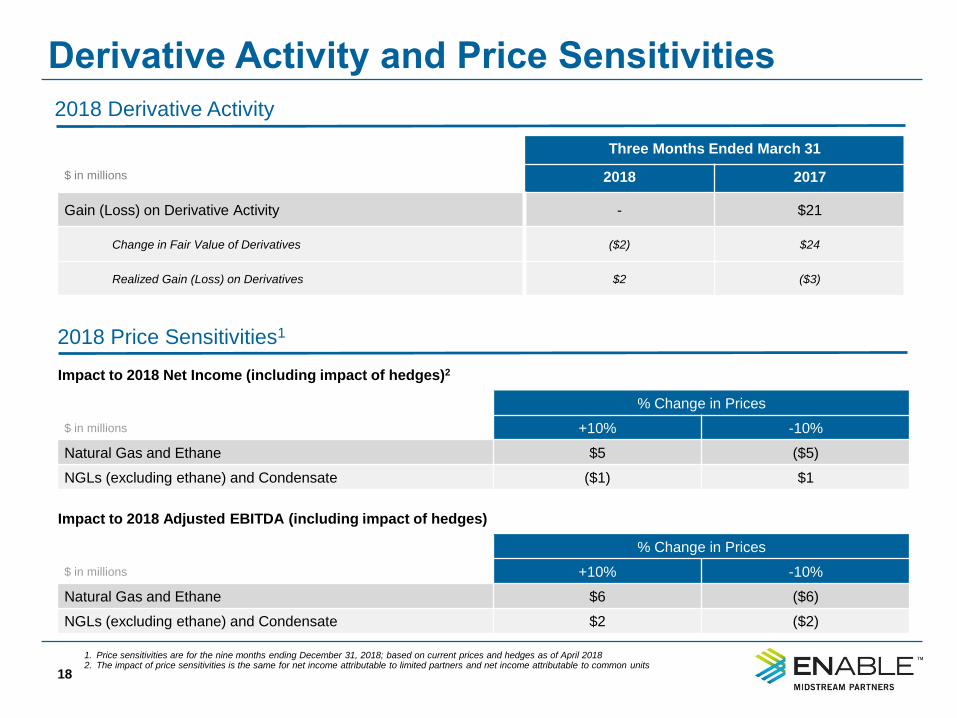
Derivative Activity and Price Sensitivities
18
1. Price sensitivities are for the nine months ending December 31, 2018; based on current prices and hedges as of April 20182. The impact of price sensitivities is the same for net income attributable to limited partners and net income attributable to common units
Impact to 2018 Net Income (including impact of hedges)2
% Change in Prices
$ in millions +10% -10%
Natural Gas and Ethane $5 ($5)
NGLs (excluding ethane) and Condensate ($1) $1
Impact to 2018 Adjusted EBITDA (including impact of hedges)
% Change in Prices
$ in millions +10% -10%
Natural Gas and Ethane $6 ($6)
NGLs (excluding ethane) and Condensate $2 ($2)
Three Months Ended March 31
$ in millions 2018 2017
Gain (Loss) on Derivative Activity - $21
Change in Fair Value of Derivatives ($2) $24
Realized Gain (Loss) on Derivatives $2 ($3)
2018 Price Sensitivities1
2018 Derivative Activity
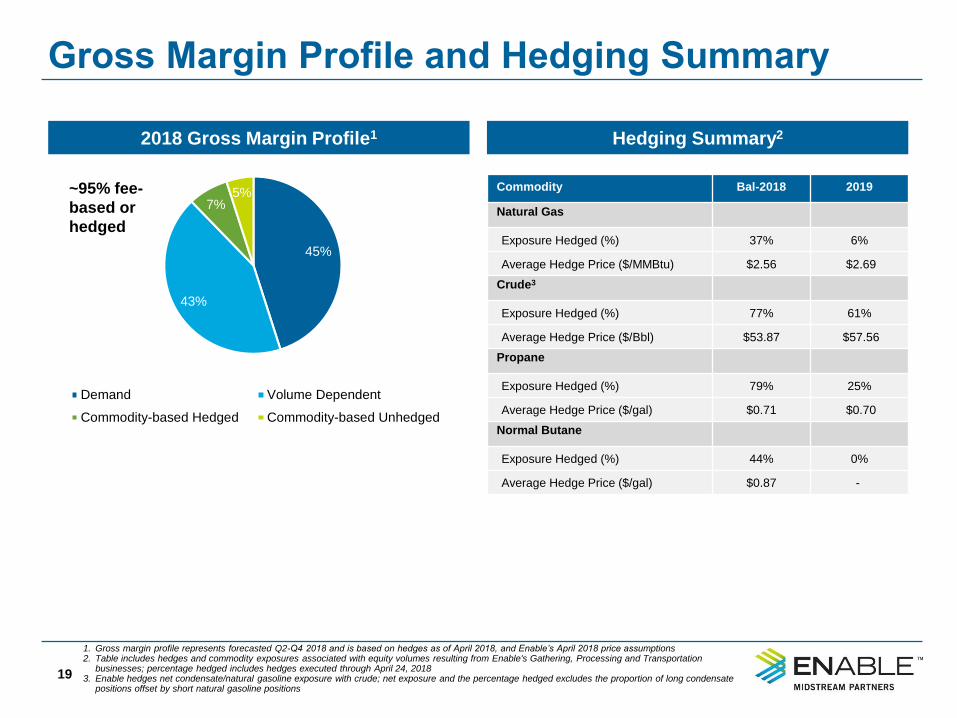
45%
43%
7%5%
Demand Volume Dependent
Commodity-based Hedged Commodity-based Unhedged
Gross Margin Profile and Hedging Summary
19
1. Gross margin profile represents forecasted Q2-Q4 2018 and is based on hedges as of April 2018, and Enable’s April 2018 price assumptions2. Table includes hedges and commodity exposures associated with equity volumes resulting from Enable's Gathering, Processing and Transportation
businesses; percentage hedged includes hedges executed through April 24, 20183. Enable hedges net condensate/natural gasoline exposure with crude; net exposure and the percentage hedged excludes the proportion of long condensate
positions offset by short natural gasoline positions
Commodity Bal-2018 2019
Natural Gas
Exposure Hedged (%) 37% 6%
Average Hedge Price ($/MMBtu) $2.56 $2.69
Crude3
Exposure Hedged (%) 77% 61%
Average Hedge Price ($/Bbl) $53.87 $57.56
Propane
Exposure Hedged (%) 79% 25%
Average Hedge Price ($/gal) $0.71 $0.70
Normal Butane
Exposure Hedged (%) 44% 0%
Average Hedge Price ($/gal) $0.87 -
2018 Gross Margin Profile1 Hedging Summary2
~95% fee-
based or
hedged
Gathering and Processing Segment
20
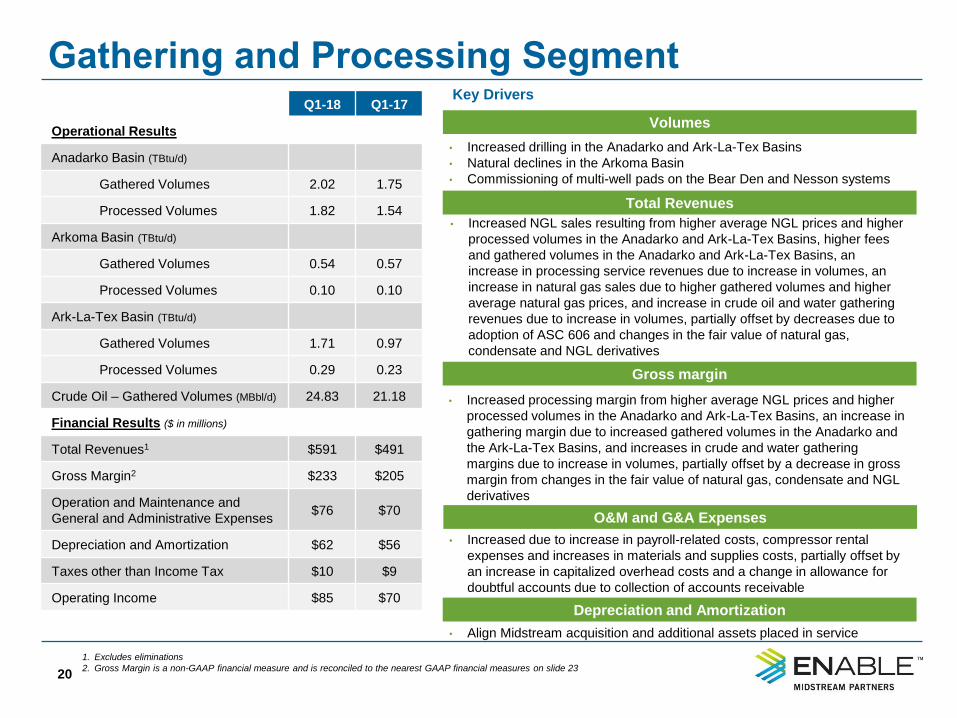
Q1-18 Q1-17
Operational Results
Anadarko Basin (TBtu/d)
Gathered Volumes 2.02 1.75
Processed Volumes 1.82 1.54
Arkoma Basin (TBtu/d)
Gathered Volumes 0.54 0.57
Processed Volumes 0.10 0.10
Ark-La-Tex Basin (TBtu/d)
Gathered Volumes 1.71 0.97
Processed Volumes 0.29 0.23
Crude Oil – Gathered Volumes (MBbl/d) 24.83 21.18
Financial Results ($ in millions)
Total Revenues1 $591 $491
Gross Margin2 $233 $205
Operation and Maintenance and
General and Administrative Expenses$76 $70
Depreciation and Amortization $62 $56
Taxes other than Income Tax $10 $9
Operating Income $85 $70
1. Excludes eliminations
2. Gross Margin is a non-GAAP financial measure and is reconciled to the nearest GAAP financial measures on slide 23
Volumes
• Increased drilling in the Anadarko and Ark-La-Tex Basins
• Natural declines in the Arkoma Basin
• Commissioning of multi-well pads on the Bear Den and Nesson systems
Total Revenues
• Increased NGL sales resulting from higher average NGL prices and higher
processed volumes in the Anadarko and Ark-La-Tex Basins, higher fees
and gathered volumes in the Anadarko and Ark-La-Tex Basins, an
increase in processing service revenues due to increase in volumes, an
increase in natural gas sales due to higher gathered volumes and higher
average natural gas prices, and increase in crude oil and water gathering
revenues due to increase in volumes, partially offset by decreases due to
adoption of ASC 606 and changes in the fair value of natural gas,
condensate and NGL derivatives
Key Drivers
Gross margin
• Increased processing margin from higher average NGL prices and higher
processed volumes in the Anadarko and Ark-La-Tex Basins, an increase in
gathering margin due to increased gathered volumes in the Anadarko and
the Ark-La-Tex Basins, and increases in crude and water gathering
margins due to increase in volumes, partially offset by a decrease in gross
margin from changes in the fair value of natural gas, condensate and NGL
derivatives
O&M and G&A Expenses
• Increased due to increase in payroll-related costs, compressor rental
expenses and increases in materials and supplies costs, partially offset by
an increase in capitalized overhead costs and a change in allowance for
doubtful accounts due to collection of accounts receivable
Depreciation and Amortization
• Align Midstream acquisition and additional assets placed in service
Transportation and Storage Segment
21
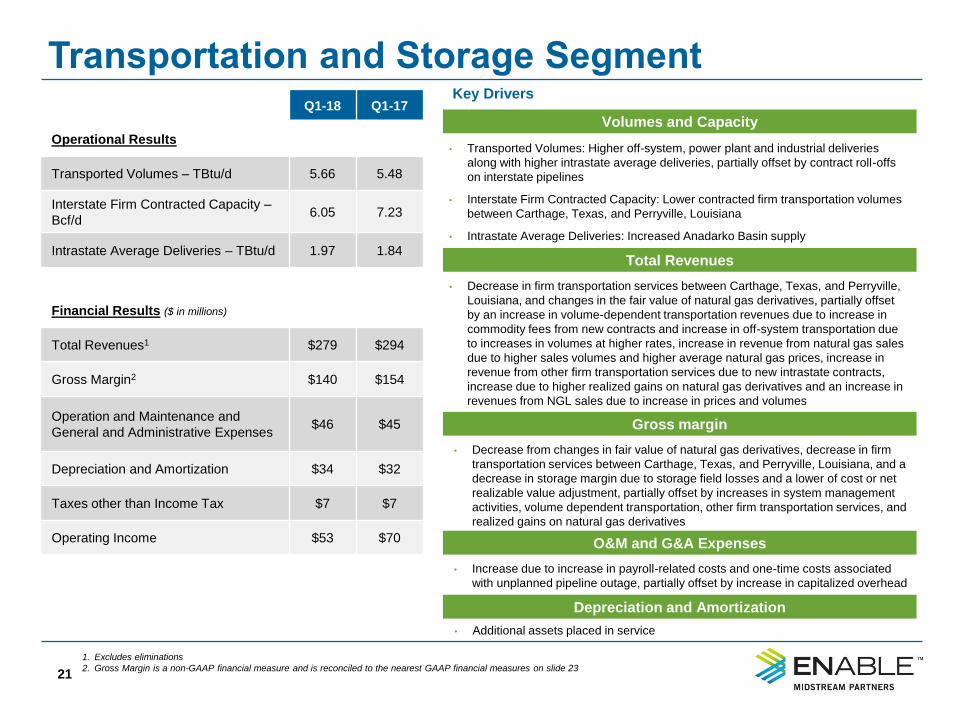
Q1-18 Q1-17
Operational Results
Transported Volumes – TBtu/d 5.66 5.48
Interstate Firm Contracted Capacity –
Bcf/d6.05 7.23
Intrastate Average Deliveries – TBtu/d 1.97 1.84
Financial Results ($ in millions)
Total Revenues1 $279 $294
Gross Margin2 $140 $154
Operation and Maintenance and
General and Administrative Expenses$46 $45
Depreciation and Amortization $34 $32
Taxes other than Income Tax $7 $7
Operating Income $53 $70
1. Excludes eliminations
2. Gross Margin is a non-GAAP financial measure and is reconciled to the nearest GAAP financial measures on slide 23
Volumes and Capacity
• Transported Volumes: Higher off-system, power plant and industrial deliveries
along with higher intrastate average deliveries, partially offset by contract roll-offs
on interstate pipelines
• Interstate Firm Contracted Capacity: Lower contracted firm transportation volumes
between Carthage, Texas, and Perryville, Louisiana
• Intrastate Average Deliveries: Increased Anadarko Basin supply
Total Revenues
Key Drivers
Gross margin
O&M and G&A Expenses
Depreciation and Amortization
• Additional assets placed in service
• Decrease in firm transportation services between Carthage, Texas, and Perryville,
Louisiana, and changes in the fair value of natural gas derivatives, partially offset
by an increase in volume-dependent transportation revenues due to increase in
commodity fees from new contracts and increase in off-system transportation due
to increases in volumes at higher rates, increase in revenue from natural gas sales
due to higher sales volumes and higher average natural gas prices, increase in
revenue from other firm transportation services due to new intrastate contracts,
increase due to higher realized gains on natural gas derivatives and an increase in
revenues from NGL sales due to increase in prices and volumes
• Decrease from changes in fair value of natural gas derivatives, decrease in firm
transportation services between Carthage, Texas, and Perryville, Louisiana, and a
decrease in storage margin due to storage field losses and a lower of cost or net
realizable value adjustment, partially offset by increases in system management
activities, volume dependent transportation, other firm transportation services, and
realized gains on natural gas derivatives
• Increase due to increase in payroll-related costs and one-time costs associated
with unplanned pipeline outage, partially offset by increase in capitalized overhead
Condensed Consolidated Statements of Income
22
1. All outstanding subordinated units converted into common units on a one-for-one basis on August 30, 2017
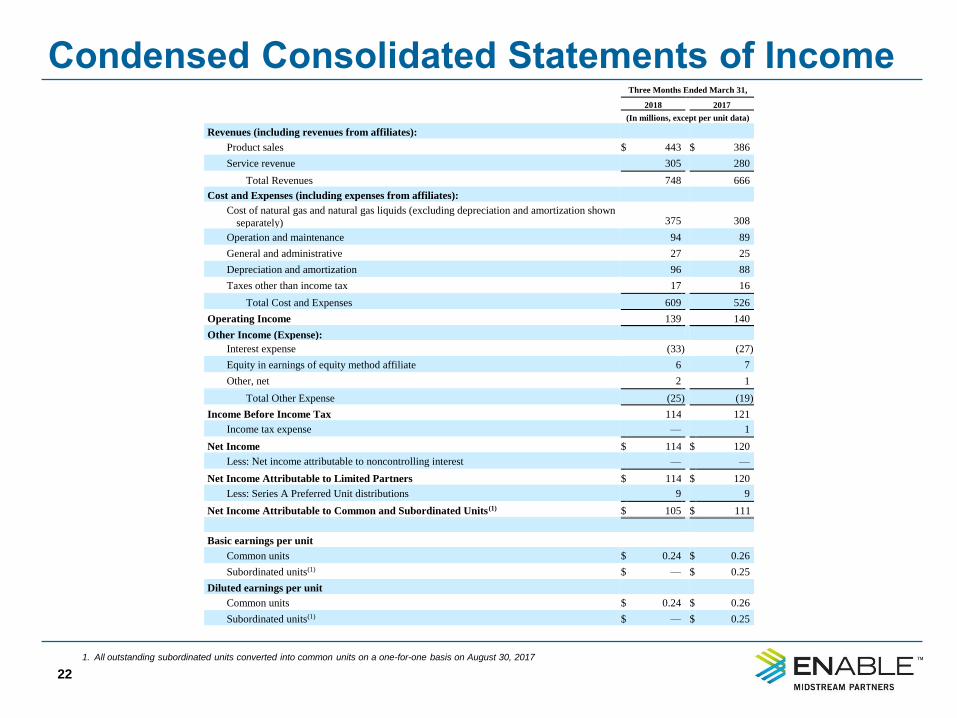
Three Months Ended March 31,
2018 2017
(In millions, except per unit data)
Revenues (including revenues from affiliates):
Product sales $ 443 $ 386
Service revenue 305 280
Total Revenues 748 666
Cost and Expenses (including expenses from affiliates):
Cost of natural gas and natural gas liquids (excluding depreciation and amortization shown
separately) 375
308
Operation and maintenance 94 89
General and administrative 27 25
Depreciation and amortization 96 88
Taxes other than income tax 17 16
Total Cost and Expenses 609 526
Operating Income 139 140
Other Income (Expense):
Interest expense (33 ) (27 )
Equity in earnings of equity method affiliate 6 7
Other, net 2 1
Total Other Expense (25 ) (19 )
Income Before Income Tax 114 121
Income tax expense — 1
Net Income $ 114 $ 120
Less: Net income attributable to noncontrolling interest — —
Net Income Attributable to Limited Partners $ 114 $ 120
Less: Series A Preferred Unit distributions 9 9
Net Income Attributable to Common and Subordinated Units(1) $ 105 $ 111
Basic earnings per unit
Common units $ 0.24 $ 0.26
Subordinated units(1) $ — $ 0.25
Diluted earnings per unit
Common units $ 0.24 $ 0.26
Subordinated units(1) $ — $ 0.25
Non-GAAP Reconciliations
23
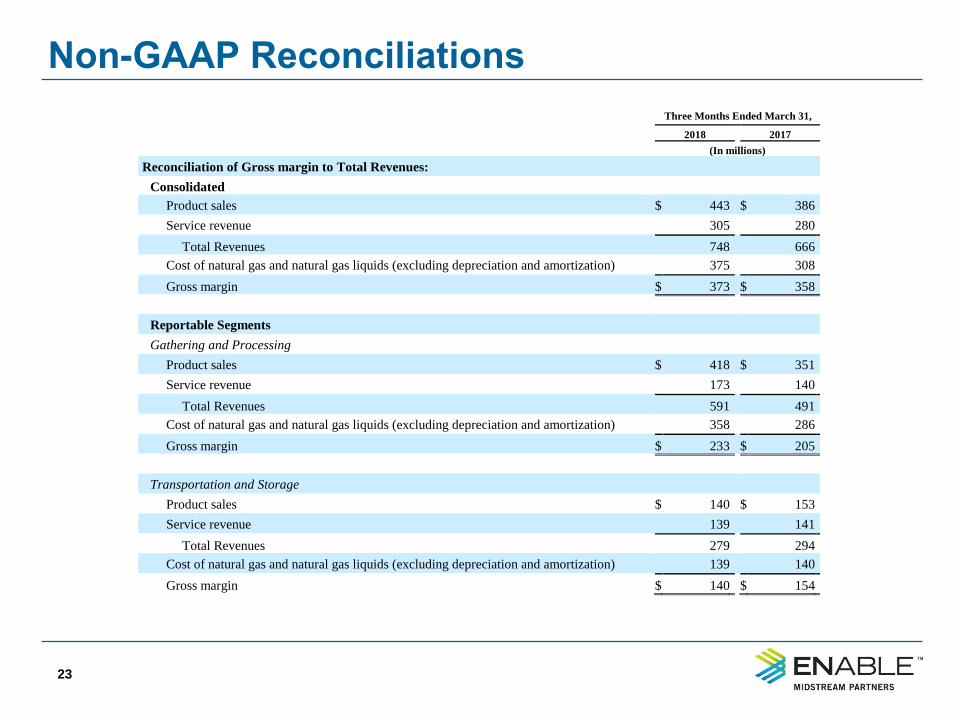
Three Months Ended March 31,
2018 2017
(In millions)
Reconciliation of Gross margin to Total Revenues:
Consolidated
Product sales $ 443 $ 386
Service revenue 305 280
Total Revenues 748 666
Cost of natural gas and natural gas liquids (excluding depreciation and amortization) 375 308
Gross margin $ 373 $ 358
Reportable Segments
Gathering and Processing
Product sales $ 418 $ 351
Service revenue 173 140
Total Revenues 591 491
Cost of natural gas and natural gas liquids (excluding depreciation and amortization) 358 286
Gross margin $ 233 $ 205
Transportation and Storage
Product sales $ 140 $ 153
Service revenue 139 141
Total Revenues 279 294
Cost of natural gas and natural gas liquids (excluding depreciation and amortization) 139 140
Gross margin $ 140 $ 154
Non-GAAP Reconciliations Continued
24
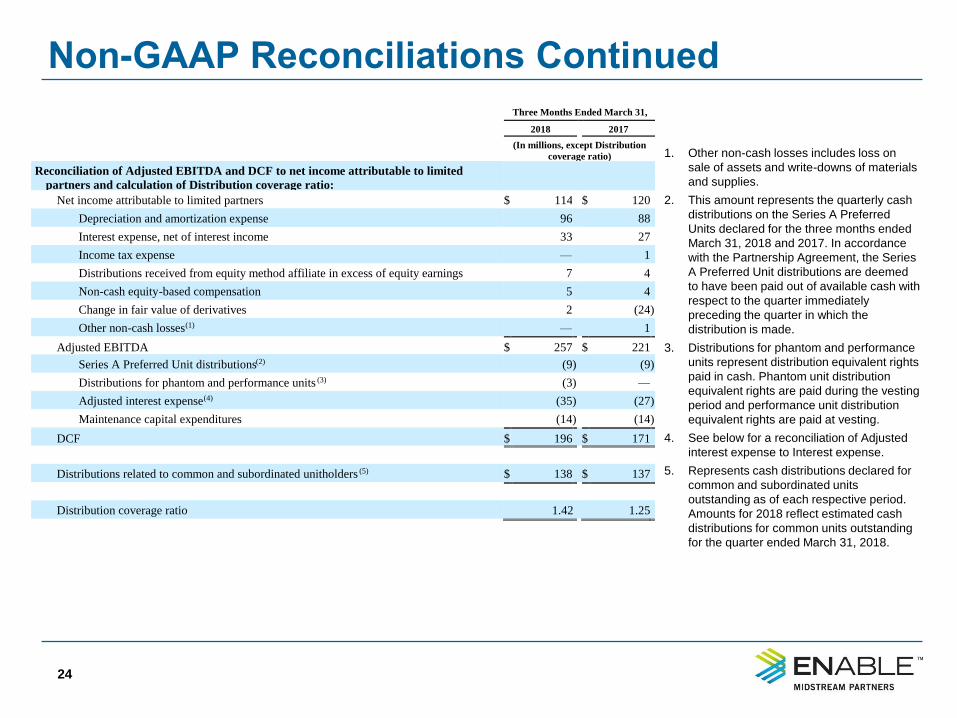
1. Other non-cash losses includes loss on
sale of assets and write-downs of materials
and supplies.
2. This amount represents the quarterly cash
distributions on the Series A Preferred
Units declared for the three months ended
March 31, 2018 and 2017. In accordance
with the Partnership Agreement, the Series
A Preferred Unit distributions are deemed
to have been paid out of available cash with
respect to the quarter immediately
preceding the quarter in which the
distribution is made.
3. Distributions for phantom and performance
units represent distribution equivalent rights
paid in cash. Phantom unit distribution
equivalent rights are paid during the vesting
period and performance unit distribution
equivalent rights are paid at vesting.
4. See below for a reconciliation of Adjusted
interest expense to Interest expense.
5. Represents cash distributions declared for
common and subordinated units
outstanding as of each respective period.
Amounts for 2018 reflect estimated cash
distributions for common units outstanding
for the quarter ended March 31, 2018.
Three Months Ended March 31,
2018 2017
(In millions, except Distribution
coverage ratio)
Reconciliation of Adjusted EBITDA and DCF to net income attributable to limited
partners and calculation of Distribution coverage ratio:
Net income attributable to limited partners $ 114 $ 120
Depreciation and amortization expense 96 88
Interest expense, net of interest income 33 27
Income tax expense — 1
Distributions received from equity method affiliate in excess of equity earnings 7 4
Non-cash equity-based compensation 5 4
Change in fair value of derivatives 2 (24 )
Other non-cash losses(1) — 1
Adjusted EBITDA $ 257 $ 221
Series A Preferred Unit distributions(2) (9 ) (9 )
Distributions for phantom and performance units (3) (3 ) —
Adjusted interest expense(4) (35 ) (27 )
Maintenance capital expenditures (14 ) (14 )
DCF $ 196 $ 171
Distributions related to common and subordinated unitholders (5) $ 138 $ 137
Distribution coverage ratio 1.42 1.25
Non-GAAP Reconciliations Continued
25
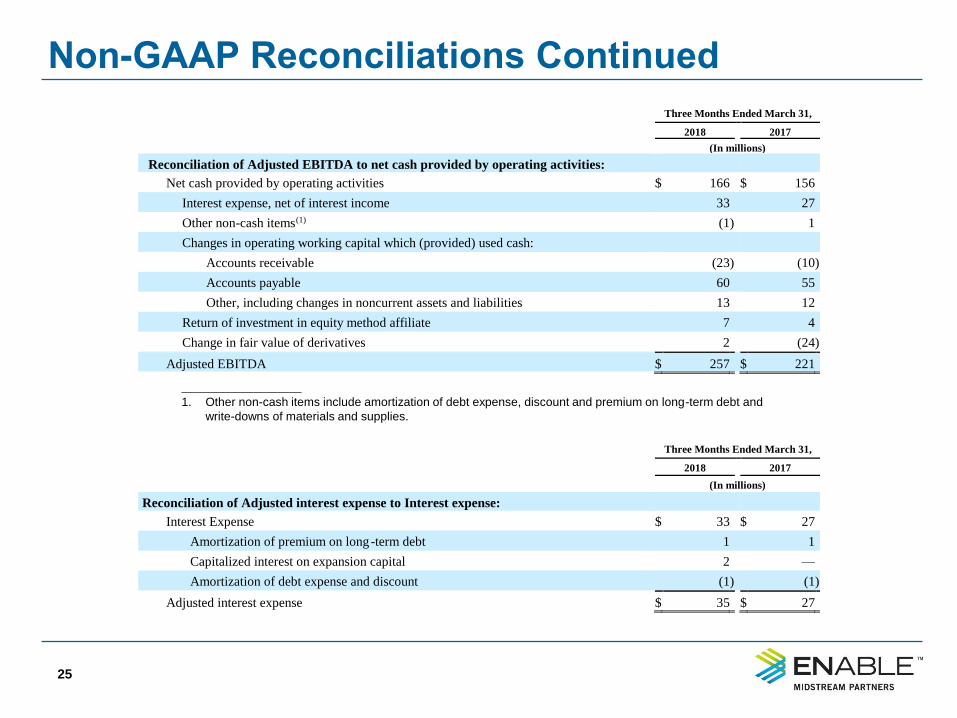
____________________
1. Other non-cash items include amortization of debt expense, discount and premium on long-term debt and
write-downs of materials and supplies.
Three Months Ended March 31,
2018 2017
(In millions)
Reconciliation of Adjusted EBITDA to net cash provided by operating activities:
Net cash provided by operating activities $ 166 $ 156
Interest expense, net of interest income 33 27
Other non-cash items(1) (1 ) 1
Changes in operating working capital which (provided) used cash:
Accounts receivable (23 ) (10 )
Accounts payable 60 55
Other, including changes in noncurrent assets and liabilities 13 12
Return of investment in equity method affiliate 7 4
Change in fair value of derivatives 2 (24 )
Adjusted EBITDA $ 257 $ 221
Three Months Ended March 31,
2018 2017
(In millions)
Reconciliation of Adjusted interest expense to Interest expense:
Interest Expense $ 33 $ 27
Amortization of premium on long-term debt 1 1
Capitalized interest on expansion capital 2 —
Amortization of debt expense and discount (1 ) (1 )
Adjusted interest expense $ 35 $ 27
Forward Looking Non-GAAP Reconciliation
26
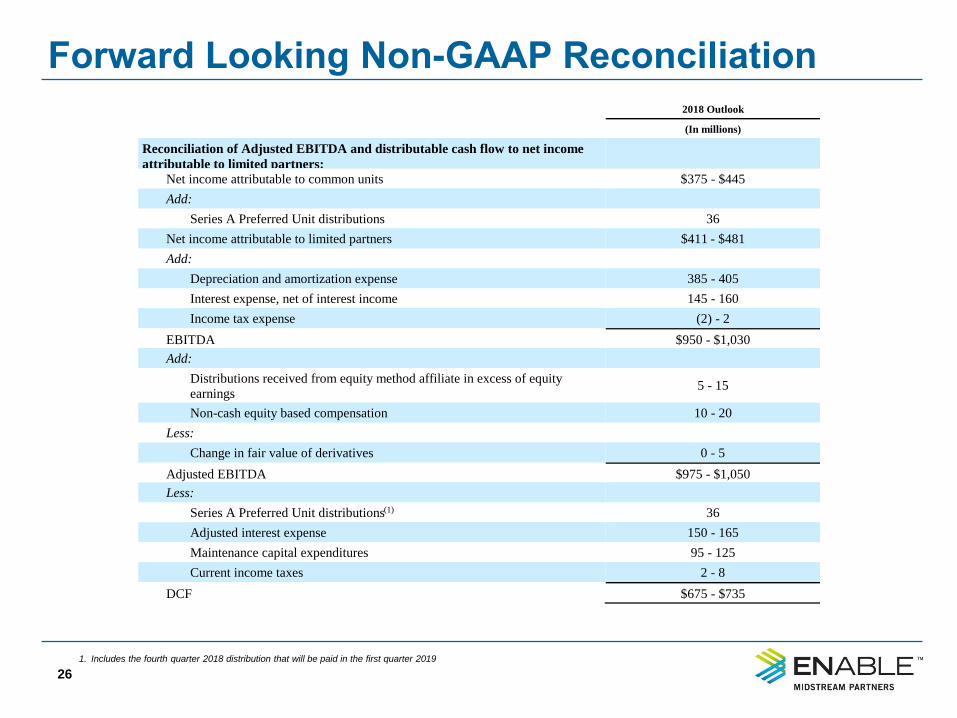
1. Includes the fourth quarter 2018 distribution that will be paid in the first quarter 2019
2018 Outlook
(In millions)
Reconciliation of Adjusted EBITDA and distributable cash flow to net income
attributable to limited partners:
Net income attributable to common units $375 - $445
Add:
Series A Preferred Unit distributions 36
Net income attributable to limited partners $411 - $481
Add:
Depreciation and amortization expense 385 - 405
Interest expense, net of interest income 145 - 160
Income tax expense (2) - 2
EBITDA $950 - $1,030
Add:
Distributions received from equity method affiliate in excess of equity
earnings 5 - 15
Non-cash equity based compensation 10 - 20
Less:
Change in fair value of derivatives 0 - 5
Adjusted EBITDA $975 - $1,050
Less:
Series A Preferred Unit distributions(1) 36
Adjusted interest expense 150 - 165
Maintenance capital expenditures 95 - 125
Current income taxes 2 - 8
DCF $675 - $735
Forward Looking Non-GAAP Reconciliation Continued
27
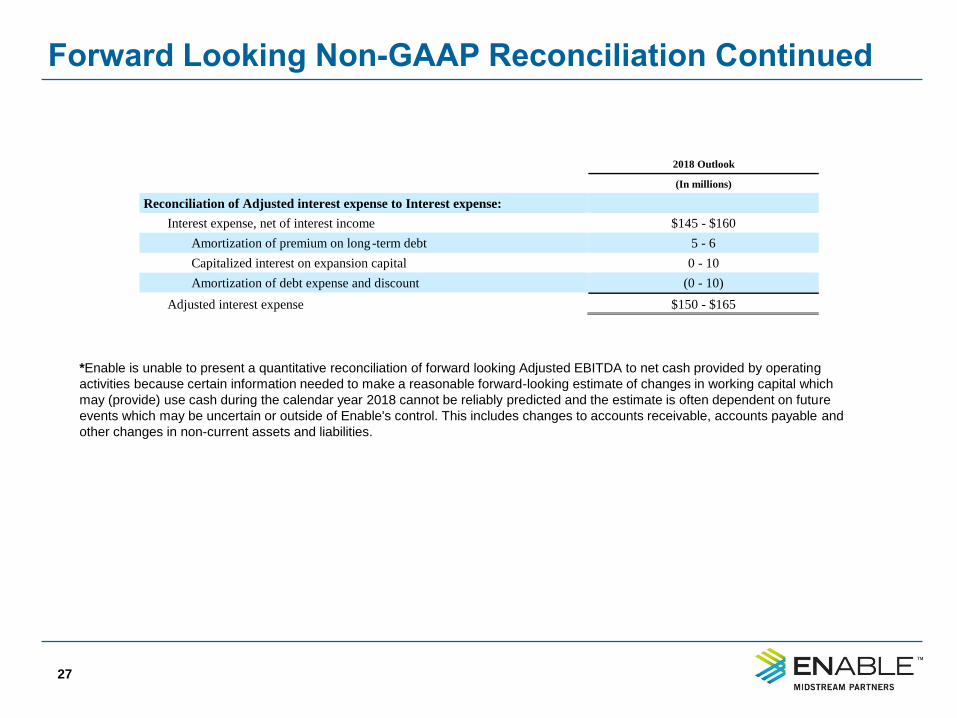
*Enable is unable to present a quantitative reconciliation of forward looking Adjusted EBITDA to net cash provided by operating
activities because certain information needed to make a reasonable forward-looking estimate of changes in working capital which
may (provide) use cash during the calendar year 2018 cannot be reliably predicted and the estimate is often dependent on future
events which may be uncertain or outside of Enable's control. This includes changes to accounts receivable, accounts payable and
other changes in non-current assets and liabilities.
2018 Outlook
(In millions)
Reconciliation of Adjusted interest expense to Interest expense:
Interest expense, net of interest income $145 - $160
Amortization of premium on long-term debt 5 - 6
Capitalized interest on expansion capital 0 - 10
Amortization of debt expense and discount (0 - 10)
Adjusted interest expense $150 - $165
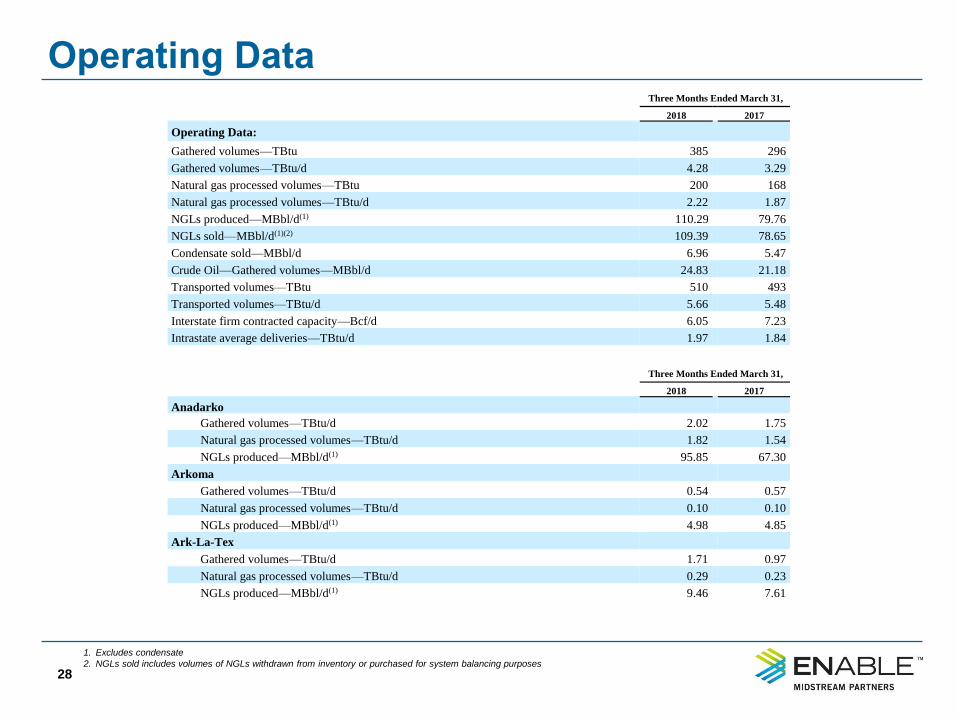
Operating Data
28
1. Excludes condensate
2. NGLs sold includes volumes of NGLs withdrawn from inventory or purchased for system balancing purposes
Three Months Ended March 31,
2018 2017
Operating Data:
Gathered volumes—TBtu 385 296
Gathered volumes—TBtu/d 4.28 3.29
Natural gas processed volumes—TBtu 200 168
Natural gas processed volumes—TBtu/d 2.22 1.87
NGLs produced—MBbl/d(1) 110.29 79.76
NGLs sold—MBbl/d(1)(2) 109.39 78.65
Condensate sold—MBbl/d 6.96 5.47
Crude Oil—Gathered volumes—MBbl/d 24.83 21.18
Transported volumes—TBtu 510 493
Transported volumes—TBtu/d 5.66 5.48
Interstate firm contracted capacity—Bcf/d 6.05 7.23
Intrastate average deliveries—TBtu/d 1.97 1.84
Three Months Ended March 31,
2018 2017
Anadarko
Gathered volumes—TBtu/d 2.02 1.75
Natural gas processed volumes—TBtu/d 1.82 1.54
NGLs produced—MBbl/d(1) 95.85 67.30
Arkoma
Gathered volumes—TBtu/d 0.54 0.57
Natural gas processed volumes—TBtu/d 0.10 0.10
NGLs produced—MBbl/d(1) 4.98 4.85
Ark-La-Tex
Gathered volumes—TBtu/d 1.71 0.97
Natural gas processed volumes—TBtu/d 0.29 0.23
NGLs produced—MBbl/d(1) 9.46 7.61