Embed Size (px)
Citation preview

World Economic Forum91-93 route de la CapiteCH-1223 Cologny/GenevaSwitzerland
Tel +41 (0) 22 869 1212Fax +41 (0) 22 786 2744
The World Economic Forum is an independent international organization committed to improving the state of the world by engaging business, political, academic and other leaders of society to shape global, regional and industry agendas.
Incorporated as a not-for-profit foundation in 1971 and headquartered in Geneva, Switzerland, the Forum is tied to no political, partisan or national interests
Enabling TradeFrom Valuation to Action
January 2014
In collaboration with Bain & Company
Foreword
In an interconnected world faced with both challenges and opportunities, enabling and growing trade is a key component in creating economic, social and environmental successes.
Last year’s Enabling Trade: Valuing Growth Opportunities report demonstrated that reducing supply chain barriers is a uniquely effective measure to enable global economic growth. The report explored how reducing even a limited set of supply chain barriers halfway to global best practice could increase trade by 15% and gross domestic product (GDP) by nearly 5%.
The overall benefits to nations, producers and consumers are clear. However, making it happen is not as simple – particularly because supply chains cut across multiple stakeholders, requiring collaboration and leadership that goes beyond local constituents and borders. Accordingly, this year’s Enabling Trade: From Valuation to Action report delves deeper into examples of practical application.
Firstly, the report explores how effective supply chains can alleviate a critical societal challenge that concerns all of us: the need to feed a growing population. Secondly, it takes a look at the automotive sector to get an industry-specific perspective. The report then turns attention towards regional trade agreements as a vehicle to achieve concrete results, specifically by observing the early progress on reducing barriers within the Pacific Alliance. And finally, it reviews border management, a key functional area with continued potential for reform.
As the report demonstrates, reasons for optimism exist, but more can be done. By removing barriers to trade, leaders have an opportunity to facilitate investment and employment in emerging markets, accelerate global economic growth and prosperity, and take real steps to reduce the substantial losses of food “from farm to fork”. Benefiting generations to come, this is an opportunity – and challenge – we should seize.
Nils S. AndersenChief Executive Officer, A.P. Moller-Maersk
Acknowledgements
Enabling Trade: From Valuation to Action is the result of collaboration among many individuals, institutions and firms. The authors are very grateful to all the firms we interviewed for their valuable contribu-tions, as well as those who reviewed materials. We would like to specifically thank A.P. Moller-Maersk, Flour Mills of Nigeria, Unilever and CHEP for their support in developing the agricultural case studies, and the Inter-American Development Bank for its leadership on the “Enabling Trade in the Pacific Alliance” section.
Project team
- Marisol Argueta, Senior Director, Head of Latin America, World Economic Forum
- Jieun Chung, Senior Manager, Supply Chain and Transport Industry, World Economic Forum
- Sean Doherty, Director, Head of Supply Chain & Transport Industry, World Economic Forum
- Fernando J. Gómez, Associate Director, Latin America, World Economic Forum
- Mark Gottfredson, Partner, Bain & Company
- Abby Gray, Case Team Leader, Bain & Company
- Gerry Mattios, Principal, Bain & Company
- Christophe Menger, Senior Associate Consultant, Bain & Company
- Alex Mitchell, Director, Head of Automotive Industry, World Economic Forum
- John Moavenzadeh, Senior Director, Head of Mobility Industries, World Economic Forum
- Philipp Sayler, Associate Director, Automotive Industry, World Economic Forum
- Dimitri Sculy-Logothéti, Senior Associate Consultant, Bain & Company
- Tania Tanvir, Senior Project Manager, Consumer Industries, World Economic Forum
Other key contributors and reviewers
- A.P. Moller-Maersk Group
- Apollo Tyres
- Audi AG
- Brazilian Ministry of Development, Industry and Foreign Trade (MDIC)
- China Association of Automobile Manufacturers
- CHEP, a Brambles Ltd company
- Deutsche Post DHL
- Flour Mills of Nigeria Plc
- Food and Agriculture Organization of the United Nations
- Hyundai Motor Company
- International Food Policy Research Institute
- KCingle-CUPIA; Korea Customs UNI-PASS & Single Window Agency
- Kenya Trade Network Agency (KENTRADE)
- Renault-Nissan Alliance
- Schaeffler Technologies AG & Co. KG
- Syngenta AG
- Unilever Plc
- Tenneco Inc.
- The Inter-American Development Bank
- The World Bank
- Transport Intelligence
- United Parcel Service, Inc. (UPS)
- Verband der Automobilindustrie
- Wal-Mart Stores, Inc.
- World Customs Organization
- World Economic Forum’s New Vision for Agriculture
- World Trade Organization
Consultative group
Finally, the authors would like to thank all the companies that generously provided interviews for the various case studies.

Enabling Trade: From Farm to Fork
First, speaking to what’s important in agribusiness means recognizing the challenge of doubling food output in the next few decades, to cope not only with growing populations but also a shift by wealthier consumers to richer diets, and increasing demand from bio-energy producers for resources. It also means recognizing the sustainability challenges of a sector responsible for 14% of the world’s greenhouse gas emissions,2 70% of its freshwater consumption,3 and the livelihoods of billions of the world’s poorest people.
In this context, supply chain reforms are a great contributor to reducing food loss: of all food produced, 30% is lost before it is consumed. The nature of this loss is different in high- and low-income countries; in the former, consumers play a large part in generating food waste, while in the latter, loss occurs primarily at pre-consumer stages. Agricultural development efforts focus primarily on increasing production. Introducing the concept of loss and waste as symptoms of supply chain barriers provides new motivations to tackle those barriers, and an opportunity to resolve core agricultural concerns. In particular, by highlighting the means to cut early-stage value leakage, the hope is to improve the share of value flowing to the poorest farmers.
Enabling Automotive Trade
Second, the automotive industry, another sector familiar with trade disputes, is examined. In this case, motivation is driven as much by opportunity as by design. We respond to an interest from senior automotive executives in the Enabling Trade programme, as well as an invitation by the WTO’s director-general for these executives to assemble an industry viewpoint on current trade challenges.
Rather than assessing individual challeng-es in depth, an overview was compiled of the issues raised by a global sample of the industry’s suppliers and vehicle manufac-turers. The interest here comes from the close consensus on priorities among fiercely competitive global manufacturers. What is more, this politically-connected industry, with strong experience in foreign direct investment and sometimes conflicting interests between local protection and global openness, is beginning to look beyond the battlefields of tariffs and local content requirements. Aiming to cut costs from global value chains, the focus turns towards border delays and synchronized regulations.
Enabling Trade in the Pacific Alliance
The third area of implementation interest is the Pacific Alliance. This grouping of Chile, Colombia, Mexico and Peru (and next-in-line Costa Rica and Panama) has caught the attention of business with its ambitions for rapid integration. In a region with strong ideological differences and low intraregional trade (only 6% of exports), business is keen to support a promising initiative.
The Alliance’s objectives include immediate tariff elimination for the vast majority of goods, harmonization of rules of origin, mutual recognition of regulatory standards, connection of single windows and elimination of visa requirements. Initial progress is promising; for example, 90% of tariffs have already been eliminated.
The Enabling Trade programme attempts to contribute to this progress by convening leaders from business and government throughout the year, and by further illustrating priorities through a regional business survey and case studies conducted together with the Inter-American Development Bank. The biennial global Enabling Trade Index will be launched in Panama in 2014 with particular focus on the region.
Enabling Smart Borders
Finally, the report looks at implementing reform in a functional area – border management – with a particular focus on digitization. The pursuit of electronic trade management systems, a core recommendation of the last Enabling Trade report, is seen by business as a potential quick win, with relatively low investment requirements and relatively few decision-makers to align.
In many cases, the private sector is eager to provide input and, where appropriate, help accelerate reform through partnerships. Additional urgency and need for dialogue is provided by ambitions for e-logistic ecosystems in which data interchange between business and government will play a crucial role.
Conclusions
Practical trade facilitation remains a priority for economic development. The participants in the Enabling Trade programme reiterate their recommenda-tions to governments to take a supply chain approach for trade reform, both in international coordination and domestic action. In return, supply chain facilitation appears to have a particularly successful record in enabling development.
The shift in the focus of trade facilitation towards supply chain improvement and coordination requires greater involvement of domestic actors beyond the trade community. To build support from these communities, trade facilitation efforts need to understand sectoral concerns and be understood in the context of those concerns. Only then can faster progress be made in harmonizing supply chain environments to allow plug and play trade. Happily, this leads to a practical pathway for implementation aimed at improving quality of life and expanding opportunities for everyone.
Endnotes 1. Hoekman, B. “Governance of Deeper Economic Integration in
a Supply Chain World”. European University Institute and CEPR. DRAFT, October 20, 2013.
2. IPCC (2007) Climate Change 2007: Synthesis Report. Contribution of Working Groups I, II and III to the Fourth Assessment Report of the Intergovernmental Panel on Climate Change. [Core Writing Team, Pachauri, R.K and Reisinger, A. (eds).] IPCC
3. Clay, J. (2004) World Agriculture and the Environment: A Commodity-by-Commodity Guide to Impacts and Practices, Island Press.
Businesspeople the world over are looking for practical ways to sell into new markets and buy from whoever can offer them the best product. Small and medium-sized businesses, emboldened by the promise of e-commerce, look much further afield than they ever did before, while large industrial companies work to serve newly prosperous economies and cut costs in the face of new competition.
Governments recognize this opportunity and aim to welcome global value chains, both through domestic reforms and international negotiations. Increasingly, the challenge is how to implement reform. In a world where average tariffs have fallen into single digits, meaningful reforms require a much wider set of stakeholders to build the conditions for global supply and value chains.
Following the successful negotiations at the World Trade Organization’s (WTO) Ministerial Conference in Bali, Indonesia in late 2013, the WTO and the world are faced with both the implementation challenge and the question, “What’s next for trade facilitation?” The Trans-Pacific Partnership Agreement and the Transatlantic Trade and Investment Partnership, for example, are designed to be “deep” trade agreements, reaching far behind the border to enable equitable transnational commerce.
This effort is eminently worthwhile. The World Economic Forum’s Enabling Trade: Valuing Growth Opportunities report, produced in 2013 with the support of the World Bank and the management consulting firm Bain & Company, found that reducing even a restricted set of supply chain barriers halfway to global best practice would yield a nearly 5% increase in GDP, or six times the benefit of removing all remaining tariffs. The benefits to emerging nations, in particular in Africa and South-East Asia, would be proportionally much higher.
Business is looking for a modular, harmonized way to operate. Here, it is useful to recognize the importance of foreign direct investment; sales by foreign-owned firms are roughly 50% higher than world merchandise trade (US$ 26 trillion vs US$ 18 trillion, respectively1). Increasingly, firms are considering whether they can set up sourcing and distribution operations in a similar way across many countries.
To allow a “plug and play” approach to trade and investment, multiple agencies within national governments (e.g. customs authorities) need to consider how their domestic requirements may affect the international supply chain.
Given that they may already benefit from tariff preferences, non-tariff reforms are particularly important for low-income countries. The ability to contribute to a global value chain through task specialization is an opportunity open even to very low-income countries, provided they can meet the international norms for that task. Meeting those norms becomes a tipping point for trade.
Enabling Trade: From Valuation to Action
This report stems from an effort to support implementation of Enabling Trade reforms.
Importantly, it was apparent that making the case to trade officials or learning only from traders would not suffice. Behind-the-border issues can be advanced only by involving a wider range of interest groups and decision-makers. We should not underestimate the extent to which conversations and decisions occur in functional silos, as busy people try to deliver on the responsibilities of their day jobs. We need to help others “think supply chain,” and to do that, we need first to learn to think as they do.
The Enabling Trade initiative therefore delved deep into several sectoral, regional and functional priorities. The two sectors covered – agriculture and automotive – are not only massive drivers of the global economy, but also among the most vulnerable to delays (Figure). As a regional priority, the Pacific Alliance represents a bright spot of political will to deepen economic integration through facilitating regional trade. Border administration, as the functional priority, is top-of-mind for both policy-makers and business leaders, and was a primary component of the 2013 WTO negotiations.
Figure: Sectors Covered in This Report Are among the Most Vulnerable to Delays
Tariff equivalent for Value of Time Saving per Day (2007)
Source: United States Agency for International Development (USAID), March 2007. “Calculating Tariff Equivalents for Time in Trade”
IntroductionImplementing Trade Facilitation and Understanding New Challenges
Vehicules
Cash crops
Fruits and vegetables
Telco/sound equip.
Cereals
Vehicule parts
Apparel
Textiles
Power generators
Office machines
Medicine and pharma
Footwear
Fertilizers
Coal
Crude oil
“Enabling Automotive Trade“
“Enabling Trade: From Farm to Fork”
Not specifically covered
2.0 %
1.1 %
0.9 %
0.9 %
0.8 %
0.8 %
0.7 %
0.6 %
0.6 %
0.5 %
0.3 %
0.2 %
0.0 %
0.0 %
0.0 %

Enabling Trade: From Farm to Fork
January 2014
In collaboration with Bain & Company

Published by World Economic Forum, Geneva, Switzerland, 2014All rights reserved. No part of this publication may be reproduced, stored in a retrieval system, or transmitted, in any form or by any means, electronic, mechanical, photocopying, or otherwise without the prior permission of the World Economic Forum.
World Economic Forum91-93 route de la CapiteCH-1223 Cologny/GenevaSwitzerlandTel.: +41 (0) 22 869 1212Fax: +41 (0) 22 786 [email protected]
The Context of Enabling Trade: From Valuation to Action
The World Economic Forum’s Enabling Trade initiative works to reduce practical barriers to trade. The initiative’s 2013 report, Enabling Trade: Valuing Growth Opportunities, indicated that reducing supply chain barriers could increase the world’s gross domestic product (GDP) by over US$ 2.5 trillion. Building on the momentum of this finding, the 2014 report looks at how to accelerate reform. It concentrates on sectoral, regional and functional areas where the positive impacts of supply chain facilitation could be greatest, or where momentum for change is building. The four sections comprising the report are:
- Enabling Trade: From Farm to Fork
- Enabling Automotive Trade
- Enabling Trade in the Pacific Alliance
- Enabling Smart Borders
Each section is designed to be stand-alone, but the reader is nonetheless invited to become familiar with the broader Enabling Trade initiative.

Contents
5 Foreword
6 Executive Summary
8 1. Introduction
9 2. Scope and Approach
10 3. Case Study Highlights
11 4. Benefits of Improved Agricultural Supply Chains
13 5. Tipping Points: Saving Food through Economic Efficiency
16 6. Case Studies
17 Nigerian Cassava Flour: Broadening Value Chains for Traditional Crops
26 Indian Tomatoes: Adding Value and Reducing Losses through Processing
34 Kenyan Avocados: Connecting to High-value Export Markets
42 7. Lessons for Implementation of Solutions
46 Acknowledgements
3Enabling Trade: From Farm to Fork

5Enabling Trade: From Farm to Fork
Foreword
Pier-Luigi SigismondiChief Supply Chain Officer, Unilever
Cutting food loss and waste is a great way to drive sustainability and development. It is a crucial step on the way to providing quality, nutritious food to a growing global and urban population. Supply chain improvement is an important tool in this effort. We see opportunities for businesses to collaborate in building better links between farmers and consumers, and for governments to ease trade and supply chain barriers in many forms, creating possibilities for growers and affordable choices for customers. To realize these benefits, we need improved communication between stakeholders, and an enhanced understanding of where food loss and quality reduction occur as a result of supply chain bottlenecks. We have embarked on concrete initiatives to smooth the path from farm to fork, and hope to contribute to a virtuous cycle of improvement linking farmers, transporters, processors, regulators, retailers and consumers.

Enabling Trade: From Farm to Fork6
Executive SummaryGetting agricultural goods to market more efficiently offers huge potential benefits across social, environmental and economic dimensions. Through a combination of case studies and secondary research, this report highlights the most significant supply-chain-related barriers faced by different actors, including their impact, and suggests potential solutions.
Food loss has significant negative social, environmental and economic impacts.
Globally, up to 1.3 billion tons of food is lost or wasted each year around the world, representing a massive set of inefficiencies in terms of environmental impact, hunger alleviation and economic development.1 In the case studies researched as part of this report, esti-mates of food loss ranged between 10% and 40%. Food loss depresses incomes along agricultural value chains, and can have particularly devastating impact on smallholder farmers. It also drives up the end prices of food, restricting access for poor consumers and contributing to hunger and malnutrition. Lost or wasted food drives approximately 4% of world energy consumption,2 20% of freshwater consumption,3 and uses 30% of the world’s agricultural land area. In 2007, the total economic cost of food loss and waste was estimated at US$ 750 billion.4
Reducing food loss will require a global effort to improve agricultural supply chains.
In North America and Europe, 40% of losses occur at the household level after consumers purchase food. In sub-Saha-ran Africa and South/South-East Asia, however, only 6% of food loss and waste occurs at this stage. The remaining 94% is a result of inefficiencies in the supply chain, from harvesting through distribu-tion.5 In the past 30 years, over 95% of horticultural development funding has gone towards pre-harvest efforts such as yield increases, while less than 5% has gone to postharvest improvements.6 This flow of resources has driven important advancements in production. Now, stakeholders have a direct interest in ensuring that the increased production resulting from their efforts enjoys a smooth and efficient route to market.
Specific solutions to food loss vary across value chains, but achieving tipping points of economic efficiency helps across the board.
In the three case studies covered in this report, losses occur in different percent-ages at varying stages in the value chain. However, one thing seems consistent across value chains: the lower the value of the food, the more susceptible it tends to be to loss. Reducing food loss requires resources, which must be outweighed by the expected benefits of loss reduction. The more profitable a crop is to all stakeholders along the value chain, the
more resources that are available to ensure it gets from farm to fork.7
Three main levers exist to improve economic efficiency of agricultural value chains: reduced volatility of supply and prices, increased end-market prices and reduced costs. If investments do not allow farmers, companies and, subsequently, entire value chains to reach sustainable profitability by pulling these levers, govern-ments will expend a huge amount of energy and resources with no momentum developed. An example is the low success rate of efforts to introduce grain storage technologies in sub-Saharan Africa; implementation was often done without a clear path to financial sustain-ability, and the focus on enhancing storage often overlooked economic incentives.8
If, on the other hand, policy-makers carefully coordinate food loss reduction efforts as part of a broader strategy to promote promising, high-potential value chains, tipping points of profitability can be reached. When this happens, the private sector is able to reinvest its retained earnings into the industry, and a virtuous, self-promoting cycle of development is triggered.
Reducing supply chain barriers contributes significantly to achieving economic efficiency.
Supply chain barriers directly impact economic efficiency. The World Economic Forum’s 2013 report Enabling Trade: Valuing Growth Opportunities estimated that reducing just a few supply chain barriers halfway to the world’s best practices could increase global GDP by 5%. The potential gains are even higher in the developing world: 12% in sub-Saharan Africa and 8% in South and Central Asia. Given the characteristics of agricultural goods and their susceptibility to supply chain barriers, the value at stake for the agricultural sector is likely even higher. For example, agricultural goods are extremely time-sensitive. Even for less perishable crops like cereals, each day of delay from harvest to market equates to a 0.8% tariff equivalent, versus 0.6% for textiles and 0.3% for pharmaceuticals.9

7Enabling Trade: From Farm to Fork
Impacts of the four types of supply chain barriers are felt in various ways across agricultural value chains:
Market access. Because of their health risks, agricultural exports are subject to additional regulatory controls. Overly strict standards are sometimes used as a form of protectionism, and lack of information about requirements and how to meet them mean that high-quality markets are often out of reach for developing-country suppliers. Overcoming market access barriers requires collaboration among governments, downstream actors and farmers to implement measures such as improved transparency and capacity building.
Transport and communications infrastructure. Transport costs are the most important challenge cited by developing-country suppliers in connecting to global value chains.10 The impact of poor transport infrastructure is especially pronounced for agricultural goods because of inherent characteristics such as low value-to-bulk ratios, fragility and perishability. Initiatives to improve underlying infrastructure are typically government-led, but private-sector involvement is critical in ensuring efficient allocation of resources along key transport corridors. Regulations impacting transport services should be designed to help enable competition, scale and standardization. Development of technologies to facilitate efficient movement and storage of crops is also important, and must be tailored to the constraints of specific value chains. Creative ownership models can help to overcome the challenges of mobilizing capital for investment in these improved technologies and logistical arrangements.
Border administration. Border delays have significant impacts on the movement of food, especially in developing countries. For example, the Burundi–Rwanda border adds the equivalent of 174 kilometres (km) in terms of increasing food prices; the Democratic Republic of Congo–Rwanda border adds a staggering 1,600 km.11 Redesigning border processes through streamlined government agencies, information and communications technology (ICT), and risk-based screening offer promising mechanisms to reduce delays; however, implementation requires overcoming vested interests, and strong political leadership is needed to create change.12
Business environment. Private-sector investment in commercial farming, vertical integration, transport services, food processing and large-scale retail net-works allow for better logistics, improved technology and capacity building, if implemented well. Governments can take steps to create an enabling regulatory environment to facilitate these structural improvements. Modernization should be accompanied by inclusive planning, involving local stakeholders and helping those producers and traders with less competitive potential to find alternative op-portunities.
Solutions differ across value chains, so a thorough supply chain assessment is a pivotal part of taking action.
Some solutions fall primarily under the purview of the public sector (e.g. infra-structure improvements, redesigned border processes), and tend to have a positive impact across multiple crops. Others are primarily private-sector-led (e.g. farmer training, logistical arrange-ments), and tend to be value-chain-specif-ic. Almost every supply chain improve-ment, however, can only be implemented successfully through a collaborative, data-driven process:
1. Prepare. Tackling supply chain barriers in a given country starts with esta-blishing a group of public and private stakeholders with a clear governance structure. For example, the World Economic Forum’s New Vision for Agriculture initiative and Grow Africa platforms could be expanded to include stakeholders from the supply chain and transport community, as well as govern-ment representatives from ministries of trade and transport. To facilitate focused use of resources towards achieving tipping points, stakeholders should align on trade routes and crops with the highest potential.
2. Diagnose. The flow of goods along these high-priority trade corridors or value chains should then be mapped, from inputs to cultivation, to distribution and consumption. Interviews can help to develop first hypotheses of supply chain bottlenecks. Their magnitude can be thoroughly assessed by gathering cost, time and food-loss data while travelling along the corridor with shipments of agricultural goods. Much of the value comes by taking an integrated look across the whole chain and understanding the interactions among stakeholders.
3. Plan. For each barrier identified during the diagnostic phase, the core team can then define a long list of potential actions for reducing costs. A cost/benefit analysis of this list is important to ensure that resources are allocated where they will have the biggest impact.
4. Mobilize. A project manager for improving a value chain should be chosen from a stakeholder group that is trusted by all stakeholders. Clearly-defined owners from various stakeholder groups should take responsibility for each initiative. Subowners should be assigned and milestones set within each initiative, and transparent mechanisms for tracking progress should be put in place.
Public-private collaboration is critical throughout this process, as policy reforms and infrastructure investments should aim to maximize benefits for the private sector, such as providing as much regulatory consistency as possible.
Through coordinated action, leaders from various communities can share their expertise and resources to reduce supply chain barriers in agriculture, triggering increased economic efficiency and a virtuous cycle of investment. In the long term, this will contribute to increased incomes along the value chain, improved food security and increased environmental sustainability.

Enabling Trade: From Farm to Fork8
1. IntroductionWith food prices on the rise and food security challenges being faced by a number of developing regions (Figure 1), the question of how to feed growing populations is a key concern of the international community. Efforts to increase food production in developing countries have achieved important successes through collaborative multistakeholder platforms, including the World Economic Forum’s New Vision for Agriculture initiative and Grow Africa partnership (Box 1).13 However, in a world where scarce resources and climate-change challenges curb the potential for continued production increases, post-harvest food-loss-reduction has a key role to play in achieving food security.
Despite the importance of reducing post-harvest losses, governments and donors have directed limited resources towards this goal.15 In light of this, the Forum’s Global Agenda Council on Logistics & Supply Chain Systems has championed the research for this report. Linking the Forum’s Enabling Trade and New Vision for Agriculture initiatives, as well as the Grow Africa partnership, this report aims to raise global awareness and understanding of the impact that supply chain barriers have on the movement of food, particularly in developing countries. It attempts to answer several questions: What are the impacts of supply chain barriers on three specific value chains and, by extension, the agricultural sector more generally? What costs do they impose, and what is their contribution to food loss? What solutions exist, and what is required for successful implementation of those solutions?
Improving agricultural supply chains will require increased dialogue and collaboration among leaders from government, civil society and the private sector. As such, this report is targeted towards ministries of agriculture, trade, transport, health and finance, as well as business leaders from agribusiness, logistics, transport and retail communities. All of these stakeholders have an important role to play in facilitating the efficient movement of food on its journey “from farm to fork”.
Box 1: The World Economic Forum’s New Vision for Agriculture initiative and Grow Africa partnership
The Forum’s New Vision for Agriculture initiative is a global platform that facilitates public-private collaboration to realize a vision of agriculture as a driver of food security, environmental sustainability and economic opportunity. The initiative collaborates on a global level with the G8 and G20, and has catalysed country-level, public-private partnership initiatives in 14 countries across Asia, Latin America and Africa. A regional partnership is jointly convened with the African Union and the New Partnership for Africa’s Development (NEPAD) to accelerate investments and transformative change in alignment with the national plans of African countries. The New Vision for Agriculture initiative is led by a broad network of 33 global companies in collaboration with 14 governments, working with international organizations, civil society, academic and farmers’ organizations worldwide to advance an action-oriented agenda. Together, these efforts have mobilized over US$ 5 billion in investment commitments and are projected to engage over 13 million smallholder farmers in the next three to five years.
Figure 1: Increasing Prices and Low Self-sufficiency Threaten Food Security for Low-income Countries
Sources: Food and Agriculture Organization of the United Nations (FAO), “Who Are the Net Food Importing Countries?” World Bank, January 200814
39%
61%
34%
66%
28%
72%
World real food price index(1961-2013, index 100 in 2002-04)
Country classificationsby raw food trade (2004/05)
33 countries 105 countries 58 countries200
150
100
50
0
100
80
60
40
20
0
%
1961 1970 1980 1990 2000 2010 Industrial
Net importer Net exporter
Middle-income Low-income

9Enabling Trade: From Farm to Fork
2. Scope and Approach
Scope
This report aims to understand how supply chain barriers affect agricultural value chains. Geographic focus is on sub-Saharan Africa and South Asia. These regions were chosen based on agriculture’s significance to their economies, the potential impact of supply-chain-barrier reduction as identified in the 2013 Enabling Trade: Valuing Growth Opportunities report, and the magnitude of food losses as quantified by the Food and Agriculture Organization of the United Nations (FAO). Within these regions, crop/country combinations (i.e. “value chains”) were selected for case studies. In order to facilitate access to contacts and data, priority was given to value chains where Forum partner companies had operations. Additional criteria for crop selection were the percentage of waste as reported by the FAO, and the potential to alleviate hunger or contribute to economic development through import substitution or exports. Additional criteria for country selection were government willingness to promote change, and the ability to leverage multistakeholder partnerships supported by the New Vision for Agriculture initiative and Grow Africa partnership, in collaboration with the African Union and NEPAD.
Three case studies are included in this report:
- Nigerian Cassava Flour: Broadening Value Chains for Traditional Crops
- Indian Tomatoes: Adding Value and Reducing Losses through Processing
- Kenyan Avocados: Connecting to High-value Export Markets
This report focuses on the steps of the value chain, from post-harvest storage to transport and distribution. Aside from post-harvest supply chain barriers, there are additional important levers that contribute to achieving a competitive cost position for any agricultural value chain, but they are not a main focus of this report. For example, breeding, access to inputs, and production and harvesting technologies and practices have important impacts on post-harvest supply chain management and food loss, and should be considered as part of the broader equation. Retailing and consumption patterns are also outside the scope of this report, as are the impacts of tariffs on the movement of agricultural goods (Box 2).
Box 2: Impacts of Tariffs on Global Agricultural Trade Flows
Tariffs continue to be a major factor restricting world agricultural trade. Average global tariffs for agricultural goods are more than three times higher than for non-agricultural goods. Some agricultural tariffs are as high as 800%, and in no other area does domestic support distort international markets to the extent it does in agriculture. In 2011, member states of the Organisation for Economic Co-operation and Development (OECD) provided US$ 252 billion in agricultural support and protection. World Trade Organization (WTO) trade rules tolerate export subsidies in the agricultural sector, even though they have long since been prohibited for other goods.16
The case against tariffs has two elements: distortions created within a protected country by higher domestic prices, and costs imposed on other countries by decreased exports and lower world prices. Export subsidies drive similar but inverse distortions.
In some cases, tariffs or export subsidies may provide the short-term boost needed to foster sector development and trigger a virtuous cycle of private-sector investment. However, these distortionary mechanisms are too often used as long-term forms of protectionism or subsidization. Continued international trade negotiations are thus critical to enabling greater overall efficiency in global agricultural markets.17
Approach
The conclusions of this report draw from the findings of the three case studies, which are based on a combination of primary and secondary research. For each case study, lead firms provided access to contacts and data along the value chain. In collaboration with these firms, the authors conducted interviews (and, where possible, field visits) to identify the most significant supply chain barriers restricting the movement of goods along the value chain and their contribution to excess costs, including food loss. A total of 80 interviews were conducted. The authors are very grateful for the contributions of the lead firms to the respective case studies: A.P. Moller-Maersk (Kenyan avocados), Flour Mills of Nigeria (Nigerian cassava flour), and Unilever and CHEP, a Brambles Ltd company (Indian tomatoes).

Enabling Trade: From Farm to Fork10
3. Case Study Highlights The following summaries provide highlights from case studies, along with recommendations for initiatives that could be further explored for implementation in the short and long term. Further detail is provided in the Annex to this report.
Nigerian Cassava Flour: Broadening Value Chains for Traditional Crops
Nigeria is in the early stages of an agricultural transformation. Cassava is one of six target crops identified by the Ministry of Agriculture for special consideration, given Nigeria’s position as the global leader in cassava production and the many industrial end uses for the crop. Current production, however, is used only for traditional foodstuffs, aside from a few first movers into value-added products such as high-quality cassava flour (HQCF). Food loss is lower in the HQCF value chain (about 21%) than in the traditional value chain (about 36%), the latter driven by traditional processors’ rejection of small or woody tubers and the perishability of the end product. Achieving profitability in these nascent value chains, however, will require overcoming the logistical challenges of smallholder production networks and cassava’s extremely low value-to-bulk ratio, along with transport infrastructure challenges. Two potential solutions are highlighted here. Implementation of both will require collaborative effort among the public, private and donor-funded sectors.
- Quick win: One promising solution is the creation of collection points, allowing smallholders to consolidate loads for long-distance transport. The public-private Cassava Development Corporation (CDC) has been formed to drive progress in the industry. The implementation of collection points could be a way for the CDC to demons-trate early results and build momentum for tackling bigger issues, like the development of large-scale farming.
- Long-term priority: In addition to cassava-specific supply chain barriers, an organization is being formed to address poor efficiency of transport along Nigeria’s Lagos-Kano-Jibiya (LAKAJI) corridor, the main artery for goods flowing between ports and markets in Lagos and agricultural
production zones further north. An initial donor-funded assessment identified considerable potential for reduction of costs and delays along this corridor, beginning with accelera-ting efforts to rehabilitate the nation’s rail network. Improving this underlying infrastructure will be a key enabler to achieving multiple tipping points that will drive continued private investment in Nigeria’s agricultural sector.
Indian Tomatoes: Adding Value and Reducing Losses through Processing
Tomatoes present a clear picture of the logistical challenges facing India’s fresh-produce sector. Although India is the world’s second-leading tomato producer, the supply chain is extremely fragmented, the processing industry is underdeveloped and losses during harvest, transport and at “mandis” (i.e. local marketplaces) are around 25-30%. A number of supply-chain-related barriers contribute to these losses and to overall inefficiency in the sector. The path to an efficient supply chain is long, however, as many solutions that are effective in developed countries such as the US and Spain are challenging to implement in the Indian context (e.g. cold storage, contract enforcement).18 Progress will require public-private collabo-ration, and two of the potential initiatives identified in this case study are highlighted here for further exploration and action:
- Quick win: Plastic crates significantly reduce losses during transport, and are now widely used in India. Further improvements in packaging are possible, along with associated logistical improvements. Unilever and CHEP are collaborating on a pilot to test these solutions, evaluating their impacts on food loss and overall cost competitiveness.
- Long-term priority: The processing industry generates fewer losses and higher yields thanks to the shorter tomato journey and the close working relationship with farmers. The Indian government should continue to work with the private sector to promote the development of this value chain. First movers in processing and established agribusiness companies can help to provide training and access to inputs for farmers, demonstrating the benefits of cultivating tomatoes for processing. In the long run, the fresh and pro-cessed value chains could be comple-tely separate.
Kenyan Avocados: Connecting to High-value Export Markets
A number of supply chain improvements have enabled Kenyan avocados to be profitably exported to high-value markets in the European Union (EU). Along the major trade corridor, the Kenyan govern-ment made targeted infrastructure improvements (e.g. Nairobi-Mombasa road, Mombasa port capacity and power), creating an enabling environment to promote private-sector investment. Exporters and transporters followed suit by introducing new technologies and capacity building. Their investments in refrigerated containers and covered trucks, along with support for smallhold-ers to acquire export certifications, helped reduce quantitative and qualitative food loss and granted access to new markets. As a result, exports doubled from 10,000 metric tons (mt) in 1999 to 20,000 in 2003. More recently, exports have declined due to quality-related challenges, largely owing to unlicensed “briefcase exporters” and missed trans-shipments in Oman. In addition to loss of value, these and other challenges contribute to food losses of around 15% in the export value chain. Overcoming these hurdles will require new forms of collaboration among all stakeholders – government, farmers, exporters and shipping companies. The Kenyan avocado experience illustrates that value chains must be able to react to changes in market dynamics in order to maintain a virtuous cycle. Two high-poten-tial initiatives have been identified:
- Quick win: A promising initiative is to better inform importers about what they really purchase. Key stakeholders (e.g. exporters, government, importers) could agree on a process to validate the quality of products sold, through grading or certification. Unofficial exporters could then sell their products to less quality-sensitive customers without affecting the reputation of higher-quality exporters and the Kenyan origin overall.
- Long-term priority: Shipping companies and port authorities from Mombasa and Salalah, Oman could collaborate further and exchange more information on potential delays and sensitivity of shipments. When a risk of trans-shipment is high, specific actions or fast-track processes can be put in place. This would minimize the number of missed trans-shipments in Oman.

11Enabling Trade: From Farm to Fork
4. Benefits of Improved Agricultural Supply Chains
Magnitude and impacts of food loss and waste
In a world where 12.5% of the population suffers chronic undernourishment,19 the fact that 30% of food produced for human consumption is lost or wasted between farm and fork is difficult to comprehend (Box 3).20 Reducing these losses would have significant social, environmental and economic benefits.
Box 3: Food loss versus food waste
“Food loss” refers to food that spills, spoils, incurs an abnormal reduction in quality such as bruising or wilting, or otherwise gets lost before reaching the consumer. Food loss typically occurs at the produc-tion, storage, processing and distribution stages of the food value chain, and is the unintended result of agricultural processes or technical limitations in storage, infra-structure, packaging and/or marketing.
“Food waste” refers to food that is of good quality and fit for human consumption, but does not get consumed because it is discarded – either before or after it spoils. Food waste typically, but not exclusively, occurs at the retail and consumption stages in the food value chain, and is the result of negligence or a conscious decision to throw food away.21
Reduced food losses would contribute to global food security. The world faces a 6 quadrillion kilocalorie-per-year gap between food available today and that needed in 2050.22 If loss and waste were cut in half, the food saved would cover 22% of this gap, or enough to feed 500 million people.23 Furthermore, access to food is often overlooked as a key driver to reducing hunger and malnutrition. Reducing food loss would increase incomes for partici-pants along the value chain, thus increasing their purchasing power. It would also help to bring down the cost of food to the end consumer and thus increase access.
Managing food losses has an important link to environmental benefits. If food loss were a country, it would rank third in carbon emissions after only the United States (US) and the People’s Republic of China (China). Produced but uneaten food occupies close to 30% of the world’s agricultural land area. While it is difficult to estimate impacts on biodiversity at a global level, food waste compounds the negative externalities that monocropping and agricultural expansion into wild areas create on loss of biodiversity, including mammals, birds, fish and amphibians.24
Furthermore, food loss and waste drive economic losses of US$ 750 billion per year.25 These costs are borne to different degrees by a variety of actors, including farmers, transporters, processors, retailers and consumers. In developing countries, smallholder farmers are particularly vulnerable to financial losses as a result of food loss, as they often depend primarily on the cash generated from harvests to feed their families. Of the developing world’s 5.5 billion people, 1.5 billion live in smallholder households.26
Food loss as a supply chain issue
In developed countries, more than half of the total food loss and waste occurs at the household level, after consumers purchase food (see Box 4 for an example of strategies to tackle consumer food waste). In developing countries, however, only 16% of loss and waste occur at this stage (Figure 2). The remaining losses are a result of inefficiencies in the supply chain, from harvesting through distribution.
Box 4: Tesco’s Approach to Food Waste Reduction
Food waste is outside the scope of this report, as it is primarily an issue in developed countries and is already the focus of extensive research and prevention efforts. However, its magnitude is worth noting: food waste at the consumer level in industrialized countries (222 million tons) is almost as high as the total net food production in sub-Saharan Africa (230 million tons).27 Retailers are playing a key role in efforts to reduce waste. For example, Tesco in the UK has begun tracking food loss and waste in its value chains. Its figures show that 68% of bagged salad is wasted, and 35% of this waste occurs in the home. In addition to supply chain initiatives to reduce upstream losses, Tesco is taking steps to reduce consumer-level waste. The retailer has announced an end to multi-buy offers on large bags of salad, and is developing mix-and-match promotions for smaller bags. In-store tips are shared with consumers on how to store apples and bananas to extend their shelf life, along with creative ways to use leftover bread.28
Figure 2: Food Loss and Waste Occur in Different Stages in Developed and Developing Countries
Source: World Resources Institute, based on FAO28
Share of total food loss and waste by stage in the value chain (2009, in quadrillion kcal)
0.81 (quad. kcal) 0.68 (quad. kcal)100%
80
60
40
20
0
Consumption 52%
Consumption 16%
Distribution and Market 16%
Processing and packaging 4%
Handling and storage 33%
Production 31%
Distribution and Market 9%Processing and packaging 4%
Handling and storage 17%
Production 19%
Developed countries Developing countries
Enabling Trade: From Farm to Fork12
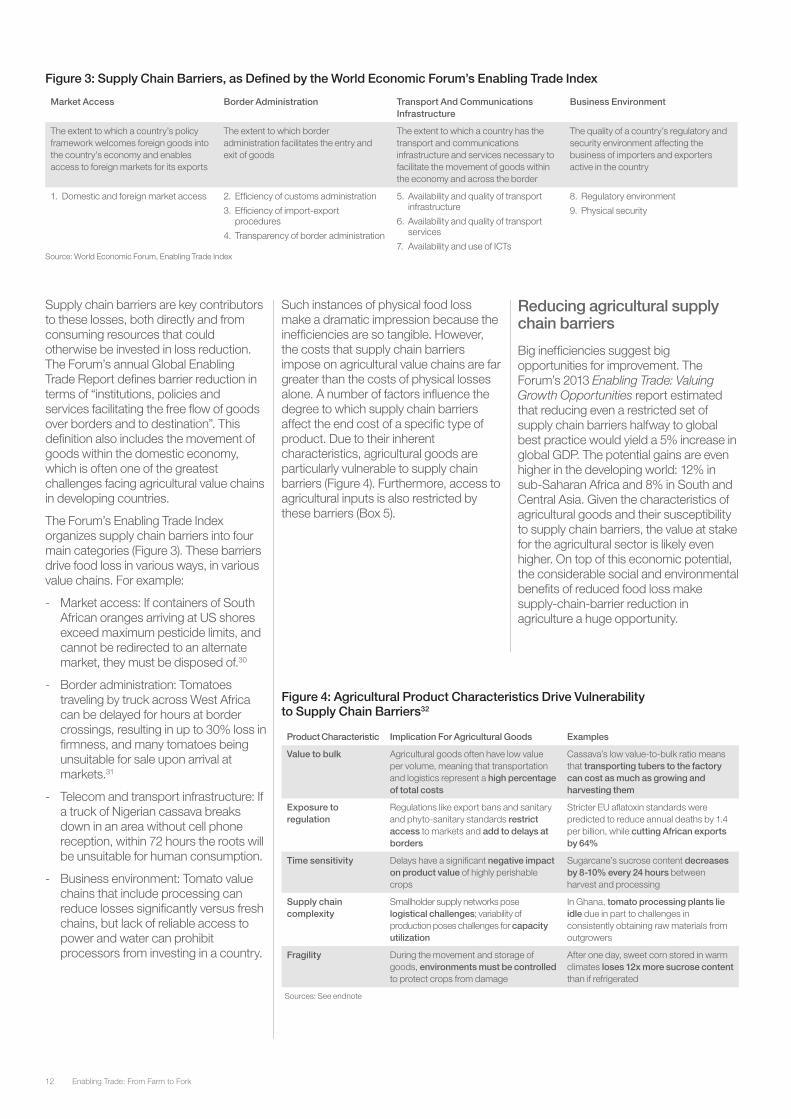
Supply chain barriers are key contributors to these losses, both directly and from consuming resources that could otherwise be invested in loss reduction. The Forum’s annual Global Enabling Trade Report defines barrier reduction in terms of “institutions, policies and services facilitating the free flow of goods over borders and to destination”. This definition also includes the movement of goods within the domestic economy, which is often one of the greatest challenges facing agricultural value chains in developing countries.
The Forum’s Enabling Trade Index organizes supply chain barriers into four main categories (Figure 3). These barriers drive food loss in various ways, in various value chains. For example:
- Market access: If containers of South African oranges arriving at US shores exceed maximum pesticide limits, and cannot be redirected to an alternate market, they must be disposed of.30
- Border administration: Tomatoes traveling by truck across West Africa can be delayed for hours at border crossings, resulting in up to 30% loss in firmness, and many tomatoes being unsuitable for sale upon arrival at markets.31
- Telecom and transport infrastructure: If a truck of Nigerian cassava breaks down in an area without cell phone reception, within 72 hours the roots will be unsuitable for human consumption.
- Business environment: Tomato value chains that include processing can reduce losses significantly versus fresh chains, but lack of reliable access to power and water can prohibit processors from investing in a country.
Such instances of physical food loss make a dramatic impression because the inefficiencies are so tangible. However, the costs that supply chain barriers impose on agricultural value chains are far greater than the costs of physical losses alone. A number of factors influence the degree to which supply chain barriers affect the end cost of a specific type of product. Due to their inherent characteristics, agricultural goods are particularly vulnerable to supply chain barriers (Figure 4). Furthermore, access to agricultural inputs is also restricted by these barriers (Box 5).
Reducing agricultural supply chain barriers
Big inefficiencies suggest big opportunities for improvement. The Forum’s 2013 Enabling Trade: Valuing Growth Opportunities report estimated that reducing even a restricted set of supply chain barriers halfway to global best practice would yield a 5% increase in global GDP. The potential gains are even higher in the developing world: 12% in sub-Saharan Africa and 8% in South and Central Asia. Given the characteristics of agricultural goods and their susceptibility to supply chain barriers, the value at stake for the agricultural sector is likely even higher. On top of this economic potential, the considerable social and environmental benefits of reduced food loss make supply-chain-barrier reduction in agriculture a huge opportunity.
Market Access Border Administration Transport And Communications Infrastructure
Business Environment
The extent to which a country’s policy framework welcomes foreign goods into the country’s economy and enables access to foreign markets for its exports
The extent to which border administration facilitates the entry and exit of goods
The extent to which a country has the transport and communications infrastructure and services necessary to facilitate the movement of goods within the economy and across the border
The quality of a country’s regulatory and security environment affecting the business of importers and exporters active in the country
1. Domestic and foreign market access 2. Efficiency of customs administration
3. Efficiency of import-export procedures
4. Transparency of border administration
5. Availability and quality of transport infrastructure
6. Availability and quality of transport services
7. Availability and use of ICTs
8. Regulatory environment
9. Physical security
Product Characteristic Implication For Agricultural Goods Examples
Value to bulk Agricultural goods often have low value per volume, meaning that transportation and logistics represent a high percentage of total costs
Cassava’s low value-to-bulk ratio means that transporting tubers to the factory can cost as much as growing and harvesting them
Exposure to regulation
Regulations like export bans and sanitary and phyto-sanitary standards restrict access to markets and add to delays at borders
Stricter EU aflatoxin standards were predicted to reduce annual deaths by 1.4 per billion, while cutting African exports by 64%
Time sensitivity Delays have a significant negative impact on product value of highly perishable crops
Sugarcane’s sucrose content decreases by 8-10% every 24 hours between harvest and processing
Supply chain complexity
Smallholder supply networks pose logistical challenges; variability of production poses challenges for capacity utilization
In Ghana, tomato processing plants lie idle due in part to challenges in consistently obtaining raw materials from outgrowers
Fragility During the movement and storage of goods, environments must be controlled to protect crops from damage
After one day, sweet corn stored in warm climates loses 12x more sucrose content than if refrigerated
Figure 3: Supply Chain Barriers, as Defined by the World Economic Forum’s Enabling Trade Index
Source: World Economic Forum, Enabling Trade Index
Figure 4: Agricultural Product Characteristics Drive Vulnerability to Supply Chain Barriers32
Sources: See endnote

13Enabling Trade: From Farm to Fork
Box 5: Impacts of Supply Chain Barriers on Inputs
Lack of access to high-quality inputs (e.g. seeds, fertilizer, pesticide) is a key driver of low agricultural yields in many developing countries. Efforts to reduce supply chain barriers should also aim to facilitate the movement of these inputs. For example, the use of fertilizer nutrients per hectare in Africa is less than 10, relative to about 100 in South-East Asia and South America. Low usage is partially driven by high costs due to supply chain barriers. Inland transport costs are the single largest cost item for fertilizer in Africa, accounting for 20% to 40% of farm gate costs. Success-ful barrier reduction is possible: Kenya stands out as a country that has liberal-ized and expanded fertilizer markets, resulting in higher rates of fertilizer use and yield increases of up to 20%. Liberaliza-tion efforts would also help to increase access to improved crop varieties and seeds through regional trade.33
5. Tipping Points: Saving Food through Economic EfficiencyAcross many different value chains, one thing is consistent: the less that food is worth, the more susceptible it is to losses. Reducing food loss requires resources, either in the form of capital expenditures or increased operating costs. These costs must be outweighed by the expected benefits of loss reduction. Therefore, the more profitable a crop is, the more resources that are available to ensure it makes its way from farm to fork.34
Three main levers exist to improve the economic efficiency of agricultural value chains (Figure 5). Supply chain barriers influence each of these levers in different ways:
1. Reduced price volatility: Supply fluctuates dramatically in agriculture, particularly in developing countries. In years of oversupply, prices drop. As a result, the cost of harvesting and getting food to market can exceed potential revenues. Solutions to reduce volatility include stable policy and reduced export barriers. For example, when Zambian maize experiences a “bumper harvest” of 30% above average, closed borders drive a 50% reduction in prices, whereas open borders result in only a 26% drop.35
2. Increased prices: Aside from volatility, low average prices can also drive food losses. European importers of Kenyan avocados lack visibility on the level of quality they will receive, due to the existence of unofficial exporters. As a result, they apply a price discount to the origin in general. If an improved system of grading were introduced, price segmentation could be created.
3. Reduced costs: The journey that Indian tomatoes take from farm to fork is extremely fragmented, involving regional and local marketplaces. The high number of touchpoints and middlemen add costs along the way, meaning that margins for each player become slim. As a result, investment has been less available for technologies such as plastic boxes, which reduce transport losses by up to 75%.36
It is important to put food-loss-reduction efforts into the broader context of economic efficiency. As governments and companies have limited resources, investments to improve supply chains must be made in ways that will maximize the long-term positive impact on society.
If investments do not allow companies and, subsequently, entire value chains to reach sustainable profitability, governments will expend enormous energy and resources with no momentum developed.
One example is the low success rates of efforts to introduce grain storage technologies in sub-Saharan Africa. Implementation was often done without a clear path to financial sustainability, and the focus on enhancing storage often overlooked missing economic incentives.37
If, on the other hand, policy-makers carefully coordinate efforts as part of a broader strategy to promote promising, high-potential industries, tipping points of profitability can be reached. When this happens, the private sector is able to reinvest retained earnings into the industry – including loss reduction efforts – and a virtuous, self-promoting cycle of development is triggered (Figure 6).

Enabling Trade: From Farm to Fork14
A successful example is Kenyan avocados. In the early 1990s, the Kenyan government liberalized the fertilizer market, leading to a 14 percentage-point increase in fertilizer use among smallholder farmers. Resulting yield increases, combined with government investment in the Nairobi-Mombasa highway and the provision of reliable power at Mombasa ports, helped to allow global shipping companies to invest in and introduce refrigerated containers. Beginning the cold chain at the packhouse gate increased the shelf life of exported avocados, allowing access to distant, high-value markets in Europe. Exporter profits generated from higher-end market prices are now being reinvested to help smallholder farmers improve product quality, driving further price appreciation.38
Similarly, coordinated efforts in infrastructure, financing, policy and capacity-building helped to drive agricultural transformations in countries such as Brazil39 and China40 in recent decades.
Implementation of the solutions proposed in the following sections should thus take place as part of a broader strategy to achieve tipping points within a naturally competitive agricultural sector. The work of the Forum’s New Vision for Agriculture initiative and Grow Africa partnership provides an example of how public- and private-sector actors can work together to create and implement this type of broader agricultural transformation strategy.
All levers are influenced by supply chain barriers (Illustrative)
Value per unit of food
Time
Margin available for reinvestment in loss reduction
Lever 2:Increase prices
Lever 3:Reduce costsLever 1:
Reduce price volatility
Price per unit
Cost per unit
Retainedearnings to
be reinvested
Increased production efficiency
Reduced costs
Lower prices
Increased aggregate
output
Economies of scale
Learning curve effects
Figure 5: Three Levers Can Free Up Resources to Reduce Food Loss
Figure 6: Virtuous Cycles Are Triggered when Profitability Is Achieved within an Enabling Environmnt
Source: Bain & Company analysis
Source: Bain & Company analysis
15Enabling Trade: From Farm to Fork
Endnotes1. “Food wastage footprint: Impacts on Natural Resources.”
FAO 2013.
2. Rough calculation based on the assumption that 30% of total agricultural energy consumption is driven by wasted food. IPCC (2007) Climate Change 2007: Synthesis Report. Contribution of Working Groups I, II and III to the Fourth Assessment Report of the Intergovernmental Panel on Climate Change. [Core Writing Team, Pachauri, R.K and Reisinger, A. (eds).] IPCC.
3. Rough calculation based on the assumption that 30% of total agricultural water consumption is driven by wasted food. Clay, J. (2004) World Agriculture and the Environment: A Commodity-by-Commodity Guide to Impacts and Practices. Island Press.
4. “Food wastage footprint: Impacts on Natural Resources.” FAO 2013.
5. “Global Food Losses and Food Waste.” FAO. 2011, Dusseldorf, Germany.
6. Kader, A.A. and Rolle, R.S. 2004. The Role of Post-harvest Management in Assuring the Quality and Safety Horticultural Crops. FAO. Agricultural Services Bulletin 152, 52 p.
7. Even if solutions to food loss meet a minimum rate of return, other factors can inhibit their implementation: lack of access to cash, low appetite for long-term investments, lack of coordination/aligned incentives, and lack of knowledge.
8. “MISSING FOOD: The Case of Postharvest Grain Losses in Sub-Saharan Africa.” World Bank, April 2011.
9. “Calculating Tariff Equivalents for Time in Trade.” USAID, March 2007.
10. “Aid for Trade and Value Chains in Agrifood.” WTO/OECD, 2013.
11. “Growing Africa: Unlocking the Potential of Agribusiness.” The World Bank, January 2013.
12. See “Enabling Trade: Enabling Smart Borders” for additional detail on best practices for implementation of border process improvements.
13. Please see the World Economic Forum website for additional information on the New Vision for Agriculture and Grow Africa initiatives.
14. See http://www.fao.org/worldfoodsituation/foodpricesindex/en/.
15. Kader, A.A. and Rolle, R.S. 2004. The Role of Post-harvest Management in Assuring the Quality and Safety Horticultural Crops. FAO. Agricultural Services Bulletin 152, 52 p.
16. “Agriculture and the WTO.” Australian Government Department of Foreign Affairs and Trade. http://www.dfat.gov.au/trade/negotiations/trade_in_agriculture.html. Accessed 21 November 2013.
17. Hoekman, Bernard, Francis Ng and Marcelo Olarreaga. “Agricultural Tariffs or Subsidies: Which Are More Important for Developing Economies?” July 2003.
18. On-field research conducted, November 2013.
19. http://www.fao.org/news/story/en/item/161819/icode/. Accessed 15 November 2013.
20. “Global Food Losses and Food Waste.” FAO. 2011, Dusseldorf, Germany; Kader, A.A. and Rolle, R.S. 2004. The Role of Post-harvest Management in Assuring the Quality and Safety Horticultural Crops. FAO. Agricultural Services Bulletin 152.
21. “Global Food Losses and Food Waste.” FAO. 2011, Dusseldorf, Germany.
22. “Reducing Food Loss and Waste.” World Resources Institute. May 2013.
23. Assumes that the 6,000 trillion kilocalorie gap reflects new population growth between 2010 and 2050 (i.e. 2.3B) with the food consumed per capita staying constant. Percent of gap source: “Reducing Food Loss and Waste.” World Resources Institute. May 2013. Population data source: http://web.worldbank.org/WBSITE/EXTERNAL/TOPICS/EXTHEALTHNUTRITIONANDPOPULATION/EXTDATASTATISTICSHNP/EXTHNPSTATS/0,,contentMDK:21737699~menuPK:3385623~pagePK:64168445~piPK:64168309~theSitePK:3237118,00.html, accessed 3 December 2013.
24. “Food wastage footprint: Impacts on Natural Resources.” FAO 2013.
25. “Food wastage footprint: Impacts on Natural Resources.” FAO 2013.
26. “Aid for Trade and Value Chains in Agrifood.” WTO/OECD, 2013.
27. “Global Food Losses and Food Waste.” FAO. 2011, Dusseldorf, Germany.
28. “Tesco tackles food waste.” http://www.tescoplc.com/index.asp?pageid=17&newsid=881&rssfeed=tescoplcnews. Accessed 21 November 2013.
29. “Reducing Food Loss and Waste.” World Resources Institute. May 2013.
30. Interview with reefer business head for Africa from a global shipping and logistics company. September 2013.
31. Asare-Kyei, Daniel. “Mapping Post-Harvest Transportation Losses in Vegetable Quality.” ITC, March 2009.
32. Sources of examples, in descending order: Interview with Flour Mills of Nigeria; “Africa can help feed Africa,” World Bank, October 2012; Interview with Carel Bezuidenhout, University of Kwa Zulu Natal, September 2013; “The Case of Tomato in Ghana: Processing,” IFPRI, April 2010; “Supply Chain Strategies for Perishable Products: The Case of Fresh Produce,” Owen Graduate School of Management, June 2008.
33. “Growing Africa: Unlocking the Potential of Agribusiness.” The World Bank, January 2013.
34. Note: Even if solutions to food loss meet a minimum rate of return, other factors can inhibit their implementation: lack of access to cash, low appetite for long-term investments, lack of coordination/aligned incentives, and lack of knowledge.
35. “Africa can help feed Africa,” World Bank, October 2012.
36. http://www.wbkllc.com/Tomato_Profile.pdf, accessed in October 2013.
37. “MISSING FOOD: The Case of Postharvest Grain Losses in Sub-Saharan Africa.” World Bank, April 2011.
38. See Annex X for additional detail.
39. “Brazilian Agriculture: The Miracle of the Cerrado.” The Economist. http://www.economist.com/node/16886442. Accessed 27 November 2013.
40. “China’s Quiet Agricultural Revolution: Policy and Programs of the New Millennium.” Eurasian Geography and Economics, Vol. 52, Issue 2, 2011. http://www.tandfonline.com/doi/pdf/10.2747/1539-7216.52.2.242.
Enabling Trade: From Farm to Fork

Enabling Trade: From Farm to Fork16
6. Case Studies
Enabling Trade: From Farm to Fork16

17Enabling Trade: From Farm to Fork
1. Agriculture in Nigeria
In the 1960’s, Nigeria was a major exporter of groundnuts, cotton, cocoa and palm oil. In the decades following independence, the economy became increasingly centred on petroleum. Agricultural growth stagnated due to lack of investment and enabling policies. In 2001, the government launched initiatives to promote the sector’s development, triggering 11% annual growth in agricul-tural GDP over the following ten years1. Despite this growth, the country still imports the vast majority of staple foods such as rice and wheat. In 2012, the Federal Ministry of Agriculture and Rural Development (FMARD) announced an updated approach to agriculture through the Agricultural Transformation Agenda (ATA). The programme aims to support the production of target crops through a favourable policy environment, access to finance and land, improved infrastructure and tax benefits.
2. Cassava in Nigeria
Cassava is one of six target crops receiving ATA support. Nigeria’s soil and climate are well suited to cassava cultiva-tion,2 and the country is already the world’s largest producer of the crop, with 2011 production estimated at 52 million mt.3 Brazil, the world’s second-largest producer, produced only half that amount. The Nigerian cassava production land-scape is dominated by thousands of smallholder farmers, with an average farm size of two hectares.4 Approximately 95% of the cassava produced in Nigeria is processed by local small businesses into traditional West African staple foods like garri.5 These foods are a key part of local diets – in fact, cassava makes up 40-50% of calories consumed in southern and central Nigeria.6
Nigerian Cassava Flour: Broadening Value Chains for Traditional Crops
Cassava is a versatile crop; its starch can be used in a number of value-added products, beyond traditional foodstuffs (Figure 7). The main focus of the ATA’s cassava programme is to facilitate the development of these “industrial” value chains.
A small number of private-sector-led processing facilities for HQCF, starch and ethanol have been constructed in recent years. This case study focuses primarily on the development of the HQCF value chain. The lead partner company for this case study, Flour Mills of Nigeria, recently acquired a flour processing subsidiary called Thai Farms International (TFI). Through this connection, data and interviews with farmers, transporters and customers were obtained along the flour value chain during a three-week field visit to Nigeria.
3. High-quality Cassava Flour
HQCF (so-called to distinguish it from less pure, traditionally-processed cassava flours) can supplement wheat flour in bread, pasta and confectionery. Due to differences in its structural composition, however, it can only be used in limited percentages before the quality of the baked goods suffer (e.g. bread does not rise, biscuits crumble).7 In 2005, the government introduced legislation obligating wheat flour millers to incorporate 10% cassava flour in their wheat flour. Enforcement of this legisla-tion largely failed due to insufficient HQCF production capacity, unreliable quality and high costs.8
Figure 7: Alternative End Uses for Cassava
Source: Foundation for Partnership Initiatives in the Niger Delta (PIND), 2011. “A Report on Cassava Value Chain Analysis in the Niger Delta”
High-quality cassava flour
- Can be used as a supplement for up to 5% of flour in bread (or more, with special additives)
- Can be used in cookies and biscuits in larger amounts
Starch - Competes with maize starch
- Industrial uses include food, adhesive, dextrin
Sweeteners - High cassava fructose syrup, glucose, sorbitol
- Used in soft drinks and juice industries
Dried chips - Used for ethanol production and animal feed
- Reduced perishability for transport
Ethanol - Fermented and distilled cassava
- Industrial uses include fuel, beverages, industrial alcohol

Enabling Trade: From Farm to Fork18
Production capacity has since grown, and bread and biscuit makers are increasingly incorporating HQCF. However, producers still struggle to profitably compete with flour made from imported wheat, despite the 15% wheat tariff protecting the nascent HQCF industry.9 A number of supply chain barriers contribute to this cost differential.
4. Impacts of Supply Chain Barriers and Potential Solutions
The HQCF value chain is nascent, fragmented and informal. Farmers harvesting cassava can choose to sell to “garri ladies” (local women who process tubers into traditional foods) or to industrial processors. This decision is taken at the time of harvest, typically without long-term contracts. Again, most cassava farmers own only a few hectares of land; the few commercial farms that exist, however, tend to supply industrial processors and so are particularly relevant for the HQCF value chain. After harvesting, tubers are transported to the processor in trucks. Cassava tubers must be processed within 72 hours of harvesting due to rapid fermentation that renders them sour and unfit for consumption.10 As a result, harvesting typically only occurs once a guaranteed buyer is identified. This precaution helps to avoid food loss during transport; such loss only occurs in rare cases (e.g. a truck breaks down in an area without mobile phone coverage).
Upon arrival at the HQCF processing facility, the roots are weighed and their starch content measured. After processing, the HQCF is bagged and sent to customers (mainly confectionery producers). End markets are concentrated in the south of Nigeria, in and around the major cities of Lagos, Ibadan and Abuja.
Transport and Communications Infrastructure
Cassava roots are made up of only 15-20% starch; the rest is water, fibre, peels and skin.11 Although some waste by-products can be sold as animal feed, the starch is the most valuable component. As a result, the tubers have an extremely low value-to-bulk ratio, so any reduction in transport cost will have a relatively high impact on value chain profitability.
Reduced distances
Reducing the distance between farm and factory is one of the biggest long-term levers for improving HQCF profitability. One way of achieving this is through vertically-integrated farms and factories, which is discussed in further detail in the section on business environment. Whether vertically integrated or not, there is an optimal size for cassava processors, which balances the operational benefits of scale with the cost of transporting tubers across long distances. Finding this balance is a critical aspect of building a profitable Nigerian cassava industry, and should be considered when constructing any new processing plants.
Improved logistics
Aside from these long-term approaches, short-term solutions are available to reduce the cost of transporting product to existing HQCF processors such as Thai Farms International (Figure 8). Farmers typically pay for transport themselves, thus reducing their willingness to send tubers across long distances and encouraging them to sell to local garri processors. In turn, this barrier reduces industrial processors’ ability to procure the quantity of raw materials needed to maintain adequate capacity utilization (large industrial cassava processors’ utilization ranges from 20% to 50%).12 Given producer cost structures, current HQCF market prices and average raw-tuber prices from August 2012-August 2013 (US$ 82/mt), industry profitability would be within reach if more raw materials were accessible.13
Figure 8: Cassava Sourcing Footprint of Thai Farms International: Limited to a 200-km Radius
Cameroon
Niger
Nigeria
Abuja
Lagos
Thai Farms
60-km radius, avg. load size 2 mt;~30% of volumes
200-km radius, avg. load size 7 mt;~90% of volumes
Source: Thai Farms International
Potential suppliers can be divided into local smallholders, mid range smallholders and distant commercial farms. For local smallholders and distant commercial farms, creative solutions have been found to reduce transport costs and make the transaction profitable for farmers. For mid range smallholders, a solution has been identified but not yet implemented (Figure 9).
Local smallholders: vertically integrated transport
Initially, farmers were expected to arrange their own transport to processors through third parties. However, the additional margins charged by transporters added costs to the value chain, making it more difficult to compete with local garri producers. Consequently, some large Nigerian processors have acquired a small number of trucks to transport roots. Farmers still pay for the transport, but on an “at-cost” basis.
Distant commercial farms: backhauling
A huge amount of cargo enters Nigeria through the ports at Lagos and is then trucked north to markets. Trucks typically make the return journey without cargo due to the limited production of goods in the north. Recognizing this opportunity, TFI leverages its sister company, Golden Transport Company (GTC, also a subsidiary of Flour Mills of Nigeria), to move cassava grown in the country’s mid-regions to the south. GTC charges farmers for this service at cost, and everyone wins.

19Enabling Trade: From Farm to Fork
Mid range smallholders: collection points
Backhauling is an effective solution for large farms, which have adequate supply to fill an empty 30-mt truck. However, for midsized farms with harvests of 3-5 mt, other arrangements must be found. Even at current cassava prices, which are above the norm, transporting cassava in 3-mt trucks is generally not economical across distances exceeding around 60 km.14 The bulk shipments enabled by collection points could be moved using 40- or even 60-mt trucks, providing obvious logistical benefits and reducing risk for the farmer (Figure 10).
Collection points also offer an opportunity to implement improved storage methods. Tubers kept in the shade while volumes accumulate can reduce the onset of post-harvest deterioration.15 Other storage approaches (e.g. plastic bags, layering tubers with straw and soil) have extended tuber shelf life to a week or more and could be further explored, although costs would have to be carefully managed.16 Farmer education is an important component of implementing any of these methods, and could be coordinated jointly by the public, private and donor sectors.
TFI is currently organizing a pilot to test the collection point concept, which the company hopes to have operational in early 2014.
Future potential: primary processing
Another innovative method of reducing transport costs is processing tubers into chips or cakes to reduce bulk and extend shelf life, using small facilities located close to farms or collection points. Dutch Agricultural Development & Trading Company has developed Autonomous Mobile Processing Units, which travel to platforms in rural locations and source raw materials from local farmers. In the already uncompetitive HQCF value chain, this approach creates a main challenge by adding another layer of costs that are not easily compensated for by transport savings. Additional research may yield success in the future as the technology and efficiency of this model improve.
Figure 9: Creative Logistical Solutions Can Help to Increase the Supply of Raw Materials
Note: (*) Procurement is estimated based on the local selling price of avocados in Kenya
Sources: Thai Farms International, farmer interviews, Bain analysis
61
3
20
30
300
3
60
40
60
Cost to deliver 1mt of cassava to factory gate (USD)
Localsmall-holders
Verticallyintegratedtransport
Backhauling
Collectionpoints
Distantlarges cale
Mid-rangesmallholders
(Current)
Mid-rangesmallholders
(Future)
125
100
75
50
25
0
1-year averagefactory gate price:$82/mt
Transport
Harvesting
Production
8%31%
62%
65
35%
17%
49%
109
48%80
24%
47%
29%
17%
35%
Truck size (mt)
Distance (km)
3mt
Current Arrangement Future Arrangement
Transport cost reduced by about 50%*
Farm
Farm
Farm Farm
Farm
Farm
Processor
3mt
40mt
Farm
Farm
Farm Farm
Farm
Farm
Processor
CollectionPoint
Figure 10: Collection Points Offer Improved Logistics and Reduced Transport Cost
* Reflects current cost of 8,300 Naira (N)/mt vs 750 N/mt for transport to collection centre + 500 N/mt cost of running collection centre + 2,500 N/mt for transport from collection centre to Thai Farms
Sources: Thai Farms International; Bain & Company analysis

Enabling Trade: From Farm to Fork20
Transport infrastructure
While requiring significant government investment, improvements to underlying infrastructure would generate benefits across a number of value chains, not only for cassava.
Cassava for industrial processing typically moves down the LAKAJI corridor, the most important transport artery in Nigeria, from production areas in the middle of the country (e.g. Kwara state) to processors located closer to Lagos end markets (Figure 11).17 Travelling by road along the corridor takes 130% more time per km and costs 25% more than a similar regional corridor between Burkina Faso and Ghana.18,19
Figure 11: LAKAJI Growth Corridor – Nigeria’s Primary Route for Transporting Agricultural Goods
Cameroon
Niger
Nigeria
Lagos
Katsina
Source: USAID/NEXTT LAKAJI Growth Corridor Project
Investments in improved road infrastructure are important in the long term, but the most effective and feasible solution to bridge the gap in costs and delays is to restore Nigeria’s extensive rail network. Most of it is currently not operational; however, a significant budget allocation was made in 2009 to fund investments in rail rehabilitation, and a segment between Lagos and Kano opened for operation in 2012. Shipping a container along this segment is 25% cheaper by rail than by road.20 Private sector investment in wagons is now needed to help drive increased usage of this segment. In addition to infrastructure, regulations can also have important impacts on transportation efficiency (Box 1).
Box 1: Impacts of regulation on transportation servicesRegulation can sometimes be even more important than infrastructure in enabling the efficient movement of agricultural goods. A recent study found that transportation costs along four African corridors are no higher than in other developing countries like China. However, transportation prices are far higher. High African profit margins – up to 160% in Central Africa – are a result of regulations that restrict entry of new companies.21
Liberalization of movement within regions is also critical, both for reducing direct costs and for promoting competition.22 In Central America, Guatemalan exporters sending goods overland to Mexico are forced to offload their cargo from Guatemalan trucks at the border and reload it onto Mexican trucks, and vice versa.23 In both countries, this process adds direct costs that make exported goods less competitive and restricts competition in the transportation sector.
Exports of HQCF are not feasible in the near future, given Nigeria's huge domestic market and lack of competitiveness versus other HQCF exporters. However, port infrastructure is important for this value chain in two ways. First, agricultural and processing equipment must be imported into Nigeria in order for the HQCF industry to grow, along with inputs for manufacturing fertilizer. Second, exports of cassava chips to China or Costa Rica are seen by some as an effective way to sell excess cassava in glut years, helping to smooth prices and reduce the potential “whiplash” effect of price volatility on production levels. Lagos port logistics reveal opportunities for improvement: almost 100% of transport costs between the port and Lagos proper could be avoided if best practices were implemented, such as increased use of rail and containers.24
Business Environment
Reduced policy risk
Dramatic fluctuations in supply and demand make long-term profitability elusive for both producers and proces-sors. Lack of data and poor information flows mean that farmers must rely on price signals to make production decisions. Seeing prices spike, farmers increase the area of cassava planted in the following year. Thousands of smallholder farmers may react in this way and overcompen-sate, causing a glut in the market (Figure 12). The process then repeats.
Many improvements to the value chain can decrease the volatility of supply and demand, including better provision of information, improved contract enforcement, vertical integration and low-cost primary processing to increase shelf life. However, one key solution could be implemented immediately and at essentially no cost: increased consistency in government policy, given past supply fluctuation in response to policy changes.
Unpredictable policies drive volatility in production volumes and prices (Figure 13). For example, Nigeria imposed a 110% tariff on rice in January 2013. Changes like this have immediate and important impacts on demand for cassava, due to garri’s role as a substitute for imported grains.
Corruption and fraud
Corruption and other unscrupulous business practices impose costs along the HQCF value chain as well as all agricultural value chains in Nigeria. “Informal fees” at the border drive additional costs of US$ 70 per 20-foot-equivalent unit, making it more expensive to import farm and processing equipment.25 Counterfeit fertilizer limits potential yields in the short term, and reduces fertilizer adoption rates in the long term. Truck drivers sometimes take unofficial side jobs along their routes to earn extra pocket money. According to some transport operators, a common scam is when drivers collaborate with state border agents to fake truck breakdowns. A tow truck is then “hired” and exorbitant charges are sent to the transport parent company, with the driver and government agent ultimately sharing the proceeds. Too often, funds earmarked for development of the agricultural sector and associated infrastructure somehow fail to translate into the intended investments.

21Enabling Trade: From Farm to Fork
Strong political leadership and an effective judicial system are required to drive change in the long term. Over the short term, the private sector can help to reduce the impacts of corruption and fraud, and to accelerate the rate of change. Scale gives companies valuable leverage and resources. GTC has the resources to test its fuel quality, thus reducing scams in the long run. When the testing system was first implemented, 4-5% of loads were rejected; rejection percentages are now negligible.26 Large transport companies have GPS tracking on all trucks to locate them in case of breakdowns and to reduce illicit movements. Companies also maintain in-house maintenance crews, bypassing the “tow truck” scam. Beyond individual company scale, collaboration between private-sector actors can provide additional leverage in lobbying governments for transparency on tracking funds, and for implementation of electronic processes to reduce corruption at the borders.
Enabling structural changes
HQCF processors face intense competi-tion for raw materials from local garri processors. Garri is an important part of the traditional Nigerian diet and, as such, demand is very inelastic. However, bakers are extremely price sensitive. Because wheat flour is directly substitutable, HQCF processors have a maximum price for what they can pay for tubers, since they cannot pass raw material cost increases on to consumers. Development of commercial-scale farming will expand supply, reduce production costs and thereby provide a buffer for HQCF processors, with vertical integration giving them control over their own raw material supply. Nigerian production costs are around US$ 40/mt compared to Thai-land’s at US$ 30/mt; bridging this gap is a critical step towards achieving the tipping point of industry profitability.27
Aside from consistent regulatory policy and reduced corruption and fraud, two additional aspects of Nigeria’s business environment could encourage private-sector investment in this space: reliable non-transport infrastructure and access to agricultural finance. As part of its Agricul-tural Transformation Agenda, the FMARD will create staple crop processing zones (SCPZs) for target crops. The plan is for the SCPZs to receive government support, such as access to finance, land ownership, and power, water and road infrastructure. Implementation of this plan would improve the competitiveness of HQCF and the agricultural sector as a whole.
Cassava production (M mt)
60
50
40
30
20
10
0
1987
1989
1991
1993
1995
1997
1999
2001
2003
2005
2007
2009
2011
200
175
150
125
100
75
50
25
Evolution of cassava supply vs population (1987-2011)
Wheat flour importationban lifted by Yar’ Aduaadministration
Legislation mandating 10%inclusion of HQCF takes effect
IFAD sponsored cassavamultiplication programme,1987-1995
Obasanjo launches Presidential Initiativeon Cassava; ban on wheat importation
ATA launchedby President Jonathan
Impact of 2006 oversupply:
Population (M)
“President Obasanjo told everyone to plant cassava in 2005. So we did. In 2006, I didn’t have a buyer for 80% of my crop, so it stayed in the ground.”
Cassava farmer, Kwara state
“In 2006, people were dumping cassava in ditches by the truckload.”
MD of Thai Farms International
“After I couldn’t sell my crop in 2006, I stopped planting cassava until 2010.”
Cassava farmer, Ogun state
Figure 12: Excessive Supply May Force Farmers to Let Cassava Rot to Clear Fields for Planting
Sources: FAOSTAT; World Bank population database; TechnoServe presentation at Cassava Development Corporation workshop, Abuja, 22 October 2013; interviews
Source: Thai Farms International
Figure 13: Nigerian Cassava Supply Fluctuates in Response to Policy Changes

Enabling Trade: From Farm to Fork22
Border Administration
Movement of goods within Nigeria is subject to regulations and fees that also add to total costs. Trucks are stopped at local and state borders and charged additional fees, which add approximately 6% to the cost of transporting cassava (Figure 14).28 If permits to operate a truck in each area are obtained in advance, the impact of these “on-the-spot” fees is reduced, but getting permits every year is a huge burden. Trucks are required to carry about 50 individual permits costing US$ 75-150 per truck per year, not to mention the administrative trouble of navigating the application process (figure 15).29 Reducing this burden should be a priority for the LAKAJI growth corridor initiative. Discussions among national, state and local governments should include an analysis of the potential impacts of establishing a “free zone” for the movement of trucks – both in terms of lost permitting revenues and increased trade.
National border administration is also relevant for the development of the HQCF value chain, both to facilitate access to equipment and inputs, and to develop cassava chip exports while reducing tuber price volatility. In 2012, a pioneering agribusiness company attempted to ship four containers of chips to China. After coordinating the logistics required to source, chip, pack, and transport the cassava to the Lagos port, the company encountered so many challenges at the border that it abandoned the effort.30
Figure 14: Unofficial Border Fees Add 6% to Transport Costs
Transport cost
Transport cost per 30mt truck ofcassava Kwara to Ososa (450 km); USD
1,250
1,000
750
500
250
0
1,108
Official cost94%
Fees: 6% Nigeria’s informalfees of US$ 11/100 kmare highest in WestAfrica; 60% higherthan thenext highestcountry ,Mali
Sources: Interviews with Kwara state farmers; LAKAJI corridor baseline assessment; USAID West Africa Trade Hub
Clearing one container for export requires 79-100 signatures.31 The cost of border clearance for one container (US$ 187) is 44% higher than benchmarks of African countries with similar GDPs. The challenge of bearing these costs and navigating the procedures is so great that one major third-party logistics provider had to cancel all contracts that involved handling goods within the port. Alleviating these bottlenecks will be critical not only for the cassava value chain development, but also for Nigeria’s agricultural sector as a whole. Best practices for border administration are well understood and documented, but require political leadership and investment (see the “Enabling Smart Borders” section of the Enabling Trade: From Valuation to Action report).
Market Access
Cassava chip importers, such as China and Costa Rica, have minimum standards for chip specifications (e.g. maximum moisture content, minimum starch content); these specifications are clearly communicated and are not exceedingly strict. Particularly for initial shipments, chip exporters must work with processors to ensure that these quality standards are met in order to establish a credible reputation and compete with established Thai chip exporters.
5. Conclusion and Recommendations
A number of supply-chain-improvement initiatives could help to reduce the overall food loss (Box 2) and bring the HQCF value chain to its tipping point of competi-tiveness with wheat flour (Figure 17). Some would benefit all agricultural value chains, and others are specific to cassava. Promising progress is being made along both fronts. Based on the initial analysis done in this case study, two priorities are highlighted for further consideration.
Box 2: Food Loss in Nigerian Cassava Value Chains32
Note: Food loss figures are estimates only. Garri-value-chain figures are based on a German Federal Ministry for Economic Cooperation and Development (BMZ) survey of 200 farmers, 30 garri processors, 30 garri marketers and 25 starch processors. HQCF figures are based on these BMZ results, adjusted to reflect farmer and processor interviews conducted by the authors.
Food loss occurs at higher rates in the traditional garri value chain (about 35%) than in the industrial HQCF value chain (about 20%) (Figure 15). Garri processors peel tubers by hand, so small tubers are discard-ed. Also, garri is susceptible to post-process-ing losses due to higher moisture content and informal storage methods.
Harvesting: Manual harvesting is the predominant method across both chains, resulting in about 5% of tubers being damaged and left on the field. During harvesting, about 2% of tubers are left on the field due to their small size. “Not sold” reflects the rough estimate that 25% of the harvests are discarded every five years due to gluts in supply, driven largely by changes in policy (import tariffs of substitute products and politically-driven
Figure 15: Permits Required to Operate a Commercial Truck in Nigeia
Sources: Bain & Company; Flour Mills of Nigeria

23Enabling Trade: From Farm to Fork
Traditional
Industrialized
Harvesting
Distribution ConsumptionTransport Processing Transport
Total
2-4% lossStorage lossesTransport losses
12% lossDamage during harvestingToo smallNot sold
10-12% lossToo smallToo woodyProcessing
2-3% lossTransport losses
7-9% lossMoistureStorage lossesPests
Out of scope
2-4% lossStorage lossesTransport losses
6-7% lossLow starch/ too oldProcessing
~0% loss ~0% loss Out of scope
33-40%
Distribution ConsumptionTransport Processing Transport
Total
20-23%
Figure 16: Food Loss in Nigerian Cassava Value Chains (Estimates)
Note: Totals are estimated, as percentages are based on different quantities.
Sources: Interviews with processors and farmers, October 2013; Oguntade, A., “Food Losses in Cassava and Maize Value Chains in Nigeria”. BMZ/German Society for International Cooperation (GIZ), June 2013
promotion of certain crops). Importantly, supply surges reduce prices, making it less economical to spend money to avoid food loss along the value chain.
Post-harvest handling and storage: Farmers reported losses of 1-2% during storage of fresh tubers, and 1-2% during transport; losses are roughly consistent across value chains. While very rare, storage and transport losses occur over entire cassava shipments. For example, if an identified buyer does not arrive to pick up a load within 72 hours, the tubers are no longer sold.33 Again, this type of loss occurs more often in years of oversupply, when buyers are difficult to find.
Processing and packaging: Garri processors reject about 10% of all tubers deemed too small or too woody for hand peeling. HQCF processors can reject entire loads that are spoiled or have extremely low starch content, although this rarely occurs (impact estimated at 5%). After these 5-10% losses due to rejections, processing itself drives further losses of 1-2% in both value chains.
Distribution: Processed garri incurs losses due to poor storage methods, pest infestation, spoilage/moisture and transport. HQCF losses have been assumed to be negligible as the product has low moisture and is less vulnerable to spoilage; it tends to be packaged, transported and stored in more formalized, protected environments.
initiatives Food loss Value at stakeEase of
implementation*
Set up collection points to allow for bulk transport of roots
Educate farmers on best practices in post-harvest storage
Introduce small processors to reduce transportation distances
Develop primary processing model to reduce transportation cost
Establish export channels for off-take of excess chips to smooth price/supply volatility
Reduce border administration and improve transparency through e-customs
Create a consistent policy environment
Invest in infrastructure along LAKAJI corridor, starting with rail
Implement SPCZ plans to facilitate commercial farming
Figure 17: Potential Initiatives to Reduce HQCF Supply Chain Barriers
Note: (*) Ease of implementation is assessed based on the number of stakeholders, nature of stakeholders, time for implementation, investment required, need to adapt/change the legal framework, and contentiousness of reform.
Sources: Bain & Company analysis; interviews
Logi
stic
alR
egul
ator
yS
truct
ural
Low to high impact
Low to high feasibility
Quick win: medium value, high ease of implementation
Long-term priority: high value, lower ease of implementation

Enabling Trade: From Farm to Fork24
Cassava-specific initiatives
A private-sector-led body is being formed to further this nascent industry’s development. In October 2013, FMARD convened a group of public and private stakeholders to discuss the structure and role of a new Cassava Development Corporation (CDC). An external consultant facilitated the session, and the group aligned on a board structure and an initial list of activities that should be pursued by the Corporation.
To leverage the CDC, the establishment of collection points could be a “quick win” that would generate results in a short time frame and create additional momentum for further initiatives.
Existing processors can drive progress on this initiative by conducting analyses of the optimal locations for collection points. Thai Farms has already identified a location where it could source raw materials from up to 1,000 local smallholders.34 Donor-funded agencies can facilitate the development of farmer cooperatives to supply tubers to this collection point, open up channels of communication between processors and farmers, and potentially mediate negotiations. Government’s role could be to assist with providing access to land for the collection point, a potentially contentious issue that is already a challenge for Thai Farms with its collection point location. Throughout implementa-tion, the CDC can be used as a forum for sharing roadblocks and best practices among processors, as well as the public, private and donor sectors. Successful performance on this quick win will build stakeholder confidence in the potential of the CDC to achieve results, create momentum to drive progress on other initiatives and mobilize additional funding from donors and the government.
Sector-wide initiatives
In addition to the cassava-specific initiatives, broader investments in infra-structure will benefit the agricultural sector as a whole. USAID has funded the NEXTT project, for which an external consultant has done an initial assessment of the LAKAJI corridor’s performance as a trade route. Through primary field research and extensive interviews with various stake-holders, data was collected on the costs and time required to travel along this route. These metrics were benchmarked against regional and global best practices to identify bottlenecks and opportunities for improvement. High-level recommenda-tions to the government have been drafted based on the findings. A list of investment opportunities for the private sector along the corridor has also been generated, from cultivation to warehousing to ICT.
The NEXTT team is now mobilizing a group of public- and private-sector stakeholders to translate these opportunities into action. This process is a prime example of how a third-party organization can help catalyse progress by creating a data-driven understanding of opportunities. Success will depend on how engaged and optimistic various stakeholders are about the initiative’s potential to positively impact Nigeria’s agricultural sector. Strong leadership and targeted communications are called for to achieve this level of excitement and engagement.
Endnotes1. Nigerian National Bureau of Statistics. http://www.
nigerianstat.gov.ng/. Accessed October 15, 2013. Bain analysis.
2. Reference IITA yield successes.
3. FAOSTAT online database. http://faostat.fao.org/. Accessed September 15, 2013.
4. “Action plan for a cassava transformation in Nigeria.” Federal Ministry of Agriculture and Rural Development. 2011.
5. “Action plan for a cassava transformation in Nigeria.” 2001.
6. “Action plan for a cassava transformation in Nigeria.” 2001.
7. Interview with Louw Burger, Managing Director of Thai Farms International. October 2013.
8. Interview with Louw Burger. October 2013.
9. Nigerian customs website. https://www.customs.gov.ng/hscode/resulthscode.php?TYPE=DESC&HSCODE=glucose&MODE=ALL. Accessed September 2013.
10. Zidenga, Tawanda. “Delaying Postharvest Physiological Deterioration in Cassava.” August 2012. ISB News Report.
11. Interview, Managing Director of Thai Farms International. October 2013.
12. Interviews with representatives from major HQCF, starch and ethanol processing facilities. Abuja, Nigeria. October 2013.
13. Confidential underlying data provided by Thai Farms International/Flour Mills of Nigeria.
14. Interview with Managing Director of Thai Farms International, October 2013. Verified through Bain analysis.
15. Interview with Paul Illona, Harvest Plus Country Manager for Nigeria. October 2013.
16. “Storage and Processing of Roots and Tubers in the Tropics.” FAO. http://www.fao.org/docrep/x5415e/x5415e04.htm. Accessed November 21, 2013.
17. There are of course exceptions, both in terms of farm and processor locations.
18. “Lagos-Kano-Jibiya (LAKAJI) Corridor Performance: Baseline Assessment Report on the Time and Cost to Transport Goods.” USAID/NEXTT. 2013.
19. Adjusted for differences in total kilometres, as LAKAJI corridor is 10-15% longer than Ouagadougou-Tema.
20. “Lagos-Kano-Jibiya (LAKAJI) Corridor Performance: Baseline Assessment Report on the Time and Cost to Transport Goods.” USAID/NEXTT. 2013.
21. Teravaninthorn, Supee and Gael Raballand, “Transport Prices and Costs in Africa: A Review of the International Corridors.” World Bank, 2009.
22. Raballand, Gael, Charles Kunana, and Bo Giersing. “The Impact of Regional Liberalization and Harmonization in Road Transport Services: A Focus on Zambia and Lessons for Landlocked Countries.” World Bank Policy Research Working Paper 4482. January 2008.
23. Interview, Guatemalan agricultural production company. September 2013.
24. “Lagos-Kano-Jibiya (LAKAJI) Corridor Performance: Baseline Assessment Report on the Time and Cost to Transport Goods.” USAID/NEXTT. 2013.
25. “Lagos-Kano-Jibiya (LAKAJI) Corridor Performance: Baseline Assessment Report on the Time and Cost to Transport Goods.” USAID/NEXTT. 2013.
26. Interview with Managing Director of Golden Transport Company. October 2013.
27. “Action plan for a cassava transformation in Nigeria.” Federal Ministry of Agriculture and Rural Development. 2011.
28. Interviews with farmers, Kwara state, October 2013. Supplemented by findings of LAKAJI corridor baseline assessment.
29. Interview, Managing Director of Golden Transport Company. Lagos, Nigeria. October 2013.
30. Interview, Martin Fregene, FMARD. October 2013.
31. “Corruption Risk Assessment”. Independent Corrupt Practices and other Related Offences Commission, April 2013.
32. Loss data come from two sources: interviews with processors and farmers conducted in October 2013, and “Food losses in cassava and maize value chains in Nigeria.” BMZ/GIZ.
33. Zidenga, Tawanda. “Delaying Postharvest Physiological Deterioration in Cassava.” August 2012. ISB News Report.
34. Interview with Louw Burger, Managing Director of Thai Farms International. October 2013.

25Enabling Trade: From Farm to Fork 25Enabling Trade: From Farm to Fork

Enabling Trade: From Farm to Fork26
Indian Tomatoes: Adding Value and Reducing Losses through Processing
1. Introduction
India ranks second in the world for both total agricultural land and farm output.2 The country benefits from highly diversified climatic and soil conditions, and agriculture is a core part of its economic, political and social constitution. A long period of agricultural expansion began in the 1970s, but the slowdown in agricultural growth has become a major concern.3 The Government of India is now prioritizing efforts to reduce poverty through increases in agricultural productivity. However, there is a need to shift away from an over-regulated, subsidy-based model towards healthy fundamentals, achieved through efficiency gains along the supply chain.4 Better post-harvest transport and storage of crops is an important piece of the puzzle: one-third of food losses in India occur during storage and transit.5 Improved back-end supply chain processes and better cold-chain facilities could reduce food loss and save up to US$ 15 billion annually, apart from securing over US$ 5 billion in additional export revenue.6
Tomatoes, the second most-widely grown vegetable in India after potatoes,7 provide a good perspective on the post-harvest challenges facing the country’s agriculture. India is the second-largest tomato producer worldwide, with about 17 million tons produced in 2010-11 and behind only China (about 40-50 million tons).8 Indian tomato production has doubled in the past decade.9
Despite this overall growth, yields are low at around 20 tons/hectare (ha),10 compared to the world average of 33 tons/ha and China at about 48 tons/ha.11 Though there are some regional disparities,12 the main reasons for low yields are the lack of knowledge about agricultural best practices and limited access to inputs (e.g. seeds, crop protection, fertilizers, irrigation).13
India’s tomatoes are primarily sold on the fresh domestic market. The processing industry represents only about 1% of total production, versus approximately 14% in China.14 Only around 1-2% of Indian tomatoes were exported in 2011,15 but interstate trade within India is significant.16 This is driven by variations in production per capita across states (e.g. from 70 kilograms (kg)/capita in Andhra Pradesh to 10 kg/capita in Bihar17), as well as varying harvest seasons.18
2. Indian Tomato Supply Chain19
Indian tomatoes are usually produced and harvested by smallholder farmers. Farmers stuff tomatoes in plastic boxes and then transport them to mandis, where tomatoes are traded in open markets. Traders purchase the farmers’ merchandise and sell it at the mandis to local retailers or to traders from other states. When tomatoes are sold to traders, they are transported to another mandi and the same iterative process occurs. Otherwise, when sold to local fresh distributors, tomatoes are transported directly to the retail location. Despite the fragmented value chain with multiple middlemen, evidence shows that tomatoes are a profitable crop for farmers. In 2011, the cost for producing tomatoes in Uttarakhand state was around 1.5 Indian rupees (Rs)/kg20 (US$ 0.03), while the 2011 average wholesale price was 11.7 Rs/kg (US$ 0.25).21
Parallel to the fresh-tomato value chain, a small but growing22 percentage of the tomato production is taken to facilities for processing. According to an Indian tomato expert, “the processing industry currently cannot afford to purchase tomatoes for more than 4 Rs/kg, so depending on market conditions and prices, it might be hard for processors to secure sourcing of tomatoes.”23 There is therefore a mixed situation between an established fresh market and a developing processing industry (details on food loss across the value chain are covered in the Box and Figure 18).

27Enabling Trade: From Farm to Fork
Box 1: Food Loss in the Indian Tomato Value Chain24
Note: Food loss figures are estimates only. Figures are based on secondary research, supplemented by a limited number of primary interviews.
The amount of food loss in the supply chain highly depends on the length of the tomato journey. Although tomatoes used for processing and for fresh consumption come from the same production sources, losses differ at the harvesting stage.
Fresh-tomato value chain
Harvesting: Tomato harvesting is done manually in India, which reduces food loss. Labourers can pass through fields 10 to 12 times, picking only the tomatoes that have achieved the ideal level of ripeness.25 Despite the losses that manual harvesting avoids, handling damages, quality sorting, pests and diseases drive losses of about 10% at this stage.26
Post-harvest: The main sources of losses for tomatoes are during transport and handling. Poor road quality, exposure to unfavourable environmental conditions like heat and sunlight, suboptimal packaging quality, long distances and the high number of touchpoints drive losses of about 15-20% at this stage.27
Distribution/consumption: Main sources of distribution losses are damages in transport and storage, unmet standards or inadequate remaining shelf life due to poor stock rotation. It is estimated that losses of 15-20% are incurred in India at this stage.28 In South and South-East Asia, 7% of fruits and vegetables purchased are wasted at the consumer level.29
Processed-tomato value chain
Overall, the processed chain enjoys fewer losses thanks to a shorter journey and increased flexibility on quality.
Harvesting: Generally, harvesting losses are similar across the two value chains, with two important exceptions. First, given less strict specifications for processed toma-toes (e.g. size, colour, damages), farmers’ knowledge and efficiency of farms,30 fewer tomatoes are discarded during harvest versus the fresh-tomato supply chain. Second, processors represent a good alternative for farmers in oversupply situations, so tomatoes that otherwise may have gone unsold have a route to market.
Post-harvest: Processed tomatoes benefit from a shorter supply chain. Indeed, processors typically source directly from the farmer or from the local mandi, which mechanically reduces the impact of loss drivers. Although not quantified, evidence from interviews indicates that the journey to processors generates fewer food losses than the journey to fresh end-markets.
Processing: The extent of losses in tomato processing depends on the equipment and technologies that are used. In general, processing technologies are quite close and therefore opportunities for losses are limited.
Distribution/consumption: Once processed, tomatoes are packed aseptically, and their shelf life can be extended for about 2 years. This further reduces the losses at distribution and consumer levels compared to tomatoes for fresh consumption.
Fresh
Processing
Harvesting
Processing* Distribution ConsumptionPost-harvest
Distribution ConsumptionTransport Processing Transport
Total
Fewer losses(e.g. lowerspecifications)
~15-20% lossTransport (e.g. truck quality, road quality)Handling
~10% lossDamagesSortingPests and diseases
Fewer losses than fresh supply chainShorter journey for tomatoes in fresh formatLess handling due to fewer intermediaries
Not available
~15-20% lossTransport and storageUnmet standardsInadequate remaining shelf life
~7% loss**Over-preparationPerished items
NotAvailable
~25-30%
Fewer lossesLonger shelf life,almost 2 years
Figure 18: Food Loss in Indian Tomato Value Chains (Estimates)
Note: (*) Primary and secondary processing are typically at different places but, in its paste format after being primarily processed, there is no loss due to its long-term perishability and the mode of transport used (i.e. in metal barrels) (**) South and South-East Asia data for fruits and vegetables

Enabling Trade: From Farm to Fork28
Figure 19: Farmers in India Use Plastic Crates for Tomatoes
Source: Unilever
3. Impacts of Supply Chain Barriers and Potential Solutions
Transport and Communications Infrastructure
Plastic crates minimize losses during transport
As a result of Indian government support (e.g. 50% subsidy in Maharashtra) and private-sector involvement, farmers are using plastic crates (Figure 19), which reduces losses by up to about 75% (Figure 20)31. Although the costs for this type of packaging can be recovered in 10-20 trips,32 farmers cannot afford it due to cash constraints and external support has been required.
In the future, a new generation of packaging could reduce losses even further. Pilots are currently being conducted by Unilever and CHEP to test the costs and benefits of these new solutions. In addition, foldable plastic packaging or nestable containers could be introduced. As current plastic crates cannot be folded or efficiently stacked, backhauling becomes an inefficient operation, reducing truck utilization rates and the overall profitability of tomatoes.34
Lack of cold-chain infrastructure generates significant food and value losses
Cold storage for Indian tomatoes could only be realistic in the very long term, and only for high-end consumers who are willing to pay a premium for fresh tomatoes. However, the case of Indian cold-chain development for potatoes, a higher-value crop with a longer shelf life, provides an interesting perspective on the complexities of post-harvest loss reduction.
At present, Indian cold-storage capacity is only around 30 million tons, while requirements are about 60 million tons.35 Due to the limited profitability of cold storage projects, investors must have a long-term horizon, which is challenging for the private sector in high-risk, developing-country environments. To overcome this situation, the Indian government has subsidized up to 50%36 of the cost of building cold-storage facilities (mainly for potatoes) in the Agra region. Once they have been constructed, local private actors have taken over ownership and operations, and have managed to achieve profitability.
Aside from availability of long-term financing, another barrier to the adoption of storage technologies is cash constraints, which farmers face at harvest time, forcing them to sell quickly. To overcome this, the Indian government first removed price-fixing regulations, allowing cold-storage owners to set prices freely. This flexibility reassured banks of profitability and freed up loans. These loans are offered to the cold storage operators, amounting to 25-40% of the current price for a 50-kg sack of potatoes.37 The cold storage operators then lend this amount to farmers. Once the potatoes are in storage, the decision to sell is taken mutually by the storage operator with the farmer. After sale, the farmers pay a flat rental rate for having stored the potatoes. As Bijay Kumar, Managing Director of the Indian National Horticulture Board, says, "there have certainly been reductions in post-harvest losses of potatoes [from the growth in cold storages in the area]."38
In the tomato industry, farmers have adapted their harvesting strategy to deal with this lack of infrastructure. They pick their tomatoes when green instead of red-ripe,39 so that the tomatoes can be sent on longer distances as they will take longer to ripen (Figure 21).40 Moreover, farmers have introduced new tomato varieties that are more resistant to transport bumps and handling.41 In the long run, the tomato supply chain could marginally benefit from the operationalization of the cold chain, mainly to serve the emerging Indian upper class.42
Absence of large trucking fleets drives inefficiencies in tomato transport
Logistics costs account for 6-10% of average retail prices in India, higher than the global average of 4-5%.43 High transport costs are a key driver of this gap.
Variations in taxation across Indian states drive fragmentation in the market. India is divided into more than 30 states (including the seven union territories),44 each with its own taxation specificities. According to one large Indian transporter, “each state tries to encourage investment in warehousing by giving tax deductions. The resulting landscape of small distribution centres is one of the reasons why large transporters tend not to enter the perishables sector.”45 Because of the taxation rules, most logistics companies end up having small stocking points in all states where they operate, rather than the hub-and-spoke distribution model prevalent in many other large countries.
Packing Price* (indexed) Food loss (%)
Bamboo basket ~1x >5
Big wooden basket ~1x <5
Plastic box ~5x 1-2
Figure 20: Price and Food Loss Estimates for Different Types of Packaging33
*in 2004, for a 27 kg box
Source: http://www.wbkllc.com/Tomato_Profile.pdf, accessed October 2013

29Enabling Trade: From Farm to Fork
Consequently, large logistics companies cannot benefit from scale and therefore lose their competitive advantage when compared to smaller transporters.
Moreover, many midsized Indian cities – usually Tier 2 or Tier 3 – have enforced “truck curfews”, prohibiting trucks from accessing the city during daytime. If trucks arrive after dawn and before dusk, they have to wait outside the city, generating long delays and losses due to overripe tomatoes.46
All of these factors present risks to the transport of perishables and discourage larger trucking companies from entering the market. This impacts the tomato value chain overall because it benefits neither from the companies’ investment capacity (e.g. refrigerated trucks, high-quality vehicles, maintenance), nor from their scale and expertise in transport and logistics (e.g. backhauling, capacity utilization across networks).47
Figure 21: Green Tomatoes Take Longer to Ripen Once Harvested
Breaker – Turning pike green
12 to 15ºC 25ºC 35ºC 45ºC
<7
7-10
<4 3-5
<2 1-2<1
14-21
Post-harvest tomato maximum lifetimeby storage condition (2013, in # days)
20
15
10
5
0
Red-ripe
Source: WFLO, 2011. “Identification of Appropriate Postharvest Technologies for Improving Market Access and Incomes for Small Horticultural Farmers in Sub-Saharan Africa and South Asia”
Business Environment
Certain structural improvements would contribute to efficiencies along the value chain, and should be encouraged through collaboration between the public and private sectors.
Develop the processing industry to improve efficiency and reduce losses
Experience from other countries shows a high correlation between GDP growth and development of the tomato processing industry,48 and the Indian government is supporting this development. As the Indian middle class grows, consumption habits change and shift towards more processed food.49
Processors can create an environment that enables better yields for farmers and reduced food loss. First, processors help farmers gain access to inputs, equipment and training on good agricultural practices. Hindustan Unilever’s public-private partnership (PPP) in Maharashtra has demonstrated that professionalized farms can achieve higher yields and lower waste than unskilled farms.50
Furthermore, processing significantly shortens the tomato’s journey from farm to end customer, in terms of distance and number of intermediaries. In Maharashtra, one primary processing facility is not more than a two-hour drive from farms. In contrast, tomatoes sent from this same farm to the large markets in Delhi take three days to arrive after being handled, transported, graded and repacked twice. Shorter journeys mean lower costs and, in most cases, reduced losses. Processing
also increases the shelf life of tomatoes from weeks to years.51
The main reason why the tomato processing industry has yet to successfully develop is that processors have not managed to obtain reliable and consistent sourcing of raw materials at the required cost and quality.52 Volatility in production levels and variations in harvest timing contribute to dramatic price swings. For instance, average prices in Mumbai declined by over 60% from January to February 2011 (Figure 22).53 As a result, processors are usually only able to source their tomatoes during the peak season. Furthermore, firmness, sugar content and colour are the most important factors for determining tomato quality for processing. The primary objective of processors is to have varieties that maximize sugar and solid content, and the traditional varieties grown in India are not optimal for this, which is not necessarily the case for the fresh market.54 Thus, processors are affected by lower processing efficiency.55
Vertical integration can help to circumvent challenges in raw-material supply. Currently, a PPP in Maharashtra involves the state government, a local primary processing company and Hindustan Unilever.56 This primary-processor, wide-ranging programme aims to improve farming techniques, yields and product quality. Ideally, the benefits that farmers get from this collaboration will create long-term trust, and encourage farmers to supply the local processor and respect contracts.
Figure 22: Interstate Trade Triggers Price Volaility
Source: http://www.wbkllc.com/Tomato_Profile.pdf, accessed October 2013
Apr-Jun Jul-Sep Oct-Dec Jan-Mar
Tomato consumption by origin inChennai - Tamilnadu (2004, in tons/day)
Average monthly fresh tomato price inMumbai (2011, in Rs/Qtl)
600
400
200
0
3,000
2,000
1,000
0
Qty (tons)
Need for interstate trade
Chennai example Mumbai example
High volatility in prices
Andhra Pradesh
Karnataka
Tamilnadu
~470
270
200
~400
200
100
100
~360
80
~360
210
300
80
200
Prices dividedby more than 3xover month
6,95
0
5,58
7
5,78
0
3,95
1
4,96
2
5,14
7
8,41
9
7,53
8
8,60
6
8,14
9
9,10
3
9,44
3
JAN
FE
B
MA
R
AP
R
May
JUN
JUL
AU
G
SE
P
OC
T
NO
V
DE
C

Enabling Trade: From Farm to Fork30
Attract large retailers to modernize supply chain efficiency
Local small-scale retailing, the prevalent distribution method in India, also struggles to overcome the impact of barriers. Fragmented local retailers lack the experience, scale and capital to professionalize distribution through investments like cold-chain facilities. When multinational retail chains enter developing markets, their investments reduce costs and food loss along the value chain. A 2008 study shows the impact of bringing a modern supply chain with consolidation points, where losses are reduced by 50-60% compared to traditional vegetable supply chains in India.57
Legislation can either encourage or discourage this type of foreign investment.
Border Administration
Exports of Indian tomatoes are very limited; therefore, the tomatoes do not face international border-crossing issues. Domestically, many permits and various documents are needed to use different roads.58 According to interviews, however, tomato transporters are able to cope well with this barrier, and it was not cited as a major concern.59
Market access
Given the low level of international trade for Indian tomatoes, market access challenges are not highlighted in this study.
4. Conclusion and Next Steps for Industry Stakeholders
Based on this initial case study, a list of initiatives has been drafted (Figure 23), along with a high-level assessment of expected benefits and ease of implementation. While this exercise is intended to be directional only, two initiatives emerge as high-priority and merit further discussion. The first – investing in a new generation of plastic packaging and related supply-chain enhancements identified by mapping – could be considered a quick win due to the relatively high ease of implementation. The second initiative – developing the processing industry – is a longer-term opportunity with possible high value (e.g. fewer food losses, potential to export) but more challenging implementation requirements.
Quick win: invest in new-generation plastic packaging and improved logistics
Unilever and CHEP are collaborating on a pilot to test further improvements in packaging technologies and logistical arrangements. For example, before a packaging solution was identified, a discussion and mapping effort were executed in order to understand the pain points in the supply chain. From this, the decision was made to compare the performance of nestable crates with foldable crates. As part of the loading and unloading processes, crates are usually thrown onto the ground for sorting. Farmers identified that, during this step, mud can become stuck in foldable crates due to the open cavities in the base of the container. The nestable solution was preferable in this regard.
Future trials defined by Unilever and CHEP will work to identify the best crate and will include the following:
- Test crates over varying distances and storage times to quantify impact on food loss
- Evaluate robustness of the selected crate to meet supply chain conditions
- Determine potential cost savings from the selected crate (beyond reduced food loss)
initiatives Food loss Value at stakeEase of
implementation*
Invest in new generation plastic packaging (e.g. foldable)
Improve farmer cooperation and facilitate access to inputs (e.g. seeds, varieties) or training on agricultural best practices
Shorten supply chains and promote direct marketing (e.g. Maharashtra farmers having access to Delhi without having to go through several mandis)
Develop processing industry through better contract enforcement or backward integration
Harmonize state regulations to facilitate the scalability of transport
Relax truck movement limitations to mitigate delay risks for perishables
Develop cold chain infrastructure (facilities, trucks)
Invest in rural road infrastructure
Figure 23: Potential Initiatives to Reduce Tomato Supply Chain Barriers
Note: (*) Ease of implementation is assessed based on the number of stakeholders, nature of stakeholders, time for implementation, investment required, need to adapt/change the legal framework, and contentiousness of reform.
Sources: Bain & Company analysis; interviews
Logi
stic
alTe
chn.
Reg
ulat
ory
Stru
ctur
.
Long-term priority: High value; low ease of implementation
Quick win: Medium value; high ease of implementation
Low to high impact
Low to high feasibility

31Enabling Trade: From Farm to Fork
In addition to container selection, there are other potential benefits of an overall supply chain solution. Optimized crate storage, for example, can allow for space-saving and protection from the elements during the off season. In addition, as volumes increase, tomatoes will need to be transported further than the current 50-km radius, so a supply chain solution incorporating equipment pooling may become more viable (figure 24). In this model, a service provider retains ownership of transportation equipment (e.g. pallets, reusable plastic containers), and manages the network, providing customers with equipment when necessary. This model allows farmers, processors, manufacturers and retailers to utilize the equipment without having to make a capital investment. Other efforts are underway to optimize the packaging and movement of semi-processed tomatoes, such as using 1,000-litre intermediate bulk containers (Figure 25).
Finally, standardization of supply chain infrastructure will be a critical step along the path to modernization, especially as labor costs increase and mechanization becomes more attractive (Box 2).
Box 2: Australian example of standardization as a supply chain enabler
Australian supply chain infrastructure was first regulated decades ago, and benefited from the 1,165 millimetre (mm) x 1,165 mm pallet already being a de-facto standard for a unit load device. Accordingly, truck-trailer widths and lengths, warehousing racking dimensions and forklift specifications were all developed to efficiently optimize the seamless interaction of all elements of the supply chain infrastructure. In an emerging or non-standardized economy such as India, such issues should be considered within policy-makers’ broader, aligned interests.
Figure 25: Intermediate Bulk Containers Are evaluated for Indian Tomatoes
Source: CHEP
Poolingsolutionsprovider
RPCsIBCs
Pallets
RetailerManufacturer
Producer Grower
Figure 24: Equipment Pooling Solutions along the Agricultural Supply Chain
Source: Brambles Ltd

Enabling Trade: From Farm to Fork32
Long-term priority: develop the processing industry
The current PPP in Maharashtra provides promising evidence of the potential benefits of a developed processing industry in India.60 However, to be sustainable, the private sector needs a push from the government in order to establish proof of concept. Farmers, seeing improved yields and reliable streams of higher revenues, would want to take advantage of this opportunity. Eventually, processing could not compete with the fresh market for harvested tomatoes, but rather on land utilization (i.e. which tomatoes to grow, processing-dedicated or fresh-dedicated). The final aim would be to have the land profitability converging between processing-dedicated and fresh-dedicated tomato varieties.
One critical enabler for developing the processing industry is a business-friendly environment for established companies that can provide expertise and investment. For example, companies like BASF, Bayer or Unilever can facilitate access to better-suited inputs and technologies (e.g. seeds, crop protection, soil treatments) and train farmers on good agricultural practices.
Despite the promising progress to date, the processing industry will require time to develop. The government can further ensure that the necessary elements are in place to ease progress. First, creating a conducive policy environment to facilitate investment is critical. In addition, continued support of multistakeholder platforms like the World Economic Forum’s New Vision for Agriculture initiative can help to disseminate best practices and identify opportunities for collaboration along the value chain. Finally, investments in underlying infrastructure and distribution networks provide the backbone for private sector companies like Unilever and CHEP to continue innovating towards more efficient movement of goods. These companies are working closely with the government to define initiatives and policy that best support growth in the sector.
Endnotes1. On-field research conducted, November 2013.
2. http://www.slideshare.net/rvmfinishingschool/indian-agriculture-sector, accessed on 2 December 2013, India Brand Equity Foundation report on agriculture, August 2013.
3. India Brand Equity Foundation report on agriculture, August 2013.
4. http://web.worldbank.org/WBSITE/EXTERNAL/COUNTRIES/SOUTHASIAEXT/EXTSAREGTOPAGRI/0,,contentMDK:20273764~menuPK:548214~pagePK:34004173~piPK:34003707~theSitePK:452766,00.html, accessed on 2 December 2013.
5. http://www.state.gov/e/rls/rmk/204965.htm, accessed on 2 December 2013.
6. Outlook on the logistics and supply chain industry World Economic Forum report: “Potential of Retail Logistics in India: A Perspective” published in July 2013.
7. http://agricoop.nic.in/hort/hortrevo5.htm, accessed on 2 December 2013.
8. In 2011, FAOSTAT, http://faostat.fao.org/site/567/DesktopDefault.aspx?PageID=567#ancor, accessed on 2 December 2013, and “Indian Horticulture database 2011”, National horticultural board, March 2011.
9. “Indian Horticulture database 2011”, National horticultural board, March 2011.
10. “Indian Horticulture database 2011”, National horticultural board, March 2011.
11. “Indian Horticulture database 2011”, National horticultural board, March 2011.
12. “Indian Horticulture database 2011”, National horticultural board, March 2011.
13. Interview with Indian tomato expert, 15 October 2013.
14. Production output derived from FAOSTAT, accessed in November 2013; Processed output derived from “WPTC World production estimate of tomatoes for processing as of 6 September 2013”, World Processing Tomato Council.
15. http://faostat.fao.org/DesktopModules/Faostat/WATFDetailed2/watf.aspx?PageID=536, accessed on 2 December 2013.
16. Interview with Indian tomato expert, 15 October 2013.
17. Production quantities derived from “Indian Horticulture database 2011 », National horticultural board, March 2011, state populations accessed in October 2013 and derived from http://fr.wikipedia.org/wiki/Andhra_Pradesh and http://fr.wikipedia.org/wiki/Bihar.
18. Interview with Indian tomato expert, 15 October 2013.
19. Interview with Indian tomato expert, 15 October 2013.
20. “Sustainable Agriculture for Increasing Efficiency of Tomato - Value Chain in Uttarakhand (India)”, Rohatash K. Bhardwaj, March 2011.
21. “Indian Horticulture database 2011”, National horticultural board, March 2011.
22. http://www.niir.org/profiles/profiles/tomato-products-tomato-juice-tomato-puree-tomato-ketchup-tomato-chutney-tomato-sauces-tomato-powder-tomato-ready-eat-products-tomato-paste-instant-tomato-soup-tomato-processing/z,,26,0,a/, accessed on 11 December 2013.
23. Interview with Indian tomato expert, 15 October 2013.
24. Losses data based on interviews and “Identification of Appropriate Postharvest Technologies for Improving Market Access and Incomes for Small Horticultural Farmers in Sub-Saharan Africa and South Asia”, World Food Logistics Organization report, March 2010.
25. On-field research conducted, November 2013.
26. On-field research conducted, November 2013; “Identification of Appropriate Postharvest Technologies for Improving Market Access and Incomes for Small Horticultural Farmers in Sub-Saharan Africa and South Asia”, World Food Logistics Organization, March 2010.
27. On-field research conducted, November 2013; “Identification of Appropriate Postharvest Technologies for Improving Market Access and Incomes for Small Horticultural Farmers in Sub-Saharan Africa and South Asia”, World Food Logistics Organization, March 2010.
28. On-field research conducted, November 2013; “Identification of Appropriate Postharvest Technologies for Improving Market Access and Incomes for Small Horticultural Farmers in Sub-Saharan Africa and South Asia”, World Food Logistics Organization, March 2010.
29. “Global food losses and food waste”, FAO, 2011.
30. Forbes article “Cultivating India, One tomato at a time”, published 1 November 2013.
31. http.//www.wbkllc.com/Tomato.profile.pdf, accessed in
October 2013.
32. Assumptions of tomato price 10.5 Rs/kg (2011 average), 20-kg capacity crates, 4% loss differential with other types of packaging, 2044 prices for packaging on http://www.wbkllc.com/Tomato.profile.pdf, accessed in October 2013.
33. http://www.wbkllc.com/Tomato_Profile.pdf, accessed in October 2013.
34. On-field research conducted, November 2013.
35. Hindu Business Line article “India seeks New Zealand’s help for developing cold storages” 3 September 2013.
36. Indian potato cold storage example is a summary of an article from the Economic times in India “How Agra became India's cold storage hub and what impact it has on the price of potatoes”, http://articles.economictimes.indiatimes.com/2012-08-12/news/33154080_1_cold-storage-potatoes-vegetable-prices accessed in November 2013 and published on 12 August 2012.
37. “How Agra became India's cold storage hub and what impact it has on the price of potatoes”, 12 August 2012.
38. Celestine, A., “How Agra became India's cold storage hub and what impact it has on the price of potatoes”. http://articles.economictimes.indiatimes.com/2012-08-12/news/33154080_1_cold-storage-potatoes-vegetable-prices/3, 12 August 2012.
39. Interview with Indian tomato expert, 15 October 2013.
40. “Identification of Appropriate Postharvest Technologies for Improving Market Access and Incomes for Small Horticultural Farmers in Sub-Saharan Africa and South Asia”, World Food Logistics Organization report, March 2010.
41. On-field research conducted, November 2013.
42. Interview with commercial tomato farmer, November 2013.
43. “WEF GAC Logistics Supply Chain Systems Outlook_2013” report, “Potential of Retail Logistics in India: A Perspective” article, July 2013.
44. http://www.mapsofindia.com/states/, accessed on 2 December 2013.
45. Interview with Indian large transporter, Regional sales manager, 1 November 2013.
46. http://www.mbaskool.com/business-articles/operations/5472-barriers-in-indian-food-supply-chain-management.html, accessed on 2 December 2013; Interview with Indian large transporter, Regional sales manager, 1 November 2013.
47. Interview with Indian large transporter, Regional sales manager, 1 November 2013.
48. Analysis done in 2011 for countries producing at least 1 million tons of tomatoes, percentage processing assessed against the GDP per capita. For population data, World Bank data; for GDP, Economist Intelligence unit data; for tomato production, FAOSTAT; for level of processing, World Processing Tomato Council.
49. http://www.niir.org/profiles/profiles/tomato-products-tomato-juice-tomato-puree-tomato-ketchup-tomato-chutney-tomato-sauces-tomato-powder-tomato-ready-eat-products-tomato-paste-instant-tomato-soup-tomato-processing/z,,26,0,a/, accessed on 11 December 2013.
50. Forbes article “Cultivating India, One tomato at a time”, published November 2013. For more information, see: http://www.hul.co.in/sustainable-living/casestudies/Casecategory/Tomato-Sourcing.aspx.
51. Interview with Indian tomato processor, 23 October 2013.
52. Interview with Indian tomato processor, 23 October 2013.
53. “Indian Horticulture database 2011”, National horticultural board, March 2011.
54. On-field research conducted, November 2013.
55. “Sustainable Agriculture for Increasing Efficiency of Tomato - Value Chain in Uttarakhand (India)”, Rohatash K. Bhardwaj, March 2011.
56. Forbes article “Cultivating India, One tomato at a time”, published 1 November 2013.
57. “Supply chain management in vegetable marketing: a comparative analysis”, table 4.7, Shilpa, K., July 2008.
58. World Economic Forum Global Agenda Council, Logistics Supply Chain Systems Outlook_2013 report; “Potential of Retail Logistics in India: A Perspective” article, July 2013.
59. On-field research conducted, November 2013.
60. Forbes article “Cultivating India, One tomato at a time”, published 1 November 2013.

33Enabling Trade: From Farm to Fork 33Enabling Trade: From Farm to Fork

Enabling Trade: From Farm to Fork34
Kenyan Avocados: Connecting to High-value Export Markets
1. Introduction
Kenya is frequently cited as a “bright spot” in African agriculture.1 Conducive government policy, strong donor support and private-sector leadership have helped to create success stories in exports to the EU; for example, French bean exports climbed from zero in the late 1980s2 to 19,000 tons by 20103. Policy changes supporting this growth include the liberalization of the fertilizer market. Following the removal of price controls and subsidies, increased competition led to lower fertilizer end-prices, triggering a 14 percentage-point increase in adoption rates among smallholders4. Today, agriculture amounts to half of Kenyan GDP and employs 75% of the Kenyan workforce5. Kenyan policy-makers and agribusiness players continue to prioritize the growth of agricultural exports, both in green beans and other cash crops like avocados.
Kenya is one of the world’s largest producers of avocados, with production of 110,000 tons in 2010.6 For comparison, the largest producer is Mexico with about 1 million tons produced annually.7 Local varieties dominate Kenyan production (about 70% of total), whereas Fuerte and Hass, the varieties suitable for export, make up approximately 20% and 10%, respectively.8 Most of the avocado farms are near Nairobi, where the export packaging factories are located.9
Of the total production, 20-25% is exported.10 Europe is the main destination, with 75% of exports in 2010.11 Kenya ranks as the sixth-largest exporter to Europe, with a 5-6% share of volume in 2010,12 and enjoys a competitive advantage versus Peru, its main competitor in Europe: the Kenyan Hass harvesting season extends later in the year than Peru’s, granting Kenya a window of opportunity.13
The focus of this case study is on the high-value, high-growth market of avocado exports to Europe. Kenyan avocados sell in Europe at roughly three times their domestic price, making the export opportunity extremely attractive.14
To prolong shelf life, Kenyan avocados are harvested while still green.Source: A.P. Moller-Maersk

35Enabling Trade: From Farm to Fork
2. Kenyan Avocado Export Supply Chain15
An estimated 70% of Kenyan avocados – even those for export – are produced on smallholder farms (Figure 26).16 When not linked to exporters through an out-grower scheme, farmers market their avocados through middlemen, either legally government-certified agents or unofficial brokers17. These middlemen typically harvest avocados themselves and organize transport to Nairobi packhouses.18 This initial leg of transport is usually done with small pickup trucks.19 Once at the factory, avocados are quality-checked, sorted, washed, waxed, pre-cooled and packed in cartons (Figure 27). Once packed, exporters stuff the cartons into refrigerated containers (“reefers”) outside the processing gate, and shipping companies then transport the reefers to the Mombasa port. There, the reefers, which are controlled-atmosphere-treated, are loaded onto a ship and later trans-shipped in Salalah, Oman. Finally, the reefer containers are unloaded in Europe and delivered to importers (see Figure 28 for an illustration of the overall value chain economics.).
Most often vertically integrated with exporters, packers procure and package a 4 kilogram (kg) carton of avocados at a cost of about US$ 4.10. An additional US$ 1.60/carton is required for shipping to Europe by sea in a reefer (Figure 28). With the import price fluctuating around US$ 7-8/carton, the supply chain overall is profitable.20
Figure 28: Kenyan Avocados Sell for a Healthy Margin in the EU, Freeing Up Resources for Investment2
Cost bar
2.50
2.00
1.50
1.00
0.50
0
2.06Peruviansellingpoint in EU
Avocado Europe CIF exporter cost bar(2013, in $/kg) (Estimates)
Kenyansellingpoint in EUExporter margin
Sea Shipping
Transport to port
Packaging
Producing
1.710.20
0.40
0.08
0.44
0.59
Note: (*) Procurement is estimated based on the local selling price of avocados in Kenya
Source: Interviews
Figure 26: Kenyan Smallholder Avocado Farmers Typically Use Manual Harvestng
Figure 27: Avocados Are Packed in Nairobi before Export
Source: A.P. Moller-Maersk
Source: A.P. Moller-Maersk

Enabling Trade: From Farm to Fork36
This situation was enabled by government-led infrastructure investments, followed by private-sector investment in reefers, which helped to reduce transport costs versus expensive air shipments. Once this tipping point of profitability was reached, investments started to naturally flow into the sector.
3. Impacts of Supply Chain Barriers and Potential Solutions
Successful initiatives to overcome supply chain barriers are presented, as well as some remaining opportunities to overcome challenges to future growth.
Transport and Communications Infrastructure
Corridor infrastructure investments benefit multiple value chains.
Mombasa is the pivotal port for East African countries and is accessed via the main corridor, the Nairobi-Mombasa highway. By the early 1990s, the quality of this road had deteriorated due to high traffic. The Kenyan government, with the help of the World Bank and the EU, decided to invest in rehabilitating the highway.22
Investments were made over approximately a decade, ending in 2005. Travel time from Nairobi to Mombasa was reduced by 40%, from 12 to 7-8 hours, and costs decreased as well.23 Typically, road rehabilitation projects in East Africa drive operational cost reductions of 15%.24 Although this saving has a marginal impact on the Kenyan avocado industry – less than 1%25 of the European end price – the incremental benefit is applied to many different value chains. The overall benefit for Kenya and Kenyan agricultural export value chains is thereby important.
Introduction of reefer container technology has made Europe accessible for Kenyan avocados.
One of the major challenges previously faced by this industry was the lack of suitable transport equipment. If not cooled, avocados ripen faster than the time it takes to ship them to Europe.26 Exports to Europe, therefore, were only possible through expensive air shipments. Alternatively, transporting by sea was only feasible for the more proximate Middle East,27 where avoca-dos sell for much less than in Europe.
Recognizing this opportunity, exporters first engaged temperature-controlled, break-bulk vessels to replace expensive air freight.28 They then approached A.P. Moller-
Figure 29: After Pre-cooling, Reefer Containers Are Packed Next to the Packing Facilities
Figure 30: Avocados Are Transported from Farmer to Packhouse in Pickup Trucks
Source: A.P. Moller-Maersk
Source: A.P. Moller-Maersk

37Enabling Trade: From Farm to Fork
Maersk to present the business case for refrigerated container transport. Shipping companies consider a number of factors when evaluating a value chain for reefer investment. Most importantly, they look at the economics and growth potential of the value chain. In this case, if Kenyan avoca-dos were able to be sold profitably when transported by air, there was a clear case for investment in sea freight, provided quality could be maintained during the journey. In addition, key enablers must be in place to ensure sustainable operations.29 Fortunately, the Kenyan government had invested in the Mombasa port and was able to provide the necessary infrastructure (e.g. specific plugs, berth capacity) to support reefers. Continuous investments are being made to accompany the growth of reefers in the Mombasa port, including a new berth to open this year.30
Early packing of containers ensures an uninterrupted cold chain.
When dealing with perishable produce, maintaining an uninterrupted cold chain is critical for food quality and safety.31 When reefers were first introduced, exporters preferred to transport avocados to Mombasa in regular trucks and pack the reefers at the port. Over time, exporters realized that they could command a price premium in EU markets if a cold chain was begun as close to the farm as possible. This price premium outweighed the costs of bringing an empty reefer to Nairobi and loading it at the packhouse gate. This extended cold-chain-arrange-ment also simplified logistics by eliminat-ing one touchpoint at the port, and is now common practice32 (Figure 29).
The use of open-truck transport from farmers to packhouse results in sun damage.
Transporting avocados from the farm to the packhouse is often done using small, open trucks (Figure 30). This transport mode triggers approximately 5% food loss, mainly due to sun exposure on the top layer of fruit, but also due to spillage.33
When sourcing directly from farmers, exporters have introduced covered trucks for this leg of the transport route. This investment can be recovered quickly, given avocados’ high value and the gains from eliminating losses.34 An investment of about US$ 10,000 in a covered truck can be paid back in approximately 20-25 trips35 (Figure 31). However, scaling this intervention to the broader market faces two issues. First, for the investment to be paid back quickly, the truck must make frequent filled trips, which does not always occur due to the atomized
Kenyan smallholder model. This challenge could be addressed by exporters introduc-ing shaded collection points.36 Second, access to finance is a common challenge for actors in agricultural value chains, making the upfront investment required for a covered truck difficult from a cash-flow perspective. Here, farmers could form cooperatives to pool resources, and governments or donors could provide guarantees or loans. A long-term solution is to develop commercial farming, where scale and access to resources facilitate such investments.
Figure 31: With Sufficient Volumes, Investment in Covered Trucks Is Rapidly Paid Back
Number of trips0 5 10 15 20 25
Cumulative savings of operating acovered vs. open truck by number of trips*(2013, in $/ton) (Illustrative)
12,500
10,000
7,500
5,000
2,500
0
US$ 10,000 investmentpaid back in about 20-25trips*
Note: (*) For a 5-ton truck capacity, assumption made of saving 5% of food losses at European prices of 1.70 US$/kg
Sources: Bain & Company analysis; interviews
Trans-shipment in Salalah is unreliable and leads to quality issues.
In addition to overland transport chal-lenges, Kenyan exporters face a strong competitive disadvantage versus export-ers in Peru and South Africa due to trans-shipping at the Salalah port in Oman37 (Figure 32). Peruvian and South African avocados are shipped directly to Europe.38 Ships from Kenya, however, have to steer wide of the Somalian coast for piracy reasons39, making the trip longer and more expensive due to insurance coverage. Moreover, vessels sometimes miss the trans-shipment in Oman and must wait for a week in Salalah’s port40. While specific data on the frequency of this issue is difficult to obtain, both exporters and importers indicate it has a significant impact on operations. Another contributing factor is that the peak period for Kenyan avocados occurs during the Khareef, or monsoon season, in Oman; the severe weather significantly affects operational efficiency at Salalah’s port.41
Figure 32 Avocados Are Trans-shipped in Oman
Arrival in Antwerp (Belgium)in 25-40 days
Need to go wide of theSomalian coasts due topiracy issues
Departure from Mombasaport
Trans-shipment in Salalah(Oman)
Sources: Bain & Company analysis; interviews
When trans-shipment is missed, importers must either maintain additional inventory or default on customer commitments. Relationships are thus damaged, and Kenyan avocados as a whole are seen as a less reliable product. In addition to the reliability issue, avocados can become overripe from delay, driving both quantita-tive and qualitative losses.42 Qualitatively, overripe avocados suffer from price discounts, meaning exporters lose revenue on a per-avocado basis. Quantitatively, avo-cados lose physical weight over time. In practical terms, the decrease in weight creates the need to repackage cartons at arrival. Traded in 4 kg cartons, avocados are often overpacked in Mombasa (to around 4.4 kg when leaving Kenya) in anticipation of weight loss during transport. With a normal journey of around 25 days (Figure 33), the cartons arrive weighing above 4 kg. If the cartons miss the trans-shipment in Oman, they risk weighing less than the required 4 kg; thus the need to repack the avocados to comply with the 4 kg standard. Repackaging triggers a loss of value because importers charge exporters a US$ 2,700 fee per reefer for this additional handling.

Enabling Trade: From Farm to Fork38
Market Access
A number of market access barriers can restrict the movement of agricultural goods (Box 1). In the case of Kenyan avocados, the biggest barriers are the challenges of attaining consistent compliance with quality requirements of European customers.
Box 1: Market access in agriculture
Many non-tariff barriers can restrict the movement of agricultural goods, including sanitary and phytosanitary standards (SPS), technical barriers to trade (TBT), export and import bans, variable import tariffs and quotas, restrictive rules of origin, and price controls. Lack of open borders contributes to price volatility, drives food loss, and creates unpredictable environments that reduce the private sector’s willingness to invest.43
For example, sanitary and phytosanitary standards (SPS), are intended to protect human, animal, or plant life or health. However, according to the WTO, “a sanitary or phytosanitary restriction which is not actually required for health reasons can be a very effective protectionist device, and because of its technical complexity, a particularly deceptive and difficult barrier to challenge.”44 Furthermore, information about newly
imposed SPS requirements is not always clearly communicated, or exporters lack access to the information. As a result, ~0.85% of agricultural products are rejected at import borders, equating to an annual product value of approximately $4 billion in 2000-01.45
Governments have a primary responsibility to ensure that their own policies impacting market access are harmonized, scientifically justifiable, and predictable. They also have a central role to play in helping domestic producers and exporters successfully navigate market access barriers.
Overall, farmers lack a clear understanding of optimal harvesting techniques (e.g. the effect of picking timing on avocado size, pest management).46 The resulting practices trigger losses for exports, especially at the processing gate during the quality check performed by packers (details on food loss across the value chain are covered in the Box 2 and Figure 34). Although redirected to local markets, rejections are around 10% during the peak summer season,47 even if they vary during the year.
Box 2: Food Loss in the Kenyan Avocado Value Chain
Note: Food loss figures are estimates only and based on a limited number of primary interviews with various actors along the value chain.
Although functioning and suitable for exports to Europe, the Kenyan avocado supply chain – as it is structured today – still suffers from around 15% food loss at the different stages of the avocado journey from farm to importer (Figure 34).
Harvesting: Current manual harvesting techniques, still widely used among smallholder farmers, generate about 7% in avocado losses due to fruit damage from falling on the ground, poor handling and loading on pickup trucks.
Transport: Since pickup trucks are open vehicles, the first layers of avocados are exposed to the sun and must be discarded as they become overripe, even to the point when they cannot be redirected to domestic markets. Moreover, avocados can fall off trucks due to bumpy roads between farmers and packers in Nairobi. This step of the supply chain causes about 5-6% in avocado losses.
Packaging: Once at the packaging gates, avocados are quality checked. Harvesting techniques are not always well suited to exports (e.g. the picking timing for avocado size), due to lack of training on European standards. This stage gener-ates many rejections, but rejected avocados are redirected to domestic value chains. During the peak season, it is estimated that around 10% of avocados are rejected at the packhouse gate due to small size.
Sea shipment: Shipment to Europe is a critical and risky step in the supply chain regarding food losses. The losses are binary. If vessels arrive on time, losses are essentially zero due to reefer technology; however, if a container misses trans-shipment in Oman, a delay of one week can occur and, as a result, the avocados become overripe during transport. These avocados are not completely discarded, but significant weight loss occurs. Although it is difficult to quantify the frequency of missed trans-shipments, importers claim that these situations drive avocado losses of about 1-5%.
Figure 33: Avocados Arrive in Rotterdam after a 20- to 45-Day Sea Voyage
Source: A.P. Moller-Maersk

39Enabling Trade: From Farm to Fork
At the other end of the value chain, quality issues mainly stem from “briefcase export-ers” who sell avocado containers on the spot, usually with no long-term contracts. These small exporters significantly affect the reputation of Kenyan origin, as most of their shipments are of lower quality and consist-ing of poorly sorted avocados that are difficult to sell in Europe.48 Importers purchasing Kenyan avocados struggle to predict the level of quality they will receive, creating a climate of mistrust. As a result of this and other factors, Kenyan avocados sell at a 15-20% discount to Peruvian avocados in European markets.49
Business Environment
One structural improvement to the value chain that would mitigate the impacts from a number of barriers is large-scale farming. The development of such farms offers many benefits: lower losses during harvesting and quality checks, profitable investment in covered trucks and improved long-term relationships with importers. Kakuzi Farms, a vertically integrated, large-scale Kenyan avocado farm/packer/exporter, generated on average 18% earnings before interest and tax (EBIT) in the avocado segment over the last three years,50 compared to the industry average of about 10-15%.51 Government should provide the enablers, where feasible, for replicating this success story, for instance by facilitating access to finance and land ownership while integrating high-potential smallholders.
Border Administration
Kenya is implementing a redesigned border management system to reduce costs and delays (see the case study in the report’s “Enabling Smart Borders” section for more details).
4. Conclusion and Next Steps for Industry Stakeholders
The Kenyan avocado value chain has passed the tipping point of profitability and is now functioning well. However, some challenges are slowing the virtuous circle of investments in this industry. Two main priorities or initiatives for the Kenyan supply chain have emerged (Figure 35). The first – mitigating the impact of unofficial exporters – could be considered a quick win due to the relatively high ease of implementation. The second initiative – mitigating missed trans-shipment in Oman – is a longer-term opportunity with high value at stake but more challenging implementation requirements.
Quick win: mitigate the situation concerning “briefcase exporters”
European importers and Kenyan exporters agree that unofficial exporters have a negative effect on the reputation and pricing of the overall Kenyan origin.49 To begin with, the industry could benefit from an organization established to develop and promote Kenyan avocados. The organization could be composed of the Horticultural Crop Development Authority, an exporters’ association (potentially created as a division of the Fresh Produce Exporters Association in Kenya), shipping companies and customs authorities (KenTrade).
Domesticmarket
Exports
N/A*
Harvesting
Packaging Sea shipment
to Europe Distribution ConsumptionTransport 13-18%
Rej
ecte
d a
voca
dos
are
red
irect
ed t
o lo
cal m
arke
ts
Total
Distribution ConsumptionTransport
Total
Transport to port
Manual harvesting(e.g. avocados fallingon the ground)
~7% loss
Avocados falling overFirst layers ofavocados sun-exposed
~5~6% loss Overripe avocadosAvocados losing weight
Limited
~10% rejectionsQuality check forEuropean standards
~1~5% loss
Figure 34: Food Loss in Kenyan Avocado Value Chains (Estimates)
Source: Interviews

Enabling Trade: From Farm to Fork40
Using this organization as a platform, a next step would be to further understand and quantify the issue, including an assessment of root causes through primary data gathering and interviewing key stakehold-ers (including importers). The findings could help drive a brainstorming session for developing potential solutions, along with a preliminary assessment of value, ease of implementation and risks.
As a short-term initiative, exporters could create a consortium of high-quality growers and define common standards. This could include an advertising budget to communicate on the Kenyan “brand”, as well as specific packaging or labels. Importers could potentially have access to an online database for checking exporter compliance with the brand’s standards. In the long term, possible initiatives include investing in more traceability, monitoring and testing resources.
Longer-term opportunity: mitigate the trans-shipment risk in Oman
In the short- or medium-term future, direct routes from Mombasa to Europe are not feasible because volumes are far from sufficient.53 Consequently, the risk of missing trans-shipment can only be mitigated through improved processes and coordination between key stakeholders. The root cause of missed trans-shipments could not be pinpointed by any actor along the value chain. To determine the cause, solutions must begin with additional investigation.
Without the benefit of that analysis, however, a few potential solutions can already be suggested. Concerned shipping companies, as well as Mombasa and Salalah port operators, could better coordinate with each other when the risk of missing trans-shipment is high. The Kenyan government could continue to invest in the Mombasa port to increase capacity and improve processes, in order to better manage vessels and avoid delays. Shipping companies could better communicate the time sensitivity of their vessels’ merchandise to Salalah port authorities. Finally, prioritization of loading and unloading could be done jointly to create fast-track processes for containers.
Endnotes1. “Growing Africa: Unlocking the Potential of Agribusiness.” The
World Bank, January 2013.
2. “Are Horticultural Exports a Replicable Success Story? Evidence from Kenya and Côte d’Ivoire”, p.16, IFPRI, August 2004.
3. “The Bean value Chain in Kenya”, executive summary, SNV, August 2012.
4. “Unlocking the potential of agribusiness” p.110, the World Bank, January 2013.
5. “Kenya Fact sheet”, Feed the Future, January 2013.
6. “2010 Horticultural Crops Production Report”, Horticultural Crops Development Authority (HCDA).
7. FruiTrop 2011 avocado report, p.13, Eric Imbert, September 2011.
8. “National avocado Business Plan”, p.27, Richard Isiaho, August 2012.
9. Interview with Kenyan avocado exporter, 2013.
10. Interview with Kenyan avocado exporter, 2013.
11. “2010 Horticultural Crops Production Report”, Horticultural Crops Development Authority (HCDA).
12. “FruiTrop statistical yearbook supplement Avocado”, FruiTrop No. 202, July-August 2012.
13. “Avocado market in the European Union”, p.11, Queensland government, 2009.
14. Interview with Kenyan Sales representative for APM Maersk, 2013.
15. “Impacts of the KBDS and KHDP Projects in the Tree Fruit VC of Kenya”, p.19, USAID, September 2008.
16. Interview with Kenyan avocado exporter, 2013.
17. Interview with association of exporters, October 2013.
18. Interview with Kenyan avocado exporter, October 2013.
19. Interview with Kenyan Sales representative for APM Maersk, 2013.
20. Interview with Kenyan avocado exporter, 2013.
21. Interview with Kenyan avocado exporter, 2013.
22. “Nairobi Mombasa road rehabilitation project”, The World Bank, February 2005.
23. http://www-wds.worldbank.org/servlet/WDSContentServer/WDSP/IB/2005/02/10/000090341_20050210092537/Rendered/PDF/31525.pdf.
24. “Transport Prices and costs in Africa: A review of the main international corridors”, table 9.2, p.109, AICD, July 2008.
25. “Transport Prices and costs in Africa: A review of the main international corridors”, table 4.2, p.56, AICD, July 2008.
26. Interview with Kenyan avocado exporter, 2013.
27. Interview with Kenyan avocado exporter, 2013.
28. Interview with Regional General manager – Reefer business development for APM Maersk, October 2013.
29. Main criteria come from interviews with Kenyan avocado importers and APM Maersk representatives.
30. Article from business daily “New berth to ease congestion at Mombasa port”, published on 26 August 2013, available on http://www.businessdailyafrica.com/New-berth-to-ease-congestion-at-Mombasa-port/-/539546/1968490/-/n02kh3/-/index.html, accessed on 26 November 2013.
31. “Containers vs. Break bulk – when quality matters”, available on http://www.maersklinereefer.com/expert-panel/raul-saca/containers-vs-break-bulk-when-quality-matters, accessed on 26 November 2013.
32. Interview with Kenyan Sales representative for APM Maersk, 2013.
33. Interview with Kenyan Sales representative for APM Maersk, 2013.
34. Interview with association of exporters, October 2013.
35. Based on a Kenyan avocado price of ~5€/4 kg carton, 5% losses per trip and 5-ton average truck capacity.
36. “National avocado Business Plan”, p.19, Richard Isiaho, August 2012.
37. Interview with Kenyan avocado exporter, October 2013.
38. Interview with Kenyan avocado importers, October 2013.
initiatives Food loss Value at stakeEase of
implementation*
Enable use of covered trucks through consolidated collection points to protect avocados from sun exposure
Promote avocados of Kenyan origin
Develop commercial farms to ensure quality for importers and reduce losses during harvest and quality checks
Mitigate missed Salalah trans-shipping risks
Improve avocado traceability and export monitoring to mitigate “briefcase exporters” effect
Figure 35: Potential Initiatives to Reduce Avocado Supply Chain Barriers
Note: (*) Ease of implementation is assessed based on the number of stakeholders, nature of stakeholders, time for implementation, investment required, need to adapt/change the legal framework and contentiousness of reform.
Sources: Bain & Company analysis; interviews
Logi
stic
alR
egul
ator
y
Long-term priority: High value; low ease of implementation
Quick win: Medium to high value; high ease of implementation
Low to high impact
Low to high feasibility

41Enabling Trade: From Farm to Fork
39. Fresh fruit portal article “Kenyan avocados struggle under pressure from Peru”, available on http://www.freshfruitportal.com/2013/07/15/kenyan-avocados-struggle-under-pressure-from-peru/?country=france, accessed on 29 September 2013.
40. Interview with Kenyan avocado exporter, October 2013.
41. Interview with Salalah Port statistics supervisor, November 2013.
42. Following paragraph comes from an interview with a Kenyan avocado exporter.
43. “Africa can help feed Africa,” World Bank, October 2012
44. “Understanding the WTO Agreement on Sanitary and Phytosanitary Measures” WTO, May 1998. http://www.wto.org/english/tratop_e/sps_e/spsund_e.htm. Accessed November 2013.
45. Jaffee, Steven and Spencer Henson. “Standards and Agro-Food Exports from Developing Countries: Rebalancing the Debate.” June 2004. World Bank. Pg 21.
46. Interview with Kenyan avocado exporter, October 2013.
47. Interview with Kenyan Sales representative for APM Maersk, 2013.
48. Interview with Kenyan avocado importers, October 2013.
49. Interview with Kenyan avocado exporter, October 2013.
50. Kakuzi financials http://www.kakuzi.co.ke/investor-relations/regulatory-news, accessed in November 2013.
51. Interview with Kenyan avocado exporter, October 2013.
52. Interviews with Kenyan avocado exporters and importers.
53. Interview with Kenyan Sales representative for APM Maersk, 2013.
41Enabling Trade: From Farm to Fork
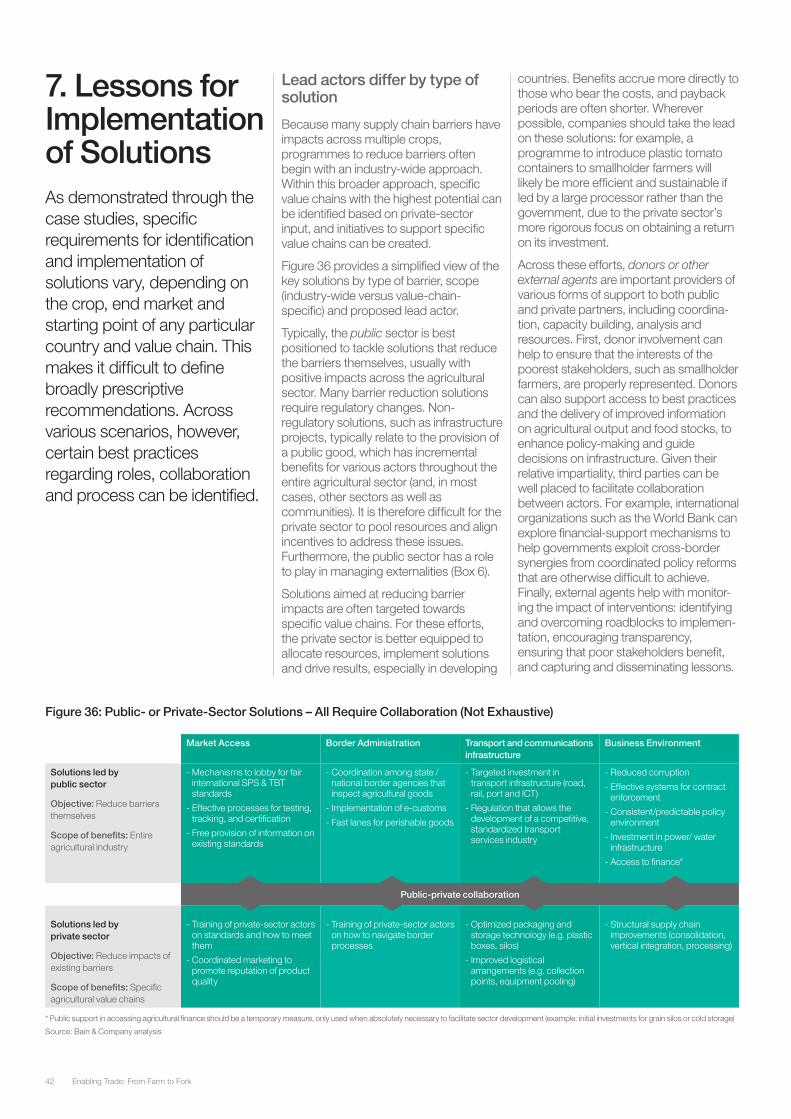
Enabling Trade: From Farm to Fork42
7. Lessons for Implementation of SolutionsAs demonstrated through the case studies, specific requirements for identification and implementation of solutions vary, depending on the crop, end market and starting point of any particular country and value chain. This makes it difficult to define broadly prescriptive recommendations. Across various scenarios, however, certain best practices regarding roles, collaboration and process can be identified.
Lead actors differ by type of solution
Because many supply chain barriers have impacts across multiple crops, programmes to reduce barriers often begin with an industry-wide approach. Within this broader approach, specific value chains with the highest potential can be identified based on private-sector input, and initiatives to support specific value chains can be created.
Figure 36 provides a simplified view of the key solutions by type of barrier, scope (industry-wide versus value-chain-specific) and proposed lead actor.
Typically, the public sector is best positioned to tackle solutions that reduce the barriers themselves, usually with positive impacts across the agricultural sector. Many barrier reduction solutions require regulatory changes. Non-regulatory solutions, such as infrastructure projects, typically relate to the provision of a public good, which has incremental benefits for various actors throughout the entire agricultural sector (and, in most cases, other sectors as well as communities). It is therefore difficult for the private sector to pool resources and align incentives to address these issues. Furthermore, the public sector has a role to play in managing externalities (Box 6).
Solutions aimed at reducing barrier impacts are often targeted towards specific value chains. For these efforts, the private sector is better equipped to allocate resources, implement solutions and drive results, especially in developing
countries. Benefits accrue more directly to those who bear the costs, and payback periods are often shorter. Wherever possible, companies should take the lead on these solutions: for example, a programme to introduce plastic tomato containers to smallholder farmers will likely be more efficient and sustainable if led by a large processor rather than the government, due to the private sector’s more rigorous focus on obtaining a return on its investment.
Across these efforts, donors or other external agents are important providers of various forms of support to both public and private partners, including coordina-tion, capacity building, analysis and resources. First, donor involvement can help to ensure that the interests of the poorest stakeholders, such as smallholder farmers, are properly represented. Donors can also support access to best practices and the delivery of improved information on agricultural output and food stocks, to enhance policy-making and guide decisions on infrastructure. Given their relative impartiality, third parties can be well placed to facilitate collaboration between actors. For example, international organizations such as the World Bank can explore financial-support mechanisms to help governments exploit cross-border synergies from coordinated policy reforms that are otherwise difficult to achieve. Finally, external agents help with monitor-ing the impact of interventions: identifying and overcoming roadblocks to implemen-tation, encouraging transparency, ensuring that poor stakeholders benefit, and capturing and disseminating lessons.
Market Access Border Administration Transport and communications infrastructure
Business Environment
Solutions led by public sector
Objective: Reduce barriers themselves
Scope of benefits: Entire agricultural industry
- Mechanisms to lobby for fair international SPS & TBT standards
- Effective processes for testing, tracking, and certification
- Free provision of information on existing standards
- Coordination among state / national border agencies that inspect agricultural goods
- Implementation of e-customs
- Fast lanes for perishable goods
- Targeted investment in transport infrastructure (road, rail, port and ICT)
- Regulation that allows the development of a competitive, standardized transport services industry
- Reduced corruption
- Effective systems for contract enforcement
- Consistent/predictable policy environment
- Investment in power/ water infrastructure
- Access to finance*
Public-private collaboration
Solutions led by private sector
Objective: Reduce impacts of existing barriers
Scope of benefits: Specific agricultural value chains
- Training of private-sector actors on standards and how to meet them
- Coordinated marketing to promote reputation of product quality
- Training of private-sector actors on how to navigate border processes
- Optimized packaging and storage technology (e.g. plastic boxes, silos)
- Improved logistical arrangements (e.g. collection points, equipment pooling)
- Structural supply chain improvements (consolidation, vertical integration, processing)
Figure 36: Public- or Private-Sector Solutions – All Require Collaboration (Not Exhaustive)
* Public support in accessing agricultural finance should be a temporary measure, only used when absolutely necessary to facilitate sector development (example: initial investments for grain silos or cold storage)
Source: Bain & Company analysis
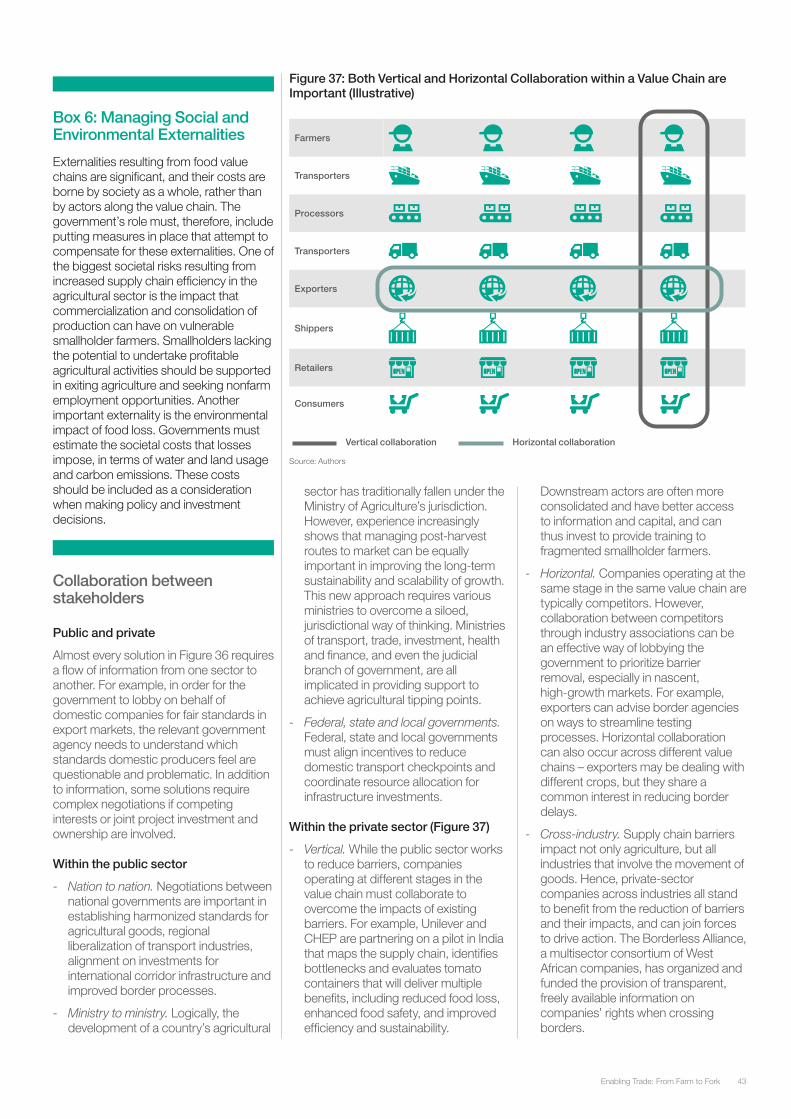
43Enabling Trade: From Farm to Fork
Box 6: Managing Social and Environmental Externalities
Externalities resulting from food value chains are significant, and their costs are borne by society as a whole, rather than by actors along the value chain. The government’s role must, therefore, include putting measures in place that attempt to compensate for these externalities. One of the biggest societal risks resulting from increased supply chain efficiency in the agricultural sector is the impact that commercialization and consolidation of production can have on vulnerable smallholder farmers. Smallholders lacking the potential to undertake profitable agricultural activities should be supported in exiting agriculture and seeking nonfarm employment opportunities. Another important externality is the environmental impact of food loss. Governments must estimate the societal costs that losses impose, in terms of water and land usage and carbon emissions. These costs should be included as a consideration when making policy and investment decisions.
Collaboration between stakeholders
Public and private
Almost every solution in Figure 36 requires a flow of information from one sector to another. For example, in order for the government to lobby on behalf of domestic companies for fair standards in export markets, the relevant government agency needs to understand which standards domestic producers feel are questionable and problematic. In addition to information, some solutions require complex negotiations if competing interests or joint project investment and ownership are involved.
Within the public sector
- Nation to nation. Negotiations between national governments are important in establishing harmonized standards for agricultural goods, regional liberalization of transport industries, alignment on investments for international corridor infrastructure and improved border processes.
- Ministry to ministry. Logically, the development of a country’s agricultural
sector has traditionally fallen under the Ministry of Agriculture’s jurisdiction. However, experience increasingly shows that managing post-harvest routes to market can be equally important in improving the long-term sustainability and scalability of growth. This new approach requires various ministries to overcome a siloed, jurisdictional way of thinking. Ministries of transport, trade, investment, health and finance, and even the judicial branch of government, are all implicated in providing support to achieve agricultural tipping points.
- Federal, state and local governments. Federal, state and local governments must align incentives to reduce domestic transport checkpoints and coordinate resource allocation for infrastructure investments.
Within the private sector (Figure 37)
- Vertical. While the public sector works to reduce barriers, companies operating at different stages in the value chain must collaborate to overcome the impacts of existing barriers. For example, Unilever and CHEP are partnering on a pilot in India that maps the supply chain, identifies bottlenecks and evaluates tomato containers that will deliver multiple benefits, including reduced food loss, enhanced food safety, and improved efficiency and sustainability.
Downstream actors are often more consolidated and have better access to information and capital, and can thus invest to provide training to fragmented smallholder farmers.
- Horizontal. Companies operating at the same stage in the same value chain are typically competitors. However, collaboration between competitors through industry associations can be an effective way of lobbying the government to prioritize barrier removal, especially in nascent, high-growth markets. For example, exporters can advise border agencies on ways to streamline testing processes. Horizontal collaboration can also occur across different value chains – exporters may be dealing with different crops, but they share a common interest in reducing border delays.
- Cross-industry. Supply chain barriers impact not only agriculture, but all industries that involve the movement of goods. Hence, private-sector companies across industries all stand to benefit from the reduction of barriers and their impacts, and can join forces to drive action. The Borderless Alliance, a multisector consortium of West African companies, has organized and funded the provision of transparent, freely available information on companies’ rights when crossing borders.
Farmers
Transporters
Processors
Transporters
Exporters
Shippers
Retailers
Consumers
Figure 37: Both Vertical and Horizontal Collaboration within a Value Chain are Important (Illustrative)
Vertical collaboration Horizontal collaboration
Source: Authors

Enabling Trade: From Farm to Fork44
Structured process to drive action
The process proposed in this section could be applied during implementation at a variety of levels and stages – either at the sector or the value-chain level (Figure 38).
1. Prepare
Establish governance structures and sources of funding. Establishing a core group of representatives is important to drive progress in an inclusive way. A new structure can be formed, or existing structures may be leveraged. For example, the Forum’s New Vision for Agriculture initiative and Grow Africa partnership have achieved great success in accelerating investments in agriculture through public-private partnerships. These platforms could be expanded to include stakeholders from the supply chain and transport community, as well as government representatives from ministries of trade and transport.
Resources are required to support a core team that will coordinate actors, conduct analyses and manage communications. Donors and third-party consultants can play a role as part of this team.
Identify priority corridors and value chains. To facilitate focused use of resourc-es for achieving tipping points, stakeholders should be aligned on trade routes and crops with the highest potential. The types of questions that can be explored include:
- Which crops are best suited to the country’s climate, and in which regions?
- Are there structural barriers-to-entry prohibiting long-term competitiveness?
- Will production be targeted towards the domestic market or export markets? Which export markets?
- Does the country have greater potential to be competitive in fresh or processed goods?
- Along which trade routes do the highest volumes of these products move?
- How profitable are actors in existing value chains, or how far from profitability are they?
- What existing initiatives can be leveraged?
- Which anchor companies are willing to provide initial investments to generate momentum along the corridor?
Based on the answers to these questions, stakeholders should align on strategic objectives for the project.
1. Prepare 2. Diagnose 3. Plan 4. Mobilize
- Establish governance structures and sources of funding
- Identify priority corridors and value chains
- Map supply chains
- Gather public- and private-sector input on impact of barriers
- Measure and benchmark supply chain performance
- Co-create list of initiatives
- Conduct cost/ benefit analyses
- Phase initiatives into an integrative roadmap
- Convert roadmap into an actionable implementation plan
0. Communicate - Manage open channels for input and provision of information
Figure 38: Proposed Process for Supply-Chain-Barrier Reduction
Source: Authors
Scoring
1 2 3
Easy Difficult
Number of stakeholders - Limited number of stakeholders to engage
- High number of stakeholders to engage (10 or more)
Nature of stakeholders - Limited complexity level of stakeholders (e.g. public companies)
- High complexity level of stakeholders (e.g. governments)
Time for implementation
- Implementation can be done in a few months
- Implementation will require several years
Investment required - CAPEX/resources required estimated in US$ million
- CAPEX/resources required estimated in US$ billion
Need to adapt/change legal framework
- No/limited need to adapt legal framework of countries involved
- Important change in legal framework of countries involved
Contentiousness of reform
- Limited reluctance to change given stakeholder’s interests
- High reluctance to change given stakeholder’s interests
Figure 40: Criteria for Ease of Implementation of a Supply-Chain-Barrier Reduction Initiative
Source: Authors
Figure 39: USAID/NEXTT’s Time and Cost Benchmarking Exercise along the LAKAJI Corridor
Source: United States Agency for International Development (USAID)/Nigeria Expanded Trade and Transport (NEXTT)
Chicago
Newark Lagos
Jibiya OuagadougouBurkina Faso
TemaGhana
IMP
OR
TS
United States Nigeria Burkina Faso - Ghana
5 days$ 1,958 USD
3 days$ 1,583 USD
19.5 days$ 4,737 USD
12.5 days$ 3,041 USD
7-14 days$ 1,958 USD
4-5 days$ 2,451 USD
EX
PO
RT
S

45Enabling Trade: From Farm to Fork
2. Diagnose
Map supply chains. The flow of goods along these high-priority trade corridors or value chains should then be mapped, from inputs to cultivation, through distribution and consumption. It is important to identify all relevant stakeholders that are active along the chain, and to understand their roles.
Gather public-and private-sector input on the impact of barriers. Interviews, workshops and focus groups can help generate a first hypothesis on supply-chain pain points. The views of members of each key stakeholder group identified during the mapping phase should be taken into consideration. Quantitative cost data from actors operating along the route can be helpful in informing the benchmarking exercise.
Measure and benchmark supply chain performance. To thoroughly assess the impact of barriers, three types of data should be gathered through field research: costs, time and food loss. By travelling along a corridor with shipments of agricul-tural goods, a research team can measure the costs (both official and unofficial) and time required for each step, which can then be compared against benchmarks (see Nigerian example in Figure 39). Input from interviews should guide this research; for example, if transporters indicate that conditions vary dramatically between day and night, or between different seasons, these variations should also be measured. Average time per step is a helpful indicator of performance, but variations in time can increase food loss, reduce processing capacity utilization and drive additional inventory costs.
Measuring food loss within the priority value chains is another important part of the process. Food loss can occur not only during transport, but also during harvesting, processing and packaging. Defining the scope of the measurement exercise is thus important.
Measurement is not straightforward; loss can be measured in calories, nutritional value, weight or economic value. To address these challenges, the World Resources Institute is designing a Global Food Loss and Waste Protocol. Lack of available data on food loss means that benchmarking may have to be done through field visits to best-practice countries. As part of their research for the Indian tomatoes case study, Unilever visited suppliers in Spain and the US to measure loss levels and learn about best practices that could be applied in the Indian context.
3. Plan
Co-create a list of initiatives. For each barrier identified during the diagnostic phase, the core team can then define a long list of potential actions for reducing costs. This list should form the basis of an integrative discussion among stakeholders. This session is useful to generate additional ideas, eliminate unfeasible ones and begin to assess what would be required for implementation.
Conduct cost/benefit analyses. A critical analysis of the resulting list of initiatives is vital to ensuring that resources are allocated where they will have the biggest impact. A cost-benefit analysis is imperative, with a view to achieving a minimum rate of return on capital invested. Key factors for prioritiz-ing initiatives should be their potential value and the ease of implementation, with the latter depending on a variety of factors. Figure 40 presents an example of criteria that could be considered.
Prioritize and phase initiatives into an integrative roadmap. Action plans can be structured so that different pieces can be presented to sources of outside funding. For example, the public sector could provide the initial investment in cold storage, while a private company could assume ownership of operations.
4. Mobilize
Convert roadmap into an actionable plan. For each initiative, clear owners from various stakeholder groups should take responsibility; moreover, subowners should be assigned, milestones set and transparent mechanisms to track progress put in place. Potential key performance indicators include transport time, cost, trade volumes, food loss and land use around corridors. Risks should also be identified at this stage, and mitigation measures incorporated into the plan.
Through coordinated action, leaders from various communities can share their expertise and resources to reduce supply chain barriers in agriculture, triggering increased economic efficiency and a virtuous cycle of investment. In the long term, this type of development will contribute to higher incomes along the value chain, improved food security and increased environmental sustainability.

World Economic Forum91-93 route de la CapiteCH-1223 Cologny/GenevaSwitzerland
Tel +41 (0) 22 869 1212Fax +41 (0) 22 786 2744
The World Economic Forum is an independent international organization committed to improving the state of the world by engaging business, political, academic and other leaders of society to shape global, regional and industry agendas.
Incorporated as a not-for-profit foundation in 1971 and headquartered in Geneva, Switzerland, the Forum is tied to no political, partisan or national interests

Enabling Trade: Enabling Automotive Trade
January 2014
In collaboration with Bain & Company
Published by World Economic Forum, Geneva, Switzerland, 2014All rights reserved. No part of this publication may be reproduced, stored in a retrieval system, or transmitted, in any form or by any means, electronic, mechanical, photocopying, or otherwise without the prior permission of the World Economic Forum.
World Economic Forum91-93 route de la CapiteCH-1223 Cologny/GenevaSwitzerlandTel.: +41 (0) 22 869 1212Fax: +41 (0) 22 786 [email protected]
The Context of Enabling Trade: From Valuation to Action
The World Economic Forum’s Enabling Trade initiative works to reduce practical barriers to trade. The initiative’s 2013 report, Enabling Trade: Valuing Growth Opportunities, indicated that reducing supply chain barriers could increase the world’s gross domestic product (GDP) by over US$ 2.5 trillion. Building on the momentum of this finding, the 2014 report looks at how to accelerate reform. It concentrates on sectoral, regional and functional areas where the positive impacts of supply chain facilitation could be greatest, or where momentum for change is building. The four sections comprising the report are:
- Enabling Trade: From Farm to Fork
- Enabling Automotive Trade
- Enabling Trade in the Pacific Alliance
- Enabling Smart Borders
Each section is designed to be stand-alone, but the reader is nonetheless invited to become familiar with the broader Enabling Trade initiative.

3The Forum of Young Global Leaders - A generation of change
Contents
9 1. Introduction
6 2. Approach
7 3. Key Findings
8 4. Recommendations
8 5. Conclusion
10 6. Case Studies
14 Acknowledgements
3Enabling Trade: Enabling Automotive Trade

5Enabling Trade: Enabling Automotive Trade
1. Introduction
The automobile is perhaps the most emotive, high-value mass-consumption good. Economies of scale dictate consolidation in production, but the size and weight of the product encourages regionalized rather than global production for all but the most high-value parts or vehicles.
While relatively few nations have been able to establish domestically-grown, globally competitive car manufacturers, almost all are eager for the prized skilled-labour jobs that automobile production plants provide. The companies seeking barrier reductions in foreign markets are often the same as those looking to maintain barriers for their local production. Unsurprisingly, the automotive sector has frequently been at the centre of trade disputes.
Most frequently, this trade tension is expressed through tariffs, non-tariff import-related fees and taxes, and local content requirements. At times, these three traditional barriers have been used for political or symbolic reasons rather than economic ones. In late 2011, the People’s Republic of China (China) increased tariffs1 on SUVs and medium- and large-sized cars from the United States (US). A generation earlier, in response to French and West German tariffs on US chicken imports, the US launched the legendary “Chicken Tax”2 in 1963, a 25% tariff on potato starch, dextrin, brandy and light trucks. Frequent and short-term changes to these barriers keep auto manufacturers from having long-term and sustainable strategic plans for their businesses. For example, in Octo-ber 2012 the Brazilian government introduced the Inovar-Auto incentive programme which, as a means of encouraging local production, gives a 30% tax deduction to manufacturers that use locally manufactured content. However, the new programme was announced with insufficient lead time (only three months), and foreign automakers were forced to scramble to comply. Moreover, countries have very different local content rules, creating additional complexity and administrative expense for automakers.
Those three barriers still represent substantial costs to the industry – US$ 50 billion3 per year in tariff costs alone, according to work carried out by the World Economic Forum and Bain & Company. Clearly, efforts at reducing these three barriers can and should continue. However, progress has been seen as well. Through the work of the World Trade Organization (WTO) and other organizations, the automotive industry and global consumers have benefitted from a long-term reduction in automotive tariffs.
Attention is now turning to other barriers that act as significant impediments to trade. Much less visible than highly publicized tariffs, these barriers extract their own high cost from consumers, producers and often governments.
The purpose of this report is to address those barriers that are prioritized by the industry, and to propose recommendations for action to major stakeholder groups. At the invitation of the director-general of the WTO, chief executive officers and other executives from the automotive and supply chain industries assembled their views on current priorities for improving automotive trade. The case studies below illustrate the key barriers identified and highlight the potential impact of removing them.

Enabling Trade: Enabling Automotive Trade6
2. ApproachTo develop a short list of the key non-tariff barriers considered as the most salient obstacles to free trade, the World Economic Forum gathered a broad panel of corporate partners (automotive industry players and experts). The panel included not only car manufacturers, but also automotive parts producers and logistics players with a key focus on automotive trade.
Through a number of interviews, a list of the most important barriers to the panellists was created. Corporate partners were then asked to rank them along two main dimensions:
1. The incremental costs or lost revenues to the global automotive industry generated by each of those barriers
2. The feasibility of solutions to these barriers being successfully implemented by governments or businesses
Barriers have been prioritized according to this assessment. To estimate their economic impact, the authors conducted an indicative quantitative analysis. Some barriers could be quantified at the global level, others at the regional or country level.
3. Key FindingsSix key supply chain barriers were identified from the panellists’ input:4
- Excessive border-crossing times and processes
Border delays and burdensome requirements can extend beyond a customs administration to include lack of coordination between border agencies and lack of compliance with import-export standards.
- Re-export barriers: Non-deductibility of import tariffs on re-exported parts and pooled equipment
Duty drawbacks allow exporters to obtain a refund of the customs duties, taxes and fees paid on the merchandise they import, if that merchandise is subsequently exported. The main objective is to lower the cost of imported inputs and, consequently, to increase the exporting firms’ competitiveness, eventually returning benefits to end customers by providing vehicles at lower cost. However, some countries do not permit or easily facilitate the duty drawback system. For example, governments sometimes restrict or create disincentives (e.g. tariffs and conditions such as bonding) to pooling and reusing containers and pallets, resulting in inefficient, less sustainable and more costly supply chains.
- Unnecessary differences in regulatory standards between countries
Despite having broadly similar intentions, nations mandate widely differing motor vehicle safety standards, and environmental and technical norms. This imposes costly and lengthy technical adaptations on carmakers, and prevents them from selling standardized vehicles around the world.
- Lengthy dispute settlements encouraging short-term violations
The lengthy WTO dispute settlement process results in some countries purposely violating the organization’s rules to temporarily take advantage of financial gains during the settlement process.
- Lack of visibility and transparency on trade and investment
Identifying local regulations on non-tariff barriers is a lengthy and manual process; it highlights the lack of a single, global automated tool, available to importers and exporters that could help them identify the most up-to-date non-tariff barriers at country level. Similar frustrations exist on the investment side, as importers and exporters struggle to deal with a confusing variety of government agencies involved in the trade- and investment-facilitation process.
- Tax obstacles to free trade
Even within large free trade areas such as the European Union (EU), local tax obstacles to trade persist. In some cases, physical goods are transferred between nations simply for tax purposes.
Figure 1 visualizes and ranks the panellists’ assessment of the financial impact and ease of implementation of these six barriers.
The analysis of this ranking highlights two main clusters of barriers:
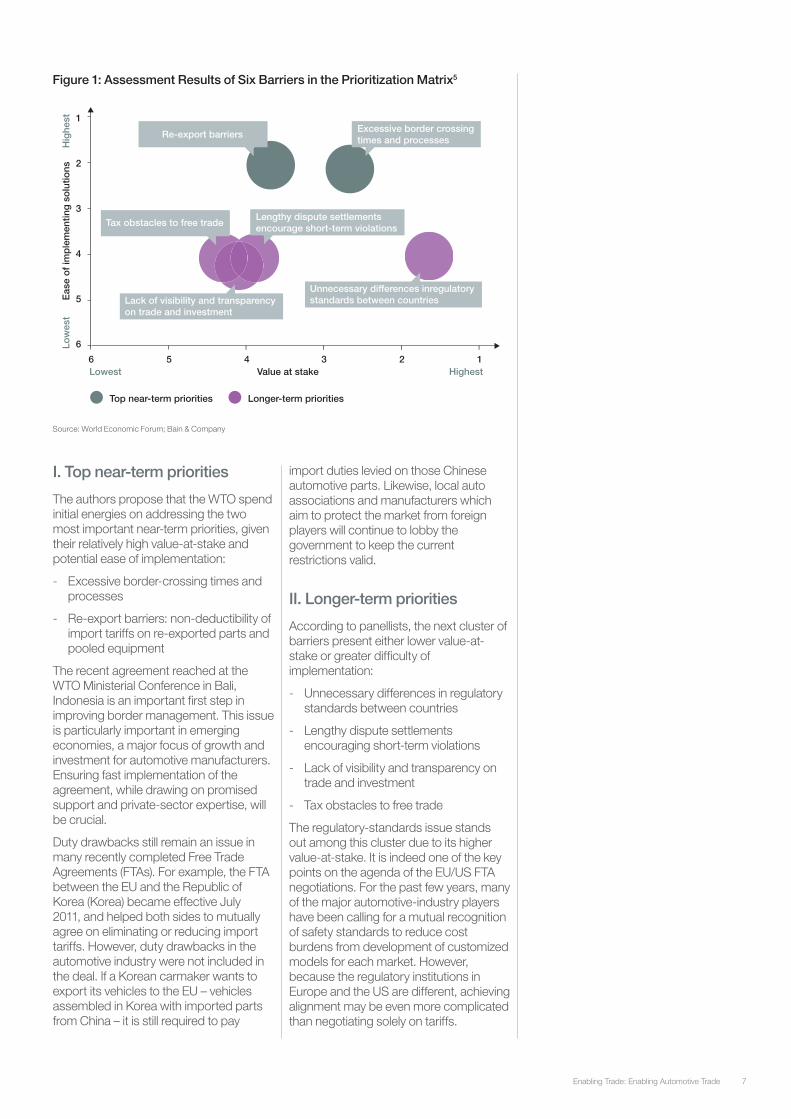
7Enabling Trade: Enabling Automotive Trade
123456Value at stake HighestLowest
Hig
hest
Low
est
Eas
e o
f im
ple
men
ting
so
lutio
ns
1
2
3
4
5
6
Top near-term priorities
Unnecessary differences inregulatorystandards between countriesLack of visibility and transparency
on trade and investment
Excessive border crossingtimes and processes
Lengthy dispute settlementsencourage short-term violations
Re-export barriers
Tax obstacles to free trade
Longer-term priorities
Figure 1: Assessment Results of Six Barriers in the Prioritization Matrix5
Source: World Economic Forum; Bain & Company
I. Top near-term priorities
The authors propose that the WTO spend initial energies on addressing the two most important near-term priorities, given their relatively high value-at-stake and potential ease of implementation:
- Excessive border-crossing times and processes
- Re-export barriers: non-deductibility of import tariffs on re-exported parts and pooled equipment
The recent agreement reached at the WTO Ministerial Conference in Bali, Indonesia is an important first step in improving border management. This issue is particularly important in emerging economies, a major focus of growth and investment for automotive manufacturers. Ensuring fast implementation of the agreement, while drawing on promised support and private-sector expertise, will be crucial.
Duty drawbacks still remain an issue in many recently completed Free Trade Agreements (FTAs). For example, the FTA between the EU and the Republic of Korea (Korea) became effective July 2011, and helped both sides to mutually agree on eliminating or reducing import tariffs. However, duty drawbacks in the automotive industry were not included in the deal. If a Korean carmaker wants to export its vehicles to the EU – vehicles assembled in Korea with imported parts from China – it is still required to pay
import duties levied on those Chinese automotive parts. Likewise, local auto associations and manufacturers which aim to protect the market from foreign players will continue to lobby the government to keep the current restrictions valid.
II. Longer-term priorities
According to panellists, the next cluster of barriers present either lower value-at-stake or greater difficulty of implementation:
- Unnecessary differences in regulatory standards between countries
- Lengthy dispute settlements encouraging short-term violations
- Lack of visibility and transparency on trade and investment
- Tax obstacles to free trade
The regulatory-standards issue stands out among this cluster due to its higher value-at-stake. It is indeed one of the key points on the agenda of the EU/US FTA negotiations. For the past few years, many of the major automotive-industry players have been calling for a mutual recognition of safety standards to reduce cost burdens from development of customized models for each market. However, because the regulatory institutions in Europe and the US are different, achieving alignment may be even more complicated than negotiating solely on tariffs.

Enabling Trade: Enabling Automotive Trade8
4. Recommendations Panellists surveyed for this report indicated that automotive companies need to be much more engaged in tackling joint trade priorities. The following were highlighted as areas where the WTO can add value by taking a leadership role.
Firstly, the WTO should review the local trade requirements and investment incentives used by its members; by focusing on the extent to which these elements distort trade, it can develop and suggest ways of improving visibility and reducing those distortions. Different processes and standards for foreign direct investment (FDI), as set by various state governments or different ministries, slow the process of opening new plants. And in many emerging markets, the transparency and reliability of local trade authorities still requires strengthening. Often, companies entering a new market encounter unforeseen difficulties. These markets struggle to enact universal standards and to create a more predictable and welcoming environment for business. A central authority is needed to provide guidance and set norms. The WTO is ideally placed to fulfil this role.
As a second area, the WTO should support bilateral dialogue to address issues such as different safety and/or environmental standards (e.g. standards between the EU and US). While FTAs can help drive this bilateral dialogue, the WTO should ensure that negotiations are goal-oriented.
Lastly, the WTO could act as a forum for discussions among its members and the automotive sector to identify existing practices and problems encountered in border management and duty drawback systems. Such consultations should lead to the development of best practices in these areas, among other outcomes. This kind of service is especially vital for emerging markets.
Of course, the governments of major automotive markets must retain a key role. In particular, the US and EU have created billions of dollars in extra costs for automotive companies in these markets due to different standards for manufacturing and selling vehicles and automotive parts. Similar yet different safety standards in the US and EU markets burden automakers without benefiting consumers. Coordinating these standards will lead to tremendous cost savings for manufacturers by reducing production lines for lights, door locks, brakes and steering systems, among others.
In the future, harmonizing different regulations will have an even greater impact on the automotive industry. In 15 to 30 years, traditional carbon-dioxide-emitting vehicles may have been largely replaced by a new generation of alternative fuel vehicles such as plug-ins and fuel cells. Battery and vehicle recycling will require consistent environmental standards across markets – standards that should be considered and established well in advance of when needed. Bilateral negotiations and dialogue on this issue should begin now, before differing standards become entrenched and create new barriers between markets.
The Bali agreement demonstrated again the significant role of the WTO as a forum for international trade negotiation. Trade wars involving different national and regional economies always result from conflicts of interest. Clearly, addressing these conflicts is challenging and will not always result in concrete agreements. However, as we observed from the Bali deal, a practical, operations-focused approach to negotiations can create a platform for the WTO to act.
5. ConclusionAs recently as a few decades ago, improving automotive trade opportunities meant reducing tariffs and removing explicit bans. It was a relatively straightforward but contentious process, mainly involving ministers of trade.
While there is still work to be done in this area, enabling trade today requires addressing a host of less explicit, often unintentional barriers to trade by involving a range of players, many of whom might not see themselves as linked to trade issues. Mutual recognition of automotive standards between the US and EU, for example, would require not only trade ministers, but also transport, safety and environmental regulators from both sides of the Atlantic to come to the bargaining table.
Not unrelated to the partial success of tariff reduction, the automotive industry itself has transformed into a more global value chain. The ease of importing goods is a crucial contributor to success in exports, and efficient border crossings can mean the difference between winning or missing out on major investments.
The industry’s global nature is beginning to translate into a more unified industry voice for streamlining supply chains and reducing trade frictions. While local workforce demands for protection are still heard, the consensus is growing to at least debate the issues openly, unencumbered by tangential barriers and restrictions.

9Enabling Trade: Enabling Automotive Trade 9Enabling Trade: Enabling Automotive Trade

Enabling Trade: Enabling Automotive Trade10
I. Excessive border-crossing times and processes
Time is money. Import and export delays represent significant costs for export-intensive industries such as automobile production and automotive equipment manufacturing. According to the chief financial officer of a European original equipment manufacturer (OEM), “time is the enemy in automotive. The value of one day of working capital in the automotive industry is very large.”
Customs clearance and border-crossing times vary widely across countries and, indeed, within them. Document checking, physical inspection, poor infrastructure, obsolete equipment and poorly trained staff are among the common causes of delay.
According to the analysis conducted by the World Economic Forum and Bain & Company, based on World Bank data on time required to import and export6, roughly US$ 6 billion7 is spent by the automotive industry on inventory-carrying costs for border crossing. By bringing all countries halfway to best practice, around US$ 2 billion could be cut from those costs.
Automotive Co., a global automotive manufacturer, provides an illustration of losses due to customs clearance and border-crossing delays in Russia. Reasons for delays include:
- Almost every truck is reweighed at the customs terminal and even minor deviations from declared weights lead to delays. For example, pallets shipped wet from Western Europe require reweighing when dry at the Russian border.
- Imports require a contract with the internal or external supplier in three languages, along with mandatory translation of technical documents into Russian.
- The trade description of goods for customs clearance are much more detailed than in other major markets, and product codes do not entirely match international standards.
The “Enabling Trade: Enabling Smart Borders” section of the Enabling Trade: From Valuation to Action report offers best practices for implementing solutions to improve border-crossing tools and processes.
II. Re-export barriers: Non-deductibility of import tariffs on re-exported parts and equipment pooling
Duty drawback regimes are a generally accepted means of lowering input costs; the regimes allow exporters to obtain a refund of customs fees paid on imported components that are subsequently exported.
The manufacturing process of the Renault Logan8, for example, is carefully designed to minimize costs at each stage, allowing the production of an affordable car for various emerging markets. Renault uses a global hub in Romania to source parts, while assembly occurs in plants in Roma-nia, Morocco, Russia and other countries, reducing exposure to high finished-vehicle import tariffs. Duty drawbacks are an essential component of this approach.
However, even where an entire vehicle platform is carefully designed to fit country-specific drawback regulations and processes, the administration is often problematic. OEMs are hindered from taking advantage of duty drawback due to costly application procedures, long delays, a lack of transparency and significant uncertainty about eventual refunds.
Equipment pooling presents unique challenges in the duty drawback process. The use of pooled equipment, notably pallets, crating and packaging, is wide-spread in the automotive industry. As components move along tiers of suppliers, manufacturers rent pooled equipment rather than disposing of containers or sending them empty back up the chain. Typically, the lessor ensures that equip-ment is well-maintained and available where needed. The flow of pooled assets is thus efficiently managed among many companies with similar needs.
Equipment pooling systems can have economic and environmental advantages as material is circulated and reused efficiently. However, border agencies do not always offer workable means for such equipment loops to cross international borders.
A typical solution, such as that proposed by US Customs and Border Protection, is to designate these materials as instruments of international traffic, effectively exempt from import duties. Similarly, aircraft, trucks and other vehicles are not repeatedly subjected to import charges on each leg of a regular route.
6. Case Studies

11Enabling Trade: Enabling Automotive Trade
However, the Customs Convention on Containers and the Istanbul Convention both restrict their definitions of containers to units larger than one cubic metre. As many automotive components are shipped in smaller containers, it would be valuable to expand trade facilitation benefits to this equipment.
More generally, requirements to post bonds on temporarily imported containers are probably unnecessary for today’s supply chains. To ensure pooled equipment is indeed re-exported, border agencies generally require that it is registered, and either duties or a bond are paid, with reimbursement upon re-export. Two difficulties result:
- Uncertainty arises as to how the dutiable value of reusable packaging should be assessed (e.g. rental fees over the duration of a contract, depreciated book value).
- Packaging materials are sometimes only eligible for duty refunds when re-exported by the importing entity. Rather than repeatedly paying cumula-ted import duties, manufacturers bear the expense of recollecting and shipping out empty containers.
Through quantification work conducted by the authors, the cost of this wasteful returns process alone (for a fairly small and peripheral part of the automotive value chain) is estimated at about US$ 40 million in India alone9.
III. Unnecessary differences in regulatory standards between countries
Differences in regulatory standards have long hampered efforts to develop models for sale worldwide. Harmonization efforts have existed for decades, yet homologa-tion for different markets remains a costly process, deterring trade in automotive parts and in new and used vehicles.
Substantial differences in standards between economies at very different levels of development are perhaps to be expected. However, small variations in standards between similar economies become barriers to trade out of proportion to their stated purpose.
The European Commission estimates that unnecessary standards barriers equate to a tariff of 10-20%10, even for large markets. Based on analysis conducted by the authors of this report, this implies an additional annual cost of US$ 3 billion-6 billion11 on EU car exports to the US.
The Fiat 500 model12 illustrates the magnitude of inconsistencies in safety and regulatory standards. The Italian manufacturer decided to market this Fiat model in the US after commercial success in Europe. In a process overseen by Fiat engineers, despite a very similar appearance to the European model, the US-market Fiat was significantly retrofitted and re-engineered. Among other almost imperceptible modifications was the need to re-engineer the front and rear fascias, as European number plates are wider and shorter than the US standard. Engineers had to increase the size of the windshield wipers to meet US guidelines. Side lights are compulsory in the US, and additional protections are needed for passengers who may not be wearing seat belts. The overall homologation process can take up to 18 months.13
It is advised to first strive for mutual recognition of automotive-safety norms between the EU and the US, and then for harmonized environmental standards. The ideal scenario is a global safety standard. Regulatory compatibility is a key component of the Transatlantic Trade & Investment Partnership negotiations, yet there is considerable scepticism about the likelihood of coming to agreement across a wide set of complex issues. The approach of mutual recognition – recognizing that regulators have similar safety concerns – is perhaps more promising. This has been applied successfully across a broad range of issues within the EU.
After reaching agreement on the mutual recognition of safety standards, regulators should start working towards harmonized environmental regulations. This would imply both reconciling regulations around existing topics (e.g. carbon dioxide and particulates output) and getting “ahead of the curve” to create shared, future environmental legislation for the automotive industry (e.g. electric-vehicle battery recyclability).
IV. Lengthy dispute settlements encouraging short-term violations
The WTO’s Dispute Settlement Body allows a member country to protest a policy measure adopted by another member that is considered to be a breach of WTO agreements.
The procedure for settling disputes follows a detailed and structured set of milestones. The duration of the process varies, but according to the WTO, if a case runs its full course to a first ruling, it should normally not take more than 12-15 months even if the case is appealed. However, the agreed time limits are flexible and disputes can, in fact, take longer to be settled.
The perception within the automotive industry is that dispute settlement has become excessively lengthy, given the large economic and commercial impact of disputed measures. Multiple industry players assert that this provides an incentive to manipulate the system by temporarily breaching WTO agreements.
A current dispute (DS 462), filed in July 2013, has a number of nations opposing the Russian Federation on whether its newly introduced recycling fee discriminates against imported vehicles. The fee varies from US$ 700 to 7,00014, and is estimated to have created up to US$ 1.3 billion15 in cost, according to the authors’ analysis. At issue is whether importers are disadvantaged by the provision for local producers to collect and dismantle vehicles themselves rather than face the levy.
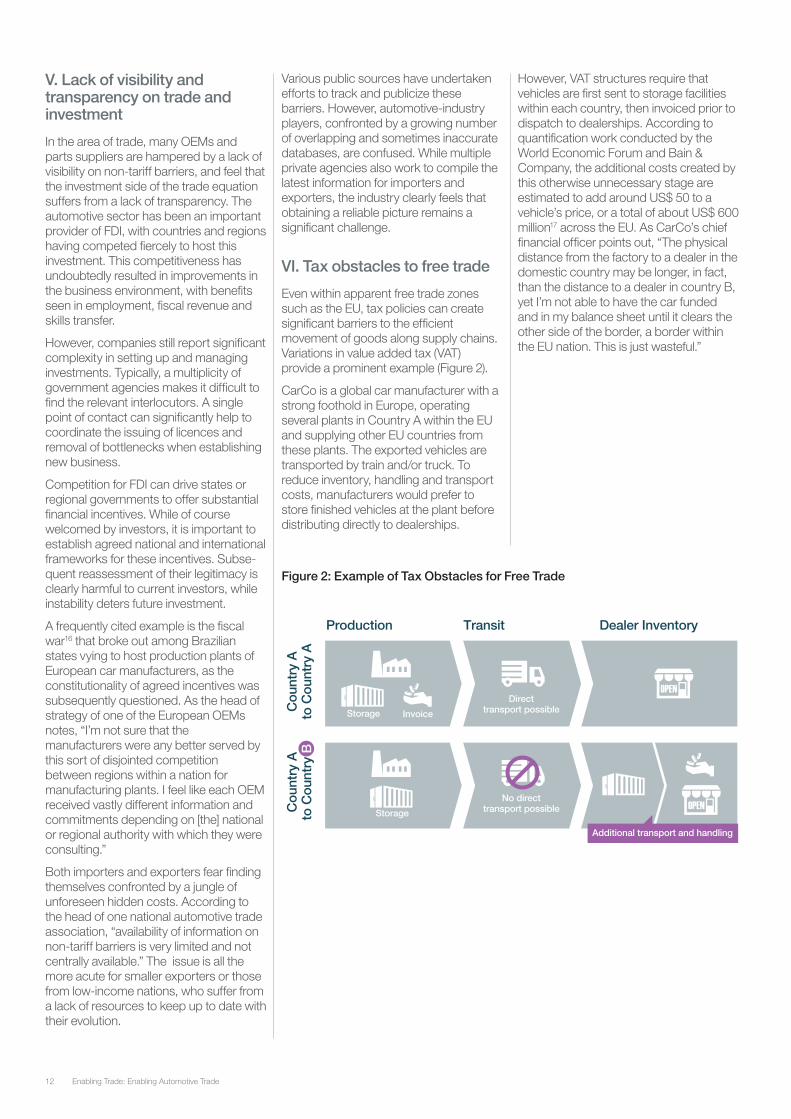
Enabling Trade: Enabling Automotive Trade12
V. Lack of visibility and transparency on trade and investment
In the area of trade, many OEMs and parts suppliers are hampered by a lack of visibility on non-tariff barriers, and feel that the investment side of the trade equation suffers from a lack of transparency. The automotive sector has been an important provider of FDI, with countries and regions having competed fiercely to host this investment. This competitiveness has undoubtedly resulted in improvements in the business environment, with benefits seen in employment, fiscal revenue and skills transfer.
However, companies still report significant complexity in setting up and managing investments. Typically, a multiplicity of government agencies makes it difficult to find the relevant interlocutors. A single point of contact can significantly help to coordinate the issuing of licences and removal of bottlenecks when establishing new business.
Competition for FDI can drive states or regional governments to offer substantial financial incentives. While of course welcomed by investors, it is important to establish agreed national and international frameworks for these incentives. Subse-quent reassessment of their legitimacy is clearly harmful to current investors, while instability deters future investment.
A frequently cited example is the fiscal war16 that broke out among Brazilian states vying to host production plants of European car manufacturers, as the constitutionality of agreed incentives was subsequently questioned. As the head of strategy of one of the European OEMs notes, “I’m not sure that the manufacturers were any better served by this sort of disjointed competition between regions within a nation for manufacturing plants. I feel like each OEM received vastly different information and commitments depending on [the] national or regional authority with which they were consulting.”
Both importers and exporters fear finding themselves confronted by a jungle of unforeseen hidden costs. According to the head of one national automotive trade association, “availability of information on non-tariff barriers is very limited and not centrally available.” The issue is all the more acute for smaller exporters or those from low-income nations, who suffer from a lack of resources to keep up to date with their evolution.
Various public sources have undertaken efforts to track and publicize these barriers. However, automotive-industry players, confronted by a growing number of overlapping and sometimes inaccurate databases, are confused. While multiple private agencies also work to compile the latest information for importers and exporters, the industry clearly feels that obtaining a reliable picture remains a significant challenge.
VI. Tax obstacles to free trade
Even within apparent free trade zones such as the EU, tax policies can create significant barriers to the efficient movement of goods along supply chains. Variations in value added tax (VAT) provide a prominent example (Figure 2).
CarCo is a global car manufacturer with a strong foothold in Europe, operating several plants in Country A within the EU and supplying other EU countries from these plants. The exported vehicles are transported by train and/or truck. To reduce inventory, handling and transport costs, manufacturers would prefer to store finished vehicles at the plant before distributing directly to dealerships.
However, VAT structures require that vehicles are first sent to storage facilities within each country, then invoiced prior to dispatch to dealerships. According to quantification work conducted by the World Economic Forum and Bain & Company, the additional costs created by this otherwise unnecessary stage are estimated to add around US$ 50 to a vehicle’s price, or a total of about US$ 600 million17 across the EU. As CarCo’s chief financial officer points out, “The physical distance from the factory to a dealer in the domestic country may be longer, in fact, than the distance to a dealer in country B, yet I’m not able to have the car funded and in my balance sheet until it clears the other side of the border, a border within the EU nation. This is just wasteful.”
Production
Cou
ntry
Ato
Cou
ntry
AC
ount
ry A
to C
ount
ry B
Transit Dealer Inventory
Directtransport possible
No directtransport possible
InvoiceStorage
Storage
Additional transport and handling
Figure 2: Example of Tax Obstacles for Free Trade

13Enabling Trade: Enabling Automotive Trade
Endnotes 1. http://www.nytimes.com/2011/12/15/business/global/
china-imposes-new-tariffs-on-some-vehicles-from-the-us.html?pagewanted=all&_r=0.
2. http://thegraph.com/2011/02/is-donald-trump-a-chicken/.
3. To come up with the total value of import duties, the authors listed up the 18 largest economies were listed up by value, which represent 81% of the global economy, pulled the value of dutiable items, and estimated value from duty collections based on the WTO database (http://tariffanalysis.wto.org/?ui=1). The total value of dutiable imports for 18 countries in 2011 was estimated US$ 515 billion; among that, 50 billion was collected as import duties.
4. Initially nine barriers were identified by the panel, with two issue pairs among the nine eventually being combined (“Restrictions on reuse of imported containers” was included as a subset of “non-deductibility of import tariffs on re-exported parts”. “Uncoordinated government agencies within nations” and “no automated central database to do cross-border business” were merged and renamed as “lack of visibility and transparency on trade and investment). As well, the barrier “data export restrictions” was tabled for the moment, due to the ongoing data protection dispute between the EU and the US. Thus the final list of barriers to be addressed stands at six.
5. The survey was conducted in October 2013 and answered by 12 respondents from relevant corporations.
6. Doing Business 2013 Report – the World Bank and International Finance Corporation.
7. The assumption is that the total cost in going through border-crossing processes is calculated by multiplying the cost of time to import/export by the value of annual automotive trade by the average daily cost of capital for the automotive industry. See the formula below for further details:
Delat vs.target time toimport/export
Value ofannual
automotiveimoprts/exports
Averageautomotivedaily cost of
capital
Applying this assumption, summing the total cost of border crossing for the automotive industry from 180 countries gave US$ 6 billion as the global cost for handling automotive exports and imports at borders in 2011. To come up with potential savings, the Time to Import/Export World Bank Index that indicates the current time to import or export goods at borders was taken as a basis. A new target time was set for each country by bringing them half way to the best practices – i.e. Singapore and Denmark. Then, the potential savings were calculated by multiplying the cost of extra days vs target time to import/export by the value of annual automotive imports/exports(from Trade map of International Trade Centre, based on UN COMTRADE data per country) by the average automotive daily cost of capital (Average Automotive Industry WACC after corporate taxes =7.6% from KPMG “Cost of capital study 2011/2012”). Accumulated savings for 180 countries was thus calculated as approximately US$ 2 billion.
8. Renault’s Logan Car: Managing Customs Duties For A Global Product – Stanford Graduate School of Business, April 2008.
9. Given the information provided by one of the Forum’s automotive partners, the current duty drawback policy (which only allows re-importable packages to be returned by the same exporting entity in India) creates 8 euros (approximately US$ 11) of additional return and shipping costs per vehicle a year. Assuming that about 4 million vehicles are produced in India every year, (http://oica.net/wp-content/uploads/all-vehicles-2010-provisional.pdf), the cost of this policy is US$ 43 million per year.
10. http://www.automotivelogisticsmagazine.com/intelligence/2eu-us-free-trase-deal-aims-to-harmonise-standards.
11. The total value of EU automotive exports in the US is estimated to be 25 billion euros (http://www.bbc.co.uk/news/business-21439945). Given 10-20% of the import tariff on those automotive vehicles imported to the US from the EU, additional import duties levied to European car makers are estimated to be around 2.5~5 billion euros (US$ 3.2~6.5 billon). Formula:
Total value of EUmotor vehicules
exports in the US
Cost of inconsistentregulatory & safety
standards(~10-20% tariff)
12. Subtle Changes for Fiat 500 in US – Jeffrey Archer in Autotrader.com, March 2011.
13. How do you turn a Fiat into a Chrysler? – Rick Kranz in Automotive News, May 2009.
14. Accession of Russia to the WTO Practical Developments – Baker McKenzie, January 2013.
15. This recycling has yielded an estimated US$ 1 to 2.5 billion in fiscal revenues for Russian authorities since its implementation. This estimate has been calculated by applying a base rate and an upgraded rate (twice as much as the base rate) on the total volume of imported cars since the tax became effective in September 2012. The base rate has been officially stated as 20,000 rubles for small cars and 150,000 for light trucks. Depending on the engine capacity, vehicle weight, and seat capacity, the maximum fee (for dump trucks weighing over 350 tons) may reach 6,000,000 rubles (approximately 148,000 euros) per vehicle. According to Autostat Analytic Agency reports (http://eng.autostat.ru/), the number of imported passenger cars in 2012 was about 1 million and the number for imported trucks was about 115 thousand. By multiplying the number of imported vehicles for passenger and trucks by required recycling fee per vehicle, the base case gives US$ 0.7 billion as the total cost for recycling and the high case US$ 1.3 billion.
16. Incentives-based Competition for Foreign Direct Investment: The Case of Brazil – OECD Working Papers on International Investment, March 2003.
17. The cost of the tax barriers is estimated at 35 euros per vehicle according to one of the Forum’s automotive partners. Therefore, the cost saving opportunity for the automotive partner at the European level was estimated by combining the unit cost with the market share of the automotive partner in the EU market. Extrapolating this for all car makers manufacturing in the EU region gives an estimate of US$ 0.6 billion per year.

World Economic Forum91-93 route de la CapiteCH-1223 Cologny/GenevaSwitzerland
Tel +41 (0) 22 869 1212Fax +41 (0) 22 786 2744
The World Economic Forum is an independent international organization committed to improving the state of the world by engaging business, political, academic and other leaders of society to shape global, regional and industry agendas.
Incorporated as a not-for-profit foundation in 1971 and headquartered in Geneva, Switzerland, the Forum is tied to no political, partisan or national interests
Enabling Trade: Enabling Trade in the Pacific Alliance
January 2014
In collaboration with the Inter-American Development Bank and Bain & Company

Published by World Economic Forum, Geneva, Switzerland, 2014All rights reserved. No part of this publication may be reproduced, stored in a retrieval system, or transmitted, in any form or by any means, electronic, mechanical, photocopying, or otherwise without the prior permission of the World Economic Forum.
World Economic Forum91-93 route de la CapiteCH-1223 Cologny/GenevaSwitzerlandTel.: +41 (0) 22 869 1212Fax: +41 (0) 22 786 [email protected]
Published by World Economic Forum, Geneva, Switzerland, 2014All rights reserved. No part of this publication may be reproduced, stored in a retrieval system, or transmitted, in any form or by any means, electronic, mechanical, photocopying, or otherwise without the prior permission of the World Economic Forum.
The Context of Enabling Trade: From Valuation to Action
The World Economic Forum’s Enabling Trade initiative works to reduce practical barriers to trade. The initiative’s 2013 report, Enabling Trade: Valuing Growth Opportunities, indicated that reducing supply chain barriers could increase the world’s gross domestic product (GDP) by over US$ 2.5 trillion. Building on the momentum of this finding, the 2014 report looks at how to accelerate reform. It concentrates on sectoral, regional and functional areas where the positive impacts of supply chain facilitation could be greatest, or where momentum for change is building. The four sections comprising the report are:
- Enabling Trade: From Farm to Fork
- Enabling Automotive Trade
- Enabling Trade in the Pacific Alliance
- Enabling Smart Borders
Each section is designed to be stand-alone, but the reader is nonetheless invited to become familiar with the broader Enabling Trade initiative.

Contents
5 Foreword
6 1. Introduction
7 2. Production Integration Perspectives
9 3. Supply Chain Barriers to Trade in the Pacific Alliance
11 4. The Road Ahead
12 Appendix
14 Acknowledgements
3Enabling Trade: Enabling Trade in the Pacific Alliance

5Enabling Trade: Enabling Trade in the Pacific Alliance
Foreword
Deepening commercial ties among its member countries is at the core of the Pacific Alliance’s overall goals. Lowering tariffs among the Alliance’s economies is an important first step in this direction. Nevertheless, the full benefits of trade liberalization will only be felt if Alliance members address structural challenges in transport, logistics, procedures and other areas that continue to block the full potential of regional trade opportunities.
Numerous studies, particularly from the World Economic Forum, highlight that a decrease in trade barriers would give a higher boost to global GDP than mere tariff elimination. It is therefore pivotal to identify these barriers and assess their nature, so that both the business community and national governments in Pacific Alliance countries can develop targeted measures, put forth best practices and prioritize coordinated investments.
The Pacific Alliance Business Council stands ready to assist the region’s governments in crafting solutions that may fulfil the promise of this ambitious integration initiative. We are aware that tackling long-standing barriers such as customs clearance delays, repetitive and uncoordinated procedures, and inefficient infrastructure will be no easy challenge. However, focusing on a series of key trade facilitation reforms can put our countries on a path towards lower trading costs and more efficient regional value chains.
In this regard, we welcome the joint efforts of the Inter-American Development Bank (IDB), the World Economic Forum and the region’s private sector to identify ongoing challenges and key trade facilitation solutions. In particular, we acknowledge the pivotal role of the Association of American Chambers of Commerce in Latin America (AACCLA) and its affiliates in Mexico, Colombia, Peru and Chile; the Mexican Business Council for Foreign Trade, Investment and Technology (COMCE); the National Business Association of Colombia (ANDI); the Peruvian National Confederation of Private Business Institutions (CONFIEP); the Peruvian Foreign Trade Society (COMEX Peru) and the Chilean Industrial Promotion Society (SOFOFA).
We believe that stronger regional trade holds the key to a more robust bloc that can create the economic opportunities for generations to come. The Pacific Alliance Business Council thus remains committed in its mission to work in tandem with governments in areas that may be conducive to improved integration among member countries.
Juan Camilo Nariño AlcocerVice-President, National Business Association of Colombia – ANDI

Enabling Trade: Enabling Trade in the Pacific Alliance6
1. Introduction
The Pacific Alliance initiative is moving progressively and pragmatically towards the free movement of goods, services, capital and people among its members, effectively creating a market of 200 million people with a combined GDP of nearly US$ 2 trillion (35% of Latin America's total).1
The initiative has already demonstrated significant progress towards the economic integration sought by member countries. As of the end of 2013, member countries had agreed to lift tariffs on over 90%2 of traded goods and restated their commitment towards establishing a comprehensive free trade zone. Visa requirements for Pacific Alliance citizens have been eliminated; the four countries (Chile, Colombia, Mexico and Peru) have opened joint export promotion offices; scholarships have been set up to promote student exchanges; and a cooperation fund has been established and funded.
Despite this progress, unresolved non-tariff barriers to trade are seriously hindering the full potential of the initiative, both internally and in terms of the region’s outward-facing competitiveness. To make best use of their productive strengths, Alliance members hope to reinforce their use of and contribution to distributed value chains. This requires the reduction of barriers to the movement of intermediary components and raw materials (see the Box for more details on the Pacific Alliance).
This study combines a review of the potential for integrating production in the region with a targeted survey of regional businesses (conducted by the Integration and Trade Sector of the IDB, in collaboration with private-sector associations in the four member countries3) and a selection of illustrative case studies. These initial findings will be supplemented by additional survey responses in coming months, as well as focus group discussions with regional companies. The resulting picture of challenges and potential solutions will be provided in a final report prior to the World Economic Forum on Latin America in Panama City, Panama on 1-3 April 2014.
Box: Key Facts and Structures of the Pacific Alliance4
The Pacific Alliance, formally created in June 2012, is made up of four member countries: Chile, Colombia, Mexico and Peru. These members have been outperforming their Latin American peers since 2009 on several macroeconomic metrics (e.g. GDP growth, level of investment, unemployment, inflation), driving economic leadership in the region. More than 20 other countries are admitted as observers and two of them, Costa Rica and Panama, have requested to be admitted as full members.
The vision for the Alliance has progressed from simply creating a free trade zone to more ambitious objectives, including deep economic integration to enhance free movement of goods, services, capital and people; economic development; and promotion of well-being and trade integration platform setup with a special pivot to Asia-Pacific, one of the region’s main trading partners.
The Alliance has put in place four layers of discussion forums. The first layer consists of the summits, during which decisions are made and summit agendas are defined. The second, a ministry council made up of the ministers of foreign affairs and foreign trade of each member state, makes decisions on implementation of the objectives and specific actions detailed in the Framework Agreement and the Alliance’s presidential declarations. The High Level Group is the third layer, in charge of monitoring progress on the Alliance’s priorities which are spread across the fourth and last layer of the technical groups (e.g. trade and integration, population transit). Moreover, the Alliance has created a “business council” organization, led by the private sector, whose role is to promote the Alliance within each of its member countries, make suggestions and recommendations to accelerate the integration process, and promote joint actions towards other markets, particularly the Asia-Pacific region.

7Enabling Trade: Enabling Trade in the Pacific Alliance
2. Production Integration Perspectives5
Trade ties across the Pacific Alliance countries are currently limited. For each country, trade within the Alliance represents on average only 6% of its total exports. But the importance of the Alliance for each of the countries has been growing steadily (Figure 1). Most crucially, the four countries today share a vision of integration backed by a set of common factors, including stable democracies with prudent macroeconomic managements, favourable business environments, strong commitments to openness in trade and investment, and a common geographic location around the Pacific basin.
Different trade patterns indicate different economic structures and the existence of potential production complementarities. Evidence from bilateral trade balances shows that, in general, Colombia, Chile and particularly Peru show, on the one hand, surpluses in raw materials and natural-resource-intensive goods when trading within the Alliance, and, on the other, deficits in manufactures that are closer to final consumption. The opposite is generally the case for Mexico (Figure 2). This suggests that a likely pattern of production complementarities within the group is one in which Mexico tends to be positioned closer to final stages of the supply chains, Peru in more upstream segments and Chile and Colombia somewhere in the middle. This finding is supported by a more detailed analysis using a new measure of supply chain participation, consisting of the extent to
which a country uses imported inputs (or foreign value added) to produce goods that are later exported.6
The trends in currently-observed produc-tion complementarities are associated with strong comparative advantages. For instance, an analysis using product-level data shows the existence of production complementarities based on clear comparative advantages, such as Chilean cellulose and processed wood used in Peru and Mexico to produce doors, windows and furniture; denim fabric from Mexico used in Chile, Colombia and Peru to produce clothing; polymers of propyl-ene from Colombia used in Mexico and Peru to produce plastic containers; and zinc, lead and tin from Peru used in Chile, Colombia and Mexico to produce wires and batteries.7
Chile Colombia Mexico Peru
Food and live animals 682 -196 -501 -69
Beverage and tobacco 51 -43 10 -27
Crude materials -618 -106 -326 860
Minerals fuels -1,895 1,597 101 138
Animal products -68 18 -5 49
Chemicals and related products -206 -364 935 -578
Manufactured goods 889 -1,157 255 -101
Machinery and transport equipment -1,128 -3,429 5,072 -1,012
Other 242 0 -58 37
Figure 2: Bilateral Trade Balance – Each Member Country vs Rest of the Pacific Alliance (in millions of US$, 2011)
Figure 1: Intraregional Exports as a Share of Total Exports
Source: IDB, based on data from UN Comtrade
Source: IDB, based on data from United Nations (UN) Comtrade
5.8%5.2%
2.9%
7.6% 7.6%
2.2%2.6%
0.9%
Chile Colombia Mexico Peru
(1986-2011, % of exports)
10%
8
6
4
2
0
20111986

Enabling Trade: Enabling Trade in the Pacific Alliance8
Even in the presence of barriers to trade and investment, some production complementarities are observed, mostly associated with strong comparative advantages within the Alliance. However, many other potential complementarities could flourish if deeper stages of integration were pursued.
Countries more tightly integrated with each other are more inclined to share international production networks. An economic analysis that examines the impact of different types of trade agreements on a measure of supply chain participation – specifically, the foreign value-added of exports – provides support to this claim. The results indicate that deep trade agreements, such as free trade agreements, customs unions or economic unions, are associated with an impact on the formation of an international supply chain that is over two times higher than the impact generated by shallow agreements that only slash tariff rates (Figure 3). Deepening integration across the Alliance will provide more incentives for the formation of international supply chains. Incorporating a number of disciplines that are typical of deep integration agreements is likely to address several dimensions that are important for supply chains to function well.
Deeper integration within the Pacific Alliance will also serve as a platform to enhance trade and investment ties with countries outside the group. For instance, exploiting production complementarities within the Alliance will help member countries reach other markets with more competitive goods. Likewise, a more integrated economic space will encourage the attraction of investment and production blocs from outside the region which will be subsequently sliced and shared among the group’s countries. These enhanced trade and investment opportunities are most likely to occur with the Alliance’s main trade partners (e.g. United States (US), People’s Republic of China, Japan, Brazil and Germany), as well as with partners sharing trade agreements, a group that increasingly covers countries in Asia-Pacific (Figure 4).
Japan
Korea
China
Hong Kong SARVietnam
Thailand
BruneiMalaysia
Singapore
Australia
New Zealand
Guatemala
Honduras
El salvador Nicaragua
Costa Rica
Panama
Colombia
Ecuador
Bolivia
Peru
Chile
Argentina
Uruguay
SignedIn Negotiation
Paraguay
Brazil
Israel
Turkey
EFTA
EU
Canada
USA
Mexico
Colombia
Figure 4: Pacific Alliance Trade Agreements
Source: IDB
Figure 3: Estimated Impact on the Foreign Value-Added of Exports, by Trade Agreement
Source: IDB, 2013
26%
0 20 40 60 80%
58%
61%
PreferentialAgreement
Free TradeAgreement
Customs UnionCommon Market
Estimated impact by trade agreement onforeign value added of exports

9Enabling Trade: Enabling Trade in the Pacific Alliance
3. Supply Chain Barriers to Trade in the Pacific Alliance
Efforts to reduce regional supply chain barriers to trade should typically begin with an assessment of the impacts of existing barriers. Input from the private sector can help governments to prioritize barriers based on how and to what degree they restrict the flow of goods within the region, and to generate ideas for initiatives to reduce these barriers.
In this spirit, the IDB, in collaboration with private-sector associations in Chile, Colombia, Mexico and Peru8, is gathering input from companies that trade across the Alliance countries. The input collected is in two forms: first, a broad survey targeting companies associated with the largest business association in each country, as well as members of AACCLA; and second, subsequent in-depth focus group discussions with representatives from selected companies in each country. The resulting picture of challenges and potential solutions will be provided, as noted, in a final report prior to the World Economic Forum on Latin America in Panama City, Panama on 1-3 April 2014.
In this report, survey results provide early signals of which barriers are seen as most restrictive to trade within the Pacific Alliance. Although these results are based on a relatively small sample of about 140 firms and have to be considered as prelimi-nary, they are generally consistent with the findings of the Enabling Trade Index, and the authors believe they are directionally accurate. A profile of respondents to date is given in the Appendix.
To supplement the quantitative survey results, qualitative case studies based on interviews with executives illustrate the kind of concrete, practical input that is expected to result from focus group discussions.
Preliminary results9
Exporters and importers completed separate questionnaires. This preliminary report focuses on key questions that can help policy-makers when prioritizing actions.
Evaluation of infrastructure, services and border efficiency
Respondents were asked to evaluate the performance of their country of origin10 for various aspects of infrastructure, services and border efficiency. Aggregating all countries’ answers, the main priorities were inland infrastructure, border control infrastructure, cold-chain installations and public information on freight (e.g. price transparency).11
Around 39% of the companies indicated land infrastructure as an important issue that is not satisfactory in their own countries, and consequently hinders their capacity to trade across borders (Figure 5). To illustrate this issue, Case Study 1 describes the challenges facing transport along Peru’s Pan-American Highway and presents the liberalization of cabotage regulations as a potential solution.
Shortcomings in domestic transport infrastructure are not exclusive to Peru. The concern is also present in the other Pacific Alliance countries and across the Latin American region, with considerable value at stake. A recent IDB report shows that reductions in domestic freight rates can significantly boost trade flows. According to the results, a reduction of 1% in domestic ad-valorem costs could increase exports on average by around 4%.12 From the coun-tries studied (which include all of the Alliance members), the major issue tends to be underinvestment, particularly in cheaper and alternative modes of transport such as rail and waterways. The agenda behind inland transport is complex, and it obvi-ously varies by country. However, the report shows that this agenda is not just restricted to the construction of new and/or better roads; it also touches on a number of institutional and regulatory weaknesses typically seen in the transport industry.
Infrastructure
39%
28%
26%
23%
22%
18%
14%
13%
12%
11%
11%
10%
10%
9%
5%
Firms' evaluation of country-of-origin performance(2013, % of bad or very bad responses) (N=136*)
Transportation and logistics services
Border administration
0 2010 30 40%
Land infrastructure
Public information on freight
Border control infrastructure
Cold storage
Centre for multi-modal logistics
E�ciency of inspections & control of other specialized agencies
Port infrastructure
Integrate inspection of agencies
Cargo monitoring
Handling equipments
E�ciency of inspections and customs control
Supply of service (routes)
Air infrastructure
Vessel cargo capacity (volume and size)
Availability of cargo insurance
Figure 5: Land Infrastructure Emerges as the Highest Priority for Country-of-Origin Performance
Note: (*) Including non-applicable answers; results are shown excluding non-applicable answer. Source: Ongoing survey

Enabling Trade: Enabling Trade in the Pacific Alliance10
Case Study 1: Land Infrastructure13
Insufficient land infrastructure with regard to transport highlights the potential benefits of liberalized cabotage legislation
Peru’s Pan-American Highway is a major route for transporting cargo domestically between the north and south. The country’s national port authority estimates that 30,000 containers are trucked from southern Peru to Callao each year for international shipping. Existing rail infrastructure is insufficient to support this traffic, and would require significant invest-ment and time to make operational. The Pan-American Highway is the only viable route to transport cargo. Inland transport costs are thus high due to lack of alterna-tives, and excessive use of the route has also led to poor road quality. In addition to increasing the prices of many domestical-ly-sourced goods for Peruvian consum-ers, these costs and delays negatively affect the competitiveness of Peruvian businesses within the Pacific Alliance and across other international markets.
One opportunity to alleviate these barriers is liberalizing the use of cabotage, permitting foreign transporters to bypass congested overland routes and move containers by sea along the Peruvian coast. Two main challenges exist for this opportunity. First, local unions are strongly opposed to reform of the existing cabo-tage legislation, which prohibits foreign companies from providing domestic transport services. By limiting competi-tion, this regulation drives up costs along these routes. The second challenge relates to infrastructure. Medium-sized Peruvian ports would require investments in order to accommodate the additional volumes from a significant cabotage development. Small feeder roads to these ports would also require investment.
Progress towards implementing this solution is being made. In 2013, Peru’s national port authority drafted an amend-ment to the national cabotage law, removing the restriction on foreign opera-tors. In support of this reform, the public and private sectors are exploring sources of funding to pursue a more detailed feasibility study of the requirements and potential impacts of the cabotage opportu-nity. First, the costs of the required invest-ments must be calculated. Negative impacts on Peruvian unions and transport-ers must also be understood, and the cost
of mechanisms to mitigate these risks needs to be estimated. These costs must then be compared with the potential upside: increased competitiveness of Peruvian businesses, leading to increased trade, economic growth and job creation.
About 26% of respondents indicate border control infrastructure as a particu-larly problematic obstacle, with 18% claiming this affects the work of the other specialized agencies. A vivid example of this problem is SaniCo, a manufacturer of disposable sanitary products such as baby diapers, sanitary napkins and wet wipes (Case Study 2).14 While specific and narrow, the SaniCo example illustrates a broader point: while maintaining border control is obviously important for many reasons, many of the inspections and controls can be improved, eliminating waste in the process. The example also hints at another, more general barrier also covered here: non-harmonized regulation across the Alliance countries.
Finally, another concern prioritized by firms regarding their own countries is public information on freight. Almost 30% of the surveyed companies indicated the lack of public information on freight as an important obstacle to trade. The lack of transparency on prices set by freight
forwarders and customs brokers adds a layer of uncertainty to the operations of importing and exporting firms. Implementing mechanisms to improve transparency of pricing should be a priority, given the large number of companies concerned about this issue.
Survey results have also been segmented according to the firms’ country of origin. For each country, the top three and top four-to-six priorities have been identified. When comparing the results across the Alliance, the same common priorities appear: inland infrastructure, border and customs control infrastructure, and public information on freight (Figure 6). The fact that these priorities are shared among all countries should create momentum and promote joint investment of focus and resources in identifying best practices from other regions.
Major obstacles in source and destination markets within the Pacific Alliance
Firms were also asked to evaluate a list of obstacles in source and destination markets within the Pacific Alliance.15 The top concern, cited by 30% of firms, was the time to process paperwork (Figure 7). Similar to Case Study 1, the experience of SaniCo in Case Study 2 illustrates a more general concern explicitly raised by many firms: the steps required to fulfil many of the regulations behind trade transactions are often painstakingly slow.
Chile Mexico* Peru* Colombia
Port infrastructure
Air infrastructure
Land infrastructure
Border control infrastructure
Centre for multi-modal logistics
Cold storage
Handling equipment
Vessel cargo capacity (volume and size)
Supply of service (routes)
Cargo monitoring
Public information on freight
Availability of cargo insurance
Efficiency of inspections and customs control
Efficiency of inspections and control of other specialized agencies
Agency inspection integration
Figure 6: Many Priorities Are Shared across Countries
Sources: Bain & Company analysis; ongoing survey Top 3 Top 4-6

11Enabling Trade: Enabling Trade in the Pacific Alliance
Case Study 2: Efficiency of Inspections and Time to Process Paperwork16
Sanitary certification requirements are not harmonized across countries, creating duplicate processes that delay entry into new markets.
SaniCo manufactures and markets disposable sanitary products such as baby diapers, incontinence briefs, sanitary napkins, trainers and wet wipes. Among other end markets, these products are sold in Peru, Ecuador and Colombia.
Peru and Colombia both require sanitary registration for most of SaniCo’s products, while Chile requires it only for sanitary wipes. The process of obtaining registra-tion is relatively efficient in Colombia, but it takes much longer in Chile (four to six months) and Peru (six to eight months).
The main reason for the longer processing periods is the difference in sanitary certification requirements across countries. Unlike the other Pacific Alliance members, Mexico does not require sanitary certification for the types of products sold by SaniCo because Mexican regulations do not deem these products to pose a significant health risk. As a result, authorities in the importing country may request a document stating that there is no sanitary registration from Mexico. In Mexico, that document must be approved locally by the Federal Commission for Protection Against Sanitary Risk and then stamped by the importing country’s embassy. This process usually takes several weeks, but can be delayed by up to two years, depending on the request. Finally, said document goes to the appropriate officials of the importing country’s government for approval. The same document must be provided every time a new product is introduced.
Aside from expediting the current process, representatives from the sanitary authorities of the Alliance countries should consider ways to avoid repetitive provision of the same document. Colombia’s officials may have best practices that could be shared with Chile and Peru. In the longer term, the countries should ideally harmonize their assessments of which products pose health risks and which do not.
4. The Road AheadBy providing insights on private-sector priorities, the objective has been to put forward relevant inputs for the Alliance countries that can be used in their integration agendas for the future. Common concerns raised in this preliminary survey are related to land transport, border and customs control, public information on freight, time to process paperwork and frequent changes in regulations. When this work is completed, robust survey results and detailed qualitative input from focus groups will provide a clearer picture of specific priorities and ideas for initiatives to drive progress. Based on this input, policy-makers and representatives from the private sector can take advantage of the World Economic Forum on Latin America in 2014 to agree on main priorities and a way forward.
It is encouraging that the Pacific Alliance Business Council is already advancing many elements of these recommendations, and concrete proposals are expected to be presented to policy-makers in early 2014. A working agenda is already in place to develop a proposal on ways to harmonize technical standards for selected productive sectors (e.g. cosmetics, pharmaceuticals, processed food products). In addition, the Business Council is working on a roadmap to reduce time and costs of exporting and importing through the interoperability of single windows within the Alliance. Moreover, in advancing work on logistics competitiveness, the Business Council is looking to reduce some of the barriers preliminarily highlighted in this report, such as by promoting transparency on freight and other logistics costs.
Continued implementation of priority initiatives can be organized through the Pacific Alliance’s existing structures, from both the public sector through the four layers of discussion groups, and the private sector through the Business Council. External organizations such as the IDB and the World Economic Forum can continue to serve useful roles as intermediaries and sources of analytical support. Through open communication and aligned incentives, the public and private sectors can work together to make the Pacific Alliance vision a reality.
Shifting from paper- to electronic-based processes is one way to reduce delays. Implementing these types of initiatives can be challenging, given the multitude of stakeholders that need to be involved and the perception that change may not be in the best interests of all parties. The “Enabling Smart Borders” section of the Enabling Trade: From Valuation to Action report provides a proposed approach to implementation in light of these challenges.
Frequent changes in regulation were cited as a concern by 24% of the firms. This is a broad issue that extends beyond trade facilitation, and a key reason why coun-tries engage in deep forms of integration. When countries collectively decide to go beyond the dismantling of tariff rates and seek to converge and harmonize the many rules (e.g. investment rules, intellec-tual property rights, technical standards), they not only pursue more compatible processes across their economies, but also effectively eliminate the need to frequently change their own regulations.
21%
24%
30%
14%
12%
0 2010 30 40%
Time to process and authorize paperwork
Frequent changes in regulation
Bureaucratic costs
Difficulties in meeting requirementsto enter the market
Differences in technical norms invarious destination markets.
Only asked to exporters
Figure 7: Time Required to Process and Authorize Paperwork: An Issue for 30% of Respondents
Note: (*) 60 exporters and 76 importers Source: Ongoing survey

Enabling Trade: Enabling Trade in the Pacific Alliance12
Appendix
Profile of the survey respondents
The survey was sent to companies that both trade within the Alliance and belong to the largest business associations in its four member countries. At the time of writing, close to 140 responses had been submitted (Figure 9). The most represented industries are food products (22% of responses) and engines, electrical equipment and parts (16%). Importers represent 56% of responses. Important caveats to the preliminary results are the sample size and skewed distribution across countries.
GD
P 2
012,
cur
rent
p
rice
s (U
S$
bill
ion)
GD
P g
row
th
2011
-12
GD
P p
er c
apita
(P
PP
*) 2
012,
cur
rent
p
rice
s (U
S$)
Gov
ernm
ent g
ross
d
ebt 2
012,
% o
f G
DP
(4)
Eas
e o
f Do
ing
B
usin
ess
2014
ra
nkin
g
Ena
blin
g Tr
ade
2012
ran
king
Trad
e o
pen
ness
(E
xpo
rts
+ Im
po
rts,
%
of G
DP
201
2)
1 2 3 5 6 7
Mexico 1,177 1.40% 15,363 43.50% 53 65 64.60%
Colombia 369 11.60% 10,671 32.60% 43 89 36.10%
Peru 199 11.50% 10,596 20.50% 42 53 43.20%
Chile 268 6.80% 18,211 11.90% 34 14 57.70%
Figure 8: Macroeconomic Figures for the Pacific Alliance
Sources: IMF (1, 2, 3, 4, 7); World Bank (5); World Economic Forum (6)
Profile of respondents(2013, in % of complete answers)
100%
80
60
40
20
0
Most frequent itemOther items
Country of origin Exporters/Importers Industry Transport mode
136 136 136 134*
Peru 11%
Mexico 25%
Chile 28%
Colombia36%
Exporters25%
Importers36%
Sea76%
Air 12%
Land 12%
Food industryproducts 22%
Engines,electricalequipment and parts 16%
Chemical and associatedindustry products 13%
Figure 9: Profile of Survey Respondents
Note: (*) 60 exporters and 76 importers Source: Ongoing survey

13Enabling Trade: Enabling Trade in the Pacific Alliance
Endnotes 1. http://alianzapacifico.net/que_es_la_alianza/valor-
estrategico/, November 2013.
2. “The Pacific Alliance Casts Its Cloud over Latin America”, August 2013, GIGA Focus International.
3. Association of American Chambers of Commerce in Latin America (AACCLA) and its affiliates in Mexico, Colombia, Peru and Chile; the Mexican Business Council for Foreign Trade, Investment and Technology (COMCE); the National Business Association of Colombia (ANDI); the Peruvian National Confederation of Private Business Institutions (CONFIEP) and the Peruvian Foreign Trade Society (COMEX Peru); and the Chilean Industrial Promotion Society (SOFOFA).
4. This call out box is a summary of two internal documents of the IDB, supporting institution to the Pacific Alliance, http://www.thepacificalliance.org/meet-the-alliance – accessed on 3 December 2013.
5. This section is an executive summary of the following report: “Perspectivas de integración productiva entre los países de la Alianza del Pacífico”, April 2013, Inter-American Development Bank, Washington DC.
6. This is called “vertical specialization” a notion that captures the idea that various countries are linked sequentially to produce a final good. For more details, see “Tracing Value-Added and Double Counting in Gross Exports” Forthcoming in American Economic Review, Koopman, Robert, Zhi Wang and Shang-Ji Wei, (2013).
7. For a more extensive analysis of the production complementarities currently seen in the Pacific Alliance, see: IDB, April 2013. “Perspectivas de integración productiva entre los países de la Alianza del Pacífico”.
8. Association of American Chambers of Commerce in Latin America (AACCLA) and its affiliates in Mexico, Colombia, Peru and Chile; the Mexican Business Council for Foreign Trade, Investment and Technology (COMCE); the National Business Association of Colombia (ANDI); the Peruvian National Confederation of Private Business Institutions (CONFIEP) and the Peruvian Foreign Trade Society (COMEX Peru); and the Chilean Industrial Promotion Society (SOFOFA).
9. Pacific Alliance survey, November 2013.
10. Respondents chose within a range from “excellent” to “very bad,” or “not applicable”. The percentage of responses that fall into the categories “very bad” and “bad” are presented in Figure 5.
11. This consolidated picture is weighted towards countries with the highest number of responses, while, in reality, priority areas may differ across countries.
12. http://www.iadb.org/en/news/news-releases/2013-10-31/transport-costs-and-exports,10621.html, accessed on 2 December 2013.
13. Interview with TerminalCo, September 2013.
14. Interview with Sanitary Co., November 2013.
15. For each dimension, respondents were asked to “qualify the following obstacles that can generate specific requirements from your source and / or destination market.” Respondents then chose within a range from “nonexistent” to “very high”. The percentages of “very high” and “high” responses are presented in Figure 7.
16. Interview with Sanitary Co., November 2013.
13Enabling Trade: Enabling Trade in the Pacific Alliance
World Economic Forum91-93 route de la CapiteCH-1223 Cologny/GenevaSwitzerland
Tel +41 (0) 22 869 1212Fax +41 (0) 22 786 2744
The World Economic Forum is an independent international organization committed to improving the state of the world by engaging business, political, academic and other leaders of society to shape global, regional and industry agendas.
Incorporated as a not-for-profit foundation in 1971 and headquartered in Geneva, Switzerland, the Forum is tied to no political, partisan or national interests

Enabling Trade: Enabling Smart Borders
January 2014
In collaboration with Bain & Company

Published by World Economic Forum, Geneva, Switzerland, 2014All rights reserved. No part of this publication may be reproduced, stored in a retrieval system, or transmitted, in any form or by any means, electronic, mechanical, photocopying, or otherwise without the prior permission of the World Economic Forum.
World Economic Forum91-93 route de la CapiteCH-1223 Cologny/GenevaSwitzerlandTel.: +41 (0) 22 869 1212Fax: +41 (0) 22 786 [email protected]
The Context of Enabling Trade: From Valuation to Action
The World Economic Forum’s Enabling Trade initiative works to reduce practical barriers to trade. The initiative’s 2013 report, Enabling Trade: Valuing Growth Opportunities, indicated that reducing supply chain barriers could increase the world’s gross domestic product (GDP) by over US$ 2.5 trillion. Building on the momentum of this finding, the 2014 report looks at how to accelerate reform. It concentrates on sectoral, regional and functional areas where the positive impacts of supply chain facilitation could be greatest, or where momentum for change is building. The four sections comprising the report are:
- Enabling Trade: From Farm to Fork
- Enabling Automotive Trade
- Enabling Trade in the Pacific Alliance
- Enabling Smart Borders
Each section is designed to be stand-alone, but the reader is nonetheless invited to become familiar with the broader Enabling Trade initiative.

Contents
5 Foreword
6 1. Introduction
7 2. Best Practices along the Path to Smarter Borders
8 3. Conclusion
10 Appendix: Case Studies
14 Acknowledgements
3Enabling Trade: Enabling Smart Borders

5Enabling Trade: Enabling Smart Borders
Foreword
Interest in better and smarter border management is at an all-time high. Driving this interest has been the need to boost economic growth and development, while maintaining high levels of compliance to guarantee the safety and security of citizens as well as the collection of revenue. Government in general, and customs more specifically, can contribute significantly to economic growth through modernization and automation, and through collaboration with other government agencies and trade, which will in turn lead to the highest levels of compliance.
At the World Customs Organization (WCO), we are committed to playing a vital role in stimulating the growth of international trade through fostering connectivity, innovation and communication, and developing global standards, instruments and tools for the modernization and automation of customs procedures.1
In all our efforts, we champion a partnership approach as one of the keys to building bridges between customs administrations and their partners, both in government and the private sector. An honest, transparent, facilitative and predictable border environment directly contributes to the economic competiveness and social well-being of states.
In addition, the current discussions at the World Trade Organization (WTO) acknowledge that efficient and effective border procedures have the potential to provide more benefits to legitimate international trade than the reduction of tariff barriers. Customs play a key role in the modernization of border management. Advance cargo information, risk management, coordinated border management and the implementation of single windows, based on harmonized international standards, enable border agencies to ensure the highest levels of compliance by focusing controls on illicit trade, thereby securing and protecting their societies while facilitating legitimate traders.
Gaozhang ZhuDirector, Enforcement and Facilitation, World Customs Organization

Enabling Trade: Enabling Smart Borders6
1. Introduction
While trade transactions are initiated long before border passage and end long after it, border administration processes are some of the most keenly felt and visible frictions. The recent deal at the WTO Ministerial Conference in Bali, Indonesia, with its emphasis on border management, reconfirmed that this is the first step to facilitating trade.
Passing the border can be one of the rare instances of direct interaction between business and government officials. Naturally, this interaction results in tensions and suggestions for improvement on both sides. In particular, business sees an opportunity for border agencies to streamline activities and adopt more sophisticated information technology (IT).
Private-sector supply chain actors are excited about the broader possibilities of greater exchange and use of supply chain data to enable new and better services. The benefits of smarter borders are clear: in Thailand, time to export decreased from 24 to 14 days as a direct result of process improvements (Figure 1). Of course, different countries are at very different stages of development in the sophistication of their border management. Progress is challenging, as implementation of existing IT solutions involves multiple stakeholders whose interests may not be aligned.
This report aims to provide both public and private actors with a clearer view of the path towards smarter borders. With this goal in mind, promising examples of progress in border administration efficiency around the world have been identified.3 Drawing from five country-based case studies – South Korea, Cambodia, Thailand, Kenya and Brazil – lessons are gleaned from their technical solutions. In addition, and potentially even more important, the case studies also provide insight on success factors when implementing those solutions.
Figure 1: Border-control Process Improvements: Thailand Reduced Time to Export by 10 Days2
Figure 2: Case Studies Reflect Varying Degrees of Progress towards Smart Borders4
Note: (*) Document preparation, customs clearance, port and terminal handling and inland transportation & handling
Sources: World Bank, Doing Business dataset; International Monetary Fund (IMF), World Economic Outlook database
Note: (*) Customs clearance and document preparation only
Source: World Bank; Doing Business dataset
Time to export*(2006-12, in # days)
Export volumes of goods(2006-12, indexed in 2006)
30
20
10
0
150
100
50
0
Time to exportExport volumes of goods
2006 2007 2008 2009 2010 2011 2012
24 24
17
14 14 14 14
Implementation of E-customs
Time to export*(2014, in # days)
30
20
10
0
Document preparationCustoms clearance
Early Stage Medium Stage Smart Border
Cambodia Kenya Brazil Thailand Costa Rica South Korea Singapore
1716
9 98
43
Improvement expected in most lengthy/complicated process; paper-based to paperless border control
Major controlling agencies needed on board for reform
Partially digitized; some functions such as inspection and payment may be manually processed
Continuous process re-engineering and system improvement
Fully digitized and integrated border management systems
Logical and systemic methods for risk management and de minimis

7Enabling Trade: Enabling Smart Borders
Irrespective of the choice made, interoperability and flexibility of the system is of great importance. The WCO Data Model provides a standard set of data elements to facilitate automated information exchange generally, including in a single-window environment, while the Globally Networked Customs programme aims to bolster information interchange between countries.
Development of IT must be accompanied by ongoing process improvements. Without an ongoing effort to redesign process and methodology, fully leveraging an IT system is not possible. South Korea is a major importer/exporter in the global economy. Efficiency is at a premium, and the Korean customs agency must continuously improve methodology and processes for border control. For example, an analysis of the customs agency demonstrated that the identity of traders is more correlated with the risk of an item being in violation than with information on the goods themselves. Furthermore, the top 1% of traders are responsible for up to 80% of total exported/imported goods. Therefore, the customs agency has changed its strategy from item-based to operator-based risk management, creating significant time savings without changing its IT infrastructure.
Digitization is a powerful tool to improve border management processes.
At relatively low cost in both financial and political terms, digitization reduces both direct compliance costs and the perception of inconvenience for smaller traders. Replacing multiple paper documents with a single electronic form can reduce border-crossing times significantly. Exchanging data electronically between stakeholders (e.g. government agencies, traders, banks) can allow more transactions at a lower cost compared to human-based systems.
One of the choices governments face in implementing new information systems is whether to develop bespoke solutions or use one of a variety of off-the-shelf systems. Such off-the-shelf systems tend to have lower maintenance and lower costs to upgrade, and may be more appropriate where fewer resources are available. The Automated System for Customs Data (ASYCUDA), provided by the United Nations Conference on Trade and Devel-opment, is used in over 90 territories; various other private-sector or government-supported systems are available on the market (e.g. MicroClear, TIMS, SOFI, TATIS, with providers including CrimsonLogic, Crown Agents and Agility). The WCO has developed ready-made systems for exchange of data and for risk management purposes, which are currently being implemented in a number of countries and are available to all 179 WCO members. Some success has occurred with port-centric systems designed to speed progress through border-crossing points, while regional systems provide another alternative to the national approach.
2. Best Practices along the Path to Smarter Borders
Different countries are at different stages of border process improvement and IT development (Figure 2). Some countries, such as South Korea, have a long history of reforming border management, resulting in fully integrated and digitized border management systems (the phase of “smart borders”). Other countries, such as Kenya and Cambodia, are still at an early stage of reform, having begun border control improvements only recently. Finally, there are those countries which have made some progress with border control reform, but which have yet to fully integrate and digitize their systems, and which are still engaged in the streamlining and automation process necessary for this step.
Donor funding appears to be fairly readily available to support reforms. For its part, the private sector is willing in some cases to provide free border management software and systems, through appropriately structured public-private partnerships in order to expand the flow of trade.
Often, however, the institutional and change-management challenges are even greater than the technical and resource constraints. In the end, systems are used by people. The underlying logic of laws and processes, combined with the realities of administrative and institutional structures, need to support efficient border management. For an overview of the border management process, see Figure 3.
Legal Compliance(Pre-declaration)
Transportmanagement
Clearancemanagement
Interface
Shipment of goods Unloading of goods Release of goods
Licensing Compliance Transport Storage Customsclearance Payment/taxes
Customs Quarantine Sanitary andphytosanitary
Standards andconsumerprotection
Radiology Ecological
Figure 3: Border Management Process
Source: Illustration from the World Economic Forum and Bain & Company

Enabling Trade: Enabling Smart Borders8
Impacts on various stakeholder groups must be understood and managed proactively. It is important to consider the potential impact of the reform on stakeholders during the design phase. Often, customs agents fail to support organizational or systemic changes because of possible job loss or financial de-incentivization. In South Korea, when fully automated screening systems were introduced for risk management, the need to manually inspect packages was reduced significantly. To counteract any negative impact on customs-agent motivation, the Korean government decided to set up performance-based incentives for staff, incentivizing agents based on the number of prohibited items identified by more targeted manual inspection.
Continuous and consistent communication with all stakeholders is critical throughout the reform process. A good example is Thailand. Whenever a new customs reform plan is introduced, the Thai government notifies stakeholders in advance and organizes meetings and seminars to disseminate information about the reform and to solicit feedback. Thus, the process is not only about informing stakeholders, but also about including them as part of new system design and working together to make the reforms successful.
For the deployment of reform, ongoing training and education of staff members is required. One option that numerous countries take is the smooth transition of operating ownership. A corporation takes initial ownership of the new system while agency staff is being trained; then, the customs agency gradually takes over operational ownership. In Kenya, the new customs system will be managed by CrimsonLogic until local staff is fully trained for takeover.
The government should put forth clear vision and direction throughout the reform. Reforms often occur when a government’s perspective on customs changes – from viewing foreign trade as an opportunity to collect revenue, to seeing it as a catalyst for promoting the local economy. However, this initial motivation must be accompanied by sustained follow-through.
The role of the private sector matters. There will always be certain functions better performed by the private sector; in each of the best practices cited here, there was at least some degree of private-sector involvement. Most commonly, private sectors act as solution providers; they assist the customs agency with developing and embedding new IT systems, and often take operating ownership at the launch until local staff are completely trained (e.g. Agility, CrimsonLogic).
Firms have another common role as knowledge providers. This is an especially important function, as risk management policies and de minimis regimes become more important methods for accelerating the border control process. And, a need develops for collaboration between government and firms to build and implement appropriate criteria and methodology. In particular, goods such as food and drugs have complex and specific compliance guidelines, thus requiring significant knowledge transfer from the private sector. For example, in Thailand, food and drug associations have helped government to develop risk management standards, which in turn have allowed local producers to benefit by exporting their items more efficiently.
Finally, the private sector often engages in the role of adviser. While the World Bank plays a leading role in this area, many private firms also contribute to the process of ensuring that optimal border-control strategies are developed and implemented.
In parallel, a shared cross-industry vision of the harmonization requirements and value of data-enabled smart logistics would help guide further needed reform of both government and private-sector processes and systems. As recommended by many international organizations, including the WCO, involving the private sector in the reform process is crucial. In recognition of the need for close interaction, work is underway in the WCO to develop more specific guidance on how to set up a proper and regular consultation mechanism between customs and other border agencies and trade.
3. ConclusionThe recent agreement in Bali by WTO member countries to prioritize trade facilitation emphasized again that accelerating customs reforms has clear benefits for both the public and private sectors. Reduced border delays mean increased trade, leading to greater flows of investment, job creation and GDP growth. Working within the best practice guidelines provided by the Organisation for Economic Co-operation and Development, World Bank, World Customs Organization and others for developing coordinated border management, governments should accelerate efforts to deploy e-customs capabilities. Where appropriate, exchange of ideas between public and private stakeholders on future e-logistics systems, and co-development through close cooperation, is valuable. Above all, strong political leadership and a clearly defined change-management process that engages all relevant stakeholders are critical to achieving the shared vision of streamlined, digitized border management.

9Enabling Trade: Enabling Smart Borders

Enabling Trade: Enabling Smart Borders10
Appendix: Case Studies
The following collection of case studies provides examples of some ongoing national customs reform and automation programmes.
Phase 1: Early stage
I. Kenya
Like many countries in 2008, Kenya was suffering from inefficient trade practices. Border procedures were slow and costly. Systems were opaque, encouraging corruption and lack of compliance. Revenues from import duties and other taxes were less than they should have been.
Recognizing this opportunity, a team from KenTrade, the Kenyan government’s trade agency, took action. Team members explored trade solutions in other countries, including Singapore and several European nations. They mapped Kenyan trade processes and consulted with stakeholders to identify roadblocks and obstacles to trade. In addition, they eliminated unnecessary procedures and re-engineered others.
Today, Kenya is close to implementing a fully automated single-window system (SWS), allowing shippers to submit all their official documents through one electronic portal. The system will ultimately create an end-to-end SWS for all maritime-, air- and road-transport entry points. Its simpler, faster procedures will enable shippers to operate more efficiently and save money; it will also improve compliance and revenue-generation for the Kenyan government. Training, piloting and roll-out of the system began in late 2013, with the team continuing to add modules, for example for payment and risk management, as each one was ready. The system is expected to be fully operational by spring 2014.
The new system is likely to make a substantial difference to Kenyan trade. Until now, shipments have taken 8-10 days to clear Kenya’s border. Once the new system is operational, clearance should take no more than 3 days. The system will also be wholly transparent, allowing shippers to track what is happening with their goods at any time. The Kenyan government expects that transparency will reduce the corruption that has plagued international trade in the past. It expects the system to help raise the country’s ranking on the annual Doing Business report issued by the International Finance Corporation and the World Bank, and to help attract foreign direct investment.
How did Kenya move so far, so fast? Five years ago, nearly every stakeholder understood that the country had much to gain from a more efficient border system; simplified processes and procedures would improve Kenya’s competitiveness in global business and would generate more revenue. Many different partners then came together to support changing the old system.
To design the new system, KenTrade engaged the Singapore Cooperative Enterprise (SCE) with a government-to-government contract, signed in October 2012, to build the Kenya Electronic Single Window System. Under the contract, SCE partnered with and subcontracted CrimsonLogic of Singapore, which specializes in developing single-window systems, to deliver the single window.
In the near future, the public and private partners supporting the system will continue to develop its potential. KenTrade is working on a business model for revenue generation, based on charging a transaction fee for each entry managed through the new system.
As in any such initiative, the leadership team experiences several challenges. Support from the government’s senior leaders was essential to encourage all the government agencies to get on board. Team members always had to deal with a large number of stakeholders (and each with its own interests), and found that continuous engagement and sensitization of each one was necessary.
II. Cambodia
Cambodia began modernizing its border procedures in 1999. Since then, it has implemented three 5-year plans designed to improve the country’s position in trade facilitation, adherence to international standards, and compliance with international safety requirements. A fourth program, slated to begin in 2014, will establish a national SWS5, a single point of electronic entry for all import, export and transit-related regulatory requirements.

11Enabling Trade: Enabling Smart Borders
So far, the key reform implemented in Cambodia has been ASYCUDA World, a customs automation system. Launched in 2006, it simplifies and harmonizes customs procedures and trade documents. Funded by the World Bank, the system allows electronic processing of declarations and other documents, enables expedited clearance of goods waiting to move into or out of the country, and enhances revenue collection by the government. Dr Kun Nhem, Cambodia’s Deputy Director-General of Customs, adds that it has reduced physical inspection from about 50% of shipments to less than 20%. About 90% of single administrative document declarations are cleared within one day.
But ASYCUDA World, which is limited to customs, was always seen as one step on the path to broader trade reform, including the SWS. Today, the country’s General Directorate of Customs and Excise (GDCE) is acting as lead agency on the single-window project, with the cooperation of roughly 10 other ministries and agencies. The group includes not only the ministries of commerce and finance, but also the Port Authority and the National Bank of Cambodia.
At present, with support provided by the World Bank, the committee is working with consultants to develop the SWS business case, including specifying its primary business functions, underlying processes, options on the most appropriate operating model and IT architecture. The business case will also spell out options for the governance model and cost recovery mechanisms for the system. Other modules, such as one for e-payment that links exporters directly to banks, are under development. This process builds on the successful development and roll-out of ASYCUDA World and the customs administration’s growing capacity to manage major information and communications technology projects.
As might be expected, the ambitious venture has already encountered some obstacles. GDCE officials report that they had to overcome resistance to reform on all sides, including from customs officers and traders themselves. They have found it challenging to build the level of consensus and commitment required, and to coordinate activities among all the different agencies. They must also cope with a lack of in-depth IT knowledge and expertise among the agencies that will eventually be linked through the SWS project.
Phase 2: Medium stage
I. Thailand
For Thailand, the year 2007 was a milestone. Before then, border procedures in and out of the country were based on electronic data interchange. Though partially electronic, the process was cumbersome and time-consuming. Shippers prepared invoices, packing lists and bills of landing, and submitted them to customs officials. Officials entered the data into the system and subsequently prepared declaration forms and paperwork, indicating how much import duty was owed. Shippers paid the import duties and, as proof of payment, had to forward the payslip to customs.
Since 2007, the process has become completely electronic – a true e-import and e-export single-window system. Only restricted items undergo physical customs inspection. Every shipment of items valued at over 1,000 baht (about US$ 32) may be liable for duty, which can be paid through an electronic payments system. The system operates 24 hours a day, seven days a week. Based on a service-charge model, shippers are charged a fee for each transaction.
More than 10 government agencies have been involved in developing the new system, with Thailand’s customs department acting as lead agency. According to officials, four specific factors have contributed significantly to the system’s success:
- Clear communication. Every such reform involves not only new govern-ment policies, but also many different stakeholders. Process changes initiated by the government need to be communicated promptly to the relevant officials, giving them time to prepare before the change takes effect.
- Collaboration with logistics companies. The government has to arrange meetings and seminars with corporate partners (such as the Thai shipping association) and importing companies to inform them about upcoming plans. Government agencies and shippers work together to review the processes for both green-light and restricted shipments, based on risk-management criteria. When issues arise, they can appeal to policy-makers for guidance.
- Internal-external IT collaboration. Internal customs IT staff participate in the development of new systems. Certain systems or modules may be put out for bid to IT-system providers, who work with responsible officials to develop solutions.
- Sector-specific knowledge transfer. For example, the food and drug association provides a database that facilitates inspection of food and drugs.
Beginning in 2014 or 2015, Thailand expects to integrate its national single-window system with the Regional single-window system created by the Association of Southeast Asian Nations (ASEAN).6 In the case of a shipment from Singapore to Thailand, for example, one system would integrate all the necessary information about that shipment; it would advise the shipper in Singapore exactly what was required for the shipment to be released in Thailand.
II. Brazil
Brazil boasts Latin America’s largest economy, one of the fastest-growing in the world. To stimulate further growth, the country is launching an initiative to create a broad single-window system encom-passing every process related to interna-tional trade. The new plan aims to build a unified system for goods flowing both in and out of the country. It will create a single interface for importers, exporters, administrative agencies and all other foreign-trade stakeholders. Officials say the first step in the initiative will be under way shortly.
Currently, both importers and exporters must submit the same information on paper documents to a variety of different agencies. Exports typically take 13 days to clear the bureaucracy, while imports require 17 days. The new plan will streamline and automate these procedures, reducing time-to-export to 4 days and time-to-import to 6 days. It will also achieve a variety of other goals:
- Transparency: guaranteeing shared access to all indicators regarding processes and information flows
- Integration: bringing every relevant agency into the single-window system
- Simplification: including easier tools for access to information and rules
- User focus: providing trade participants with real-time consultation on, for example, trade flows and regulations

Enabling Trade: Enabling Smart Borders12
Overall, Brazil expects the reform to be particularly beneficial for the nation’s small and medium-sized enterprises, many of which currently find it too complicated and costly to participate in international trade.
The task has been challenging: most people working for these agencies have done their job their own way for a long time, and few have a broad view of the overall trade picture. “The challenge is not only to change the regulatory framework, but also mindsets and habits,” said one senior official. “It’s much more an issue of managing change than of resources and technical issues.” To maintain agencies’ involvement and participation over the long term, planners designed five different projects and created working groups that met weekly. “Our main preoccupation was to bring these agencies together and help them understand that we’re here to strengthen their competencies and not kill them. They have to feel part of the project.”
Brazil believes that the participation of corporate partners in the new system is essential. By assisting the group involved with reforming customs, the private sector is helping to build the systems and integrate users’ perspectives. Brazil is also linking the project to development plans and investments in infrastructure, such as airports, ports and roads. The goal is to link the “soft” logistics of border-adminis-tration reform with the “hard” logistics of physical infrastructure to create speedy, efficient processes at every trade point. The full system, expected to be finished in 2016 or soon thereafter, will contribute to developing Brazil’s international trade and thus help the country’s economy maintain its healthy growth.
Phase 3: Smart borders
Korea
Korea’s UNI-PASS is a single-window, electronic customs-clearance system for both sea and air cargo. It integrates customs clearance, cargo management and duty payment for imports and exports.
The UNI-PASS system incorporates advanced technological features. When containers are released from a seaport, for example, a radio-frequency identification (RFID) is attached to each one. The system then tracks the container’s location and information. In addition, import companies’ enterprise-resource-planning systems are linked to UNI-PASS. When shippers release goods from a warehouse, they enter the necessary information into the system so that the Korean Customs Service does not have to wait until shipments arrive at destination ports or terminals. Imports require only about 1.5 hours to clear customs, and exports only 1.5 minutes. Duty drawback takes only about 5 minutes, and tax payments 10 minutes.
The customs service found several tactics helpful in managing the change to a single-window system. For example, when the customs office introduced new risk-selection criteria for the automated risk-management system, it also incentivized customs agents according to the number of risky items they found. The incentive plan received positive reactions from customs officers and encouraged buy-in to the new system. Customs officers were less tempted to engage in corrupt practices.
Korea also avoided a problem that has plagued many nations – the resistance by customs officers to the introduction of automated systems, out of fear for their jobs. The customs service has maintained the same staffing level for the past ten years. During that time, the quantity of goods going through customs has risen more than tenfold. The increase in productivity has allowed the agency to process more shipments while maintaining an agent’s job security.
The customs service has mounted an ongoing effort to improve the operation of the system. In the past, for instance, agency customs focused on controlling shipped items to identify potential risks. But this process has been changed to control the identity of the importer or exporter, as this is the main factor determining an item’s risk. Today, the customs agency maintains an integrated risk-management system with an electronic database of shippers, reducing procedures for reliable shippers and applying strict inspections for riskier ones.
The agency is contemplating another reform – the fourth generation of UNI-PASS – that would make the system accessible on any kind of device. By 2016, users of mobile devices or any other device providing internet connection should be able to access the system. UNI-PASS has not only streamlined trade procedures, reducing costs and increasing Korea’s international competitiveness, but has also increased transparency of border administration and contributed to national revenue through detecting illegal trade and tax evasion. It is one significant step on Korea’s road to e-government.

Endnotes 1. Examples include Revised Kyoto Convention, enterprise
resource planning (ERP), SAFE Framework of Standards, Data Model, Risk Management Compendium, Single Window Compendium, Coordinated Border Management Compendium (currently under review).
2. Doing Business dataset (World Bank), IMF World economic Outlook database, includes time for document preparation, customs clearance, port and terminal handling and inland transport and handling.
3. In addition to these six case studies, bright spots of progress in border administration are found in Singapore and Costa Rica. See the 2013 “Enabling Trade: Valuing Growth Opportunities” report for additional details on Singapore (www3.weforum.org/docs/WEF_SCT_EnablingTrade_Report_2013.pdf) and the 2012 Global Enabling Trade Report for details on Costa Rica (http://www.weforum.org/reports/global-enabling-trade-report-2012).
4. Doing Business dataset – World Bank, includes time for customs clearance and document preparation only as time required for terminal and inland handling is relevant to development of transport infrastructure.
5. http://www.mpwt.gov.kh/externalfund/sccp/pdf/Apr%202012/IT%20Report.pdf.
13Enabling Trade: Enabling Smart Borders

World Economic Forum91-93 route de la CapiteCH-1223 Cologny/GenevaSwitzerland
Tel +41 (0) 22 869 1212Fax +41 (0) 22 786 2744
The World Economic Forum is an independent international organization committed to improving the state of the world by engaging business, political, academic and other leaders of society to shape global, regional and industry agendas.
Incorporated as a not-for-profit foundation in 1971 and headquartered in Geneva, Switzerland, the Forum is tied to no political, partisan or national interests
Enabling TradeFrom Valuation to Action
January 2014
In collaboration with Bain & Company
Foreword
In an interconnected world faced with both challenges and opportunities, enabling and growing trade is a key component in creating economic, social and environmental successes.
Last year’s Enabling Trade: Valuing Growth Opportunities report demonstrated that reducing supply chain barriers is a uniquely effective measure to enable global economic growth. The report explored how reducing even a limited set of supply chain barriers halfway to global best practice could increase trade by 15% and gross domestic product (GDP) by nearly 5%.
The overall benefits to nations, producers and consumers are clear. However, making it happen is not as simple – particularly because supply chains cut across multiple stakeholders, requiring collaboration and leadership that goes beyond local constituents and borders. Accordingly, this year’s Enabling Trade: From Valuation to Action report delves deeper into examples of practical application.
Firstly, the report explores how effective supply chains can alleviate a critical societal challenge that concerns all of us: the need to feed a growing population. Secondly, it takes a look at the automotive sector to get an industry-specific perspective. The report then turns attention towards regional trade agreements as a vehicle to achieve concrete results, specifically by observing the early progress on reducing barriers within the Pacific Alliance. And finally, it reviews border management, a key functional area with continued potential for reform.
As the report demonstrates, reasons for optimism exist, but more can be done. By removing barriers to trade, leaders have an opportunity to facilitate investment and employment in emerging markets, accelerate global economic growth and prosperity, and take real steps to reduce the substantial losses of food “from farm to fork”. Benefiting generations to come, this is an opportunity – and challenge – we should seize.
Nils S. AndersenChief Executive Officer, A.P. Moller-Maersk
Acknowledgements
Enabling Trade: From Valuation to Action is the result of collaboration among many individuals, institutions and firms. The authors are very grateful to all the firms we interviewed for their valuable contribu-tions, as well as those who reviewed materials. We would like to specifically thank A.P. Moller-Maersk, Flour Mills of Nigeria, Unilever and CHEP for their support in developing the agricultural case studies, and the Inter-American Development Bank for its leadership on the “Enabling Trade in the Pacific Alliance” section.
Project team
- Marisol Argueta, Senior Director, Head of Latin America, World Economic Forum
- Jieun Chung, Senior Manager, Supply Chain and Transport Industry, World Economic Forum
- Sean Doherty, Director, Head of Supply Chain & Transport Industry, World Economic Forum
- Fernando J. Gómez, Associate Director, Latin America, World Economic Forum
- Mark Gottfredson, Partner, Bain & Company
- Abby Gray, Case Team Leader, Bain & Company
- Gerry Mattios, Principal, Bain & Company
- Christophe Menger, Senior Associate Consultant, Bain & Company
- Alex Mitchell, Director, Head of Automotive Industry, World Economic Forum
- John Moavenzadeh, Senior Director, Head of Mobility Industries, World Economic Forum
- Philipp Sayler, Associate Director, Automotive Industry, World Economic Forum
- Dimitri Sculy-Logothéti, Senior Associate Consultant, Bain & Company
- Tania Tanvir, Senior Project Manager, Consumer Industries, World Economic Forum
Other key contributors and reviewers
- A.P. Moller-Maersk Group
- Apollo Tyres
- Audi AG
- Brazilian Ministry of Development, Industry and Foreign Trade (MDIC)
- China Association of Automobile Manufacturers
- CHEP, a Brambles Ltd company
- Deutsche Post DHL
- Flour Mills of Nigeria Plc
- Food and Agriculture Organization of the United Nations
- Hyundai Motor Company
- International Food Policy Research Institute
- KCingle-CUPIA; Korea Customs UNI-PASS & Single Window Agency
- Kenya Trade Network Agency (KENTRADE)
- Renault-Nissan Alliance
- Schaeffler Technologies AG & Co. KG
- Syngenta AG
- Unilever Plc
- Tenneco Inc.
- The Inter-American Development Bank
- The World Bank
- Transport Intelligence
- United Parcel Service, Inc. (UPS)
- Verband der Automobilindustrie
- Wal-Mart Stores, Inc.
- World Customs Organization
- World Economic Forum’s New Vision for Agriculture
- World Trade Organization
Consultative group
Finally, the authors would like to thank all the companies that generously provided interviews for the various case studies.