Embed Size (px)
Citation preview

www.enbridgepartners.com
ENBRIDGE ENERGY PARTNERS, L.P.
1100 LOUISIANA, SUITE 3300
HOUSTON, TEXAS 77002
(713) 821-2000
ENBRIDGE ENERGY PARTNERS, L.P.
EN
BR
IDG
E E
NE
RG
YP
AR
TN
ER
S, L
.P.2
00
3 A
NN
UA
LR
EP
OR
T
2 0 0 3 A N N U A L R E P O R T
UnitholderInformation
YEAR ENDED DECEMBER 31, 2003 2002
UNITS OUTSTANDING AT YEAR END (in thousands)
Class A Common 40,616 31,314Class B Common 3,913 3,913i-units 10,062 9,229
Approximate number of 70,000 48,000Unitholders at year end
CLASS A COMMON UNIT TRADING FOR YEAR
High $52.93 $46.75Low $41.70 $35.68Close $49.90 $42.15
The Partnership’s Class A Common Units are traded on the New YorkStock Exchange which is the principal market for the Partnership’sunits. All Class B Common Units are held by the General Partner andthere is no established trading market for these units. All i-units are heldby Enbridge Energy Management, L.L.C.
2004 PARTNERSHIP DISTRIBUTIONS INFORMATION
1ST Q 2ND Q 3RD Q 4TH Q
Declaration date Jan 22 Apr 26 Jul 22 Oct 22Ex-Dividend date Jan 29 May 3 Jul 29 Oct 28Record date Feb 2 May 5 Aug 2 Nov 1Payment date Feb 13 May 14 Aug 13 Nov 12
All dates are tentative until approved by the Board of Directors of theGeneral Partner.
To be entitled to a declared cash distribution, investors must havepurchased units at least one business day in advance of the Ex-Dividend date. Commencing on the Ex-Dividend date, units tradewithout entitlement to the recently declared cash distribution.
PARTNERSHIP CHARACTERISTICSEnbridge Energy Partners, L.P. is a publiclytraded master limited partnership. An invest-ment in a partnership differs in the followingsignificant ways from an investment in a corporation:
• A partner in a publicly traded partnership owns units of the partnership rather than shares of stock and receives cash distribu-tions rather than dividends. The cash dis-tributions are not taxable as long as the partner’s tax basis in the partnership exceeds zero.
• Generally, a corporation is subject to federal and state income taxes but a part-nership is not. All of the income, gains, losses and deductions of a partnership are passed through to its partners who are required to show their allocated share of these amounts on their personal incometax returns.
• In late February, unitholders (partners) are provided a tax package (Substitute Schedule K-1) required for preparation of their personal income tax returns. By comparison, a corporate stockholder typically receives a Form 1099 in late January detailing required tax data.
STOCK EXCHANGEThe Partnership’s Class A Common Unitsare traded on the New York Stock Exchangeusing ticker symbol EEP.
The shares of Enbridge Energy Manage-ment, L.L.C., exist one for one with thePartnership’s i-units and trade on the NewYork Stock Exchange, using ticker symbolEEQ.
TRANSFER AGENT AND REGISTRAREnbridge Energy Partners L.P.c/o Mellon Investor ServicesP.O. Box 3315So. Hackensack, NJ 07606Telephone: (888) 749-9483TDD:(800) 231-5469 (Hearing Assisted)
Internet:www.mellon-investor.com
INDEPENDENT ACCOUNTANTSPricewaterhouseCoopers LLP1201 Louisiana, Ste. 2900Houston, Texas 77002
INFORMATIONInternetwww.enbridgepartners.com
Tax WebInvestor tax information (SubstituteSchedule K-1) is available via thePartnership Internet site.
Tax Call CenterToll Free: (800) 525-3999E-mail:[email protected]
Investor RelationsToll Free: (866) 337-4636
(866) EEP INFOFacsimile: (713) 821-2230E-mail:[email protected]
Media InquiriesTelephone: (713) 821-2253Facsimile: (713) 821-2230E-mail:[email protected]
E N B R I D G E E N E R G Y P A R T N E R S , L . P .2 0 0 3 A N N U A L R E P O R T
TORONTO
HOUSTON
CALGARY
Enbridge Energy Partners Systems
Enbridge Inc. Systems and Joint Ventures
Enbridge Energy Partners, L.P. (The Partnership) is a publicly-traded
master limited partnership that owns crude oil, liquid petroleum and natural
gas midstream businesses in the United States. Its liquids business is generally
conducted through ownership of the U.S. portion of the world’s longest liquid
petroleum pipeline, which transports crude oil and liquid petroleum primarily
from reserves in western Canada and the northern United States to refining
centers in the U.S. Midwest and Ontario, Canada. The Partnership’s natural
gas business consists of gathering, transmission, processing, treating and
marketing subsidiaries operating in the Mid-Continent and Gulf Coast areas.
Enbridge Energy Company, Inc. (“Enbridge Energy”) is the General Partner,
and through agreements with affiliates, operates the systems owned by the
Partnership. Enbridge Energy, through its direct interest in the Partnership and
through its interest held in Enbridge Energy Management, L.L.C. (“EEQ” on the
NYSE), holds an approximate 12% interest in the Partnership. The remaining
interests are held by approximately 70,000 unitholders, and Enbridge Energy
Management, L.L.C. The Partnership’s Class A Common Units are traded on
the New York Stock Exchange under the symbol “EEP”.

150.0
100.0
50.0
0 .02003 2002 2001 19992000
Net Income(dollars in millions)
4.00
3.80
3.60
3 .40
3 .20
3.002003 2002 2001 1999
Annual Distributions(per unit in dollars)
2000
1,500
1,400
1300
1,2002000 1999200120022003
1,600
1,500
1,400
1,300
1,2002003 2002 2001 19992000
Natural Gas Deliveries(Btu/d in billions)
Liquids Deliveries(bpd in thousands)
E N B R I D G E E N E R G Y P A R T N E R S , L . P .
Year Ended December 31, 2003 2002 2001 2000 1999
Financial (dollars in millions)
Operating revenue $ 3,172.3 $ 1,185.5 $ 342.3 $ 307.0 $ 314.0Operating Income 194.3 138.0 97.8 117.9 131.7Net Income 111.7 78.1 38.9 60.2 78.7
Per Unit (in dollars)
Net Income 1.93 1.76 0.98 1.78 2.48Cash distributions 3.70 3.60 3.50 3.50 3.49
Operating
Deliveries Liquids Transportation (thousands of bpd)Lakehead System 1,354 1,302 1,315 1,338 1,369North Dakota System* 69 69 64 – –
1,423 1,371 1,379 1,338 1,369Deliveries Natural Gas Systems (MMBtu)
Major Transmission Systems 631 660** – – –Major Gathering Systems 873 767** – – –
1,504 1,427 – – –* Includes transmission system only
** The full year volume data for 2002 is shown for information purposes and includes data from the records of the previous owner, the General Partner.
Financial and Operating Highlights
1

FellowUnitholders
Our strategies served Enbridge Energy Partners, L.P. well during 2003.
Our disciplined growth strategy, steadfast focus on strong business funda-
mentals and our unwavering commitment to operational excellence and
corporate responsibility laid a foundation for 2004 and beyond to achieve
the long-term value you expect from your investment.
We have progressed by building on the strength of our core businesses — Liquids Transportation and Natural Gas Gathering, Processing andTransportation. During 2003, we:
• Grew earnings per unit to $1.93 compared with $1.76 in 2002.
• Increased operating income by approximately 40% to $194.3 million, from $138.0 million, in 2002.
• Announced two significant acquisitions, totaling approximately $365 million, which will contribute to unitholder value.
In conjunction with Enbridge Inc., we rolled outa multi-step plan that will greatly expand access by U.S. refineries to growing crude oil supplies produced in the Alberta oil sands. Our LakeheadSystem is a key link in the transportation path.
2003 Performance Continued to Deliver Value
I am pleased with our progress during 2003.Enbridge Partners reported net income in 2003 of $111.7 million ($1.93 per unit) compared with $78.1 million ($1.76 per unit) in 2002. This improve-ment was largely attributable to a full year’s contribution from the natural gas systems acquiredfrom Enbridge Inc. in October 2002, as well asstronger performance on the Lakehead and EastTexas Systems.
The Partnership benefited from long-anticipatedincreases in throughput on the Lakehead System as production from Alberta’s oil sands expandedduring 2003. For the full year, deliveries averaged1.35 million barrels per day (bpd) compared to 1.30 million bpd during 2002. Lakehead deliv-eries averaged 1.46 million bpd during the fourth quarter of 2003, 9% higher than the 1.34 millionbpd recorded for the same period in 2002. This marked the first time since 1998 that averagequarterly deliveries exceeded the 1.4 million bpdthreshold; a strong positive indicator for futureLakehead System throughput.
During 2003, we successfully integrated andimproved performance of the Midcoast systems,which were acquired in October 2002. Natural gas volumes for the four largest gathering and pro-cessing systems (excluding the North TexasSystem acquired in December 2003) increasedapproximately 14% from an average of 767,000 million British thermal units (MMBtu) per day to873,000 MMBtu per day for 2003. A key contri-butor to volume growth was an increase in drillingactivity by natural gas producers due to higher natural gas prices. For the eleven major interstateand intrastate transmission pipeline systems, deliv-eries averaged 631,000 MMBtu per day for 2003 compared with 660,000 MMBtu per day for 2002.
2

E N B R I D G E E N E R G Y P A R T N E R S , L . P .
3
Competitive Strengths Support Positive Outlook
We have built a strong foundation to allow us tocapitalize on future growth opportunities.
The United States now imports nearly 63% of its total crude oil supply, with Canada the mostsecure source among the top four countries thatmeet this import demand. The Lakehead Systemdelivered approximately 64% of that Canadiancrude production to U.S. refineries. Canadianimports are expected to increase steadily in thefuture, principally due to the immense undevelopedoil reserves contained in the Alberta oil sands.
Our strategy to capitalize on this market positionis strengthened by the continued affiliation withEnbridge Inc. as demonstrated by our coordinatedefforts to expand access by U.S. refineries to growing Canadian crude oil supply. Specifically, in July 2003, Enbridge Inc. announced the acqui-sition of BP’s Cushing-to-Chicago pipeline, whichEnbridge plans to rename the “Spearhead System”.Planned reversal of this line in 2005 (subject to producer and regulatory approval) will attractincreased deliveries on the Lakehead System toChicago, the origination point of the SpearheadSystem. In October 2003, the Partnership announcedthe “Southern Access” expansion on the LakeheadSystem. This $550-$650 million pipeline is targetedfor completion in 2007 to further improve access to Canadian crude oil by refineries in America’sheartland.
A further step to expand and diversify thePartnership’s business was taken in December2003, when we announced the acquisition of crudeoil pipeline and terminal facilities from affiliates ofShell. This new “Mid-Continent System” suppliesMid-Continent area refineries with U.S. domesticand offshore crude, diversifying the Partnership’sliquids transportation cash flow beyond the histor-ical reliance on Canadian crude oil transportation.
We also implemented new commercial strategiesin the Mid-Continent and Gulf Coast to enhance theperformance of our natural gas gathering, process-ing and transportation assets. Mid-year 2003, weproposed construction of a 100-mile transmissionline in east Texas with capacity of up to 500 MMcfd.When complete in 2005, this new line will provideenhanced market access for our customers to theactive Carthage, Texas hub. On December 31, 2003,
we closed on the acquisition of the North TexasSystem, giving us an incremental 217 MMcfd ofprocessing capacity in the prolific Barnett Shaledevelopment, one of the most active onshore gasproducing regions in the United States.
I salute our employees for a job well done overthe past year. Through the efforts of our manage-ment team and exemplary workforce, we havesolidified our market presence in targeted regionsto meet energy transportation demand. Throughoperational excellence, we have delivered reliable,economical and safe service to our customers and the communities and environments where weoperate. These combined strengths will continue to deliver growth in unitholder value through core system expansions and complementary and profitable acquisitions.
We welcomed Martha Hesse as our newestboard member in March 2003. Ms. Hesse brings a great depth of industry, FERC and govern-ment experience to our Board and we appreciateher counsel.
We are excited about the opportunities aheadand are well positioned to generate superior totalreturns from a secure and growing asset base.
Dan C. Tutcher, PresidentEnbridge Energy Company, Inc.March 31, 2004

Defining the FutureThe Partnership’s broad geographic and commodity diversity positions us
to produce long-term value for our unitholders. At the end of 2003, we
owned more than 14,500 miles of crude oil, natural gas liquids, and natural
gas gathering and transmission pipelines. Our strong belief is that we
can succeed in growing the Partnership by pursuing a disciplined strategy
of profitable expansions and acquisitions that complement our asset
portfolio. Combined with committed leadership and a strong workforce,
these existing and new assets have laid a solid foundation for the Partnership
in 2003 and gives us a positive momentum in moving forward during 2004.
Disciplined Growth StrategyLast year, the Partnership focused on optimizing
existing assets and acquiring complementary sys-tems in the energy transportation sector. Today, weare securing new growth opportunities by:
• Meeting the demand of refineries in the Mid-Continent for increased access to growing Canadian crude oil supply;
• Diversifying the supply basins served by our liquids transportation business; and,
• Increasing our market presence in key natural gas production areas in Texas, including East Texas and the growing Barnett Shale development in the Fort Worth Basin.
Our core businesses include liquids transportationand natural gas assets in twenty states across theUnited States.
4
OperationalProfile

E N B R I D G E E N E R G Y P A R T N E R S , L . P .
Spanning approximately 1,900 miles across the United States, the Lakehead
System is operationally integrated with the pipeline system of Canadian
affiliate Enbridge Pipelines Inc.; and together they form the longest liquids
petroleum pipeline in the world. The combined mainline system has operated
since 1950 and spans more than 3,100 miles across North America. In 2003, the
Lakehead System transported approximately 64% of the crude oil exported
from Canada to the United States, feeding refineries in the Great Lakes region
and beyond.
The System extends to serve refineries in theProvince of Ontario through interconnects withEnbridge Pipelines at the Michigan-Canada border.The System re-enters the United States nearBuffalo, New York, and delivers crude oil throughinterconnecting pipelines to a Pennsylvania refinery.The Lakehead System has available tank storagecapacity of 14 million barrels and transported anaverage of 1.35 million barrels per day of crude oiland natural gas liquids in 2003.
In April 2003, the $195 million third phase of theTerrace expansion project was completed andincreased the Lakehead System’s delivery capacityby 140,000 bpd. In October 2003, a $41 million, 36-mile extension of one of the Chicago lines to theGriffith, Indiana terminal was completed; increasingthe Partnership’s delivery capability to Chicago-area refineries.
In October 2003, the Partnership announced further plans to expand the Lakehead System with a 630-mile pipeline from Superior, Wisconsinto Wood River, Illinois. Slated for startup in 2007, the approximate $600 million “Southern Access”
expansion project will increase capacity by 250,000to 400,000 bpd — meeting the demand of regionalrefineries for access to growing production fromAlberta’s vast oil sands reserves. The SouthernAccess project will extend the Lakehead Systembeyond Chicago, connect to Enbridge Inc.’sSpearhead System, and provide direct access to Canadian crude supplies for the large WoodRiver refinery center and beyond.
The North Dakota System consists of approx-imately 330 miles of crude oil gathering lines connected to 620 miles of transmission pipeline.During 2003, the North Dakota System trans-ported approximately 84,000 bpd of crude oil.Operational since the early 1960s, the NorthDakota System serves 36 crude oil fields in NorthDakota and Montana and has an interconnect with the affiliated Enbridge Saskatchewan Systemto transport western Canadian production. TheSystem serves the Mandan, North Dakota refineryand interconnects with the Lakehead System atClearbrook, Minnesota.
WOOD RIVER
CUSHING
CHICAGO
SUPERIOR
CLEARBOOK
BUFFALO
5
Liquids Transportation Business

The Mid-Continent System is a new addition to the Partnership’s liquids transportation port-folio. The $115 million acquisition was announcedin December 2003 and closed on March 1, 2004.The System includes the 433-mile Ozark pipeline, 47-mile West Tulsa pipeline, 8.3 million barrelCushing tank storage terminal, and 1.2 million barrel El Dorado storage terminal. Interconnectingpipelines transport crude petroleum from produc-tion fields in Oklahoma and nearby states to thePartnership’s Mid-Continent System that connectsto the Wood River refinery market.
Liquids Transportation Future OutlookStrong growth in production from Alberta’s oil
sands region is expected to continue well into thenext decade. Production rose more than 100,000bpd during 2003 with the commissioning of sev-eral oil sands projects including the Athabasca OilSands Project (AOSP). Completion of this project istangible evidence that the long-awaited growth inWestern Canadian Sedimentary Basin production ismaterializing.
In an effort to better understand the potentialfrom western Canada’s oil sands resource, Enbridgeinitiated a comprehensive study of North Americanoil markets. The study is providing important insight
and information to help further the development ofmarkets for the vast oil sands resource and corre-sponding transportation infrastructure.
The market study concluded that there are several significant adjustments needed in the infrastructure to respond to declining U.S. domes-tic production, changes in the North American refinery market structure, and increases in westernCanadian crude oil supply.
Two critical components in the plan include thepump station expansion of the Superior-to-Chicagoline underway in 2004 and the Lakehead System’sSouthern Access expansion project targeted forcompletion in 2007. The visionary plan also includesEnbridge Inc.’s Spearhead Pipeline acquisition andreversal that will benefit the Partnership as increasedsupplies are delivered from the Lakehead System tothe interconnect with Spearhead near Chicago. TheLakehead System will benefit from the expansion of Enbridge Inc.’s Toledo Pipeline which receivesdeliveries off the Lakehead System at Stockbridge,Michigan. By implementing a market strategy thatextends transportation of western Canadian pro-duction into the Mid-Continent, Enbridge is driving a change in the energy transportation landscape inAmerica’s heartland and potentially beyond.
The Alberta Oil Sands is a world-scale resource, with reserves comparable to those of Saudi Arabia. The oil sands deposits contain about 14% of the known oil reserves in the world. Northern Alberta, Canada, contains three major oil sands regions covering some 30,000 square miles. While most of North America’s crude oil production regions are maturing, the Alberta oil sands is in its initial development with cumulative production to the end of 2002 of 3.8 billion barrels and remaining established reserves of over 174 billion barrels. During 2003, the oil sands produced nearly 800,000 bpd, accounting for approxi-mately 37% of western Canadian oil production. Based on Enbridge’s annual producer survey, finalized in early 2003, the Partnershipexpects that oil sands production will grow to more than 1.5 bpd by 2010 and comprise approximately 58% of western Canadianoil production.
What are oil sands?The Alberta oil sands are naturally occurring mixtures of sand, water,clay, and approximately 12% bitumen, a tar-like petroleum oil. Thesesands can be found at varying depths, even near the surface. Near-surface deposits are mined, and the oil is then extracted from thesands using a steam extraction process. Deposits deep under-ground can be recovered through several processes, which canrange from conventional vertical pumps to technologies wheresteam or solvents are used to assist the oil flow and enhance oilrecovery. Currently, about 75% of the bitumen is upgraded into lightersynthetic crudes prior to transportation to refining markets.
AL
BE
RT
A O
IL S
AN
DS
Western Canadian Oil Production
1997 1999 2001 2003 2005 2007 2009 2011 2013
Conventional Oil
Oil Sands
FORECASTACTUAL
BPD (000)
3,000
2,500
2,000
1,500
1,000
500
-
Year
6

E N B R I D G E E N E R G Y P A R T N E R S , L . P .
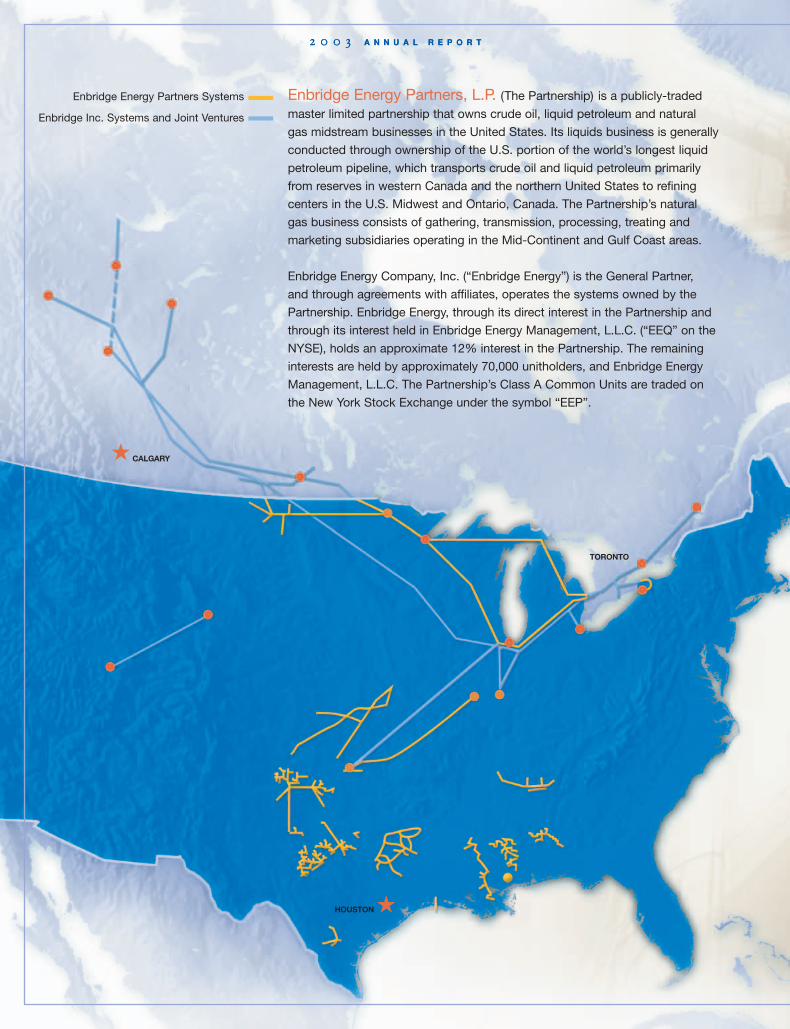
Natural Gas Business
Natural Gas Gathering and Processing The Partnership’s five largest natural gas gather-
ing and processing systems include the EastTexas, Northeast Texas, Anadarko, South Texas andnewly acquired North Texas assets.
The 2,000-mile East Texas System provides natural gas gathering, treating and processing services and receives more than 446,000 MMBtuper day. The System includes two active treatingfacilities and two active processing plants. A pro-posed expansion to the East Texas System includesa new pipeline with capacity up to 500,000 MMcfper day supplementing the transportation con-nections to the active Carthage, Texas hub. Whencomplete in 2005, the pipeline will relieve trans-portation constraints now faced by shippers withproduction from regional natural gas developments.
Adjacent to the East Texas System is thePartnership’s 1,200 mile Northeast Texas System.The System currently handles approximately133,000 MMBtu of natural gas per day — a signif-icant portion of which contains hydrogen sulfideand/or carbon dioxide and is treated before trans-porting to downstream suppliers. The NortheastTexas System has four active treating plants andtwo active natural gas processing plants in Texas.
Further north, in the Texas Panhandle and western Oklahoma, is the Partnership’s 730-mileAnadarko System. The pipeline provides naturalgas gathering, treating and processing services andcurrently handles approximately 255,000 MMBtu ofnatural gas per day.
The South Texas System includes 175 miles ofnatural gas gathering pipelines and one treatingplant. During 2003, average delivery volumes were38,000 MMBtu per day.
Acquired in December 2003, the 2,000-mileNorth Texas System primarily serves the FortWorth Basin, including growing production from theBarnett Shale zone. Natural gas throughput on theSystem currently averages approximately 198,000MMBtu per day. The System includes five activeprocessing plants.
The Partnership also conducts natural gas liquid,crude oil and carbon dioxide trucking operationsthrough ownership of Dufour Petroleum, L.P.Approximately 100 trucks and trailers and 50 railcars transport natural gas liquids, crude oil and carbon dioxide, product treating and handlingequipment. Dufour also includes more than 400,000gallons of NGL storage facilities and a CO2 pro-cessing facility.
The Partnership offers value-added natural gas gathering, treating, processing
and transportation services to customers throughout the Mid-Continent and
Gulf Coast United States. The natural gas systems collectively comprise more
than 9,000 miles of gathering and transmission pipelines, 21 active treating and
processing plants, and the Dufour Petroleum trucking and rail operations.
Enbridge Energy Partners, L.P.
South Texas
HOUSTONEast Texas
Northeast Texas
North Texas
Palo Duro
Anadarko
Kansas Pipeline
Harmony
Midla
UTOS MLGT
Dufour Petroleum, L.P.
Magnolia
BamaGas
AlaTenn
7

Natural Gas Transportation The following are the Partnership’s interstate
transmission pipeline systems regulated by theFederal Energy Regulatory Commission (FERC).
• The Midla System is a 405-mile pipeline that serves a number of large industrial markets and municipal customers.
• The UTOS System is a 30-mile, 42-inch offshore natural gas transmission pipeline.
• The AlaTenn System consists of 380 miles of pipeline serving industry users and local distri-bution companies in an eight county area in Alabama, Mississippi and Tennessee.
• The Kansas System includes a 1,100-mile gas pipeline that transports natural gas from Oklahoma and western Kansas to the metropol-itan Wichita and Kansas City markets.
The major intrastate transmission pipelinesinclude the Bamagas Pipeline, Mid-Louisiana GasTransmission Pipeline, and Magnolia Pipeline. Theintrastate systems are commercially regulated atthe state level, with some segments subject to lim-ited FERC jurisdiction.
These major interstate and intrastate trans-portation systems serve wholesale customers in theMid-Continent and Gulf Coast areas of the UnitedStates, including power plants, industrial facilities,local distribution companies, large consumersseeking an alternative to their local distribution
company and shippers of natural gas, such as producers and marketers.
Natural Gas Marketing The Partnership’s marketing affiliate provides
natural gas supply, transportation, balancing andsales services to producers and wholesale cus-tomers on the gathering, transmission and wholesalecustomer pipelines as well as interconnected third-party pipelines. Our Marketing affiliate manages its commodity risk by concurrently negotiating andexecuting gas purchase and sales agreements.
The Marketing affiliate was recognized inDecember 2003 in the reputable Mastio Natural GasStudy. In the survey, Enbridge Marketing ranked12th of 38 natural gas marketers in North Americafor quality service.
Natural Gas Future Outlook Natural gas use in the United States is expected
to continue growing by 1-2% per year, driven byenvironmental advantages of natural gas energy.
In recent years, growth in U.S. gas supply has not kept pace with growth in demand, result-ing in higher prices. Although stronger prices have stimulated drilling activities, conventional gas pro- duction in the lower 48 states continues to declinedue to the maturity of most onshore basins. Areaswhere supply growth is expected are the RockyMountain region, deepwater Gulf Coast offshore,liquefied natural gas (LNG) imports and, in the
Non-Conventional Gas SuppliesTight gas sands, gas shales and coalbed methane are all
classified as non-conventional gas sources, but the distinctionis diminishing as technology is allowing the economical pro-duction of these supply sources.
Gas shales are organic-rich rock with a major portion of thegas resource adsorbed on and within the organic matter in theshale. The shale reservoir is both the source rock and the reser-voir rock — typically covering a large geographical area.
Tight gas sands are low-permeability, gas-bearing reservoirsof a number of rock types that also tend to extend over largegeographic areas. Coalbed methane is typical of the reservesin the Rockies.
The Barnett Shale and Bossier Sand zones are two exam-ples of high-potential plays in gas shales and tight gas sands,
respectively. As one of the most active drilling plays in theUnited States with a trillion cubic feet of natural gas everyseven square miles, the Barnett Shale is the largest producing gas field in Texas and covers 15 counties in North Texas. Annualwell additions have grown four-fold in the last two years.
The Bossier Sand play has emerged as one of the premierbasins in the onshore United States. A flurry of drilling hasoccurred since 1997 as production increased from 530 to 1,800wells in 2003.
Drilling and completion techniques continue to improve, whichlead to decreased costs and increased efficiencies, causingshale gas resources to become a major factor in meeting theenergy demands of the next decade.
NA
TU
RA
L G
AS

E N B R I D G E E N E R G Y P A R T N E R S , L . P .
longer term, Alaskan gas supplies. The Partnershipwill carefully monitor developments in these areasto determine opportunities for growth that are suit-able to our risk profile.
Non-conventional gas reserves, such as coal- bed methane and shale gas, will also play a role in increasing the total available supply in the UnitedStates. The Partnership is well positioned to takeadvantage of the growth in these non-con-ventional natural gas developments. The BarnettShale, the Bossier Trend and the Granite Wash arethree of the fastest growing natural gas develop-ments in the United States and are served by thePartnership’s North Texas, East Texas and AnadarkoSystems, respectively.
With our recent acquisition of the North TexasSystem, the Partnership’s gathering and process-ing systems are virtually contiguous from theAnadarko basin in the Texas Panhandle to EastTexas. We are therefore solidly positioned to offerincreased delivery flexibility for our customers. Forexample, our proposed East Texas transmissionpipeline is initially designed to offer increasedaccess to the Carthage hub, for East Texas produc-tion. In addition, options to link North Texas andAnadarko to this delivery route will be actively pursued. The Carthage hub is expected to emergeas a premium market for producers as supply anddelivery patterns evolve in Texas.
Committed LeadershipWe have continued to do what we do best — own
and operate pipelines and other fee-for-serviceassets. The depth and breadth of our leadership isclearly evident as we continued to integrate andimprove performance of the natural gas businessesacquired initially by Enbridge Inc. in 2001 and rolledinto the Partnership in late 2002. With each newacquisition, we have further solidified our marketposition and added to distributable cash flow.
We enjoy an exemplary workforce that supports our growing business and reinforces our core valuesof Integrity, Accountability, Innovation and Flexibility,Value Creation and Corporate Responsibility. Ourcore values provide the framework for operational
excellence and reliable, competitive service to ourcustomers and contribute to long-term investorvalue. Our commitment to corporate responsibilitydefines how we relate to our stakeholders throughperformance in environment, health, safety, gover-nance, community investment and stakeholder relations. We joined Enbridge Inc. in issuing our sec-ond annual Environment Health and Safety report and are in the process of jointly issuing the renamed“Corporate Responsibility” report for 2003.
We are excited about the future we are defining forthe Partnership and the corresponding growth inlong-term value for you, our stakeholders.
Jeffrey A. Connelly,
Ernest C. Hambrook,
Patrick D. Daniel,
Dan C. Tutcher,
J. Richard Bird,
George K. Petty,
and Martha O. Hesse
The Enbridge Energy Company, Inc.
Board of Directors are: (left to right)

2 0 0 3 A N N U A L R E P O R T
UnitholderInformation
YEAR ENDED DECEMBER 31, 2003 2002
UNITS OUTSTANDING AT YEAR END (in thousands)
Class A Common 40,166 31,314Class B Common 3,913 3,913i-units 10,062 9,229
Approximate number of 70,000 48,000Unitholders at year end
CLASS A COMMON UNIT TRADING FOR YEAR
High $52.93 $46.75Low $41.70 $35.68Close $49.90 $42.15
The Partnership’s Class A Common Units are traded on the New YorkStock Exchange which is the principal market for the Partnership’sunits. All Class B Common Units are held by the General Partner andthere is no established trading market for these units. All i-units are heldby Enbridge Energy Management, L.L.C.
2004 PARTNERSHIP DISTRIBUTIONS INFORMATION
1ST Q 2ND Q 3RD Q 4TH Q
Declaration date Jan 22 Apr 26 Jul 22 Oct 22Ex-Dividend date Jan 29 May 3 Jul 29 Oct 28Record date Feb 2 May 5 Aug 2 Nov 1Payment date Feb 13 May 14 Aug 13 Nov 12
All dates are tentative until approved by the Board of Directors of theGeneral Partner.
To be entitled to a declared cash distribution, investors must havepurchased units at least one business day in advance of the Ex-Dividend date. Commencing on the Ex-Dividend date, units tradewithout entitlement to the recently declared cash distribution.
PARTNERSHIP CHARACTERISTICSEnbridge Energy Partners, L.P. is a publiclytraded master limited partnership. An invest-ment in a partnership differs in the followingsignificant ways from an investment in a corporation:
• A partner in a publicly traded partnership owns units of the partnership rather than shares of stock and receives cash distribu-tions rather than dividends. The cash dis-tributions are not taxable as long as the partner’s tax basis in the partnership exceeds zero.
• Generally, a corporation is subject to federal and state income taxes but a part-nership is not. All of the income, gains, losses and deductions of a partnership are passed through to its partners who are required to show their allocated share of these amounts on their personal incometax returns.
• In late February, unitholders (partners) are provided a tax package (Substitute Schedule K-1) required for preparation of their personal income tax returns. By comparison, a corporate stockholder typically receives a Form 1099 in late January detailing required tax data.
STOCK EXCHANGEThe Partnership’s Class A Common Unitsare traded on the New York Stock Exchangeusing ticker symbol EEP.
The shares of Enbridge Energy Manage-ment, L.L.C., exist one for one with thePartnership’s i-units and trade on the NewYork Stock Exchange, using ticker symbolEEQ.
TRANSFER AGENT AND REGISTRAREnbridge Energy Partners L.P.c/o Mellon Investor ServicesP.O. Box 3315So. Hackensack, NJ 07606Telephone: (888) 749-9483TDD:(800) 231-5469 (Hearing Assisted)
Internet:www.mellon-investor.com
INDEPENDENT ACCOUNTANTSPricewaterhouseCoopers LLP1201 Louisiana, Ste. 2900Houston, Texas 77002
INFORMATIONInternetwww.enbridgepartners.com
Tax WebInvestor tax information (SubstituteSchedule K-1) is available via thePartnership Internet site.
Tax Call CenterToll Free: (800) 525-3999E-mail:[email protected]
Investor RelationsToll Free: (866) 337-4636
(866) EEP INFOFacsimile: (713) 821-2230E-mail:[email protected]
Media InquiriesTelephone: (713) 821-2253Facsimile: (713) 821-2230E-mail:[email protected]
E N B R I D G E E N E R G Y P A R T N E R S , L . P .2 0 0 3 A N N U A L R E P O R T
TORONTO
HOUSTON
CALGARY
Enbridge Energy Partners Systems
Enbridge Inc. Systems and Joint Ventures
Enbridge Energy Partners, L.P. (The Partnership) is a publicly-traded
master limited partnership that owns crude oil, liquid petroleum and natural
gas midstream businesses in the United States. Its liquids business is generally
conducted through ownership of the U.S. portion of the world’s longest liquid
petroleum pipeline, which transports crude oil and liquid petroleum primarily
from reserves in western Canada and the northern United States to refining
centers in the U.S. Midwest and Ontario, Canada. The Partnership’s natural
gas business consists of gathering, transmission, processing, treating and
marketing subsidiaries operating in the Mid-Continent and Gulf Coast areas.
Enbridge Energy Company, Inc. (“Enbridge Energy”) is the General Partner,
and through agreements with affiliates, operates the systems owned by the
Partnership. Enbridge Energy, through its direct interest in the Partnership and
through its interest held in Enbridge Energy Management, L.L.C. (“EEQ” on the
NYSE), holds an approximate 12% interest in the Partnership. The remaining
interests are held by approximately 70,000 unitholders, and Enbridge Energy
Management, L.L.C. The Partnership’s Class A Common Units are traded on
the New York Stock Exchange under the symbol “EEP”.

www.enbridgepartners.com
ENBRIDGE ENERGY PARTNERS, L.P.
1100 LOUISIANA, SUITE 3300
HOUSTON, TEXAS 77002
(713) 821-2000
ENBRIDGE ENERGY PARTNERS, L.P.
EN
BR
IDG
E E
NE
RG
YP
AR
TN
ER
S, L
.P.2
00
3 A
NN
UA
LR
EP
OR
T

Check Out Tax Web
on
www.enbridgepartners.com
Don’t wait for your K-1 to arrive by the U.S. Postal Service! Access the tax information you need via our website as soon as it is available in lateFebruary of each year.
Here’s what you can do at this site:
• View your tax schedules for the current year• Print your tax package including instructions• Automatically transfer amounts from your Schedule K-1 to IRS forms filed by individuals• Download your K-1 information into the TurboTax software• Request changes to incorrect information
Save this card as a reminder to access your K-1 from our website.

UNITED STATESSECURITIES AND EXCHANGE COMMISSION
Washington, D.C. 20549
FORM 10-K
� ANNUAL REPORT PURSUANT TO SECTION 13 OR 15(d) OF THESECURITIES EXCHANGE ACT OF 1934
For the fiscal year ended DECEMBER 31, 2003
OR
� TRANSITION REPORT PURSUANT TO SECTION 13 OR 15(d) OF THESECURITIES EXCHANGE ACT OF 1934
For the transition period from to
Commission File Number: 1-10934
ENBRIDGE ENERGY PARTNERS, L.P.(Exact name of Registrant as specified in its charter)
Delaware 39-1715850(State or other jurisdiction of (I.R.S. Employer Identification No.)incorporation or organization)
1100 LouisianaSuite 3300
Houston, Texas 77002(Address of principal executive offices and zip code)
(713) 821-2000(Registrant’s telephone number, including area code)
Securities registered pursuant to Section 12(b) of the Act:
Title of each class Name of each exchange on which registeredClass A Common Units New York Stock Exchange
Securities registered pursuant to Section 12(g) of the Act: NONE
Indicate by check mark whether the Registrant (1) has filed all reports required to be filed bySection 13 or 15(d) of the Securities Exchange Act of 1934 during the preceding 12 months (or for suchshorter period that the Registrant was required to file such reports), and (2) has been subject to such filingrequirements for the past 90 days. Yes � No �
Indicate by check mark if disclosure of delinquent filers pursuant to Item 405 of Regulation S-K is notcontained herein, and will not be contained, to the best of the Registrant’s knowledge, in definitive proxy orinformation statements incorporated by reference in Part III of this Form 10-K or any amendment to thisForm 10-K. �
Indicate by check mark whether the registrant is an accelerated filer (as defined in Rule 12b-2 of theAct) Yes � No �
The aggregate market value of the Registrant’s Class A Common Units held by non-affiliates computedby reference to the price at which the common equity was last sold, or the average bid and asked price ofsuch common equity, as of June 30, 2003, was $1,683,394,439.
DOCUMENTS INCORPORATED BY REFERENCE: NONE

TABLE OF CONTENTS
Page
PART IItems 1. & 2. Business and Properties . . . . . . . . . . . . . . . . . . . . . . . . . . . . . . . . . . . . . . . . . 6Item 3. Legal Proceedings . . . . . . . . . . . . . . . . . . . . . . . . . . . . . . . . . . . . . . . . . . . . . 29Item 4. Submission of Matters to a Vote of Security Holders . . . . . . . . . . . . . . . . . . . . 29
PART IIItem 5. Market for Registrant’s Common Equity and Related Stockholder Matters . . . . 30Item 6. Selected Financial Data . . . . . . . . . . . . . . . . . . . . . . . . . . . . . . . . . . . . . . . . . 31Item 7. Management’s Discussion and Analysis of Financial Condition and Results of
Operations . . . . . . . . . . . . . . . . . . . . . . . . . . . . . . . . . . . . . . . . . . . . . . . . . . . 32Item 7A. Quantitative and Qualitative Disclosures About Market Risk . . . . . . . . . . . . . . 54Item 8. Financial Statements and Supplementary Data . . . . . . . . . . . . . . . . . . . . . . . . . 56Item 9. Changes in and Disagreements with Accountants on Accounting and Financial
Disclosure . . . . . . . . . . . . . . . . . . . . . . . . . . . . . . . . . . . . . . . . . . . . . . . . . . . 56Item 9A. Controls and Procedures . . . . . . . . . . . . . . . . . . . . . . . . . . . . . . . . . . . . . . . . . 56
PART IIIItem 10. Directors and Executive Officers of the Registrant . . . . . . . . . . . . . . . . . . . . . . 57Item 11. Executive Compensation . . . . . . . . . . . . . . . . . . . . . . . . . . . . . . . . . . . . . . . . . 60Item 12. Security Ownership of Certain Beneficial Owners and Management . . . . . . . . . 63Item 13. Certain Relationships and Related Transactions . . . . . . . . . . . . . . . . . . . . . . . . 64Item 14. Principal Accountant Fees and Services . . . . . . . . . . . . . . . . . . . . . . . . . . . . . . 65
PART IVItem 15. Exhibits, Financial Statement Schedules and Reports on Form 8-K . . . . . . . . . . 66Signatures . . . . . . . . . . . . . . . . . . . . . . . . . . . . . . . . . . . . . . . . . . . . . . . . . . . . . . . . . . . . . . . 67Index to Consolidated Financial Statements . . . . . . . . . . . . . . . . . . . . . . . . . . . . . . . . . . . . . . . F-1
This Annual Report on Form 10-K contains forward-looking statements. These forward-lookingstatements are identified as any statement that does not relate strictly to historical or current facts. They usewords such as ‘‘anticipate,’’ ‘‘believe,’’ ‘‘continue,’’ ‘‘estimate,’’ ‘‘expect,’’ ‘‘forecast,’’ ‘‘intend,’’ ‘‘may,’’‘‘plan,’’ ‘‘position,’’ ‘‘projection,’’ ‘‘strategy,’’ could,’’ ‘‘should,’’ or ‘‘will’’ or the negative of those terms orother variations of them or comparable terminology. In particular, statements, expressed or implied,concerning future actions, conditions or events or future operating results or the ability to generate revenue,income or cash flow are forward-looking statements. Forward-looking statements are not guarantees ofperformance. They involve risks, uncertainties and assumptions. Future actions, conditions or events andfuture results of operations may differ materially from those expressed in these forward-looking statements.Many of the factors that will determine these results are beyond the ability of the Partnership to control orpredict. For additional discussion of risks, uncertainties and assumptions, see ‘‘Items 1. & 2. Business andProperties—Risk Factors’’ included elsewhere in this Form 10-K.
2

Glossary
The following abbreviations, acronyms, or terms used in this Form 10-K are defined below:
Act . . . . . . . . . . . . . . . . . . . . . . . . . . . . . . . . . . Pipeline Safety ActAnadarko system . . . . . . . . . . . . . . . . . . . . . . . . Natural gas gathering and processing assets
located in western Oklahoma and the Texaspanhandle, which were acquired on October 17,2002
AOSP . . . . . . . . . . . . . . . . . . . . . . . . . . . . . . . . Athabasca Oil Sands ProjectBbl . . . . . . . . . . . . . . . . . . . . . . . . . . . . . . . . . . Barrel of liquids (approximately 42 U.S. gallons)Bpd . . . . . . . . . . . . . . . . . . . . . . . . . . . . . . . . . . Barrels per dayCAA . . . . . . . . . . . . . . . . . . . . . . . . . . . . . . . . . Clean Air ActCAPP . . . . . . . . . . . . . . . . . . . . . . . . . . . . . . . . Canadian Association of Petroleum Producers, a
trade association representing a majority of theLakehead system’s customers
CERCLA . . . . . . . . . . . . . . . . . . . . . . . . . . . . . . Comprehensive Environmental Response,Compensation, and Liability Act
Cdn. . . . . . . . . . . . . . . . . . . . . . . . . . . . . . . . . . Amount denominated in Canadian dollarsCold Lake . . . . . . . . . . . . . . . . . . . . . . . . . . . . . Oil sands reserves in the province of Alberta,
CanadaCWA . . . . . . . . . . . . . . . . . . . . . . . . . . . . . . . . . Clean Water ActDOT . . . . . . . . . . . . . . . . . . . . . . . . . . . . . . . . . Department of TransportationEast Texas system . . . . . . . . . . . . . . . . . . . . . . . . Natural gas gathering, treating and processing
assets in East Texas acquired on November 30,2001
Enbridge . . . . . . . . . . . . . . . . . . . . . . . . . . . . . . Enbridge Inc., of Calgary, Alberta, Canada, theultimate parent of the General Partner
Enbridge Management . . . . . . . . . . . . . . . . . . . . Enbridge Energy Management, L.L.C.Enbridge system . . . . . . . . . . . . . . . . . . . . . . . . . Canadian portion of the SystemEnbridge Pipelines . . . . . . . . . . . . . . . . . . . . . . . Enbridge Pipelines Inc.Enbridge U.S. . . . . . . . . . . . . . . . . . . . . . . . . . . Enbridge (U.S.) Inc.Energy Policy Act . . . . . . . . . . . . . . . . . . . . . . . . Energy Policy Act of 1992EES . . . . . . . . . . . . . . . . . . . . . . . . . . . . . . . . . . Enbridge Employee Services, Inc.EPA . . . . . . . . . . . . . . . . . . . . . . . . . . . . . . . . . . Environmental Protection AgencyEpu . . . . . . . . . . . . . . . . . . . . . . . . . . . . . . . . . . Earnings per unitExchange Act . . . . . . . . . . . . . . . . . . . . . . . . . . . Securities Exchange Act of 1934FASB . . . . . . . . . . . . . . . . . . . . . . . . . . . . . . . . . Financial Accounting Standards BoardFERC . . . . . . . . . . . . . . . . . . . . . . . . . . . . . . . . Federal Energy Regulatory CommissionGeneral Partner . . . . . . . . . . . . . . . . . . . . . . . . . Enbridge Energy Company, Inc., general partner
of the PartnershipHCA . . . . . . . . . . . . . . . . . . . . . . . . . . . . . . . . . High consequence areaHinshaw pipeline . . . . . . . . . . . . . . . . . . . . . . . . An intrastate pipeline that receives gas in
interstate commerce at or within the boundariesof the state and is ultimately consumed withinthat state.
HLPSA . . . . . . . . . . . . . . . . . . . . . . . . . . . . . . . Hazardous Liquid Pipeline Safety ActICA . . . . . . . . . . . . . . . . . . . . . . . . . . . . . . . . . . Interstate Commerce ActKPC . . . . . . . . . . . . . . . . . . . . . . . . . . . . . . . . . Kansas Pipeline CompanyLakehead Partnership . . . . . . . . . . . . . . . . . . . . . Enbridge Energy, Limited Partnership, a
subsidiary of the Partnership
3

Lakehead system . . . . . . . . . . . . . . . . . . . . . . . . U.S. portion of the SystemLIBOR . . . . . . . . . . . . . . . . . . . . . . . . . . . . . . . London Interbank Offered Rate—British Bankers
Association’s average settlement rate for depositsin U.S. dollars
MMBtu/d . . . . . . . . . . . . . . . . . . . . . . . . . . . . . . Million British Thermal units per dayMMcf/d . . . . . . . . . . . . . . . . . . . . . . . . . . . . . . . Million cubic feet per dayMidcoast system . . . . . . . . . . . . . . . . . . . . . . . . . Natural gas gathering, treating, processing,
transmission and marketing assets comprised ofthe Midcoast system, Northeast Texas System andSouth Texas System.
NEB . . . . . . . . . . . . . . . . . . . . . . . . . . . . . . . . . National Energy BoardNGA . . . . . . . . . . . . . . . . . . . . . . . . . . . . . . . . . Natural Gas ActNGL or NGLs . . . . . . . . . . . . . . . . . . . . . . . . . . Natural gas liquidsNGPA . . . . . . . . . . . . . . . . . . . . . . . . . . . . . . . . Natural Gas Policy ActNorth Dakota system . . . . . . . . . . . . . . . . . . . . . Liquids petroleum pipeline system in the Upper
MidwestNortheast Texas system . . . . . . . . . . . . . . . . . . . . Natural gas gathering and processing assets
acquired on October 17, 2002North Texas system . . . . . . . . . . . . . . . . . . . . . . Natural gas gathering and processing assets
acquired on December 31, 2003NYMEX . . . . . . . . . . . . . . . . . . . . . . . . . . . . . . The New York Mercantile Commodity Exchange
where natural gas futures, options contracts, andother energy futures are traded.
NYSE . . . . . . . . . . . . . . . . . . . . . . . . . . . . . . . . New York Stock ExchangeOBA . . . . . . . . . . . . . . . . . . . . . . . . . . . . . . . . . Operational balancing agreementOCSLA . . . . . . . . . . . . . . . . . . . . . . . . . . . . . . . Outer Continental Shelf Lands ActOPA . . . . . . . . . . . . . . . . . . . . . . . . . . . . . . . . . Oil Pollution ActOPS . . . . . . . . . . . . . . . . . . . . . . . . . . . . . . . . . . Office of Pipeline SafetyOSHA . . . . . . . . . . . . . . . . . . . . . . . . . . . . . . . . Occupational Safety and Health AdministrationOTC . . . . . . . . . . . . . . . . . . . . . . . . . . . . . . . . . Over-the-Counter derivatives are privately
negotiated contracts between two parties and arenot limited to restrictions of contracts traded onexchanges
PADD . . . . . . . . . . . . . . . . . . . . . . . . . . . . . . . . Petroleum Administration for Defense DistrictsPADD II . . . . . . . . . . . . . . . . . . . . . . . . . . . . . . Consists of Illinois, Indiana, Iowa, Kansas,
Kentucky, Michigan, Minnesota, Missouri,Nebraska, North Dakota, Ohio, Oklahoma, SouthDakota, Tennessee and Wisconsin
PADD III . . . . . . . . . . . . . . . . . . . . . . . . . . . . . . Consists of Alabama, Arkansas, Louisiana,Mississippi, New Mexico and Texas
PADD IV . . . . . . . . . . . . . . . . . . . . . . . . . . . . . . Consists of Idaho, Montana, Wyoming andColorado
PADD V . . . . . . . . . . . . . . . . . . . . . . . . . . . . . . Consists of Washington, Oregon, California,Arizona, Alaska, Hawaii and Nevada
Partnership Agreement . . . . . . . . . . . . . . . . . . . . Third Amended and Restated Agreement ofLimited Partnership of the Partnership
Partnership . . . . . . . . . . . . . . . . . . . . . . . . . . . . . Enbridge Energy Partners, L.P. and subsidiariesPPIFG-1 . . . . . . . . . . . . . . . . . . . . . . . . . . . . . . Producer Price Index for Finished Goods minus
1%PSA . . . . . . . . . . . . . . . . . . . . . . . . . . . . . . . . . . Pipeline Safety ActRCRA . . . . . . . . . . . . . . . . . . . . . . . . . . . . . . . . Resource Conservation and Recovery Act
4

RSPA . . . . . . . . . . . . . . . . . . . . . . . . . . . . . . . . . Research and Special Programs AdministrationSAGD . . . . . . . . . . . . . . . . . . . . . . . . . . . . . . . . Steam Assisted Gravity DrainageSEC . . . . . . . . . . . . . . . . . . . . . . . . . . . . . . . . . . Securities and Exchange CommissionSEP II . . . . . . . . . . . . . . . . . . . . . . . . . . . . . . . . System Expansion Program IISettlement Agreement . . . . . . . . . . . . . . . . . . . . A FERC approved settlement agreement, signed
October 1996SFAS . . . . . . . . . . . . . . . . . . . . . . . . . . . . . . . . . Statement of Financial Accounting StandardsSFPP . . . . . . . . . . . . . . . . . . . . . . . . . . . . . . . . . Santa Fe Pacific Pipelines, L.P., an unrelated
companySPCC . . . . . . . . . . . . . . . . . . . . . . . . . . . . . . . . . Spill Prevention, Control and CountermeasureSuncor . . . . . . . . . . . . . . . . . . . . . . . . . . . . . . . . Suncor Energy Inc., an unrelated companySyncrude . . . . . . . . . . . . . . . . . . . . . . . . . . . . . . Syncrude Canada Ltd., an unrelated companySystem . . . . . . . . . . . . . . . . . . . . . . . . . . . . . . . . The combined liquid petroleum pipeline
operations of the Lakehead system and theEnbridge system
Tariff Agreement . . . . . . . . . . . . . . . . . . . . . . . . A 1998 offer of settlement filed with the FERCTerrace . . . . . . . . . . . . . . . . . . . . . . . . . . . . . . . Terrace Expansion ProgramWCSB . . . . . . . . . . . . . . . . . . . . . . . . . . . . . . . . Western Canadian Sedimentary Basin
5
PART I
Items 1. & 2.—Business & Properties
OVERVIEW
The Partnership is a publicly traded Delaware limited partnership that owns and operates crude oiland liquid petroleum transportation assets and natural gas gathering, treating, processing, transmissionand marketing assets in the United States. The Class A common units of the Partnership are traded onthe NYSE under the symbol ‘‘EEP.’’
The Partnership was formed in 1991 by the General Partner to own and operate the Lakeheadsystem, which is the U.S. portion of a crude oil and liquid petroleum pipeline system extending fromwestern Canada through the upper and lower Great Lakes region of the United States to easternCanada. Since the Partnership’s initial public offering in 1991, it has increased its quarterly cashdistribution by 57% from $0.59 per unit to the current quarterly rate of $0.925 per unit.
The Partnership’s ownership is comprised of a 2% general partner interest and a 98% limitedpartner interest. The General Partner owns the 2% general partner interest and a 7.1% limited partnerinterest, in the form of 3,912,750 Class B common units in the Partnership. The remaining 90.9%limited partner interest is represented by a 72.7% ownership interest of 40,166,134 publicly tradedClass A common units and an 18.2% ownership interest of 10,062,170 i-units, which are wholly-ownedby Enbridge Management.
Enbridge Management is a Delaware limited liability company that was formed on May 14, 2002.Enbridge Management’s shares represent limited liability company interests and are traded on theNYSE under the symbol ‘‘EEQ.’’ Its principal asset is its 18.2% limited partnership interest in thePartnership through its ownership of i-units. Enbridge Management’s principal activity is managing thebusiness and affairs of the Partnership and its subsidiaries. Under a Delegation of Control Agreement,the General Partner delegated substantially all of its power and authority to manage the business andaffairs of the Partnership to Enbridge Management. The General Partner, through its direct ownershipof the voting shares of Enbridge Management, elects all of the directors of Enbridge Management.
Since May 2001, the Partnership has diversified its operations both geographically and by industry.The North Dakota system, acquired in May 2001, connects to the Partnership’s Lakehead system andaccessed a different crude oil supply basin in North Dakota and Montana. The East Texas system,acquired in November 2001, was the Partnership’s first entry into the natural gas gathering andprocessing business and diversified the geographic focus of the Partnership to include the southernUnited States. In October 2002, the Partnership continued its diversification through the acquisition ofthe Midcoast system, which included natural gas gathering, treating, processing, transmission andmarketing activities located in the southern United States. On December 31, 2003, the Partnershipacquired the North Texas system, a natural gas gathering and processing business in Texas.
AVAILABLE INFORMATION
The Partnership files annual, quarterly and other reports and information with the SEC under theExchange Act. You may read and copy any materials that the Partnership files with the SEC at theSEC’s Public Reference Room at 450 Fifth Street, NW, Washington, DC 20549. You may obtainadditional information about the Public Reference Room by calling the SEC at 1-800-SEC-0330. Inaddition, the SEC maintains an Internet site http://www.sec.gov that contains reports, proxy andinformation statements, and other information regarding issuers that file electronically with the SEC,including the Partnership.
The Partnership also makes available free of charge on or through its Internet websitehttp://www.enbridgepartners.com its Annual Report on Form 10-K, Quarterly Reports on Form 10-Q,Current Reports on Form 8-K and other information statements, and if applicable, amendments to
6

those reports filed or furnished pursuant to Section 13(a) of the Exchange Act as soon as reasonablypracticable after the Partnership electronically files such material with the SEC.
BUSINESS STRATEGY
The primary strategy of the Partnership is to grow cash distributions through the profitableexpansion of existing assets and through the development and acquisition of complementary businesseswith risk profiles similar to the Partnership’s current business.
A number of developments in 2003 strengthened the Partnership’s position as a crude oil carrierinto the U.S. Mid-Continent. The Partnership continues to expand the Lakehead system’s capacitythrough the construction of Terrace and the complementary expansion of pipeline facilities in theChicago area. CAPP had requested these expansions, in anticipation of future growth in crude oilproduction from the prolific Alberta oil sands. In September 2003, Enbridge purchased a crude oilpipeline that currently flows from Cushing, Oklahoma to Chicago, Illinois. Enbridge intends to reversethe direction of flow on this system, which should ultimately increase market access for Canadian crudeoil delivered on the Lakehead system. In December 2003, the Partnership announced the acquisition ofcrude oil pipeline and storage facilities in the U.S. Mid-Continent, which closed in the first quarter of2004. This acquisition is expected to be accretive to cash distributions while, at the same time,increasing the diversity of sources of crude oil, thereby reducing the Partnership’s dependence onwestern Canadian crude oil volumes.
The Partnership continues to grow its natural gas business with the acquisition of the North Texasgathering and processing system on December 31, 2003, adding to its presence in Texas. EffectiveOctober 2003, the Partnership made a decision to proceed with the construction of a pipeline toconnect its East Texas system to the Carthage, Texas hub. Carthage access is important to shippersbecause it offers a number of connections to interstate natural gas pipelines. These projects areallowing the Partnership to achieve a larger scale and geographic profile from its East Texas system toits Anadarko system in the Texas panhandle, where it can pursue commercial and operating synergiesthat will make it the operator of choice in Texas.
The Partnership will continue to analyze potential acquisitions, with a focus on crude oil, refinedproducts and natural gas pipelines, terminals and related facilities. Major energy companies have soldtheir non-strategic assets in recent years, continuing the trend of rationalization of the energyinfrastructure in the United States. The Partnership expects this trend to continue and believes it iswell positioned to participate in these opportunities. The Partnership will seek out opportunitiesthroughout the United States, particularly in the U.S. Gulf Coast area, where asset divestitures areanticipated in and around its existing natural gas gathering, processing and transportation businesses.
BUSINESS SEGMENTS
The Partnership conducts its business through four business segments: Liquids Transportation,Gathering and Processing, Natural Gas Transportation and Marketing.
• Liquids Transportation includes the operations of a common carrier pipeline and a feederpipeline, which transport crude oil and other liquid hydrocarbons.
• Gathering and Processing consists of natural gas gathering pipelines, treating plants andprocessing plants. This segment also includes the transportation of natural gas liquids, crude oiland carbon dioxide by rail and road.
• Natural Gas Transportation includes the operations of natural gas transmission pipeline systems.
• The Marketing segment provides natural gas supply, transmission and sales services forcustomers.
7

Liquid Transportation Segment
Lakehead system
The Lakehead system in the United States and the Enbridge system in Canada, which is owned byEnbridge Pipelines, a wholly-owned subsidiary of Enbridge, together form the System. The System,which spans 3,100 miles, is the longest liquid petroleum pipeline system in the world and transportscrude oil and other liquid petroleum products as a common carrier. The System is the primarytransporter of crude oil from western Canada to the United States and the only pipeline that transportscrude oil from western Canada to the province of Ontario in eastern Canada.
The System serves all the major refining centers in the Great Lakes and upper Midwest regions ofthe United States and the province of Ontario, and, through interconnects, the Patoka/Wood Riverpipeline hub located in southern Illinois. Deliveries of crude oil and NGLs from the Lakehead systemare made principally to refineries, either directly or through connecting pipelines of other companies,and serve as feedstocks for refineries and petrochemical plants.
The Lakehead system is a FERC regulated interstate common carrier pipeline system. TheLakehead system spans approximately 1,900 miles, and consists of approximately 3,300 miles of pipewith diameters ranging from 12 inches to 48 inches, 59 pump station locations with a total ofapproximately 752,000 installed horsepower and 60 crude oil storage tanks with an aggregate workingcapacity of approximately 14 million barrels. The System operates in a segregation, or batch mode. Thisoperating mode allows the Lakehead system to transport up to 45 different types of liquidhydrocarbons including light, medium and heavy crude oil (including bitumen, which is a naturallyoccurring tar-like mixture of hydrocarbons), condensate and NGLs. This flexibility increases utilizationof the system and enhances the Partnership’s ability to serve its customers.
Customers. The Lakehead system operates under month-to-month transportation arrangementswith its shippers. During 2003, 36 shippers tendered crude oil and liquid petroleum for delivery throughthe Lakehead system. These customers include integrated oil companies, major independent oilproducers, refiners and marketers.
Supply and Demand. The Lakehead system is well positioned as the primary transporter ofwestern Canadian crude oil and will benefit from the growing production of crude oil from the Albertaoil sands. As with U.S. domestic conventional crude oil production, western Canada’s conventionalcrude oil production is in decline. More than offsetting this decline is substantial growth in productionfrom Canada’s prolific oil sands resource from the WCSB.
The western Canadian oil sands are naturally occurring mixtures of sand, water, clay, andapproximately 12% bitumen. According to the Alberta Energy and Utilities Board, using existingtechnology, knowledge and economics, the remaining recoverable bitumen reserves in the province ofAlberta were estimated at the end of 2002 at approximately 174 billion barrels. This represents arecovery of approximately 10% of the initial volume in place (over 1.6 trillion barrels). The cumulativeproduction of bitumen to the end of 2002 stood at approximately 3.8 billion barrels. According toindustry sources, the economics of producing bitumen have improved substantially from the late 1970’swhen average production costs were nearly $23 per barrel (including extraction and upgrading costs).Bitumen production must be blended with lighter, less viscous materials to permit transportation viapipelines to refinery markets. Alternatively, bitumen can be upgraded into a synthetic crude oil to meetthe demand from a greater number of refineries. Recent industry estimates of the cost of producingupgraded crude oil from the bitumen deposits are $7 to $10 per barrel.
Firms involved in the development of heavy crude oil from the Alberta oil sands have investedapproximately $20.0 billion since 1995, with additional previously announced extraction or up-graderprojects valued in excess of approximately $30.0 billion over the next ten years. This could provide upto 1.5 million bpd of incremental crude oil production from western Canada. Based upon Enbridge’s
8

survey of producers, refiners and governments conducted in early 2003, the supply of western Canadiancrude oil and liquid petroleum is expected to be approximately 2.3 million bpd in 2004, 2.5 million bpdin 2005 and approximately 2.8 million bpd in 2010.
Although substantially all of the crude oil and liquid petroleum delivered through the Lakeheadsystem originates in oilfields in western Canada, the Lakehead system also receives approximately 5%of its receipts from domestic sources including:
• U.S. and Canadian production at Clearbrook, Minnesota through a connection with the NorthDakota system;
• U.S. production at Lewiston, Michigan; and
• both U.S. and offshore production in the Chicago area.
Supply from the WCSB, and hence future deliveries on the Lakehead system, is expected to growover 2003 levels. The near-term growth in supply comes from the completion of the Syncrude andSuncor oil sands expansions and full year production from the AOSP and Cold Lake expansions.Syncrude and Suncor were the original oil sands producers in northern Alberta, and AOSP and ColdLake expansions are separate producers and producing areas.
During the fourth quarter of 2003, Syncrude announced the completion of the second mining trainat its Aurora Mining site, which increases the bitumen mining capacity of the Syncrude project inpreparation for its Aurora Upgrader Expansion project. With the completion of this project, Syncrude’ssynthetic crude oil production capacity is expected to grow to approximately 350,000 bpd by 2005-2006from approximately 230,000 bpd in 2002.
Suncor began upgrading bitumen from the first phase of its Firebag in-situ oil sands developmentnear the end of 2003. Firebag phase one is expected to reach full production capacity of 35,000 bpd ofbitumen production in mid-2005. When complete, the first phase of Firebag and expanded upgraderfacilities are expected to bring Suncor’s production capacity to 260,000 bpd in 2005, compared with205,000 bpd in 2002.
The AOSP, owned by Shell Canada Limited (60%), Chevron Canada Limited (20%) and WesternOil Sands L.P. (20%) began commercial operation in June 2003. AOSP consists of oil sands mining andbitumen extraction operations in the Fort McMurray, Alberta region with transportation to the FortSaskatchewan, Alberta area for upgrading to sweet and heavy synthetic crude oil products. Productionfrom this operation averaged 122,500 bpd during initial operations in 2003. The project has a designcapacity to process 155,000 of bpd bitumen.
Imperial Oil Limited recently completed certain phases of its Cold Lake expansion project. Thisproject is expected to increase overall WCSB bitumen production by 30,000 bpd in 2004.
Based on the above noted oil sands activity and its most recent survey of crude oil shippers, thePartnership estimates that deliveries on the Lakehead system will average approximately 1.45 millionbpd in 2004, an increase of approximately 100,000 bpd over 2003. The Partnership further believes thatthe outlook for increased crude oil production in western Canada continues to be positive and willyield additional volumes. In that event, the Partnership should expect increased earnings contributionsfrom the Lakehead system. As an example, an incremental 100,000 bpd of deliveries on the Lakeheadsystem to Chicago would increase operating income by approximately $10.0 million. The Partnershipexpects that increased capacity utilization on the Lakehead system should support a significantcomponent of its future earnings growth. The timing of growth in the supply of western Canadiancrude oil will depend upon the level of crude oil prices, oil drilling activity, the development of the oilsands resource, and access to compatible markets for Canadian oil sands production.
The Partnership’s ability to increase deliveries and to expand its Lakehead system in the future willultimately depend upon numerous factors. The investment levels and related development activities by
9
crude oil producers in conventional and oil sands production directly impacts the level of supply fromthe WCSB. Investment levels are influenced by crude oil producers’ expectations of crude oil andnatural gas prices. Higher crude oil production from the WCSB should result in higher deliveries onthe Lakehead system. Deliveries on the Lakehead system are also affected by periodic maintenance,turnarounds and other shutdowns at producing plants that supply crude oil to, or refineries that takedelivery from, the System.
The Partnership forecasts that demand for WCSB production will continue to increase in PADDII, which is the U.S. Government’s designation for the area that includes the Great Lakes and Midwestregions of the United States. PADD II refinery configurations and crude oil requirements continue tobe an attractive market for western Canadian supply. According to the U.S. Department of Energy’sEnergy Information Administration, demand for crude oil in PADD II increased from approximately2.75 million bpd in 1984 to approximately 3.2 million bpd in 2002. Over that same period, productionof crude oil within PADD II decreased from over 1.0 million bpd to approximately 450,000 bpd. ThePartnership expects this gap between PADD II demand and production will continue to widen,contributing to increased demand for imports of crude oil to PADD II.
The closure of Petro-Canada’s Oakville, Ontario refinery in late 2004, is expected to result in adecline in the volume of crude oil delivered by the Lakehead system to the province of Ontario and acorresponding increase in deliveries into the PADD II market. Following the announced refineryclosure, Lakehead system deliveries into Ontario are expected to remain relatively constant.
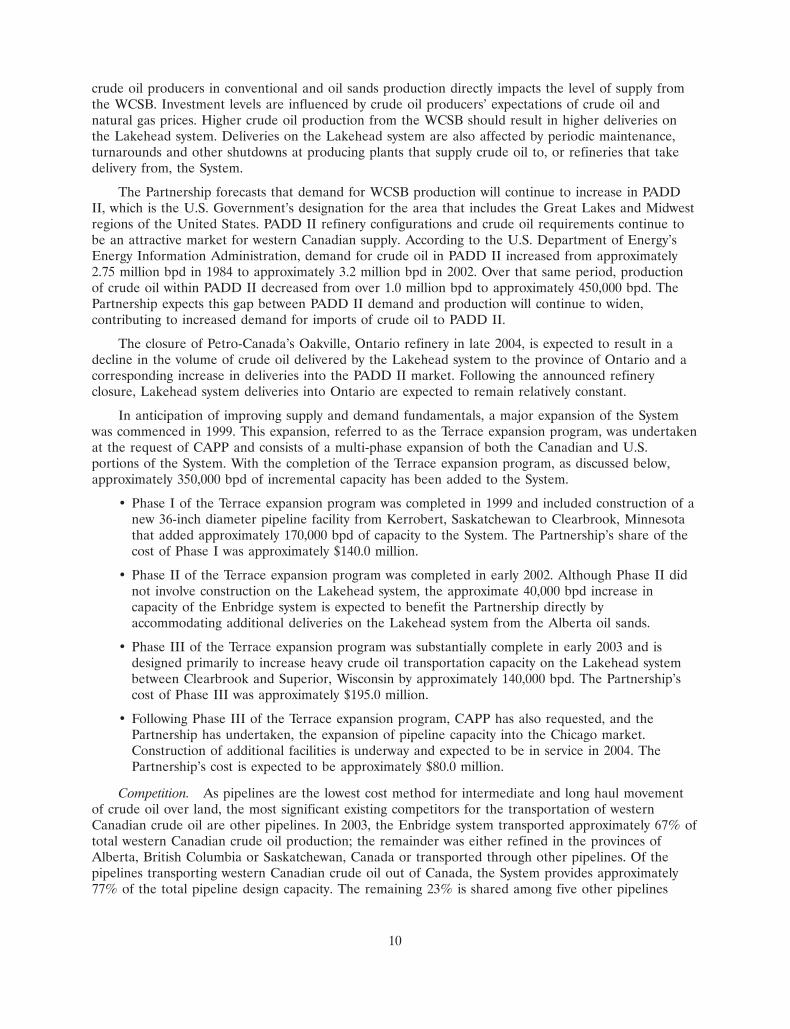
In anticipation of improving supply and demand fundamentals, a major expansion of the Systemwas commenced in 1999. This expansion, referred to as the Terrace expansion program, was undertakenat the request of CAPP and consists of a multi-phase expansion of both the Canadian and U.S.portions of the System. With the completion of the Terrace expansion program, as discussed below,approximately 350,000 bpd of incremental capacity has been added to the System.
• Phase I of the Terrace expansion program was completed in 1999 and included construction of anew 36-inch diameter pipeline facility from Kerrobert, Saskatchewan to Clearbrook, Minnesotathat added approximately 170,000 bpd of capacity to the System. The Partnership’s share of thecost of Phase I was approximately $140.0 million.
• Phase II of the Terrace expansion program was completed in early 2002. Although Phase II didnot involve construction on the Lakehead system, the approximate 40,000 bpd increase incapacity of the Enbridge system is expected to benefit the Partnership directly byaccommodating additional deliveries on the Lakehead system from the Alberta oil sands.
• Phase III of the Terrace expansion program was substantially complete in early 2003 and isdesigned primarily to increase heavy crude oil transportation capacity on the Lakehead systembetween Clearbrook and Superior, Wisconsin by approximately 140,000 bpd. The Partnership’scost of Phase III was approximately $195.0 million.
• Following Phase III of the Terrace expansion program, CAPP has also requested, and thePartnership has undertaken, the expansion of pipeline capacity into the Chicago market.Construction of additional facilities is underway and expected to be in service in 2004. ThePartnership’s cost is expected to be approximately $80.0 million.
Competition. As pipelines are the lowest cost method for intermediate and long haul movementof crude oil over land, the most significant existing competitors for the transportation of westernCanadian crude oil are other pipelines. In 2003, the Enbridge system transported approximately 67% oftotal western Canadian crude oil production; the remainder was either refined in the provinces ofAlberta, British Columbia or Saskatchewan, Canada or transported through other pipelines. Of thepipelines transporting western Canadian crude oil out of Canada, the System provides approximately77% of the total pipeline design capacity. The remaining 23% is shared among five other pipelines
10
transporting crude oil to British Columbia, Washington, Montana and other states in the northwesternUnited States.
To address growing demand in the PADD IV and Puget Sound Area of PADD V, severalexpansions of these competing pipeline systems have been announced. Competing pipelines are ownedby Terasen Inc. and transport crude oil from Alberta to British Columbia and Washington Statethrough the Trans Mountain pipeline and from Alberta to the PADD IV region of the U.S. through theExpress pipeline.
Terasen Inc. has stated that it plans to apply to the NEB for approval to increase the capacity ofits Trans Mountain pipeline from approximately 188,100 bpd to 214,500 bpd. It is anticipated that thisexpansion will be in service during the third quarter of 2004.
Terasen Inc. has also announced plans to proceed with the expansion of the Express pipelinesystem from current capacity of 172,000 bpd to 280,000 bpd. Terasen Inc. expects this expansion to bein service by April 2005.
Another competitor, Inter Pipeline Fund, has announced a commercial agreement with fourshippers to increase southbound capacity on its Bow River pipeline by 17,000 bpd. This systemtransports western Canadian crude to markets in Montana. Inter Pipeline Fund expects the newfacilities will be in place by May 1, 2004.
The pipeline expansions into PADD IV are in line with management expectations as the PADD IVregion indigenous supply continues to decline. Management expects the growing supply from WesternCanada to substantially exceed the impact requirements of the PADD IV region, leaving the balance tobe transported on the Lakehead system.
In the United States, the Lakehead system encounters competition from other liquid petroleumpipelines and other modes of transportation delivering crude oil and refined products to the refiningcenters of Minneapolis-St. Paul, Minnesota; Superior, Wisconsin; Chicago, Illinois; Detroit, Michigan;Toledo, Ohio; and the Patoka/Wood River area in southern Illinois.
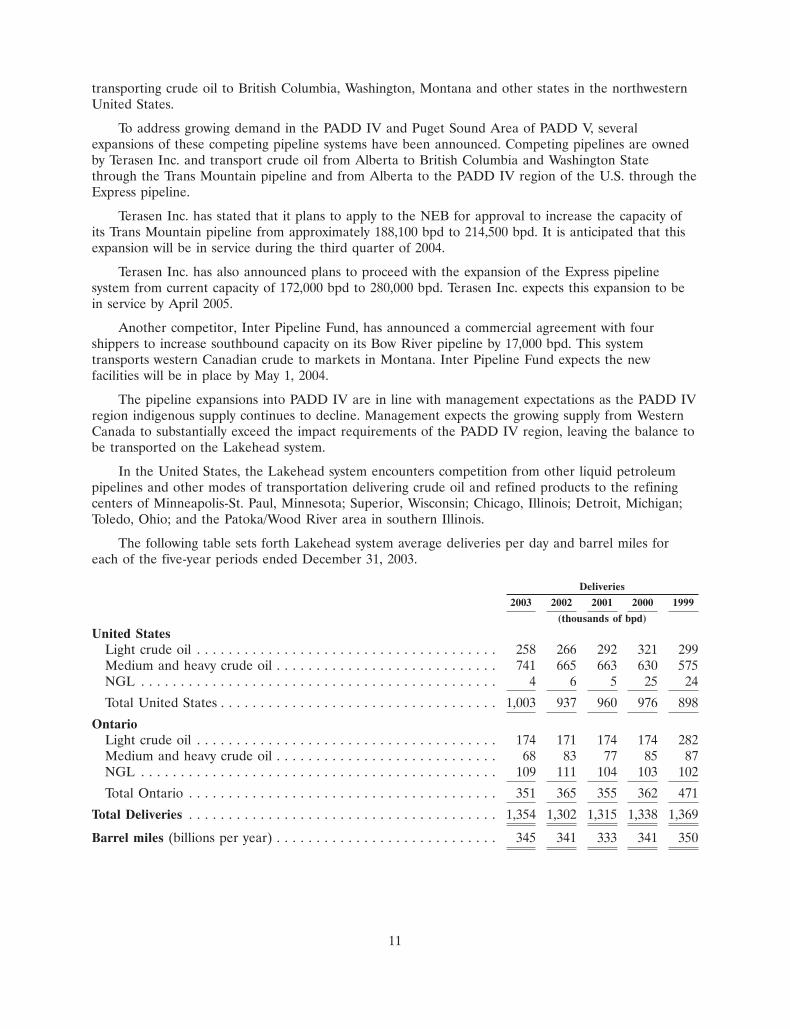
The following table sets forth Lakehead system average deliveries per day and barrel miles foreach of the five-year periods ended December 31, 2003.
Deliveries
2003 2002 2001 2000 1999
(thousands of bpd)
United StatesLight crude oil . . . . . . . . . . . . . . . . . . . . . . . . . . . . . . . . . . . . . . 258 266 292 321 299Medium and heavy crude oil . . . . . . . . . . . . . . . . . . . . . . . . . . . . 741 665 663 630 575NGL . . . . . . . . . . . . . . . . . . . . . . . . . . . . . . . . . . . . . . . . . . . . . 4 6 5 25 24
Total United States . . . . . . . . . . . . . . . . . . . . . . . . . . . . . . . . . . . 1,003 937 960 976 898
OntarioLight crude oil . . . . . . . . . . . . . . . . . . . . . . . . . . . . . . . . . . . . . . 174 171 174 174 282Medium and heavy crude oil . . . . . . . . . . . . . . . . . . . . . . . . . . . . 68 83 77 85 87NGL . . . . . . . . . . . . . . . . . . . . . . . . . . . . . . . . . . . . . . . . . . . . . 109 111 104 103 102
Total Ontario . . . . . . . . . . . . . . . . . . . . . . . . . . . . . . . . . . . . . . . 351 365 355 362 471
Total Deliveries . . . . . . . . . . . . . . . . . . . . . . . . . . . . . . . . . . . . . . . 1,354 1,302 1,315 1,338 1,369
Barrel miles (billions per year) . . . . . . . . . . . . . . . . . . . . . . . . . . . . 345 341 333 341 350
11
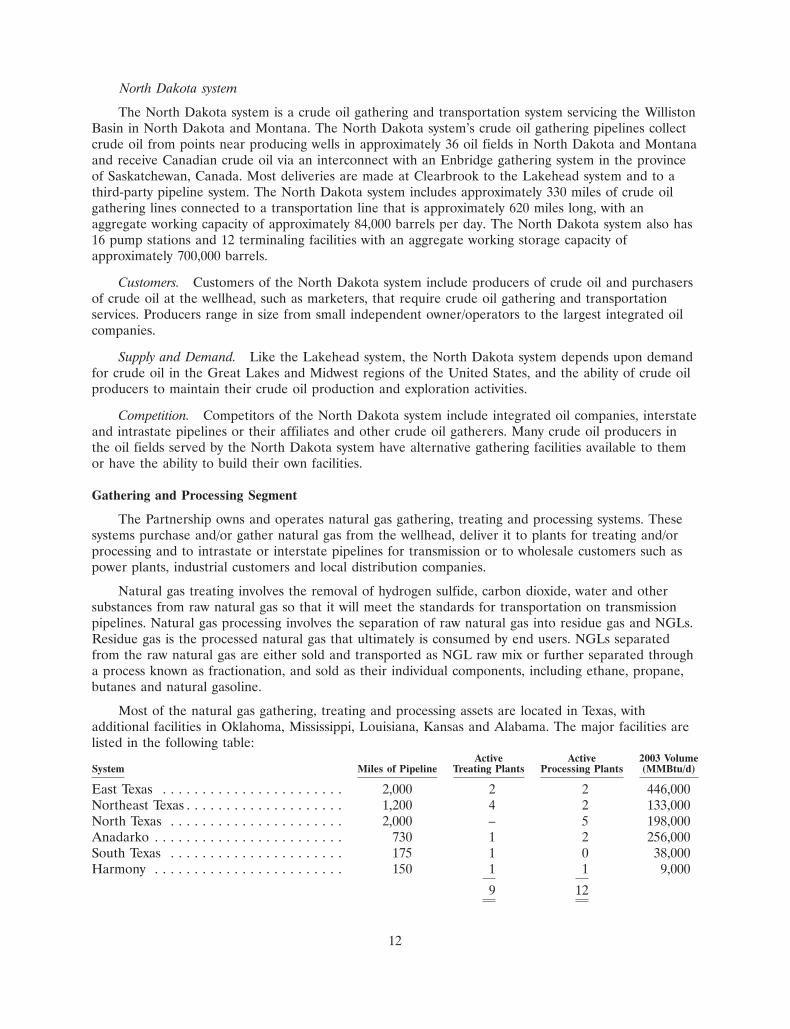
The North Dakota system is a crude oil gathering and transportation system servicing the WillistonBasin in North Dakota and Montana. The North Dakota system’s crude oil gathering pipelines collectcrude oil from points near producing wells in approximately 36 oil fields in North Dakota and Montanaand receive Canadian crude oil via an interconnect with an Enbridge gathering system in the provinceof Saskatchewan, Canada. Most deliveries are made at Clearbrook to the Lakehead system and to athird-party pipeline system. The North Dakota system includes approximately 330 miles of crude oilgathering lines connected to a transportation line that is approximately 620 miles long, with anaggregate working capacity of approximately 84,000 barrels per day. The North Dakota system also has16 pump stations and 12 terminaling facilities with an aggregate working storage capacity ofapproximately 700,000 barrels.
Customers. Customers of the North Dakota system include producers of crude oil and purchasersof crude oil at the wellhead, such as marketers, that require crude oil gathering and transportationservices. Producers range in size from small independent owner/operators to the largest integrated oilcompanies.
Supply and Demand. Like the Lakehead system, the North Dakota system depends upon demandfor crude oil in the Great Lakes and Midwest regions of the United States, and the ability of crude oilproducers to maintain their crude oil production and exploration activities.
Competition. Competitors of the North Dakota system include integrated oil companies, interstateand intrastate pipelines or their affiliates and other crude oil gatherers. Many crude oil producers inthe oil fields served by the North Dakota system have alternative gathering facilities available to themor have the ability to build their own facilities.
Gathering and Processing Segment
The Partnership owns and operates natural gas gathering, treating and processing systems. Thesesystems purchase and/or gather natural gas from the wellhead, deliver it to plants for treating and/orprocessing and to intrastate or interstate pipelines for transmission or to wholesale customers such aspower plants, industrial customers and local distribution companies.
Natural gas treating involves the removal of hydrogen sulfide, carbon dioxide, water and othersubstances from raw natural gas so that it will meet the standards for transportation on transmissionpipelines. Natural gas processing involves the separation of raw natural gas into residue gas and NGLs.Residue gas is the processed natural gas that ultimately is consumed by end users. NGLs separatedfrom the raw natural gas are either sold and transported as NGL raw mix or further separated througha process known as fractionation, and sold as their individual components, including ethane, propane,butanes and natural gasoline.
Most of the natural gas gathering, treating and processing assets are located in Texas, withadditional facilities in Oklahoma, Mississippi, Louisiana, Kansas and Alabama. The major facilities arelisted in the following table:
Active Active 2003 VolumeSystem Miles of Pipeline Treating Plants Processing Plants (MMBtu/d)
East Texas . . . . . . . . . . . . . . . . . . . . . . . 2,000 2 2 446,000Northeast Texas . . . . . . . . . . . . . . . . . . . . 1,200 4 2 133,000North Texas . . . . . . . . . . . . . . . . . . . . . . 2,000 – 5 198,000Anadarko . . . . . . . . . . . . . . . . . . . . . . . . 730 1 2 256,000South Texas . . . . . . . . . . . . . . . . . . . . . . 175 1 0 38,000Harmony . . . . . . . . . . . . . . . . . . . . . . . . 150 1 1 9,000
9 12
12
North Dakota system

In total, the Partnership has over 6,200 miles of gathering pipelines, 9 active treating plants and 12active processing plants. The active treating and processing capacities are currently over 700 MMcf/dand 600 MMcf/d respectively.
The Northeast Texas system is capable of handling sour gas, which has a high hydrogen sulfideand/or carbon dioxide and water content and which requires specialized treating processes before it canbe delivered for transportation on downstream pipelines. These treating plants are capable ofproducing approximately 1,100 long tons of sulfur per day.
The Partnership acquired the North Texas system on December 31, 2003, for approximately$249.7 million, which also includes the buyout of a capital lease of $1.9 million and transaction costs of$1.8 million. Three of the processing plants receive natural gas primarily from a conglomerateformation in the Fort Worth Basin. A fourth plant receives gas from both the conglomerate andBarnett Shale formations in the Fort Worth Basin. The fifth active processing plant processes gas on athird party pipeline under a combination of a fee-for-service and a products-sharing arrangement withthat third party pipeline. The system also includes two pipeline systems that gather lean gas in theBarnett Shale region for a fixed gathering fee. The larger of these two pipelines commenced operationin 2001 and has been growing rapidly with the expansion of the Barnett Shale production. Volume datafor 2003, noted in the table above, is derived from the records of the prior owner.
Customers. Customers of the Partnership’s gathering, treating and processing systems include bothnatural gas purchasers and producers. Purchasers include marketers and large users of natural gas, suchas power plants, industrial facilities and local distribution companies. Producers served by thePartnership’s systems consist of small, medium and large independent operators and large integratedenergy companies. The Partnership sells NGLs resulting from its processing activities to a variety ofcustomers ranging from large petrochemical and refining companies to small regional retail propanedistributors.
Supply and Demand. Supply for the Partnership’s gathering, treating and processing servicesprimarily depends upon the rate of depletion of natural gas reserves and the drilling rate of new wells.Treating services also are affected by the level of impurities in the natural gas gathered. Demand forthese services depends upon overall economic conditions and the prices of natural gas and NGLs.Three of the Partnership’s larger systems are located in basins that have experienced recent growth innatural gas land purchases, drilling and production.
The East Texas system is primarily located in the East Texas Basin. While production from mostregions within this basin have remained flat for several years, the Bossier trend within the East TexasBasin has experienced substantial growth. The Bossier trend is located on the western side of the EastTexas system. Bossier production has grown from under 200 MMcf/d in 1997 to over 800 MMcf/d in2003.
A substantial portion of natural gas on the North Texas system is produced in the Barnett Shalewithin the Fort Worth Basin Comglomerate. The Fort Worth Basin Conglomerate is a mature zone thatis experiencing slow decline. In contrast, the Barnett Shale is one of the most active natural gas plays inNorth America. While abundant natural gas reserves have been known to exist in the Barnett Shalesince the early 1980s, recent technological development in fracturing the shale formation allowscommercial production of this gas. Barnett Shale production has risen from 180 MMcf/d to 750MMcf/d since 2000 with the drilling of over 2,000 wells. Growth in this region is expected for at leastten years.
The Anadarko system is located within the Anadarko Basin. Within that basin, recent growth isoccurring in the Granite Wash play, particularly in Hemphill County, Texas.
The Partnership intends to expand its natural gas gathering and processing services through acombination of internal growth and acquisitions, which should provide exposure to incremental supplies
13

of natural gas at the wellhead, increase opportunities to serve additional customers and allow expansionof the treating and processing businesses.
Competition. Competitors of the Partnership’s gathering, treating and processing systems includeinterstate and intrastate pipelines or their affiliates and other natural gas gatherers that gather, treat,process and market natural gas or NGLs. Some of these competitors are substantially larger than thePartnership. Competition for these services varies based upon the location of gathering, treating andprocessing facilities. Most natural gas producers and owners have alternate gathering, treating andprocessing facilities available to them. In addition, they have alternatives such as building their owngathering facilities or in some cases, selling their natural gas supplies without treating and processing.In addition to location, competition also varies based upon pricing arrangements and reputation. Onthe sour gas systems, such as the Partnership’s Northeast Texas system, competition is more limited dueto the infrastructure required to treat sour gas.
Competition for customers in the marketing of residue gas is based primarily upon the price of thedelivered gas, the services offered by the seller and the reliability of the seller in making deliveries.Residue gas also competes on a price basis with alternative fuels such as crude oil and coal, especiallyfor customers that have the capability of using these alternative fuels, and on the basis of localenvironmental considerations. Competition in the marketing of NGLs comes from other NGLmarketing companies, producers/traders, chemical companies and other asset owners.
Trucking Operations
Also included in the Partnership’s Gathering and Processing segment are its trucking operations.Trucking operations include the transportation of NGLs, crude oil and carbon dioxide by truck andrailcar from wellheads to treating, processing and fractionation facilities and to wholesale customers,such as distributors, refiners and chemical facilities. In addition, the trucking operations market theseproducts. These services are provided using 105 trucks and trailers and 48 rail cars, product treatingand handling equipment and over 400,000 gallons of NGL storage facilities. In addition, a CO2 plantwith 250 tons per day of capacity, takes excess CO2 from hydrogen producers and sells it to a variety ofcustomers.
Customers. Most of the customers of the crude oil and NGL trucking operations are wholesalecustomers, such as refineries and propane distributors. The trucking operations also market products towholesale customers such as refineries and petrochemical plants.
Supply and Demand. The areas served by the Partnership’s trucking operations are geographicallydiverse, and the forces that affect the supply of the products transported vary by region. The supply ofthese products is affected by crude oil and natural gas prices and production levels. The demand fortrucking operations is affected by the demand for NGLs and crude oil by large industrial, refineries,and similar customers in the regions served by this business.
Competition. The trucking operations have a number of competitors, including other trucking andrailcar operations, pipelines, and, to a lesser extent, marine transportation and alternative fuels. Inaddition, the marketing activities of the trucking operations have numerous competitors, includingmarketers of all types and sizes, affiliates of pipelines and independent aggregators.
Natural Gas Transportation Segment
Included in this segment are the following major systems that were acquired in connection with theMidcoast system acquisition in October 2002:
• the KPC Pipeline, MidLa Pipeline, AlaTenn Pipeline, and UTOS Pipeline systems, which areFERC regulated natural gas interstate transmission pipelines; and
14

• the Bamagas Pipeline, Mid-Louisiana Gas Transmission Pipeline and Magnolia Pipeline systems,which are natural gas intrastate transmission pipelines.
Each of these pipeline systems typically consists of a natural gas transmission pipeline as well asvarious interconnects to other pipelines that serve wholesale customers.
Customers. The Partnership’s natural gas transportation pipelines serve customers in Alabama,Kansas, Louisiana, Mississippi, Missouri and Tennessee. Customers include large users of natural gas,such as power plants, industrial facilities, local distribution companies, large consumers seeking analternative to their local distribution company, and shippers of natural gas, such as natural gasproducers and marketers.
Supply and Demand. As the Partnership’s natural gas transportation pipelines generally servedifferent geographical areas, supply and demand vary in each market.
The Partnership believes that demand for natural gas in the areas served by its natural gastransportation assets generally will remain strong as a result of being located in areas where industrial,commercial or residential growth is occurring. The greatest demand for natural gas transmissionservices in the markets served by these assets occurs in the winter months.
The table below indicates the capacity in million cubic feet per day of the transmission andwholesale customer pipelines with firm transportation contracts as of December 31, 2003 and theamount of capacity that is reserved under those contracts as of that date.
Percentage Reserved Under Contractas of
Major System Capacity MMcf/d December 31, 2003
UTOS System . . . . . . . . . . . . . . . . . . . . . . . 1,200 0%MidLa System . . . . . . . . . . . . . . . . . . . . . . . 200 88%AlaTenn System . . . . . . . . . . . . . . . . . . . . . . 200 49%KPC System . . . . . . . . . . . . . . . . . . . . . . . . 160 94%Bamagas System . . . . . . . . . . . . . . . . . . . . . 450 61%
The UTOS system is a FERC-regulated offshore pipeline system with a capacity of 1.2 billion cubicfeet of natural gas per day that transmits natural gas from offshore platforms to other pipelinesonshore for further delivery. The UTOS system’s average daily throughput during 2003 was 209,000MMBtu/d. The FERC has approved the Partnership’s negotiated settlement with UTOS shippers,keeping the current rates in effect through 2006.
The MidLa, AlaTenn and Bamagas systems primarily serve industrial corridors and power plants inLouisiana, Alabama and Tennessee. Industries in the area include energy intensive segments of thepetrochemical and pulp and paper industries. The Bamagas system in northern Alabama serves twopower plants. This system is contiguous with the AlaTenn system and a third party pipeline, allowingfor operational flexibility as natural gas could flow between Bamagas and either of the other twosystems. The Partnership markets the unused capacity on these systems under both short-term firm andinterruptible transportation contracts and long-term firm transportation contracts. These systems arelocated in areas where opportunities exist to serve new industrial facilities and to make deliveryinterconnects to alleviate capacity constraints on other third party pipeline systems. The AlaTennsystem had contracts representing 21% of its capacity that terminated in 2003. Expiration of theAlaTenn contracts did not have a material impact on the business segment. As of December 31, 2003,approximately 62% of the capacity of the MidLa system is under contract to affiliated entities.
The KPC system has 82% of its capacity reserved under firm transportation contracts extendingthrough 2009 and an additional 12% of its capacity reserved under contracts extending through 2017.The KPC system’s primary customers are local distribution companies.
15

The Partnership’s long-term financial condition depends on the continued availability of natural gasfor transportation to the markets served by its systems. Existing customers may not extend theircontracts if the availability of natural gas from the Mid-Continent and Gulf Coast producing regionswas to decline and if the cost of transporting natural gas from other producing regions through otherpipelines into the areas served by the Partnership was to render the delivered cost of natural gasuneconomical. The Partnership may be unable to find additional customers to replace the lost demandor transportation fees.
Competition. Because pipelines are generally the only practical mode of transportation for naturalgas over land, the most significant competitors of the Partnership’s natural gas transportation pipelinesare other pipelines. Pipelines typically compete with each other based on location, capacity, price andreliability. Many of the large wholesale customers served by the Partnership have multiple pipelinesconnected or adjacent to their facilities. Accordingly, many of these customers have the ability topurchase natural gas directly from a number of pipelines or third parties that may hold capacity on thevarious pipelines.
Marketing Segment
The natural gas Marketing segment provides natural gas supply, transportation, balancing and salesservices to producers and wholesale customers on the Partnership’s gathering, transmission andwholesale customer pipelines, as well as interconnected third-party pipelines. In general, the Marketingsegment makes natural gas purchases from the Partnership’s gathering systems and from otherproducers and marketers. It then makes natural gas sales to wholesale customers on the Partnership’stransmission and wholesale customer pipelines. The Marketing segment also arranges transportation forwholesale customers, provides storage services, and contracts capacity on certain third-party pipelinesystems.
Natural gas purchased and sold by the Marketing segment is typically priced based upon apublished daily or monthly price index. Sales to wholesale customers incorporate a pass-through chargefor costs of transportation and generally include an additional margin.
The Marketing segment has numerous competitors, including large natural gas marketingcompanies, marketing affiliates of pipelines, major oil and gas producers, independent aggregators andregional marketing companies.
RISK FACTORS
The following risk factors should be read in conjunction with the other sections in this Report onForm 10-K.
Transportation Volumes
The Partnership’s financial performance depends to a large extent on the volume of productstransported on its pipeline systems. Decreases in the volume of products transported by thePartnership’s systems, whether caused by supply and demand factors in the markets these systems serve,or otherwise, can directly and adversely affect the Partnership’s revenues and results of operations. See‘‘Business Segments—Liquids Transportation Segment—Lakehead system—Supply and Demand’’;—‘‘Business Segments—Gathering and Processing Segment—Supply and Demand’’; and ‘‘BusinessSegments—Natural Gas Transportation Segment—Supply and Demand’’.
Regulation
The tariff rates charged by several of the Partnership’s systems are regulated by the FERC orvarious state regulatory agencies. If the Partnership’s tariffs are reduced by one of these regulatory
16

agencies on its own initiative or as a result of challenges by third parties, the profitability of thePartnership’s pipeline businesses may suffer. If the Partnership is permitted to raise its tariffs for aparticular pipeline, there may be significant delay between the time the tariff rate increase is approvedand the time that the rate increase actually goes into effect. Furthermore, competition from otherpipeline systems may prevent the Partnership from raising its tariff rates even if regulatory agenciespermit the Partnership to do so. The regulatory agencies that regulate the Partnership’s systemsperiodically propose and implement new rules and regulations, terms and conditions of services andrates subject to their jurisdiction. New initiatives or orders may adversely affect the tariff rates chargedfor services by the Partnership. Several states, including Oklahoma and Texas, are taking a more activerole in the rate and service regulation of intrastate natural gas systems. Increased state regulation couldadversely impact the Partnership’s natural gas systems.
Competition with Enbridge
Enbridge has agreed with the Partnership that, so long as an affiliate of Enbridge is the generalpartner of the Partnership, Enbridge and its subsidiaries may not engage in or acquire any business thatis in direct material competition with the businesses of the Partnership, subject to the followingexceptions:
• Enbridge and its subsidiaries are not restricted from continuing to engage in businesses,including the normal development of such businesses, in which they were engaged at the time ofthe Partnership’s initial public offering in December 1991;
• such restriction is limited geographically only to those routes and products for which thePartnership provided transportation at the time of the Partnership’s initial public offering;
• Enbridge and its subsidiaries are not prohibited from acquiring any competitive business as partof a larger acquisition, so long as the majority of the value of the business or assets acquired, inEnbridge’s reasonable judgment, is not attributable to the competitive business; and
• Enbridge and its subsidiaries are not prohibited from acquiring any competitive business if thatbusiness is first offered for acquisition to the Partnership and the Partnership fails to approve,after submission to a vote of unitholders, the making of the acquisition.
As the Partnership was not engaged in any aspect of the natural gas business at the time of itsinitial public offering, Enbridge and its subsidiaries are not restricted from competing with thePartnership in any aspects of the natural gas business. In addition, Enbridge and its subsidiaries wouldbe permitted to transport crude oil and liquid petroleum over routes that are not the same as theLakehead system even if such transportation is in direct material competition with the business of thePartnership.
This agreement also expressly permitted the reversal by Enbridge in 1999 of one of its pipelinesthat extends from Sarnia, Ontario to Montreal, Quebec. As a result of this reversal, Enbridge competeswith the Partnership to supply crude oil to the Ontario, Canada market. This competition fromEnbridge has reduced the Partnership’s deliveries of crude oil to Ontario.
Market Risk
As part of its natural gas marketing activities, the Partnership purchases natural gas at prevailingmarket prices. Following the purchase of natural gas, the Partnership generally resells it at a higherprice under a sales contract that has comparable terms to the purchase contract, including any price
17

escalation provisions. The profitability of the Partnership’s natural gas operations may be affected bythe following factors:
• the ability to negotiate, on a timely basis, natural gas purchase and sales agreements in changingmarkets;
• reluctance of wholesale customers to enter into long-term purchase contracts;
• consumers’ willingness to use other fuels when natural gas prices increase significantly;
• timing of imbalance or volume discrepancy corrections and their impact on financial results; and
• the ability of its customers to make timely payment, customer default, and concentration ofreceivables with third parties in the energy sector.
Environmental and Safety Regulations
The Partnership’s pipeline, gathering, processing and trucking operations are subject to federal andstate laws and regulations relating to environmental protection and operational safety. Liquidpetroleum and natural gas transportation and processing operations always involve the risk of costs orliabilities related to environmental protection and operational safety matters. It is also possible that thePartnership will have to pay amounts in the future because of changes in environmental and safety lawsor enforcement policies or claims for environmentally related damage to persons or property. ThePartnership may not be able to recover these costs from insurance, higher fees or through higherpipeline tariffs rates.
Kyoto Protocol
In December 2002, Canada ratified the Kyoto Protocol, a 1997 treaty designed to reducegreenhouse gas emissions to 6% below 1990 levels. The Partnership and Enbridge are assessing andevaluating the Canadian federal government’s approach to implementation. Until these plans becomecertain, the Partnership will not be able to quantify the impact, if any, of the Kyoto Protocol on itsoperations. The Partnership is encouraged by reactions by western Canadian crude oil producers toKyoto, particularly their commitment to oil sands development, which supports the outlook for thesustainability of crude oil supplies for the Lakehead system.
Transportation of Hazardous Materials
Operation of complex liquid petroleum and natural gas transportation and processing systemsinvolve risks, hazards and uncertainties, such as operational hazards and unforeseen interruptionscaused by events beyond the control of the Partnership. For example, the East Texas, Northeast Texasand South Texas systems, and some facilities in Mississippi, handle or transport large quantities ofnatural gas containing hydrogen sulfide, a highly toxic substance when workers or the public areexposed above safe limits. Some of these pipelines are located in or near densely populated areas. Amajor release of natural gas containing hydrogen sulfide from one of these pipelines or plants couldresult in severe injuries or death, as well as severe environmental damage. Insurance proceeds may notbe adequate to cover all liabilities incurred or lost revenues.
Growth Strategy
The acquisition of complementary energy delivery assets is a focus of the Partnership’s strategicplan. Acquisitions may present various risks and challenges, including the risks of incorrect assumptionsin the acquisition models, effective integration of the acquired operations and diversion ofmanagement’s attention from existing operations. In addition, the Partnership may be unable to identify
18

acquisition targets and consummate acquisitions in the future or be unable to raise, on termsacceptable to it, any debt or equity financing that may be required for any such acquisition.
Oil Measurement Losses
Oil measurement losses occur as part of the normal operating conditions associated with thePartnership’s liquid petroleum pipelines. The three types of oil measurement losses include:
• physical losses, which occur through evaporation, shrinkage, differences in measurement betweenreceipt and delivery locations and other operational incidents;
• degradation losses, which result from mixing at the interface between higher quality light crudeoil and lower quality heavy crude oil in pipelines; and
• revaluation losses, which are a function of crude oil prices, the level of the carrier’s inventoryand the inventory positions of customers.
There are inherent difficulties in quantifying oil measurement losses because physicalmeasurements of volumes are not practical, as products continuously move through the Partnership’spipelines and virtually all of these pipelines are located underground. Quantifying oil measurementlosses is especially difficult for the Partnership because of the length of the Lakehead system and thenumber of different grades of crude oil and types of crude oil products it carries. The Partnershiputilizes engineering-based models and operational assumptions to estimate product volumes in itssystem and associated oil measurement losses. If there is a material change in these assumptions, itmay result in a revision of oil measurement loss estimates.
Conflicts of Interest
Enbridge indirectly owns all of the stock of the general partner of the Partnership and elects all ofits directors. Furthermore, some of the Partnership’s directors and officers are also directors andofficers of Enbridge. Consequently, conflicts of interest could arise between the Partnership’sunitholders and Enbridge.
The Partnership’s partnership agreement limits the fiduciary duties of the general partner of thePartnership to the Partnership’s unitholders. These restrictions allow the general partner of thePartnership to resolve conflicts of interest by considering the interests of all the parties to the conflict,including Enbridge Management’s interests, the interests of the Partnership and the General Partner.Additionally, these limitations reduce the rights of the Partnership’s unitholders under the Partnership’spartnership agreement to sue the general partner of the Partnership or Enbridge Management, itsdelegee, should its directors or officers act in a way that, were it not for these limitations of liability,would constitute breaches of their fiduciary duties.
State Tax Legislation
State tax legislation resulting in the imposition of a partnership-level income tax on the Partnershipcould reduce the cash distributions on the common units and the value of the i-units that thePartnership will distribute quarterly to Enbridge Management. Currently, state-level income taxation ofthe Partnership is not significant. However, many states have considered increasing their taxes,including some partnership-level taxes, in their recent legislative processes. The enactment of significantlegislation imposing partnership-level income taxes would cause a reduction in the value of thepartnership units.
19

TITLE TO PROPERTIES
The Partnership currently conducts business and owns properties located in 20 states: Alabama,Arkansas, Florida, Georgia, Illinois, Indiana, Kansas, Louisiana, Michigan, Minnesota, Mississippi,Missouri, Montana, New York, North Carolina, North Dakota, Oklahoma, Texas, Tennessee andWisconsin. In general, the Partnership’s systems are located on land owned by others and are operatedunder perpetual easements and rights of way, licenses or permits that have been granted by privateland owners, public authorities, railways or public utilities. The pumping stations, tanks, terminals andcertain other facilities of these systems are located on land that is owned by the Partnership, except forfive pumping stations that are situated on land owned by others and used by the Partnership undereasements or permits.
Substantially all of the Lakehead system assets are subject to a first mortgage securingindebtedness of the Lakehead Partnership, a principal operating subsidiary of the Partnership.
In connection with the acquisition of the Midcoast system, certain filings with respect to titlerecords were not made prior to the closing of the transaction. The Partnership or its subsidiaries havenow made these filings. Although title to these properties is subject to encumbrances in some cases, thePartnership believes that none of these burdens should materially detract from the value of theseproperties or materially interfere with their use in the operation of the Partnership’s business.
REGULATION
Regulation by the FERC of Interstate Common Carrier Liquids Pipelines
The Lakehead and North Dakota systems are interstate common carrier liquids pipelines subject toregulation by the FERC under the ICA. As interstate common carriers, these pipelines provide serviceto any shipper who requests transportation services, provided that products tendered for transportationsatisfy the conditions and specifications contained in the applicable tariff. The ICA requires thePartnership to maintain tariffs on file with the FERC that set forth the rates it charges for providingtransportation services on its interstate common carrier pipelines, as well as the rules and regulationsgoverning these services.
The ICA gives the FERC the authority to regulate the rates the Partnership charges for service onits interstate common carrier pipelines. The ICA requires, among other things, that such rates be ‘‘justand reasonable’’ and nondiscriminatory. The ICA permits interested persons to challenge new orproposed changes to existing rates and authorizes the FERC to suspend the effectiveness of such ratesfor a period of up to seven months and to order a hearing concerning such rates. If, upon completionof an investigation, the FERC finds that the new or changed rate is unlawful, it is authorized to requirethe carrier to refund the revenues in excess of the prior tariff during the term of the investigation. TheFERC also may investigate, upon complaint or on its own motion, rates that are already in effect andmay order a carrier to change its rates prospectively. Upon an appropriate showing, a shipper mayobtain reparations for damages sustained for a period of up to two years prior to the filing of acomplaint.
On October 24, 1992, Congress passed the Energy Policy Act, which deemed petroleum pipelinerates that were in effect for the 365-day period ending on the date of enactment and had not beensubject to complaint, protest or investigation, to be just and reasonable under the ICA (i.e.,‘‘grandfathered’’). The Energy Policy Act also limited the circumstances under which a complaint canbe made against such grandfathered rates. In order to challenge grandfathered rates, a party wouldhave to show that it was previously contractually barred from challenging the rates or that theeconomic circumstances or the nature of service underlying the rate had substantially changed or thatthe rate was unduly discriminatory or preferential. These grandfathering provisions and thecircumstances under which they may be challenged have received only limited attention from the
20

FERC, causing a degree of uncertainty as to their application and scope. The North Dakota system islargely covered by the grandfathering provisions of the Energy Policy Act. The Lakehead system is notcovered by the grandfathering provisions of the Energy Policy Act.
The Energy Policy Act required the FERC to issue rules establishing a simplified and generallyapplicable ratemaking methodology for petroleum pipelines, and to streamline procedures in petroleumpipeline proceedings. The FERC responded to this mandate by issuing Order No. 561, which, amongother things, adopted an indexing rate methodology for petroleum pipelines. Under the regulations,which became effective January 1, 1995, petroleum pipelines are able to change their rates withinprescribed ceiling levels that are tied to an inflation index. Rate increases made within the ceiling levelsmay be protested, but such protests must show that the rate increase resulting from application of theindex is substantially in excess of the pipeline’s increase in costs. If the indexing methodology results ina reduced ceiling level that is lower than a pipeline’s filed rate, Order No. 561 requires the pipeline toreduce its rate to comply with the lower ceiling. A pipeline may not be required to reduce its ratebelow the level grandfathered under the Energy Policy Act. Under Order No. 561, a pipeline must, as ageneral rule, utilize the indexing methodology to change its rates. The FERC, however, retainedcost-of-service ratemaking, market-based rates and settlement as alternatives to the indexing approach,which alternatives may be used in certain specified circumstances.
The Partnership believes that the rates charged for transportation services on its interstatecommon carrier liquids pipelines are just and reasonable under the ICA. However, because the ratesthat the Partnership charges are subject to review upon an appropriately supported complaint, thePartnership cannot predict what rates it will be allowed to charge in the future for service on itsinterstate common carrier liquids pipelines. Furthermore, because rates charged for transportationservices must be competitive with those charged by other transporters, the rates set forth in thePartnership’s tariffs will be determined based on competitive factors in addition to regulatoryconsiderations.
Allowance for Income Taxes in Rates
In a 1995 decision involving the Partnership’s Lakehead system, the FERC partially disallowed theinclusion of income taxes in the cost of service for the Lakehead system. Subsequent appeals of thisruling were resolved by settlement and were not adjudicated. In another FERC proceeding involvingSFPP, L.P., an unrelated pipeline limited partnership, the FERC held that the limited partnership maynot claim an income tax allowance for income attributable to non-corporate partners, both individualsand other entities. SFPP and other parties to the proceeding have appealed the FERC’s orders to theU.S. Court of Appeals for the District of Columbia Circuit. Arguments in the appeals were completedin the fall of 2003 and the court’s decision is pending. The effect of the FERC’s policy stated in theLakehead proceeding (and the results of the ongoing SFPP litigation regarding that policy) on thePartnership is uncertain. Parties may challenge rates on the Partnership’s common carrier interstateliquids pipelines on the basis that its rates are not just and reasonable because the level of income taxallowance in its rates exceeds that permitted under the Lakehead and/or SFPP decisions. It is notpossible to predict the likelihood that parties will assert such challenges or that such challenges wouldsucceed. If the Court of Appeals were to follow the Lakehead decision, and challenges were to beraised and succeeded, application of the Lakehead/SFPP and related rulings would reduce permissibleincome tax allowance in any cost-of-service based rate, to the extent income tax is attributed topartnership interests held by individuals and other non-corporate entities.
Regulation by the FERC of Interstate Natural Gas Pipelines
The Partnership’s AlaTenn, MidLa, KPC and UTOS systems are interstate natural gas pipelinesregulated by the FERC under the NGA, and the NGPA. Each system operates under separateFERC-approved tariffs that establish rates, terms and conditions under which each system provides
21
service to its customers. In addition, the FERC’s authority over natural gas companies that providenatural gas pipeline transportation services in interstate commerce includes:
• the certification and construction of new facilities;
• the extension or abandonment of services and facilities;
• the maintenance of accounts and records;
• the acquisition and disposition of facilities;
• the initiation and discontinuation of services;
• conduct and relationship with energy affiliates; and
• various other matters.
Tariff changes can only be implemented upon approval by the FERC. There are two primarymethods by which the rates, terms and conditions of service of an interstate pipeline may be changed.Under the first method, the company voluntarily seeks a tariff change by making a tariff filing with theFERC, which justifies the proposed tariff change and provides notice, generally 30 days, to theappropriate parties. If the FERC determines that a proposed change may not be just and reasonable asrequired by the NGA, then the FERC may suspend such change for up to five months and set thematter for an administrative hearing. Subsequent to any suspension period ordered by the FERC, theproposed change may be placed into effect by the company pending final FERC approval. In mostcases, a proposed rate increase is placed into effect before a final FERC determination on such rateincrease, and the proposed increase is collected subject to refund (plus interest). Under the secondmethod, the FERC may, on its own motion or based on a complaint, initiate a proceeding seeking tocompel the company to change its rates, terms and/or conditions of service. If the FERC determinesthat the existing rates, terms and/or conditions of service are unjust, unreasonable, undulydiscriminatory or preferential, then any rate reduction or change that it orders generally will beeffective prospectively from the date of the FERC order requiring this change.
In addition to its jurisdiction over the UTOS system under the NGA and the NGPA, the FERCalso has jurisdiction over the UTOS system and the Partnership’s offshore gathering systems under theOuter Continental Shelf Lands Act. The OCSLA requires that all pipelines operating on or across theouter continental shelf, referred to as the ‘‘OCS,’’ provide open-access, non-discriminatorytransportation service on their systems. In 2000, the FERC issued Order Nos. 639 and 639-A, referredto collectively as ‘‘Order No. 639,’’ which required gas service providers operating on the OCS to makepublic their rates, terms and conditions of service. The purpose of Order No. 639 was to provideregulators and other interested parties with sufficient information to detect and to remedydiscriminatory conduct by such service providers. In January 2002, the U.S. District Court for theDistrict of Columbia Circuit permanently enjoined the FERC from enforcing Order No. 639, on thebasis that the FERC did not possess the requisite rule-making authority under the OCSLA for issuingOrder No. 639. The U.S. Court of Appeals for the District of Columbia Circuit affirmed the lowercourts ruling by its October 10, 2003 Order, which is now final.
On November 25, 2003 the FERC issued Order No. 2004 governing the Standards of Conduct forTransmission Providers (interstate pipelines). The new standards provide that (1) a TransmissionProviders’ employees engaged in transmission system operations must function independently from theTransmission Providers’ sales or marketing employees and from any employees of their EnergyAffiliates; and (2) a Transmission Provider must treat all transmission customers, affiliated andnon-affiliated, on a non-discriminatory basis, and cannot operate its transmission system to benefitpreferentially an Energy Affiliate. The rule defined an ‘‘Energy Affiliate’’ as any affiliated company thatengages in or is involved in transmission transactions in U.S. energy or transmission markets, or onethat manages the capacity of a Transmission Provider, or buys, sales, trades or administers natural gas
22
in U.S. markets, or engages in financial transactions relating to the sale or transmission of natural gasin U.S. markets. Affiliated interstate pipelines are not considered Energy Affiliates. However, gatherers,processors, intrastate and Hinshaw pipelines are considered Energy Affiliates, in addition to marketingaffiliates. The new rule will result in additional costs and increased difficulty in the Partnership’soperations, although the Partnership does not believe that these regulations will affect it any differentlythan any other interstate pipelines with which its competes.
Additional proposals and proceedings that might affect the natural gas industry are pending beforeCongress, the FERC and the courts. The natural gas industry historically has been very heavilyregulated; therefore, there is no assurance that the less stringent regulatory approach recently pursuedby the FERC and Congress will continue, especially in light of alleged market power abuse bymarketing affiliates of certain large interstate pipeline companies.
Intrastate Pipeline Regulation
The Partnership’s intrastate liquids and natural gas pipeline operations generally are not subject torate regulation by the FERC, but they are subject to regulation by various agencies of the states inwhich they are located. However, to the extent that the Partnership’s intrastate pipeline systems delivernatural gas into interstate commerce, the rates, terms and conditions of such transportation service aresubject to FERC jurisdiction under Section 311 of the NGPA, which regulates, among other things, theprovision of transportation services by an intrastate natural gas pipeline making deliveries on behalf ofa local distribution company or an interstate natural gas pipeline. Most states have agencies thatpossess the authority to review and authorize natural gas transportation transactions and theconstruction, acquisition, abandonment and interconnection of physical facilities. Some states also havestate agencies that regulate transportation rates, service terms and conditions and contract pricing toensure their reasonableness and to ensure that the intrastate pipeline companies that they regulate donot discriminate among similarly situated customers.
Natural Gas Gathering Pipeline Regulation
Section 1(b) of the NGA exempts natural gas gathering facilities from the jurisdiction of the FERCunder the NGA. The Partnership owns certain natural gas pipelines that it believes meet the traditionaltests the FERC has used to establish a pipeline’s status as a gatherer not subject to the FERCjurisdiction. State regulation of gathering facilities generally includes various safety, environmental and,in some circumstances, nondiscriminatory take requirements, but historically has not entailed rateregulation. Natural gas gathering may receive greater regulatory scrutiny at both the state and federallevels now that the FERC has taken a more light-handed approach to regulation of the gatheringactivities of interstate pipeline transmission companies and a number of such companies havetransferred gathering facilities to unregulated affiliates. For example, the Texas Railroad Commissionhas approved changes to its regulations governing transportation and gathering services performed byintrastate pipelines and gatherers, which prohibit such entities from unduly discriminating in favor oftheir affiliates. Many of the producing states have adopted some form of complaint-based regulationthat generally allows natural gas producers and shippers to file complaints with state regulators in aneffort to resolve grievances relating to natural gas gathering access and rate discrimination. ThePartnership’s gathering operations could be adversely affected should they be subject in the future tothe application of state or federal regulation of rates and services. The Partnership’s gatheringoperations also may be or become subject to safety and operational regulations relating to the design,installation, testing, construction, operation, replacement and management of gathering facilities.Additional rules and legislation pertaining to these matters are considered or adopted from time totime. The Partnership cannot predict what effect, if any, such changes might have on its operations, butthe industry could be required to incur additional capital expenditures and increased costs dependingon future legislative and regulatory changes.
23

Sales of Natural Gas, Crude Oil, Condensate and Natural Gas Liquids
The price at which the Partnership sells natural gas currently is not subject to federal or stateregulation except for certain systems in Texas. The Partnership’s sales of natural gas are affected by theavailability, terms and cost of pipeline transportation. As noted above, the price and terms of access topipeline transportation are subject to extensive federal and state regulation. The FERC is continuallyproposing and implementing new rules and regulations affecting those segments of the natural gasindustry, most notably interstate natural gas transmission companies, that remain subject to the FERC’sjurisdiction. These initiatives also may affect the intrastate transportation of natural gas under certaincircumstances. The stated purpose of many of these regulatory changes is to promote competitionamong the various sectors of the natural gas industry and these initiatives generally reflect more light-handed regulation. The Partnership cannot predict the ultimate impact of these regulatory changes toits natural gas marketing operations. Some of the FERC’s more recent proposals may adversely affectthe availability and reliability of interruptible transportation service on interstate pipelines. ThePartnership does not believe that it will be affected by any such FERC action in a manner that ismaterially different than other natural gas marketers with whom it competes.
The Partnership’s sales of crude oil, condensate and natural gas liquids currently are not regulatedand are made at market prices. In a number of instances, however, the ability to transport and sell suchproducts is dependent on pipelines whose rates, terms and conditions of service are subject to theFERC’s jurisdiction under the ICA. Certain regulations implemented by the FERC in recent yearscould increase the cost of transportation service on certain petroleum products pipelines. However, thePartnership does not believe that these regulations affect it any differently than other marketers ofthese products.
Other Regulation
The governments of the United States and Canada have, by treaty, agreed to ensurenondiscriminatory treatment for the passage of oil and natural gas through the pipelines of one countryacross the territory of the other. Individual border crossing points require U.S. government permits thatmay be terminated or amended at the will of the U.S. government. These permits provide thatpipelines may be inspected by or subject to orders issued by federal or state government agencies.
Tariffs and Rate Cases
Lakehead system
Under published tariffs at December 31, 2003 (including the tariff surcharges related to Lakeheadsystem expansions), for transportation on the Lakehead system, the rates for transportation of lightcrude oil from Neche, North Dakota, where the System enters the U.S. (unless otherwise stated), toprincipal delivery points are set forth below.
Published Tariff Per Barrel
To Clearbrook, Minnesota . . . . . . . . . . . . . . . . . . . . . . . . . . . . . . . . $0.171To Superior, Wisconsin . . . . . . . . . . . . . . . . . . . . . . . . . . . . . . . . . . $0.332To Chicago, Illinois area . . . . . . . . . . . . . . . . . . . . . . . . . . . . . . . . . $0.676To Marysville, Michigan area . . . . . . . . . . . . . . . . . . . . . . . . . . . . . . $0.807To Buffalo, New York area . . . . . . . . . . . . . . . . . . . . . . . . . . . . . . . $0.826Chicago to the international border near Marysville . . . . . . . . . . . . . $0.301
The rates at December 31, 2003 for medium and heavy crude oils are higher, and those for NGLsare lower than the rates set forth in the table to compensate for differences in the costs of shippingdifferent types and grades of liquid hydrocarbons. The Partnership periodically adjusts its tariff rates asallowed under the FERC’s indexing methodology and the tariff agreement described below.
24

Under a tariff agreement approved by the FERC in 1998, the Partnership implemented a tariffsurcharge for the Terrace expansion program of approximately $0.013 per barrel for light crude oil fromthe Canadian border to Chicago. On April 1, 2001, pursuant to an agreement between the Partnershipand Enbridge Pipelines, the Partnership’s share of the surcharge was increased to $0.026 per barrel.Subject to any adjustments permitted under the tariff agreement, this surcharge will be effective untilApril 1, 2004, when the surcharge to the Partnership will change to $0.007 per barrel. This new tariff isexpected to be in effect for the next six years, after which time it will return to $0.013 per barrel forthe Partnership through 2013, the term of the agreement.
Natural Gas Transportation Systems
Tariff rates on the FERC-regulated natural gas pipelines vary by pipeline and, in the case of KPC,by receipt point and delivery point. The rates charged for transmission of natural gas on pipelines notregulated by the FERC, or a state agency, are established by competitive forces. Please read ‘‘Item 7.Management’s Discussion and Analysis of Financial Condition and Results of Operations.’’
Environmental and Safety Regulation
General
The Partnership’s transmission and gathering pipelines and storage and processing facilities aresubject to extensive federal and state environmental, operational and safety regulation. The failure tocomply with such rules and regulations can result in substantial penalties and/or enforcement actionsand added operational costs. However, the added costs imposed by regulations are generally nodifferent than those imposed on the Partnership’s competitors.
Pipeline Safety and Transportation Regulation
The Partnership’s transmission and non-rural gathering pipelines are subject to regulation by theU.S. Department Of Transportation, under the Title 49 United States Code (Pipeline Safety Act)relating to the design, installation, testing, construction, operation, replacement and management oftransmission and non-rural gathering pipeline facilities. Periodically the PSA has been reauthorized andamended, imposing new mandates on the regulator to promulgate new regulations, imposing directmandates on operators of pipelines.
On December 17, 2002 the ‘‘Pipeline Safety Improvement Act of 2002’’ (Act) was signed intolegislation reauthorizing and amending the PSA in several important respects.
Following requirements of mandates in the PSA, the DOT has issued regulations requiringoperators of hazardous liquid and natural gas transmission pipelines subject to the regulations to assess,evaluate, repair and validate, through a comprehensive analysis, the integrity of pipeline segments that,in the event of a leak or failure, could affect a high consequence area. HCA’s for liquid pipelines havebeen defined as: populated areas, areas unusually sensitive to environmental damage and commerciallynavigable waterways. For natural gas pipelines, HCA’s are defined as segments in proximity topopulation density or places of public congregation.
The DOT has issued recent rules on requirements to submit maps, additional reports and enhanceoperator personnel qualification programs. The Partnership anticipates new rules regulating pipelinesecurity, contractor drug testing, inspection, public awareness programs and annual informationreporting. Additionally, revised regulations are anticipated that may impose new federal mandates oncertain non-DOT jurisdictional pipelines currently classified as ‘‘rural gathering lines’’. Pending specificproposed regulations, the Partnership is not certain of the effect or costs that the new requirementsmay have on its operations.
25
Various states in which the Partnership operates have authority to issue additional regulationsaffecting intrastate or gathering pipeline design, safety and operational requirements.
The Partnership’s trucking and railcar operations are also subject to safety and permittingregulation by the DOT and state agencies with regard to the safe transportation of hazardous materialsand other materials.
The Partnership believes that its pipeline, trucking and railcar operations are in substantialcompliance with applicable operational and safety requirements. In instances of non-compliance, thePartnership has taken actions to remediate the situations. Nevertheless, significant expenses could beincurred in the future if additional safety measures are required or if safety standards are raised andexceed the capabilities of its current pipeline control system or other safety equipment.
Pressure Restrictions on the Lakehead system
Following a leak that occurred on the Lakehead system in July 2002, the federal Office of PipelineSafety imposed pressure restrictions on the entire line that was affected. The Partnership then proposeda Return-to-Service-plan, which included implementing certain internal inspections and other strategiesto verify the integrity of the pipeline in the affected area. During 2003, the OPS removed the majorityof the restrictions, while directing that a small restriction remain in place in one area of the line inMinnesota. OPS has indicated that this restriction is expected to be removed following another internalinspection and associated repairs in 2005, and after evaluation of the interim performance of the lineand the Partnership’s progress in implementing its risk management plan. Based on the Partnership’sforecast of deliveries for 2004, the remaining ten percent pressure restriction is not expected tonegatively impact its earnings.
Environmental Regulation
General. The Partnership’s operations are subject to complex federal, state, and local laws andregulations relating to the protection of health and the environment, including laws and regulationswhich govern the handling, storage and release of crude oil and other liquid hydrocarbon materials oremissions from natural gas compression facilities. As with the pipeline and processing industry ingeneral, complying with current and anticipated environmental laws and regulations increases theoverall cost of doing business, including its capital costs to construct, maintain, and upgrade equipmentand facilities. While these laws and regulations affect its maintenance capital expenditures and netincome, the Partnership believes that they do not affect its competitive position since the operations ofits competitors are similarly affected.
In addition to compliance costs, violations of environmental laws or regulations can result in theimposition of significant administrative, civil and criminal fines and penalties and, in some instances,injunctions banning or delaying certain activities. The Partnership believes that its operations are insubstantial compliance with applicable environmental laws and regulations.
There are also risks of accidental releases into the environment associated with the Partnership’soperations, such as leaks or spills of crude oil, liquids or natural gas or other substances from itspipelines or storage facilities. Such accidental releases could, to the extent not insured, subject thePartnership to substantial liabilities arising from environmental cleanup and restoration costs, claimsmade by neighboring landowners and other third parties for personal injury and property damage, andfines, penalties, or damages for related violations of environmental laws or regulations.
Although the Partnership is entitled in certain circumstances to indemnification from third partiesfor environmental liabilities relating to assets it acquired from those parties, these contractualindemnification rights are limited and, accordingly, the Partnership may be required to bear substantial
26

environmental expenses. However, the Partnership believes that through its due diligence processsubstantial issues are identified and managed.
Air and Water Emissions. The Partnership’s operations are subject to the federal Clean Air Actand the federal Clean Water Act and comparable state and local statutes. The Partnership anticipates,therefore, that it will incur certain capital expenses in the next several years for air pollution controlequipment and spill prevention measures in connection with maintaining existing facilities and obtainingpermits and approvals for any new or acquired facilities. The Partnership believes compliance withthese CAA and CWA requirements will not have a material adverse effect on its financial condition.
An operating permit excursion occurred at the Bryans’ Mill Treating Plant in 2003 where asignificant amount (approximately 7000 tons) of sulphur-dioxide (SO2) was released above permit limitsand was self-reported to the applicable state agency. A plant catalyst bed was found to be deficient andthe problem has been corrected. Administrative reporting systems and operations procedures have beenaugmented for the prevention of future occurrences. An accrual has been made for the amount of theexpected penalty.
The OPA was enacted in 1990 and amends parts of the CWA and other statutes as they pertain tothe prevention of and response to oil spills. Under the OPA, the Partnership could be subject to strict,joint and potentially unlimited liability for removal costs and other consequences of an oil spill from itsfacilities into navigable waters, along shorelines or in an exclusive economic zone of the United States.The OPA also imposes certain spill prevention, control and countermeasure requirements for many ofthe Partnership’s non-pipeline facilities, such as the preparation of detailed oil spill emergency responseplans and the construction of dikes or other containment structures to prevent contamination ofnavigable or other waters in the event of an oil overflow, rupture or leak. For the Partnership’s pipelinefacilities, the OPA imposes requirements for emergency plans to be prepared, submitted and approvedby the DOT. For the Partnership’s non-transportation facilities, such as storage tanks, the OPAregulations are promulgated by the EPA. The Partnership believes it is in material compliance withthese laws and promulgating regulations.
Hazardous Substances and Waste Management. The federal CERCLA (also known as the‘‘Superfund’’ law), and similar state laws, impose liability without regard to fault or the legality of theoriginal conduct, on certain classes of persons, including the owners or operators of waste disposal sitesand companies that disposed or arranged for disposal of hazardous substances found at such sites. ThePartnership may generate some wastes that fall within the definition of a ‘‘hazardous substance.’’ ThePartnership may, therefore, be jointly and severally liable under CERCLA for all or part of any costsrequired cleaning up and restoring sites at which such wastes have been disposed. In addition, it is notuncommon for neighboring landowners and other third parties to file claims for personal injury andproperty damage allegedly caused by hazardous substances or other pollutants released into theenvironment. Analogous state laws may apply to a broader range of substances than CERCLA and, insome instances, may offer fewer exemptions from liability. The Partnership has not received anynotification that it may be potentially responsible for cleanup costs under CERCLA or similar statelaws.
Employee Health and Safety. The workplaces associated with the Partnership’s operations aresubject to the requirements of the federal OSHA and comparable state statutes that regulate workerhealth and safety. The Partnership has an ongoing safety-training program for its employees andbelieves that its operations are in compliance with applicable occupational health and safetyrequirements, including general industry standards, record keeping requirements, monitoring ofoccupational exposure to regulated substances, and hazard communication standards.
Site Remediation. The Partnership owns and operates a number of pipelines, gathering systems,storage facilities and processing facilities that have been used to transport, distribute, store and process
27

crude oil, natural gas and other petroleum products. The Partnership or its predecessors have operatedcertain facilities, including the Lakehead system since 1950. Many of the other facilities of thePartnership were previously owned and operated by third parties whose handling, disposal and releaseof petroleum and waste materials were not under the Partnership’s control. The age of the facilities,combined with the past operating and waste disposal practices, which were standard for the industryand regulatory regime at the time, have resulted in soil and groundwater contamination at somefacilities due to historical spills and releases. Such contamination is not unusual within the natural gasand petroleum industry. Historical contamination found on, under or originating from the Partnership’sproperties may be subject to CERCLA, RCRA and analogous state laws as described above. Underthese laws, the Partnership could incur substantial expense to remediate such contamination, includingcontamination caused by prior owners and operators. In addition, Enbridge Management, as the entitywith managerial responsibility for the Partnership, could also be liable for such costs to the extent thatthe Partnership is unable to fulfill its obligations. The Partnership has conducted site investigations atsome of its facilities to assess historical environmental issues, and it is currently addressing soil andgroundwater contamination at various facilities through remediation and monitoring programs, withoversight by the applicable government agencies where appropriate.
In connection with the Partnership’s acquisition of the Midcoast system from Enbridge, theGeneral Partner agreed to indemnify the Partnership and other related persons for certainenvironmental liabilities of which the General Partner had knowledge. Pursuant to the contributionagreement related to this acquisition, the General Partner will not be required to indemnify thePartnership until the aggregate liabilities, including environmental liabilities, exceed $20.0 million, andthe General Partner’s aggregate liability, including environmental liabilities, may not exceed, withcertain exceptions, $150.0 million. The Partnership will be liable for any environmental conditionsrelated to the acquired systems that were not known to the General Partner or were disclosed underthe contribution agreement between the General Partner and the Partnership. In addition, thePartnership will be liable for all removal, remediation and disposal of all asbestos-containing materialsand all naturally occurring radioactive materials associated with the Northeast Texas system and forwhich the General Partner is liable to the prior owner of that system.
Although the Partnership believes these indemnities and conditions provide valuable protection, itis possible that the sellers from whom these assets were purchased will not be able to satisfy theirindemnity obligations or their remedial obligations related to retained liabilities or properties. In thiscase, it is possible that governmental agencies or third party claimants could assert that the Partnershipmay be liable or bears some responsibility for such obligations.
EMPLOYEES
Neither the Partnership, nor Enbridge Management, has any employees. The General Partner hasdelegated to Enbridge Management, pursuant to the Delegation of Control Agreement, substantially allof the responsibility for the day-to-day management and operation of the Partnership. The GeneralPartner, however, retains certain functions and approval rights over the operations of the Partnership.To fulfill its management obligations, Enbridge Management has entered into agreements withEnbridge and several of its affiliates to provide Enbridge Management with the necessary services andsupport personnel, who act on Enbridge Management’s behalf as its agents. The Partnership isultimately responsible for reimbursing these service providers based on the costs that they incur inperforming these services.
INSURANCE
The operations of the Partnership are subject to many hazards inherent in the liquid petroleumand natural gas gathering, processing and transmission industry. The Partnership maintains insurancecoverage for its operations and properties considered to be customary in the industry. There can be noassurance, however, that insurance coverages maintained by the Partnership will be available oradequate for any particular risk or loss or that it will be able to maintain adequate insurance in thefuture at rates it considers reasonable. Although management believes that the assets of the Partnershipare adequately covered by insurance, a substantial uninsured loss could have a material adverse effecton the Partnership’s financial position, results of operations or cash flows.
28

CAPITAL EXPENDITURES
In 2003, the Partnership made capital expenditures of $129.3 million, of which $65.9 million wasfor pipeline system enhancements, $28.8 million for core maintenance activities and $34.6 million forthe Terrace expansion program. See also ‘‘Item 7. Management’s Discussion and Analysis of FinancialCondition and Results of Operations—Liquidity and Capital Resources—Cash Requirements for FutureGrowth—Capital Spending.’’
TAXATION
For U.S. federal and state income tax purposes, the Partnership is not a taxable entity. Federal andstate income taxes on Partnership taxable income are borne by the individual partners through theallocation of Partnership taxable income. Such taxable income may vary substantially from net incomereported in the statement of income.
OTHER MATTERS
In October 2002, the Partnership acquired the Midcoast, Northeast Texas, and South Texas systemsfrom the General Partner (the ‘‘Acquisition’’). A committee of independent members of the Board ofDirectors of the General Partner negotiated the purchase price and terms of the Acquisition on behalfof the Partnership’s public unitholders and recommended that the Board approve the Acquisition. Theindependent committee retained its own expert financial and legal advisors to assist in this process andthe financial advisor rendered a fairness opinion in connection with the Acquisition.
In November 2002, the staff of the SEC advised the Partnership, Enbridge Management, theGeneral Partner and Enbridge (the ‘‘Enbridge Group’’), that it had commenced an informal inquiryinto the Acquisition and the initial public offering by Enbridge Management. The SEC staff has advisedthe Enbridge Group that its principal focus includes the financial forecast made in connection with theAcquisition and the price paid for the assets. The SEC staff has not asserted that the Partnership orthe other Enbridge entities has acted improperly or illegally, and it has not indicated an intention toseek a formal order of investigation. The Enbridge Group is cooperating fully with the SEC staff.
Based on an internal review of the forecast and terms of the Acquisition, the Enbridge Groupcontinues to believe that the financial forecast had a reasonable basis and the price paid for the assetswas fair to the Partnership. The Partnership believes that the informal investigation will not have amaterial adverse effect on the financial condition of the Partnership.
Item 3. Legal Proceedings
The Partnership is a party in a limited number of legal proceedings arising in the ordinary courseof business. The Partnership believes that the outcome of these matters will not, individually or in theaggregate, have a material adverse effect on the financial condition of the Partnership.
Item 4. Submission of Matters to a Vote of Security Holders
No matters were submitted to a vote of security holders during the fourth quarter of 2003.
29
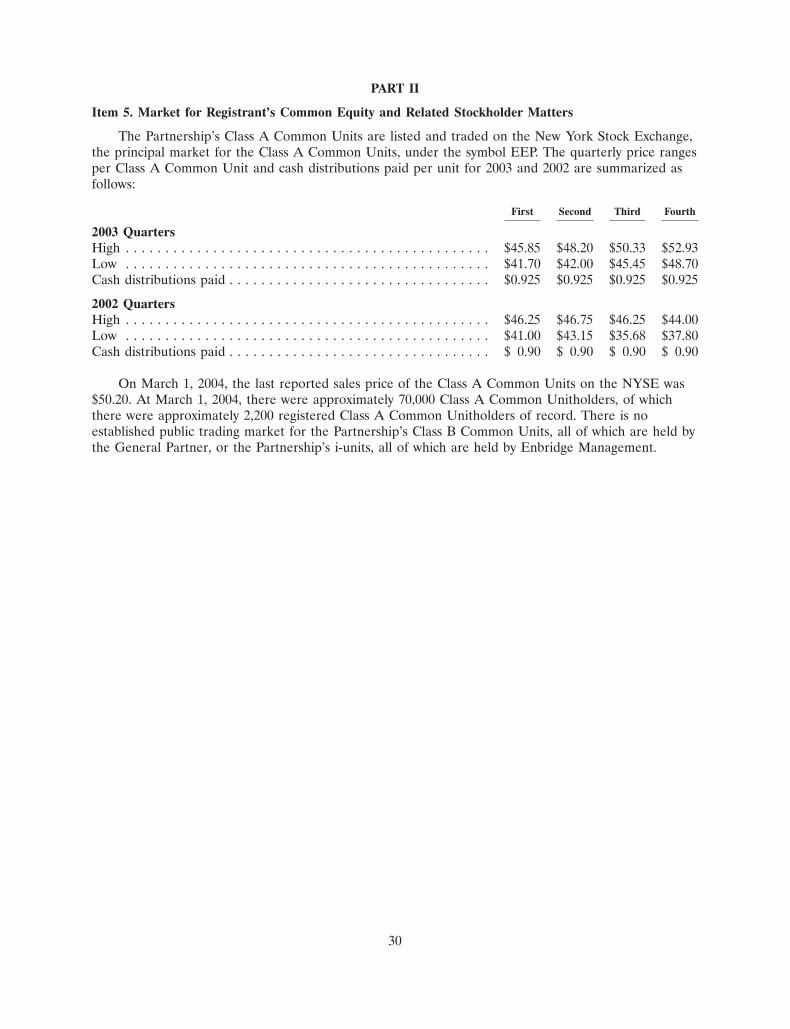
PART II
Item 5. Market for Registrant’s Common Equity and Related Stockholder Matters
The Partnership’s Class A Common Units are listed and traded on the New York Stock Exchange,the principal market for the Class A Common Units, under the symbol EEP. The quarterly price rangesper Class A Common Unit and cash distributions paid per unit for 2003 and 2002 are summarized asfollows:
First Second Third Fourth
2003 QuartersHigh . . . . . . . . . . . . . . . . . . . . . . . . . . . . . . . . . . . . . . . . . . . . . . $45.85 $48.20 $50.33 $52.93Low . . . . . . . . . . . . . . . . . . . . . . . . . . . . . . . . . . . . . . . . . . . . . . $41.70 $42.00 $45.45 $48.70Cash distributions paid . . . . . . . . . . . . . . . . . . . . . . . . . . . . . . . . . $0.925 $0.925 $0.925 $0.925
2002 QuartersHigh . . . . . . . . . . . . . . . . . . . . . . . . . . . . . . . . . . . . . . . . . . . . . . $46.25 $46.75 $46.25 $44.00Low . . . . . . . . . . . . . . . . . . . . . . . . . . . . . . . . . . . . . . . . . . . . . . $41.00 $43.15 $35.68 $37.80Cash distributions paid . . . . . . . . . . . . . . . . . . . . . . . . . . . . . . . . . $ 0.90 $ 0.90 $ 0.90 $ 0.90
On March 1, 2004, the last reported sales price of the Class A Common Units on the NYSE was$50.20. At March 1, 2004, there were approximately 70,000 Class A Common Unitholders, of whichthere were approximately 2,200 registered Class A Common Unitholders of record. There is noestablished public trading market for the Partnership’s Class B Common Units, all of which are held bythe General Partner, or the Partnership’s i-units, all of which are held by Enbridge Management.
30
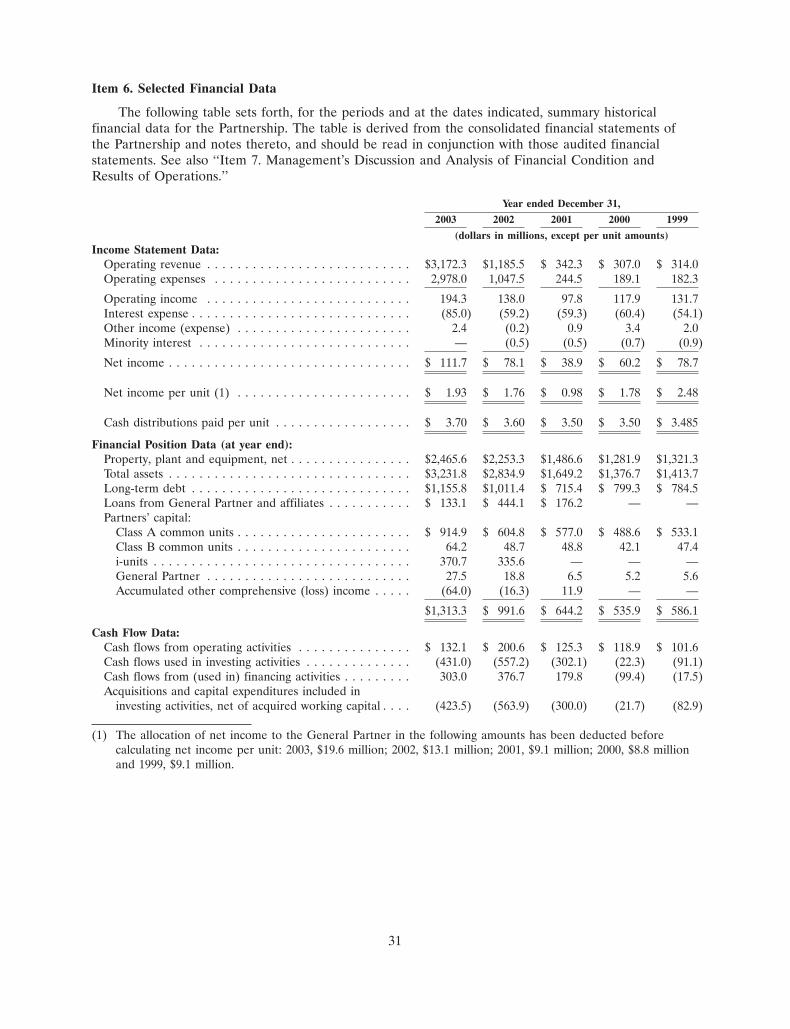
Item 6. Selected Financial Data
The following table sets forth, for the periods and at the dates indicated, summary historicalfinancial data for the Partnership. The table is derived from the consolidated financial statements ofthe Partnership and notes thereto, and should be read in conjunction with those audited financialstatements. See also ‘‘Item 7. Management’s Discussion and Analysis of Financial Condition andResults of Operations.’’
Year ended December 31,
2003 2002 2001 2000 1999
(dollars in millions, except per unit amounts)Income Statement Data:
Operating revenue . . . . . . . . . . . . . . . . . . . . . . . . . . . $3,172.3 $1,185.5 $ 342.3 $ 307.0 $ 314.0Operating expenses . . . . . . . . . . . . . . . . . . . . . . . . . . 2,978.0 1,047.5 244.5 189.1 182.3
Operating income . . . . . . . . . . . . . . . . . . . . . . . . . . . 194.3 138.0 97.8 117.9 131.7Interest expense . . . . . . . . . . . . . . . . . . . . . . . . . . . . . (85.0) (59.2) (59.3) (60.4) (54.1)Other income (expense) . . . . . . . . . . . . . . . . . . . . . . . 2.4 (0.2) 0.9 3.4 2.0Minority interest . . . . . . . . . . . . . . . . . . . . . . . . . . . . — (0.5) (0.5) (0.7) (0.9)
Net income . . . . . . . . . . . . . . . . . . . . . . . . . . . . . . . . $ 111.7 $ 78.1 $ 38.9 $ 60.2 $ 78.7
Net income per unit (1) . . . . . . . . . . . . . . . . . . . . . . . $ 1.93 $ 1.76 $ 0.98 $ 1.78 $ 2.48
Cash distributions paid per unit . . . . . . . . . . . . . . . . . . $ 3.70 $ 3.60 $ 3.50 $ 3.50 $ 3.485
Financial Position Data (at year end):Property, plant and equipment, net . . . . . . . . . . . . . . . . $2,465.6 $2,253.3 $1,486.6 $1,281.9 $1,321.3Total assets . . . . . . . . . . . . . . . . . . . . . . . . . . . . . . . . $3,231.8 $2,834.9 $1,649.2 $1,376.7 $1,413.7Long-term debt . . . . . . . . . . . . . . . . . . . . . . . . . . . . . $1,155.8 $1,011.4 $ 715.4 $ 799.3 $ 784.5Loans from General Partner and affiliates . . . . . . . . . . . $ 133.1 $ 444.1 $ 176.2 — —Partners’ capital:
Class A common units . . . . . . . . . . . . . . . . . . . . . . . $ 914.9 $ 604.8 $ 577.0 $ 488.6 $ 533.1Class B common units . . . . . . . . . . . . . . . . . . . . . . . 64.2 48.7 48.8 42.1 47.4i-units . . . . . . . . . . . . . . . . . . . . . . . . . . . . . . . . . . 370.7 335.6 — — —General Partner . . . . . . . . . . . . . . . . . . . . . . . . . . . 27.5 18.8 6.5 5.2 5.6Accumulated other comprehensive (loss) income . . . . . (64.0) (16.3) 11.9 — —
$1,313.3 $ 991.6 $ 644.2 $ 535.9 $ 586.1
Cash Flow Data:Cash flows from operating activities . . . . . . . . . . . . . . . $ 132.1 $ 200.6 $ 125.3 $ 118.9 $ 101.6Cash flows used in investing activities . . . . . . . . . . . . . . (431.0) (557.2) (302.1) (22.3) (91.1)Cash flows from (used in) financing activities . . . . . . . . . 303.0 376.7 179.8 (99.4) (17.5)Acquisitions and capital expenditures included in
investing activities, net of acquired working capital . . . . (423.5) (563.9) (300.0) (21.7) (82.9)
(1) The allocation of net income to the General Partner in the following amounts has been deducted beforecalculating net income per unit: 2003, $19.6 million; 2002, $13.1 million; 2001, $9.1 million; 2000, $8.8 millionand 1999, $9.1 million.
31
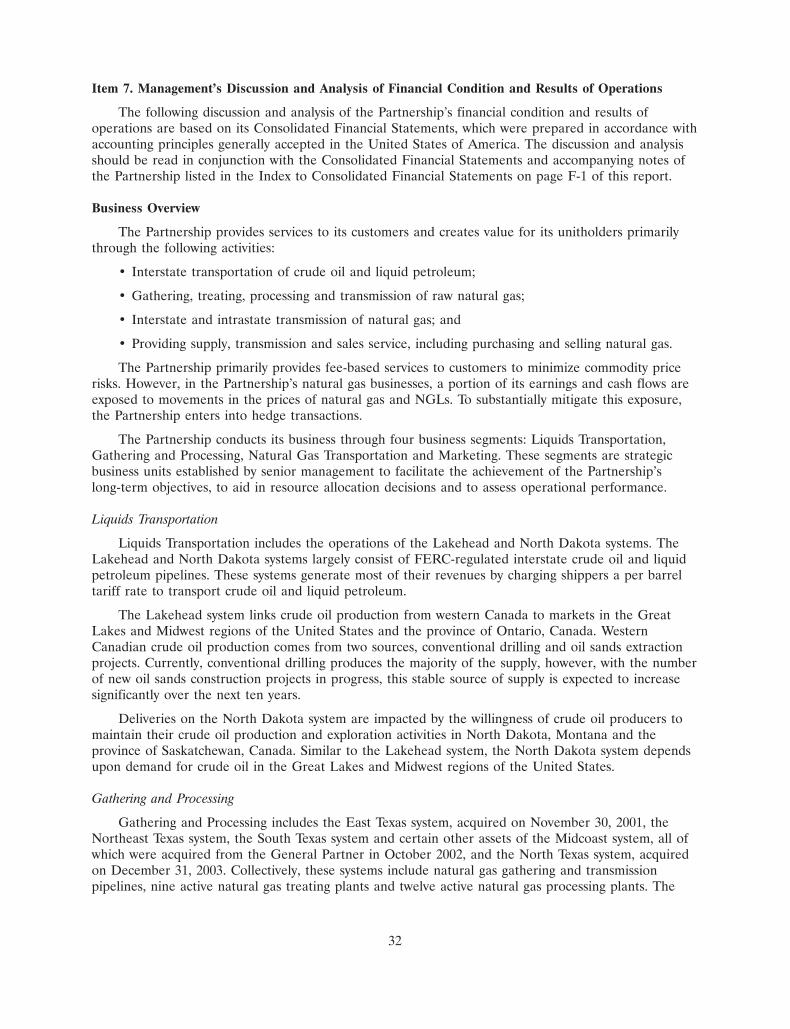
Item 7. Management’s Discussion and Analysis of Financial Condition and Results of Operations
The following discussion and analysis of the Partnership’s financial condition and results ofoperations are based on its Consolidated Financial Statements, which were prepared in accordance withaccounting principles generally accepted in the United States of America. The discussion and analysisshould be read in conjunction with the Consolidated Financial Statements and accompanying notes ofthe Partnership listed in the Index to Consolidated Financial Statements on page F-1 of this report.
Business Overview
The Partnership provides services to its customers and creates value for its unitholders primarilythrough the following activities:
• Interstate transportation of crude oil and liquid petroleum;
• Gathering, treating, processing and transmission of raw natural gas;
• Interstate and intrastate transmission of natural gas; and
• Providing supply, transmission and sales service, including purchasing and selling natural gas.
The Partnership primarily provides fee-based services to customers to minimize commodity pricerisks. However, in the Partnership’s natural gas businesses, a portion of its earnings and cash flows areexposed to movements in the prices of natural gas and NGLs. To substantially mitigate this exposure,the Partnership enters into hedge transactions.
The Partnership conducts its business through four business segments: Liquids Transportation,Gathering and Processing, Natural Gas Transportation and Marketing. These segments are strategicbusiness units established by senior management to facilitate the achievement of the Partnership’slong-term objectives, to aid in resource allocation decisions and to assess operational performance.
Liquids Transportation
Liquids Transportation includes the operations of the Lakehead and North Dakota systems. TheLakehead and North Dakota systems largely consist of FERC-regulated interstate crude oil and liquidpetroleum pipelines. These systems generate most of their revenues by charging shippers a per barreltariff rate to transport crude oil and liquid petroleum.
The Lakehead system links crude oil production from western Canada to markets in the GreatLakes and Midwest regions of the United States and the province of Ontario, Canada. WesternCanadian crude oil production comes from two sources, conventional drilling and oil sands extractionprojects. Currently, conventional drilling produces the majority of the supply, however, with the numberof new oil sands construction projects in progress, this stable source of supply is expected to increasesignificantly over the next ten years.
Deliveries on the North Dakota system are impacted by the willingness of crude oil producers tomaintain their crude oil production and exploration activities in North Dakota, Montana and theprovince of Saskatchewan, Canada. Similar to the Lakehead system, the North Dakota system dependsupon demand for crude oil in the Great Lakes and Midwest regions of the United States.
Gathering and Processing
Gathering and Processing includes the East Texas system, acquired on November 30, 2001, theNortheast Texas system, the South Texas system and certain other assets of the Midcoast system, all ofwhich were acquired from the General Partner in October 2002, and the North Texas system, acquiredon December 31, 2003. Collectively, these systems include natural gas gathering and transmissionpipelines, nine active natural gas treating plants and twelve active natural gas processing plants. The
32
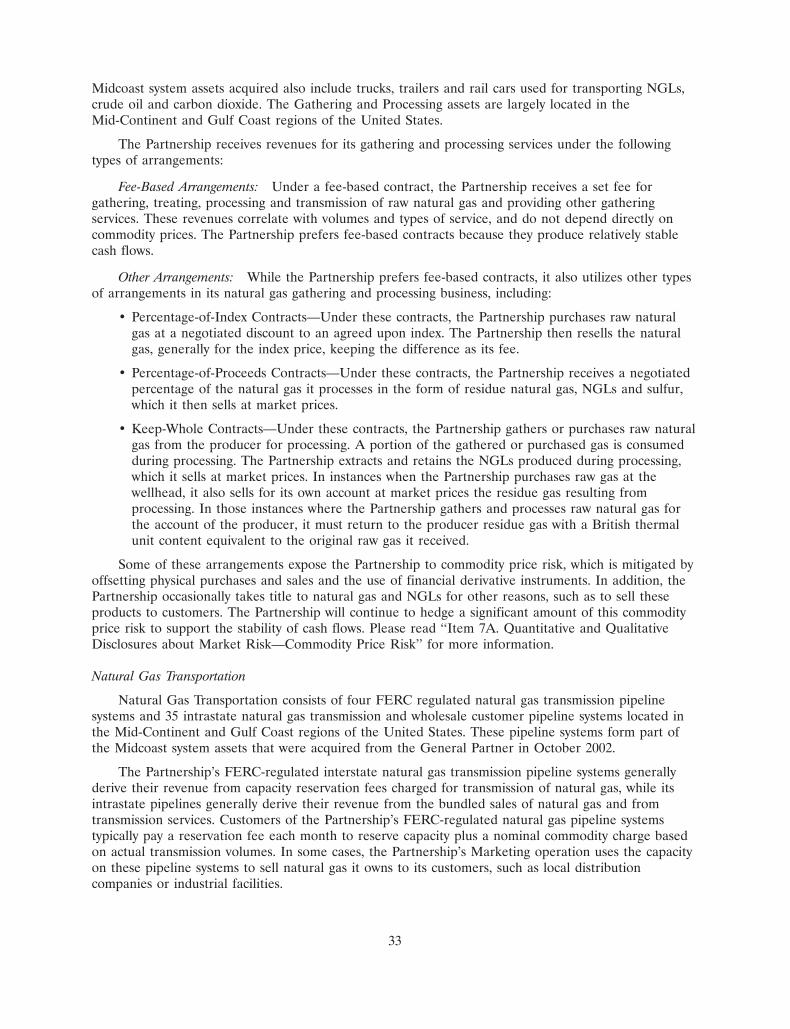
Midcoast system assets acquired also include trucks, trailers and rail cars used for transporting NGLs,crude oil and carbon dioxide. The Gathering and Processing assets are largely located in theMid-Continent and Gulf Coast regions of the United States.
The Partnership receives revenues for its gathering and processing services under the followingtypes of arrangements:
Fee-Based Arrangements: Under a fee-based contract, the Partnership receives a set fee forgathering, treating, processing and transmission of raw natural gas and providing other gatheringservices. These revenues correlate with volumes and types of service, and do not depend directly oncommodity prices. The Partnership prefers fee-based contracts because they produce relatively stablecash flows.
Other Arrangements: While the Partnership prefers fee-based contracts, it also utilizes other typesof arrangements in its natural gas gathering and processing business, including:
• Percentage-of-Index Contracts—Under these contracts, the Partnership purchases raw naturalgas at a negotiated discount to an agreed upon index. The Partnership then resells the naturalgas, generally for the index price, keeping the difference as its fee.
• Percentage-of-Proceeds Contracts—Under these contracts, the Partnership receives a negotiatedpercentage of the natural gas it processes in the form of residue natural gas, NGLs and sulfur,which it then sells at market prices.
• Keep-Whole Contracts—Under these contracts, the Partnership gathers or purchases raw naturalgas from the producer for processing. A portion of the gathered or purchased gas is consumedduring processing. The Partnership extracts and retains the NGLs produced during processing,which it sells at market prices. In instances when the Partnership purchases raw gas at thewellhead, it also sells for its own account at market prices the residue gas resulting fromprocessing. In those instances where the Partnership gathers and processes raw natural gas forthe account of the producer, it must return to the producer residue gas with a British thermalunit content equivalent to the original raw gas it received.
Some of these arrangements expose the Partnership to commodity price risk, which is mitigated byoffsetting physical purchases and sales and the use of financial derivative instruments. In addition, thePartnership occasionally takes title to natural gas and NGLs for other reasons, such as to sell theseproducts to customers. The Partnership will continue to hedge a significant amount of this commodityprice risk to support the stability of cash flows. Please read ‘‘Item 7A. Quantitative and QualitativeDisclosures about Market Risk—Commodity Price Risk’’ for more information.
Natural Gas Transportation
Natural Gas Transportation consists of four FERC regulated natural gas transmission pipelinesystems and 35 intrastate natural gas transmission and wholesale customer pipeline systems located inthe Mid-Continent and Gulf Coast regions of the United States. These pipeline systems form part ofthe Midcoast system assets that were acquired from the General Partner in October 2002.
The Partnership’s FERC-regulated interstate natural gas transmission pipeline systems generallyderive their revenue from capacity reservation fees charged for transmission of natural gas, while itsintrastate pipelines generally derive their revenue from the bundled sales of natural gas and fromtransmission services. Customers of the Partnership’s FERC-regulated natural gas pipeline systemstypically pay a reservation fee each month to reserve capacity plus a nominal commodity charge basedon actual transmission volumes. In some cases, the Partnership’s Marketing operation uses the capacityon these pipeline systems to sell natural gas it owns to its customers, such as local distributioncompanies or industrial facilities.
33

Marketing
The Partnership’s Marketing segment provides supply, transmission and sales service for producersand wholesale customers on its gathering, transmission and customer pipelines as well as otherinterconnected pipeline systems. Marketing activities are primarily undertaken to realize incrementalmargins on gas purchased at the wellhead, increase pipeline utilization and provide value addedservices to customers.
In general, natural gas purchased and sold by the Marketing segment is priced at a published dailyor monthly price index. Sales to wholesale customers typically incorporate a premium for managingtheir transmission and balancing requirements. Higher premiums and associated margins result fromtransactions that involve smaller volumes or that offer greater service flexibility for wholesalecustomers. At their request, the Partnership will enter into long-term fixed price purchase or salescontracts with its customers and generally will enter into offsetting hedged positions under the same orsimilar terms.
Critical Accounting Policies and Estimates
The Partnership’s consolidated financial statements have been prepared in accordance withaccounting principles generally accepted in the United States of America. The preparation of thesefinancial statements requires management to make estimates and assumptions that affect the reportedamounts of assets, liabilities, revenues, expenses and related disclosures with respect to contingentassets and liabilities. The basis for these estimates is historical experience, consultation with experts andvarious other assumptions that are believed to be reasonable, the results of which form the basis formaking judgments about the carrying values of assets and liabilities that are not readily apparent fromother sources. Actual results could differ from these estimates under different assumptions orconditions. Any effects on the Partnership’s business, financial position or results of operations resultingfrom revisions to these estimates are recorded in the period in which the facts that give rise to therevision become known. The Partnership believes the critical accounting policies and estimatesdiscussed in the following paragraphs affect the more significant judgments and estimates used in thepreparation of its consolidated financial statements.
Revenue Recognition
In general, the Partnership recognizes revenue when delivery has occurred or services have beenrendered, pricing is determinable and collectibility is reasonably assured. For its natural gas businesses,the Partnership records an estimate each month for its operating revenues and cost of natural gasbased on quantities delivered, along with a true-up of the prior month’s estimate to equal the priormonth’s actual data. As a result, there is one month of estimated data recorded in the Partnership’soperating revenues and cost of natural gas for each of the years ended December 31, 2003, 2002 and2001. These estimates are based on the best available volume and price data. The Partnership believesthat the assumptions underlying these estimates will not be significantly different from actual amountsdue to the routine nature of these estimates and the stability of the Partnership’s processes.
Property, Plant and Equipment
Property, plant and equipment is recorded at its original cost and is depreciated based on thelesser of the estimated useful lives of the assets or the estimated remaining life of crude oil or naturalgas production in the basins served by the pipelines. Determining the useful life requires variousassumptions to be made, including the supply of and demand for hydrocarbons in the markets servedby assets, normal wear and tear of the facilities, and the extent and frequency of maintenanceprograms. Changes in any of these assumptions may impact the rate at which depreciation is recognizedin the financial statements. Additionally, if it is determined that an asset’s undepreciated cost may not
34

be recoverable due to economic obsolescence, the business climate, legal and other factors, the assetwould be reviewed for impairment and any necessary reduction in its value would be recorded as acharge against earnings. If there are changes to any of the estimates and assumptions, actual resultsmay differ. If an average remaining service life of 20 years had been used (compared to the averageremaining service life of approximately 25 years in the 2003 results), depreciation expense would be$119.3 million or $23.1 million higher and net income per unit would have been $1.45 or $0.48 lower. Ifan average remaining service life of 30 years had been used, depreciation expense would be$79.5 million or $16.7 million lower and net income per unit would have been $2.28 or $0.35 higher.
Assessment of Recoverability of Goodwill and Intangibles
Goodwill represents the excess of the purchase price over the fair value of net assets acquired in abusiness combination. Goodwill is not amortized but is tested for impairment annually as of the end ofthe second quarter or more frequently if impairment indicators arise that indicate the carrying value ofgoodwill may not be recovered. Impairment occurs when the carrying amount of a reporting unitexceeds its fair value. At the time the Partnership determines that impairment has occurred, thecarrying value of the goodwill is written down to its fair value. To estimate the fair value of thereporting units, management makes estimates and judgments about future cash flows, as well asrevenue, cost of sales, operating expenses, capital expenditures and net working capital based onassumptions that are consistent with the Partnership’s most recent five-year plan to manage thebusiness. Preparation of forecast information for use in the five-year plan involves significantjudgments. Based on the results of the impairment analysis, the fair value of the total equity of eachreporting unit is deemed to exceed the respective carrying value.
Actual results can, and often do, differ from the projections and assumptions made. These changescan have a negative impact on the estimates of impairment, which would result in charges to income.In addition, further changes in the economic and business environment can impact the Partnership’soriginal and ongoing assessments of potential impairment.
Other intangible assets consist of natural gas purchase and sale customer contracts, and natural gassupply opportunities, which are amortized on a straight-line basis over the weighted average useful lifeof the underlying assets, which is the period over which the asset is expected to contribute directly orindirectly to the future cash flows of the Partnership.
The Partnership evaluates the carrying value of the intangible assets whenever certain events orchanges in circumstances indicate that the carrying amount of these assets may not be recoverable. Inassessing the recoverability of intangibles, the Partnership compares the carrying value to theundiscounted future cash flows the intangibles are expected to generate. If the total of theundiscounted future cash flows is less than the carrying amount of the intangibles, the intangibles arewritten down to their fair value. If there are changes to any of the estimates and assumptions, actualresults may differ.
Derivative Financial Instruments
Net income and cash flows are subject to volatility from changes in market prices such as interestrates, natural gas prices, natural gas liquids prices and fractionation margins. In order to manage therisks to Partnership unitholders, the General Partner uses a variety of derivative financial instrumentsto create offsetting positions to specific commodity or interest rate exposures. Under SFAS No. 133, allderivative financial instruments are reflected in the balance sheet at their fair value. For thoseinstruments that qualify for hedge accounting, the accounting treatment depends on each instrument’sintended use and how it is designated.
Derivative financial instruments qualifying for hedge accounting treatment and in use by thePartnership can be divided into two categories: 1) cashflow hedges, or 2) fair value hedges. Cashflow
35

hedges are entered into to hedge the variability in cashflow(s) related to a forecasted transaction. Fairvalue hedges are entered into to hedge the value of a recognized asset or liability.
Price assumptions used to value the cash flow and fair value hedges can have an impact on netincome results for each period. The Partnership uses published market price information whereavailable, or quotations from OTC market makers to find executable bids and offers. The valuationsalso reflect the potential impact of liquidating the Partnership’s position in an orderly manner over areasonable period of time under present market conditions, modeling risk, credit risk of ourcounterparties and operational risk. The amounts reported in the Partnership’s consolidated financialstatements change quarterly as these estimates are revised to reflect actual results, changes in marketconditions or other factors, many of which are beyond the Partnership’s control.
At inception and on an ongoing basis, the Partnership also assesses whether the derivatives thatare used in its hedging transactions are highly effective in offsetting changes in cash flows or fair valueof the hedged item. To the extent the hedges are determined to be highly effective, changes in thederivative fair values are recorded as a component of Accumulated Other Comprehensive Income untilthe hedged transactions occur and are then recognized into earnings. If the hedge is determined to notbe highly effective, it can no longer be designated as a cash flow or fair value hedge and changes in thefair value would be reported directly in the income statement.
The Partnership’s earnings are also affected by use of the mark-to-market method of accountingrequired under GAAP for certain basis swap financial instruments. The Partnership uses short-term,highly liquid financial instruments such as basis swaps and other contracts to economically hedgemarket price risks associated with inventories, firm commitments and certain anticipated transactions,primarily within our Marketing segment. As of December 31, 2003, certain basis swap financialinstruments, however, did not qualify for hedge accounting treatment under SFAS No. 133, and thusthe changes in fair value of these instruments are recorded on the balance sheet and through earnings(i.e., using the ‘‘mark-to-market’’ method) rather than being deferred until the firm commitment oranticipated transaction affects earnings. The use of mark-to-market accounting for financial instrumentsmay cause the Partnership’s non-cash earnings to fluctuate based upon changes in underlying indexes,primarily commodity prices. Fair value for these financial instruments is determined using price datafrom highly liquid markets such as the NYMEX commodity exchange or from OTC market makers.
For the year ended December 31, 2003, the Partnership recognized losses of $0.3 million in theConsolidated Statement of Income, as part of the Cost of Natural Gas balance of the Marketingsegment. The fair value of the basis swaps at December 31, 2003, is a payable of $0.3 million, and isincluded in the Consolidated Statement of Financial Position as part of the Deferred Credits balance.These losses resulted from the negative change in market value of these basis swap hedging portfolioactivities. At that date, the Partnership had a limited number of open positions that extend beyondDecember 31, 2004.
Commitments, Contingencies and Environmental Liabilities
The Partnership accrues reserves for contingent liabilities, including environmental remediationand clean-up costs, when its assessments indicate that it is probable that a liability has been incurredand an amount can be reasonably estimated. Estimates of the liabilities are based on currently availablefacts, existing technology and presently enacted laws and regulations taking into consideration the likelyeffects of inflation and other factors, and include estimates of associated legal costs. These amountsalso consider prior experience in remediating contaminated sites, other companies’ clean-up experienceand data released by government organizations. These estimates are subject to revision in futureperiods based on actual costs or new circumstances and the revisions are reflected in the Partnership’sincome in the period in which they are reasonably determinable. The Partnership evaluates recoveriesfrom insurance coverage separately from its liability and, when recovery is reasonably assured, it
36
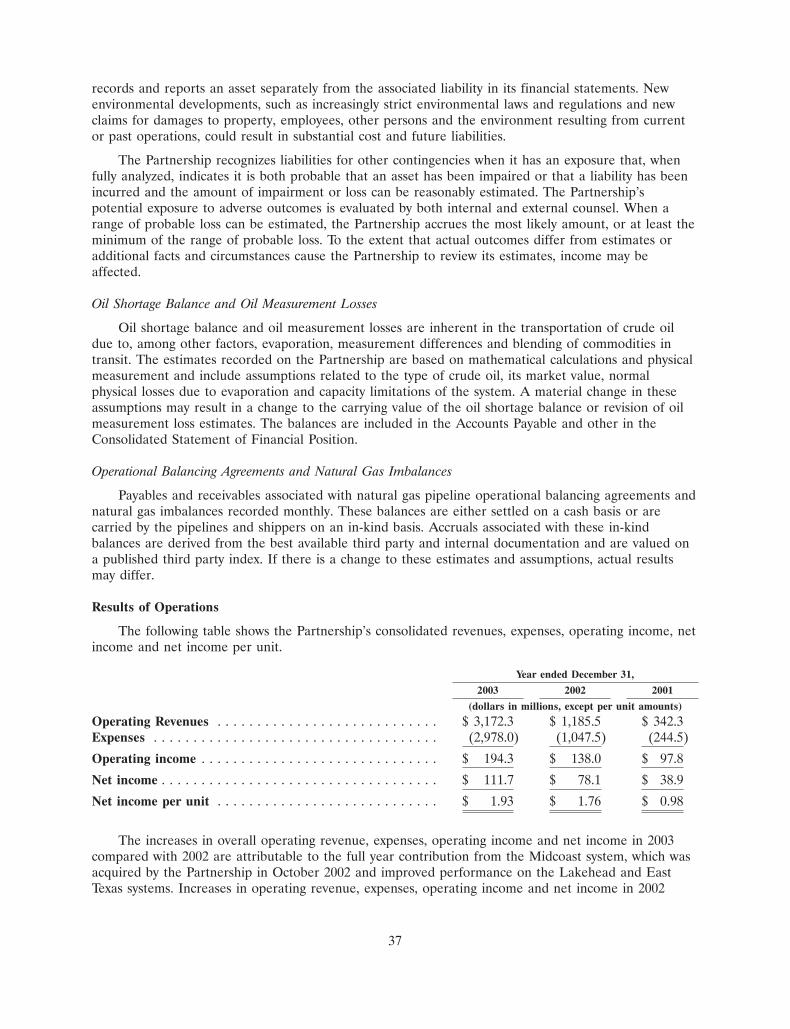
records and reports an asset separately from the associated liability in its financial statements. Newenvironmental developments, such as increasingly strict environmental laws and regulations and newclaims for damages to property, employees, other persons and the environment resulting from currentor past operations, could result in substantial cost and future liabilities.
The Partnership recognizes liabilities for other contingencies when it has an exposure that, whenfully analyzed, indicates it is both probable that an asset has been impaired or that a liability has beenincurred and the amount of impairment or loss can be reasonably estimated. The Partnership’spotential exposure to adverse outcomes is evaluated by both internal and external counsel. When arange of probable loss can be estimated, the Partnership accrues the most likely amount, or at least theminimum of the range of probable loss. To the extent that actual outcomes differ from estimates oradditional facts and circumstances cause the Partnership to review its estimates, income may beaffected.
Oil Shortage Balance and Oil Measurement Losses
Oil shortage balance and oil measurement losses are inherent in the transportation of crude oildue to, among other factors, evaporation, measurement differences and blending of commodities intransit. The estimates recorded on the Partnership are based on mathematical calculations and physicalmeasurement and include assumptions related to the type of crude oil, its market value, normalphysical losses due to evaporation and capacity limitations of the system. A material change in theseassumptions may result in a change to the carrying value of the oil shortage balance or revision of oilmeasurement loss estimates. The balances are included in the Accounts Payable and other in theConsolidated Statement of Financial Position.
Operational Balancing Agreements and Natural Gas Imbalances
Payables and receivables associated with natural gas pipeline operational balancing agreements andnatural gas imbalances recorded monthly. These balances are either settled on a cash basis or arecarried by the pipelines and shippers on an in-kind basis. Accruals associated with these in-kindbalances are derived from the best available third party and internal documentation and are valued ona published third party index. If there is a change to these estimates and assumptions, actual resultsmay differ.
Results of Operations
The following table shows the Partnership’s consolidated revenues, expenses, operating income, netincome and net income per unit.
Year ended December 31,
2003 2002 2001
(dollars in millions, except per unit amounts)
Operating Revenues . . . . . . . . . . . . . . . . . . . . . . . . . . . . $ 3,172.3 $ 1,185.5 $ 342.3Expenses . . . . . . . . . . . . . . . . . . . . . . . . . . . . . . . . . . . . (2,978.0) (1,047.5) (244.5)
Operating income . . . . . . . . . . . . . . . . . . . . . . . . . . . . . . $ 194.3 $ 138.0 $ 97.8
Net income . . . . . . . . . . . . . . . . . . . . . . . . . . . . . . . . . . . $ 111.7 $ 78.1 $ 38.9
Net income per unit . . . . . . . . . . . . . . . . . . . . . . . . . . . . $ 1.93 $ 1.76 $ 0.98
The increases in overall operating revenue, expenses, operating income and net income in 2003compared with 2002 are attributable to the full year contribution from the Midcoast system, which wasacquired by the Partnership in October 2002 and improved performance on the Lakehead and EastTexas systems. Increases in operating revenue, expenses, operating income and net income in 2002
37

compared with 2001 resulted from the full-year contribution of the East Texas system acquired inDecember 2001 and the partial year contribution from the Midcoast system.
The following table reflects operating income by business segment and corporate charges.
Year ended December 31,
2003 2002 2001
(dollars in millions)
Operating IncomeLiquids Transportation . . . . . . . . . . . . . . . . . . . . . . . . . . . . . . . . . . . . . . $124.5 $112.1 $ 97.7Gathering and Processing . . . . . . . . . . . . . . . . . . . . . . . . . . . . . . . . . . . . 48.4 20.2 0.1Natural Gas Transportation . . . . . . . . . . . . . . . . . . . . . . . . . . . . . . . . . . . 15.2 3.9 —Marketing . . . . . . . . . . . . . . . . . . . . . . . . . . . . . . . . . . . . . . . . . . . . . . . 9.4 1.8 —Corporate, operating and administrative* . . . . . . . . . . . . . . . . . . . . . . . . . (3.2) — —
Total Operating Income . . . . . . . . . . . . . . . . . . . . . . . . . . . . . . . . . . . . . . . $194.3 $138.0 $ 97.8Corporate* . . . . . . . . . . . . . . . . . . . . . . . . . . . . . . . . . . . . . . . . . . . . . . (82.6) (59.9) (58.9)
Net Income . . . . . . . . . . . . . . . . . . . . . . . . . . . . . . . . . . . . . . . . . . . . . . . . $111.7 $ 78.1 $ 38.9
* Corporate consists of interest expense, interest income, minority interest and certain otheroperating and administrative costs such as franchise taxes, that are not allocated to the otherbusiness segments.
Liquids Transportation
The results of operations for the Liquids Transportation segment include the Lakehead system andthe North Dakota system, since its acquisition by the Partnership in May 2001.
Year Ended December 31,
2003 2002 2001
(dollars in millions)
Operating Revenues . . . . . . . . . . . . . . . . . . . . . . . . . . . . . . . . . . . . . . . $ 344.2 $ 334.3 $ 313.3Operating and administrative . . . . . . . . . . . . . . . . . . . . . . . . . . . . . . . . . $(104.1) $(104.7) $(102.7)Power . . . . . . . . . . . . . . . . . . . . . . . . . . . . . . . . . . . . . . . . . . . . . . . . . . (56.1) (52.7) (49.9)Depreciation and amortization . . . . . . . . . . . . . . . . . . . . . . . . . . . . . . . . (59.5) (64.8) (63.0)
Expenses . . . . . . . . . . . . . . . . . . . . . . . . . . . . . . . . . . . . . . . . . . . . . . . $(219.7) $(222.2) $(215.6)
Operating income . . . . . . . . . . . . . . . . . . . . . . . . . . . . . . . . . . . . . . . . . $ 124.5 $ 112.1 $ 97.7
The following table sets forth the Lakehead system’s average deliveries per day, barrel miles, andaverage haul:
Year ended December 31,
2003 2002 2001
(average bpd)
United States . . . . . . . . . . . . . . . . . . . . . . . . . . . . . . . . . . . . . . . . . . . . 1,003 937 960Province of Ontario . . . . . . . . . . . . . . . . . . . . . . . . . . . . . . . . . . . . . . . . 351 365 355
Total deliveries (thousands) . . . . . . . . . . . . . . . . . . . . . . . . . . . . . . . . . . 1,354 1,302 1,315
Barrel miles (billions) . . . . . . . . . . . . . . . . . . . . . . . . . . . . . . . . . . . . . . 345 341 333
38

Year ended December 31, 2003 compared with year ended December 31, 2002
Operating income was higher in 2003 compared with 2002 due to higher revenue and loweroperating expenses, including depreciation. Operating revenue was $9.9 million higher in 2003compared with 2002 due to higher deliveries on the Lakehead and North Dakota systems, partiallyoffset by slightly lower tariffs.
Overall, production of western Canadian crude oil increased in 2003 over 2002 mainly due to thestart up of new oil sands projects in the province of Alberta. These latest oil sands projects differ fromconventional oil production in two ways. First, oil sands deposits are a mixture of bitumen, water, sandand clay. As a result, oil production takes the form of either mining the oil sands from subsurfacedeposits and separating out the water, sand and clay components, or, if the deposits are deeper, heatingthe reservoir sufficiently to flow the pure bitumen to the surface. Second, the bitumen requires eitherupgrading or blending prior to being sent to market. The upgrading process partially refines thebitumen into a crude stream, which can be readily refined by most conventional refineries. This productis known as synthetic crude oil. Due to startup challenges at the newest upgrader, known as theAthabasca Oil Sands Project (‘‘AOSP’’), 2003 crude oil production lagged behind expectations. Thisdelayed the expected increase in western Canadian oil production during the year, and as a result,impacted the level of deliveries on the Lakehead system.
On a full year basis, tariffs were lower during 2003 due to negative indexing adjustments calculatedunder FERC regulations and tariff reductions related to existing agreements with customers. InFebruary 2003, the FERC issued an Order on Remand, which replaced the annual index of ProducersPrice Index for Finished Goods (‘‘PPI’’) less one percent with an index of PPI without the minus onepercent. The FERC allowed the indexed levels to increase for a short period of time in 2003 to reflectthe change in the index during 2002. However, effective July 2003, the PPI adjustment was negative.
Power costs increased by $3.4 million in 2003 to $56.1 million from $52.7 million in 2002 primarilydue to the increase in deliveries on the Lakehead and North Dakota systems.
Operating and administrative expenses decreased by $0.6 million to $104.1 million in 2003 from$104.7 million in 2002. The Partnership experienced higher leak clean-up and remediation costs relatedto two leaks in Minnesota during 2003, as well as higher workforce costs related to benefits. Theseincreases were offset by lower oil measurement expenses and higher labor costs capitalized toconstruction projects.
Depreciation expense was lower in 2003 by $5.3 million compared with 2002. The decrease wasdue to revised depreciation rates effective January 1, 2003 on the Lakehead system of $13.4 million,offset by depreciation on new facilities placed into service during the fourth quarter of 2002 andthroughout 2003 of $8.1 million. The reduction in depreciation rates pursuant to a third party study,better represents the expected remaining service life of the Lakehead system.
Year ended December 31, 2002 compared with year ended December 31, 2001
Operating income for 2002 was $112.1 million compared with $97.7 million for 2001. Operatingincome was higher in 2002 compared with 2001 primarily due to higher revenues, partially offset byhigher operating expenses. Operating income for 2002 includes the full year results of the NorthDakota acquisition, whereas 2001 includes the results from the date of acquisition of May 18, 2001.
Operating revenue was higher in 2002 compared with 2001 due to increased tariffs and a full yearcontribution from the North Dakota system, partially offset by lower deliveries on the Lakeheadsystem. Tariffs were higher due to positive adjustments calculated under FERC regulations andagreements with customers. As well, the amount of heavy oil transported on the Lakehead system,which attracts a higher tariff, was higher in 2002 compared with 2001. Volumes delivered on theLakehead system declined over the period as western Canadian crude oil was delivered to othermarkets on competing pipeline systems.
39
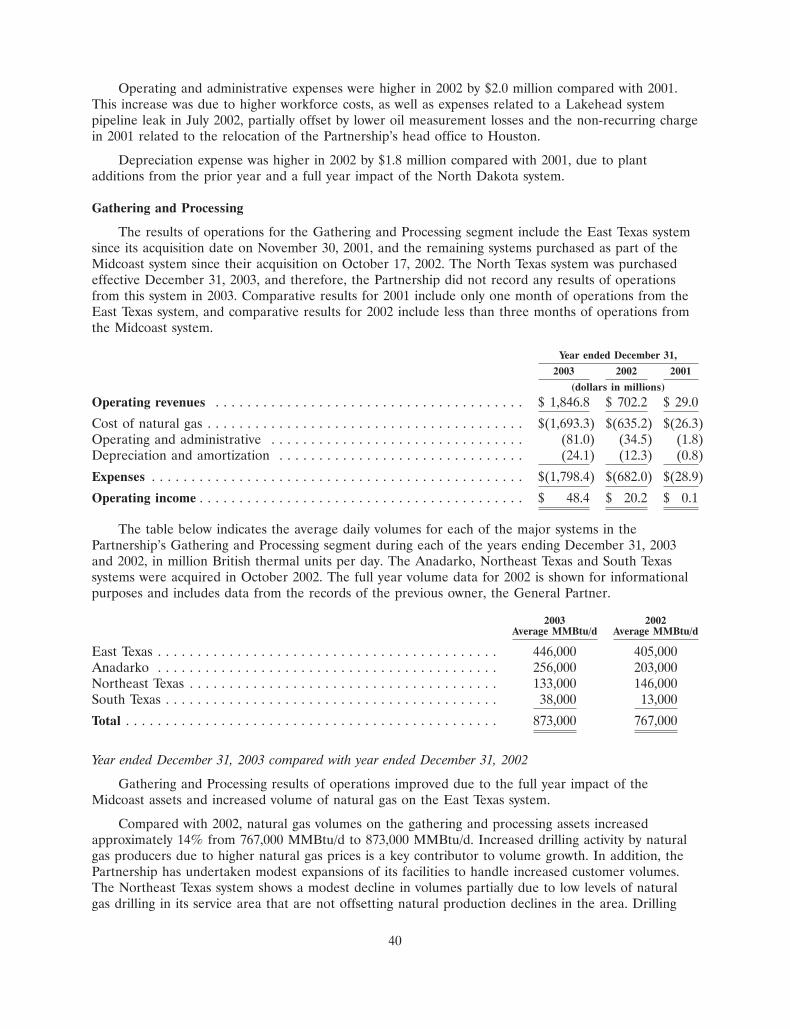
Operating and administrative expenses were higher in 2002 by $2.0 million compared with 2001.This increase was due to higher workforce costs, as well as expenses related to a Lakehead systempipeline leak in July 2002, partially offset by lower oil measurement losses and the non-recurring chargein 2001 related to the relocation of the Partnership’s head office to Houston.
Depreciation expense was higher in 2002 by $1.8 million compared with 2001, due to plantadditions from the prior year and a full year impact of the North Dakota system.
Gathering and Processing
The results of operations for the Gathering and Processing segment include the East Texas systemsince its acquisition date on November 30, 2001, and the remaining systems purchased as part of theMidcoast system since their acquisition on October 17, 2002. The North Texas system was purchasedeffective December 31, 2003, and therefore, the Partnership did not record any results of operationsfrom this system in 2003. Comparative results for 2001 include only one month of operations from theEast Texas system, and comparative results for 2002 include less than three months of operations fromthe Midcoast system.
Year ended December 31,
2003 2002 2001
(dollars in millions)
Operating revenues . . . . . . . . . . . . . . . . . . . . . . . . . . . . . . . . . . . . . . . $ 1,846.8 $ 702.2 $ 29.0
Cost of natural gas . . . . . . . . . . . . . . . . . . . . . . . . . . . . . . . . . . . . . . . . $(1,693.3) $(635.2) $(26.3)Operating and administrative . . . . . . . . . . . . . . . . . . . . . . . . . . . . . . . . (81.0) (34.5) (1.8)Depreciation and amortization . . . . . . . . . . . . . . . . . . . . . . . . . . . . . . . (24.1) (12.3) (0.8)
Expenses . . . . . . . . . . . . . . . . . . . . . . . . . . . . . . . . . . . . . . . . . . . . . . . $(1,798.4) $(682.0) $(28.9)
Operating income . . . . . . . . . . . . . . . . . . . . . . . . . . . . . . . . . . . . . . . . . $ 48.4 $ 20.2 $ 0.1
The table below indicates the average daily volumes for each of the major systems in thePartnership’s Gathering and Processing segment during each of the years ending December 31, 2003and 2002, in million British thermal units per day. The Anadarko, Northeast Texas and South Texassystems were acquired in October 2002. The full year volume data for 2002 is shown for informationalpurposes and includes data from the records of the previous owner, the General Partner.
2003 2002Average MMBtu/d Average MMBtu/d
East Texas . . . . . . . . . . . . . . . . . . . . . . . . . . . . . . . . . . . . . . . . . . . 446,000 405,000Anadarko . . . . . . . . . . . . . . . . . . . . . . . . . . . . . . . . . . . . . . . . . . . 256,000 203,000Northeast Texas . . . . . . . . . . . . . . . . . . . . . . . . . . . . . . . . . . . . . . . 133,000 146,000South Texas . . . . . . . . . . . . . . . . . . . . . . . . . . . . . . . . . . . . . . . . . . 38,000 13,000
Total . . . . . . . . . . . . . . . . . . . . . . . . . . . . . . . . . . . . . . . . . . . . . . . 873,000 767,000
Year ended December 31, 2003 compared with year ended December 31, 2002
Gathering and Processing results of operations improved due to the full year impact of theMidcoast assets and increased volume of natural gas on the East Texas system.
Compared with 2002, natural gas volumes on the gathering and processing assets increasedapproximately 14% from 767,000 MMBtu/d to 873,000 MMBtu/d. Increased drilling activity by naturalgas producers due to higher natural gas prices is a key contributor to volume growth. In addition, thePartnership has undertaken modest expansions of its facilities to handle increased customer volumes.The Northeast Texas system shows a modest decline in volumes partially due to low levels of naturalgas drilling in its service area that are not offsetting natural production declines in the area. Drilling
40

near these assets is expected to increase to a level, which should result in a lesser decline or keepproduction levels flat in the near future.
While high natural gas prices positively impacted volumes on the Partnership’s gathering andprocessing systems, this positive impact was largely offset by poor processing economics in 2003. Themajority of the Partnership’s operating income is derived from fee-based contracts, percentage of indexor percentage of proceeds contracts. However, a portion of this segment’s operating income is derivedfrom keep-whole processing of natural gas. This contract structure requires the Partnership to processnatural gas at times on limited volumes, when it may not be economic to do so. This can happen whennatural gas prices are unusually high or natural gas liquids prices are unusually low.
Keep-whole processing for the Partnership is mostly attributable to the Anadarko and East Texassystems. The Partnership’s keep-whole processing is a small but variable element of the gathering andprocessing segment’s operating income. During 2003, operating income associated with keep-wholeprocessing was approximately $1.9 million. This compares to operating income of $48.4 million for thegathering and processing segment as a whole.
During 2003, high natural gas prices, particularly at the beginning of the year, adversely affectedprocessing results. In the second half of 2003, processing economics improved marginally as a result oflower natural gas prices. As levels of natural gas in storage increased through the year, natural gasprices decreased.
The Partnership estimates that a $0.05 per MMBtu change in keep-whole processing operatingrevenues less cost of natural gas would increase or decrease total segment operating income byapproximately $4.0 million. A 50,000 MMBtu/d change in gathering volume will increase or decreaseoperating income by approximately $6.0 million. These estimates may vary depending upon the pipelinesystem to which they relate, competition, other factors and are subject to variability.
Natural Gas Transportation
The Natural Gas Transportation segment was established upon the acquisition of the Midcoastsystem on October 17, 2002, and its results of operations are included in the Partnership’s results sincethat date. The Natural Gas Transportation segment results for 2003 reflect a full year’s contribution tothe Partnership compared with less than three months of results in 2002.
Year ended December 31,
2003 2002 2001
(dollars in millions)
Operating revenues . . . . . . . . . . . . . . . . . . . . . . . . . . . . . . . . . . . . . . . . . . . $ 117.7 $ 19.8 $ —
Cost of natural gas . . . . . . . . . . . . . . . . . . . . . . . . . . . . . . . . . . . . . . . . . . . $ (67.6) $ (8.6) $ —Operating and administrative . . . . . . . . . . . . . . . . . . . . . . . . . . . . . . . . . . . . (21.3) (4.5) —Depreciation and amortization . . . . . . . . . . . . . . . . . . . . . . . . . . . . . . . . . . . (13.6) (2.8) —
Expenses . . . . . . . . . . . . . . . . . . . . . . . . . . . . . . . . . . . . . . . . . . . . . . . . . . $(102.5) $(15.9) $ —
Operating income . . . . . . . . . . . . . . . . . . . . . . . . . . . . . . . . . . . . . . . . . . . . $ 15.2 $ 3.9 $ —
The table below indicates the average daily volumes for each of the major systems in Partnership’sNatural Gas Transportation segment during each of the years ending December 31, 2003 and 2002, inmillion British thermal units per day. The UTOS, Midla, AlaTenn, KPC, Bamagas and other major
41
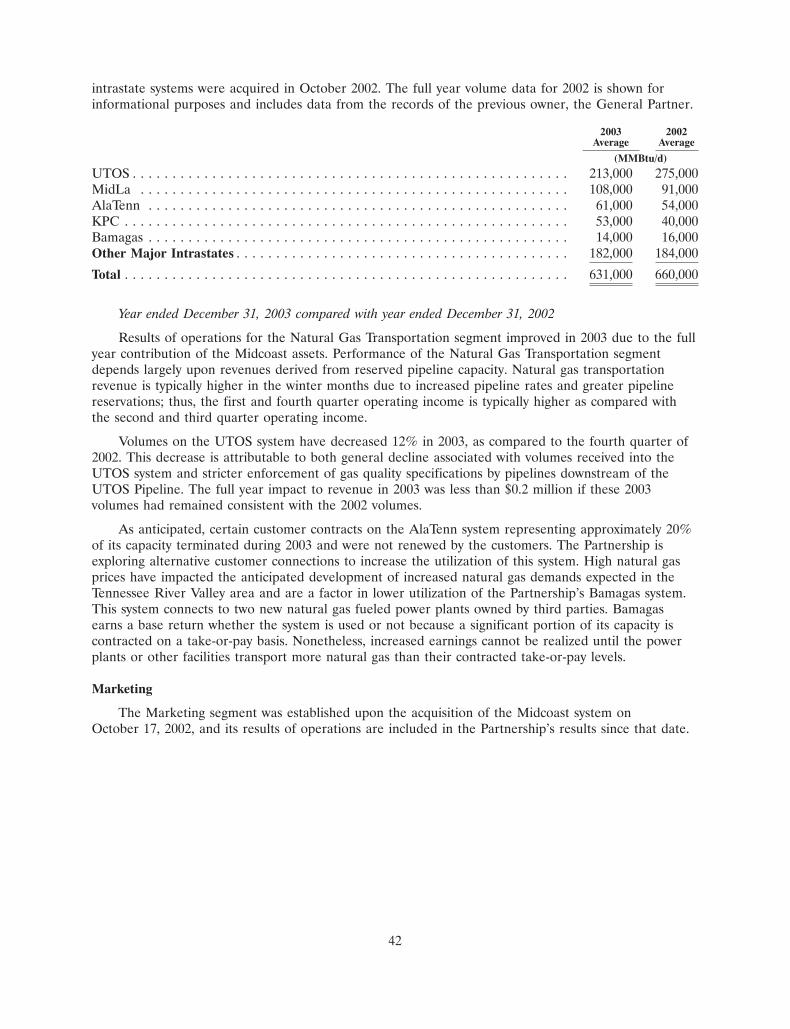
intrastate systems were acquired in October 2002. The full year volume data for 2002 is shown forinformational purposes and includes data from the records of the previous owner, the General Partner.
2003 2002Average Average
(MMBtu/d)
UTOS . . . . . . . . . . . . . . . . . . . . . . . . . . . . . . . . . . . . . . . . . . . . . . . . . . . . . . . 213,000 275,000MidLa . . . . . . . . . . . . . . . . . . . . . . . . . . . . . . . . . . . . . . . . . . . . . . . . . . . . . . 108,000 91,000AlaTenn . . . . . . . . . . . . . . . . . . . . . . . . . . . . . . . . . . . . . . . . . . . . . . . . . . . . . 61,000 54,000KPC . . . . . . . . . . . . . . . . . . . . . . . . . . . . . . . . . . . . . . . . . . . . . . . . . . . . . . . . 53,000 40,000Bamagas . . . . . . . . . . . . . . . . . . . . . . . . . . . . . . . . . . . . . . . . . . . . . . . . . . . . . 14,000 16,000Other Major Intrastates . . . . . . . . . . . . . . . . . . . . . . . . . . . . . . . . . . . . . . . . . . 182,000 184,000
Total . . . . . . . . . . . . . . . . . . . . . . . . . . . . . . . . . . . . . . . . . . . . . . . . . . . . . . . . 631,000 660,000
Year ended December 31, 2003 compared with year ended December 31, 2002
Results of operations for the Natural Gas Transportation segment improved in 2003 due to the fullyear contribution of the Midcoast assets. Performance of the Natural Gas Transportation segmentdepends largely upon revenues derived from reserved pipeline capacity. Natural gas transportationrevenue is typically higher in the winter months due to increased pipeline rates and greater pipelinereservations; thus, the first and fourth quarter operating income is typically higher as compared withthe second and third quarter operating income.
Volumes on the UTOS system have decreased 12% in 2003, as compared to the fourth quarter of2002. This decrease is attributable to both general decline associated with volumes received into theUTOS system and stricter enforcement of gas quality specifications by pipelines downstream of theUTOS Pipeline. The full year impact to revenue in 2003 was less than $0.2 million if these 2003volumes had remained consistent with the 2002 volumes.
As anticipated, certain customer contracts on the AlaTenn system representing approximately 20%of its capacity terminated during 2003 and were not renewed by the customers. The Partnership isexploring alternative customer connections to increase the utilization of this system. High natural gasprices have impacted the anticipated development of increased natural gas demands expected in theTennessee River Valley area and are a factor in lower utilization of the Partnership’s Bamagas system.This system connects to two new natural gas fueled power plants owned by third parties. Bamagasearns a base return whether the system is used or not because a significant portion of its capacity iscontracted on a take-or-pay basis. Nonetheless, increased earnings cannot be realized until the powerplants or other facilities transport more natural gas than their contracted take-or-pay levels.
Marketing
The Marketing segment was established upon the acquisition of the Midcoast system onOctober 17, 2002, and its results of operations are included in the Partnership’s results since that date.
42
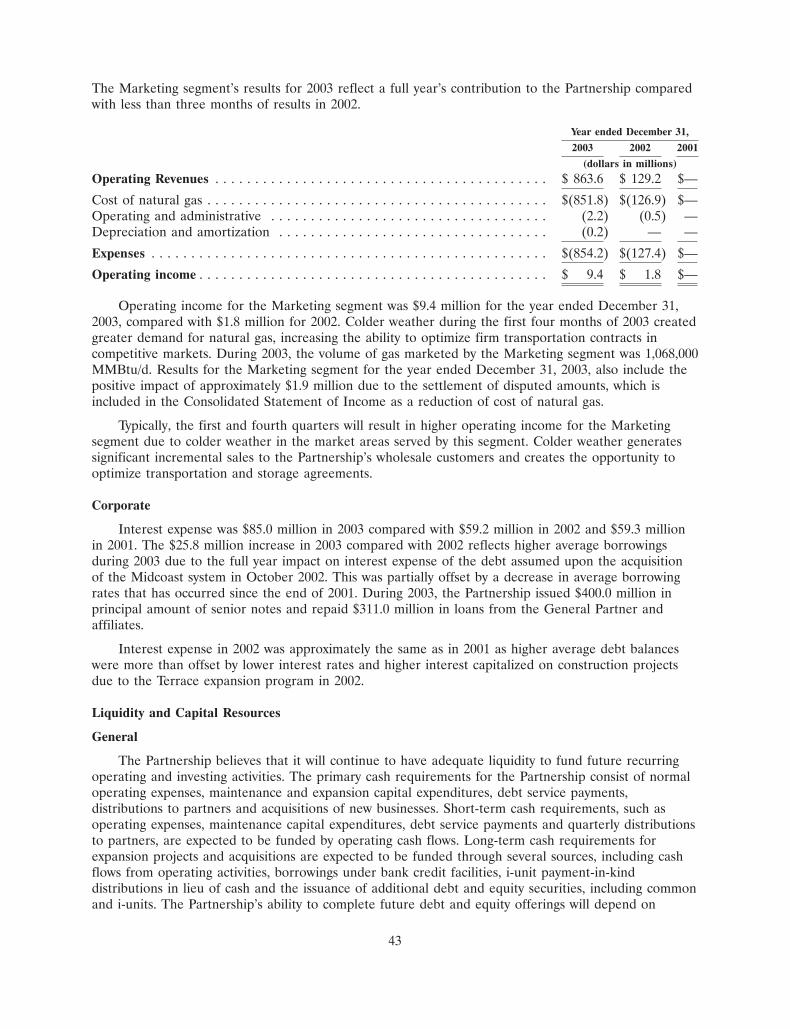
The Marketing segment’s results for 2003 reflect a full year’s contribution to the Partnership comparedwith less than three months of results in 2002.
Year ended December 31,
2003 2002 2001
(dollars in millions)
Operating Revenues . . . . . . . . . . . . . . . . . . . . . . . . . . . . . . . . . . . . . . . . . . $ 863.6 $ 129.2 $—
Cost of natural gas . . . . . . . . . . . . . . . . . . . . . . . . . . . . . . . . . . . . . . . . . . . $(851.8) $(126.9) $—Operating and administrative . . . . . . . . . . . . . . . . . . . . . . . . . . . . . . . . . . . (2.2) (0.5) —Depreciation and amortization . . . . . . . . . . . . . . . . . . . . . . . . . . . . . . . . . . (0.2) — —
Expenses . . . . . . . . . . . . . . . . . . . . . . . . . . . . . . . . . . . . . . . . . . . . . . . . . . $(854.2) $(127.4) $—
Operating income . . . . . . . . . . . . . . . . . . . . . . . . . . . . . . . . . . . . . . . . . . . . $ 9.4 $ 1.8 $—
Operating income for the Marketing segment was $9.4 million for the year ended December 31,2003, compared with $1.8 million for 2002. Colder weather during the first four months of 2003 createdgreater demand for natural gas, increasing the ability to optimize firm transportation contracts incompetitive markets. During 2003, the volume of gas marketed by the Marketing segment was 1,068,000MMBtu/d. Results for the Marketing segment for the year ended December 31, 2003, also include thepositive impact of approximately $1.9 million due to the settlement of disputed amounts, which isincluded in the Consolidated Statement of Income as a reduction of cost of natural gas.
Typically, the first and fourth quarters will result in higher operating income for the Marketingsegment due to colder weather in the market areas served by this segment. Colder weather generatessignificant incremental sales to the Partnership’s wholesale customers and creates the opportunity tooptimize transportation and storage agreements.
Corporate
Interest expense was $85.0 million in 2003 compared with $59.2 million in 2002 and $59.3 millionin 2001. The $25.8 million increase in 2003 compared with 2002 reflects higher average borrowingsduring 2003 due to the full year impact on interest expense of the debt assumed upon the acquisitionof the Midcoast system in October 2002. This was partially offset by a decrease in average borrowingrates that has occurred since the end of 2001. During 2003, the Partnership issued $400.0 million inprincipal amount of senior notes and repaid $311.0 million in loans from the General Partner andaffiliates.
Interest expense in 2002 was approximately the same as in 2001 as higher average debt balanceswere more than offset by lower interest rates and higher interest capitalized on construction projectsdue to the Terrace expansion program in 2002.
Liquidity and Capital Resources
General
The Partnership believes that it will continue to have adequate liquidity to fund future recurringoperating and investing activities. The primary cash requirements for the Partnership consist of normaloperating expenses, maintenance and expansion capital expenditures, debt service payments,distributions to partners and acquisitions of new businesses. Short-term cash requirements, such asoperating expenses, maintenance capital expenditures, debt service payments and quarterly distributionsto partners, are expected to be funded by operating cash flows. Long-term cash requirements forexpansion projects and acquisitions are expected to be funded through several sources, including cashflows from operating activities, borrowings under bank credit facilities, i-unit payment-in-kinddistributions in lieu of cash and the issuance of additional debt and equity securities, including commonand i-units. The Partnership’s ability to complete future debt and equity offerings will depend on
43
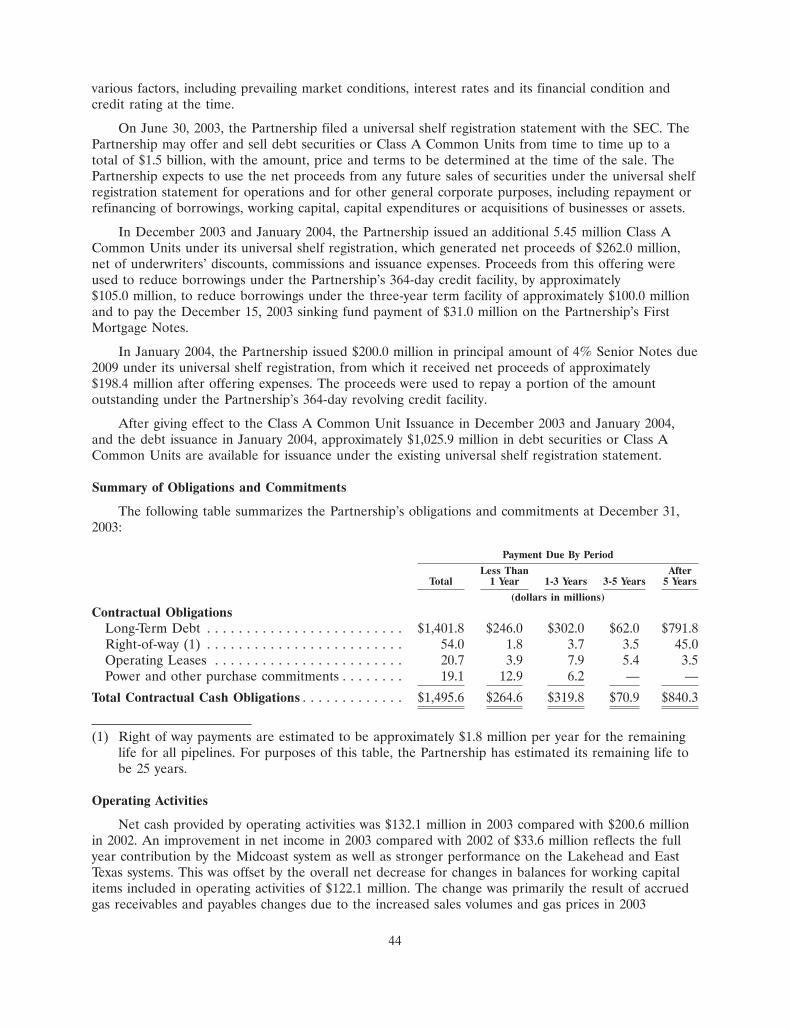
various factors, including prevailing market conditions, interest rates and its financial condition andcredit rating at the time.
On June 30, 2003, the Partnership filed a universal shelf registration statement with the SEC. ThePartnership may offer and sell debt securities or Class A Common Units from time to time up to atotal of $1.5 billion, with the amount, price and terms to be determined at the time of the sale. ThePartnership expects to use the net proceeds from any future sales of securities under the universal shelfregistration statement for operations and for other general corporate purposes, including repayment orrefinancing of borrowings, working capital, capital expenditures or acquisitions of businesses or assets.
In December 2003 and January 2004, the Partnership issued an additional 5.45 million Class ACommon Units under its universal shelf registration, which generated net proceeds of $262.0 million,net of underwriters’ discounts, commissions and issuance expenses. Proceeds from this offering wereused to reduce borrowings under the Partnership’s 364-day credit facility, by approximately$105.0 million, to reduce borrowings under the three-year term facility of approximately $100.0 millionand to pay the December 15, 2003 sinking fund payment of $31.0 million on the Partnership’s FirstMortgage Notes.
In January 2004, the Partnership issued $200.0 million in principal amount of 4% Senior Notes due2009 under its universal shelf registration, from which it received net proceeds of approximately$198.4 million after offering expenses. The proceeds were used to repay a portion of the amountoutstanding under the Partnership’s 364-day revolving credit facility.
After giving effect to the Class A Common Unit Issuance in December 2003 and January 2004,and the debt issuance in January 2004, approximately $1,025.9 million in debt securities or Class ACommon Units are available for issuance under the existing universal shelf registration statement.
Summary of Obligations and Commitments
The following table summarizes the Partnership’s obligations and commitments at December 31,2003:
Payment Due By Period
Less Than AfterTotal 1 Year 1-3 Years 3-5 Years 5 Years
(dollars in millions)
Contractual ObligationsLong-Term Debt . . . . . . . . . . . . . . . . . . . . . . . . . $1,401.8 $246.0 $302.0 $62.0 $791.8Right-of-way (1) . . . . . . . . . . . . . . . . . . . . . . . . . 54.0 1.8 3.7 3.5 45.0Operating Leases . . . . . . . . . . . . . . . . . . . . . . . . 20.7 3.9 7.9 5.4 3.5Power and other purchase commitments . . . . . . . . 19.1 12.9 6.2 — —
Total Contractual Cash Obligations . . . . . . . . . . . . . $1,495.6 $264.6 $319.8 $70.9 $840.3
(1) Right of way payments are estimated to be approximately $1.8 million per year for the remaininglife for all pipelines. For purposes of this table, the Partnership has estimated its remaining life tobe 25 years.
Operating Activities
Net cash provided by operating activities was $132.1 million in 2003 compared with $200.6 millionin 2002. An improvement in net income in 2003 compared with 2002 of $33.6 million reflects the fullyear contribution by the Midcoast system as well as stronger performance on the Lakehead and EastTexas systems. This was offset by the overall net decrease for changes in balances for working capitalitems included in operating activities of $122.1 million. The change was primarily the result of accruedgas receivables and payables changes due to the increased sales volumes and gas prices in 2003
44

compared with 2002, a deposit of $13.1 million made in December 2003, related to the Mid-Continentasset acquisition that closed on March 1, 2004, as well as the result of timing differences in thecollection on and payment of the Partnership’s current accounts.
At December 31, 2003, cash and cash equivalents totaled $64.4 million, an increase of $4.1 millionfrom December 31, 2002. Of this amount, $55.8 million was available for cash distributions tounitholders. Of the cash available for distribution, $9.3 million was retained from i-unit holders and$0.2 million was retained from the General Partner by the Partnership for use in its business. Thefourth quarter distribution to unitholders and the General Partner of $46.8 million ($0.925 per unit),which includes the effects of $0.5 million for the exercise of the over-allotment option in January 2004,was paid on February 13, 2004.
Investing Activities
Net cash used in investing activities was $431.0 million for the year ended December 31, 2003,compared with $557.2 million for the prior year. The $126.2 million decrease in funds utilized ininvesting activities was attributable to two items:
• Lower cash out flows made for strategic acquisitions in 2003 compared with 2002 of$55.0 million. During 2003, the Partnership acquired the North Texas system for cash paid of$249.7 million and paid post-closing adjustments to the General Partner related to the Midcoastacquisition of $43.8 million, compared with the acquisition of the Midcoast system during 2002for cash paid of $344.4 million; and
• A decrease in additions to property, plant and equipment in 2003 of $85.4 million primarily dueto a significant amount of construction activity during 2002 related to the Terrace Phase IIIexpansion program.
During 2003, the Partnership spent $129.3 million for capital expenditures including coremaintenance and enhancement projects. Core maintenance activities, such as the replacement ofequipment and planned major maintenance activities, are undertaken to enable the Partnership’ssystems to operate at their maximum operating capacity. Enhancements to the systems are expected toextend the life of the systems, reduce costs or enhance revenues, and permit the Partnership to respondto developing industry and government standards and the changing service expectations of itscustomers. The Partnership’s core maintenance capital expenditures increased to $28.8 million for 2003compared with $14.2 million for 2002, due to the full year impact of the Midcoast system acquisition in2003.
Financing Activities
Net cash provided by financing activities was $303.0 million in 2003, compared with $376.7 millionin 2002. The decrease of $73.7 million from 2002 is primarily due to higher net repayments to theGeneral Partner and affiliates and an increase in the distributions to partners. In May 2003, thePartnership issued $400.0 million in aggregate principal of senior unsecured notes and used the netproceeds to repay existing loans from Enbridge affiliates and amounts outstanding under thePartnership’s credit facilities. Cash distributions to partners increased to $156.7 million in 2003compared with $137.3 million in 2002. The increase in distributions was due to:
• an increase in the per unit cash distributions paid, from $3.60 per unit in 2002 to $3.70 per unitin 2003;
• an increase in the number of units outstanding; and
• an increase in the general partner incentive distributions, which resulted from increased cashdistributions to unitholders.
45

During 2003, working capital decreased by $118.7 million to a working capital deficit of$179.8 million, primarily due to the inclusion of the $215.0 million balance of the Partnership’s 364-daycredit facility in current liabilities in 2003, compared with classifying it as long-term debt in 2002. Thisbalance was recorded as a current liability, as the Partnership’s lender granted a three-month extensionto the existing maturity date of January 2004 to facilitate the credit review process and bettercoordinate the annual request for extension.
In December 2003, the Partnership issued 5.0 million Class A Common Units at $50.30 per unit,which generated proceeds, net of underwriters’ discounts, commissions and issuance expenses, ofapproximately $240.3 million. Proceeds from this offering were used to reduce borrowings under thePartnership’s 364-day credit facility by approximately $105.0 million, $100.0 million to reduceborrowings under the Partnership’s three-year term facility and $31.0 million to pay the December 15,2003 sinking fund payment on the First Mortgage Notes. The remainder of the net proceeds was usedto fund a portion of the North Texas system acquisition. In addition to the proceeds generated from theunit issuances, the General Partner contributed $5.1 million to the Partnership to maintain its 2%general partner interest in the Partnership.
In May 2003, the Partnership issued 3.85 million Class A Common Units at $44.79 per unit, whichgenerated proceeds, net of underwriters’ discounts, commissions and issuance expenses, ofapproximately $165.5 million. Proceeds from this offering were used to reduce borrowings under thePartnership’s 364-day credit facility by $102.4 million and an affiliate loan by $63.1 million. In additionto the proceeds generated from the unit issuances, the General Partner contributed $3.5 million to thePartnership to maintain its 2% general partner interest in the Partnership.
In March 2002, the Partnership issued 2.26 million Class A Common Units at $42.75 per unit. Thenet proceeds from the offering were $93.3 million and were used to repay indebtedness.
On October 17, 2002, the Partnership issued 9,000,000 i-units to Enbridge Management for netproceeds of $330.8 million. The Partnership used the net proceeds to repay debt owed to affiliates thatwas assumed in connection with the acquisition of the Midcoast system.
Cash Distributions
The Partnership distributes quarterly to the General Partner and the holders of its common unitsan amount equal to its’’available cash,’’ which generally is defined to mean for any calendar quarter thesum of all of the cash receipts of the Partnership plus net reductions to reserves less all of its cashdisbursements and net changes to reserves. These reserves are retained to provide for the properconduct of the Partnership’s business, to stabilize distributions of cash to unitholders and the GeneralPartner and, as necessary, to comply with the terms of any agreement or obligation of the Partnership.Enbridge Management, as the delegate of the General Partner under a Delegation of ControlAgreement, computes the amount of the Partnership’s available cash.
Enbridge Management, as owner of the i-units, does not receive distributions in cash. Instead, eachtime that the Partnership makes a cash distribution to the General Partner and the holders of itscommon units, the number of i-units owned by Enbridge Management and the percentage of total unitsin the Partnership owned by Enbridge Management increases automatically under the provisions of thePartnership Agreement with the result that the number of i-units owned by Enbridge Management willequal the number of Enbridge Management’s shares and voting shares that are then outstanding. Theamount of this increase per i-unit is determined by dividing the cash amount distributed per commonunit by the average price of one of Enbridge Management’s listed shares on the NYSE for the 10-dayperiod immediately preceding the ex-dividend date for Enbridge Management’s shares. For purposes ofcalculating the sum of all distributions of available cash, the cash equivalent amount of the additionali-units that are issued when a distribution of cash is made to the General Partner and owners ofcommon units is treated as distribution of available cash, even though the i-unit holder will not receivecash. The Partnership will retain and use that cash in its business.
46
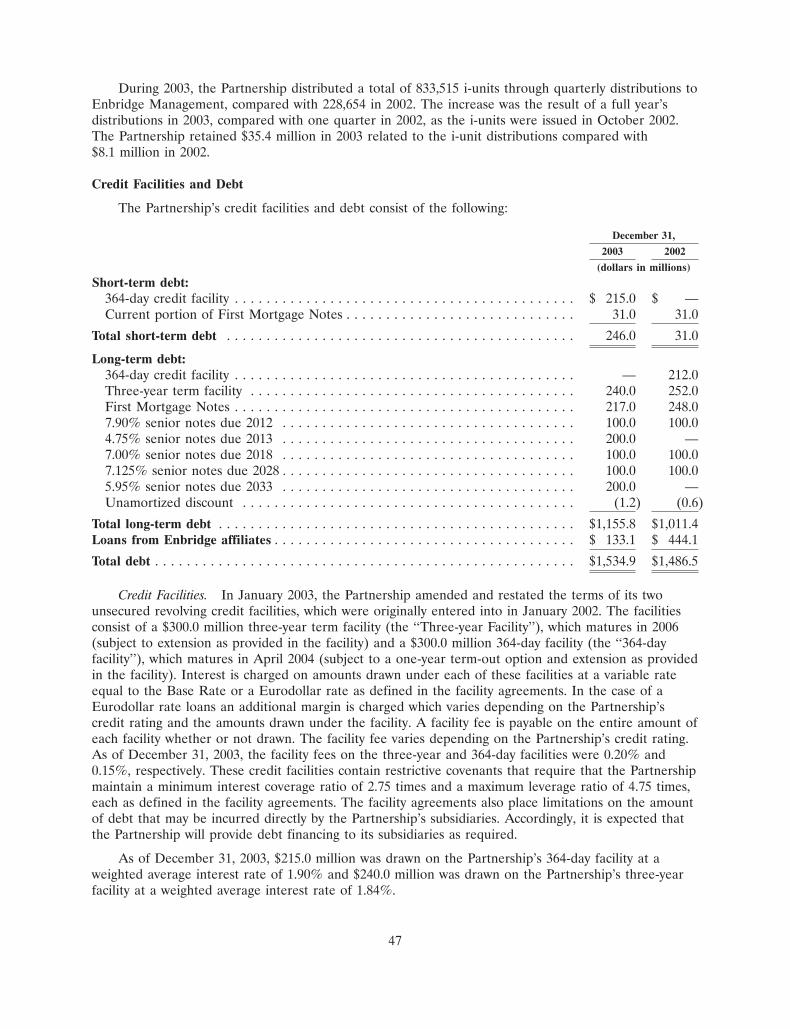
During 2003, the Partnership distributed a total of 833,515 i-units through quarterly distributions toEnbridge Management, compared with 228,654 in 2002. The increase was the result of a full year’sdistributions in 2003, compared with one quarter in 2002, as the i-units were issued in October 2002.The Partnership retained $35.4 million in 2003 related to the i-unit distributions compared with$8.1 million in 2002.
Credit Facilities and Debt
The Partnership’s credit facilities and debt consist of the following:
December 31,
2003 2002
(dollars in millions)
Short-term debt:364-day credit facility . . . . . . . . . . . . . . . . . . . . . . . . . . . . . . . . . . . . . . . . . . . $ 215.0 $ —Current portion of First Mortgage Notes . . . . . . . . . . . . . . . . . . . . . . . . . . . . . 31.0 31.0
Total short-term debt . . . . . . . . . . . . . . . . . . . . . . . . . . . . . . . . . . . . . . . . . . . . 246.0 31.0
Long-term debt:364-day credit facility . . . . . . . . . . . . . . . . . . . . . . . . . . . . . . . . . . . . . . . . . . . — 212.0Three-year term facility . . . . . . . . . . . . . . . . . . . . . . . . . . . . . . . . . . . . . . . . . 240.0 252.0First Mortgage Notes . . . . . . . . . . . . . . . . . . . . . . . . . . . . . . . . . . . . . . . . . . . 217.0 248.07.90% senior notes due 2012 . . . . . . . . . . . . . . . . . . . . . . . . . . . . . . . . . . . . . 100.0 100.04.75% senior notes due 2013 . . . . . . . . . . . . . . . . . . . . . . . . . . . . . . . . . . . . . 200.0 —7.00% senior notes due 2018 . . . . . . . . . . . . . . . . . . . . . . . . . . . . . . . . . . . . . 100.0 100.07.125% senior notes due 2028 . . . . . . . . . . . . . . . . . . . . . . . . . . . . . . . . . . . . . 100.0 100.05.95% senior notes due 2033 . . . . . . . . . . . . . . . . . . . . . . . . . . . . . . . . . . . . . 200.0 —Unamortized discount . . . . . . . . . . . . . . . . . . . . . . . . . . . . . . . . . . . . . . . . . . (1.2) (0.6)
Total long-term debt . . . . . . . . . . . . . . . . . . . . . . . . . . . . . . . . . . . . . . . . . . . . . $1,155.8 $1,011.4Loans from Enbridge affiliates . . . . . . . . . . . . . . . . . . . . . . . . . . . . . . . . . . . . . . $ 133.1 $ 444.1
Total debt . . . . . . . . . . . . . . . . . . . . . . . . . . . . . . . . . . . . . . . . . . . . . . . . . . . . . $1,534.9 $1,486.5
Credit Facilities. In January 2003, the Partnership amended and restated the terms of its twounsecured revolving credit facilities, which were originally entered into in January 2002. The facilitiesconsist of a $300.0 million three-year term facility (the ‘‘Three-year Facility’’), which matures in 2006(subject to extension as provided in the facility) and a $300.0 million 364-day facility (the ‘‘364-dayfacility’’), which matures in April 2004 (subject to a one-year term-out option and extension as providedin the facility). Interest is charged on amounts drawn under each of these facilities at a variable rateequal to the Base Rate or a Eurodollar rate as defined in the facility agreements. In the case of aEurodollar rate loans an additional margin is charged which varies depending on the Partnership’scredit rating and the amounts drawn under the facility. A facility fee is payable on the entire amount ofeach facility whether or not drawn. The facility fee varies depending on the Partnership’s credit rating.As of December 31, 2003, the facility fees on the three-year and 364-day facilities were 0.20% and0.15%, respectively. These credit facilities contain restrictive covenants that require that the Partnershipmaintain a minimum interest coverage ratio of 2.75 times and a maximum leverage ratio of 4.75 times,each as defined in the facility agreements. The facility agreements also place limitations on the amountof debt that may be incurred directly by the Partnership’s subsidiaries. Accordingly, it is expected thatthe Partnership will provide debt financing to its subsidiaries as required.
As of December 31, 2003, $215.0 million was drawn on the Partnership’s 364-day facility at aweighted average interest rate of 1.90% and $240.0 million was drawn on the Partnership’s three-yearfacility at a weighted average interest rate of 1.84%.
47

First Mortgage Notes. The First Mortgage Notes are collateralized by a first mortgage onsubstantially all of the property, plant and equipment of the Lakehead Partnership and are due andpayable in equal annual installments of $31.0 million until their maturity in 2011. The Notes containvarious restrictive covenants applicable to the Partnership, and restrictions on the incurrence ofadditional indebtedness, including compliance with certain debt issuance tests. The Partnership believesthese issuance tests will not negatively impact its ability to finance future expansion projects. Under theFirst Mortgage Note Agreements, the Partnership cannot make cash distributions more frequently thanquarterly in an amount not to exceed Available Cash for the immediately preceding calendar quarter. Ifthe notes were to be paid prior to their stated maturities, the First Mortgage Note Agreements providefor the payment of a redemption premium by the Partnership.
Senior Notes. In addition to the $300.0 million of Senior Unsecured Notes previously outstanding,on May 27, 2003, the Partnership issued $200.0 million in aggregate principal amount of its 4.75%Notes due 2013 and $200.0 million in aggregate principal amount of its 5.95% Notes due 2033 in aprivate placement. The Partnership used the proceeds of approximately $396.3 million, net of expensesof approximately $3.0 million, to repay loans from affiliates of the Partnership and other bank debt.The Partnership recorded a discount of $0.7 million in connection with the issuance of the Notes. OnJune 30, 2003, the Partnership completed a Form S-4 with the SEC, which registered the exchange ofthe unregistered Notes for publicly registered Notes.
All of the notes pay interest semi-annually and have varying maturities and terms as previouslyoutlined in the table above. The senior unsecured notes do not contain any covenants restricting theissuance of additional indebtedness.
Loans from Enbridge affiliates. As of December 31, 2003, the Partnership had $133.1 million indebt outstanding under a note to an affiliate of the General Partner. This note relates to debt assumedby the Partnership in connection with the acquisition of the Midcoast system in October 2002. The notematures in 2007 and has cross-default provisions that are triggered by events of default under the FirstMortgage Notes issued by the Partnership or defaults under the Partnership’s three-year term facilityand 364-day credit facility. The note is subordinate to the Partnership’s credit facilities and other seniorindebtedness.
Off-Balance Sheet Arrangements
The Partnership has no off-balance sheet arrangements.
Credit Ratings
In May 2003, Standard & Poor’s and Moody’s assigned the ratings for the Partnership’s seniorunsecured debt obligations of BBB and a Baa2, respectively. In May 2003, Moody’s also lowered itssenior unsecured debt rating of the Lakehead Partnership, a wholly-owned subsidiary of thePartnership, from A3 to Baa1. Standard & Poor’s rating for the Lakehead Partnership’s seniorunsecured debt obligations was unchanged during 2003 at BBB+.
Cash Requirements for Future Growth
Acquisitions. The primary strategy of the Partnership is to grow cash distributions through theprofitable expansion of existing assets and through development and acquisition of complementarybusinesses with risk profiles similar to the Partnership’s current businesses. The Partnership willcontinue to analyze potential acquisitions, with a focus on crude oil, refined products and natural gaspipelines, terminals and related facilities. Major energy companies have sold their non-strategic assetsin recent years, continuing the trend of rationalization of the energy infrastructure in the United States.The Partnership expects this trend to continue and believes it is well positioned to participate in theseopportunities. The Partnership will seek opportunities throughout the United States, particularly in the
48

U.S. Gulf Coast area, where asset acquisitions are anticipated in and around its recently acquirednatural gas gathering, processing, and transportation businesses.
The Partnership expects that the funds needed to achieve the objective of growth throughacquisitions will be obtained through a combination of cash flows from operating activities, borrowingsunder bank credit facilities, i-unit payment-in-kind distributions in lieu of cash and the issuance ofadditional debt and equity securities, including common units and i-units.
The Partnership’s acquisition of the North Texas system on December 31, 2003 for $249.7 millionwas funded with borrowings under the Partnership’s 364-day revolving credit facility and three-yearterm facility. The additional debt will result in increased debt service costs in the future. To the extentthat proceeds from future equity offerings are used to reduce the principal amount of debt, thePartnership’s interest expense will be reduced. To the extent that the Partnership refinances its existingdebt with new debt, its interest expense will generally be affected by differences in interest ratescharged on the existing debt versus the new debt and by any fees associated with the new debt.
On December 22, 2003, the Partnership entered into definitive agreements to acquire crude oilpipeline and storage systems from Shell Pipeline Company LP and Shell Oil Products US (‘‘Shell’’) for$115.0 million, excluding customary closing adjustments for working capital and other items. The assetpurchase closed on March 1, 2004. The Partnership funded the acquisition through its existing creditfacilities.
Distributions. For the year ended December 31, 2003, the declared annual distribution rate was$3.70 per unit, compared with $3.60 per unit for the year ended December 31, 2002. An increase in thePartnership’s distribution rate will result in additional cash payments to existing unitholders and theGeneral Partner. As well, an increase in the number of common units eligible for cash distributions willresult in higher total distribution payments. The Partnership expects that all cash distributions will bepaid out of operating cash flows over the long-term; however, from time to time, the Partnership maytemporarily borrow under its credit facilities for the purpose of paying cash distributions until the fullimpact of operations is realized.
Capital Spending. At December 31, 2003, the Partnership had $3.7 million in estimatedoutstanding purchase commitments attributable to capital projects for the construction of assets thatwill be recorded as Property, Plant and Equipment.
Expenditures related to Property, Plant and Equipment are capitalized (‘‘capital expenditures’’),subject to a minimum rule, that have a useful life greater than one year for (1) assets purchased orconstructed; (2) existing assets that are extended, replaced, or improved; or (3) all land, regardless ofcost. Acquisition of new assets, additions, replacements and improvements (other than land) costingless than the established minimum rules are expensed accordingly.
Capital expenditures are categorized by the Partnership as either core maintenance orenhancement expenditures. Core maintenance expenditures are those expenditures that are necessary tomaintain the service capability of the existing assets and includes the replacement of systemcomponents and equipment which is worn, obsolete or completing its useful life. Enhancementexpenditures improve the service capability of the existing assets, extend asset useful lives, increasecapacities from existing levels, reduce costs or enhance revenues, and enable the Partnership to respondto governmental regulations and developing industry standards.
49

In 2004, the Partnership anticipates capital expenditure spending to approximate:(dollars in millions)
System enhancements . . . . . . . . . . . . . . . . . . . . . . . . . . . . . . . . . . . . . . . $122.0Core maintenance activities . . . . . . . . . . . . . . . . . . . . . . . . . . . . . . . . . . . 33.0Lakehead System expansion projects . . . . . . . . . . . . . . . . . . . . . . . . . . . . . 40.0East Texas expansion . . . . . . . . . . . . . . . . . . . . . . . . . . . . . . . . . . . . . . . . 105.0
$300.0
Excluding major expansion projects and acquisitions, ongoing capital expenditures are expected toaverage approximately $98.0 million annually (approximately 35% for core maintenance and 65% forsystem enhancements).
The Partnership anticipates funding the expenditures temporarily through its bank credit facilities,with permanent debt and equity funding being provided when appropriate.
The Partnership expects to incur continuing annual capital and operating expenditures for pipelineintegrity measures to ensure both regulatory compliance and to maintain the overall integrity of thepipeline systems. Expenditure levels have continued to increase as pipelines age and require higherlevels of inspection or maintenance; however, these are viewed to be consistent with industry trends.
Included in the anticipated capital expenditures spending for system enhancements in 2004 isapproximately $25.0 million of capital expenditures to ensure regulatory compliance on the Lakeheadsystem. This spending is for pressure testing of the Lakehead system to establish operating pressures inexcess of operating limits that would otherwise be allowed under current circumstances.
Subsequent Events
Class A Common Unit issuance
In January 2004, the Partnership issued an additional 450,000 Class A Common Units to itsunderwriters pursuant to the exercise of the over-allotment option as part of the December 2003Class A Common Unit issuance. This resulted in additional proceeds to the Partnership, net ofunderwriters’ fees and discounts, commissions and issuance expenses, of approximately $21.7 million.The proceeds were used to reduce amounts outstanding under the Partnership’s revolving creditfacilities.
Distribution Declaration
On January 22, 2004, the Partnership’s Board of Directors declared a distribution payable onFebruary 13, 2004, to unitholders of record as of February 2, 2004, of its available cash of $55.8 millionat December 31, 2003, or $0.925 per common unit. Of this distribution, $9.3 million was distributed ini-units to i-unit holders and $0.2 million was retained from the General Partner in respect of this i-unitdistribution.
Senior Notes offering
In January 2004, the Partnership issued $200 million in principal amount of 4% Senior Notes due2009, from which it received net proceeds of $198.4 million after offering expenses. The proceeds wereused to repay a portion of the amount outstanding under the 364-day revolving credit facility.
Mid-Continent Liquids System
On December 22, 2003, the Partnership entered into definitive agreements to acquire crude oilpipeline and storage systems from Shell Pipeline Company LP and Shell Oil Products US (‘‘Shell’’) for$115.0 million, excluding customary closing adjustments for working capital and other items. The asset
50

purchase closed on March 1, 2004. The assets acquired serve refineries in the Mid-Continent from theCushing, Oklahoma hub, and consist of the following:
• The 433-mile Ozark pipeline that currently transports approximately 170,000 barrels of crude oilper day from Cushing to Wood River, Illinois;
• A 1.2 million barrel storage terminal located in El Dorado, Kansas;
• The 47-mile West Tulsa pipeline that currently transports approximately 55,000 barrels per dayto two refineries in Oklahoma; and
• The storage terminal at Cushing, which is one of the largest terminal facilities in North Americawith 8.3 million barrels of storage capacity.
These systems provide cash flows primarily from toll or fee-based revenues from a combination ofregulated assets and contracted unregulated assets and are expected to be accretive to the Partnership’sdistributable cash flow. The assets are consistent with the Partnership’s core operating expertise incrude oil pipelines and the throughput originates from sources of supply different from those on itsother crude oil systems, providing increased diversity in the Partnership’s sources of cash flow.
Enbridge concurrently acquired Shell’s Patoka West Tank Farm. These assets complementEnbridge’s initiative to access new markets for Canadian crude oil. The Partnership expects to benefitfrom the market access initiative by facilitating throughput on the Lakehead system.
Other Matters
Future Prospects
The Partnership believes that its financial performance will continue to improve in 2004 as a resultof increased capacity utilization on the Lakehead system, combined with the contributions from therecently acquired North Texas and Mid-Continent Liquids systems.
Liquids Transportation
Average daily crude oil deliveries on the Lakehead system are expected to increase by 100,000 bpdduring 2004, from 1.354 million barrels per day in 2003 to approximately 1.45 million bpd in 2004. Themajority of the growth in deliveries is expected to come from a full year’s production from the AOSPproject that commenced during 2003. The AOSP is sponsored by two multinational integrated oilcompanies and an independent oil and gas company. While start-up problems delayed the expectedincremental supply from the AOSP during 2003, the Partnership anticipates production to increasesignificantly in 2004 to meet the AOSP sponsor’s expectations. This increase in supply is expected toresult in higher deliveries on the Lakehead system.
Future prospects for the Lakehead system depend upon increased crude oil production fromwestern Canada. While conventional oil supplies in this area are declining, crude oil production fromCanada’s oil sands supply is increasing. Estimated recoverable crude oil reserves from the oil sands,using existing technology, represent only 10% of the volume in place, of approximately 1.6 trillionbarrels. To put this in perspective, this total volume in western Canada exceeds the estimated reservesof Saudi Arabia. Therefore this resource is expected to be an important crude oil supply for NorthAmerica in the coming decades. Recognizing this, a number of major oil companies have announcedprojects requiring investments of approximately $30 billion over the next decade. This level ofinvestment is expected to increase production of crude oil and enhance utilization of the capacityavailable on the Lakehead system.
There are several major oil sands projects scheduled for completion over the next few yearsincluding expansions of existing oil sands projects as well as new projects. The two original oil sandsproducers, Suncor and Syncrude, are both constructing projects to increase production by 2005-2006. Incombination, these projects are expected to provide more than 100,000 bpd of supply. In addition to
51

the Alberta oil sands, Canada has substantial conventional crude oil resources. Conventional crudeproduction will remain sensitive to the price of crude oil and the level of crude oil drilling activity. Fora complete discussion of supply and demand for crude oil, please see ‘‘Items 1. & 2. Business andProperties.’’
Recognizing the need to expand beyond the Lakehead system’s traditional markets, Enbridge andthe Partnership have undertaken an Oil Sands Market Study to research supply and disposition ofcrude oil. The findings indicate that there is demand among U.S. refiners who have not previously hadaccess to Canadian crude oil due to a lack of pipeline infrastructure or economic tariffs. Enbridge andthe Partnership are focusing on developing transportation solutions to allow PADD II refineries, andultimately, refiners on the U.S. Gulf Coast, to gain increased or new access to western Canadian crudeoil production.
Two tangible steps have already been announced under this initiative. First, Enbridge acquired a90% stake in a pipeline that runs from Cushing, Oklahoma to Chicago and intends to reverse its flow.The pipeline will be renamed the Spearhead Pipeline and will provide capacity to deliver 200,000 bpdinto the major oil hub at Cushing by 2005. The Partnership expects to benefit following the reversal, aswestern Canadian crude oil will be carried on the Lakehead system as far as Chicago, and thentransferred to Spearhead. The second step was the Partnership’s announcement in October 2003 ofplans to extend the Lakehead system with a new 250,000 to 400,000 bpd pipeline to serve the largeWood River, Illinois refining center by 2007. This ‘‘Southern Access’’ project would intersect withSpearhead to offer customers delivery options to Cushing and Chicago, in addition to Wood River.
The Partnership closed its previously announced acquisition of Shell’s Mid-Continent liquidssystems, centered around the major Cushing crude oil hub, on March 1, 2004. The pipeline assetsprovide U.S. domestic and imported feedstock to Mid-Continent area refineries. The Partnership alsoacquired considerable tank storage capacity, mainly at the Cushing hub. The Cushing storage capacityin excess of operating requirements is contracted under term agreements. These assets provide basindiversification for the Partnership, because the crude oil shipped is not sourced from the westernCanadian basin, as are the bulk of the Lakehead system deliveries.
Natural Gas—Gathering and Processing, Transportation and Marketing
The Partnership’s natural gas assets are located in the Gulf Coast and Mid-Continent regions ofthe United States, two of the premier natural gas producing areas of the United States. As a result,there are many opportunities to connect new natural gas supplies either by installing new facilities oracquiring adjacent third-party gathering operations. Consolidation with neighboring facilities will extractefficiencies by eliminating costs, for example, by combining redundant facilities, increasing volume, andincreasing processing margins. These opportunities tend to involve modest amounts of capital withattractive rates of return.
Results of the Partnership’s natural gas gathering and processing business depend upon the drillingactivities of natural gas producers in the areas served by the Partnership. During 2003, increaseddrilling in the areas where the Partnership’s gathering systems are located has generally exceeded thenational trend. One of the prominent areas in which this occurred was the Barnett Shale formation innorth Texas, where natural gas production increased from 180 MMcf/d in 1999 to 750 MMcf/d in late2003. The Barnett Shale is a prominent new natural gas development within the Fort Worth Basin, notpreviously accessed by the Partnership’s system. To address this opportunity, the Partnership acquiredthe North Texas system in a transaction that closed on December 31, 2003. The acquired facilities willprovide approximately 220 MMcf/d of processing capacity. The Barnett Shale is being activelydeveloped, and the Partnership anticipates that throughput on the North Texas system will increasemodestly in each of the next several years.
The Partnership has announced proposed construction of a new 500 MMcf/d intrastatetransmission pipeline to carry increased volumes of natural gas to the pipeline hub at Carthage, Texas.
52

Carthage access is important to natural gas shippers because it offers a number of connections tointerstate pipelines, which tend to support more favorable margins to producers. Following a successfulopen season for the proposed East Texas line, preliminary volume commitments were obtained fromnatural gas producers, and the Partnership expects to proceed with construction to bring the system onstream in mid 2005. The Partnership is pursuing options to connect production from North Texas to thenew transmission line and provide Carthage access for gas producers in that area.
Growth by Acquisitions
Acquisitions are expected to play a role in the achievement of financial targets of the Partnershipfor 2004. In general, these acquisitions are expected to be in or near areas where the Partnershipalready operates and will present the best opportunities for consolidation savings and enhancement ofthe Partnership’s market position. In addition to the previously announced Mid-Continent crude oilacquisition, approximately $175.0 million of capital has been budgeted for additional acquisitions in2004.
The Partnership also will evaluate more significant acquisitions. Subject to financing capability,Enbridge plans to use the Partnership as its primary vehicle for acquiring mature energy delivery assets,particularly in the Gulf Coast region of the United States. The Partnership could make acquisitionsdirectly from Enbridge or its subsidiaries in the future and will continue to pursue strategic acquisitionsfrom unaffiliated parties.
Growth in Cash Distributions
The Partnership has modestly grown its cash distributions over the last several years. Cashdistributions would likely have increased more were it not for lower utilization of the Lakehead systemexpansions than anticipated when the Partnership committed to the expansions in the late 1990’s.Increased utilization of the Lakehead system and the approximately $415.0 million Terrace expansionprogram are fundamental to increasing cash distributions above the current $3.70 per unit, per year. Itis anticipated that oil sands developments will provide increased utilization of the Lakehead system inthe near future. It is also anticipated that oil sands development will support further expansions, suchas the Southern Access project, that will grow the earnings and cash flow of the Partnership. Selectedacquisitions and growth of the natural gas segments are also expected to contribute to improvednear-term performance of the Partnership.
Regulatory Matters
KPC System
From 1998, when KPC became subject to the FERC jurisdiction, until November 9, 2002, whenKPC’s rate case rates became effective, the FERC established initial rates based upon an annual cost ofservice of approximately $31.0 million. Since that time, these initial rates have been the subject ofvarious ongoing challenges that remain unresolved.
The United States Court of Appeals for the D.C. Circuit issued an order on August 12, 2003,vacating the FERC’s 2001 remand order and 2002 rehearing order and remanded the issue of KPC’sinitial rates back to the FERC with directions that the FERC address the question of an appropriaterate refund. In prior KPC orders in this proceeding, the FERC determined that it had no authority toimpose a refund condition on initial rates. On October 3, 2003, KPC filed a pleading at the FERCrequesting the issuance of an order finding that it had no refund obligation and requesting terminationof the proceedings on remand. There are other actions and administrative proceedings that may beundertaken in connection with the Court’s determination. The outcome of KPC’s motion or anyproceedings, including the amount of any refunds that may be ordered, is uncertain. If the FERCdetermines refunds are required, after all administrative options and court appeals are exhausted, theamount of the refunds may range from zero to $9.0 million.
53

Liquids Petroleum Pipelines
Since 1995, FERC-regulated liquid petroleum pipelines have been generally subject to an indexedceiling rate methodology under which the annual change in the ceiling rate is the annual change in theProducers Price Index for Finished Goods minus 1% (PPI-1%). In December 2000, FERC affirmed thismethodology and the existing index. The petroleum industry appealed this decision, and onFebruary 24, 2003, the FERC issued an Order on Remand, replacing the PPI-1% index by removingthe 1% reduction. During the second quarter of 2003, Flying J, Lion Oil, Sinclair Oil and TesoroRefining and Marketing filed an appeal against this Order with the U.S. Court of Appeals for theDistrict of Columbia Circuit. This issue has not yet been resolved.
Recent Accounting Developments
In April 2003, the Financial Accounting Standards Board (‘‘FASB’’) issued SFAS No. 149,‘‘Amendment of Statement 133 on Derivative Instruments and Hedging Activities.’’ This statement amendsand clarifies financial accounting and reporting for derivative instruments, including certain derivativeinstruments embedded in other contracts (collectively referred to as derivatives) and for hedgingactivities under SFAS No. 133, Accounting for Derivative Instruments and Hedging Activities. Inparticular, this statement: (1) clarifies under what circumstances a contract with an initial netinvestment meets the characteristic of a derivative discussed in paragraph 6(b) of SFAS No. 133,(2) clarifies when a derivative contains a financing component, (3) amends the definition of anunderlying to conform it to language used in FASB Interpretation No. 45, Guarantor’s Accounting andDisclosure Requirements for Guarantees, Including Indirect Guarantees of Indebtedness of Others, and(4) amends certain other existing pronouncements. The new standard was adopted July 1, 2003, and didnot have a significant impact on the Partnership’s financial position, results of operations, or cash flows.
In January 2003, the FASB issued Interpretation No. 46, ‘‘Consolidation of Variable Interest Entities’’(‘‘FIN 46’’). FIN 46 requires an investor with a majority of the variable interests in a variable interestentity to consolidate the entity and also requires majority and significant variable interest investors toprovide certain disclosures. A variable interest entity is an entity in which the equity investors do nothave a controlling interest or the equity investment at risk is insufficient to finance the entity’s activitieswithout receiving additional subordinated financial support form the other parties. In December 2003,the FASB completed deliberations of proposed modifications to FIN 46 resulting in multiple effectivedates based on the nature as well as the creation date of the variable interest entity. However, therevised Interpretation must be applied no later than the first quarter of fiscal year 2004. There was noimpact on the Partnership’s consolidated financial position or results of operations as a result of theadoption of FIN 46.
Item 7A. Quantitative and Qualitative Disclosures About Market Risk
Interest Rate and Foreign Exchange Risk
To the extent the amounts drawn under its revolving credit facilities carry a floating rate ofinterest, the Partnership’s earnings and cash flow are exposed to changes in interest rates. Thisexposure is managed through periodically refinancing floating rate bank debt with long-term fixed ratedebt and through the use of interest rate risk management hedge contracts. The Partnership does nothave any material exposure to movements in foreign exchange rates as virtually all of its revenues andexpenses are denominated in U.S. dollars. To the extent that a material foreign exchange exposurearises, the Partnership intends to hedge such exposure using forward or other financial derivativecontracts.
The table below summarizes, as of December 31, 2003, the Partnership’s derivative financialinstruments and other financial instruments that are sensitive to changes in interest rates, includinginterest rate swaps and debt obligations. For debt obligations, the table presents principal cash flowsand related weighted average interest rates by expected maturity dates. For interest rate swaps, the
54

table presents notional amounts and weighted average interest paid rates by expected (contractual)maturity dates. Notional amounts are used to calculate the contractual payments to be exchanged underthe contract.
Expected Maturity Date
There- Fair2004 2005 2006 2007 2008 after Total Value
(dollars in millions)LiabilitiesFixed Rate:
First Mortgage Notes $ 31.0 $31.0 $ 31.0 $ 31.0 $31.0 $ 93.0 $248.0 $303.0Interest Rate . . . . . . 9.15% 9.15% 9.15% 9.15% 9.15% 9.15% — —Senior Unsecured
Notes . . . . . . . . . — — — — — $ 700.0 $700.0 $739.0Average Interest
Rate . . . . . . . . . . — — — — — 6.20% — —Variable Rate:
Revolving CreditFacility . . . . . . . . $215.0 — $240.0 — — — $455.0 $455.0
Average InterestRate . . . . . . . . . . 1.90% — 1.84% — — — — —
Interest Rate DerivativesInterest Rate Swaps:
Variable to Fixed . . . $150.0 — — — — — $150.0 —Average Pay Rate . . 1.36% — — — — — — —Fixed to Variable . . . — — — — — $ 125.0 $125.0 $ 4.2Average Pay Rate . . — — — — — Libor—0.22% — —Treasury Lock . . . . . $104.0 — — — — — $104.0 $ 1.0Pay Rate . . . . . . . . . 3.19% — — — — — — —
Commodity Price Risk
The Partnership’s earnings and cash flows associated with its liquids transportation systems are notsignificantly impacted by changes in commodity prices, as the Partnership does not own the crude oiland NGLs it transports. However, the Partnership has commodity risk related to degradation lossesassociated with fluctuating differentials between the price of heavy crude oil relative to light crude oil.Commodity prices have a significant impact on the underlying supply of, and demand for, crude oil andNGLs that the Partnership transports.
A portion of the Partnership’s earnings and cash flows in its natural gas segments are exposed tomovements in the prices of natural gas and NGLs. The Partnership has entered into hedge transactionsto substantially mitigate exposure to movements in these prices. Pursuant to policies approved by theBoard of Directors of the General Partner, the Partnership may not enter into derivative instrumentsfor speculative purposes. All financial derivative transactions must be undertaken with creditworthycounterparties. As at December 31, 2003, all financial counterparties were rated at least ‘‘A’’ by allmajor credit rating agencies.
Natural Gas Transportation and Marketing
Natural gas derivative transactions are entered into by the Partnership in order to hedge theforecasted purchases or sales of natural gas. The following table details the outstanding derivatives atDecember 31, 2003 and 2002:
Fair ValueMaturity NotionalSystem Dates MMBtu 2003 2002
(dollars in millions)
East Texas system . . . . . . . . . . . . . . . . . 2004-2011 26,000 $(19.9) $ (6.1)Northeast Texas system . . . . . . . . . . . . . . 2004-2012 42,000 $(44.9) $(19.1)Midcoast system . . . . . . . . . . . . . . . . . . . 2004 600 $ (0.7) $ (0.3)Marketing . . . . . . . . . . . . . . . . . . . . . . . 2004-2007 38,000 $ 2.0 $ 2.1
55

A limited number of natural gas derivative transactions, which mitigate economic exposures arisingfrom underlying natural gas purchases and sales, do not qualify for hedge accounting treatment underSFAS No. 133. As such, the change in fair market value (from the last quarter-end) of these derivativeinstruments is booked to the income statement. For the years ended December 31, 2003 and 2002, thePartnership recorded losses of $0.3 million and zero, respectively, in the Consolidated Statements ofIncome as part of the cost of natural gas expense, to account for changes in the fair value related tothese basis swaps in mark to market changes related to the Marketing segment.
Natural Gas Liquids
NGL derivative transactions are entered into by the Partnership to hedge the forecasted sales ofNGLs. The following table details the outstanding derivatives at December 31, 2003 and 2002:
Fair ValueMaturity NotionalSystem Date Barrels 2003 2002
(in millions) (dollars in millions)
Northeast Texas system . . . . . . . . . . . . . . . . . . . . . . . . . . . 2004 0.5 $(2.4) $(2.5)Midcoast system . . . . . . . . . . . . . . . . . . . . . . . . . . . . . . . . 2004 0.1 $(0.2) $(0.1)East Texas system . . . . . . . . . . . . . . . . . . . . . . . . . . . . . . . 2004 0.5 $(0.8) $ —North Texas system . . . . . . . . . . . . . . . . . . . . . . . . . . . . . 2004 0.8 $(1.1) $ —
Item 8. Financial Statements and Supplementary Data
The consolidated financial statements of the Partnership, together with the notes thereto and theindependent auditors’ report thereon, and unaudited supplementary information, appear on pages F-2through F-20 of this Report, and are incorporated by reference. Reference should be made to the‘‘Index to Financial Statements, Supplementary Information and Financial Statement Schedules’’ onpage F-1 of this Report.
Item 9. Changes in and Disagreements with Accountants on Accounting and Financial Disclosure
None.
Item 9A. Controls and Procedures
The Partnership and Enbridge maintain systems of disclosure controls and procedures designed toprovide reasonable assurance that the Partnership is able to record, process, summarize and report theinformation required in the Partnership’s annual and quarterly reports under the Securities ExchangeAct of 1934. Management of the Partnership has evaluated the effectiveness of our disclosure controlsand procedures as of December 31, 2003. Based upon that evaluation, our principal executive officerand principal financial officer concluded that our disclosure controls and procedures are effective toaccomplish their purpose. In conducting this assessment, management of the Partnership relied onsimilar evaluations conducted by employees of Enbridge affiliates who provide certain treasury,accounting and other services on behalf of the Partnership. No significant changes were made to ourinternal controls or other factors that could significantly affect these controls subsequent to the date oftheir evaluation, nor were any corrective actions with respect to significant deficiencies and materialweaknesses necessary subsequent to that date.
56

PART III
Item 10. Directors and Executive Officers of the Registrant
(a) Directors and Executive Officers of the Registrant
The Partnership is a limited partnership and has no officers or directors of its own. Set forth belowis certain information concerning the directors and executive officers of the General Partner and ofEnbridge Management, the delegate of the General Partner under a Delegation of Control Agreementamong the Partnership, the General Partner and Enbridge Management. All directors of the GeneralPartner are elected annually by, and may be removed by, Enbridge Pipelines, as the sole stockholder ofthe General Partner. All directors of Enbridge Management are elected annually by, and may beremoved by, the General Partner, as the sole holder of the Enbridge Management’s voting shares. Allofficers of the General Partner and Enbridge Management serve at the discretion of the respectiveboards of directors of the General Partner and Enbridge Management. All directors and officers of theGeneral Partner hold identical positions in Enbridge Management.
Name Age Position
J.A. Connelly . . . . . . . . . . . . . . . . . . . . . . 57 DirectorP.D. Daniel . . . . . . . . . . . . . . . . . . . . . . . 57 DirectorE.C. Hambrook . . . . . . . . . . . . . . . . . . . . 66 DirectorM.O. Hesse . . . . . . . . . . . . . . . . . . . . . . . 61 DirectorG.K. Petty . . . . . . . . . . . . . . . . . . . . . . . . 62 DirectorD.C. Tutcher . . . . . . . . . . . . . . . . . . . . . . 55 President and DirectorJ.R. Bird . . . . . . . . . . . . . . . . . . . . . . . . . 54 Group Vice President — Liquids
Transportation and DirectorG.L.Sevick . . . . . . . . . . . . . . . . . . . . . . . . 48 Vice President — Liquids Transportation,
OperationsM.A. Maki . . . . . . . . . . . . . . . . . . . . . . . 39 Vice President — FinanceT.L. McGill . . . . . . . . . . . . . . . . . . . . . . . 49 Vice President — Commercial Activity &
Business DevelopmentA.D. Meyer . . . . . . . . . . . . . . . . . . . . . . . 47 Vice President — Liquids Transportation,
TechnologyR.L. Adams . . . . . . . . . . . . . . . . . . . . . . . 39 Vice President — Operations and
TechnologyL.S. Cruess . . . . . . . . . . . . . . . . . . . . . . . 46 TreasurerJ.L. Balko . . . . . . . . . . . . . . . . . . . . . . . . 38 ControllerE.C. Kaitson . . . . . . . . . . . . . . . . . . . . . . 47 Corporate Secretary
J.A. Connelly was elected a director of the General Partner in January 2003 and serves on itsAudit, Finance & Risk Committee. Mr. Connelly served as Senior Vice President and Vice President ofthe Coastal Corporation from 1988 to 2001. Mr. Connelly is a business consultant providing executivemanagement consulting services.
P.D. Daniel was elected a director of the General Partner in July 1996 and served as its Presidentfrom July 1996 through October 1997. Mr. Daniel has served as President of Enbridge sinceSeptember 2000 and as Chief Executive Officer of Enbridge since January 2001. Prior to that timeMr. Daniel also served as President & Chief Operating Officer—Energy Delivery of Enbridge fromJune 1998 to December 2000.
E.C. Hambrook was elected a director of the General Partner in January 1992 and serves on itsAudit, Finance & Risk Committee. Mr. Hambrook served as Chairman of the General Partner fromJuly 1996 until July 1999. Mr. Hambrook has served as President of Hambrook Resources, Inc. since itsinception in 1991. Hambrook Resources, Inc. is a real estate investment, marketing and sales company.
57

M.O. Hesse was elected a director of General Partner in April 2003 and serves as a member of itsAudit, Finance & Risk Committee. Ms. Hesse is President and CEO of Hesse Gas Company. Sheserved as Chairman of the U.S. Federal Energy Regulatory Commission from 1986 to 1989. Ms. Hessealso served as Senior Vice President, First Chicago Corporation and Assistant Secretary forManagement and Administration, U.S. Department of Energy. She currently serves as a director ofseveral domestic and international public companies.
G.K. Petty was elected a director of the General Partner in February 2001 and serves on its Audit,Finance & Risk Committee. Mr. Petty has served as a director of Enbridge since January 2001.Mr. Petty served as President and Chief Executive Officer of Telus Corporation, a Canadiantelecommunications company, from November 1994 to November 1999. Mr. Petty is a businessconsultant providing executive management consulting services to the telecommunications industry.
D.C. Tutcher was elected a director and President of the General Partner in June 2001. He alsocurrently serves as Group Vice President, Transportation South of Enbridge. He was previouslyChairman of the Board, President and Chief Executive Officer of Midcoast Energy Resources, Inc.from its formation in 1992 until it was acquired by Enbridge on May 11, 2001.
J.R. Bird served as a director of the General Partner from September 2000 to January 2003 andwas reelected as a Director in October 2003. He was elected Group Vice President, LiquidsTransportation of the General Partner in January 2003. He served as President from September 2000until June 2001. He has also served as Group Vice President, Transportation North of Enbridge sinceMay 2001 and President of Enbridge Pipelines since September 2000. Prior to that time he served asGroup Vice President, Transportation from September 2000 through April 2001 and as Senior VicePresident, Corporate Planning and Development of Enbridge from August 1997 through August 2000.
G.L. Sevick was elected Vice President—Liquids Transportation, Operations of the GeneralPartner in June 2001. He has served as Vice President, Operations for Enbridge Pipelines since 1999.
M.A. Maki was elected Vice President—Finance of the General Partner in July 2002. Prior to thattime, he served as Controller of the General Partner since June 2001, and prior to that, as Controllerof Enbridge Pipelines since September 1999.
T.L. McGill was elected Vice President—Commercial Activity and Business Development of theGeneral Partner in April 2002. Prior to that time, Mr. McGill was President of Columbia GulfTransmission Company from January 1996 to March 2002.
A.D. Meyer was elected Vice President—Liquids Transportation, Technology, of the GeneralPartner in October 2003. He also continues to serve as Vice President, Technology, EnbridgeTransportation—Pipelines since his appointment in July 1999. Prior to that time he served as President,Enbridge Pipelines (Athabasca) Inc. from October 1997 to July 1999 and as Vice President, LiquidsMarketing with Enbridge for the same period.
R.L. Adams was elected Vice President—Operations and Technology of the General Partner inApril 2003. Prior to his current position, he was Director of Technology & Operations for the GeneralPartner since 2001, and Director of Field Operations and Technical Services and Director ofCommercial Activities for Ocensa/Enbridge in Bogota, Columbia from 1997 to 2001.
L.S. Cruess was elected Treasurer of the General Partner in April 2003. He also has served as VicePresident Financial Services of Enbridge since April 2003. Prior to that time, he served as VicePresident Corporate Development of Enbridge from 2000 to 2003 and Vice President, CorporateDevelopment of Utilicorp United Inc. from 1996 to 1999.
J.L. Balko was elected Controller of the General Partner in July 2002. Prior to that time, sheserved as Chief Accountant of the General Partner from October 1999 to June 2002 and served inmanagerial positions in accounting with Enbridge Pipelines since January 1998 to September 1999.
58

E.C. Kaitson has served as Corporate Secretary of the General Partner since November 2001. Healso currently serves as Associate General Counsel of Enbridge. He was previously Assistant CorporateSecretary and General Counsel of Midcoast Energy Resources, Inc. from 1997 until Enbridge acquiredit on May 11, 2001.
(b) Section 16(a) Beneficial Ownership Reporting Compliance
Section 16(a) of the Exchange Act requires directors, executive officers and 10% beneficial ownersto file with the SEC reports of ownership and changes in ownership of the Partnership’s equitysecurities and to furnish the Partnership with copies of all reports filed. The Partnership is a limitedpartnership and has no officers or directors of its own. Based solely on the review of the reportsfurnished, the Partnership believes that, during fiscal year 2003, all Section 16(a) filing requirementsapplicable to the directors and officers of the General Partner, and greater than 10% beneficial ownersof the Partnership were met, except that SEC Form 3, Initial Statement of Beneficial Ownership ofSecurities, for A.D. Meyer was filed late.
(c) Governance Matters
As the Partnership is a limited partnership, the listing standards of the NYSE do not require thatthe Partnership or the General Partner have a majority of independent directors or a nominating orcompensation committee of the General Partner’s board of directors.
Audit, Finance & Risk Committee
Enbridge Management has an Audit, Finance & Risk Committee (the ‘‘Audit Committee’’)comprised of four board members who are independent as the term is used in Section 10A of theSecurities Exchange Act of 1934, as amended. The members of the Audit Committee are M.O. Hesse,E.C. Hambrook, G.K. Petty and J.A. Connelly. No member of the Audit Committee serves on the auditcommittee of more than three public companies. The Audit Committee provides independent oversightwith respect to our internal controls, accounting policies, financial reporting, internal audit function andthe independent auditors. The Audit Committee also reviews the scope and quality, including theindependence and objectivity of the independent and internal auditors and the fees paid for both auditand non-audit work and makes recommendations concerning audit matters, including the engagementof the independent auditors, to the Board of Directors.
The current version of the charter of the Audit Committee is filed as an exhibit to this annualreport on Form 10-K and is available on the Partnership’s website at www.enbridgepartners.com. TheCharter of the Audit Committee complies with the listing standards of the New York Stock Exchangecurrently applicable to the Partnership. The Charter is under review for compliance with newly adoptedrules of the NYSE with which the Partnership must comply by October 31, 2004.
The Partnership’s Board of Directors has determined that M.O. Hesse, E.C. Hambrook and J.A.Connelly qualify as ‘‘audit committee financial experts’’ as defined in Item 401(h) of SECRegulation S-K and are independent as that term is used in Item 7(d)(3)(iv) of Schedule 14A underthe Exchange Act.
The Partnership’s Audit Committee has established procedures for the receipt, retention, andtreatment of complaints we receive regarding accounting, internal accounting controls, or auditingmatters and the confidential, anonymous submission by our employees of concerns regardingquestionable accounting or auditing matters. Persons wishing to communicate with the Partnership’sAudit Committee may do by writing in care of Chairman, Audit Committee, c/o Enbridge EnergyPartners, L.P., 1100 Louisiana, Suite 3300, Houston, TX 77002.
59
Code of Ethics and Statement of Business Conduct
The Partnership has adopted a Code of Ethics applicable to its Senior Financial Officers, includingthe principal executive officer, principal financial officer and principal accounting officer of EnbridgeManagement. A copy of the Code of Ethics for Senior Financial Officers is available on thePartnership’s website at www.enbridgepartners.com and is included herein as Exhibit 14.1. ThePartnership intends to post on its website any amendments to or waivers of its Code of Ethics forSenior Financial Officers. Additionally, this material is available in print, free of charge, to any personwho requests the information. Persons wishing to obtain this printed material should submit a requestto Corporate Secretary, c/o Enbridge Energy Partners, L.P., 1100 Louisiana, Suite 3300, Houston, TX77002.
The Partnership also has a Statement of Business Conduct applicable to all employees, officers anddirectors of Enbridge Management. A copy of the Statement of Business Conduct is available on thePartnership’s website at www.enbridgepartners.com. The Partnership intends to post on its website anyamendments to or waivers of its Statement of Business Conduct. Additionally, this material is availablein print, free of charge, to any person who requests the information. Persons wishing to obtain thisprinted material should submit a request to Corporate Secretary, c/o Enbridge Energy Partners, L.P.,1100 Louisiana, Suite 3300, Houston, TX 77002.
Executive Sessions of Non-Management Directors
The non-management directors of Enbridge Management meet at regularly scheduled executivesessions without management. J.A. Connelly or E.C. Hambrook served as the presiding director atthose executive sessions. Persons wishing to communicate with the Partnership’s non-managementdirectors may do so by writing in care of Chairman, Board of Directors, Enbridge Energy Partners, L.P.,1100 Louisiana, Suite 3300, Houston, TX 77002.
Item 11. Executive Compensation
The following table sets forth the total annual and long-term compensation for all servicesrendered in all capacities to the Partnership and Enbridge Management for the fiscal year endedDecember 31, 2003 and 2002, of the Chief Executive Officer and the other most highly compensatedexecutive officers (the ‘‘Named Executive Officers’’). No allocation of compensation is made betweenthe Partnership and Enbridge Management because the Partnership bears an allocable portion of theseofficers’ total compensation that is based approximately on the percentage of time each of theseofficers devotes to Enbridge Management and the Partnership. The other affiliates of Enbridge, towhom these officers also render services, bear the remainder of the compensation expenses of theseofficers. Compensation of the Named Executive Officers for years prior to 2002 is not provided becauseit was previously not reported.
60

Summary Compensation Table
ApproximatePercentage
of TimeDevoted toEnbridge
Other Annual All Other ManagementCompensation Compensation and the
Name & Principal Position Year Salary Bonus (1)(2) (3) Partnership
D.C. Tutcher . . . . . . . . . . . . . . . . . . . . 2003 $309,750 $235,000 $35,000 $10,000 80President 2002 $296,250 $ 91,000 $40,000 $11,625 80
T.L. McGill . . . . . . . . . . . . . . . . . . . . . 2003 $221,000 $ 89,800 $20,000 $ 6,361 90Vice President—Commercial 2002 $182,474 $ 34,000 $16,886 $ 4,193 90Activity & Business Development
E.C. Kaitson . . . . . . . . . . . . . . . . . . . . 2003 $168,000 $ 35,400 $10,000 $ 8,375 90Secretary 2002 $161,250 $ 18,200 $10,000 $ 8,990 90
M.A. Maki . . . . . . . . . . . . . . . . . . . . . . 2003 $161,750 $ 71,400 $20,000 $ 7,100 90Vice President—Finance 2002 $136,762 $ 55,700 $25,978 $ 6,950 90
R.L. Adams . . . . . . . . . . . . . . . . . . . . . 2003 $151,000 $ 54,100 $26,229 $ 7,568 90Vice President—Operations and 2002 * * * * *Technology
* Not elected as an officer until 2003
Notes:
(1) Amounts in this column include: the flexible perquisites allowance (as described in Note 2 below),flexible credits paid as additional compensation (as described in Note 2 below), reimbursementsfor professional financial services, one-time payments for termination benefits, and the taxablebenefit from loans by Enbridge, which were granted for relocation or hiring incentive purposes(and amounts reimbursed for the payment of taxes relating to such benefit).
(2) In fiscal 2003, the Named Executive Officers were given a Flexible Perquisites Allowance to coverperquisites that may have been previously paid on behalf of each executive. Effective July 1, 2001,Enbridge adopted a flexible benefit program pursuant to which employees receive an amount offlex credits based on their family status and base salary. Flex credits can be (a) used to purchasevarious benefits (such as extended health or dental coverage, disability insurance and lifeinsurance) on the same terms as are available to all employees; (b) applied as contributions to theStock Purchase and Savings Plan (as described in Note 3 below); or (c) paid to the employee asadditional compensation. In 2003, Mr. Tutcher received perquisites and other personal benefitstotaling $35,000, of which $30,000 related to his Flexible Perquisites Allowance; Mr. McGillreceived perquisites and other personal benefits totaling $20,000, all of which related to hisFlexible Perquisites Allowance; Mr. Maki received perquisites and other personal benefits totaling$20,000, all of which related to his Flexible Perquisites Allowance; Mr. Kaitson received perquisitesand other personal benefits totaling $10,000, all of which related to his Flexible PerquisitesAllowance, and Mr. Adams received perquisites and other personal benefits totaling $26,229, ofwhich $17,500 related to his Flexible Perquisites Allowance.
(3) Employees in the United States participate in the Enbridge Employee Services, Inc. Savings Plan(the ‘‘401(k) Plan’’) under which employees may contribute up to 25% of their base salary, withemployee contributions up to 5% matched by Enbridge (all subject to the contribution limitsspecified in the Internal Revenue Code). Enbridge’s contributions are used to purchase Enbridgeshares at market value and the employees’ contributions may be used to purchase Enbridge shares
61

or nine designated funds. During 2003, Enbridge made contributions of $10,000, $6,361, $7,100,$8,375 and $7,568, respectively, to the 401(k) Plan for the benefit of Mr. Tutcher, Mr. McGill,Mr. Maki, Mr. Kaitson, and Mr. Adams.
Compensation Committee Interlocks and Insider Participation
Neither Enbridge Management nor the General Partner have a compensation committee,therefore, all decisions related to executive compensation matters are made by a committee of theBoard of Directors of Enbridge.
Enbridge has a Human Resources & Compensation Committee (the ‘‘Committee’’) which ispresently comprised of the following directors (the date of their appointment to the Committee is listedafter their name): D.A. Arledge (January 1, 2002), E.S. Evans (May 3, 2002), W.R. Fatt (Chair)(May 3, 2002), R.L. George (April 29, 1999), R.W. Martin (February 1, 2001) and D.J. Taylor (May 2,1996). During 2003, no member of the Committee was an officer or employee of Enbridge or any of itssubsidiaries, or had any relationship with Enbridge except as director, other than D.J. Taylor, who wasa non-executive officer holding the office of Chair of the Board. Effective February 24, 2004, the Boardof Directors of Enbridge revised bylaw No. 1 of the corporation so that Chair of the Board is no longeran office of the corporation. Mr. Taylor continues as Chair of the Board of Enbridge, however,effective February 24, 2004, is no longer an officer of the Board.
Stock Options
Options to purchase shares of Enbridge may from time to time be granted by Enbridge to thePartnership’s Named Executive Officers, but no portion of any such grant is attributable to servicesperformed for the Partnership or Enbridge Management nor are any expense reimbursements made bythe Partnership on account of such options.
Employment Agreements
Messrs. Tutcher and Kaitson have Executive Employment Agreements with Enbridge. TheAgreements commenced on May 11, 2001, and continue until the earlier of (i) the date of voluntaryretirement in accordance with the retirement policies established for senior employees of Enbridge(ii) the voluntary resignation which is not a constructive dismissal, or (iii) termination based ondisability, death, cause or by either party. The Agreements provide that in the event of termination ofemployment, the executive agrees to keep confidential all information of a confidential or proprietarynature and further agrees not to use such information for personal advantage. The Agreements alsoprovide for a base salary, annual reviews, discretionary raises, participation in short and long-termincentive plans of Enbridge, and severance payments in the amount of two years compensation in theevent of termination by Enbridge.
Director Compensation
Enbridge employees who are members of the Board of Directors of the General Partner orEnbridge Management do not receive any additional compensation for serving in those capacities.Members of the Board of Directors of the General Partner and Enbridge Management who are notemployees receive an aggregate annual fee of $20,000, paid quarterly, plus $1,000 per day for eachmeeting attended of the board of directors or committees of the board. In addition, each non-employeedirector is reimbursed for out-of-pocket expenses in connection with attending meetings of the board ofdirectors or committees and an additional $500 for meetings requiring out of town travel. The directorwho serves as chairman of the audit committees is paid an additional $5,000 per year and the directorwho serves as chairman of the boards is paid an additional $10,000 per year, paid quarterly. The
62

General Partner indemnifies each director for actions associated with being a director to the full extentpermitted under Delaware law and maintains errors and omissions insurance.
Mr. Hambrook served as chairman of a special committee of the Board of Directors of theGeneral Partner in 2002 and 2003, in its capacity as General Partner of the Partnership. The specialcommittee of the Partnership was empowered to act on behalf of the Partnership in its purchase of theMidcoast assets. As compensation, Mr. Hambrook received a fee of $20,000, plus a fee of $1,000 percommittee meeting. In addition, he was reimbursed for out-of-pocket expenses in connection withattending special committee meetings and an additional $500 for each meeting requiring out of towntravel.
Messrs. Hambrook and Connelly served on pricing committees in 2003 in connection with publicofferings to sell limited partnership interests in the Partnership. As compensation for serving on thepricing committees, they each received a fee of $1,000 per meeting.
Item 12. Security Ownership of Certain Beneficial Owners and Management
(a) Security Ownership of Certain Beneficial Owners
The following table sets forth information as of February 17, 2004, with respect to persons knownto the Partnership to be the beneficial owners of more than 5% of either class of the Partnership’sUnits:
Amount andNature ofBeneficial Percent
Name and Address of Beneficial Owner Title of Class Ownership Of Class
Enbridge Energy Management, L.L.C. . . . . i-units 10,062,170 100.01100 Louisiana, Suite 3300Houston, TX 77002
Enbridge Energy Company, Inc. . . . . . . . . . Class B Common Units 3,912,750 100.01100 Louisiana, Suite 3300Houston, TX 77002
Goldman, Sachs & Co.(1) . . . . . . . . . . . . . Class A Common Units 1,740,639 4.3The Goldman Sachs Group, Inc.85 Broad St.New York, N.Y. 10004
(1) Goldman, Sachs & Co. and The Goldman Sachs Group, Inc. reported shared voting power andshared dispositive power with respects to all of such shares in its report on Form SC 13G/A filedFebruary 12, 2004. Goldman, Sachs & Co. and The Goldman Sachs Group, Inc. each disclaimbeneficial ownership of the securities beneficially owned by (a) any client accounts with respect towhich Goldman, Sachs & Co. or its employees have voting or investment discretion or both, and(b) certain investment entities, of which a subsidiary of The Goldman Sachs Group, Inc. orGoldman, Sachs & Co. is the general partner, managing general partner or other manager, to theextent interests in such entities are held by persons other than The Goldman Sachs Group, Inc.,Goldman, Sachs & Co. or their affiliates. The address of Goldman, Sachs & Co. and the GoldmanSachs Group, Inc. is 85 Broad Street, New York, NY 10004.
(b) Security Ownership of Management and Directors
The following table sets forth information as of February 17, 2004, with respect to each class of thePartnership’s units beneficially owned by the Named Executive Officers, directors and nominees for
63

director of the General Partner and all executive officers, directors and nominees for director of thePartnership as a group:
Amount andNature ofBeneficial Percent
Name Title of Class Ownership(1) Of Class
J.A. Connelly . . . . . . . . . . . . . . . Class A Common Units 5,000 *P.D. Daniel . . . . . . . . . . . . . . . . . Class A Common Units — —E.C. Hambrook . . . . . . . . . . . . . Class A Common Units 2,000 *M.O. Hesse . . . . . . . . . . . . . . . . Class A Common Units — —G.K. Petty . . . . . . . . . . . . . . . . . Class A Common Units 1,000 *D.C.Tutcher . . . . . . . . . . . . . . . . Class A Common Units 20,200 *J.R. Bird . . . . . . . . . . . . . . . . . . Class A Common Units — —G.L. Sevick . . . . . . . . . . . . . . . . . Class A Common Units — —M.A. Maki . . . . . . . . . . . . . . . . . Class A Common Units — —T.L. McGill . . . . . . . . . . . . . . . . . Class A Common Units — —A.D. Meyer . . . . . . . . . . . . . . . . Class A Common Units — —R.L. Adams . . . . . . . . . . . . . . . . Class A Common Units — —L.S. Cruess . . . . . . . . . . . . . . . . . Class A Common Units — —J.L. Balko . . . . . . . . . . . . . . . . . . Class A Common Units — —E.C. Kaitson . . . . . . . . . . . . . . . . Class A Common Units — —
All Officers, directors andnominees as a group (15persons) . . . . . . . . . . . . . . . . . Class A Common Units 28,200 *
* Less than 1%
(1) Each beneficial owner has sole voting and investment power with respect to all the units attributedto him/her.
Item 13. Certain Relationships and Related Transactions
Interest of the General Partner in the Partnership
At December 31, 2003, the General Partner owned 3,912,750 Class B Common Units representinga 7.1% limited partner interest in the Partnership. In addition, the General Partner also owns 1,732,930Listed shares or 17.2% of Enbridge Management’s outstanding Listed shares, constituting an effective3.1% limited partner interest in the Partnership. Together with the 2% general partner interest, theGeneral Partner effectively owns a total of 12.2% of the Partnership and received $33.7 million in cashand incentive distributions.
Interest of Enbridge Management in the Partnership
At December 31, 2003, Enbridge Management owned 10,062,170 i-units, representing an 18.2%limited partner interest in the Partnership. The i-units are a separate class of limited partner interestsin the Partnership. All of the i-units are owned by Enbridge Management and are not publicly traded.Enbridge Management’s limited liability company agreement provides that the number of all of itsoutstanding shares, including the voting shares owned by the General Partner, at all times will equalthe number of i-units that it owns. Through the combined effect of the provisions in the PartnershipAgreement and the provisions of Enbridge Management’s limited liability company agreement, thenumber of outstanding Enbridge Management shares and the number of the i-units will at all times beequal.
64
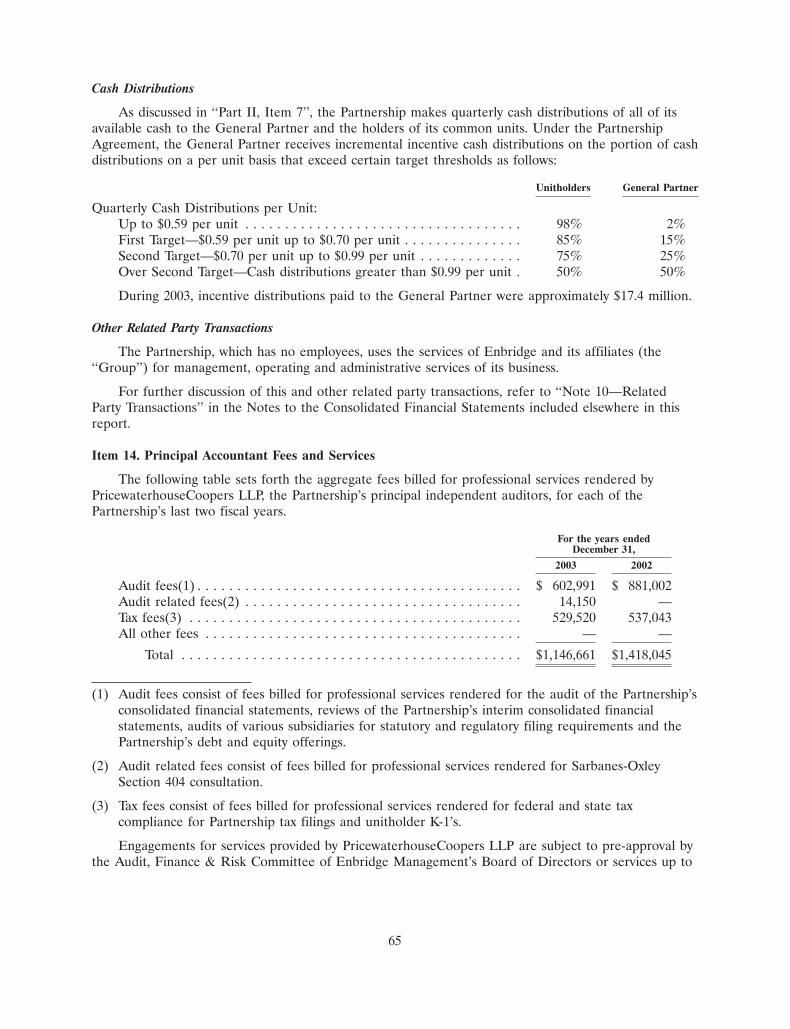
Cash Distributions
As discussed in ‘‘Part II, Item 7’’, the Partnership makes quarterly cash distributions of all of itsavailable cash to the General Partner and the holders of its common units. Under the PartnershipAgreement, the General Partner receives incremental incentive cash distributions on the portion of cashdistributions on a per unit basis that exceed certain target thresholds as follows:
Unitholders General Partner
Quarterly Cash Distributions per Unit:Up to $0.59 per unit . . . . . . . . . . . . . . . . . . . . . . . . . . . . . . . . . . . 98% 2%First Target—$0.59 per unit up to $0.70 per unit . . . . . . . . . . . . . . . 85% 15%Second Target—$0.70 per unit up to $0.99 per unit . . . . . . . . . . . . . 75% 25%Over Second Target—Cash distributions greater than $0.99 per unit . 50% 50%
During 2003, incentive distributions paid to the General Partner were approximately $17.4 million.
Other Related Party Transactions
The Partnership, which has no employees, uses the services of Enbridge and its affiliates (the‘‘Group’’) for management, operating and administrative services of its business.
For further discussion of this and other related party transactions, refer to ‘‘Note 10—RelatedParty Transactions’’ in the Notes to the Consolidated Financial Statements included elsewhere in thisreport.
Item 14. Principal Accountant Fees and Services
The following table sets forth the aggregate fees billed for professional services rendered byPricewaterhouseCoopers LLP, the Partnership’s principal independent auditors, for each of thePartnership’s last two fiscal years.
For the years endedDecember 31,
2003 2002
Audit fees(1) . . . . . . . . . . . . . . . . . . . . . . . . . . . . . . . . . . . . . . . . . $ 602,991 $ 881,002Audit related fees(2) . . . . . . . . . . . . . . . . . . . . . . . . . . . . . . . . . . . 14,150 —Tax fees(3) . . . . . . . . . . . . . . . . . . . . . . . . . . . . . . . . . . . . . . . . . . 529,520 537,043All other fees . . . . . . . . . . . . . . . . . . . . . . . . . . . . . . . . . . . . . . . . — —
Total . . . . . . . . . . . . . . . . . . . . . . . . . . . . . . . . . . . . . . . . . . . $1,146,661 $1,418,045
(1) Audit fees consist of fees billed for professional services rendered for the audit of the Partnership’sconsolidated financial statements, reviews of the Partnership’s interim consolidated financialstatements, audits of various subsidiaries for statutory and regulatory filing requirements and thePartnership’s debt and equity offerings.
(2) Audit related fees consist of fees billed for professional services rendered for Sarbanes-OxleySection 404 consultation.
(3) Tax fees consist of fees billed for professional services rendered for federal and state taxcompliance for Partnership tax filings and unitholder K-1’s.
Engagements for services provided by PricewaterhouseCoopers LLP are subject to pre-approval bythe Audit, Finance & Risk Committee of Enbridge Management’s Board of Directors or services up to
65

$50,000 may be approved by the Chairman of the Audit, Finance & Risk Committee, under Board ofDirectors delegated authority.
PART IV
Item 15. Exhibits, Financial Statement Schedules and Reports on Form 8-K
The following documents are filed as part of this Report:
(a) As to financial statements, supplementary information and financial statement schedules,reference is made to ‘‘Index Consolidated to Financial Statements, Supplementary Information andFinancial Statement Schedules’’ on page F-1 of this Report.
(b) The Partnership filed the following reports on Form 8-K during the fourth quarter of 2003:
• A current report on Form 8-K was filed on December 30, 2003, attaching a press release datedDecember 22, 2003, disclosing the intent to acquire of certain crude oil pipeline and storagesystems from Shell;
• A current report on Form 8-K was filed on December 5, 2003, regarding entering into anUnderwriting Agreement relating to the offering of up to 5,725,000 units (including an option topurchase up to 725,000 units) representing limited partner interests in the Partnership;
• A current report on Form 8-K was filed on November 24, 2003, attaching a press release datedNovember 19, 2003, disclosing the execution of a definitive purchase agreement to acquirenatural gas gathering and processing assets in North Texas from Cantera Resources Inc., anaffiliate of Morgan Stanley Capital Partners;
• A current report on Form 8-K was filed on October 24, 2003, attaching a press release datedOctober 22, 2003 regarding the financial results for the three and nine months endedSeptember 30, 2003.
(c) Reference is made to the Index of Exhibits following the signature page, which is herebyincorporated into this Item.
66
SIGNATURES
Pursuant to the requirements of Section 13 or 15(d) of the Securities Exchange Act of 1934, theRegistrant has duly caused this Report to be signed on its behalf by the undersigned, thereunto dulyauthorized.
ENBRIDGE ENERGY PARTNERS, L.P.(Registrant)
By: Enbridge Energy Management, L.L.C.,as delegate of the General Partner
Date: March 12, 2004 By: /s/ DAN C. TUTCHER
Dan C. Tutcher(President)
Pursuant to the requirements of the Securities Exchange Act of 1934, this Report has been signedbelow on March 12, 2004 by the following persons on behalf of the Registrant and in the capacitiesindicated.
/s/ D. C. TUTCHER /s/ M.A. MAKI
D. C. Tutcher M.A. MakiPresident and Director Vice President — Finance
(Principal Executive Officer) (Principal Financial Officer)
/s/ J.A. CONNELLY /s/ E.C. HAMBROOK
J.A. Connelly E.C. HambrookDirector Director
/s/ G.K. PETTY /s/ P.D. DANIEL
G.K. Petty P.D. DanielDirector Director
/s/ M.O. HESSE /s/ J.R. BIRD
M.O. Hesse J.R. BirdDirector Director
67

Index to Exhibits
The following Exhibits (numbered in accordance with Item 601 of Regulation S-K) are filed orincorporated herein by reference as part of this Report.
ExhibitNumber Description
3.1 Certificate of Limited Partnership of the Partnership (Exhibit 3.1 to the Partnership’sRegistration Statement No. 33-43425)
3.2 Certificate of Amendment to Certificate of Limited Partnership of the Partnership (Exhibit 3.2to the Partnership’s 2000 Form 10-K/A dated October 9, 2001)
3.3 Third Amended and Restated Agreement of Limited Partnership of the Partnership(Exhibit 3.1 to the Partnership’s Quarterly Report on Form 10-Q filed November 14, 2002)
4.1 Form of Certificate representing Class A Common Units (Exhibit 4.1 to the Partnership’s 2000Form 10-K/A dated October 9, 2001)
10.1 Contribution, Conveyance and Assumption Agreement, dated December 27, 1991, amongLakehead Pipe Line Company, Inc., Lakehead Pipe Line Partners, L.P. and Lakehead PipeLine Company, Limited Partnership. (Exhibit 10.10 to the Partnership’s 1991 Form 10-K)
10.2 LPL Contribution and Assumption Agreement, dated December 27, 1991, among LakeheadPipe Line Company, Inc., Lakehead Pipe Line Partners, L.P. and Lakehead Pipe LineCompany, Limited Partnership and Lakehead Services, Limited Partnership. (Exhibit 10.11 tothe Partnership’s 1991 Form 10-K)
10.3 Contribution Agreement (Exhibit 10.1 to the Partnership’s Registration Statement on FormS-3/A filed July 8, 2002)
10.4 First Amendment to Contribution Agreement (Exhibit 10.8 to the Partnership’s RegistrationStatement on Form S-3/A filed September 24, 2002)
10.5 Second Amendment to Contribution Agreement (Exhibit 99.3 to the Partnership’s CurrentReport on Form 8-K filed October 31, 2002)
10.6 Delegation of Control Agreement (Exhibit 10.2 to the Partnership’s Quarterly Report onForm 10-Q filed November 14, 2002)
10.7 Amended and Restated Treasury Services Agreement (Exhibit 10.3 to the Partnership’sQuarterly Report on Form 10-Q filed November 14, 2002)
10.8 Operational Services Agreement (Exhibit 10.4 to the Partnership’s Quarterly Report onForm 10-Q filed November 14, 2002)
10.9 General and Administrative Services Agreement (Exhibit 10.5 to the Partnership’s QuarterlyReport on Form 10-Q filed November 14, 2002)
10.10 Omnibus Agreement (Exhibit 10.6 to the Partnership’s Quarterly Report on Form 10-Q filedNovember 14, 2002)
10.11 Amended and Restated Credit Agreement, dated January 24, 2003, among Enbridge EnergyPartners, L.P., Bank of America, N.A., as administrative agent, and the lenders party thereto(Exhibit 10.11 to the Partnership’s Annual Report on Form 10-K filed on March 28, 2003)
10.12 Amended and Restated 364-Day Credit Agreement, dated January 24, 2003, among EnbridgeEnergy Partners, L.P., Bank of America, N.A., as administrative agent, and the lenders partythereto (Exhibit 10.12 to the Partnership’s Annual Report on Form 10-K filed on March 28,2003)
10.13 Subordinated Promissory Note, dated as of January 24, 2003, given by Enbridge EnergyPartners, L.P., as borrower, to Enbridge Hungary Liquidity Management Limited LiabilityCompany, as lender (Exhibit 10.13 to the Partnership’s Annual Report on Form 10-K filed onMarch 28, 2003)
68

ExhibitNumber Description
10.14 Subordinated Promissory Note, dated as of January 24, 2003, given by Enbridge EnergyPartners, L.P., as borrower, to Enbridge Hungary Liquidity Management Limited LiabilityCompany, as lender (Exhibit 10.14 to the Partnership’s Annual Report on Form 10-K filed onMarch 28, 2003)
10.15 Subordinated Promissory Note, dated as of January 24, 2003, given by Enbridge EnergyPartners, L.P., as borrower, to Enbridge (U.S.) Inc., as lender (Exhibit 10.15 to thePartnership’s Annual Report on Form 10-K filed on March 28, 2003)
10.16 Note Agreement and Mortgage, dated December 12, 1991 (Exhibit 10.1 to the Partnership’s1991 Form 10-K)
10.17 Assumption and Indemnity Agreement, dated December 18, 1992, between InterprovincialPipe Line Inc. and Interprovincial Pipe Line System Inc. (Exhibit 10.4 to the Partnership’s1992 Form 10-K)
10.18 Settlement Agreement, dated August 28, 1996, between Lakehead Pipe Line Company,Limited Partnership and the Canadian Association of Petroleum Producers and the AlbertaDepartment of Energy (Exhibit 10.17 to the Partnership’s 1996 Form 10-K)
10.19 Tariff Agreement as filed with the Federal Energy Regulatory Commission for the SystemExpansion Program II and Terrace Expansion Project (Exhibit 10.21 to the Partnership’s 1998Form 10-K)
10.20 Promissory Note, dated as of September 30, 1998, given by Lakehead Pipe Line Company,Limited Partnership, as borrower, to Lakehead Pipe Line Company, Inc., as lender(Exhibit 10.19 to the Partnership’s 1998 Form 10-K)
10.21 Promissory Note, dated as of March 31, 1999, given by Lakehead Pipe Line Company, LimitedPartnership, as borrower, to Lakehead Pipe Line Company, Inc., as lender. (Exhibit 10.26 tothe Partnership’s 1999 Form 10-K)
10.22 Indenture dated September 15, 1998, between Lakehead Pipe Line Company, LimitedPartnership and the Chase Manhattan Bank (Exhibit 4.1 to the Lakehead Pipe Line Company,Limited Partnership’s Form 8-K dated October 20, 1998)
10.23 First Supplemental Indenture dated September 15, 1998, between Lakehead Pipe LineCompany, Limited Partnership and the Chase Manhattan Bank (Exhibit 4.2 to the LakeheadPipe Line Company, Limited Partnership’s Form 8-K dated October 20, 1998)
10.24 Second Supplemental Indenture dated September 15, 1998, between Lakehead Pipe LineCompany, Limited Partnership and the Chase Manhattan Bank (Exhibit 4.3 to the LakeheadPipe Line Company, Limited Partnership’s Form 8-K dated October 20, 1998)
10.25 Third Supplemental Indenture dated November 21, 2000, between Lakehead Pipe LineCompany, Limited Partnership and the Chase Manhattan Bank (Exhibit 4.2 to the LakeheadPipe Line Company, Limited Partnership’s Form 8-K dated November 16, 2000)
10.26 Indenture dated September 15, 1998, between Lakehead Pipe Line Company, LimitedPartnership and the Chase Manhattan Bank (Exhibit 4.4 to the Lakehead Pipe Line Company,Limited Partnership’s Form 8-K dated October 20, 1998)
*10.27 Executive Employment Agreement, dated May 11, 2001, between Dan C. Tutcher, asExecutive, and Enbridge Inc., as corporation.
*10.28 Executive Employment Agreement, dated May 11, 2001, between E. Chris Kaitson, asExecutive, and Enbridge Inc., as corporation.
10.29 Indenture dated May 27, 2003, between the Partnership, as Issuer, and SunTrust Bank, asTrustee (Exhibit 4.5 to the Partnership’s Registration Statement on Form S-4 filed June 30,2003)
10.30 First Supplemental Indenture dated May 27, 2003 between the Partnership and SunTrust Bank(Exhibit 4.5 to the Partnership’s Registration Statement on Form S-4 filed June 30, 2003)
69

ExhibitNumber Description
10.31 Second Supplemental Indenture dated May 27, 2003 between the Partnership and SunTrustBank (Exhibit 4.5 to the Partnership’s Registration Statement on Form S-4 filed June 30,2003)
10.32 Third Supplemental Indenture dated January 9, 2004 between the Partnership and SunTrustBank (Exhibit 99.3 to the Partnership’s Form 8-K filed January 9, 2004)
14.1 Code of Ethics for Senior Financial Officers21.1 Subsidiaries of the Registrant23.1 Consent of PricewaterhouseCoopers LLP31.1 Certification of Chief Executive Officer Pursuant to Section 302 of the Sarbanes-Oxley Act of
200231.2 Certification of Chief Financial Officer Pursuant to Section 302 of the Sarbanes-Oxley Act of
200232.1 Certification of Chief Executive Officer Pursuant to Section 906 of the Sarbanes-Oxley Act of
200232.2 Certification of Chief Financial Officer Pursuant to Section 906 of the Sarbanes-Oxley Act of
200299.1 Charter of the Audit, Finance & Risk Committee of Enbridge Energy Management, L.L.C.
All Exhibits listed above (with the exception of Exhibits 14.1, 21.1, 23.1, 31.1, 31.2, 32.1, 32.2, and99.1 which are filed herewith) are incorporated herein by reference to the documents identified inparentheses.
Copies of Exhibits may be obtained upon written request of any Unitholder to Investor Relations,Enbridge Energy Partners, L.P., 1100 Louisiana, Suite 3300, Houston, Texas 77002.
* Management Compensation or Incentive Plan
70

INDEX TO CONSOLIDATED FINANCIAL STATEMENTS,SUPPLEMENTARY INFORMATION AND
CONSOLIDATED FINANCIAL STATEMENT SCHEDULES
ENBRIDGE ENERGY PARTNERS, L.P.
Page
Financial Statements
Report of Independent Auditors . . . . . . . . . . . . . . . . . . . . . . . . . . . . . . . . . . . . . . . . . . . . . . F-2
Consolidated Statements of Income for each of the three years ended December 31, 2003 . . . . F-3
Consolidated Statements of Comprehensive Income for each of the three years endedDecember 31, 2003 . . . . . . . . . . . . . . . . . . . . . . . . . . . . . . . . . . . . . . . . . . . . . . . . . . . . . . F-4
Consolidated Statements of Cash Flows for each of the three years ended December 31, 2003 . F-5
Consolidated Statements of Financial Position as of December 31, 2003 and 2002 . . . . . . . . . . F-6
Consolidated Statements of Partners’ Capital for each of the three years ended December 31,2003 . . . . . . . . . . . . . . . . . . . . . . . . . . . . . . . . . . . . . . . . . . . . . . . . . . . . . . . . . . . . . . . . F-7
Notes to the Consolidated Financial Statements . . . . . . . . . . . . . . . . . . . . . . . . . . . . . . . . . . . F-8
FINANCIAL STATEMENT SCHEDULES
Financial statement schedules not included in this Report have been omitted because they are notapplicable or the required information is shown in the consolidated financial statements or notesthereto.
F-1

Report of Independent Auditors
To the Partners ofEnbridge Energy Partners, L.P.
In our opinion, the accompanying consolidated statements of financial position and the relatedconsolidated statements of income, of comprehensive income, of cash flows and of partners’ capitalpresent fairly, in all material respects, the consolidated financial position of Enbridge Energy Partners,L.P. and its subsidiaries (the ‘‘Partnership’’) at December 31, 2003 and 2002, and the results of theiroperations and their cash flows for each of the three years in the period ended December 31, 2003 inconformity with accounting principles generally accepted in the United States of America. Thesefinancial statements are the responsibility of the Partnership’s management; our responsibility is toexpress an opinion on these financial statements based on our audits. We conducted our audits of thesestatements in accordance with auditing standards generally accepted in the United States of America,which require that we plan and perform the audit to obtain reasonable assurance about whether thefinancial statements are free of material misstatement. An audit includes examining, on a test basis,evidence supporting the amounts and disclosures in the financial statements, assessing the accountingprinciples used and significant estimates made by management, and evaluating the overall financialstatement presentation. We believe that our audits provide a reasonable basis for our opinion.
As discussed in Note 2 to the consolidated financial statements, the Partnership changed its method ofaccounting for goodwill and intangible assets effective January 1, 2002.
PricewaterhouseCoopers LLP
Houston, TexasJanuary 27, 2004, except forthe first two paragraphs of Note 15, as to which the date isMarch 1, 2004
F-2
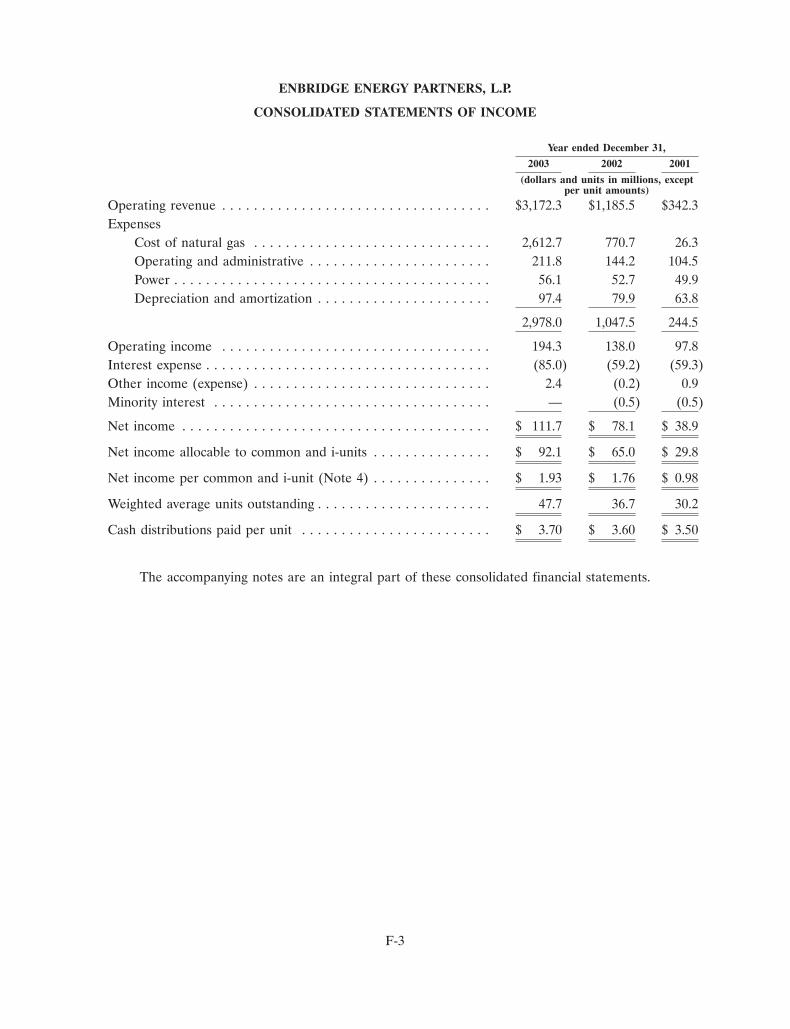
ENBRIDGE ENERGY PARTNERS, L.P.
CONSOLIDATED STATEMENTS OF INCOME
Year ended December 31,
2003 2002 2001
(dollars and units in millions, exceptper unit amounts)
Operating revenue . . . . . . . . . . . . . . . . . . . . . . . . . . . . . . . . . . $3,172.3 $1,185.5 $342.3Expenses
Cost of natural gas . . . . . . . . . . . . . . . . . . . . . . . . . . . . . . 2,612.7 770.7 26.3Operating and administrative . . . . . . . . . . . . . . . . . . . . . . . 211.8 144.2 104.5Power . . . . . . . . . . . . . . . . . . . . . . . . . . . . . . . . . . . . . . . . 56.1 52.7 49.9Depreciation and amortization . . . . . . . . . . . . . . . . . . . . . . 97.4 79.9 63.8
2,978.0 1,047.5 244.5
Operating income . . . . . . . . . . . . . . . . . . . . . . . . . . . . . . . . . . 194.3 138.0 97.8Interest expense . . . . . . . . . . . . . . . . . . . . . . . . . . . . . . . . . . . . (85.0) (59.2) (59.3)Other income (expense) . . . . . . . . . . . . . . . . . . . . . . . . . . . . . . 2.4 (0.2) 0.9Minority interest . . . . . . . . . . . . . . . . . . . . . . . . . . . . . . . . . . . — (0.5) (0.5)
Net income . . . . . . . . . . . . . . . . . . . . . . . . . . . . . . . . . . . . . . . $ 111.7 $ 78.1 $ 38.9
Net income allocable to common and i-units . . . . . . . . . . . . . . . $ 92.1 $ 65.0 $ 29.8
Net income per common and i-unit (Note 4) . . . . . . . . . . . . . . . $ 1.93 $ 1.76 $ 0.98
Weighted average units outstanding . . . . . . . . . . . . . . . . . . . . . . 47.7 36.7 30.2
Cash distributions paid per unit . . . . . . . . . . . . . . . . . . . . . . . . $ 3.70 $ 3.60 $ 3.50
The accompanying notes are an integral part of these consolidated financial statements.
F-3

ENBRIDGE ENERGY PARTNERS, L.P.
CONSOLIDATED STATEMENTS OF COMPREHENSIVE INCOME
Year ended December 31,
2003 2002 2001
(dollars in millions)
Net income . . . . . . . . . . . . . . . . . . . . . . . . . . . . . . . . . . . . . . . . . . . $111.7 $ 78.1 $38.9
Unrealized (loss) gain on derivative financial instruments . . . . . . . . . (47.7) (28.2) 11.9
Comprehensive income . . . . . . . . . . . . . . . . . . . . . . . . . . . . . . . . . . $ 64.0 $ 49.9 $50.8
The accompanying notes are an integral part of these consolidated financial statements.
F-4

ENBRIDGE ENERGY PARTNERS, L.P.
CONSOLIDATED STATEMENTS OF CASH FLOWS
Year ended December 31,
2003 2002 2001
(dollars in millions)
Cash provided from operating activitiesNet income . . . . . . . . . . . . . . . . . . . . . . . . . . . . . . . . . . . . . . . . . . $ 111.7 $ 78.1 $ 38.9Adjustments to reconcile net income to net cash provided by
operating activities:Depreciation and amortization . . . . . . . . . . . . . . . . . . . . . . . . . . 97.4 79.9 63.8Other . . . . . . . . . . . . . . . . . . . . . . . . . . . . . . . . . . . . . . . . . . . . (0.4) (2.9) 0.3
Changes in operating assets and liabilities, net of acquiredworking capital:
Receivables, trade and other . . . . . . . . . . . . . . . . . . . . . . . . . . (21.0) 46.0 (22.7)Due from General Partner and affiliates . . . . . . . . . . . . . . . . . (7.2) — —Accrued gas receivables . . . . . . . . . . . . . . . . . . . . . . . . . . . . . (59.2) (162.0) —Other current assets . . . . . . . . . . . . . . . . . . . . . . . . . . . . . . . . (24.8) 18.7 (9.4)Due to General Partner and affiliates . . . . . . . . . . . . . . . . . . . (8.7) 12.5 —Accounts payable and other . . . . . . . . . . . . . . . . . . . . . . . . . . (34.1) (3.6) 54.3Accrued gas purchases . . . . . . . . . . . . . . . . . . . . . . . . . . . . . . 76.6 136.4 —Interest payable . . . . . . . . . . . . . . . . . . . . . . . . . . . . . . . . . . . (0.2) (1.2) 0.3Property and other taxes payable . . . . . . . . . . . . . . . . . . . . . . . 2.0 (1.3) (0.2)
Net cash provided by operating activities . . . . . . . . . . . . . . . . . . . . . . $ 132.1 $ 200.6 $ 125.3
Cash used in investing activitiesAdditions to property, plant and equipment . . . . . . . . . . . . . . . . . . (129.3) (214.7) (35.0)Change in construction payable . . . . . . . . . . . . . . . . . . . . . . . . . . . (7.5) 6.7 (2.1)Asset acquisitions, net of cash acquired (Note 3) . . . . . . . . . . . . . . (294.2) (349.2) (265.0)
Net cash used in investing activities . . . . . . . . . . . . . . . . . . . . . . . . . . $ (431.0) $ (557.2) $(302.1)
Cash provided by financing activitiesProceeds from unit issuances, net (Note 10) . . . . . . . . . . . . . . . . . . 414.4 424.1 171.3Distributions to partners . . . . . . . . . . . . . . . . . . . . . . . . . . . . . . . . (156.7) (138.1) (113.8)Borrowings under debt agreements . . . . . . . . . . . . . . . . . . . . . . . . 2,653.3 2,939.0 452.0Repayments of debt . . . . . . . . . . . . . . . . . . . . . . . . . . . . . . . . . . . (2,297.0) (2,643.0) (505.0)Borrowings from General Partner and affiliates . . . . . . . . . . . . . . . . 16.0 1,074.7 176.2Repayments to the General Partner and affiliates . . . . . . . . . . . . . . (327.0) (1,279.1) —Other . . . . . . . . . . . . . . . . . . . . . . . . . . . . . . . . . . . . . . . . . . . . . . — (0.9) (0.9)
Net cash provided by financing activities . . . . . . . . . . . . . . . . . . . . . . $ 303.0 $ 376.7 $ 179.8
Net increase in cash and cash equivalents . . . . . . . . . . . . . . . . . . . . . 4.1 20.1 3.0Cash and cash equivalents at beginning of year . . . . . . . . . . . . . . . . . 60.3 40.2 37.2
Cash and cash equivalents at end of year . . . . . . . . . . . . . . . . . . . . . . $ 64.4 $ 60.3 $ 40.2
The accompanying notes are an integral part of these consolidated financial statements.
F-5

ENBRIDGE ENERGY PARTNERS, L.P.
CONSOLIDATED STATEMENTS OF FINANCIAL POSITION
December 31,
2003 2002
(dollars in millions)
ASSETSCurrent assets
Cash and cash equivalents . . . . . . . . . . . . . . . . . . . . . . . . . . . . . . . . . . . . . . . $ 64.4 $ 60.3Receivables, trade and other, net of allowance for doubtful accounts of $2.9 in
2003 and $3.7 in 2002 . . . . . . . . . . . . . . . . . . . . . . . . . . . . . . . . . . . . . . . . . 46.3 27.4Due from General Partner and affiliates . . . . . . . . . . . . . . . . . . . . . . . . . . . . . 7.2 —Accrued gas receivables . . . . . . . . . . . . . . . . . . . . . . . . . . . . . . . . . . . . . . . . . 249.7 190.5Other current assets . . . . . . . . . . . . . . . . . . . . . . . . . . . . . . . . . . . . . . . . . . . . 41.2 19.3
408.8 297.5Property, plant and equipment, net (Note 5) . . . . . . . . . . . . . . . . . . . . . . . . . . . . 2,465.6 2,253.3Other assets . . . . . . . . . . . . . . . . . . . . . . . . . . . . . . . . . . . . . . . . . . . . . . . . . . . 22.9 12.6Goodwill (Note 6) . . . . . . . . . . . . . . . . . . . . . . . . . . . . . . . . . . . . . . . . . . . . . . . 257.3 241.1Intangibles, net (Note 7) . . . . . . . . . . . . . . . . . . . . . . . . . . . . . . . . . . . . . . . . . . 77.2 30.4
$3,231.8 $2,834.9
LIABILITIES AND PARTNERS’ CAPITALCurrent liabilities
Due to General Partner and affiliates . . . . . . . . . . . . . . . . . . . . . . . . . . . . . . . $ 1.8 $ 63.1Accounts payable and other . . . . . . . . . . . . . . . . . . . . . . . . . . . . . . . . . . . . . . 85.1 87.2Accrued gas purchases . . . . . . . . . . . . . . . . . . . . . . . . . . . . . . . . . . . . . . . . . . 230.6 154.0Interest payable . . . . . . . . . . . . . . . . . . . . . . . . . . . . . . . . . . . . . . . . . . . . . . . 6.8 7.0Property and other taxes payable . . . . . . . . . . . . . . . . . . . . . . . . . . . . . . . . . . 18.3 16.3Current maturities and short-term debt (Note 8) . . . . . . . . . . . . . . . . . . . . . . . 246.0 31.0
588.6 358.6Long-term debt (Note 8) . . . . . . . . . . . . . . . . . . . . . . . . . . . . . . . . . . . . . . . . . . 1,155.8 1,011.4Loans from General Partner and affiliates (Note 10) . . . . . . . . . . . . . . . . . . . . . . 133.1 444.1Commitments, contingencies and environmental liabilities (Note 11) . . . . . . . . . . . 7.9 5.6Deferred credits . . . . . . . . . . . . . . . . . . . . . . . . . . . . . . . . . . . . . . . . . . . . . . . . 33.1 23.2Minority interest . . . . . . . . . . . . . . . . . . . . . . . . . . . . . . . . . . . . . . . . . . . . . . . . — 0.4
1,918.5 1,843.3Partners’ capital (Note 9)
Class A common units (Units issued — 40,166,134 in 2003 and 31,313,634 in2002) . . . . . . . . . . . . . . . . . . . . . . . . . . . . . . . . . . . . . . . . . . . . . . . . . . . . . 914.9 604.8
Class B common units (Units issued — 3,912,750 in 2003 and 2002) . . . . . . . . . 64.2 48.7i-units (Units issued — 10,062,170 in 2003 and 9,228,655 in 2002) . . . . . . . . . . . 370.7 335.6General Partner . . . . . . . . . . . . . . . . . . . . . . . . . . . . . . . . . . . . . . . . . . . . . . . 27.5 18.8Accumulated other comprehensive loss . . . . . . . . . . . . . . . . . . . . . . . . . . . . . . (64.0) (16.3)
1,313.3 991.6
$3,231.8 $2,834.9
The accompanying notes are an integral part of these consolidated financial statements.
F-6

ENBRIDGE ENERGY PARTNERS, L.P.CONSOLIDATED STATEMENTS OF PARTNERS’ CAPITAL
Years ended December 31,
2003 2002 2001
Units Amount Units Amount Units Amount
(dollars in millions)
Class A common units:Beginning balance . . . . . . . . . . . 31,313,634 $ 604.8 29,053,634 $ 577.0 24,990,000 $488.6Net income allocation . . . . . . . . — 64.9 — 52.3 — 24.4Allocation of proceeds and
issuance costs from unitissuance . . . . . . . . . . . . . . . . 8,852,500 368.2 2,260,000 86.2 4,063,634 154.6
Distributions to partners . . . . . . — (123.0) — (110.7) — (90.6)
Ending balance . . . . . . . . . . . . . 40,166,134 914.9 31,313,634 604.8 29,053,634 577.0
Class B common units:Beginning balance . . . . . . . . . . . 3,912,750 48.7 3,912,750 48.8 3,912,750 42.1Net income allocation . . . . . . . . — 8.3 — 7.9 — 5.4Allocation of proceeds and
issuance costs from unitissuance . . . . . . . . . . . . . . . . — 21.7 — 6.1 — 15.0
Distributions to partner . . . . . . . — (14.5) — (14.1) — (13.7)
Ending balance . . . . . . . . . . . . . 3,912,750 64.2 3,912,750 48.7 3,912,750 48.8
i-units:Beginning balance . . . . . . . . . . . 9,228,655 335.6 — — — —Net income allocation . . . . . . . . — 18.9 — 4.8 — —Allocation of proceeds and
issuance costs from unitissuance . . . . . . . . . . . . . . . . — 16.2 9,000,001 330.8 — —
Distributions to partner . . . . . . . 833,515 — 228,654 — — —
Ending balance . . . . . . . . . . . . . 10,062,170 370.7 9,228,655 335.6 — —
General Partner:Beginning balance . . . . . . . . . . . 18.8 6.5 5.2Net income allocation . . . . . . . . 19.6 13.1 9.1Allocation of proceeds and
issuance costs from unitissuance . . . . . . . . . . . . . . . . (0.3) 1.0 1.7
General Partner contribution . . . 8.6 11.5 —Distributions to partner . . . . . . . (19.2) (13.3) (9.5)
Ending balance . . . . . . . . . . . . . 27.5 18.8 6.5Accumulated other comprehensive
(loss) income:Beginning balance . . . . . . . . . . . (16.3) 11.9 —Unrealized (loss) gain on
derivative financialinstruments . . . . . . . . . . . . . . (47.7) (28.2) 11.9
Ending balance . . . . . . . . . . . . . (64.0) (16.3) 11.9
Partners’ capital atDecember 31, . . . . . . . . . . . . . . $1,313.3 $ 991.6 $644.2
The accompanying notes are an integral part of these consolidated financial statements.
F-7

ENBRIDGE ENERGY PARTNERS, L.P.
NOTES TO THE CONSOLIDATED FINANCIAL STATEMENTS
1. PARTNERSHIP ORGANIZATION AND NATURE OF OPERATIONS
General
Enbridge Energy Partners, L.P. and its subsidiaries (the ‘‘Partnership’’) is a publicly-tradedDelaware limited partnership that owns and operates crude oil and liquid petroleum transportationassets, as well as natural gas gathering, treating, processing, transmission and marketing assets in theUnited States of America. The Class A common units of the Partnership are traded on the New YorkStock Exchange (‘‘NYSE’’) under the symbol ‘‘EEP.’’
The Partnership was formed in 1991 by Enbridge Energy Company, Inc. (the ‘‘General Partner’’),which is an indirect, wholly-owned subsidiary of Enbridge Inc. (‘‘Enbridge’’) of Calgary, Canada. ThePartnership was formed to acquire, own and operate the crude oil and liquid petroleum transportationassets of Enbridge Energy, Limited Partnership (the ‘‘Lakehead Partnership’’).
On December 31, 2003, the Partnership acquired the natural gas gathering and processing assets innorth Texas (the ‘‘North Texas system’’). On October 17, 2002, the Partnership acquired the natural gasgathering, treating, processing, transmission and marketing assets of Enbridge Midcoast Energy, Inc.(comprised of the ‘‘Midcoast system’’, ‘‘Northeast Texas system’’ and the ‘‘South Texas system’’) fromthe General Partner. During 2001, the Partnership acquired the crude oil and liquid petroleumtransportation assets of Enbridge Pipelines (North Dakota) L.L.C. (the ‘‘North Dakota system’’) andnatural gas gathering, transportation, processing and marketing assets in east Texas (the ‘‘East Texassystem’’). The assets acquired are held in a series of limited liability companies and limited partnershipsowned, directly or indirectly, wholly-owned by the Partnership.
On October 17, 2002, in connection with the acquisition described above, the Partnership’sownership of the Lakehead Partnership was restructured such that the Lakehead Partnership is now awholly-owned subsidiary of the Partnership. As a result of this restructuring, the General Partner holdsa 2% general partner interest in the Partnership, but no longer holds a direct interest in the LakeheadPartnership.
Enbridge Energy Management, L.L.C.
Enbridge Energy Management, L.L.C. and its subsidiary (‘‘Enbridge Management’’), a Delawarelimited liability company, was formed on May 14, 2002. The General Partner owns all of the votingshares of Enbridge Management. At December 31, 2003 and 2002, Enbridge Management ownedapproximately 18.2% and 20.3%, respectively, of the outstanding limited partner units of thePartnership. Enbridge Management receives its earnings from this investment.
All of the Partnership’s i-units are held by Enbridge Management. As of December 31, 2003 and2002, Enbridge Management held 10,062,170 and 9,228,655 i-units, respectively. Enbridge Management,pursuant to a delegation of control agreement, manages the business and affairs of the Partnership.The Delegation of Control Agreement provides that Enbridge Management will not amend or proposeto amend the Partnership’s partnership agreement, allow a merger or consolidation involving thePartnership, allow a sale or exchange of all or substantially all of the assets of the Partnership ordissolve or liquidate the Partnership without the approval of the General Partner. In accordance withits limited liability company agreement, Enbridge Management’s activities are restricted to being alimited partner in, and managing the business and affairs, of the Partnership.
F-8

ENBRIDGE ENERGY PARTNERS, L.P.
NOTES TO THE CONSOLIDATED FINANCIAL STATEMENTS —(Continued)
1. PARTNERSHIP ORGANIZATION AND NATURE OF OPERATIONS —(Continued)
Enbridge Inc.
Enbridge, a Canadian corporation, is the indirect parent of the General Partner and is traded onthe NYSE and Toronto Stock Exchange under the symbol ‘‘ENB.’’ Enbridge is a leader in thetransportation and distribution of energy, with a focus on crude oil and liquids pipelines, natural gaspipelines and natural gas distribution in North America. Enbridge also has international interestslocated in Western Europe and Latin America. At December 31, 2003 and 2002, Enbridge and itsconsolidated subsidiaries owned, through the General Partner, an approximate 12.2% and 14.1%interest, respectively, in the Partnership.
Business Segments
The Partnership conducts its business through four business segments: Liquids Transportation,Gathering and Processing, Natural Gas Transportation, and Marketing. These operating segments arestrategic business units established by senior management to facilitate the achievement of thePartnership’s long-term objectives, to aid in resource allocation decisions and to assess operationalperformance.
As a result of the purchase of natural gas assets in October 2002, the Partnership changed theorganization of its business segments effective in the fourth quarter of 2002. Prior period segmentresults have been restated to conform to the Partnership’s current organization. For more informationon the Partnership’s reportable business segments, see Note 14.
Liquids Transportation
Liquids Transportation includes the operations of the Lakehead system, which consists of crude oiland liquid petroleum transportation and storage assets in the Great Lakes and Midwest regions of theUnited States. The Lakehead system, which spans approximately 1,900 miles, has been in operation forover 50 years and is the primary transporter of crude oil and liquid petroleum from western Canada tothe United States. The Lakehead system serves all the major refining centers in the Great Lakes andMidwest regions of the United States and the Province of Ontario, Canada. Liquids Transportation alsoincludes the operations of the North Dakota system, which consists of crude oil gathering linesconnected to a transportation line that interconnects directly with the Lakehead system in the state ofMinnesota.
Gathering and Processing
The Gathering and Processing segment includes the East Texas, Midcoast, Northeast Texas, SouthTexas and the newly acquired North Texas systems. The East Texas system includes natural gasgathering and transmission pipelines, four natural gas treating plants and three natural gas processingplants. The Midcoast system consists of 35 gathering and processing/treating systems, as well as trucks,trailers, and rail cars used for transporting natural gas liquids (‘‘NGLs’’), crude oil and carbon dioxide.The Northeast Texas system includes natural gas gathering pipelines, nine natural gas treating plantsand three natural gas processing plants. The South Texas system includes natural gas gatheringpipelines, a hydrogen sulfide treating plant and a natural gas processing plant. The North Texas systemincludes natural gas gathering pipelines and nine natural gas processing plants.
F-9

ENBRIDGE ENERGY PARTNERS, L.P.
NOTES TO THE CONSOLIDATED FINANCIAL STATEMENTS —(Continued)
1. PARTNERSHIP ORGANIZATION AND NATURE OF OPERATIONS —(Continued)
Natural Gas Transportation
The Natural Gas Transportation segment consists of four Federal Energy Regulatory Commission(‘‘FERC’’) regulated natural gas transmission pipeline systems and 35 intrastate natural gastransmission and wholesale customer pipeline systems located in the Mid-Continent and Gulf Coastregions of the United States. These pipeline systems form part of the Midcoast System assets that wereacquired from the General Partner in 2002, see Note 3.
Marketing
The Marketing segment primarily provides natural gas supply, transmission storage and salesservices for producers and wholesale customers on the Partnership’s pipelines as well as otherinterconnected natural gas pipeline systems. Natural gas marketing activities are primarily undertakento increase pipeline utilization, realize incremental margins on gas purchased at the wellhead, andprovide value added services to customers.
2. SUMMARY OF SIGNIFICANT ACCOUNTING POLICIES
The consolidated financial statements of the Partnership are prepared in accordance withaccounting principles generally accepted in the United States of America. The preparation ofconsolidated financial statements requires management to make estimates and assumptions that affectthe reported amounts of assets, liabilities, revenues, expenses and the disclosure of contingent assetsand liabilities. Management evaluates these estimates on an ongoing basis, utilizing historicalexperience, consultation with experts and other methods considered reasonable in the particularcircumstances. Nevertheless, actual results may differ significantly from the estimates. Any effects onthe consolidated financial statements resulting from revisions to these estimates are recorded in theperiod in which the facts that give rise to the revision become known.
Basis of Presentation and Principles of Consolidation
The financial statements include the accounts of the Partnership and its wholly-owned subsidiarieson a consolidated basis. All significant intercompany items have been eliminated in consolidation.
Regulation
The Partnership’s Liquids Transportation, Gathering and Processing and certain of its Natural GasTransportation activities are subject to regulation by the FERC and various state authorities. Regulatorybodies exercise statutory authority over matters such as construction, rates and underlying accountingpractices, and ratemaking agreements with customers.
Certain of the Natural Gas Transportation systems are subject to the provisions of Statement ofFinancial Accounting Standards (‘‘SFAS’’) No. 71, ‘‘Accounting for the Effects of Certain Types ofRegulation.’’ Accordingly, certain assets and liabilities that result from the regulated ratemaking processare recorded that would not be recorded for non-regulated entities under accounting principlesgenerally accepted in the United States of America. The Partnership acquired four interstateFERC-regulated natural gas transmission pipeline systems as part of the Midcoast Acquisition, see alsoNote 3.
F-10
ENBRIDGE ENERGY PARTNERS, L.P.
NOTES TO THE CONSOLIDATED FINANCIAL STATEMENTS —(Continued)
2. SUMMARY OF SIGNIFICANT ACCOUNTING POLICIES —(Continued)
Revenue Recognition
Revenues of the Liquids Transportation segment are derived from interstate transportation ofcrude oil and liquid petroleum under tariffs regulated by the FERC. The tariffs specify the amounts tobe paid by shippers for service between receipt and delivery locations and the general terms andconditions of transportation service on the respective pipeline systems. Revenues are recorded upondelivery. The Partnership does not own the crude oil and liquid petroleum that it transports, andtherefore does not assume the related commodity risk.
Revenues of the Gathering and Processing segment are derived from gathering and processingservices under the following types of arrangements:
Fee-Based Arrangements: Under a fee-based contract, the Partnership receives a set fee forgathering, treating, processing and transmission of raw natural gas and providing other gatheringservices. These revenues correlate with volumes and types of service, and do not depend directly oncommodity prices.
Other Arrangements: The Partnership also utilizes other types of arrangements in its natural gasgathering and processing business:
• Percentage-of-Index-Contracts—Under these contracts, the Partnership purchases raw naturalgas at a negotiated discount to an agreed upon index. The Partnership then resells the naturalgas, generally for the index price, keeping the difference as its fee.
• Percentage-of-Proceeds Contracts-Under these contracts, the Partnership receives a negotiatedpercentage of the natural gas it processes in the form of residue natural gas, NGLs condensateand sulfur, which it then sells at market prices.
• Keep-Whole Contracts—Under these contracts, the Partnership gathers or purchases raw naturalgas from the producer for processing. A portion of the gathered or purchased gas is consumedduring processing. The Partnership extracts and retains the NGLs produced during processingfor its own account, which it sells at market prices. In instances where the Partnership purchasesraw gas at the wellhead, it also sells for its own account the residue gas resulting fromprocessing at market prices. In those instances when the Partnership gathers and processes rawnatural gas for the account of the producer, it must return to the producer residue gas with aBritish Thermal Unit content equivalent to the original raw gas it received.
Some of these other arrangements expose the Partnership to commodity price risk, which issubstantially mitigated by offsetting physical purchases and sales and derivative financial instruments.Revenues under all arrangements are recognized upon delivery of natural gas and natural gas liquids tocustomers and/or upon services rendered.
Revenues of the Natural Gas Transportation segment are generally derived from reservation feescharged for transmission of natural gas on the FERC-regulated interstate natural gas transmissionpipeline systems, while revenues from intrastate pipelines are generally derived from the bundled salesof natural gas and transmission services. Customers of the FERC-regulated natural gas pipeline systemstypically pay a reservation fee each month to reserve capacity plus a nominal commodity charge basedon actual transmission volumes. Revenues are recognized as natural gas is delivered to customers or astransportation services are rendered.
F-11

ENBRIDGE ENERGY PARTNERS, L.P.
NOTES TO THE CONSOLIDATED FINANCIAL STATEMENTS —(Continued)
2. SUMMARY OF SIGNIFICANT ACCOUNTING POLICIES —(Continued)
Revenues of the Marketing segment are derived from providing supply, transmission storage andsales service for producers and wholesale customers on the Partnership’s natural gas gathering,transmission and customer pipelines, as well as other interconnected pipeline systems. Natural gasmarketing activities are primarily undertaken to increase pipeline utilization, realize incrementalmargins on gas purchased at the wellhead, and provide value-added services to customers. In general,natural gas purchased and sold by the Marketing business is priced at a published daily or monthlyprice index. Sales to wholesale customers typically incorporate a premium for managing theirtransmission and balancing requirements. Higher premiums and associated margins result fromtransactions that involve smaller volumes or that offer greater service flexibility for wholesalecustomers. At the request of some customers, the Partnership will enter into long-term fixed pricepurchase or sale contracts with its customers and usually will enter into offsetting positions under thesame or similar terms. Revenues are recognized upon delivery of natural gas and natural gas liquids tocustomers and/or upon services rendered.
Cash and Cash Equivalents
Cash equivalents are defined as all highly marketable securities with maturities of three months orless when purchased. The carrying value of cash and cash equivalents approximates fair value becauseof the short term to maturity of these investments.
The Partnership extinguishes liabilities when a creditor has relieved the Partnership of theobligation, which occurs when the Partnership’s financial institution honors a check that the creditorhas presented for payment. As such, included in Accounts Payable and Other are obligations for whichthe Partnership has issued check payments that have not yet been presented to the financial institutionof approximately $11.9 million and $2.9 million at December 31, 2003 and 2002, respectively.
Allowance for Doubtful Accounts
The Partnership establishes provisions for losses on accounts receivable if it determines that it willnot collect all or part of the outstanding balance. Collectibility is reviewed regularly and an allowance isestablished or adjusted, as necessary, using the specific identification method.
Other Current Assets
Other current assets include product inventory, materials and supplies inventory, and prepaidexpenses. The product inventory consists of natural gas liquids and natural gas. All inventories arevalued at the lower of cost or market.
Operational Balancing Agreements and Natural Gas Imbalances
To facilitate deliveries of natural gas and provide for operational flexibility, many natural gastransmission companies have operational balancing agreements in place with other interconnectingpipelines. These agreements ensure that the volume of gas a shipper schedules for transportationbetween two interconnecting pipelines equals the volume actually delivered. If natural gas movesbetween pipelines in volumes that are more or less than the volumes the shipper previously scheduled,a gas imbalance is created. The imbalances are settled through periodic cash payments or repaid inkind through the receipt or delivery of natural gas in the future. Gas imbalances are recorded as
F-12

ENBRIDGE ENERGY PARTNERS, L.P.
NOTES TO THE CONSOLIDATED FINANCIAL STATEMENTS —(Continued)
2. SUMMARY OF SIGNIFICANT ACCOUNTING POLICIES —(Continued)
current assets or current liabilities on the balance sheet using the posted index prices, whichapproximate market rates, or the Partnership’s weighted average cost of gas.
Property, Plant and Equipment
Property, plant and equipment is stated at its original cost of construction or, upon acquisition, atthe fair value of the assets acquired. Expenditures for system expansion and major renewals andbetterments are capitalized; maintenance and repair costs are expensed as incurred.
Depreciation rates for the pipeline systems are based on the lesser of the estimated remaininguseful lives of the properties or the estimated remaining life of crude oil or natural gas production inthe basins served by the pipelines.
The Partnership capitalizes direct costs, such as labor and materials, and related indirect costs,such as overhead and interest at the Partnership’s weighted average cost of debt, and, in its regulatedbusinesses that apply the provisions of SFAS No. 71, an equity return component, during construction.Depreciation of property, plant and equipment is provided on a straight-line basis over estimated usefullives. For all segments, on disposition of property, plant and equipment, the cost less net proceeds isnormally charged to accumulated depreciation and no gain or loss on disposal is recognized.
Expenditures related to property, plant and equipment are capitalized (‘‘capital expenditures’’),subject to a minimum rule, that have a useful life greater than one year for (1) assets purchased orconstructed; (2) existing assets that are extended, replaced, or improved; or (3) all land, regardless ofcost. Acquisition of new assets, additions, replacements and improvements (other than land) costingless than the established minimum rules are expensed accordingly.
Capital expenditures are categorized by the Partnership as either core maintenance orenhancement expenditures. Core maintenance expenditures are those expenditures that are necessary tomaintain the service capability of the existing assets and includes the replacement of systemcomponents and equipment which is worn, obsolete or completing its useful life. Enhancementexpenditures improve the service capability of the existing assets, extend asset useful lives, increasecapacities from existing levels, reduce costs or enhance revenues, and enable the Partnership to respondto governmental regulations and developing industry standards.
The Partnership evaluates impairment of long-lived assets whenever events or changes incircumstances indicate that the carrying amount of an asset may not be recoverable. An impairmentloss will be recognized when the sum of estimated undiscounted future cash flows expected to resultfrom use of the asset and its eventual disposition is less than its carrying amount. If an impairment losswill be recognized, the amount of the impairment would be calculated as the excess of the carryingamount of the asset over the fair value of the assets either through reference to similar asset sales, orby estimating the fair value using a discounted cash flow approach. There have been no impairmentsrecorded in 2003, 2002 or 2001.
Goodwill
Goodwill represents the excess of the purchase price over the fair value of net assets acquired in abusiness combination. Goodwill is allocated to three of the Partnership’s segments, Gathering andProcessing, Natural Gas Transportation, and Marketing.
F-13
ENBRIDGE ENERGY PARTNERS, L.P.
NOTES TO THE CONSOLIDATED FINANCIAL STATEMENTS —(Continued)
2. SUMMARY OF SIGNIFICANT ACCOUNTING POLICIES —(Continued)
Effective January 1, 2002, the Partnership adopted SFAS No. 142, ‘‘Goodwill and Other IntangibleAssets’’. Goodwill is not amortized but is tested for impairment annually, or more frequently ifimpairment indicators arise that indicate the carrying value of goodwill may not be recovered.Impairment occurs when the carrying amount of a reporting unit exceeds the fair value of the reportingunit. At the time the Partnership determines that impairment has occurred, the carrying value of thegoodwill is written down to its fair value.
Intangibles, Net
Other intangible assets consist of natural gas purchase and sale customer contracts, and natural gasopportunities, which are amortized on a straight-line basis, which approximates the effective interestmethod, over the weighted average useful life of the underlying reserves.
The Partnership evaluates the carrying value of the intangible assets, whenever certain events orchanges in circumstances indicate that the carrying amount of these assets may not be recoverable. Inassessing the recoverability of intangibles, the Partnership compares the carrying value to theundiscounted future cash flows the intangibles are expected to generate. If the total of theundiscounted future cash flows is less than the carrying amount of the intangibles, the intangibles arewritten down to their fair value. There have been no impairments recorded in 2003, 2002, or 2001.
Other Assets
Other assets primarily include deferred financing charges, which are amortized on a straight-linebasis, which approximates the effective interest method, over the life of the related debt and classifiedas interest expense on the Consolidated Statements of Income.
Income Taxes
The Partnership is not a taxable entity for federal and state income tax purposes. Accordingly, norecognition is given to income taxes for financial reporting purposes. The tax on Partnership netincome is borne by the individual partners through the allocation of taxable income. Net income forfinancial statement purposes may differ significantly from taxable income of unitholders as a result ofdifferences between the tax basis and financial reporting basis of assets and liabilities and the taxableincome allocation requirements under the Partnership Agreement. The aggregate difference in the basisof the Partnership’s net assets for financial and tax reporting purposes cannot be readily determinedbecause information regarding each partner’s tax attributes in the Partnership is not available.
Derivative Financial Instruments
Net income and cash flows are subject to volatility stemming from changes in market prices suchas interest rates, natural gas prices, natural gas liquids prices and fractionation margins. In order tomanage the risks to Partnership unitholders, the General Partner uses a variety of derivative financialinstruments to create offsetting positions to specific commodity or interest rate exposures. Under SFASNo. 133 all derivative financial instruments are reflected in the balance sheet at their fair value. Forthose instruments that qualify for hedge accounting, the accounting treatment depends on eachinstrument’s intended use and how it is designated. For those instruments that do not qualify for hedgeaccounting, the change in market value is recorded as cost of natural gas in the Consolidated Statementof Income.
F-14

ENBRIDGE ENERGY PARTNERS, L.P.
NOTES TO THE CONSOLIDATED FINANCIAL STATEMENTS —(Continued)
2. SUMMARY OF SIGNIFICANT ACCOUNTING POLICIES —(Continued)
In implementing its hedging programs, the General Partner has established a formal analysis,execution and reporting framework that requires the approval of the Board of Directors of the GeneralPartner or a committee of senior management. Derivative financial instruments are employed inconnection with an underlying asset, liability and/or anticipated transaction and are not used forspeculative purposes.
Derivative financial instruments qualifying for hedge accounting treatment and in use by thePartnership can generally be divided into two categories: 1) cashflow hedges, or 2) fair value hedges.Cashflow hedges are entered into to hedge the variability in cashflow(s) related to a forecastedtransaction. Fair value hedges are entered into to hedge the value of a recognized asset or liability.
At inception, the Partnership formally documents the relationship between the hedging instrumentand the hedged item, the risk management objectives, and the methods used for assessing and testingcorrelation and hedge effectiveness. The Partnership also assesses, both at the inception of the hedgeand on an on-going basis, whether the derivatives that are used in its hedging transactions are highlyeffective in offsetting changes in cash flows or fair value of the hedged item. Furthermore, thePartnership regularly assesses the creditworthiness of the derivative counterparties to manage againstthe risk of default. If the Partnership determines that a derivative is no longer highly effective as ahedge, it discontinues hedge accounting prospectively by including changes in the fair value of thederivative in current earnings.
For cash flow hedges, changes in the derivative fair values, to the extent that the hedges aredetermined to be highly effective, are recorded as a component of accumulated other comprehensiveincome until the hedged transactions occur and are recognized in earnings. Any ineffective portion of acash flow hedge’s change in value is recognized immediately in earnings. For fair value hedges, thechange in mark to market value of the financial instrument is determined each period and is taken intoearnings. In conjunction with this, the change in the value of the hedged item is also calculated andtaken into earnings. To the extent that the two valuations offset, the hedge is effective and there shouldnot be a net earnings effect.
Environmental Liabilities
The Partnership expenses or capitalizes, as appropriate, expenditures for ongoing compliance withenvironmental regulations that relate to past or current operations. Amounts for remediation ofexisting environmental contamination caused by past operations, which do not benefit future periods bypreventing or eliminating future contamination, are expensed. Liabilities are recorded whenenvironmental assessments indicate that remediation efforts are probable, and the costs can bereasonably estimated. Estimates of the liabilities are based on currently available facts, existingtechnology and presently enacted laws and regulations taking into consideration the likely effects ofinflation and other factors. These amounts also consider prior experience in remediating contaminatedsites, other companies’ clean-up experience and data released by government organizations. Theseestimates are subject to revision in future periods based on actual costs or new circumstances and areincluded on the balance sheet in other current and long-term liabilities at their undiscounted amounts.The Partnership evaluates recoveries from insurance coverage separately from its liability and, whenrecovery is probable, it records and reports an asset separately from the associated liability in itsfinancial statements.
F-15

ENBRIDGE ENERGY PARTNERS, L.P.
NOTES TO THE CONSOLIDATED FINANCIAL STATEMENTS —(Continued)
2. SUMMARY OF SIGNIFICANT ACCOUNTING POLICIES —(Continued)
The Partnership recognizes liabilities for other contingencies when it has an exposure that, whenfully analyzed, indicates it is either probable that an asset has been impaired or that a liability has beenincurred and the amount of impairment or loss can be reasonably estimated. When a range of probableloss can be estimated, the Partnership accrues the most likely amount, or at least the minimum of therange of probable loss.
Asset Retirement Obligations
Effective January 1, 2003, the Partnership adopted SFAS No. 143, ‘‘Accounting for Asset RetirementObligations’’ (‘‘SFAS No. 143’’), which addresses accounting and reporting for legal asset obligationsassociated with the retirement of long-lived tangible assets. SFAS No. 143 requires entities to recordthe fair value of a liability for the retirement obligation in the period in which the liability is incurred ifa reasonable estimate of fair value can be made. The associated asset retirement costs are capitalizedas part of the carrying value of the asset, which is subsequently depreciated over its useful life. Foroffshore pipeline systems, a legal obligation exists for decommissioning requirements. However, the fairvalue of the asset retirement obligations cannot be reasonably estimated, as settlement dates and scopeof decommissioning work are indeterminate. For a minority of onshore rights-of-way agreements, alegal obligation may be construed to exist due to the requirement to remove the pipe at finalabandonment. However, the fair value of the asset retirement obligation cannot be reasonablyestimated, as the settlement dates are indeterminate. In certain rate jurisdictions, the Partnership ispermitted to include annual charges for cost of removal in its regulated cost of service rates charged tocustomers. For the year ended December 31, 2003, the Partnership recorded a $0.8 million long-termliability with a resulting increase in the related property, plant and equipment in the consolidatedstatement of financial position and a corresponding accretion expense of $0.1 million in theconsolidated statement of net income.
Comparative Amounts
Certain reclassifications have been made to the prior years’ reported amounts to conform to theclassifications used in the 2003 consolidated financial statements. These reclassifications have no impacton net income.
New Accounting Pronouncements
In April 2003, the Financial Accounting Standards Board (‘‘FASB’’) issued SFAS No. 149,‘‘Amendment of Statement 133 on Derivative Instruments and Hedging Activities.’’ This statement amendsand clarifies financial accounting and reporting for derivative instruments, including certain derivativeinstruments embedded in other contracts (collectively referred to as derivatives) and for hedgingactivities under SFAS No. 133, Accounting for Derivative Instruments and Hedging Activities. Inparticular, this statement: (1) clarifies under what circumstances a contract with an initial netinvestment meets the characteristic of a derivative discussed in paragraph 6(b) of SFAS No. 133,(2) clarifies when a derivative contains a financing component, (3) amends the definition of anunderlying to conform it to language used in FASB Interpretation No. 45, Guarantor’s Accounting andDisclosure Requirements for Guarantees, Including Indirect Guarantees of Indebtedness of Others, and(4) amends certain other existing pronouncements. The new standard was adopted July 1, 2003 and didnot have a significant impact on the Partnership’s financial position, results of operations, or cash flows.
F-16
ENBRIDGE ENERGY PARTNERS, L.P.
NOTES TO THE CONSOLIDATED FINANCIAL STATEMENTS —(Continued)
2. SUMMARY OF SIGNIFICANT ACCOUNTING POLICIES —(Continued)
In January 2003, the FASB issued Interpretation No. 46, ‘‘Consolidation of Variable Interest Entities’’(‘‘FIN 46’’). FIN 46 requires an investor with a majority of the variable interests in a variable interestentity to consolidate the entity and also requires majority and significant variable interest investors toprovide certain disclosures. A variable interest entity is an entity in which the equity investors do nothave a controlling interest or the equity investment at risk is insufficient to finance the entity’s activitieswithout receiving additional subordinated financial support form the other parties. In December 2003,the FASB completed deliberations of proposed modifications to FIN 46 resulting in multiple effectivedates based on the nature as well as the creation date of the variable interest entity. However, therevised Interpretation must be applied no later than the first quarter of fiscal year 2004. There was noimpact on the Partnership’s consolidated financial position or results if operations as a result of theadoption of FIN 46, as revised.
3. ACQUISITIONS
The primary strategy of the Partnership is to grow cash distributions through the profitableexpansion of existing assets and through development and acquisition of complementary businesses withsimilar risk profiles to the Partnership’s current business. During 2003 and 2002, the Partnershipcompleted acquisitions, each of which were accounted for using the purchase method and the assetsacquired and liabilities assumed were recorded at their estimated fair market values as determined byindependent appraisals. The results of operations from these acquisitions are included in earnings fromthe effective date of acquisition.
North Texas Acquisition
Effective December 31, 2003, the Partnership acquired natural gas gathering and processing assetsin north Texas. The gathering system, referred to as the North Texas system, primarily serves the FortWorth Basin, including the Barnett Shale producing zone, and is complementary to the Partnership’sexisting natural gas systems in the area. The assets were purchased for cash of $249.7 million, whichincludes the buyout of a capital lease of $1.9 million and transaction costs of $1.8 million. The purchasewas funded with borrowings under the Partnership’s 364-day revolving credit facility and three-yearterm facility. The value allocated to the assets was determined by an independent appraisal. Goodwillassociated with the acquisition was $23.9 million, and is allocated entirely to the Gathering andProcessing segment. Intangible assets acquired of $48.1 million represents the fair value associated withthe natural gas supply opportunities present in the Barnett Shale producing zone that will be shippedthrough the North Texas systems and is recorded in the Gathering and Processing segment. Of the$2.7 million environmental liabilities assumed, $0.5 million are included in accounts payable and otherand $2.2 million are included in commitments, contingencies and environmental liabilities on theconsolidated Statement of Financial Position.
F-17
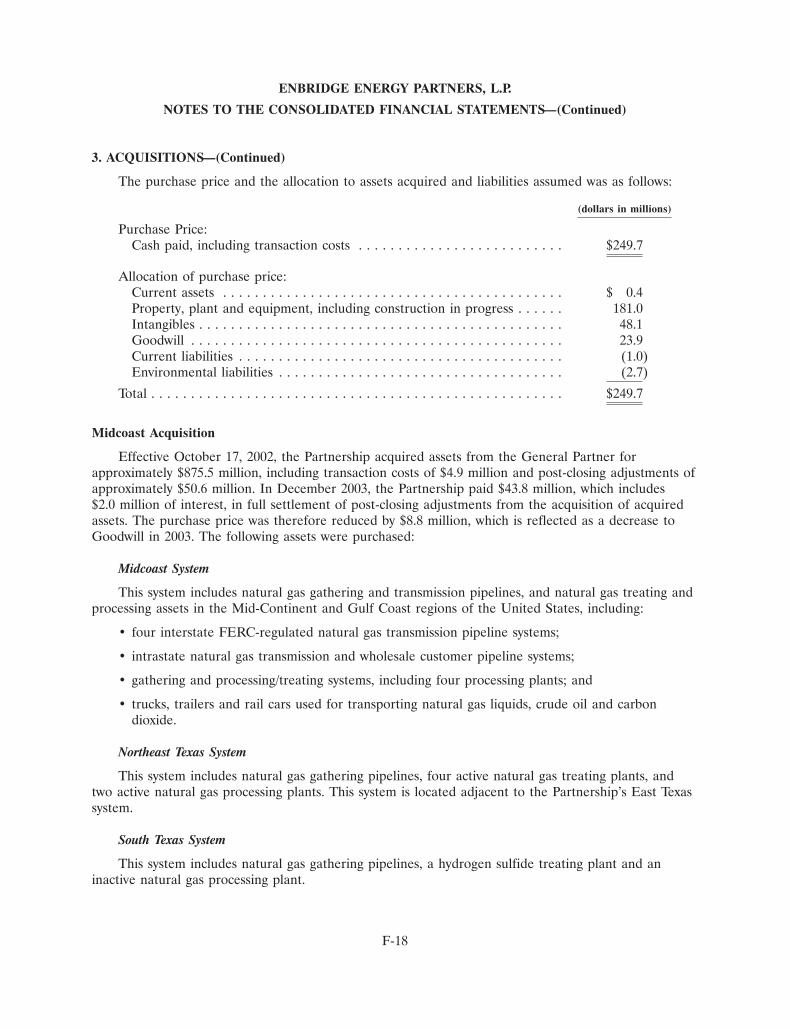
ENBRIDGE ENERGY PARTNERS, L.P.
NOTES TO THE CONSOLIDATED FINANCIAL STATEMENTS —(Continued)
3. ACQUISITIONS —(Continued)
The purchase price and the allocation to assets acquired and liabilities assumed was as follows:
(dollars in millions)
Purchase Price:Cash paid, including transaction costs . . . . . . . . . . . . . . . . . . . . . . . . . . $249.7
Allocation of purchase price:Current assets . . . . . . . . . . . . . . . . . . . . . . . . . . . . . . . . . . . . . . . . . . . $ 0.4Property, plant and equipment, including construction in progress . . . . . . 181.0Intangibles . . . . . . . . . . . . . . . . . . . . . . . . . . . . . . . . . . . . . . . . . . . . . . 48.1Goodwill . . . . . . . . . . . . . . . . . . . . . . . . . . . . . . . . . . . . . . . . . . . . . . . 23.9Current liabilities . . . . . . . . . . . . . . . . . . . . . . . . . . . . . . . . . . . . . . . . . (1.0)Environmental liabilities . . . . . . . . . . . . . . . . . . . . . . . . . . . . . . . . . . . . (2.7)
Total . . . . . . . . . . . . . . . . . . . . . . . . . . . . . . . . . . . . . . . . . . . . . . . . . . . . $249.7
Midcoast Acquisition
Effective October 17, 2002, the Partnership acquired assets from the General Partner forapproximately $875.5 million, including transaction costs of $4.9 million and post-closing adjustments ofapproximately $50.6 million. In December 2003, the Partnership paid $43.8 million, which includes$2.0 million of interest, in full settlement of post-closing adjustments from the acquisition of acquiredassets. The purchase price was therefore reduced by $8.8 million, which is reflected as a decrease toGoodwill in 2003. The following assets were purchased:
Midcoast System
This system includes natural gas gathering and transmission pipelines, and natural gas treating andprocessing assets in the Mid-Continent and Gulf Coast regions of the United States, including:
• four interstate FERC-regulated natural gas transmission pipeline systems;
• intrastate natural gas transmission and wholesale customer pipeline systems;
• gathering and processing/treating systems, including four processing plants; and
• trucks, trailers and rail cars used for transporting natural gas liquids, crude oil and carbondioxide.
Northeast Texas System
This system includes natural gas gathering pipelines, four active natural gas treating plants, andtwo active natural gas processing plants. This system is located adjacent to the Partnership’s East Texassystem.
South Texas System
This system includes natural gas gathering pipelines, a hydrogen sulfide treating plant and aninactive natural gas processing plant.
F-18

ENBRIDGE ENERGY PARTNERS, L.P.
NOTES TO THE CONSOLIDATED FINANCIAL STATEMENTS —(Continued)
3. ACQUISITIONS —(Continued)
The Partnership funded this acquisition through the assumption of $472.3 million in debt related tothe acquired systems, the issuance to the General Partner of an additional $8.2 million equity interestin the Partnership, $332.7 million of proceeds from the issuance of i-units to Enbridge Managementand the payment to the General Partner of $11.7 million in cash, which was funded by the Partnershipwith borrowings under its 364-day revolving credit facility. A committee of independent members of theBoard of Directors of the General Partner negotiated the purchase price and the terms of theacquisition on behalf of the Partnership and recommended that the Board of Directors of the GeneralPartner approve the acquisition on behalf of the Partnership. The value allocated to the assets wasdetermined by agreement between the parties and supported by an independent appraisal. Included inthe acquired current assets of $51.3 million is a $3.7 million reserve for doubtful accounts. Goodwillassociated with the acquisition was $226.0 million, and is allocated to the Gathering and Processing,Natural Gas Transportation, and Marketing segments. Intangible assets acquired of $16.1 million relateto customer contracts for gas purchases and sales and are recorded in the Gathering and Processingand Natural Gas Transportation segments. Other liabilities consist primarily of amounts payable for gas,NGL and interest rate swaps of $14.6 million and an environmental contingency of $5.9 million.
The purchase price and the allocation to assets acquired was as follows:
(dollars in millions)
Purchase Price:Debt assumed . . . . . . . . . . . . . . . . . . . . . . . . . . . . . . . . . . . . . . . . . . . $472.3Issuance of equity interest to the General Partner . . . . . . . . . . . . . . . . . 8.2Cash paid, including transaction costs . . . . . . . . . . . . . . . . . . . . . . . . . . 344.4Working capital and other adjustments(1) . . . . . . . . . . . . . . . . . . . . . . . 50.6
Total purchase price . . . . . . . . . . . . . . . . . . . . . . . . . . . . . . . . . . . . . . . . . $875.5
Allocation of purchase price:Current assets . . . . . . . . . . . . . . . . . . . . . . . . . . . . . . . . . . . . . . . . . . . $ 51.3Property, plant and equipment . . . . . . . . . . . . . . . . . . . . . . . . . . . . . . . 626.7Goodwill(1) . . . . . . . . . . . . . . . . . . . . . . . . . . . . . . . . . . . . . . . . . . . . . 226.0Other assets and intangibles . . . . . . . . . . . . . . . . . . . . . . . . . . . . . . . . . 19.1Current liabilities . . . . . . . . . . . . . . . . . . . . . . . . . . . . . . . . . . . . . . . . . (26.4)Other liabilities . . . . . . . . . . . . . . . . . . . . . . . . . . . . . . . . . . . . . . . . . . (21.2)
Total . . . . . . . . . . . . . . . . . . . . . . . . . . . . . . . . . . . . . . . . . . . . . . . . . . . . $875.5
(1) Working capital and other adjustments were settled and paid in December 2003 for $43.8 million,which includes $2.0 million of interest. As a result, Goodwill was reduced by $8.8 million.
Pro Forma Information (Unaudited)
The following summarized unaudited Pro Forma Consolidated Income Statement information forthe twelve months ended December 31, 2003 and 2002 assumes the acquisitions described aboveoccurred as of January 1, 2002. These unaudited Pro Forma financial results have been prepared forcomparative purposes only. These unaudited Pro Forma financial results may not be indicative of theresults that would have occurred if the Partnership had completed the acquisitions as of January 1,
F-19

ENBRIDGE ENERGY PARTNERS, L.P.
NOTES TO THE CONSOLIDATED FINANCIAL STATEMENTS —(Continued)
3. ACQUISITIONS —(Continued)
2002 or the results that will be attained in the future. Amounts presented below are in millions, exceptfor the per unit amounts.
Pro FormaYear Ended December 31,
2003 2002
(Unaudited)
Revenues . . . . . . . . . . . . . . . . . . . . . . . . . . . . . . . . . . . . . . . . . . . $3,484.4 $2,209.1Net Income . . . . . . . . . . . . . . . . . . . . . . . . . . . . . . . . . . . . . . . . . $ 127.4 $ 70.7Net Income per Unit . . . . . . . . . . . . . . . . . . . . . . . . . . . . . . . . . . . $ 2.11 $ 1.16
4. NET INCOME PER UNIT
Net income per unit is computed by dividing net income, after deduction of the General Partner’sallocation, by the weighted average number of Class A and B common units and i-units outstanding.The General Partner’s allocation is equal to an amount based upon its general partner interest,adjusted to reflect an amount equal to incentive distributions and an amount required to reflectdepreciation on the General Partner’s historical cost basis for assets contributed on formation of thePartnership. Net income per unit was determined as follows:
Year ended December 31,
2003 2002 2001
(dollars and units in millions,except per unit amounts)
Net income . . . . . . . . . . . . . . . . . . . . . . . . . . . . . . . . . . . . . . . . . . . . . $111.7 $ 78.1 $38.9Net income allocated to General Partner . . . . . . . . . . . . . . . . . . . . . . . (2.2) (1.1) (0.4)Incentive distributions and historical cost depreciation adjustments . . . . . (17.4) (12.0) (8.7)
(19.6) (13.1) (9.1)
Net income allocable to common units and i-units . . . . . . . . . . . . . . . . . $ 92.1 $ 65.0 $29.8
Weighted average outstanding . . . . . . . . . . . . . . . . . . . . . . . . . . . . . . . 47.7 36.7 30.2
Net income per common and i-unit . . . . . . . . . . . . . . . . . . . . . . . . . . . $ 1.93 $ 1.76 $0.98
F-20

ENBRIDGE ENERGY PARTNERS, L.P.
NOTES TO THE CONSOLIDATED FINANCIAL STATEMENTS —(Continued)
5. PROPERTY, PLANT AND EQUIPMENT
December 31,DepreciationRates 2003 2002
(dollars in millions)
Land . . . . . . . . . . . . . . . . . . . . . . . . . . . . . . . . . . . . . . . . . . . . — $ 12.6 $ 10.4Rights-of-way . . . . . . . . . . . . . . . . . . . . . . . . . . . . . . . . . . . . . . 0.60% — 5.71% 222.9 192.5Pipeline . . . . . . . . . . . . . . . . . . . . . . . . . . . . . . . . . . . . . . . . . . 0.60% — 14.29% 1,770.1 1,576.1Pumping equipment, buildings and tanks . . . . . . . . . . . . . . . . . . 0.20% — 20.00% 587.9 520.1Compressors, meters, and other operating equipment . . . . . . . . . 1.52% — 20.00% 167.3 114.5Vehicles, office furniture and equipment . . . . . . . . . . . . . . . . . . 0.09% — 33.33% 69.4 62.1Processing and treater plants . . . . . . . . . . . . . . . . . . . . . . . . . . 4.00% 115.2 96.4Construction in progress . . . . . . . . . . . . . . . . . . . . . . . . . . . . . . — 66.8 130.1
$3,012.2 $2,702.2
Accumulated depreciation . . . . . . . . . . . . . . . . . . . . . . . . . . . . . (546.6) (448.9)
$2,465.6 $2,253.3
Based on a third-party study commissioned by management, revised depreciation rates for theLakehead system were implemented effective January 1, 2003, which represent the expected remainingservice life of the pipeline system. The annual composite rate was reduced from 3.9% to 3.17% on theLakehead System. Depreciation expense would have been approximately $109.6 million or $13.4 millionhigher and net income per unit would have been approximately $1.65 or $0.28 cents lower had the 2002depreciation rates been in effect during 2003.
6. GOODWILL
The changes in the carrying amount of goodwill for each of the years ended December 31, 2003and 2002 are as follows:
Liquids Gathering and Natural GasTransportation Processing Transportation Marketing Corporate Total
(dollars in millions)Balance as of January 1, 2002 . . . . . . . . . $— $ 15.1 $ — $ — $— $ 15.1
Acquired during the year in conjunctionwith the Midcoast acquisition . . . . . . . — 132.1 73.5 20.4 — 226.0
Balance as of December 31, 2002 . . . . . . $— $147.2 $73.5 $20.4 $— $241.1
Purchase price adjustments . . . . . . . . . . . — 0.8 (8.5) — — (7.7)
Acquired during the year in conjunctionwith the North Texas acquisition . . . . . — 23.9 — — — 23.9
Balance as of December 31, 2003 . . . . . . $— $171.9 $65.0 $20.4 $— $257.3
Net income and earnings per unit, as reported for the year ending December 31, 2001, would havebeen unaffected by our adoption of SFAS No. 142 as the balance of goodwill at January 1, 2002 wasacquired on November 30, 2001 and did not result in the recognition of material amortization expensefor the year ending December 31, 2001.
F-21

ENBRIDGE ENERGY PARTNERS, L.P.
NOTES TO THE CONSOLIDATED FINANCIAL STATEMENTS —(Continued)
6. GOODWILL —(Continued)
In accordance with SFAS No. 142, the Partnership completed its annual goodwill impairment testas of June 30, 2003. To estimate the fair value of the reporting units, management made estimates andjudgments about future cash flows, as well as revenue, cost of sales, operating expenses, capitalexpenditures, and net working capital based on assumptions that are consistent with the long-rangeplans used to manage the business. Based on the results of the impairment analysis, the fair value ofthe total equity of each reporting unit was determined to exceed the respective carrying value. As aresult, no goodwill impairment existed in any of its reporting units at June 30, 2003 and no eventsoccurred or circumstances changed that would more likely than not reduce the fair value of itsreporting units below the carrying amounts as of December 31, 2003.
7. INTANGIBLES
December 31,
2003 2002
Gross Carrying Accumulated Gross Carrying AccumulatedAmount Amortization Amount Amortization
(dollars in millions)
Customer Contracts . . . . . . . . . . . . . $31.1 $(2.0) $31.1 $(0.7)Natural gas supply opportunities . . . . 48.1 — — —
$79.2 $(2.0) $31.1 $(0.7)
Customer contracts are comprised entirely of natural gas purchase and sale contracts and arerecorded in the Gathering and Processing, Natural Gas Transportation, and Marketing segments.Customer contracts are amortized over the weighted average useful life of the underlying reserves,which is approximately 25 years.
The natural gas supply opportunities were acquired in conjunction with the North Texas acquisition(see Note 3) and are recorded entirely in the Gathering and Processing segment. The value of theintangible was determined by a third party appraisal and it represents the fair value associated withgrowth opportunities present in the Barnett Shale producing zone. The natural gas supply opportunitiesare being amortized over the weighted average estimated useful life of the underlying reserves, which isapproximately 25 years.
The aggregate amortization expense for the years ended December 31, 2003, 2002 and 2001, were$1.3 million, $0.7 million, and zero, respectively.
The estimated amortization expense for each of the years ended December 31, 2004, 2005, 2006,2007, and 2008 is $3.1 million, respectively.
F-22
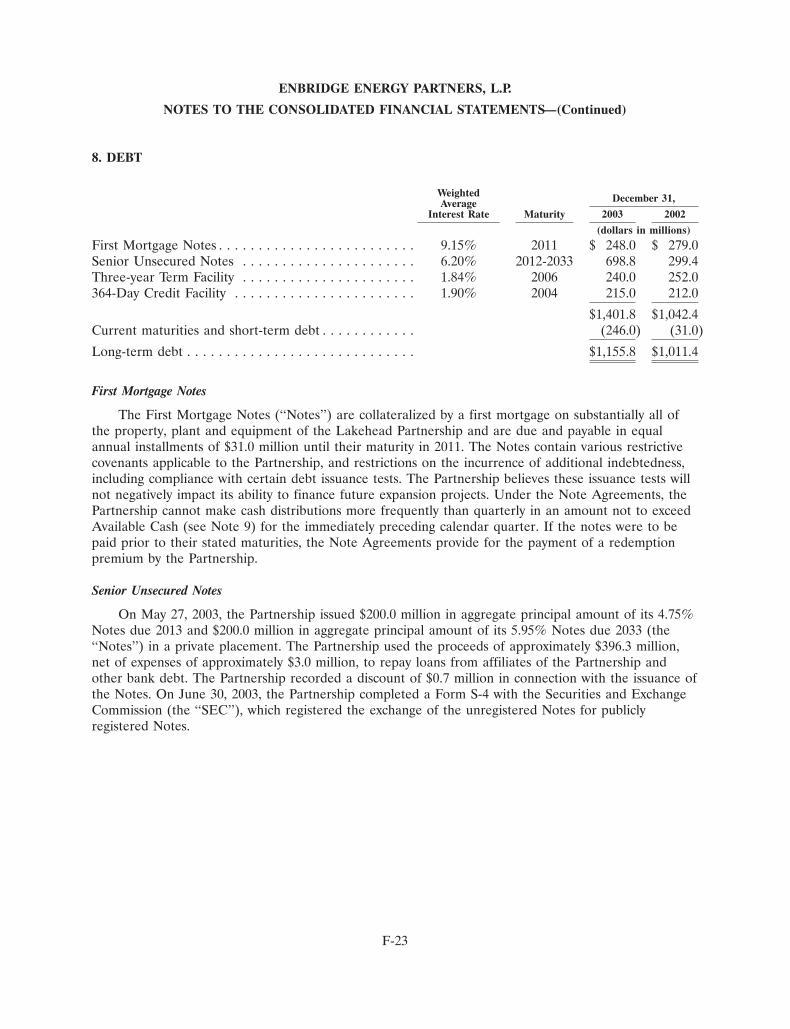
ENBRIDGE ENERGY PARTNERS, L.P.
NOTES TO THE CONSOLIDATED FINANCIAL STATEMENTS —(Continued)
8. DEBT
Weighted December 31,AverageInterest Rate Maturity 2003 2002
(dollars in millions)
First Mortgage Notes . . . . . . . . . . . . . . . . . . . . . . . . . 9.15% 2011 $ 248.0 $ 279.0Senior Unsecured Notes . . . . . . . . . . . . . . . . . . . . . . 6.20% 2012-2033 698.8 299.4Three-year Term Facility . . . . . . . . . . . . . . . . . . . . . . 1.84% 2006 240.0 252.0364-Day Credit Facility . . . . . . . . . . . . . . . . . . . . . . . 1.90% 2004 215.0 212.0
$1,401.8 $1,042.4Current maturities and short-term debt . . . . . . . . . . . . (246.0) (31.0)
Long-term debt . . . . . . . . . . . . . . . . . . . . . . . . . . . . . $1,155.8 $1,011.4
First Mortgage Notes
The First Mortgage Notes (‘‘Notes’’) are collateralized by a first mortgage on substantially all ofthe property, plant and equipment of the Lakehead Partnership and are due and payable in equalannual installments of $31.0 million until their maturity in 2011. The Notes contain various restrictivecovenants applicable to the Partnership, and restrictions on the incurrence of additional indebtedness,including compliance with certain debt issuance tests. The Partnership believes these issuance tests willnot negatively impact its ability to finance future expansion projects. Under the Note Agreements, thePartnership cannot make cash distributions more frequently than quarterly in an amount not to exceedAvailable Cash (see Note 9) for the immediately preceding calendar quarter. If the notes were to bepaid prior to their stated maturities, the Note Agreements provide for the payment of a redemptionpremium by the Partnership.
Senior Unsecured Notes
On May 27, 2003, the Partnership issued $200.0 million in aggregate principal amount of its 4.75%Notes due 2013 and $200.0 million in aggregate principal amount of its 5.95% Notes due 2033 (the‘‘Notes’’) in a private placement. The Partnership used the proceeds of approximately $396.3 million,net of expenses of approximately $3.0 million, to repay loans from affiliates of the Partnership andother bank debt. The Partnership recorded a discount of $0.7 million in connection with the issuance ofthe Notes. On June 30, 2003, the Partnership completed a Form S-4 with the Securities and ExchangeCommission (the ‘‘SEC’’), which registered the exchange of the unregistered Notes for publiclyregistered Notes.
F-23

ENBRIDGE ENERGY PARTNERS, L.P.
NOTES TO THE CONSOLIDATED FINANCIAL STATEMENTS —(Continued)
8. DEBT —(Continued)
All of the notes pay interest semi-annually and have varying maturities and terms as outlinedbelow. The senior unsecured notes do not contain any covenants restricting the issuance of additionalindebtedness.
December 31,InterestSenior Unsecured Notes Rate 2003 2002
Notes maturing in 2012 . . . . . . . . . . . . . . . . . . . . . . . . . . . . . . . . . . . . . . . 7.90% $100.0 $100.0Notes maturing in 2013 . . . . . . . . . . . . . . . . . . . . . . . . . . . . . . . . . . . . . . . 4.75% 200.0 —Notes maturing in 2018 . . . . . . . . . . . . . . . . . . . . . . . . . . . . . . . . . . . . . . . 7.00% 100.0 100.0Notes maturing in 2028 . . . . . . . . . . . . . . . . . . . . . . . . . . . . . . . . . . . . . . . 7.125% 100.0 100.0Notes maturing in 2033 . . . . . . . . . . . . . . . . . . . . . . . . . . . . . . . . . . . . . . . 5.95% 200.0 —
$700.0 $300.0Unamortized Discount . . . . . . . . . . . . . . . . . . . . . . . . . . . . . . . . . . . . . . . . (1.2) (0.6)
$698.8 $299.4
Bank Credit Facilities
On January 24, 2003, the Partnership amended and restated the terms of its two unsecuredrevolving credit facilities, which were originally entered into in January 2002. The facilities consist of a$300.0 million three-year term facility (the ‘‘Three-year Facility’’), which matures in 2006 (subject toextension as provided in the facility) and a $300.0 million 364-day facility (the ‘‘364-day Facility’’),which matures in April 2004 (subject to a one-year term out option and extension as provided in thefacility). Interest is charged on amounts drawn under each of these facilities at a variable rate equal tothe Base Rate or a Eurodollar rate as defined in the facility agreements. In the case of a Eurodollarrate loans an additional margin is charged which varies depending on the Partnership’s credit ratingand the amounts drawn under the facility. A facility fee is payable on the entire amount of each facilitywhether or not drawn. The facility fee varies depending on the Partnership’s credit rating. As ofDecember 31, 2003, the facility fees on the three-year and 364-day facilities were 0.20% and 0.15%,respectively. These credit facilities contain restrictive covenants that require that the Partnershipmaintain a minimum interest coverage ratio of 2.75 times and a maximum leverage ratio of 4.75 timeseach as defined in the facility agreements. The facilities agreements also place limitations on theamount of debt that may be incurred directly by the Partnership’s subsidiaries. Accordingly, it isexpected that the Partnership will provide debt financing to its subsidiaries as required.
Interest
In 2003, 2002, and 2001, interest expense is net of amounts capitalized of $2.2 million, $7.9 million,and $0.3 million, respectively. In 2003, 2002, and 2001, total interest paid was $85.2 million,$59.2 million, and $57.0 million, respectively.
Debt Service Reserve
Under the terms of the First Mortgage Notes, the Partnership is required to establish, at the endof each quarter, a debt service reserve amount. This reserve includes an amount equal to 50% of theprospective First Mortgage Note interest payments for the immediate following quarter and an amount
F-24

ENBRIDGE ENERGY PARTNERS, L.P.
NOTES TO THE CONSOLIDATED FINANCIAL STATEMENTS —(Continued)
8. DEBT —(Continued)
for First Mortgage Note sinking fund repayments. At December 31, 2003 and 2002, there was norequired debt service reserve as all required interest and sinking fund payments had been made.
Maturities of Debt
The scheduled maturities of outstanding debt, excluding market value of interest rate swaps, atDecember 31, 2003, are summarized as follows:
(dollars in millions)
2004 . . . . . . . . . . . . . . . . . . . . . . . . . . . . . . . . . . . . . . . . . . . . . . . . . . . . $ 246.02005 . . . . . . . . . . . . . . . . . . . . . . . . . . . . . . . . . . . . . . . . . . . . . . . . . . . . 31.02006 . . . . . . . . . . . . . . . . . . . . . . . . . . . . . . . . . . . . . . . . . . . . . . . . . . . . 271.02007 . . . . . . . . . . . . . . . . . . . . . . . . . . . . . . . . . . . . . . . . . . . . . . . . . . . . 31.02008 . . . . . . . . . . . . . . . . . . . . . . . . . . . . . . . . . . . . . . . . . . . . . . . . . . . . 31.0Thereafter . . . . . . . . . . . . . . . . . . . . . . . . . . . . . . . . . . . . . . . . . . . . . . . . 791.8
Total . . . . . . . . . . . . . . . . . . . . . . . . . . . . . . . . . . . . . . . . . . . . . . . . . . . . $1,401.8
9. PARTNERS’ CAPITAL
The Partnership’s ownership is comprised of a 2% general partner interest and 98% of limitedpartner interests. The limited partner ownership in the Partnership is comprised of Class A commonunits, Class B common units and i-units. The limited partners have limited rights of ownership asprovided for under the Partnership Agreement and, as discussed below, participate in the Partnership’sdistributions. The General Partner manages the operations of the Partnership, subject to a Delegationof Control Agreement with Enbridge Management, and participates in the Partnership’s distributions,including certain incentive income distributions.
Class A common units
In December 2003, the Partnership issued 5.0 million Class A common units at $50.30 per unit,which generated proceeds, net of underwriters’ discounts, commissions and issuance expenses, ofapproximately $240.3 million. Proceeds from this offering were used to reduce borrowings under thePartnership’s 364-day credit facility by approximately $105.0 million, to reduce borrowings under thethree-year term facility of approximately $100.0 million and to pay the December 15, 2003 sinking fundpayment of $31.0 million on the First Mortgage Notes. In addition to the proceeds generated from theunit issuance, the General Partner contributed $5.1 million to the Partnership to maintain its 2%general partner interest in the Partnership.
In May 2003, the Partnership issued 3.85 million Class A common units at $44.79 per unit, whichgenerated proceeds, net of underwriters’ discounts, commissions and issuance expenses, ofapproximately $165.5 million. Proceeds from this offering were used to reduce borrowings under thePartnership’s 364-day credit facility of approximately $102.4 million and an affiliate loan from Enbridge(U.S.) Inc. by $63.1 million. In addition to the proceeds generated from the unit issuance, the GeneralPartner contributed $3.5 million to the Partnership to maintain its 2% general partner interest in thePartnership.
F-25

ENBRIDGE ENERGY PARTNERS, L.P.
NOTES TO THE CONSOLIDATED FINANCIAL STATEMENTS —(Continued)
9. PARTNERS’ CAPITAL —(Continued)
In March 2002, the Partnership issued 2.26 million Class A common units at $42.75 per unit, whichgenerated proceeds, net of underwriters’ discounts and commissions and issuance expenses, ofapproximately $93.3 million. Proceeds from this offering were used to repay indebtedness.
Class B common units
At December 31, 2003 and 2002, the Partnership had 3,912,750 Class B common units outstanding,which are held entirely by the General Partner. The Class B common units have rights similar to theClass A common units except that they are not eligible for trading on the NYSE.
i-units
In October 2002, the Partnership received net proceeds of approximately $330.8 million fromEnbridge Management for the issuance of 9,000,000 i-units. The Partnership used the net proceeds torepay debt owed to affiliates that was assumed in connection with the acquisition of the Midcoastsystem assets.
The i-units are a separate class of limited partner interests in the Partnership. All of the i-units areowned by Enbridge Management and are not publicly traded. Enbridge Management’s limited liabilitycompany agreement provides that the number of all of its outstanding shares, including the votingshares owned by the General Partner, at all times will equal the number of i-units that it owns.Through the combined effect of the provisions in the Partnership Agreement and the provisions ofEnbridge Management’s limited liability company agreement, the number of outstanding EnbridgeManagement shares and the number of the i-units will at all times be equal.
Enbridge Management, as the owner of the i-units, votes together with the holders of the commonunits as a single class. However, the i-units vote separately as a class on the following matters:
• Any proposed action that would cause the Partnership to be treated as a corporation for U.S.federal income tax purposes;
• Amendments to the Partnership Agreement that would have a material adverse effect on theholders of the i-units, unless, under the Partnership Agreement, the amendment could be madeby the general partner of the Partnership without a vote of holders of any class of units;
• The removal of the general partner of the Partnership and the election of a successor generalpartner; and
• The transfer by the general partner of the Partnership of its general partner interest to anon-affiliated person that requires a vote of holders of units under the Partnership Agreementand the admission of that person as a general partner of the Partnership.
In all cases, Enbridge Management will vote or refrain from voting its i-units in the same mannerthat owners of Enbridge Management’s shares vote or refrain from voting their shares. Furthermore,under the terms of the Partnership Agreement, the Partnership agrees that it will not, except inliquidation, make a distribution on an i-unit other than in additional i-units or a security that has in allmaterial respects the same rights and privileges as the i-units.
In October 2002, the General Partner received an allocation of the proceeds from i-unit issuanceof approximately $8.2 million. In conjunction with the restructuring of the Partnership’s subsidiariesimmediately following the acquisition of the Midcoast system, the Partnership contributed its 1.0101%
F-26

ENBRIDGE ENERGY PARTNERS, L.P.
NOTES TO THE CONSOLIDATED FINANCIAL STATEMENTS —(Continued)
9. PARTNERS’ CAPITAL —(Continued)
interest in the Lakehead Partnership to the Partnership at its carrying value of approximately$3.3 million.
Distributions Paid
The Partnership Agreement requires that the Partnership distribute 100% of its ‘‘Available Cash’’,which is generally defined in the Partnership Agreement as the sum of all cash receipts and netadditions to reserves for future requirements less cash disbursements and amounts retained by thePartnership. The reserves are retained to provide for the proper conduct of the Partnership businessand as necessary to comply with the terms of any agreement or obligation of the Partnership (includingany reserves required under debt instruments for future principal and interest payments and for futurecapital expenditures). The amounts retained by the Partnership are the cash amount in respect to the i-unit distribution plus an amount equal to 2% of the i-unit distribution. The distributions are made toits partners within 45 days following the end of each calendar quarter in accordance with theirrespective percentage interests.
The General Partner is granted discretion by the Partnership Agreement, which discretion hasbeen delegated to Enbridge Management, subject to the approval of the General Partner in certaincases, to establish, maintain and adjust reserves for future operating expenses, debt service,maintenance capital expenditures, and distributions for the next four quarters. These reserves are notrestricted by magnitude, but only by type of future cash requirements with which they can beassociated. When Enbridge Management determines the quarterly distributions, it considers current andexpected reserve needs along with current and expected cash flows to identify the appropriatesustainable distribution level.
Distributions by the Partnership of its Available Cash generally are made 98.0% to the Class Aand B common unitholders and the i-unitholder and 2.0% to the General Partner. The Partnership willnot distribute the cash related to the i-units but instead will distribute additional i-units such that thecash is retained and used in the business. Further, the Partnership retains an additional amount equalto 2% of the i-unit distribution from the General Partner in respect of the 2% general partner interestin the i-units. Distributions are subject to the payment of incentive distributions to the General Partnerto the extent that certain target levels of cash distributions to the unitholders are achieved. Theincremental incentive distributions payable to the General Partner are 15.0%, 25.0% and 50.0% of allquarterly distributions of Available Cash that exceed target levels of $0.59, $0.70, and $0.99 per Class Aand B common units and i-units, respectively.
Typically, the General Partner and owners of common units will receive distributions in cash.Enbridge Management, as the delegate of the General Partner under the Delegation of ControlAgreement, computes the amount of the Partnership’s available cash. Enbridge Management, as ownerof the i-units, however, does not receive distributions in cash. Instead, each time that the Partnershipmakes a cash distribution to the General Partner and the holders of its common units, the number ofi-units owned by Enbridge Management and the percentage of total units in the Partnership owned byEnbridge Management will increase automatically under the provisions of the Partnership’s partnershipagreement with the result that the number of i-units owned by Enbridge Management will equal thenumber of Enbridge Management’s shares and voting shares that are then outstanding. The amount ofthis increase per i-unit is determined by dividing the cash amount distributed per common unit by theaverage price of one of Enbridge Management’s listed shares on the NYSE for the 10-day periodimmediately preceding the ex-dividend date for Enbridge Management’s shares. The cash equivalent
F-27

ENBRIDGE ENERGY PARTNERS, L.P.
NOTES TO THE CONSOLIDATED FINANCIAL STATEMENTS —(Continued)
9. PARTNERS’ CAPITAL —(Continued)
amount of the additional i-units is treated as if it had actually been distributed for purposes ofdetermining the distributions to be made to the General Partner.
The following table sets forth the distributions, as approved by the Board of Directors for eachperiod in the years ended December 31, 2003, 2002 and 2001.
Amount ofDistribution
Cash of i-units Retained fromDistribution Distribution Ex-Distribution Distribution available for to i-unit General Distribution
Declaration Date Payment Date Date per Unit distribution holders Partner(1) of Cash
(dollars in millions, except per unit amounts)2003October 22, 2003 November 14, 2003 November 4, 2003 $0.925 $ 50.5 $ 9.2 $0.2 $ 41.1
July 23, 2003 August 14, 2003 July 31, 2003 0.925 50.3 8.9 0.2 41.2April 24, 2003 May 15, 2003 April 30, 2003 0.925 46.1 8.7 0.2 37.2
January 23, 2003 February 14, 2003 January 31, 2003 0.925 46.0 8.6 0.2 37.2
$192.9 $35.4 $0.8 $156.7
2002October 24, 2002 November 14, 2002 November 5, 2002 $ 0.90 $ 44.1 $ 8.1 $0.2 $ 35.8
July 22, 2002 August 14, 2002 August 5, 2002 0.90 34.6 — — 34.6April 25, 2002 May 15, 2002 May 3, 2002 0.90 34.5 — — 34.5
January 24, 2002 February 14, 2002 February 5, 2002 0.90 32.4 — — 32.4
$145.6 $ 8.1 $0.2 $137.3
2001October 25, 2001 November 14, 2001 October 31, 2001 $0.875 $ 29.3 $ — $ — $ 29.3
July 19, 2001 August 15, 2001 July 31, 2001 0.875 29.3 — — 29.3April 19, 2001 May 15, 2001 April 30, 2001 0.875 27.6 — — 27.6
January 25, 2001 February 14, 2001 December 29, 2000 0.875 27.6 — — 27.6
$113.8 $ — $ — $113.8
(1) The Partnership retains an amount equal to 2% of the i-unit distribution from the General Partner in respect of its 2%general partner interest in the i-units.
10. RELATED PARTY TRANSACTIONS
Administrative and Workforce Related Services
Enbridge and its affiliates provide management and administrative, operations and workforcerelated services to the Partnership. Employees of Enbridge and its affiliates are assigned to work forone or more affiliates of Enbridge, including the Partnership. Where directly attributable, the costs ofall compensation, benefits expenses and employer expenses for these employees are charged directly byEnbridge to the appropriate affiliate. There is no profit or margin for these services charged byEnbridge to its affiliates.
The portion of direct workforce costs associated with the management and administrative servicesprovided at the Partnership’s Houston office and the operating and administrative services provided tosupport the Partnership’s facilities across the United States, are charged from Enbridge and its affiliatesto the Partnership.
Certain of the Partnership’s operating activities associated with its Liquids Transportation segmentare provided by Enbridge Pipelines Inc., a subsidiary of Enbridge, as these pipeline systems form onecontiguous system with the Enbridge system in Canada. These services include control centeroperations, facilities management, shipper services, pipeline integrity management and other related
F-28

ENBRIDGE ENERGY PARTNERS, L.P.
NOTES TO THE CONSOLIDATED FINANCIAL STATEMENTS —(Continued)
10. RELATED PARTY TRANSACTIONS—(Continued)
activities. The costs to provide these services are allocated to the Partnership from EnbridgePipelines Inc., based on an appropriate allocation methodology consistent with Enbridge’s corporatecost allocation policy, including estimated time spent and miles of pipe. The Partnership also receivescosts associated with control center services for some of its Natural Gas Transportation assets fromanother affiliate of Enbridge.
Enbridge also allocates management and administrative costs to the Partnership pursuant to thePartnership’s amended and restated limited partnership agreement (‘‘partnership agreement’’) andrelated services agreements. These costs are allocated to the Partnership based on an appropriateallocation methodology consistent with Enbridge’s corporate cost allocation policy, including estimatedtime spent and headcount.
During 2003, 2002 and 2001, the Partnership incurred the following costs related to these services,which are included in operating and administrative expenses.
Year ended December 31,
2003 2002 2001
(dollars in millions)
Direct operating and administrative costs . . . . . . . . . . . . . . . . . . . . . . . . . . . . . $75.4 $51.2 $22.2Liquids Transportation/Natural Gas Transportation operating costs . . . . . . . . . . 9.6 6.5 8.6Allocated management and administrative costs, including insurance . . . . . . . . . 14.2 13.5 8.1
$99.2 $71.2 $38.9
Natural Gas Sales and PurchasesThe Partnership purchases natural gas from third parties, which subsequently generates operating
revenues from the sales to Enbridge and its affiliates. These transactions are entered into at the marketprice at the date of sale. Included in the results for the twelve months ending December 31, 2003 and2002, are operating revenues of $30.6 million and $4.6 million, respectively, related to these sales.There were no such comparative amounts in 2001.
The Partnership also purchases natural gas from Enbridge and its affiliates for sale to third partiesat market prices at the date of purchase. Included in the results for the twelve months endingDecember 31, 2003 and 2002, are cost of natural gas expenses of $1.2 million and $0.1 million,respectively, relating to these purchases. There were no such comparative amounts in 2001.
Affiliate NotesThe Partnership has various notes payable with affiliates of Enbridge that totaled $133.1 million
and $444.1 million at December 31, 2003 and 2002. All loans mature in 2007. The weighted averageinterest rate is 6.60% and 6.03% as of December 31, 2003 and 2002.
Interest expense related to affiliate notes totaled $16.1 million, $4.6 million, and $1.3 million in2003, 2002, and 2001, respectively. Interest payable to affiliates totaled $2.2 million and $1.3 million atDecember 31, 2003 and 2002, respectively. Interest paid to affiliates totaled $15.2 million, $3.3 million,and $1.3 million in 2003, 2002 and 2001, respectively.
Incentive Income and Partnership DistributionsEnbridge Energy Company, Inc., an affiliate of Enbridge, serves as the Partnership’s general
partner. Pursuant to the Partnership’s partnership agreement, the General Partner owns an effective2% ownership interest in the Partnership. The General Partner received incentive distributions for theyears ended December 31, 2003, 2002 and 2001 of $17.2 million, $11.9 million, and $8.6 million,respectively.
F-29

ENBRIDGE ENERGY PARTNERS, L.P.
NOTES TO THE CONSOLIDATED FINANCIAL STATEMENTS —(Continued)
10. RELATED PARTY TRANSACTIONS—(Continued)
As of December 31, 2003, the General Partner also owned 3,912,750 Class B common units,representing 7.1% ownership in the Partnership. The General Partner received cash distributionsrelated to its ownership of Class B units for the years ended December 31, 2003, 2002 and 2001 of$14.5 million, $14.1 million and $13.7 million, respectively. See also Note 9 (Partners’ Capital).
Conflicts of Interest
Through a Delegation of Control Agreement with the General Partner and the Partnership,Enbridge Management makes all decisions relating to the management and control of the Partnership’sbusiness. The General Partner owns the voting shares of Enbridge Management and elects all ofEnbridge Management’s directors. Enbridge, through its wholly-owned subsidiary, EnbridgePipelines Inc., owns all the common stock of the General Partner. Some of the General Partner’sofficers and directors are also directors and officers of Enbridge and Enbridge Management and havefiduciary duties to manage the business of Enbridge and Enbridge Management in a manner that maynot be in the best interests of the Partnership’s unitholders. Certain conflicts of interest could arise as aresult of the relationships among Enbridge Management, the General Partner, Enbridge and thePartnership. The partnership agreement and Delegation of Control Agreement for the Partnership andits subsidiaries contain provisions that allow Enbridge Management to take into account the interest ofparties in addition to the Partnership in resolving conflicts of interest, thereby limiting its fiduciaryduties to the Partnership’s unitholders, as well as provisions that may restrict the remedies available tounitholders for actions taken that might, without such limitations, constitute breaches of fiduciary duty.
Enbridge Management
Pursuant to the Delegation of Control Agreement between Enbridge Management, the GeneralPartner and the Partnership, and the Partnership’s partnership agreement, all expenses relating toEnbridge Management are paid by the Partnership. This includes Texas franchise taxes and any otherforeign, state and local taxes not otherwise paid or reimbursed pursuant to a tax indemnificationagreement between Enbridge and Enbridge Management on behalf of Enbridge Management.
11. COMMITMENTS AND CONTINGENCIES
Environmental
The Partnership is subject to federal and state laws and regulations relating to the protection ofthe environment. Environmental risk is inherent to liquid and gas pipeline operations and thePartnership could, at times, be subject to environmental cleanup and enforcement actions. ThePartnership manages this environmental risk through appropriate environmental policies and practicesto minimize any impact. To the extent that the Partnership is unable to recover environmental liabilitiesassociated with the Lakehead system assets prior to the transfer to the Partnership in 1991, to theextent not recovered through insurance, the General Partner has agreed to indemnify the Partnershipfrom and against any costs relating to environmental liabilities associated with the Lakehead systemassets prior to the transfer to the Partnership in 1991. This excludes any liabilities resulting from achange in laws after such transfer. The Partnership continues to voluntarily investigate past leak siteson its systems for the purpose of assessing whether any remediation is required in light of currentregulations, and to date no material environmental risks have been identified.
F-30

ENBRIDGE ENERGY PARTNERS, L.P.
NOTES TO THE CONSOLIDATED FINANCIAL STATEMENTS —(Continued)
11. COMMITMENTS AND CONTINGENCIES —(Continued)
In connection with the Partnership’s acquisition of Midcoast, Northeast Texas and South Texassystems, the General Partner has agreed to indemnify the Partnership and other related persons forcertain environmental liabilities of which the General Partner has knowledge and which it did notdisclose. The General Partner will not be required to indemnify the Partnership until the aggregateliabilities, including environmental liabilities, exceed $20.0 million, and the General Partner’s aggregateliability, including environmental liabilities, may not exceed, with certain exceptions, $150.0 million. ThePartnership will be liable for any environmental conditions related to the acquired systems that werenot known to the General Partner or were disclosed.
As of December 31, 2003 and 2002, the Partnership has recorded $2.6 million and $1.1 million incurrent liabilities and $7.9 million and $5.6 million, respectively, in long-term liabilities to addressremediation of asbestos containing materials, management of hazardous waste material disposal, andoutstanding air quality measures for certain of its Liquids Transportation and Gathering and Processingassets.
Oil and Gas in Custody
The Partnership’s Liquids Transportation assets transport crude oil and NGLs owned by itscustomers for a fee. The volume of liquid hydrocarbons in the Partnership’s pipeline system at any onetime approximates 14 million barrels, virtually all of which is owned by the Partnership’s customers.Under terms of the Partnership’s tariffs, losses of crude oil not resulting from direct negligence of thePartnership may be apportioned among its customers. In addition, the Partnership maintains adequateproperty insurance coverage with respect to crude oil and NGLs in the Partnership’s custody.
Approximately 60% of the natural gas volumes on the Gathering and Processing and Natural GasTransportation assets are transported for customers on their contract, with the remaining 40%purchased by the Partnership and sold to third parties downstream of the purchase point. At any pointin time, the value of customers’ natural gas in custody of the Natural Gas Transportation systems is notmaterial to the Partnership.
Regulatory
From 1998, when the Kansas Pipeline system (‘‘KPC’’) became subject to the FERC jurisdiction,until November 9, 2002, at which time KPC’s rate case became effective, the FERC established initialrates based upon an annual cost of service of approximately $31.0 million. Since that time, these initialrates have been the subject of various ongoing challenges that remain unresolved.
The United States Court of Appeals for the D.C. Circuit issued an order on August 12, 2003vacating the FERC’s 2001 remand order and 2002 rehearing order and remanded the issue of KPC’sinitial rates back to the FERC with directions that the FERC address the question of an appropriaterate refund. In prior KPC orders in this proceeding, the FERC determined that it had no authority toimpose a refund condition on initial rates. On October 3, 2003, KPC filed a pleading at FERCrequesting the issuance of an order finding that it had no refund obligation and requesting terminationof the proceedings on remand. The Missouri Public Service Commission filed an answer to KPC’spleading on October 20, 2003. The outcome of KPC’s motion or any other proceedings, including theamount of any refunds that may be ordered, is uncertain. If the FERC determines refunds arerequired, after all administrative options and court appeals are exhausted, the amount of the refundsaffecting the Partnership’s earnings may range from zero to $9.0 million.
F-31

ENBRIDGE ENERGY PARTNERS, L.P.
NOTES TO THE CONSOLIDATED FINANCIAL STATEMENTS —(Continued)
11. COMMITMENTS AND CONTINGENCIES —(Continued)
Commitments
Right-of-Way
The Partnership, as part of its pipeline construction process, must obtain certain right-of-wayagreements from landowners whose property the pipeline will cross. Right-of-way agreements that thePartnership buys are capitalized as part of Property, Plant and Equipment (Note 5). Right-of-wayagreements that are leased from a third party are expensed. The Partnership recorded expenses for theleased right-of-way agreements of $1.4 million, $1.2 million, and $1.0 million during 2003, 2002, and2001, respectively.
Future Minimum Commitments
As of December 31, 2003, the future minimum commitments having remaining non-cancelableterms in excess of one year are as follows:
Powerand other OtherPurchase Operating
Year ended December 31, Commitments Leases Right of Way(1) Total
(dollars in millions)
2004 . . . . . . . . . . . . . . . . . . . . . . . . . . . . . . . . . . . . . . . . $12.9 $ 3.9 $ 1.8 $18.62005 . . . . . . . . . . . . . . . . . . . . . . . . . . . . . . . . . . . . . . . . 3.1 4.2 1.9 9.22006 . . . . . . . . . . . . . . . . . . . . . . . . . . . . . . . . . . . . . . . . 3.1 3.7 1.8 8.62007 . . . . . . . . . . . . . . . . . . . . . . . . . . . . . . . . . . . . . . . . — 2.7 1.8 4.52008 . . . . . . . . . . . . . . . . . . . . . . . . . . . . . . . . . . . . . . . . — 2.7 1.7 4.4Thereafter . . . . . . . . . . . . . . . . . . . . . . . . . . . . . . . . . . . . — 3.5 45.0 48.5
Total . . . . . . . . . . . . . . . . . . . . . . . . . . . . . . . . . . . . . . . . $19.1 $20.7 $54.0 $93.8
(1) Right of way payments are estimated to be approximately $1.8 million per year for the remaininglife for all pipeline systems, which has been estimated to be 25 years, for purposes of calculatingthe amount of future minimum commitments beyond 2008.
12. MAJOR CUSTOMERS
At December 31, 2003 and 2002, the Partnership did not have an external customer that accountedfor 10% or more of its operating revenues. The customers listed below were all attributable to thePartnership’s Liquids Transportation segment. For 2001, operating revenue received from majorcustomers was as follows:
Year endedDecember 31, 2001
(dollars in millions)
BP Canada Energy Company . . . . . . . . . . . . . . . . . . . . . . . . . . . . . . . . . . $73.4ExxonMobil Canada Energy . . . . . . . . . . . . . . . . . . . . . . . . . . . . . . . . . . . $59.7PDV Midwest . . . . . . . . . . . . . . . . . . . . . . . . . . . . . . . . . . . . . . . . . . . . . $21.4Imperial Oil Limited . . . . . . . . . . . . . . . . . . . . . . . . . . . . . . . . . . . . . . . . $24.0
F-32

ENBRIDGE ENERGY PARTNERS, L.P.
NOTES TO THE CONSOLIDATED FINANCIAL STATEMENTS —(Continued)
12. MAJOR CUSTOMERS —(Continued)
The Partnership has a concentration of trade receivables from companies operating in the oil andgas industry. These receivables are collateralized by the crude oil and other products contained in thePartnership’s pipeline and storage facilities.
13. FINANCIAL INSTRUMENTS
Fair Value of Financial Instruments
The carrying amounts of cash equivalents approximate fair value because of the short term tomaturity of these investments.
Based on the borrowing rates currently available for instruments with similar terms and remainingmaturities, the carrying value of borrowings under the 364-day credit and three-year term facilitiesapproximates fair value.
At December 31, 2003 and 2002, the fair value of the First Mortgage Notes approximates$303.0 million and $334.0 million and the fair value of the Senior Unsecured Notes approximates$739.0 million and $326.0 million, respectively. Due to defined contractual make-whole arrangements,refinancing of the First Mortgage Notes and Senior Unsecured Notes would not result in any financialbenefit to the Partnership.
The fair value of derivative financial instruments reflects the Partnership’s best estimate and isbased upon either exchange- traded prices, published market prices or over-the-counter market pricequotations, whenever they are available. Quoted valuations may not be available due to locationdifferences or terms that extend beyond the period for which quotations are available. Where quotesare not available, the Partnership utilizes other valuation techniques or models to estimate marketvalues. These modeling techniques require the Partnership to make estimations of future prices, pricecorrelation and market volatility and liquidity. The estimates also reflect factors for time value andvolatility underlying the contracts, the potential impact of liquidating positions in an orderly mannerover a reasonable period of time under present market conditions, modeling risk, credit risk of counterparties and operational risk.
The Partnership enters into floating rate to fixed rate (fixed rate) interest rate swaps to managethe effect of future interest rate movements on its interest costs. The Partnership also enters fixed rateto floating rate (floating rate) interest rate swaps to manage the fair value of debt issuances. Thefollowing table summarizes the interest rate financial derivatives outstanding at December 31:
Partnership Fair ValueNotionalPrincipal Pays Receives Maturity Date 2003 2002
(dollars in millions)
Fixed rate interestrate swaps: $100.0 5.95% LIBOR October 13, 2003 $ — $(4.6)
$ 40.0 4.48% LIBOR November 3, 2003 $ — $(1.2)$ 50.0 1.31% LIBOR October 6, 2004 $ — $ —$ 50.0 1.31% LIBOR October 7, 2004 $ — $ —$ 25.0 1.44% LIBOR December 29, 2004 $ — $ —$ 25.0 1.45% LIBOR December 24, 2004 $ — $ —
Floating rateinterest rateswaps: $ 50.0 LIBOR — 21bps 4.75% June 1, 2013 $1.7 $ —
$ 50.0 LIBOR — 21bps 4.75% June 1, 2013 $1.7 $ —$ 25.0 LIBOR — 25bps 4.75% June 1, 2013 $0.8 $ —
Treasury Lock: $104.0 3.19% N/A January 30, 2004 $1.0 $ —
F-33

ENBRIDGE ENERGY PARTNERS, L.P.
NOTES TO THE CONSOLIDATED FINANCIAL STATEMENTS —(Continued)
13. FINANCIAL INSTRUMENTS —(Continued)
The fixed rate interest rate swaps and the treasury lock meet the criteria for hedge accounting andare accounted for as cash flow hedges.
The floating rate interest rate swaps meet the criteria for hedge accounting and are accounted foras fair value hedges.
Commodity price risk
The earnings and cash flows of the Partnership are sensitive to changes in the price of natural gas,NGLs, condensate, and to fractionation margins (the relative price differential between NGL sales andoffsetting natural gas purchases). This market price exposure exists within the Gathering andProcessing, Natural Gas Transportation and Marketing segments. To mitigate the volatility of cashflows, the exposed entity enters into derivative financial instruments to manage the purchase and salesprices of the commodities. The majority of the Partnership’s commodity derivative transactions qualifiesfor hedge accounting under SFAS No. 133 and are accounted for as cash flow hedges.
Natural Gas
Natural gas derivative transactions are entered into by the Partnership in order to hedge theforecasted purchases or sales of natural gas. The following table details the outstanding derivatives atDecember 31:
Fair ValueMaturity NotionalSystem Dates MMBtu 2003 2002
(dollars inmillions)
East Texas System . . . . . . . . . . . . . . . . . . . . . . . . . . . 2004-2011 26,000 $(19.9) $ (6.1)Northeast Texas System . . . . . . . . . . . . . . . . . . . . . . . 2004-2012 42,000 $(44.9) $(19.1)Midcoast System . . . . . . . . . . . . . . . . . . . . . . . . . . . . 2004 600 $ (0.7) $ (0.3)Marketing . . . . . . . . . . . . . . . . . . . . . . . . . . . . . . . . . 2004-2007 38,000 $ 2.0 $ 2.1
A limited number of natural gas derivative transactions, which mitigate economic exposures arisingfrom underlying natural gas purchases and sales, do not qualify for hedge accounting treatment underSFAS No. 133. As such, the change in fair market value (from the last quarter-end) of these derivativeinstruments is booked to the income statement. For the years ended December 31, 2003 and 2002,$0.3 million and zero, respectively, were recorded in the Consolidated Statements of Income on thecost of natural gas expense to account mark to market changes related to the Marketing segment.
F-34

ENBRIDGE ENERGY PARTNERS, L.P.
NOTES TO THE CONSOLIDATED FINANCIAL STATEMENTS —(Continued)
13. FINANCIAL INSTRUMENTS —(Continued)
Natural Gas Liquids
NGL derivative transactions are entered into by the Partnership to hedge the forecasted sales ofNGLs. The following table details the outstanding derivatives at December 31:
Fair ValueMaturity NotionalSystem Date Barrels 2003 2002
(in millions) (dollars inmillions)
Northeast Texas System . . . . . . . . . . . . . . . . . . . . 2004 0.5 $(2.4) $(2.5)Midcoast System . . . . . . . . . . . . . . . . . . . . . . . . . 2004 0.1 $(0.2) $(0.1)East Texas System . . . . . . . . . . . . . . . . . . . . . . . . 2004 0.5 $(0.8) $ —North Texas System . . . . . . . . . . . . . . . . . . . . . . . 2004 0.8 $(1.1) $ —
Other
The Partnership estimates that approximately $17.0 million of the Accumulated OtherComprehensive Loss balance on the Consolidated Statement of Financial Position of $64.0 millionrepresenting unrecognized net losses on derivative activities at December 31, 2003 is expected to bereclassified into earnings during the next twelve months.
At December 31, 2003, no material credit risk exposure existed as the Partnership enters intofinancial instruments only with credit worthy institutions that possess investment grade ratings.
The Partnership’s hedging activities are included at the fair values in the Consolidated Statementsof Financial Position as follows:
December 31,
2003 2002
(dollars in millions)
Accounts receivable, trade and other . . . . . . . . . . . . . . . . . . . . . . . . . . $ 2.8 $ 3.5Other assets, net . . . . . . . . . . . . . . . . . . . . . . . . . . . . . . . . . . . . . . . . 4.0 —Accounts payable and other . . . . . . . . . . . . . . . . . . . . . . . . . . . . . . . . (43.7) (13.1)Deferred credits . . . . . . . . . . . . . . . . . . . . . . . . . . . . . . . . . . . . . . . . (27.5) (22.2)
$(64.4) $(31.8)
14. SEGMENT INFORMATION
The Partnership’s business is divided into operating segments, defined as components of theenterprise about which financial information is available and evaluated regularly by the Partnership’sChief Operating Decision Maker in deciding how to allocate resources to an individual segment and inassessing performance of the segment.
The Partnership’s reportable segments are based on the type of business activity and managementcontrol. Each segment is managed separately because each business requires different operatingstrategies. The Partnership has four reportable business segments, Liquids Transportation, Gatheringand Processing, Natural Gas Transportation and Marketing (see Note 1). Each segment uses accountingpolicies as described in the Summary of Significant Accounting Policies (see Note 2).
F-35

ENBRIDGE ENERGY PARTNERS, L.P.
NOTES TO THE CONSOLIDATED FINANCIAL STATEMENTS —(Continued)
14. SEGMENT INFORMATION —(Continued)
The following table presents certain financial information relating to the Partnership’s businesssegments as of or for the year ended December 31, 2003 and 2002. As discussed in Note 3 to theConsolidated Financial Statements, the results from the Midcoast Acquisition were included sinceOctober 17, 2002.
As of and for the Year Ended December 31, 2003
Liquids Gathering and Natural Gas (1)Transportation Processing Transportation Marketing Corporate Total
(dollars in millions)Total Revenues . . . . . . . . . . . . . . . . . . $ 344.2 $2,153.8 $121.0 $1,984.8 $ — $4,603.8
Less: Intersegment revenue . . . . . . . . — 307.0 3.3 1,121.2 — 1,431.5
Operating revenues . . . . . . . . . . . . . . . 344.2 1,846.8 117.7 863.6 — 3,172.3Cost of natural gas . . . . . . . . . . . . . . . — 1,693.3 67.6 851.8 — 2,612.7Operating and administrative . . . . . . . . 104.1 81.0 21.3 2.2 3.2 211.8Power . . . . . . . . . . . . . . . . . . . . . . . . 56.1 — — — — 56.1Depreciation and amortization . . . . . . . 59.5 24.1 13.6 0.2 — 97.4
Operating income . . . . . . . . . . . . . . . . $ 124.5 $ 48.4 $ 15.2 $ 9.4 $ (3.2) $ 194.3Interest expense . . . . . . . . . . . . . . . . . — — — — (85.0) (85.0)Other income (expense) . . . . . . . . . . . — — — — 2.4 2.4Minority interest . . . . . . . . . . . . . . . . — — — — — —
Net income . . . . . . . . . . . . . . . . . . . . $ 124.5 $ 48.4 $ 15.2 $ 9.4 $(85.8) $ 111.7
Total assets . . . . . . . . . . . . . . . . . . . . $1,511.2 $1,085.9 $404.6 $ 189.6 $ 40.5 $3,231.8
Capital expenditures (excludingacquisitions) . . . . . . . . . . . . . . . . . . $ 69.3 $ 51.0 $ 4.4 $ 0.1 $ 4.5 $ 129.3
(1) Corporate consists of interest expense, interest income, minority interest and certain other costs such asfranchise taxes, which are not allocated to the other business segments.
F-36

ENBRIDGE ENERGY PARTNERS, L.P.
NOTES TO THE CONSOLIDATED FINANCIAL STATEMENTS —(Continued)
14. SEGMENT INFORMATION —(Continued)
As of and for the Year Ended December 31, 2002
Liquids Gathering and Natural Gas (1)Transportation Processing Transportation Marketing Corporate Total
(dollars in millions)Total Revenues . . . . . . . . . . . . . . . . . . $ 334.3 $ 780.0 $ 24.8 $ 267.9 $ — $1,407.0
Less: Intersegment revenue . . . . . . . . — 77.8 5.0 138.7 — 221.5
Operating revenues . . . . . . . . . . . . . . . 334.3 702.2 19.8 129.2 — 1,185.5Cost of natural gas . . . . . . . . . . . . . . . — 635.2 8.6 126.9 — 770.7Operating and administrative . . . . . . . . 104.7 34.5 4.5 0.5 — 144.2Power . . . . . . . . . . . . . . . . . . . . . . . . 52.7 — — — — 52.7Depreciation and amortization . . . . . . . 64.8 12.3 2.8 — — 79.9
Operating Income . . . . . . . . . . . . . . . . $ 112.1 $ 20.2 $ 3.9 $ 1.8 $ — $ 138.0Interest expense . . . . . . . . . . . . . . . . . — — — — (59.2) (59.2)Other income (expense) . . . . . . . . . . . — — — — (0.2) (0.2)Minority interest . . . . . . . . . . . . . . . . — — — — (0.5) (0.5)
Net income . . . . . . . . . . . . . . . . . . . . $ 112.1 $ 20.2 $ 3.9 $ 1.8 $(59.9) $ 78.1
Total Assets . . . . . . . . . . . . . . . . . . . . $1,528.0 $ 734.5 $435.1 $ 137.3 $ — $2,834.9
Capital Expenditures (excludingacquisitions) . . . . . . . . . . . . . . . . . . $ 201.8 $ 12.2 $ 0.7 $ — $ — $ 214.7
(1) Corporate consists of interest expense, interest income, minority interest and certain other costs such asfranchise taxes, which are not allocated to the other business segments.
As of and for the Year Ended December 31, 2001
Liquids Gathering and Natural Gas (1)Transportation Processing Transportation Marketing Corporate Total
(dollars in millions)Total Revenues . . . . . . . . . . . . . . . . . . $ 313.3 $ 29.0 $ — $ — $ — $ 342.3
Less: Intersegment revenue . . . . . . . . — — — — — —
Operating revenues . . . . . . . . . . . . . . . 313.3 29.0 — — — 342.3Cost of natural gas . . . . . . . . . . . . . . . — 26.3 — — — 26.3Operating and administrative . . . . . . . . 102.7 1.8 — — — 104.5Power . . . . . . . . . . . . . . . . . . . . . . . . 49.9 — — — — 49.9Depreciation and amortization . . . . . . . 63.0 0.8 — — — 63.8
Operating Income . . . . . . . . . . . . . . . . $ 97.7 $ 0.1 $ — $ — $ — $ 97.8Interest expense . . . . . . . . . . . . . . . . . — — — — (59.3) (59.3)Other income (expense) . . . . . . . . . . . — — — — 0.9 0.9Minority interest . . . . . . . . . . . . . . . . — — — — (0.5) (0.5)
Net income . . . . . . . . . . . . . . . . . . . . $ 97.7 $ 0.1 $ — $ — $(58.9) $ 38.9
Total Assets . . . . . . . . . . . . . . . . . . . . $1,372.6 $ 276.6 $ — $ — $ — $1,649.2
Capital Expenditures (excludingacquisitions) . . . . . . . . . . . . . . . . . . $ 34.9 $ 0.1 $ — $ — $ — $ 35.0
(1) Corporate consists of interest expense, interest income, minority interest and certain other costs such asfranchise taxes, which are not allocated to the other business segments.
F-37

ENBRIDGE ENERGY PARTNERS, L.P.
NOTES TO THE CONSOLIDATED FINANCIAL STATEMENTS —(Continued)
15. SUBSEQUENT EVENTS
Mid-Continent Liquids System Acquisition
On December 22, 2003, the Partnership entered into a definitive agreement to acquire crude oilpipeline and storage for $115.0 million, excluding customary closing adjustments for working capitaland other items. The asset purchase closed on March 1, 2004. The assets acquired serve refineries inthe Mid-Continent from the Cushing, Oklahoma Hub and consist of some 615 miles of active crude oilpipelines and 9.5 million barrels of storage capacity. Included are:
• The 433 mile Ozark pipeline that currently transports approximately 170,000 barrels of crude oilper day from Cushing to Wood River, Illinois;
• A 1.2 million barrel storage terminal;
• The 47-mile West Tulsa pipeline that currently transports approximately 55,000 barrels per dayto two refineries in Oklahoma; and
• The Shell storage terminal at Cushing, which is one of the largest terminal facilities in NorthAmerica with 8.3 million barrels of storage capacity.
These systems provide cash flows primarily from toll or fee-based revenues from a combination ofregulated assets and contracted unregulated. The assets will be included in the Partnership’s LiquidsTransportation segment.
Class A common unit issuance
On January 2, 2004, the Partnership issued an additional 450,000 Class A common units pursuantto the exercise of the over-allotment option as part of the December 2003 Class A common unitissuance, resulting in additional proceeds to the Partnership, net of underwriters’ fees and discounts,commissions and issuance expenses, of approximately $21.7 million. In addition to the proceedsgenerated from the unit issuance, the General Partner contributed $0.5 million to the Partnership tomaintain its 2% general partner interest in the Partnership.
Distribution Declaration
On January 22, 2004, the Partnership’s Board of Directors declared a distribution payable onFebruary 13, 2004, to unitholders of record as of February 2, 2004, of its available cash of $55.8 millionat December 31, 2003, or $0.925 per common unit. Of this distribution, $9.3 million was distributed ini-units to i-unit holders and $0.2 million was retained from the General Partner in respect of this i-unitdistribution.
Senior Unsecured Note Issuance
On January 9, 2004, the Partnership issued an additional $200.0 million in aggregate principalamount of its 4.0% Senior Unsecured Notes due in 2009 in a public offering, from which it resulted innet proceeds of $198.4 million. The Partnership used the proceeds to repay a portion of its outstandingBank Credit Facilities debt.
F-38
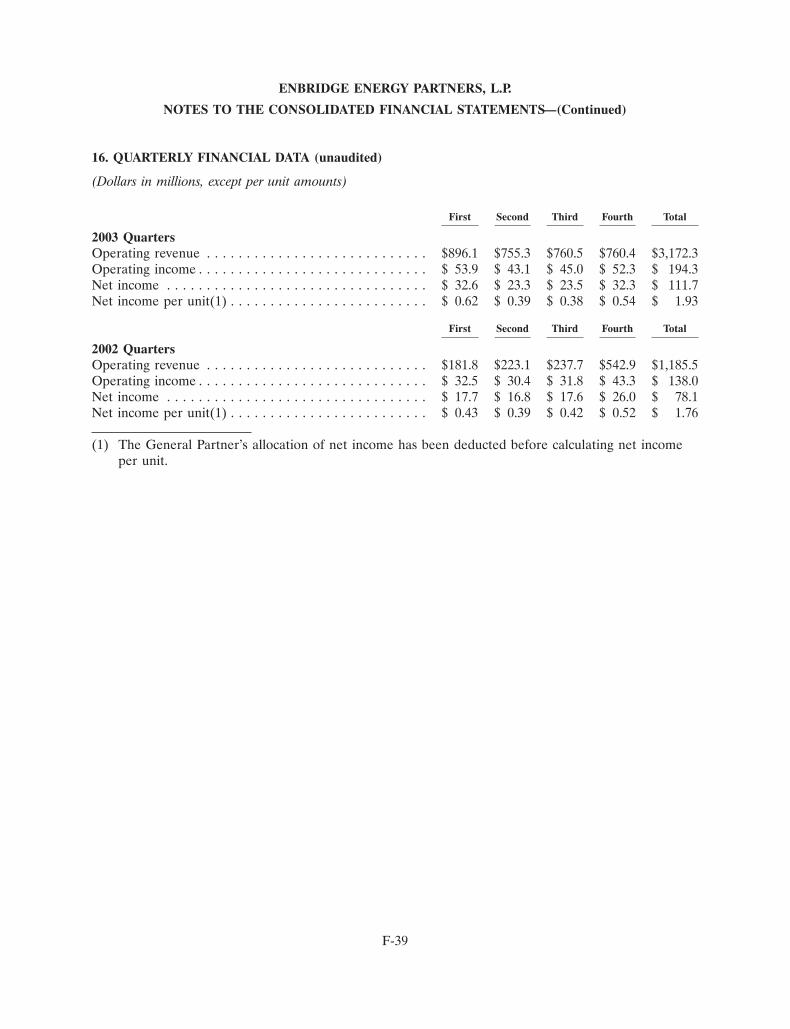
ENBRIDGE ENERGY PARTNERS, L.P.
NOTES TO THE CONSOLIDATED FINANCIAL STATEMENTS —(Continued)
16. QUARTERLY FINANCIAL DATA (unaudited)
(Dollars in millions, except per unit amounts)
First Second Third Fourth Total
2003 QuartersOperating revenue . . . . . . . . . . . . . . . . . . . . . . . . . . . . $896.1 $755.3 $760.5 $760.4 $3,172.3Operating income . . . . . . . . . . . . . . . . . . . . . . . . . . . . . $ 53.9 $ 43.1 $ 45.0 $ 52.3 $ 194.3Net income . . . . . . . . . . . . . . . . . . . . . . . . . . . . . . . . . $ 32.6 $ 23.3 $ 23.5 $ 32.3 $ 111.7Net income per unit(1) . . . . . . . . . . . . . . . . . . . . . . . . . $ 0.62 $ 0.39 $ 0.38 $ 0.54 $ 1.93
First Second Third Fourth Total
2002 QuartersOperating revenue . . . . . . . . . . . . . . . . . . . . . . . . . . . . $181.8 $223.1 $237.7 $542.9 $1,185.5Operating income . . . . . . . . . . . . . . . . . . . . . . . . . . . . . $ 32.5 $ 30.4 $ 31.8 $ 43.3 $ 138.0Net income . . . . . . . . . . . . . . . . . . . . . . . . . . . . . . . . . $ 17.7 $ 16.8 $ 17.6 $ 26.0 $ 78.1Net income per unit(1) . . . . . . . . . . . . . . . . . . . . . . . . . $ 0.43 $ 0.39 $ 0.42 $ 0.52 $ 1.76
(1) The General Partner’s allocation of net income has been deducted before calculating net incomeper unit.
F-39