Embed Size (px)
Citation preview

Enbridge Line 5
Straits of Mackinac, MI
Biota Investigation Work Plan
Enbridge Energy, Limited Partnership
Revision 2: May 18, 2017
REDACTED SUBMITTAL -- PUBLIC COPY
ii
Table of Contents
1.0 Introduction ......................................................................................................................... 1
2.0 Consent Decree Requirements ......................................................................................... 2
3.0 Methods ............................................................................................................................... 3
3.1 Literature Searches .................................................................................................. 3
3.2 Coating Inspections .................................................................................................. 3
3.2.1 Cathodic Protection Evaluation .................................................................. 5
3.3 Biota Study Zones and Sampling Locations ............................................................ 5
3.4 Biota Sampling Field Testing ................................................................................... 7
3.5 Biota Surveys, Measurements, and Sampling ........................................................ 8
3.5.1 Visual Biota Surveys ................................................................................... 9
3.5.2 Biota Measurements ................................................................................. 10
3.5.3 Biota Sampling .......................................................................................... 10
3.5.3.1 Biota Sampling at Areas of Interest .................................. 13
3.5.3.2 Biota Sampling at Any Holiday Found ............................. 13
3.5.3.3 Additional/Opportunistic Sampling ................................... 14
3.5.4 Sample Handling and Preparation ........................................................... 14
4.0 Analysis ............................................................................................................................. 16
4.1 Biota Counts/Densities/Weight .............................................................................. 17
4.2 Presence/Absence Bacteria Testing ..................................................................... 17
4.3 Coating Integrity Testing ........................................................................................ 18
4.4 Engineering Stress Analysis .................................................................................. 18
5.0 Quality Assurance/Quality Control ................................................................................. 20
6.0 Schedule and Deliverables .............................................................................................. 22
7.0 Workforce .......................................................................................................................... 24
8.0 Literature Cited ................................................................................................................. 25

iii
FIGURES
Figure 1 – General profile view of east and west pipelines and associated zones
Figure 2 – Profile view of sampling zones and sites for the east pipeline
Figure 3 – Profile view of sampling zones and sites for the west pipeline
Figure 4 – Layout of Thickness Measurements at Area of Interest
Figure 5 – Qualitative assessment of the Biota across the east pipeline
Figure 6 – Qualitative assessment of the Biota across the west pipeline
Figure 7 – Biotic sampler
Figure 8 – Layout at Undisturbed Area with Biota Sampling
Figure 9 – Layout at Area of Interest with Biota Sampling
TABLES
Table 1: Biota sample sites: East and West pipelines
APPENDICES
Appendix A. Bibliography
Appendix B. Level of Mussel Colonization Reference Cards
Appendix C. Standard Operating Procedures

iv
LIST OF ACRONYMS
ANOVA Analysis of variance
APB Acid producing bacteria
CP Cathodic Protection
CPDM Cathodic Protection Data Management
Enbridge Enbridge Energy, Limited Partnership
mV Millivolt
SRB Sulfate-reducing bacteria
USACE United States Army Corps of Engineers
USEPA United States Environmental Protection Agency
VIV Vortex induced vibration

v
DEFINITIONS
Area(s) of Interest
An Area of Interest is a part of the pipeline where, based on visual inspection, (i) the normal (local)
Biota is unexpectedly absent or (ii) there is evidence of possible coating damage (e.g., Dislodged
Coating and/or potential Holiday). Disturbed Areas (see definition below) are not Areas of Interest as
the lack of Biota can be attributed to past maintenance and monitoring activities.
Biota
Animals and plants living around and on the pipelines through the Straits (e.g. mussels, periphyton,
algae, microbes)
Dislodged Coating
An area on the pipeline where, based on visual inspection, the outer wrap of the coating appears to
have been dislodged or removed without exposure of the pipe steel.
Disturbed Area
An area on the pipeline where past maintenance and monitoring activities resulted in the removal of
Biota but does not represent damage to the pipe coating.
Holidays
An area on the pipeline where there is a discontinuity in the coating that exposes the pipe steel to the
environment.
Undisturbed Area
An area on the pipeline where there is no evidence of any loss of Biota (or pipe coating).

1
1.0 Introduction
Enbridge Energy, Limited Partnership (Enbridge) will be required by federal consent decree
(Case 1:16-cv-00914, ECF No. 3 filed 07/20/16), once the decree is entered, to conduct
measures to prevent spills in the Straits of Mackinac (Subsection VII.E of the consent decree).
The consent decree contains requirements specifically focused on the two 20-inch diameter
pipelines (“Dual Pipelines”) that span the Straits of Mackinac (“Straits”) as part of Enbridge’s’
Lakehead System Line 5 pipeline (“Line 5”).
Per the consent decree, Enbridge must conduct an investigation (“Biota investigation”) to
assess whether any of the Biota found on the pipeline impact the integrity of the Dual
Pipelines. Prior to undertaking that effort, Enbridge must submit to the United States
Environmental Protection Agency (“USEPA”) for approval, a proposed plan for the Biota
investigation described in Subparagraph 69.a. This document details Enbridge’s plan for a
Biota investigation that will satisfy requirements of the consent decree listed in Subparagraph
69.a. Enbridge anticipates the information obtained from this investigation will complement the
information gathered during integrity monitoring activities already undertaken by the company.

2
2.0 Consent Decree Requirements
The consent decree includes three requirements (“assessments”) that must be part of
Enbridge’s Biota investigation. Those assessments are listed below and associated efforts
presented herein are designed to provide information to address the requirements in the
consent decree. The assessments were not numbered in the consent decree but have been
numbered in this document for consistency in referencing the assessments.
• Assessment 1: “…..assess whether the accumulation of mussels and other Biota
have impacted the integrity of the pipelines’ coating or the underlying metal,
including areas where there are openings or “holidays” in the pipeline coating.”
• Assessment 2: “…..evaluate whether the mussels and other Biota are creating a
corrosive environment by, among other things, fostering the growth of anaerobic
sulfate-reducing bacteria (“SRB”) that may cause metal loss.”
• Assessment 3: “…..evaluate whether mussels and other Biota are introducing
features that may threaten the integrity of either of the Dual Pipelines due to the
weight of such biomass or the pressure caused by current or ice movement around
such biomass in areas where the pipelines are suspended above the floor of the
Straits.”

3
3.0 Methods
Prior to development and submittal of this Biota Investigation Work Plan (“Plan”), Enbridge
conducted literature searches and reviews of key topics and issues to aid in identifying,
developing, and proposing use of appropriate methodologies, assessments, and analyses that
could best address the requirements of the consent decree. Additional scoping efforts included
assessing video-photography of the Dual Pipelines from 2014 and 2016 and overlaying
pertinent pipeline and resource data. Those preliminary efforts have facilitated development of
this Plan. Opportunistic testing of techniques and methodologies will enable subsequent
sampling and monitoring efforts to be more effective.
3.1 Literature Searches Literature searches and reviews included, but were not limited to, limnological data of the
Straits, physical and chemical features of aquatic Biota previously observed on the pipelines,
field data collection methodologies, cathodic protection, and SRB. Appendix A provides a
bibliography of the literature reviewed.
3.2 Coating Inspections In order to address Assessments 1 and 2 of the Consent Decree, this plan incorporates
pipeline coating tests, inspection and documentation at Areas of Interest. A total of 18
representative Areas of Interest1 were selected for the coating inspection – 11 on the East
Pipeline and 7 on the West Pipeline. These 18 sites were identified during the video surveys
and selected based on their appearance, distribution through the four limnologic zones, and
proximity to other dive locations (e.g., locations where screw anchors will be installed in 2017).
Visual criteria used to select these sites include: (1) the normal (local) Biota is unexpectedly
1 In previous versions of this Plan, these Areas of Interest were variously referred to as “holidays”, “dislodged
coating’ and ‘delaminations’ – and this inconsistency in terminology has led to confusion. Until diver examinations
are completed per this study, the exact nature of these features is unknown. It is for this reason that Enbridge has
selected them for direct examination.

4
absent (and the disruption is not consistent with Biota removal caused by past maintenance
and monitoring activities) or (2) there is evidence of possible coating damage.
The locations of the 18 Areas of Interest are identified in Figures 1, 2 and 3. These Areas of
Interest will be inspected to establish the condition of the pipe and coating (i.e., Disturbed
Area, Dislodged Coating or Holiday), measure the size of the area, report the presence of
corrosion and, if present, determine cathodic protection levels at Holidays. Seven (7) of the 18
Areas of Interest shown in these Figures also coincide with locations at which Biota sampling
will be conducted to address Assessment 3 of the Consent Decree (described later in Section
3.3 and Table 1).
Thickness readings of the coating will also be measured using an underwater, ultrasonic
thickness gauge to assess the condition of the coating. Biota, if present, will be removed prior
to the coating thickness measurements. As shown in Figure 4 and described below, the
thickness measurements will be collected at each (i) Area of Interest and (ii) at the
Undisturbed Areas adjacent to the Area of Interest.
i. Area of Interest: Three thickness measurements shall be taken at equal distances
downstream from the center of the Area of Interest as close to as possible to the 9,
12, and 3 o’clock positions around the pipe, respectively. Three thickness
measurements shall be taken upstream from the center of the Area of Interest as
close as possible to the 9, 12, and 3 o’clock positions, respectively. If the Area of
Interest exceeds 6 square feet, additional thickness measurements shall be taken
at a frequency of 3 measurements (9, 12, and 3 o’clock positions) for every
additional 6 square feet.
ii. Undisturbed Area:
a. Within two inches of the Area of Interest (as determined by the diver). Three
thickness measurements shall be taken at equal distances downstream from
the Area of Interest as close to as possible to the 9, 12, and 3 o’clock positions,
respectively. Three additional thickness measurements shall be taken at equal
distances upstream from the Area of Interest as close to as possible to the 9,
12, and 3 o’clock positions, respectively.
b. At least five (5) feet from the Area of Interest (as determined by the diver).
Three thickness measurements shall be taken at equal distances downstream

5
from the Area of Interest as close to as possible to the 9, 12, and 3 o’clock
positions, respectively. Three (3) thickness measurements shall be taken at
equal distances upstream from the Area of Interest as close as possible to the
9, 12, and 3 o’clock positions, respectively.
In addition to the 18 Areas of Interest, three (3) additional sites have been identified by the
Enbridge marine contractor as being valuable to investigate further. The locations of these
areas are identified as “Additional Site” in Figures 1, 2, and 3. These sites will be investigated
using the same protocol described above for the 18 Areas of Interest. CP measurements
(Section 3.2.1) and Biota sampling (Section 3.5.3.2) will be taken if Holidays are found.
3.2.1 Cathodic Protection Evaluation
Cathodic protection readings will be taken at each Holiday area that may be found. The diver
will utilize a hand-held bathycorrommeter dual element probe, specifically a
that is a product of , Houston,
Texas, for those measurements.
Three potential measurements shall be taken at any Holiday area that may be found to
evaluate levels of cathodic protection. The video camera attached to the diver shall assist in
recording the measurements obtained from the and in providing visual observations
of the Holiday area. Readings will not be taken of any coated portions of the pipe since the
requires a metal contact to obtain a reading.
Data collected during this investigation will be evaluated by one of Enbridge NACE Accredited
CP Specialists prior to incorporation into Enbridge’s Cathodic Protection Data Management
(CPDM) system as a unique survey. Data collected during this evaluation will be correlated
with the most recent cathodic protection in-line inspection results.
3.3 Biota Study Zones and Sampling Locations Proposed locations for surveying and obtaining aquatic Biota samples were determined based
upon a wide range of information. Primary factors included video-photography from 2014 and
2016 coupled with a literature review of limnological information on the Straits.
Assessment of underwater video determined that within both the northern and southern
shallow water zones where the pipeline was visible (not buried beneath the bottom substrates)
there was a mixture of submergent aquatic vegetation, algae, periphyton, and mussels. As the
REDACTED
REDACTED
REDACTED
REDACTED

6
Dual Pipelines extended into deeper water, the density of filamentous algae and macrophytes
diminished, and the density of mussels increased. The approximate “break point/depth” where
vegetation began to diminish occurred between water depths of 100 to 120 feet. This depth
and reduction in plant growth correlates with expected euphotic zones for Lake Michigan
which range from approximately 60 to 100 foot water depths (Lake Access 2016).
Underwater video-photography provided useful information in identifying general types of
aquatic Biota present and changes in composition and density of that aquatic Biota at various
depths and locations on and around the pipes. Figures 5 and 6 summarize qualitative
observations made of the aquatic Biota on the east and west pipelines, respectively, using
2014 and 2016 video-photography. A review of 2016 video-photography for both pipelines
indicated that the composition and density of Biota along both pipelines were similar to one
another, and that findings presented were representative of both pipelines (Enbridge, 2016).
Using the video-photography information, four zones were established based upon physical,
limnological, and biological features associated with various water depths of the Straits across
both the Dual Pipelines. Figure 1 shows the location of the four zones across the east and
west pipelines. The four zones for the east and west pipelines and a basic description relative
to each are provided below:
• Zone A – 50- to 100-foot water depth; periphyton most abundant; mussels present
o There is a Zone A at the northern and southern ends of each of the Dual
Pipelines.
• Zone B – 100- to 150-foot water depth; periphyton moderate, mussels moderate.
o There is a Zone B at the northern and southern ends of each of the Dual
Pipelines.
• Zone C – 150- to 200-foot water depth; periphyton sparse, mussels most abundant
o There is a Zone C at the northern and southern ends of each of the Dual
Pipelines.
• Zone D – Over 200-foot water depth; mussels abundant
o There is only one Zone D as it represents the deepest zone of each of the Dual
Pipelines.

7
As shown in Figure 1, starting from the North Bank of the Straits, each pipeline passes through
zones A, B, and C before reaching the deepest zone (D), and then through C, B, and A before
passing out of the Straits via the South Bank.
In order to address Assessment 3 of the Consent Decree, Biota will be collected at two (2)
sampling sites from each limnologic zone on each pipeline (see Figure 1). This approach will
result in eight (8) sampling sites on each pipeline with four (4) sampling sites within each zone.
A primary focus of this Biota sampling is to establish mass and volume of the Biota, which will
be used in calculations to assess the forces acting on the pipelines. The level of effort being
conducted within each zone provides for evaluation of variability among surveys, samples, and
measurements taken within each zone. Details of these surveys, sampling, and
measurements are discussed further in Section 3.5. If a Holiday is found, Biota sampling will
follow methods described in Section 3.5.4.
The proposed Biota sampling locations within each zone also included locations with
suspended and non-suspended pipe, areas of expected elevated water currents, and Areas of
Interest, and took into account dive logistics. Areas where pipe was suspended above the
bottom of the lake were selected over areas where the pipe was partially buried in the lake
bottom to enable surveys, measurements and sampling to occur around the full diameter of
the pipe.
3.4 Biota Sampling Field Testing Specific Biota sampling protocol described below will be field tested prior to collecting Biota
samples from the Dual Pipelines. Field testing will be conducted in another location of Lake
Michigan through a series of shallow water dives to ensure the methods described below can
be safely executed by the diver while maintaining data/sample integrity. These dives will test
the effective use of diver communication and video techniques to ensure adequate
communication with the biologist on the barge during sample observation and collection. Field
testing will also ensure effective communication between the diver and biologist on providing
randomly generated numbers which the diver will use to move up-current to randomly
generated sampling locations (when not at a specific Area of Interest), where and how to
collect samples, take measurements and readings, and in transferring of samples to the water
8
surface (dive boat). Any changes to the protocols to increase safety, communication, and/or
integrity of the data collection will be provided to the USEPA for approval prior to conducting
the described work within the Straits.
3.5 Biota Surveys, Measurements, and Sampling In evaluating appropriate sampling methods to use, literature searches and reviews provided
few articles or studies where Biota samples were being collected from deep freshwater
structures for analysis. Many of the references were from marine environments and were
associated with saltwater corrosion issues and/or aquatic Biota that are not present in the
freshwater of the Straits (Castaneda and Benetton, 2008; Duperron, 2010; Moura et al., 2013).
The overall paucity of references dealing with Biota collection in deep freshwater environments
necessitated adapting sampling methodologies and principles utilized in marine environments
for use in the Straits (Gale and Thompson, 1975; Hicks and Oster, 2012; Kikuchi et al., 2006;
Purcell, 1996; Purcell and Bellwood, 2001; Water Research Foundation, 2015).
Based upon discussions with marine contractors who have conducted maintenance related
activities for Line 5, a professional diver will be required to perform the proposed visual survey,
data collection, and sampling tasks given that pipeline sampling locations range from
approximately 65 to over 225 feet below the water surface of the Straits. Surveying, data
collection, and sampling methods were selected to address the requirements of the consent
decree while also being manageable by a diver operating at those extreme depths using
gloves and necessary safety gear. The conditions also require that the size and number of
sampling containers be kept at a minimum while still maintaining the integrity of the samples
and not impacting subsequent testing and analysis.
Each diver will be equipped with a video camera so that visual surveys and data collection
activities can be observed and directed (as necessary) by surface staff to ensure data is being
collected accurately and scientifically. Field data and Biota samples will be obtained as
effectively and efficiently as possible, while also adhering to safety and time constraints
imposed from working in various water depths and underwater currents associated with the
Straits. Dive times will be limited to approximately 30 minutes or less when operating at depths
greater than 120 feet.

9
Enbridge (2016) identified that the apparent density of mussels and other Biota on the Dual
Pipelines varied based upon water depth and past maintenance and monitoring activities. In
some areas, past maintenance and monitoring activities have disturbed or removed the
normal local amount of Biota, such sites would be poor choices for addressing Assessment 3.
Should a Biota site coincide with an area where Biota has been previously disturbed
(Disturbed Area), the diver is directed to relocate a maximum of 100 linear feet to reach an
area of undisturbed Biota (Undisturbed Area). If all areas in that 100-linear-foot span have
been disturbed by past monitoring activities, the samples shall be taken within the Disturbed
Area (as it represents existing and representative conditions of that site). This location
selection criterion applies to all survey and sampling activities outlined below.
3.5.1 Visual Biota Surveys
At the 16 Biota sampling sites, video-photography will be used to provide a visual record of the
Biota associated with various sections of the Dual Pipelines, the general appearance/condition
of the Dual Pipelines, and to document the field sampling process. Prior to collecting samples,
a slow pan view of the sampling site will be taken.
The slow pan view will enable qualitative characterization of the relative level of mussel
colonization on the pipe (i.e., heavy, moderate, sparse, or none). In addition, multiple layers of
Biota, if present, will be noted in areas where samples are to be collected. The divers, in
communication with a biologist, will also be trained with reference cards to identify the relative
level of mussel colonization. The reference cards to be used are included in Appendix B. The
slow pan or other video-photography footage obtained throughout the sampling dive may also
provide data on the presence of fish species or macroinvertebrates that may be utilizing the
pipelines for habitat (e.g., feeding and cover sites). Where positive identifications can be made
by the diver or biologist(s) reviewing the video-photography, the data will be recorded to the
lowest possible taxa.
Special attention will be given to any areas where Biota have been disturbed and Areas of
Interest. Those areas will be closely inspected by the diver(s) allowing for additional video
footage to be collected of those areas for further review.

10
3.5.2 Biota Measurements
To avoid potential bias, upon arrival at one of the 16 Biota sampling locations the diver will
receive a randomly- generated number (ranging from 1 - 100 feet) from a person on board the
boat. The diver will then proceed into the current (or to the north) that given distance and
commence Biota measurements.
Once the diver has arrived at the random location, the thickness of Biota on the pipelines will
be determined. The circumference of the pipeline will be measured at three locations with a
flexible tape measure. Once that measurement has been recorded, a “clean pipe”
circumference measurement should be taken in the same location as the previous
measurement. To do that, the diver should gently, but comprehensively, remove all attached
material (mussels, periphyton, etc.) from the pipeline and re-measure the circumference. A
combination of a narrow plastic putty knife and nylon scrub brush will be used to remove
attached material. The process will be repeated at two additional locations that are
approximately three feet and six feet up-current from the initial location. That information will
be useful in calculating point estimates of Biota thickness at those specific locations on the
pipeline. It is important to note that circumference measurements can only be taken at
locations where the pipelines are elevated off the lake bed (i.e., not partially or fully-buried).
3.5.3 Biota Sampling
Biota samples will be taken up-current of the Biota measurements (Section 3.5.2 Biota
Measurements). Taking these samples up-current of the Biota measurements will minimize
disturbances, turbidity, and any possible sample impacts or biases to the Biota sampling.
Collection of Biota from the Dual Pipelines will include all Biota attached to or surrounding the
pipelines, including mussels, macrophytes, periphyton, biofilm, etc. Biota will be collected in
accordance with the protocol outlined below with the intent of collecting complete samples with
little to no loss of Biota. Biota will be evaluated and analyzed as presented in Section 4.0
Analysis.
Prior to collection of Biota samples, sampling containers (pre-labeled with a unique sample
identification number [ID]) will be held in front of the video camera so that the sampling
location and associated unique sample ID(s) can be documented.

11
Once the Biota sampling site has been identified (up-current or north of the Biota
measurements), a set of paired samples will be taken from every designated location on or
around the pipe. Biota samples will be collected using a container similar to that used by
Purcell (1996). The sampling containers for the Biota samples need to enclose a fixed surface
area on the pipe to enable quantification (number of mussels per square inch) of the total
surface area sampled at each site. At this time, it is expected the containers will enclose
approximately 10 to 16 square inches (Figure 7).
The containers will be compact so divers can effectively transport numerous containers,
handle, and use them at depth within their limited dive times. The containers will be pre-filled
with lake water to ensure neutral or negative buoyancy. Prototype containers and proposed
collection protocol (described below) will be field tested, and refined if necessary, prior to Biota
sampling on the Dual Pipelines.
The Biota sampling container will consist of a four (4) inch diameter circular plastic pipe,
synthetic nylon screen (e.g., bolt cloth-Nitex), end caps, and water pressure release valve (i.e.,
vent) with a screw-in end cap (Figure 7). One end of the sampling container will be affixed with
screen, end cap, and vent and the other end will be open for collection of the Biota sample.
The end caps for the container and vent will be tethered to the sampling container to prevent
loss of end caps during the collection process. A thin, flexible blade, such as a plastic putty
knife, will be slid in between the wall of the pipeline and the sampling container to dislodge
Biota from the pipeline up into the container. The dislodged material will be captured inside the
sampling container. Mussels that are outside of the sampling container will not be included in
the sample unless the majority of the length of the mussel is within the interior portions of the
container. The blade will be used to push mussels into the interior of the sampling container or
to pull them out from the container (where the majority of the mussel is outside of the
container). At that point, the sampling container will be carefully removed from the pipeline
ensuring that the blade is held against the open end of the sampling container to minimize
sample loss. The diver will place the end cap on the blade then slowly remove the blade so
that the end cap can be pushed on to the open end of the container. The small vent will allow
water to escape, yet retain material scraped off the pipeline due to the screen inside the upper
part of the container. The container will be returned to the surface and the sample extracted
and placed into storage bags as described in Section 3.5.4 Sampling Handling and
Preparation. The final sampling container and method used to collect Biota samples, as part of
12
implementing this Plan, is expected to undergo additional modifications and refinements to
those currently presented. Containers and protocol will be field tested and any subsequent
improvements to the containers and methods will be made to increase the divers’ ability to
handle and maintain the integrity of the samples being collected (i.e., minimize sample loss
and obtain samples from a defined area).
At the sixteen (16) Biota sampling locations shown in Figure 1, Biota samples will be collected
following the protocols described above. Samples will be taken from four different positions on
the pipelines (top, both sides, and the bottom). A set of two samples will be taken from each
of the four (4) positions for a total of eight (8) sampling containers per sampling location
(Figure 8). Spacing of the paired set of samples will be as close to one another as possible but
without adversely affecting the integrity of the sample locations or the collected sample.
Samples will not be collected from the bottom of the pipeline if it is not accessible due to safety
hazards or because the bottom is in contact with the lake bed. The paired samples will be
numbered as belonging to either Set 1 or Set 2. Half of the samples (one from each pipeline
position) will be used to obtain Biota community data (e.g., mussel count) described in Section
4.1 Biota Counts/Densities/Weight and the other half will be used for testing for the presence
or absence of SRB or acid producing bacteria (“APB”) as described in Section 4.2
Presence/Absence Bacteria Testing. Set 1 or Set 2 will be randomly assigned (coin flip or
random number generator) for either SRB/APB testing or to be sent to the ecological lab for
Biota community data.
As discussed above, a stratified sampling design has been selected based on the visual
observations of Biota on the Dual Pipelines and the establishment of four zones. The zones
represent varying degrees of biomass accumulation that correlate to water depth, depending
on the development of the periphyton/macrophyte and mussel assemblage, including
microbial biofilm development. The zones also represent potential differences in biomass
accumulation depending on whether the zone is on the north or south side of the Straits.
One sample site has been established in each zone with the exception of Zone D where two
sample sites have been established. This provides for eight (8) sample sites for the east and
west pipelines for a total of 16 sample sites across the Dual Pipelines (Figures 1-3). Biotic
samples will be collected from the Undisturbed Areas to examine the extent to which the
biomass of the plant-microbial biofilm layer or mussel layer vary with respect to location

13
around the pipe. The data will be graphically displayed to identify potential patterns in
biomass accumulation by different zones and by different positions around each pipeline. The
total biomass and individual biomass components (e.g., plant-biofilm biomass or quagga
biomass) for each stratum will be analyzed using a mixed model analysis of variance
(ANOVA) to examine whether there are differences in the biomass with respect to zones or
position on the pipeline. Further comparisons may prove to be meaningful if statistical
differences are noted.
3.5.3.1 Biota Sampling at Areas of Interest
A total of seven (7) representative locations were selected for the Biota sampling at Areas of
Interest – 3 on the East Pipeline and 4 on the West Pipeline. The locations of the seven (7)
areas of interest that will be sampled are identified in Figures 1 – 3. Biota samples will be
collected following the protocols described above (3.5.3). Collection of samples will
commence at the down-current location first (i.e., diver facing into the current) to minimize
disturbances, turbidity, and any possible sample impacts. A set of two samples will be taken
from the Area of Interest and another set of two samples will be taken outside of the Area of
Interest at the same position on the pipe. That will yield a total of four (4) samples per
sampling location. One of the two Area of Interest samples will be used to obtain Biota
community data as described in Section 4.1 Biota Counts/Densities/Weight and the other for
testing for SRB and APB as described in Section 4.2 Presence/Absence Bacteria Testing.
The sampling design of the Areas of Interest has been structured to provide paired biomass
data to evaluate whether these areas provide a more desirable/suitable area for periphyton-
microbial biofilm development or quagga mussel attachment when compared to immediately
adjacent coated area (see Figure 9). Results of Area of Interest sampling will provide insight
as to whether the accumulation of mussels or other Biota have impacted the integrity of the
pipeline. The biomass data will be graphically displayed to identify potential patterns in
biomass accumulation at these Areas of Interest, and determine whether statistical differences
in biomass accumulation exist in those areas where the coating has been disturbed.
3.5.3.2 Biota Sampling at Any Holiday Found
Currently there are no known Holidays on the pipeline. However, Biota will be sampled from
any Area of Interest that is found to be a Holiday. A set of two samples will be taken from
within the Holiday and two samples outside of the Holiday (at the same position on the pipe as

14
the Holiday area samples [Figure 9]). That will yield a total of four samples per sampling
location. One of two samples taken from the Holiday and non-Holiday area will be used to
obtain Biota community data as described in Section 4.1 Biota Counts/Densities/Weight and
the other for SRB and APB testing as described in Section 4.2 Presence/Absence Bacteria
Testing.
The sampling design of the Holidays has been structured to provide paired biomass data to
evaluate whether these areas provide a more desirable/suitable area for periphyton-microbial
biofilm development or quagga mussel attachment when compared to immediately adjacent
coated area (see Figure 9). Results of sampling of any Holiday found will provide insight as to
whether the accumulation of mussels or other Biota have the potential to impact the integrity of
the pipeline. The biomass data will be graphically displayed to identify potential patterns in
biomass accumulation at these Areas of Interest, and will be used to determine whether
statistical differences in biomass accumulation exist in those areas where the coating has
been disturbed.
3.5.3.3 Additional/Opportunistic Sampling
If Dislodged Coatings are found along the lake floor or, at the discretion of the diver, are easily
removed from the pipe without affecting the integrity of the glass inner wrap and enamel
coating, their location shall be first surveyed, inclusive of its surroundings, using a slow pan
view of the site. The sample and any attached Biota shall be carefully bagged and sealed in a
bag with a unique sample ID. The location and sample depth of where the sample was
collected will be recorded by the field sampling team. Upon collection of the Dislodged
Coating, the pipeline shall be visually inspected by the diver to identify the source of the
Dislodged Coating if possible. If Dislodged Coating samples are found, they will be evaluated
for biologically-induced impacts to the coating as indicated in Section 4.3 Coating Integrity
Testing.
3.5.4 Sample Handling and Preparation
Sampling containers will be returned to the surface upon completion of the dive and grouped
according to laboratory. All biological material will then be transferred from each sampling
container into individual plastic storage bags (Ziploc® or Whirl-Pak®, one bag per sampling
container). Transferring of the samples from the containers to the storage bags will be
conducted by experienced staff using sterilized stainless steel instruments (e.g., long-handled

15
spatula). Remaining material will be washed from the container into the storage bags using
wash bottles filled with lake water. Bags will be labeled with information such as the pipe,
zone, sampling, and pipe position site numbers clearly visible. Representative photographs
will be taken of this process.
Samples will be transported on ice to a secure laboratory or office facility near the Straits.
Bacteria presence/absence testing (see Section 4.2) will be conducted at the secure facility.
Sample handling and chain-of-custody procedures can be found in Appendix C.

16
4.0 Analysis
Experienced aquatic biologists will review all of the underwater video-photography taken of the
Dual Pipelines, with respect to sampling sites and their surrounding habitats to assist in the
identification of larger macrophytes and fish species that may be attached to or utilizing the
Dual Pipelines (and which are unlikely to be captured within the Biota sampling containers).
Review of the video-photography can assist in identifying apparent visual differences in
colonization rates or densities of mussels or other Biota on the Dual Pipelines at various
depths and locations around the pipe. Qualitative characterization of the relative level of
mussel colonization on the pipe (i.e., heavy, moderate, sparse, or none as shown in Appendix
B) will be made using the video-photography, recorded, and potentially used in conjunction
with the lab analyses.
Those observations may be beneficial and substantiated by the lab analyses of the Biota
samples sent to an ecological laboratory. Comparison of video-photography of specific areas
from previous and subsequent years, where locations can be confirmed, will be evaluated for
differences in colonization rates or densities, especially in areas where maintenance and
inspection activities removed mussels from the upper surface of the pipe.
As noted in Section 3.5 Biota Surveys, Measurements, and Sampling, Biota samples will be
collected in pairs to enable analysis of multiple parameters from the same location without
having to collect and subdivide larger samples, which can increase the risk of contamination
and loss of sample integrity.
One Biota sample from each of the four locations sampled around the pipe (or one Biota
sample from each of the two locations if sampled at a Holiday) will be sent to an ecological
laboratory for evaluation of Biota composition and physical metrics of the Biota present.
Experienced staff will conduct tests for the presence or absence of SRB and APB on the set of
Biota samples that were not randomly selected to be sent to the lab for Biota analysis.
Dislodged Coating samples will also be sent to the ecological lab for evaluation of attached
Biota.

17
4.1 Biota Counts/Densities/Weight
The ecological laboratory will qualitatively evaluate and separate out the larger Biota (i.e.,
mussels) from the smaller Biota. At the present time, Biota is expected to be divided into four
(4) general categories: plant matter (macrophytes and algae), mussels, benthic
macroinvertebrates, and biofilm (microscopic organisms and undiscernible gelatinous
material). All Biota will be identified or keyed out to its lowest practicable taxa.
The ecological laboratory will obtain dry and wet weights of mussels using standard laboratory
procedures for obtaining these masses, similar to those used by United States Army Corps of
Engineers (USACE,1993; Wilson et al., 2006). Mussels will be enumerated and their shells
measured. Shell measurements will be used to assist in determining the number of
generations (i.e., age structure) of mussels present at each of the sampling locations.
Mussels are consumed by some fish species, particularly round gobies (Neogobius
melanostomus) (French and Jude, 2001; Wilson et al., 2006), and overt signs of mussel
predation such as active feeding and high abundance of round gobies will be documented.
The ecological laboratory will obtain collective dry and wet weights of the remaining Biota
using standard laboratory procedures similar to those used by USACE (1993). The total mass
of all aquatic Biota will be obtained by adding together the weights of the mussels and the
remaining non-mussel Biota.
4.2 Presence/Absence Bacteria Testing
Staff will utilize BioSan Laboratories SRB and APB test kits for evaluating Biota samples taken
from the one set of samples collected from the various sides of the pipe, Dislodged Coatings,
areas adjacent to Dislodged Coatings, and any Dislodged Coating for the presence or
absence of SRB and APB. Approximately 5 grams or less of biofilm/periphyton will be
removed from the appropriate sample bag(s) and placed it into a test kit. Additional information
related to SRB/APB test kit use can be found in Appendix C.
The SRB test kits contain tubes of culture media specifically formulated to promote the growth
of anaerobic SRB. SRBs are organisms which reduce sulfate to sulfide in the absence of
oxygen. The most common organisms of that type associated with accelerated corrosion and
industrial environments are found in the genera Desulfovibrio and Desulfotomaculum. When

18
sulfide is liberated, it reacts with iron in the tubed culture medium to form iron sulfide, a black
precipitate. The degree to which the test kit medium blackens, along with the length of time it
takes to change color, allows for an estimated count of sulfate reducers to be made. Test kits
include sample applicators that allows for the evaluation of both liquids and surfaces.
The APB test kit is a simple and rapid test for the detection and enumeration of APB with
results in 24 hours when strong acid producers are present. That semi-quantitative system
contains tubes of culture media specifically formulated to promote the growth of APB. One
culture tube equals one test and no syringes are needed. Similar to the SRB test kits,
applicators are included to allow for the evaluation of both liquids and surfaces. When acid is
liberated, it reacts with the tubed culture medium and changes the color from red to yellow.
The length of time it takes to change color allows for an estimated count of acid producing
bacteria to be made.
4.3 Coating Integrity Testing
In addition to the coating inspection in Section 3.2, Enbridge will also retrieve representative
samples of Dislodged Coating from the bottom of the Straits when available. The intent of this
work is to confirm the overall thickness of the coating and determine the penetration depth of
various types of Biota into the coating. The overall coating thickness and penetration depths
will be measured by cross-sectional microscopy. Biota samples will also be tested for SRB
and APB in accordance with Section 4.2.
4.4 Engineering Stress Analysis An additional analysis will be conducted and will include additional inputs from the Biota
Investigation. The intent of the augmented analysis will be to determine how sensitive both
stress and vortex induced vibration (VIV) assessments are to variability in the pipeline as a
result of Biota. The inputs into this engineering analysis from the Plan will include; Biota mass,
Biota size, and corresponding effect on drag force and effective diameter.
In addition to the Plan variables, the variables normally considered for stress and VIV
assessments include pipeline weight (with varying products), internal pressure, span length,
pipeline wall thickness, grade, diameter, coating type/thickness and water velocities. For the
stress analysis, the methodology used will involve varying the input parameters within a finite
element model to determine the effects of varying the weight, span length, pressure and

19
buoyancy on the pipe stress. For VIV assessments, both the increase in diameter due to Biota
presence, as well as the increase in pipe mass will be assessed utilizing finite element
analysis to calculate nodal frequencies and span lengths and closed formed solutions to
determine VIV limits.
This assessment will require at least 12 weeks to complete once the Biota variable data has
been provided to the engineering consultant.

20
5.0 Quality Assurance/Quality Control
Robust quality assurance/quality control measures will be instituted to ensure the integrity of
samples and measurements generated during the Biota investigation (see also Appendix C).
Those measures will include, but are not limited to:
• Project organization: the Project Manager, subcontractors, and all parties taking part in
this effort will be identified and their roles articulated prior to commencing efforts.
Planning and coordination calls and/or meetings will take place with divers, members
of the integrity team, biologists, etc., to ensure the proper execution of sampling and
data collection protocol.
• Proper training: The divers used on this project will be Operator Qualified (OQ) for
coating thickness measurements and cathodic protection readings.
• All instruments will be calibrated according to manufacturer’s recommendations.
• Field sampling review: the location of zones, sampling sites, and pipe positions where
samples are to be collected will be reviewed prior to undertaking any field sampling
efforts.
• Video-photography and audio communication (between divers and personnel on
boats) will be utilized to ensure proper documentation of conditions and sampling
requirements.
• Sample handling: biological samples (e.g., biofilm, periphyton, mussels, etc.) collected
during the course of the investigation will be handled and preserved using proper
techniques to ensure sample integrity.
o Methods currently include the removal and washing of all Biota from the
sampling containers into plastic storage bags using a flexible blade and wash
bottles.
• Documentation and records: field notes, chain-of-custody documents, laboratory
reports, etc., will be compiled and saved at secure locations in hard copy and/or
electronic form.
o Chain-of-custody files will be utilized to track the custody of samples throughout
collection, transfer/shipment of samples to analytical labs, etc. Pertinent
information such as the dates, times, and persons handling samples will be
recorded to ensure that chain-of-custody is properly documented.

21
• Data validation: Data generated through the course of these efforts will be routinely
evaluated for accuracy, precision, representativeness, and completeness.
• Reporting: Reports and project deliverables will be edited, reviewed, and finalized prior
to submittal.

22
6.0 Schedule and Deliverables
Enbridge shall implement the Plan in accordance with the schedule described below,
predicated upon USEPA’s approval of the Plan in June 2017. If USEPA approval is not
granted by this date, logistical requirements, seasonal limitations, and biological growing
season considerations will necessitate moving field sampling efforts to 2018.
• June 2017: Refinement and opportunistic testing of sampling methodologies, lab
analyses, and statistical tests of any preliminary data.
• July 2017 September 2017: Visual and Biota surveys and sampling of Biota on
Dual Pipelines.
o Representative samples of the aquatic Biota attaching to and/or surrounding the
Dual Pipelines are best obtained later in the growing season since macrophytes,
algae, and periphyton will not fully establish until later in the growing season
when water temperatures are highest (July-September, [NOAA, 2016]).
o Representative samples of mussels can be obtained at any time of the year but
late summer is recommended given mussels would be at their greatest size
(Schneider, 1992), which would enable more accurate maximum mass
estimations.
• August 2017 December 2017: Lab and engineering stress analysis.
o Discussions with the ecological laboratory and Enbridge integrity indicate that 12
weeks are needed to process the large volume of Biota samples for analysis.
o A pipeline structural engineering firm will also require 12 weeks to complete an
engineering stress analysis of the Biota with respect to the integrity of the
pipelines suspended above the floor at the Straits.
• December 2017 February 2018: Data analysis.
• March 2018: Submittal of Final Report.
o Submitted within 60 days of completion of field and lab analyses.
Implementation of this Plan, inclusive of its literature reviews, visual surveys, Biota
measurements, Biota sampling and lab analyses, chemical and biological activities, and levels
of cathodic protection will aide in answering the assessments presented in Section 2.0
Consent Decree Requirements. To achieve compliance with the consent decree, Enbridge

23
will implement this Plan in accordance with the schedules presented above. As part of the
Plan the following deliverables will be provided to USEPA, within the specified timeframes, as
follows:
• No later than 60 days after the completion of field and lab analyses associated with
implementing this Plan, Enbridge shall submit a final report to USEPA for review and
approval, describing the findings and results of the investigation.
o In the event that the investigation finds that mussels and other Biota have
impaired, or threaten to impair, the Dual Pipelines, Enbridge shall supplement
its final report with a proposed work plan to address such impairments, together
with a proposed schedule for completing such work.
The supplement shall be submitted within 60 days of submittal of the
final report to USEPA.

24
7.0 Workforce
Key personnel currently proposed for implementation of this Plan include the following:
Enbridge Energy, Limited Partnership
• Senior Manager Environment U.S. Operations
• Senior Integrity Engineer
Leggette, Brashears, and Graham, Inc. (LBG)
• P.E., Civil Engineer, Leggette, Brashears & Graham, Inc, Hancock,
Michigan
• P.E., Environmental Engineer, Leggette, Brashears & Graham, Inc,
Wetmore, Michigan
GEI Consultants of Michigan, P.C.
• Sr. Aquatic Biologist, Traverse City, Michigan
• Aquatic Ecotoxicologist, Lansing, Michigan
GEI Consultants, Inc.
• , Aquatic Ecologist / Limnologist, Denver, Colorado
• Ecological Laboratory Manager, Denver, Colorado
Ballard Marine
• Project/Operations Manager
Kiefner and Associates Inc.
• Principal Engineer, Manager-Stress Analysis, Columbus, Ohio
Key personnel, Contractors and Consultants maybe changed as needed to facilitate
completion of this investigation plan as outlined in Section 6.0 Schedules and Deliverables.
REDACTED
REDACTED
REDACTEDREDACTED
REDACTEDREDACTED
REDACTED
REDACTED
25
8.0 Literature Cited
Castaneda, H. and Benetton, X. 2008. SRB-biofilm influence in active corrosion sites formed
at the steel-electrolyte interface when exposed to artificial seawater conditions. Corrosion
Science, Volume 50, lssue 4, April 2008, Pages 1189-1183.
Duperron, Sébastien. 2010. The Diversity of Deep-Sea Mussels and Their Bacterial
Symbioses. Chapter 6: The Vent and Seep Biota, Topics in Geobiology 33, S. Kiel (ed.).
Enbridge. 2016. Enbridge Line 5 Visual Biota Survey of Straits of Mackinac Crossing.
Technical Memorandum, GEI Consultants of Michigan, P.C., July 29, 2016.
Epping, E., V. Schoemann and H. de Heij, 1998. Manganese and iron oxidation during benthic
oxygenic photosynthesis. Estuarine Coastal and Shelf Science 47: 753–767.
French, J.R.P. and Jude, D.J. 2001. Diets and Diet Overlap of Nonindigenous Gobies and
Small Benthic Native Fishes Co-inhabiting the St. Clair River, Michigan. J. Great Lakes Res.
27(3):300–311.
Gale, W.F and D. Thompson. 1975. A Suction Sampler for Quantitatively Sampling Benthos
on Rocky Substrates in Rivers. Trans. Am. Fish. Soc., Volume 104, pages 398-405.
Hicks, R.E. and Oster, R.J. 2012. Developing a Risk Assessment Tool to Predict the Risk of
Accelerated Corrosion to Port Infrastructure. Final report to the Great Lakes Maritime
Research Institute.
Jeroschewski,P., C. Steuckart and M. Kühl. 1996. An amperometric microsensor for the
determination of H2S in aquatic environments. Analytical Chemistry 68(24): 4351 – 4357.
Kikuchi, R.M., A.A. Fonesca-Gessner, G.Y. Shimizu. 2006. Suction sampler for collection of
benthic macroinvertebrates in several continental aquatic environments: a comparative study
with the Hess and Surber samplers. Acta Limnol. Bras., 18(1):29-37.

26
Koschorreck, M., A. Kleeberg, R. Herszprung and K. Wendt-Potthoff. 2007. Effects of benthic
filamentous algae on the sediment-water interface in an acidic mining lake. Hydrobiologia
592:387-397.
Krause-Jensen, D., P.Christensen and S. Rysgaard, 1999. Oxygen and nutrient dynamics
within mats of the filamentous macroalga Chaetomorpha linum. Estuaries 22: 31–38.
Lake Access. 2016. Lake ecology webpage providing estimated ranges for water
transparency/euphotic zones for various lakes (including Lake Michigan).
http://www.lakeaccess.org/ecology/lakeecologyprim3.html
Moura, M.C., Pontual, E.V., Paiva, P.M.G., and Coelho, L.C.B.B. 2013. An Outline to
Corrosive Bacteria. Chapter in: Microbial pathogens and strategies for combating them:
science, technology and education. Formatex Research Center. (A. Méndez-Vilas, Ed.)
National Oceanic and Atmospheric Administration (NOAA) - Great Lakes Average GLSEA
Surface Water. Accessed 9/15/16 -- https://coastwatch.glerl.noaa.gov/statistic/avg-sst.php
Purcell, S. 1996. A direct method for assessing sediment load in epilithic algal communities.
Coral Reefs, November 1996, Volume 15, Issue 4, pp 211–213.
Purcell, S. and Bellwood, D. 2001. Spatial patterns of epilithic algal and detrital resources on
a coral reef. Coral Reefs, September 2001, Volume 20, Issue 2, pp 117–125.
Revsbech, N. 1989. An oxygen microsensor with a guard cathode. Limnology and
Oceanography 34:474–478.
Schneider, D. W. 1992. A bioenergetics model of zebra mussel, Dreissena polymorpha,
growth in the Great Lakes. Can. J. Fish. Aquat. Sci. 49: 1406-1416.
Stachowitsch, M., B. Riedel, M. Zuschin and R. Machan. 2007. Oxygen depletion and benthic
mortalities: the first in situ experimental approach to documenting an elusive phenomenon.
Limnology and Oceanography: Methods 5:344-352.

27
Thongnueakhaeng, W. and P. Chaiprasert. 2015. Effect of dissolved oxygen concentrations
on specific microbial activities and their metabolic products in simultaneous sulfur and nitrogen
removal. International Journal of Environmental Science and Development 6(4): 235-240.
Trampe, E., J. Larsen, M. Glaring, P. Stougaard and M. Kühl. 2016. In situ dynamics of O2,
pH, light, and photosynthesis in ikaite tufa columns, (Ikka Fjord, Greenland) – A unique
microbial habitat. Frontiers in Microbiology 7(722): 1-13.
USACE, 1993. A Method for Calculating the Total Mass of Zebra Mussels. Zebra Mussel
Research Technical Notes.
USEPA. 2002. Guidance on Choosing a Sampling Design for Environmental Data Collection
for Use in Developing a Quality Assurance Project Plan EPA QA/G-5S, EPA/240/R-02/005
Van der Meer, J. 1997. Sampling design of monitoring programmes for marine benthos: a
comparison between the use of fixed versus randomly selected stations. Journal of Sea
Research 37:167-175
Vopel, K., D. Thistle, J. Ott, M. Bright and H. Roy. 2005. Wave-induced H2S flux sustains
chemoautotrophic symbiosis. Limnology and Oceanography 50(1):128-133.
Vopel, K. and I. Hawes. 2006. Photosynthetic performance of benthic microbial mats in Lake
Hoare, Antarctica. Limnology and Oceanography 51(4):1801-1812.
Water Research Foundation. 2015. Assessing Performance of Biofilm Sampling Approaches.
Report to USEPA.
Wilson, K.A., Howell, T.E., and Jackson, D.A. 2006. Replacement of Zebra Mussels by
Quagga Mussels in the Canadian Nearshore of Lake Ontario: the Importance of Substrate,
Round Goby Abundance, and Upwelling Frequency. J. Great Lakes Res. 32:11–28.

FIGURES
Figure 1 – General profile view of east and west pipelines and associated zones
Figure 2 – Profile view of sampling zones and sites for the east pipeline
Figure 3 – Profile view of sampling zones and sites for the west pipeline
Figure 4 – Layout of Thickness Measurements at Areas of Interest
Figure 5 – Qualitative assessment of the Biota across the east pipeline
Figure 6 – Qualitative assessment of the Biota across the west pipeline
Figure 7 – Biotic sampler
Figure 8 – Layout at Undisturbed Area with Biota Sampling
Figure 9 – Layout at Area of Interest with Biota Sampling

Sources: Topographic imagery from ArcGIS Online. Topographic Data from Ballard Marine Construction
FIGURE 1: GENERAL PROFILE VIEW OF EAST AND WESTPIPELINE AND ASSOCIATED ZONES
DATE: 5/16/17

G:\
GIS
\Enb
ridge
\Str
aits
of M
ack
inac
\map
s\g2
5enb
stra
its01
e.m
xd,
5/1
6/20
17, 1
0:0
4:32
AM
, NA
D 1
983
UT
M Z
one
16N
Sources: Topographic imagery from ArcGIS Online. Topographic Data from Ballard Marine Construction.Notes: Aquatic Observations are approximate. Area of Interest Locations and 2016 Anchor Locations are not survey grade data
Survey Area
Project #: Straits, MIDrawn: LBG 5/16/2017 Approved: LBG 5/16/2017 Name: g25enbstraits01e
F I G U R E 2P R O F I L E V I E W O F S A M P L I N G Z O N E S A N D
S I T E S F O R T H E E A S T P I P E L I N E
LegendTopographic Profile
Water Level Indicator
Station ID
Span ID
1 + 250
E-20
#
Lake Bottom Profile
Pipeline Profile
Natural Touch Down
Grout Bag
Existing Anchor Location
!
"
#
Additional Site
#
_̂ Area of Interest
S Sample Site of 6-8 SamplesAround the Pipe
Proposed Anchor Location#
B Biota Sample Site at Area of Interest

G:\
GIS
\Enb
ridge
\Str
aits
of M
ack
inac
\map
s\g2
5enb
stra
its01
f.mxd
, 5/1
6/2
017,
10
:02:
28
AM
, NA
D 1
983
UT
M Z
on
e 1
6N
Survey Area
Sources: Topographic imagery from ArcGIS Online. Topographic Data from Ballard Marine Construction.Notes: Aquatic Observations are approximate. Area of Interest Locations and 2016 Anchor Locations are not survey grade data.
Project #: Straits, MIDrawn: LBG 5/16/2017 Approved: LBG 5/16/2017 Name: g25enbstraits01f
F I G U R E 3P R O F I L E V I E W O F S A M P L I N G Z O N E S A N D
S I T E S F O R T H E W E S T P I P E L I N E
LegendTopographic Profile
Water Level Indicator
Station ID
Span ID
1 + 250
E-20
#
Lake Bottom Profile
Pipeline Profile
Natural Touch Down
Grout Bag
Existing Anchor Location
!
"
#
Additional Site
#
_̂ Area of Interest
S Sample Site of 6-8 SamplesAround the Pipe
Proposed Anchor Location#
B Biota Sample Site at Area of Interest

2
31
12 0'CLOCK
3 0'CLOCK9 0'CLOCK
CROSS-SECTION VIEWOF PIPE MEASUREMENTS
2
31
31
2
31
31
22
2
31
UPSTREAM
DOWNSTREAM
CENTER
AREA OF INTEREST
UNDISTURBED AREAGREATER THAN 5 FEET FROM THE AREA OF INTEREST
UNDISTURBED AREAGREATER THAN 5 FEET FROMTHE AREA OF INTEREST
>60"
>60"
2"
2"
UNDISTURBED AREAWITHIN 2 INCHES OF AREA OF INTEREST
UNDISTURBED AREAWITHIN 2 INCHES OF AREA OF INTEREST
SCALE:
ISOMETRIC LAYOUTN.T.S.
SCALE:
LAYOUT OF THICKNESS MEASUREMENTS AT AREAS OF INTERESTSECTION LAYOUT
N.T.S.
DATE: 5/11/2017 FIGURE 4: LAYOUT OF THICKNESS MEASUREMENTS ATAREA OF INTEREST

G:\GIS\Enbridge\Straits of Mackinac\maps\g25enbstraits01l.mxd, 5/16/2017, 10:46:48 AM, NAD 1983 UTM Zone 16N
Source s : Topog raphic im ag e ry from ArcGIS Online. Topog raphic Data from Ballard Marine Cons truction.Note s : Aquatic Obs e rvations are approxim ate.
F I G U R E 5Q U A L I TAT I V E A S S E S S M E N T O F T H E B I O TA
A C R O S S T H E E A S T P I P E L I N E
Survey Area
P roje ct #: Straits, MIDrawn: LBG 5/16/2017 Approve d : LBG 5/16/2017 Nam e : g 25e nbs traits01l
Le g e ndTopog raphic P rofileLake Bottom P rofileP ipe line P rofileWate r Leve l Ind icatorStation IDSpan ID
1 + 250E-20
#

G:\GIS\Enbridge\Straits of Mackinac\maps\g25enbstraits01k.mxd, 5/16/2017, 10:17:24 AM, NAD 1983 UTM Zone 16N
F I G U R E 6Q U A L I TAT I V E A S S E S S M E N T O F T H E B I O TA
A C R O S S T H E W E S T P I P E L I N E
Le ge ndTop ograp hic ProfileLake Bottom ProfilePip e line ProfileWate r Le ve l Ind ic atorStation IDSp an ID
Survey Area
1 + 250E-20
#
Sourc e s: Top ograp hic im age ry from ArcGIS Online . Top ograp hic Data from Ballard Marine Construction.N ote s: Aq uatic Ob se rvations are ap p roxim ate .
Proje ct #: Straits, MIDrawn: LBG 5/16/2017 Ap p rove d : LBG 5/16/2017 N am e : g25e nb straits01k

NOTES:1. SAMPLER AREA SHALL BE APPROXIMATELY 16 IN²2. DESIGN MAY CHANGE PENDING TESTING
SCALE:
BIOTIC SAMPLER ISOMETRIC VIEWN.T.S.
BLEEDER VALVE, PLUG WITH THUMB SCREW (TYP)
END CAP
MESH SCREEN, COVEREND OF LINER SLEEVE
BAND TO SECURE SCREEN
4" DIAMETER SAMPLE DEVICE
LINER SLEEVE
END CAP
SAMPLER LENGTH APPROXIMATELY 8"
DATE: 5/17/2017 FIGURE 7: BIOTIC SAMPLER

1
2
3
4
5
7
6
8
1&2
3&45&6
7&8
NOTES:1. SAMPLES 7 AND 8 WILL BE OBTAINED IF POSSIBLE.2. ADJACENT SAMPLES SHALL BE SPACED
APPROXIMATELY 6" APART. ENSURE SAMPLES ARETAKEN IN PREVIOUSLY UNDISTURBED AREAS.
3. DESIGN MAY CHANGE PENDING TESTING
SCALE:
BIOTIC SAMPLING ISOMETRIC LAYOUTN.T.S.
SCALE:
BIOTIC SAMPLING SECTION LAYOUTN.T.S.
DATE: 5/11/2017 FIGURE 8: LAYOUT AT UNDISTURBED AREA WITH BIOTASAMPLING

3
4
1,2,3&4
1
2
NOTES:1. SAMPLES 3 AND 4 WILL BE OBTAINED AT A SIMILAR
POSITION ON THE PIPE AS SAMPLES 1 AND 2.2. ADJACENT SAMPLES SHALL BE SPACED
APPROXIMATELY 6" APART. ENSURE SAMPLES ARETAKEN IN PREVIOUSLY UNDISTURBED AREAS.
3. DESIGN MAY CHANGE PENDING TESTING
SCALE:
BIOTIC SAMPLING ISOMETRIC LAYOUTN.T.S.
SCALE:
BIOTIC SAMPLING SECTION LAYOUTN.T.S.
AREA OF INTEREST
DATE: 5/11/2017 FIGURE 9: LAYOUT AT AREA OF INTERESTWITH BIOTA SAMPLING
~ 3 FEET

TABLES
Table 1: Biota sample sites: East and West pipelines

Table 1. Biota sample sites: East and West pipelines
East Pipeline - Biota sample sites
Zone Water depth (ft)1Proposed Biota sampling sites2 Description of Biota sampling sites Total number of Biota samples3
Total number of Biota samples at area of interest4
A (north) 50-100 1 Equidistant between E07 and E65B 6-8 -B (north) 100-150 1 North of E-05B 6-8 -C (north) 150-200 1 Area of Interest south of E01B-B 6-8 4
D >200 1 Area of Interest north of E76A/B 6-8 4D >200 1 E10 6-8 -
C (south) 150-200 1 E16 6-8 -B (south) 100-150 1 South of E-61A 6-8 -A (south) 50-100 1 Area of Interest south of 34A 6-8 4
West Pipeline - Biota sample sites
Zone Water depth (ft)1Proposed Biota sampling sites2 Description of Biota sampling sites Total number of Biota samples3
Total number of Biota samples at area of interest4
A (north) 50-100 1 W65B 6-8 -B (north) 100-150 1 W61A 6-8 -C (north) 150-200 1 W58B 6-8 -
D >200 1 Area of Interest near W54A 6-8 4D >200 1 Area of Interest near W72A 6-8 -
C (south) 150-200 1 Area of Interest north of W-70B 6-8 4B (south) 100-150 1 Area of Interest south of W35B North 6-8 4A (south) 50-100 1 Area of Interest south of W10 6-8 4
1 Pipelines buried to water depth of approximately 65 feet2 One site per zone, sampling immediately adjacent to Area of Interest when possible3 Six samples/site if pipeline bottom not accessible; eight samples/site otherwise4 Paired sampling: two samples in area of interest, two samples immediately adjacent area of interest

APPENDICES

Appendix A – Bibliography (Includes literature cited and other documents preliminarily reviewed)
Al Abbas, F.M., Williamson, C., Bhola, S., Spear, J.R., Olson, D.L. 2013. Influence of sulfate
reducing bacterial biofilm on corrosion behavior of low-alloy, high-strength steel (API-5L X80).
International Biodeterioration and Biodegradation, 78:34-42.
Azim, M.E., M.C.J. Verdegen, A.A. van Dam, and M.C.M. Beveridge. 2005. Periphyton: Ecology, Exploitation and Management. CAB Publishing, Wallingford, Oxfordshire, UK. Bjerkan, G., Witso, E., and Bergh, K. 2009. Sonication is superior to scraping for retrieval of
bacteria in biofilm on titanium and steel surfaces in vitro. Acta Orthopaedica, 80 (2): 245–250.
Brajendra Mishra c, Anthony E. Kakpovbia aBeeton, A.M. and J.H. Saylor. Limnology of Lake
Huron. 1995. In The Lake Huron Ecosystem: Ecology, Fisheries, and Management pp. 1-37.
Great Lakes Environmental Research Laboratory, NOAA
Castanede, H. and Benetton, X. 2008. SRB-biofilm influence in active corrosion sites formed
at the steel-electrolyte interface when exposed to artificial seawater conditions. Corrosion
Science, Volume 50, lssue 4, April 2008, Pages 1189-1183.
Duperron, Sébastien. 2010. The Diversity of Deep-Sea Mussels and Their Bacterial
Symbioses. Chapter 6: The Vent and Seep Biota, Topics in Geobiology 33, S. Kiel (ed.).
Enning, D., and Garrelfs, J. 2014. Corrosion of Iron by Sulfate-Reducing Bacteria: New Views
of an Old Problem. Applied and Environmental Microbiology, Volume 80 Number 4, p. 1226–
1236.
Epping, E., V. Schoemann and H. de Heij, 1998. Manganese and iron oxidation during benthic
oxygenic photosynthesis. Estuarine Coastal and Shelf Science 47: 753–767.
EPRI, 1991. Cathodic Protection Criteria for Controlling Microbially Influenced Corrosion in
Power Plants. Palo Alto, CA.
EPRI, 1992. Zebra Mussel Monitoring and Control Guide. Palo Alto, CA.
EPRI, 2004. Water Treatment Strategies: Microorganism Control. Palo Alto, CA
A-1

Freeberg, M.H., W.W. Taylor, R.W. Brown. 1990. Effect of Egg and Larval Survival on Year-
Class Strength of Lake Whitefish in Grand Traverse Bay, Lake Michigan. Trans. Am. Fish.
Soc. Vol. 1, pages 92-100.
French, J.R.P. and Jude, D.J. 2001. Diets and Diet Overlap of Nonindigenous Gobies and
Small Benthic Native Fishes Co-inhabiting the St. Clair River, Michigan. J. Great Lakes Res.
27(3):300–311.
Gale, W.F and D. Thompson. 1975. A Suction Sampler for Quantitatively Sampling Benthos
on Rocky Substrates in Rivers. Trans. Am. Fish. Soc., Volume 104, pages 398-405.
Hicks, Randall. 2007. Structure of Bacterial Communities Associated with Accelerated
Corrosive Loss of Port Transportation Infrastructure. Report to/for Great Lakes Maritime
Research Institute.
Hicks, Randall. 2008. Development and Succession of Microbial Communities Associated with
Corroding Steel Pilings in the Duluth-Superior Harbor. Interim Report.
Hicks, Randall. 2012. Assessing the Role of Microorganisms in the Accelerated Corrosion of
Port Transportation Infrastructure in the Duluth-Superior Harbor.
Hicks, R.E. and Oster, R.J. 2012. Developing a Risk Assessment Tool to Predict the Risk of
Accelerated Corrosion to Port Infrastructure. Final report to the Great Lakes Maritime
Research Institute.
Hu, A. 2004. Investigation of sulfate-reducing bacteria growth behavior for the mitigation of
microbiologically-influenced corrosion (MIC). Thesis submitted to Ohio University.
Jeroschewski,P., C. Steuckart and M. Kühl. 1996. An amperometric microsensor for the
determination of H2S in aquatic environments. Analytical Chemistry 68 (24): 4351 – 4357.
Kikuchi, R.M., A.A. Fonesca-Gessner, G.Y. Shimizu. 2006. Suction sampler for collection of
benthic macroinvertebrates in several continental aquatic environments: a comparative study
with the Hess and Surber samplers. Acta Limnol. Bras., 18(1):29-37.
Kogge, S. and G. DeJong, Enbridge Line 5 – Straits of Mackinaw – Assessment of Attached
Aquatic Organisms Technical Memorandum, November 12, 2014.
A-2
Koschorreck, M., A. Kleeberg, R. Herszprung and K. Wendt-Potthoff. 2007. Effects of benthic
filamentous algae on the sediment-water interface in an acidic mining lake. Hydrobiologia
592:387-397.
Krause-Jensen, D., P.Christensen and S. Rysgaard, 1999. Oxygen and nutrient dynamics
within mats of the filamentous macroalga Chaetomorpha linum. Estuaries 22: 31–38.
Lake Champlain Maritime Museum. 1996. Zebra mussels and their impacts on historic
shipwrecks. 62 pgs.
Li, K., Whitfield, M., and Van Vliet, K. 2013. Beating the bugs: roles of microbial biofilms in
corrosion. Corrosion Reviews, Volume 31, Issue 3-6.
Matthews, J., G. van der Velde, A. bij de Vaate, and R. S. E. W. Leiven. 2012. Key Factors for
Spread, Impact and Management of Quagga Mussels in the Netherlands. Radboud University
Nijmegen, the Netherlands.
Mills, Edward (et al.). 1996. A Review of the Biology and Ecology of the Quagga Mussel
(Dreissena bugensis), a Second Species of Freshwater Dreissenid Introduced to North
America. American Zoologist, 36: 271-286.
Moura, M.C., Pontual, E.V., Paiva, P.M.G., and Coelho, L.C.B.B. 2013. An Outline to
Corrosive Bacteria. Chapter in: Microbial pathogens and strategies for combating them:
science, technology and education. Formatex Research Center. (A. Méndez-Vilas, Ed.)
National Oceanic and Atmospheric Administration (NOAA) - Great Lakes Average GLSEA
Surface Water. Accessed 9/15/16 -- https://coastwatch.glerl.noaa.gov/statistic/avg-sst.php
Oster, R.J. 2012. Modeling the Corrosive Loss of Port Infrastructure in the Duluth-Superior
Harbor and the North Shore of Lake Superior. Master’s Thesis submitted to The University of
Minnesota.
Purcell, S. 1996. A direct method for assessing sediment load in epilithic algal communities.
Coral Reefs, November 1996, Volume 15, Issue 4, pp 211–213.
Purcell, S. & Bellwood, D. 2001. Spatial patterns of epilithic algal and detrital resources on a
coral reef. Coral Reefs, September 2001, Volume 20, Issue 2, pp 117–125.
A-3

Revsbech, N. 1989. An oxygen microsensor with a guard cathode. Limnology and
Oceanography 34:474–478.
Schneider, D. W. 1992. A bioenergetics model of zebra mussel, Dreissena polymorpha,
growth in the Great Lakes. Can. J. Fish. Aquat. Sci. 49: 1406-1416.
Sherar, B.W.A., Power, I.M., Keech, P.G., Mitlin, S., Southam, G., and Shoesmit, D.W. 2011.
Characterizing the effect of carbon steel exposure in sulfide containing solutions to microbially
induced corrosion. Corrosion Science 53: 955–960.
Stachowitsch, M., B. Riedel, M. Zuschin and R. Machan. 2007. Oxygen depletion and benthic
mortalities: the first in situ experimental approach to documenting an elusive phenomenon.
Limnology and Oceanography: Methods 5:344-352.
Thongnueakhaeng, W. and P. Chaiprasert. 2015. Effect of dissolved oxygen concentrations
on specific microbial activities and their metabolic products in simultaneous sulfur and nitrogen
removal. International Journal of Environmental Science and Development 6(4): 235-240.
Trampe, E., J. Larsen, M. Glaring, P. Stougaard and M. Kühl. 2016. In situ dynamics of O2,
pH, light, and photosynthesis in ikaite tufa columns, (Ikka Fjord, Greenland) – A unique
microbial habitat. Frontiers in Microbiology 7(722): 1-13.
USACE, 1993. A Method for Calculating the Total Mass of Zebra Mussels. Zebra Mussel
Research Technical Notes.
USACE, 1994. Zebra Mussel Infestation at Black Rock Lock, Buffalo, New York. Zebra Mussel
Research Technical Notes.
USACE, 1998. Corrosion Rates of Ferrous Metals Associated with Zebra Mussel Infestations.
Zebra Mussel Research Technical Notes.
USACE, 2010. Zebra Mussel Action Plan. U.S. Army Corps of Engineers Tulsa District,
Operations Division.
USEPA. 2002. Guidance on Choosing a Sampling Design for Environmental Data Collection
for Use in Developing a Quality Assurance Project Plan EPA QA/G-5S, EPA/240/R-02/005
A-4

Van der Meer, J. 1997. Sampling design of monitoring programmes for marine benthos: a
comparison between the use of fixed versus randomly selected stations. Journal of Sea
Research 37:167-175
Vopel, K., D. Thistle, J. Ott, M. Bright and H. Roy. 2005. Wave-induced H2S flux sustains
chemoautotrophic symbiosis. Limnology and Oceanography 50(1):128-133.
Videla and Herrera. 2005. Microbiologically influenced corrosion: looking to the future. Int.
Microbiol. Vol. 8, 2005.
Vopel, K. and I. Hawes. 2006. Photosynthetic performance of benthic microbial mats in Lake
Hoare, Antarctica. Limnology and Oceanography 51(4):1801-1812.
Water Research Foundation. 2015. Assessing Performance of Biofilm Sampling Approaches.
Report to USEPA.
Wilson, K.A., Howell, T.E., and Jackson, D.A. 2006. Replacement of Zebra Mussels by
Quagga Mussels in the Canadian Nearshore of Lake Ontario: the Importance of Substrate,
Round Goby Abundance, and Upwelling Frequency. J. Great Lakes Res. 32:11–28.
Zhang, P., Xu, D., Li, Y., Yang, K., Gu, T. 2015. Electron mediators accelerate the
microbiologically influenced corrosion of 304 stainless steel by the Desulfovibrio vulgaris
biofilm. Bioelectrochemistry 101: 14–21.
Zhulidov, A. V., A. V. Kozhara, T. F. Nalepa, T. Y. Gurtovaya, and D. A. Zhulidov. 2013.
Relative abundance of two dreissenid species, Dreissena polymorpha and Dreissena
rostriformis bugensis in the Lower Don River system, Russia. Aquatic Invasions 8: 311-318.
A-5

DATE: 5/16/2017 APPENDIX B: LEVEL OF MUSSEL COLONIZATIONREFERENCE CARDS
<10%NONE 1%
<10% = SPARSE
<50%10%
10-<50% = MODERATE 50-100% = HEAVY
100%50%
B-1

1 of 2
STANDARD OPERATING PROCEDURE Field Notebook
1. ObjectiveDescribe methods for documentation of field activities.
Documentation of site activities is a crucial part of the field investigation process. The field notebook serves as the record of field activities performed or observed during the project. It provides a factual basis for preparing field observation reports, if required, and reports to clients and regulatory agencies. Example field notes are provided in Attachment A.
2. Execution Use a separate all-weather bound notebook for each site/location/project
number. Spiral notebooks should not be used because pages can be easilyremoved.
Write neatly using black or blue pen, preferably a waterproof pen. Use ofpencil is also acceptable only with approval of the project manager, such as inbut not limited to, certain field conditions [e.g., cold or wet weather].
Write the project name, project number, book number (i.e., 1 of 3), and dateon the front cover. On the inside cover, identify the project name, projectnumber, and “Return Book To:” the office address of the project manager.
Number all of the pages of the field book starting with the first entry. Record activities as they occur. Record only facts and observations,
regardless of whether they appear to be relevant at that time. Identify conditions or events that could affect/impede your ability to observe
conditions (e.g. snow-covered ground surface, inability to access areas ofinterest).
• Neatly cross out mistakes using a single line and initial them. Erasures arenot permitted.
o If an error is made on an entry in the field notebook, the individualwho made the entry should make the corrections. The correctionsmust be initialed and dated by the person making the correction.
Sign or initial and date the bottom of every page with an entry if the projectrequires such documentation.
Place a diagonal line through unused portions of a page. Record the following information upon each arrival at the site:
o Date/time/weather.o Personnel.o Purpose of visit/daily objectives.o People (client, contractor, landowners, etc.) present upon
arrival at site.
Appendix C
C-1

2 of 2
Record the following information during the course of the day:o Conversations with contractors/subcontractors, clients, visitors,
professional staff, landowners (site or abutters). If possible, record complete names, titles, and affiliations.
o Time of arrival and departure of individuals.o Activities as they occur.
Additional examples of observations to record may include and are not limitedto:
o Type and quantity of monitoring well construction materials used.o Use of field data sheets or electronic logging equipment (e.g. boring
logs, monitoring well sampling logs, etc.).o Ambient air monitoring data.o Field equipment calibration information.o Locations and descriptions of sampling points.o Contractor/Subcontractor progress.o Sample media (soil, sediment, groundwater, etc.).o Sample collection method.o Number and volume of sample(s) collected and sample bottle
preservatives used.o Sample identification number (s) and date and time of sample
collection.o Approximate volume of groundwater removed before sampling.o Any field observations made such as pH, temperature, turbidity,
conductivity, water level, etc.o References for maps and photographs of the sampling site(s).o Information pertaining to sample documentation: bottle lot numbers/
dates, method of sample shipments, chain-of custody recordnumbers, and overnight shipping numbers.
o Surveying data (including sketches with north arrows).o Changes in weather.o Rationale for critical field decisions.o Recommendations made to the client representative and/or
Project Manager(s).o Site sketch of conditions at the end of the day.o Summary of work completed/work remaining.o Allow time at the end of the day to complete entries in the
notebook.
3. AttachmentsAttachment A - Example Field Notes
C-2

Attachment A – Example Field Notes
Start of each day includes:•Date•Project Number•People on site•Purpose of Work•Weather Conditions
Errors are single line crossed out and initialed
Bottom of each page signed and dated
Blank Space crossed out and initialed
Each page is numbered
C-3

1 of 1
STANDARD OPERATING PROCEDURE Photo Documentation
1. ObjectiveDescribe methods to document and retain photographic records.
Keeping a record of photographs taken is crucial to their validity as a representation of existing conditions.
2. Execution Photographs of a site, individual samples, or other observations should be
taken using a digital camera. Set the camera to record the time and date for each photograph. All photographic records, along with the following information, should be
recorded in the field notebook (SOP FD-001).o If applicable, the compass direction describing the direction the
photograph was taken (e.g. looking southeast). This may not apply to photographs of individual samples.
o Brief description of what the photograph is intended to show. The field notebook should note who took the photographs. The photographs should be electronically backed up on a computer or other
data storage device. If photographs will be used in a report, memo, or letter, they should be placed
on a photograph record template and the relevant information describing thephotograph should be inserted into the caption section for each photograph.
3. Limitations Some clients and regulatory agencies require photographs of every subsurface
soil sample collected. These photographs typically include a “whiteboard” whichindicates the site, the boring ID, and the depth of the sample, while loggingdetails are recorded in the field notebook. Under these circumstances, it is notnecessary to include compass directions or descriptions.
C-4

1 of 3
STANDARD OPERATING PROCEDURE Sample Handling
1. ObjectiveDescribe appropriate environmental sample handling procedures.
The procedures include collection and transport of environmental samples to a laboratory for chemical analysis. Appropriate sample handling should ensure that samples are properly: labeled and documented; preserved; packaged; and transported
2. Execution Prior to mobilizing to the field, select a shipper or arrange for a courier for
sample delivery to the laboratory. If using a shipper (i.e., FedEx or UPS)determine the time constraints for pickup requests, the location and hours ofthe nearest shipping office, and any size/weight restrictions.
A waterproof or permanent ink pen should be used for all labels. The labelshould have an adhesive backing and be placed on the jar or bottle, not onthe cap. In addition, clear packing tape can be placed over the sample labelto secure it to the bottle as moisture from the samples can loosen the labeladhesive.
Record the following information on the label and in the field notebook (SeeSOPs FD-001 and FD-003):
o Project numbero Sample identification (i.e. MW-201 or SS-2)o Date and time (military time) of collectiono Sampler’s initialso Analysis methodso Preservative, if present
Pre-preserved laboratory jars are preferable and should be used wheneverpracticable. If sample jars are not pre-preserved, add preservative as appropriate.
At each sampling location, samples should be collected in order of volatility,most volatile first. Samples collected for volatile analysis should be placed insample containers immediately upon retrieval of the sample.
Aqueous samples for volatile analysis should be collected without air bubbles. The collection and preservation method of soil samples for volatile analysis
may depend on project, client, or state regulatory requirements. Check withyour Project Manager and/or SOPs SM-001 and SM-002 where appropriate.
C-5

2 of 3
Care must be taken to avoid getting soils on the threads of sample jars, whichcan cause a faulty seal.
If compositing samples in the field, specify the basis for composite (i.e.volume, weight, spoon recovery, etc.) and record in the field book theprocedure for compositing the sample.
Once samples have been collected and labeled, place samples in a coolerwith sufficient bagged ice or freezer packs (blue ice) (if allowed) to chillsamples to 4°C. If using ice, use double-bagged ice.
Complete the chain-of-custody (COC) (SOP FD-003). If transporting the samples by way of a shipper:
i. The sample cooler should have water drains securely sealed with ducttape, both on the inside and outside of the cooler.
ii. Place a layer of packing material on the bottom of the cooler as acushion.
iii. Individually wrap each sample bottle with bubble packing or suitablepacking material and place the wrapped bottles upright in the coolerwith sufficient packing material between samples to avoid breakage.
iv. Methanol preserved samples for volatiles analysis should be packedso they remain upright with the soil completely covered by themethanol during transport.
v. Place a layer of packing material on top of the sample bottles.vi. Place bagged ice or freezer packs on top of the packing material. Fill
the remaining space in the cooler with packing material to eliminate thepossibility of vertical movement of samples.
vii. Place the completed and signed chain-of-custody form in a sealableplastic bag and place on top of the packing material in the cooler, ortape it to the inside lid of the cooler.
viii. Fill out the appropriate shipping or courier forms and attach to the topor handle of the cooler. If necessary, place the proper shipping labelson the cooler. Have the courier sign the COC form (or write pickup byFEDEX, UPS, etc. with date and time). Place a signed and datedcustody seal on the cooler.
All samples should be submitted to the laboratory as soon as possible. Inmany cases, same day shipping will be required by the client or the projectmanager. Be clear on this before beginning the field work.
A copy of the waybills should be kept by the field supervisor to trackshipments if necessary.
3. Limitations If samples are shipped on a Friday, call the laboratory ahead of time to
confirm that personnel will be at the laboratory to receive and log-in thesamples.
During warm weather, make sure to use plenty of ice in the shippingcontainer.
C-6

3 of 3
Field personnel should be aware of analyses which have short hold times andschedule sampling events and shipping accordingly. Shipment of samples foranalyses with short hold times must be arranged for in advance. Refer to theproject work plan, quality assurance project plan, or state/federal regulationsfor holding time and preservative information. Contact the laboratory aheadof time when shipping samples with short hold time to ensure the lab isprepared for these analyses.
For glassware containing preservatives (e.g., HCl, HNO3
Never composite samples for VOCs in the field. Collect individual aliquotsand direct the laboratory to perform compositing, if needed.
), take care not to overfill the container, thus flushing the preservative out of the bottle.
Collection of aqueous samples should not be performed over the opening of amonitoring well. Preservatives from overfilling, a marker pen or other objectscould fall into the well.
If the recharge volume for a monitoring well is low, completely fill all volatilevials and then collect the minimum sample volume required for eachremaining analysis.
During subsurface soil sampling, if the recovery from the split-spoon sampleis inadequate, if appropriate, resample the bottom of the borehole to obtainproper sample volume.
Laboratories will homogenize and test the contents of the sample container,unless directed otherwise. Samples should not contain rocks, twigs, leaves,etc… unless these materials are of interest.
C-7

1 of 3
STANDARD OPERATING PROCEDURESample Management and Chain of Custody
1. ObjectiveDescribe methods to label sample containers, manage the samples, and prepareChain of Custody documentation for the samples. Sample transport is alsoaddressed.
2. Project SetupWhen setting up a sampling event, inform the recipients of the samples(laboratories) and recipients of laboratory results (data group and project managers).Discuss with the laboratory the sampling media, turnaround times, and reportinglimits for appropriate regulatory criteria for the site. Include the data group oncorrespondence so that turnaround times, data validation, and project deliverableschedules can be tracked successfully. Laboratory - Number of samples, analyses needed: bottle orders and holding
times, turnaround times needed, reporting limits needed for regulatory criteria. Data group - Number of samples, analyses requested, turnaround times and
reporting limits requested, data validation needed, regulatory criteria to usefor tabulating results, deliverables needed, and project name and number.
Schedule - Inform the laboratory and Data Group of schedule delays,changes to analyses, and expediting.
3. Sampling Execution Review the work plan prior to sampling to determine the following:
o Sample matrix and sampling method.o Required analysis and sample volumes.o Sample container type and preservative requirements.o Required analysis methods and/or report formats.o The turnaround time required by the project.o If the data will be sent directly from the laboratory to the data validator,
Project Manager, or Data Group.o Holding time restrictions for sampling media and analytical methods.o Sample naming convention used for this project site.
Sample labels should be filled out using a waterproof or permanent marker orpen. Required information includes:
o Sample ID.o Date and time of sample collection.o Project number.o Sample preservatives.o Sampler’s initials.o Laboratory analytical methods.
C-8

2 of 3
Place the label on the jar or bottle, not on the cap. Sample custody begins atthis time.
Record the above information in the field notebook. Individually wrap sample jars with packing material, if needed. Place
samples in a cooler with bagged ice or freezer packs (blue ice) immediately after collection. Add sufficient ice or freezer packs to cool samples to approximately 4°C.
Complete a chain of custody (COC) for the samples as described below. Laboratory COCs may be used as long as they contain fields for all required sample information as described in Section 2.1.
3.1. Chain-of-Custody (COC) Completion Fill out COC neatly and in permanent ink. Alternatively, an Excel version of
the COC is available and can be filled out electronically. Certain analyses (i.e. air analysis by TO-15) require specialized, laboratory
issued COCs. Make sure any specialized COCs are available before samplecollection.
Record the project name and number, the sampler’s name(s) and the statewhere the samples were collected.
For each sample, enter the sample identification number, date and time(military time) collected, the number of sample containers, and any additionalinformation to fulfill project, client or regulatory requirements.
Record the type of analysis (including laboratory method; e.g. EPA-SW846Method XX) requested and the preservative (if appropriate) in the verticalboxes.
Field duplicates should be anonymous to the laboratory, but must be recorded for use by the Data Group. To keep track of this information, link the field duplicate with the proper sample in the field notebook. If required by the Project Manager or Data Group, also document this information on or attach a note to a copy of the COC.
Trip blanks for large sites should be named similar to the samples they arecollected with so that there are not two of the same sample name for thesame site. For example, “OU1TB-122509” and “OU3TB-122509” would avoidany mistakes.
Strike incorrect entries on the COC with a single line, followed by the initialsof the person making the correction, the date, and the correct entry.
When sample custody is ready to be relinquished, complete the bottom of the form with date and time (military time) and signatures of relinquisher and receiver of samples as indicated. The sample collector is always the first signature while the analytical laboratory is the final signature. Theoretically, all individuals handling the samples between collection and laboratory should sign the form; however, if a common carrier (i.e., Federal Express, UPS) is used for shipping, the carrier must be identified in the ‘Received by’ box on the
C-9

3 of 3
COC. If the sampler hand delivers the samples to the laboratory, the received box must be signed by the laboratory.
If the samples are placed in a designated secure area (e.g. samplefridge), note this location in the “Received by” box on the COC.
Single sheet and triplicate COCs are utilized. If using the triplicate COCs(white, yellow, and pink copies), the pink copy should be retained by thesampling personnel and provided to the Data Group for proper filing. Thewhite and yellow copies should accompany the samples to the laboratory.
If you are using the single sheet COC, make a copy of the COC after it hasbeen signed by the lab courier and forward it to the Data Group.
Prior to sample shipment by common carrier, the COC must be placed insidethe cooler in a Ziplock bag or other watertight package.
If a common carrier such as FedEx is used to transport the samples to thelaboratory, include the carrier tracking number and identify the carrier in the“Received by” box on the COC.
If a courier is used to transport samples to the laboratory the courier signs the COC in the “Received by” box.
Place a custody seal on the cooler if shipping via common carrier. Transport samples to the laboratory as soon as possible. It is preferable to
transport the samples directly to the laboratory from the field. Samplesbrought back to the office for storage prior to submission to the laboratorymust be kept cold (4° C).
Unused sampling containers/media that are sent back to the lab should beincluded on a separate COC.
4. Limitations Keep the number of people involved in handling samples to a minimum. Where practical, only allow people associated with the project to handle the
samples. Always document the transfer of samples from one person to another on the
COC. The COC should always accompany the samples. Give samples positive identification at all times that is legible and written with
waterproof or permanent ink. When sending samples via a common carrier, use one COC per package. Where practical, avoid sending samples from more than one site with
separate COCs in a single package.
C-10
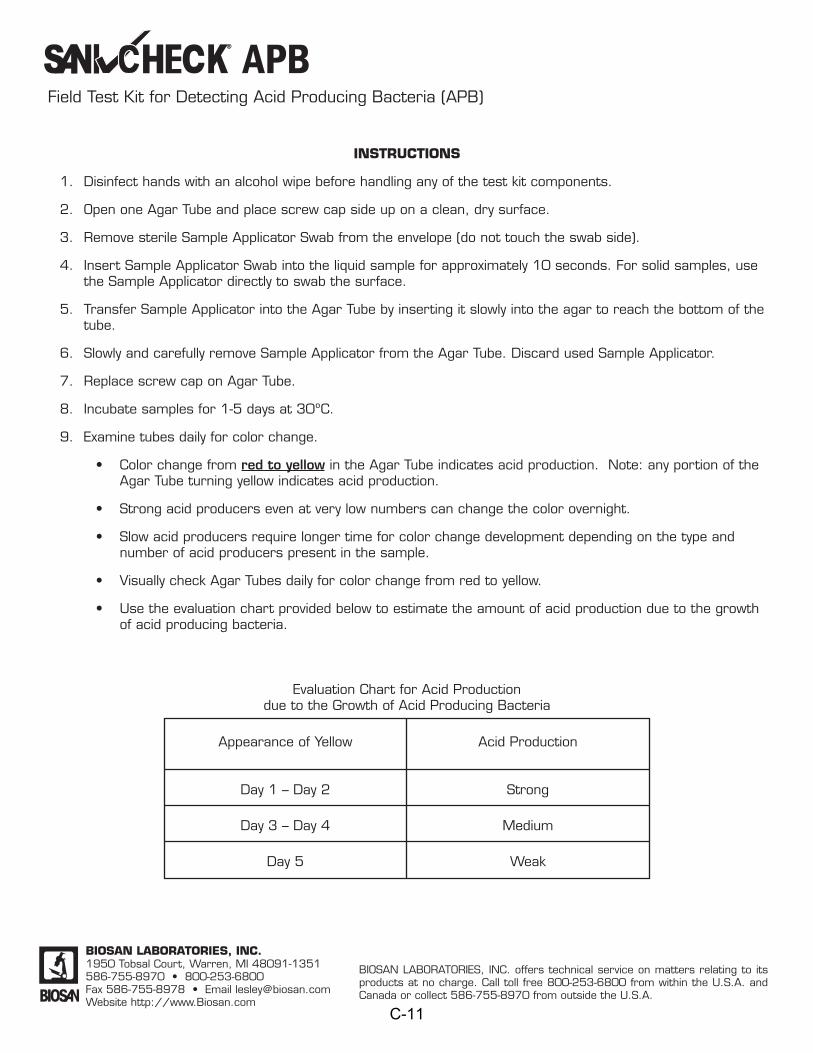
® APBField Test Kit for Detecting Acid Producing Bacteria (APB)
INSTRUCTIONS
1. Disinfect hands with an alcohol wipe before handling any of the test kit components.
2. Open one Agar Tube and place screw cap side up on a clean, dry surface.
3. Remove sterile Sample Applicator Swab from the envelope (do not touch the swab side).
4. Insert Sample Applicator Swab into the liquid sample for approximately 10 seconds. For solid samples, use the Sample Applicator directly to swab the surface.
5. Transfer Sample Applicator into the Agar Tube by inserting it slowly into the agar to reach the bottom of the tube.
6. Slowly and carefully remove Sample Applicator from the Agar Tube. Discard used Sample Applicator.
7. Replace screw cap on Agar Tube.
8. Incubate samples for 1-5 days at 30ºC.
9. Examine tubes daily for color change.
• Color change from red to yellow in the Agar Tube indicates acid production. Note: any portion of the Agar Tube turning yellow indicates acid production.
• Strong acid producers even at very low numbers can change the color overnight.
• Slow acid producers require longer time for color change development depending on the type and number of acid producers present in the sample.
• Visually check Agar Tubes daily for color change from red to yellow.
• Use the evaluation chart provided below to estimate the amount of acid production due to the growth of acid producing bacteria.
Appearance of Yellow
Day 1 – Day 2
Day 3 – Day 4
Day 5
Acid Production
Strong
Medium
Weak
Evaluation Chart for Acid Production due to the Growth of Acid Producing Bacteria
BIOSAN LABORATORIES, INC.1950 Tobsal Court, Warren, MI 48091-1351586-755-8970 • 800-253-6800Fax 586-755-8978 • Email [email protected] http://www.Biosan.com
BIOSAN LABORATORIES, INC. offers technical service on matters relating to its products at no charge. Call toll free 800-253-6800 from within the U.S.A. and Canada or collect 586-755-8970 from outside the U.S.A.
C-11

C-12
![[BIOTA CONVENTION]. PROGRAMMEbiotaph.org/wp-content/uploads/2012/04/BIOTA-CONVENTION-2012... · BIOTA Hymn Ateneo de Naga University Choir ... Bicol University 9:30 AM SNACK ... [BIOTA](https://img.pdfslide.net/doc/110x75/5b786cae7f8b9a7f378b8034/biota-convention-biota-hymn-ateneo-de-naga-university-choir-bicol-university.jpg)