Embed Size (px)
Citation preview
EnBW Investor Presentation»
October 2018

Overview
2
En
BW
In
vest
or
Pre
sen
tati
on
Company Presentation page 3
Green Financing Framework page 7
Eligible Projects page 15
Appendix page 25
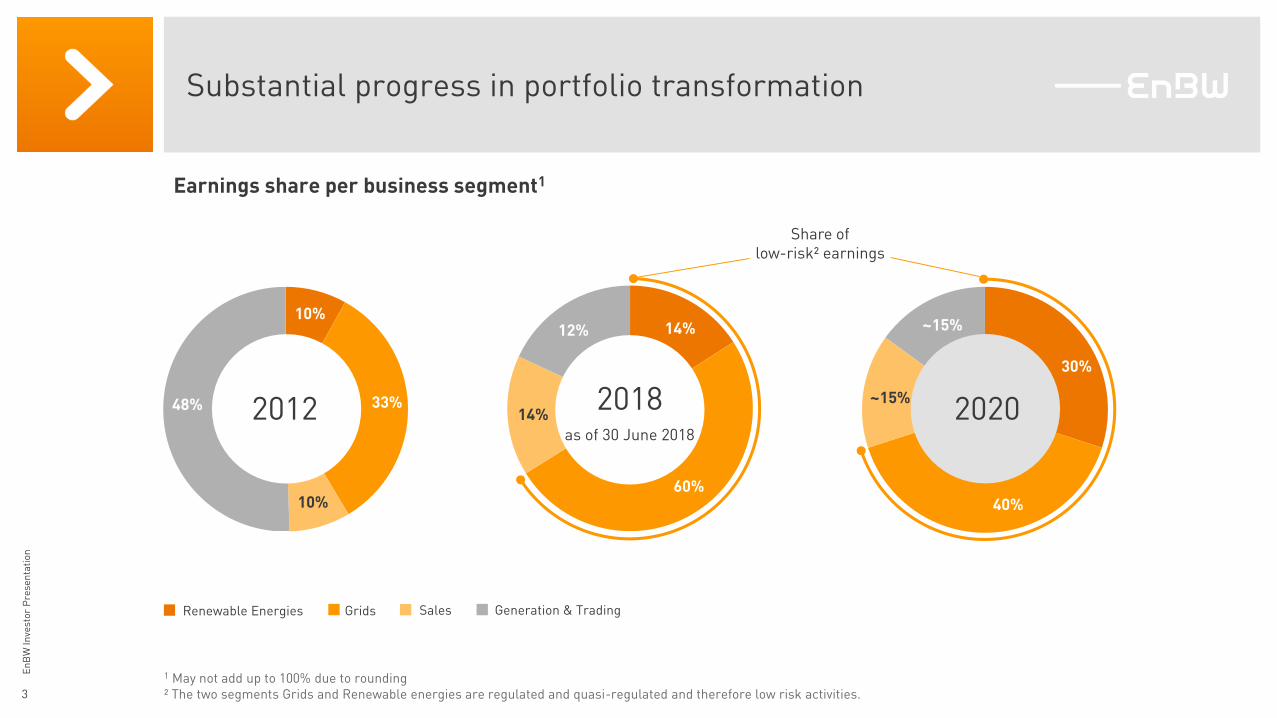
Substantial progress in portfolio transformation
3
En
BW
In
vest
or
Pre
sen
tati
on
Earnings share per business segment1
SalesGridsRenewable Energies Generation & Trading
30%
~15%
~15%
40%
10%
33%48%
10%
20202012 2018as of 30 June 2018
Share of low-risk² earnings
14%
60%
14%
12%
1 May not add up to 100% due to rounding² The two segments Grids and Renewable energies are regulated and quasi-regulated and therefore low risk activities.
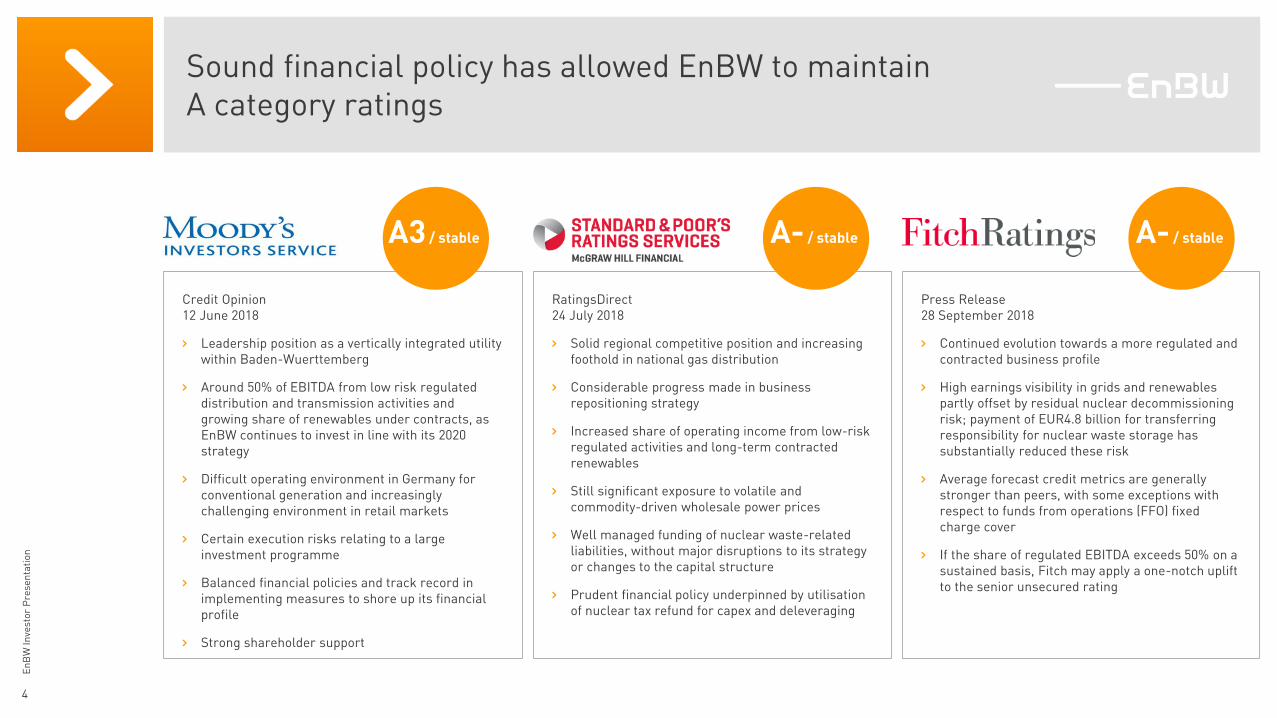
Sound financial policy has allowed EnBW to maintain A category ratings
4
En
BW
In
vest
or
Pre
sen
tati
on
RatingsDirect24 July 2018
› Solid regional competitive position and increasing foothold in national gas distribution
› Considerable progress made in business repositioning strategy
› Increased share of operating income from low-risk regulated activities and long-term contracted renewables
› Still significant exposure to volatile and commodity-driven wholesale power prices
› Well managed funding of nuclear waste-related liabilities, without major disruptions to its strategy or changes to the capital structure
› Prudent financial policy underpinned by utilisationof nuclear tax refund for capex and deleveraging
Credit Opinion 12 June 2018
› Leadership position as a vertically integrated utility within Baden-Wuerttemberg
› Around 50% of EBITDA from low risk regulated distribution and transmission activities and growing share of renewables under contracts, as EnBW continues to invest in line with its 2020 strategy
› Difficult operating environment in Germany for conventional generation and increasingly challenging environment in retail markets
› Certain execution risks relating to a large investment programme
› Balanced financial policies and track record in implementing measures to shore up its financial profile
› Strong shareholder support
Press Release28 September 2018
› Continued evolution towards a more regulated and contracted business profile
› High earnings visibility in grids and renewables partly offset by residual nuclear decommissioning risk; payment of EUR4.8 billion for transferring responsibility for nuclear waste storage has substantially reduced these risk
› Average forecast credit metrics are generally stronger than peers, with some exceptions with respect to funds from operations (FFO) fixed charge cover
› If the share of regulated EBITDA exceeds 50% on a sustained basis, Fitch may apply a one-notch uplift to the senior unsecured rating
A- / stableA3 / stable A- / stable
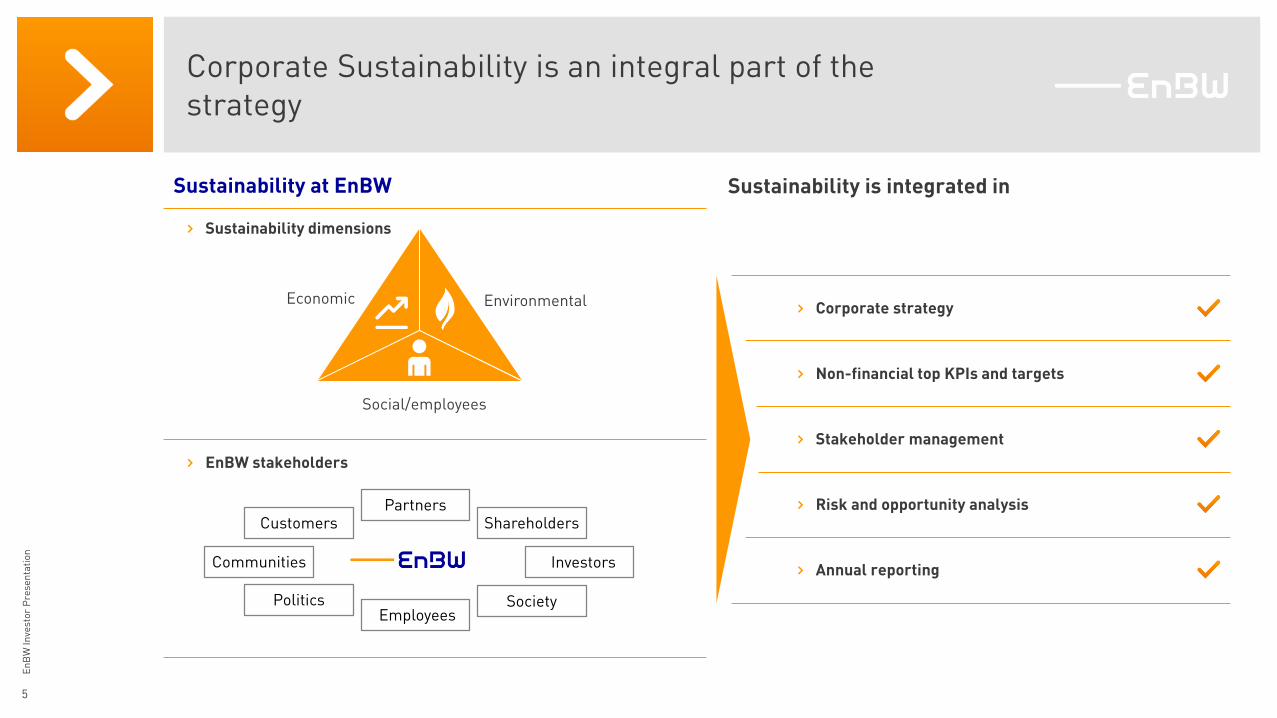
Corporate Sustainability is an integral part of the strategy
5
En
BW
In
vest
or
Pre
sen
tati
on
› Corporate strategy
› Non-financial top KPIs and targets
› Stakeholder management
› Risk and opportunity analysis
› Annual reporting
Sustainability at EnBW
Society
Partners
Politics
Customers
Investors
Employees
Communities
Shareholders
Sustainability is integrated in
Economic
Social/employees
Environmental
› Sustainability dimensions
› EnBW stakeholders
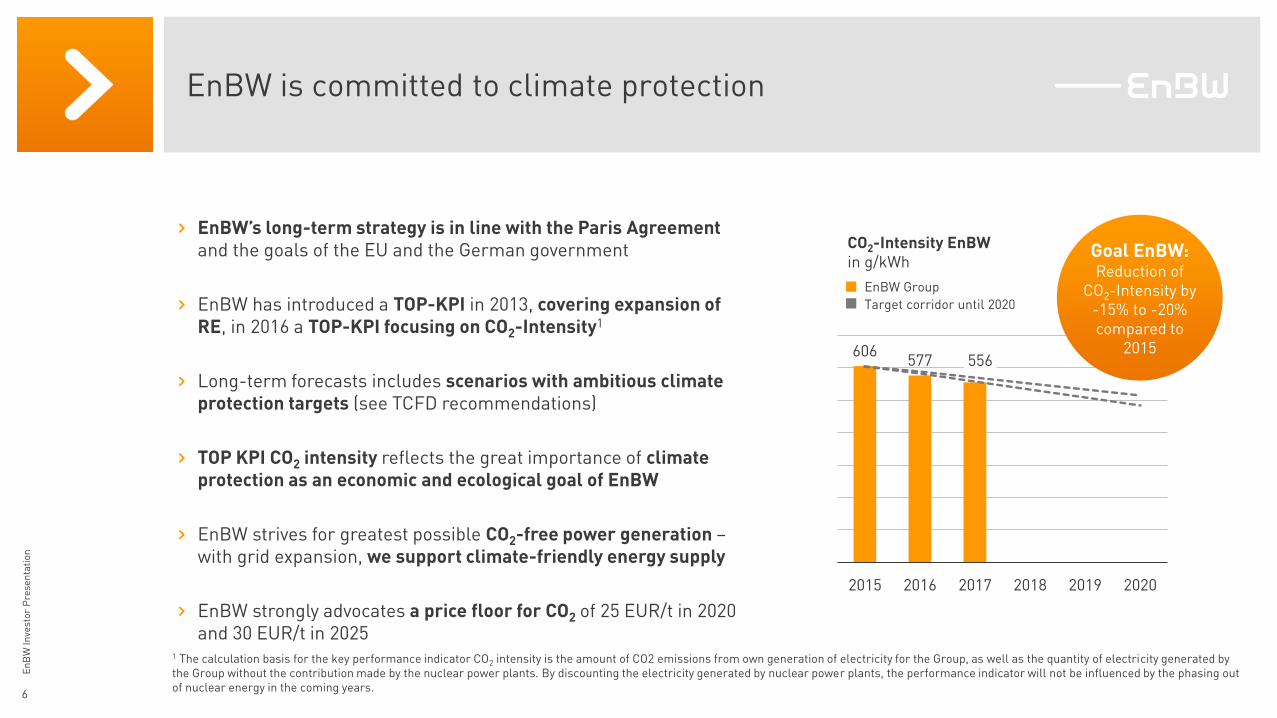
EnBW is committed to climate protection
1 The calculation basis for the key performance indicator CO2 intensity is the amount of CO2 emissions from own generation of electricity for the Group, as well as the quantity of electricity generated by the Group without the contribution made by the nuclear power plants. By discounting the electricity generated by nuclear power plants, the performance indicator will not be influenced by the phasing out of nuclear energy in the coming years.
6
606577 556
2015 2016 2017 2018 2019 2020
CO2-Intensity EnBWin g/kWh
EnBW Group
Target corridor until 2020
Goal EnBW: Reduction of
CO2-Intensity by-15% to -20% compared to
2015
› EnBW’s long-term strategy is in line with the Paris Agreementand the goals of the EU and the German government
› EnBW has introduced a TOP-KPI in 2013, covering expansion of RE, in 2016 a TOP-KPI focusing on CO2-Intensity1
› Long-term forecasts includes scenarios with ambitious climate protection targets (see TCFD recommendations)
› TOP KPI CO2 intensity reflects the great importance of climate protection as an economic and ecological goal of EnBW
› EnBW strives for greatest possible CO2-free power generation –with grid expansion, we support climate-friendly energy supply
› EnBW strongly advocates a price floor for CO2 of 25 EUR/t in 2020 and 30 EUR/t in 2025
En
BW
In
vest
or
Pre
sen
tati
on
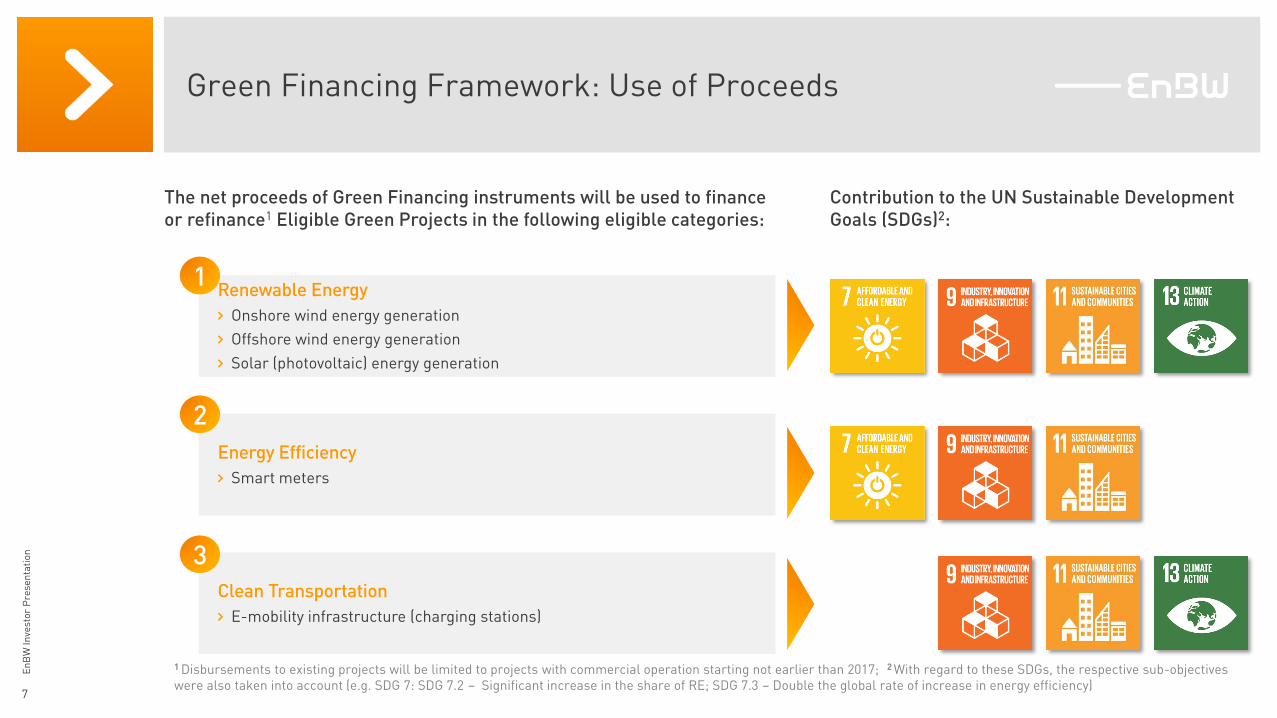
Green Financing Framework: Use of Proceeds
The net proceeds of Green Financing instruments will be used to financeor refinance1 Eligible Green Projects in the following eligible categories:
Renewable Energy
› Onshore wind energy generation
› Offshore wind energy generation
› Solar (photovoltaic) energy generation
Energy Efficiency
› Smart meters
Clean Transportation
› E-mobility infrastructure (charging stations)
1 Disbursements to existing projects will be limited to projects with commercial operation starting not earlier than 2017; 2 With regard to these SDGs, the respective sub-objectives were also taken into account (e.g. SDG 7: SDG 7.2 – Significant increase in the share of RE; SDG 7.3 – Double the global rate of increase in energy efficiency)
Contribution to the UN Sustainable Development Goals (SDGs)2:
2
3
1
7
En
BW
In
vest
or
Pre
sen
tati
on
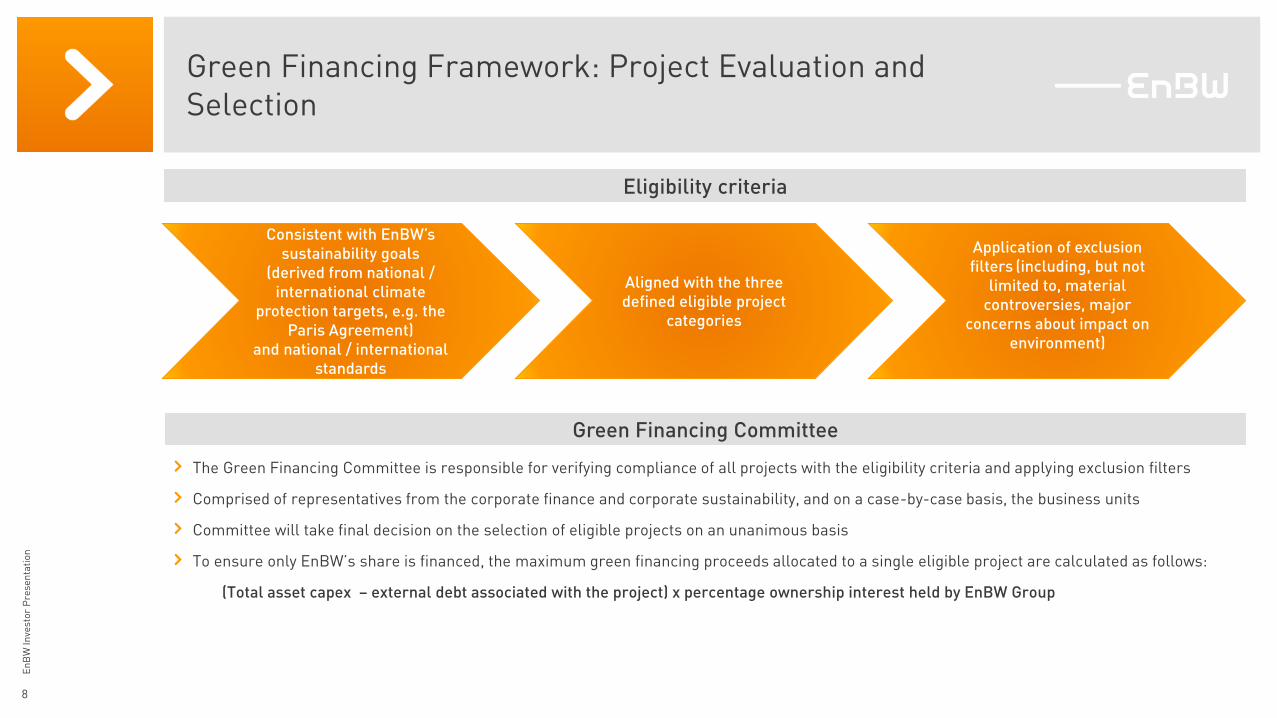
Green Financing Framework: Project Evaluation and Selection
› The Green Financing Committee is responsible for verifying compliance of all projects with the eligibility criteria and applying exclusion filters
› Comprised of representatives from the corporate finance and corporate sustainability, and on a case-by-case basis, the business units
› Committee will take final decision on the selection of eligible projects on an unanimous basis
› To ensure only EnBW’s share is financed, the maximum green financing proceeds allocated to a single eligible project are calculated as follows:
(Total asset capex – external debt associated with the project) x percentage ownership interest held by EnBW Group
Eligibility criteria
Green Financing Committee
Consistent with EnBW’s sustainability goals
(derived from national / international climate
protection targets, e.g. the Paris Agreement)
and national / international standards
Aligned with the three defined eligible project
categories
Application of exclusion filters (including, but not
limited to, material controversies, major
concerns about impact on environment)
8
En
BW
In
vest
or
Pre
sen
tati
on
Green Financing Framework: Relevant criteria for the selection of projects (ESG/CSR-Standards, -Initiatives)
9
En
BW
In
vest
or
Pre
sen
tati
on
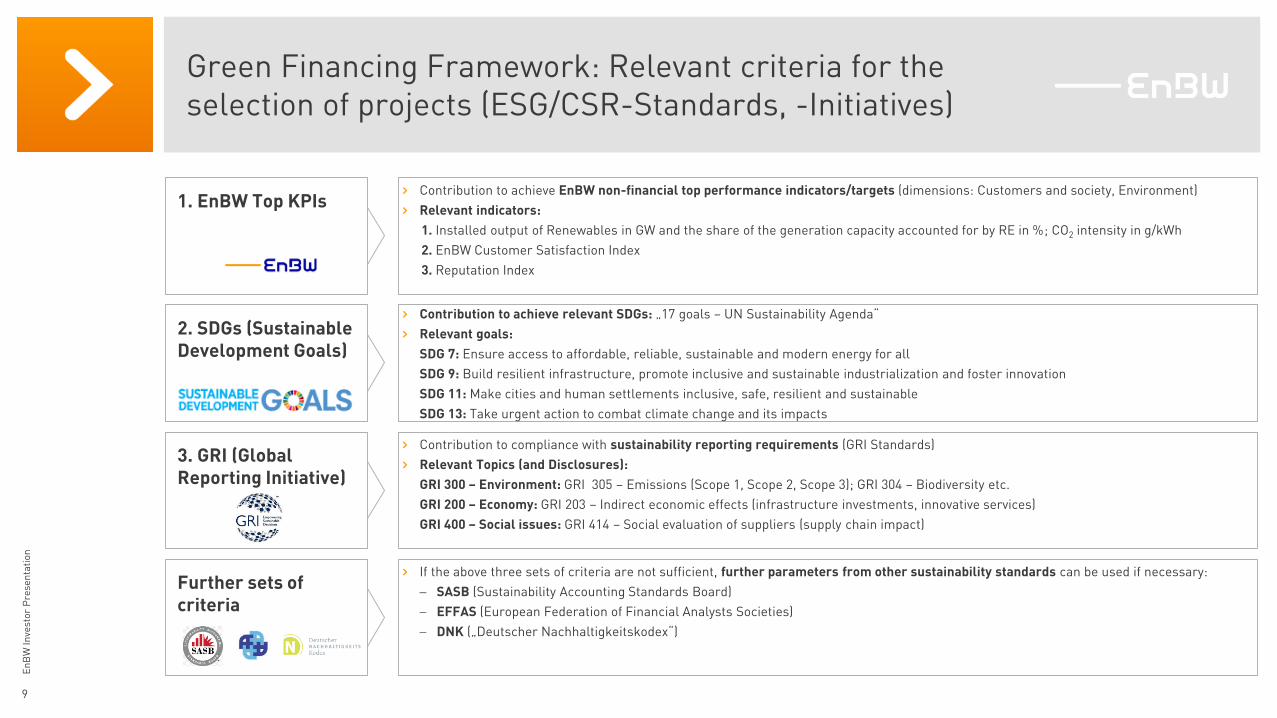
1. EnBW Top KPIs› Contribution to achieve EnBW non-financial top performance indicators/targets (dimensions: Customers and society, Environment)
› Relevant indicators:
1. Installed output of Renewables in GW and the share of the generation capacity accounted for by RE in %; CO2 intensity in g/kWh
2. EnBW Customer Satisfaction Index
3. Reputation Index
2. SDGs (SustainableDevelopment Goals)
› Contribution to achieve relevant SDGs: „17 goals – UN Sustainability Agenda“
› Relevant goals:
SDG 7: Ensure access to affordable, reliable, sustainable and modern energy for all
SDG 9: Build resilient infrastructure, promote inclusive and sustainable industrialization and foster innovation
SDG 11: Make cities and human settlements inclusive, safe, resilient and sustainable
SDG 13: Take urgent action to combat climate change and its impacts
3. GRI (Global Reporting Initiative)
› Contribution to compliance with sustainability reporting requirements (GRI Standards)
› Relevant Topics (and Disclosures):
GRI 300 – Environment: GRI 305 – Emissions (Scope 1, Scope 2, Scope 3); GRI 304 – Biodiversity etc.
GRI 200 – Economy: GRI 203 – Indirect economic effects (infrastructure investments, innovative services)
GRI 400 – Social issues: GRI 414 – Social evaluation of suppliers (supply chain impact)
Further sets ofcriteria
› If the above three sets of criteria are not sufficient, further parameters from other sustainability standards can be used if necessary:
SASB (Sustainability Accounting Standards Board)
EFFAS (European Federation of Financial Analysts Societies)
DNK („Deutscher Nachhaltigkeitskodex“)
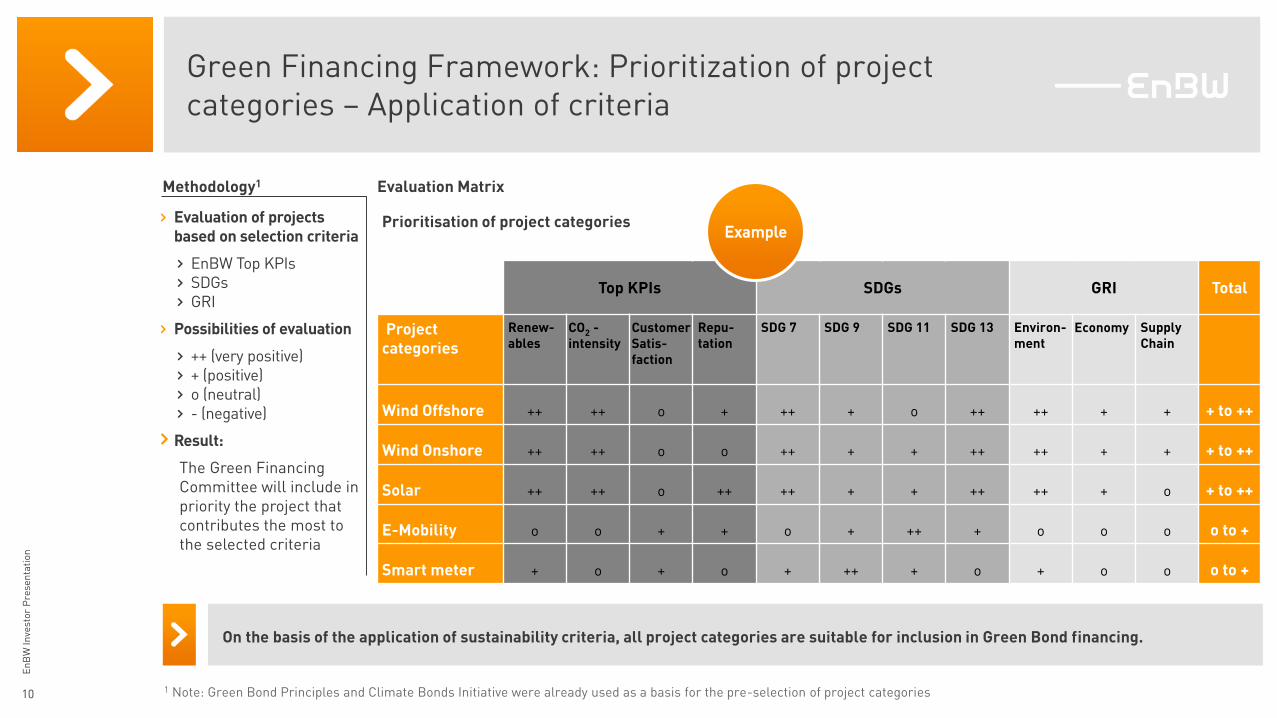
Green Financing Framework: Prioritization of project categories – Application of criteria
10
En
BW
In
vest
or
Pre
sen
tati
on
Methodology1
› Evaluation of projects based on selection criteria
› EnBW Top KPIs› SDGs › GRI
› Possibilities of evaluation
› ++ (very positive)› + (positive)› o (neutral)› - (negative)
› Result:
The Green Financing Committee will include in priority the project that contributes the most to the selected criteria
Evaluation Matrix
On the basis of the application of sustainability criteria, all project categories are suitable for inclusion in Green Bond financing.
Prioritisation of project categories
Top KPIs SDGs GRI Total
Project categories
Renew-ables
CO2 -intensity
CustomerSatis-faction
Repu-tation
SDG 7 SDG 9 SDG 11 SDG 13 Environ-ment
Economy Supply Chain
Wind Offshore ++ ++ o + ++ + o ++ ++ + + + to ++
Wind Onshore ++ ++ o o ++ + + ++ ++ + + + to ++
Solar ++ ++ o ++ ++ + + ++ ++ + o + to ++
E-Mobility o o + + o + ++ + o o o o to +
Smart meter + o + o + ++ + o + o o o to +
1 Note: Green Bond Principles and Climate Bonds Initiative were already used as a basis for the pre-selection of project categories
Example
2 3
4 5 6
1
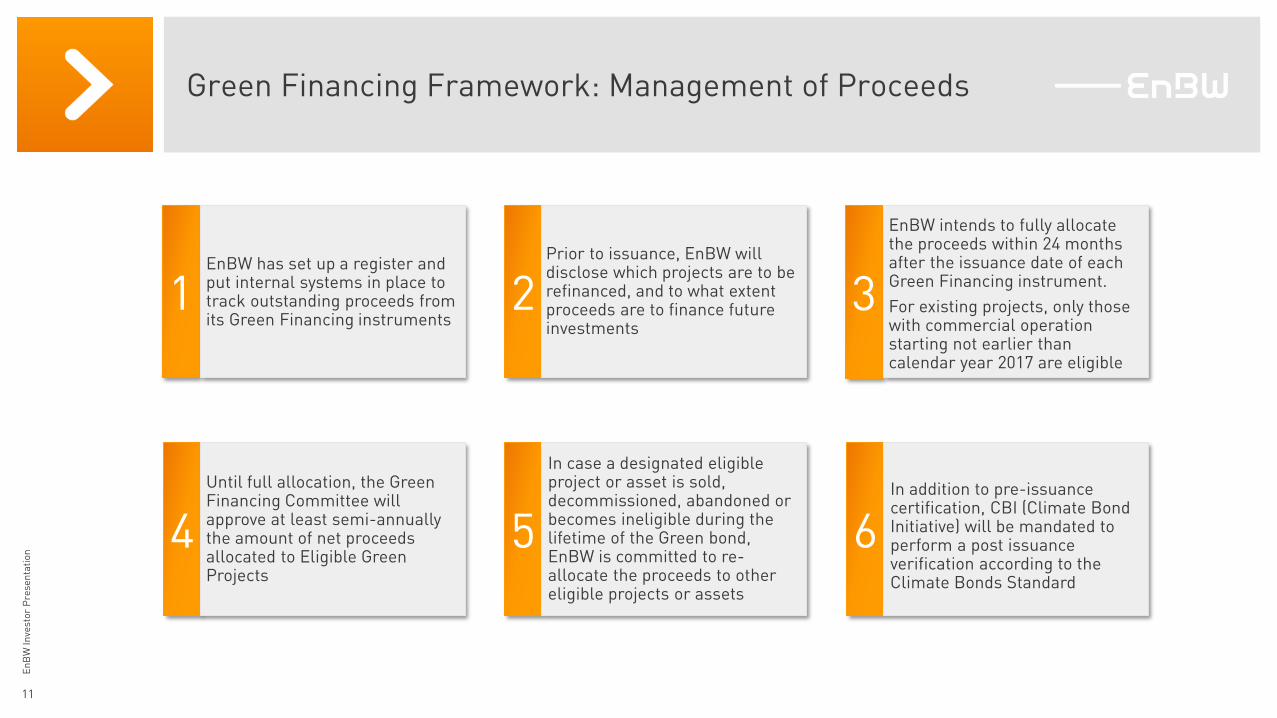
Green Financing Framework: Management of Proceeds
11
EnBW has set up a register and put internal systems in place to track outstanding proceeds from its Green Financing instruments
Prior to issuance, EnBW will disclose which projects are to be refinanced, and to what extent proceeds are to finance future investments
EnBW intends to fully allocate the proceeds within 24 months after the issuance date of each Green Financing instrument.
For existing projects, only those with commercial operation starting not earlier than calendar year 2017 are eligible
Until full allocation, the Green Financing Committee will approve at least semi-annually the amount of net proceeds allocated to Eligible Green Projects
In case a designated eligible project or asset is sold, decommissioned, abandoned or becomes ineligible during the lifetime of the Green bond, EnBW is committed to re-allocate the proceeds to other eligible projects or assets
En
BW
In
vest
or
Pre
sen
tati
on
In addition to pre-issuance certification, CBI (Climate Bond Initiative) will be mandated to perform a post issuance verification according to the Climate Bonds Standard
Green Financing Framework: Reporting
EnBW will report1, annually and until the maturity of its outstanding Green Bonds, on the use of proceeds and environmental impact
Allocation Reporting
› List of projects financed with some individual information› Total funds allocated (with breakdown per type of project and breakdown of proceeds allocation between new financing and
refinancing)› The amount of unallocated proceeds
Impact Reporting
1 Available on EnBW’s website: https://www.enbw.com/company/investors/
2
1
Eligible Category Key Performance IndicatorsPer project Per category
Renewable Energy
Energy Efficiency
Clean Transportation
✓ Installed capacity (MW) attributable to the financing instrument
✓ [Expected] annual energy produced (MWh p.a.)
✓ [Expected] annual GHG emissions avoided (tCO2)
✓ Physical indicator, e.g. smart meters (total and attributable number)
✓ Physical indicator, e.g. charging stations, charging procedures (total and attributable number)
12
En
BW
In
vest
or
Pre
sen
tati
on
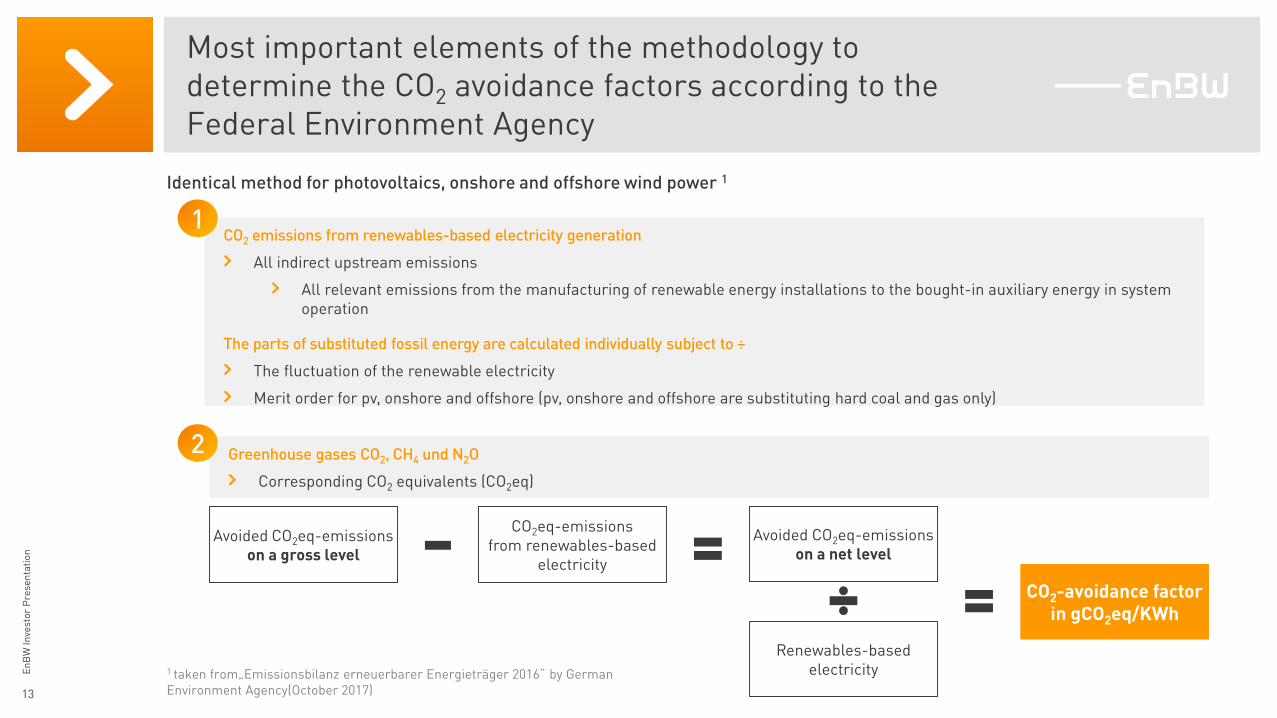
Greenhouse gases CO2, CH4 und N2O
› Corresponding CO2 equivalents (CO2eq)
Most important elements of the methodology todetermine the CO2 avoidance factors according to theFederal Environment Agency
Identical method for photovoltaics, onshore and offshore wind power 1
CO2 emissions from renewables-based electricity generation
› All indirect upstream emissions
› All relevant emissions from the manufacturing of renewable energy installations to the bought-in auxiliary energy in systemoperation
The parts of substituted fossil energy are calculated individually subject to ÷
› The fluctuation of the renewable electricity
› Merit order for pv, onshore and offshore (pv, onshore and offshore are substituting hard coal and gas only)
2
1
13
En
BW
In
vest
or
Pre
sen
tati
on
CO2eq-emissions from renewables-based
electricity
Avoided CO2eq-emissions on a gross level
Avoided CO2eq-emissions on a net level
CO2-avoidance factorin gCO2eq/KWh
1 taken from„Emissionsbilanz erneuerbarer Energieträger 2016“ by German Environment Agency(October 2017)
Renewables-basedelectricity
Green Financing Framework: External Review
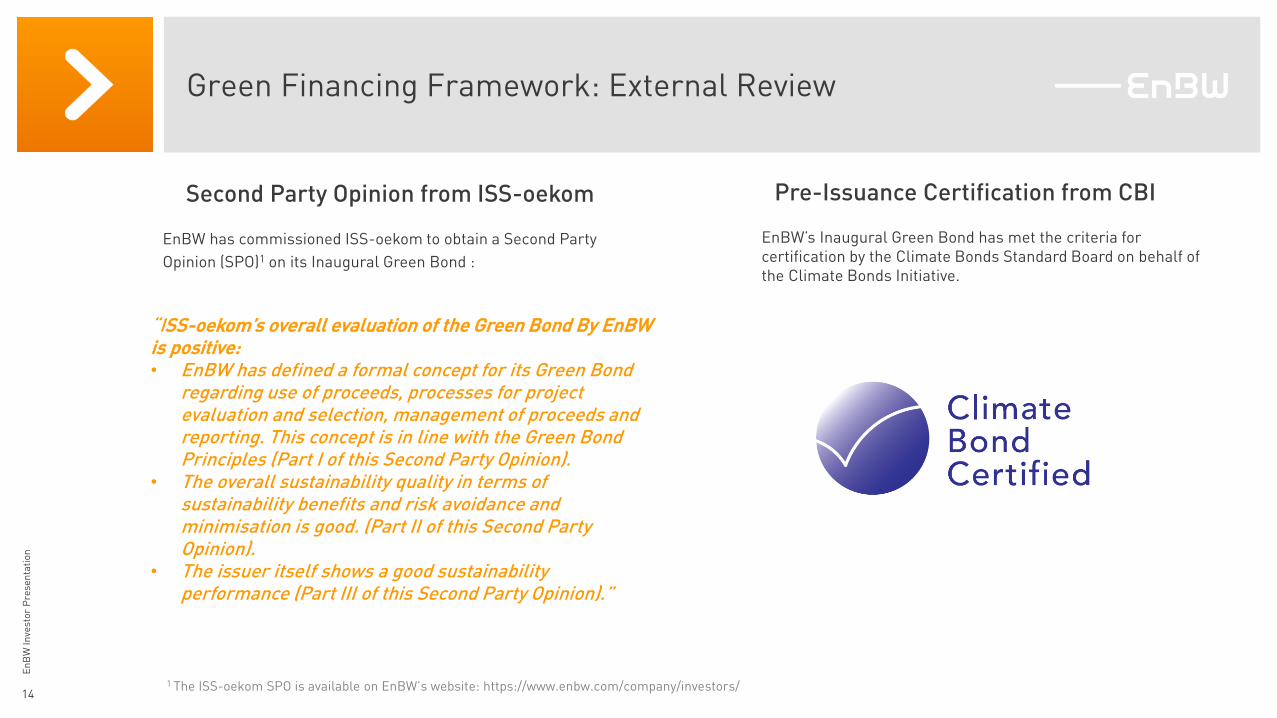
Second Party Opinion from ISS-oekom
“ISS-oekom’s overall evaluation of the Green Bond By EnBW is positive:• EnBW has defined a formal concept for its Green Bond
regarding use of proceeds, processes for project evaluation and selection, management of proceeds and reporting. This concept is in line with the Green Bond Principles (Part I of this Second Party Opinion).
• The overall sustainability quality in terms of sustainability benefits and risk avoidance and minimisation is good. (Part II of this Second Party Opinion).
• The issuer itself shows a good sustainability performance (Part III of this Second Party Opinion).”
Pre-Issuance Certification from CBI
EnBW has commissioned ISS-oekom to obtain a Second Party
Opinion (SPO)1 on its Inaugural Green Bond :
1 The ISS-oekom SPO is available on EnBW’s website: https://www.enbw.com/company/investors/14
En
BW
In
vest
or
Pre
sen
tati
on
EnBW’s Inaugural Green Bond has met the criteria for certification by the Climate Bonds Standard Board on behalf of the Climate Bonds Initiative.
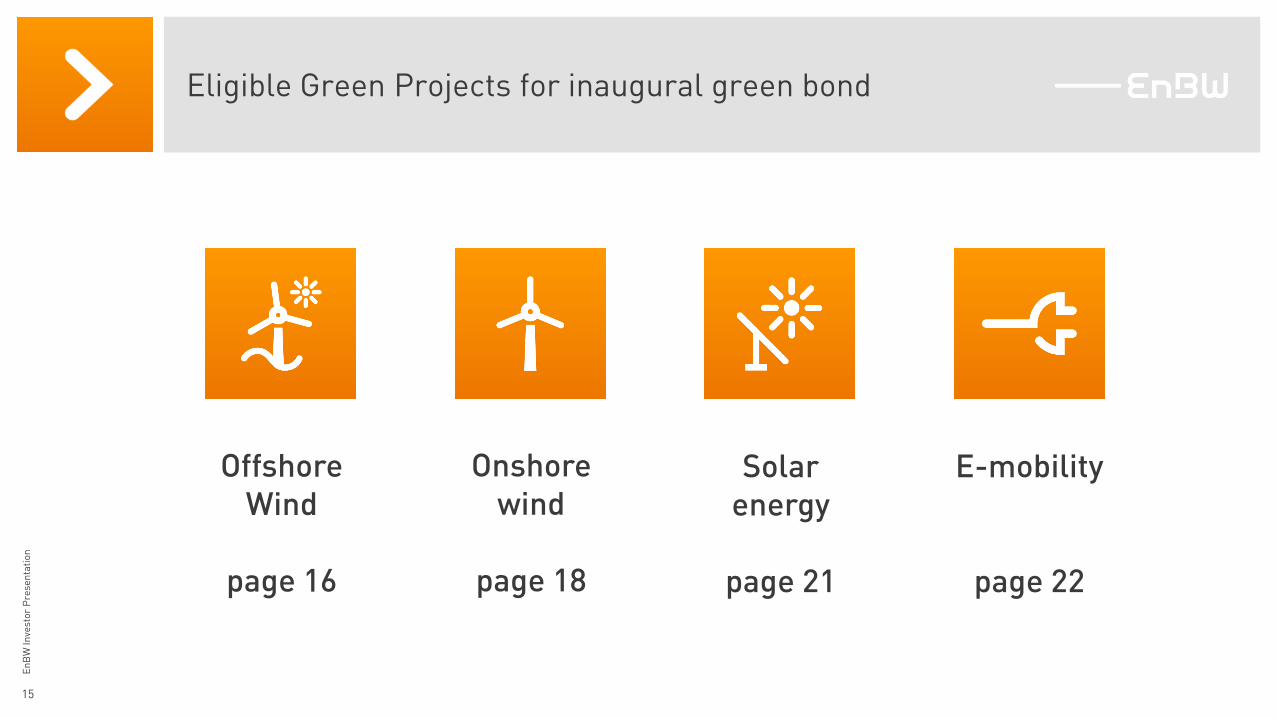
Eligible Green Projects for inaugural green bond
Offshore Wind
page 16
Solar energy
page 21
E-mobility
page 22
Onshorewind
page 18
15
En
BW
In
vest
or
Pre
sen
tati
on
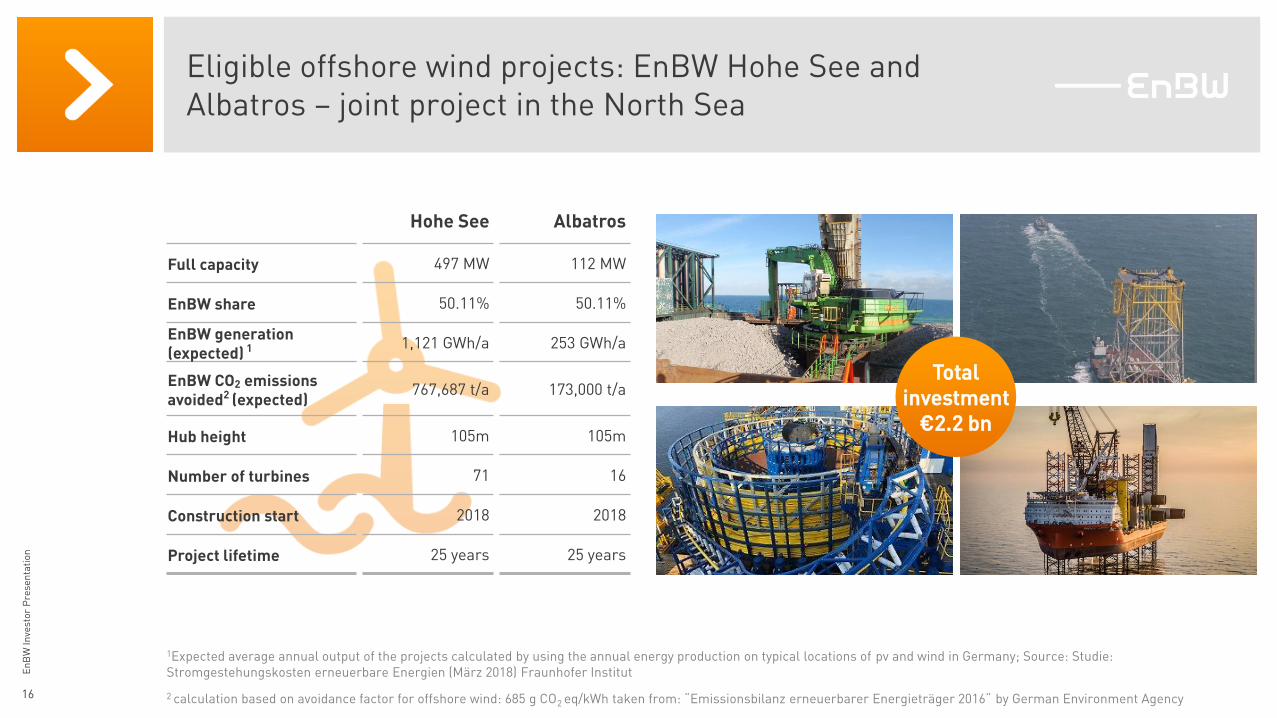
Eligible offshore wind projects: EnBW Hohe See and Albatros – joint project in the North Sea
1Expected average annual output of the projects calculated by using the annual energy production on typical locations of pv and wind in Germany; Source: Studie: Stromgestehungskosten erneuerbare Energien (März 2018) Fraunhofer Institut
2 calculation based on avoidance factor for offshore wind: 685 g CO2 eq/kWh taken from: “Emissionsbilanz erneuerbarer Energieträger 2016“ by German Environment Agency16
Hohe See Albatros
Full capacity 497 MW 112 MW
EnBW share 50.11% 50.11%
EnBW generation(expected) 1 1,121 GWh/a 253 GWh/a
EnBW CO2 emissionsavoided2 (expected)
767,687 t/a 173,000 t/a
Hub height 105m 105m
Number of turbines 71 16
Construction start 2018 2018
Project lifetime 25 years 25 years
En
BW
In
vest
or
Pre
sen
tati
on
Totalinvestment
€2.2 bn
Examples for environmental measures:EnBW Hohe See and Albatros
17
Approvals and assessments in application phase
› Framework of the approval procedure for offshore wind farms in the Exclusive Economic Zone (EEZ) is in place
• Potential adverse impacts of the planned facilities on the marine environment had to be assessed
› In line with the German regulation, an Environmental Impact Assessment (EIA) was mandatory
Environmental measures in construction phase e.g.
› Mitigation of sound and light emissions by vessels and machinery
• IHC Noise Mitigation System is combination of two well introduced systems
• Double walled cladding tube surrounded by a double big bubble curtain
• A big bubble curtain is a system of hoses on the seabed
• Hoses are under pressure, the air flows through little holes and builds a “curtain” of air bubbles in the water
› Reduction of pollutant emissions
• Advanced corrosion protection system
• The coating is environment-friendly using a combination of sacrificial nodes together with an “Impressed Current Cathodic Protection” (ICCP) system (not only sacrificial anodes)
Benthos, fish, avifauna (resting birds, migratory birds) and marine mammals are constantly investigated.
Mitigation of sound and
light emissions
En
BW
In
vest
or
Pre
sen
tati
on
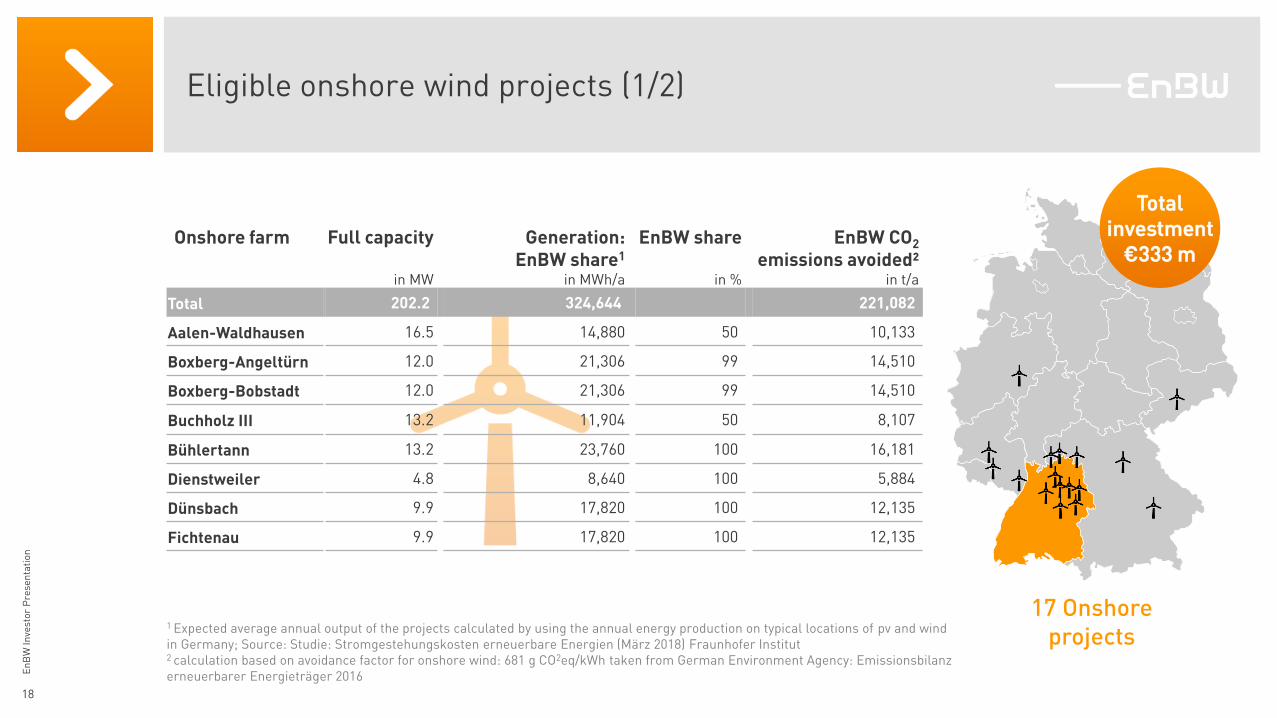
Eligible onshore wind projects (1/2)
1 Expected average annual output of the projects calculated by using the annual energy production on typical locations of pv and wind in Germany; Source: Studie: Stromgestehungskosten erneuerbare Energien (März 2018) Fraunhofer Institut2 calculation based on avoidance factor for onshore wind: 681 g CO2eq/kWh taken from German Environment Agency: Emissionsbilanzerneuerbarer Energieträger 2016
Totalinvestment
€333 m
17 Onshore projects
18
En
BW
In
vest
or
Pre
sen
tati
on
Onshore farm Full capacity
in MW
Generation: EnBW share1
in MWh/a
EnBW share
in %
EnBW CO2
emissions avoided²in t/a
Total 202.2 324,644 221,082
Aalen-Waldhausen 16.5 14,880 50 10,133
Boxberg-Angeltürn 12.0 21,306 99 14,510
Boxberg-Bobstadt 12.0 21,306 99 14,510
Buchholz III 13.2 11,904 50 8,107
Bühlertann 13.2 23,760 100 16,181
Dienstweiler 4.8 8,640 100 5,884
Dünsbach 9.9 17,820 100 12,135
Fichtenau 9.9 17,820 100 12,135
1 Expected average annual output of the projects calculated by using the annual energy production on typical locations of pv and wind in Germany; Source: Studie: Stromgestehungskosten erneuerbare Energien (März 2018) Fraunhofer Institut2 calculation based on avoidance factor for onshore wind: 681 g CO2eq/kWh taken from German Environment Agency: Emissionsbilanzerneuerbarer Energieträger 2016
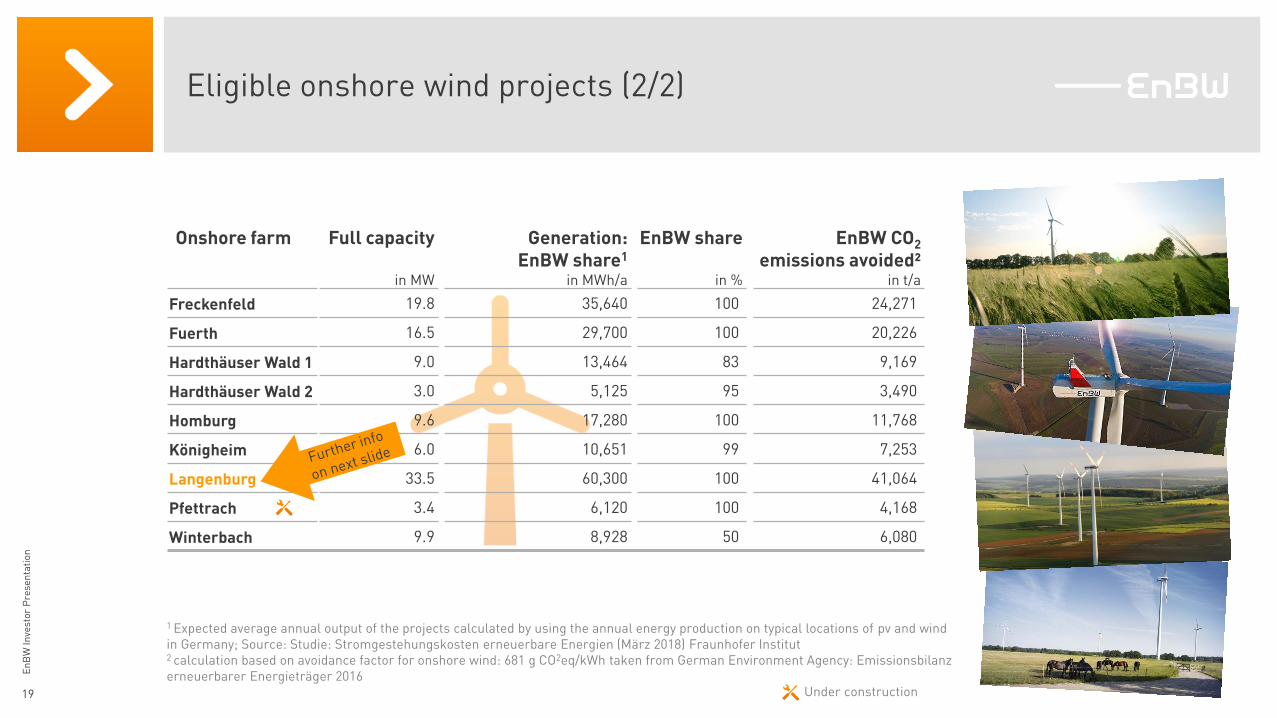
Eligible onshore wind projects (2/2)
Onshore farm Full capacity
in MW
Generation: EnBW share1
in MWh/a
EnBW share
in %
EnBW CO2
emissions avoided²in t/a
Freckenfeld 19.8 35,640 100 24,271
Fuerth 16.5 29,700 100 20,226
Hardthäuser Wald 1 9.0 13,464 83 9,169
Hardthäuser Wald 2 3.0 5,125 95 3,490
Homburg 9.6 17,280 100 11,768
Königheim 6.0 10,651 99 7,253
Langenburg 33.5 60,300 100 41,064
Pfettrach 3.4 6,120 100 4,168
Winterbach 9.9 8,928 50 6,080
19
En
BW
In
vest
or
Pre
sen
tati
on
Under construction
20
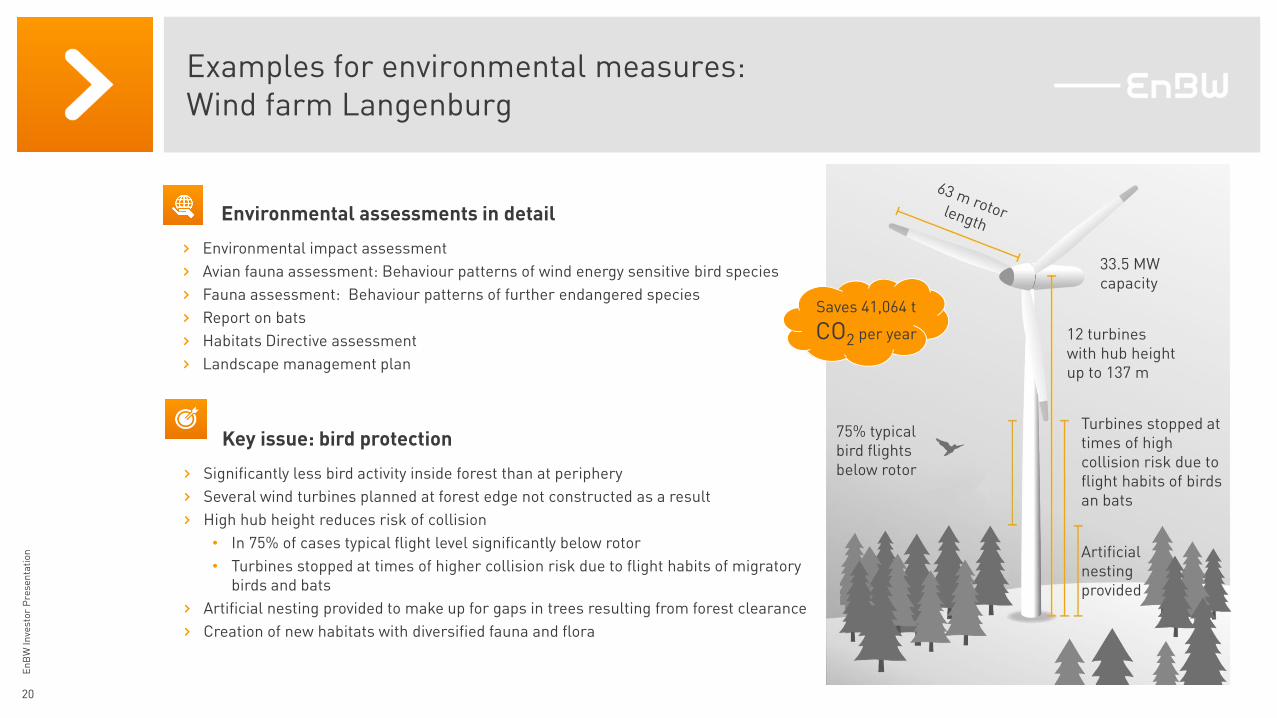
Examples for environmental measures: Wind farm Langenburg
En
BW
In
vest
or
Pre
sen
tati
on
12 turbineswith hub heightup to 137 m
33.5 MW capacity
75% typicalbird flightsbelow rotor
Turbines stopped at times of high collision risk due toflight habits of birdsan bats
Artificialnestingprovided
Saves 41,064 t
CO2 per year
Environmental assessments in detail
› Environmental impact assessment
› Avian fauna assessment: Behaviour patterns of wind energy sensitive bird species
› Fauna assessment: Behaviour patterns of further endangered species
› Report on bats
› Habitats Directive assessment
› Landscape management plan
Key issue: bird protection
› Significantly less bird activity inside forest than at periphery
› Several wind turbines planned at forest edge not constructed as a result
› High hub height reduces risk of collision
• In 75% of cases typical flight level significantly below rotor
• Turbines stopped at times of higher collision risk due to flight habits of migratory birds and bats
› Artificial nesting provided to make up for gaps in trees resulting from forest clearance
› Creation of new habitats with diversified fauna and flora
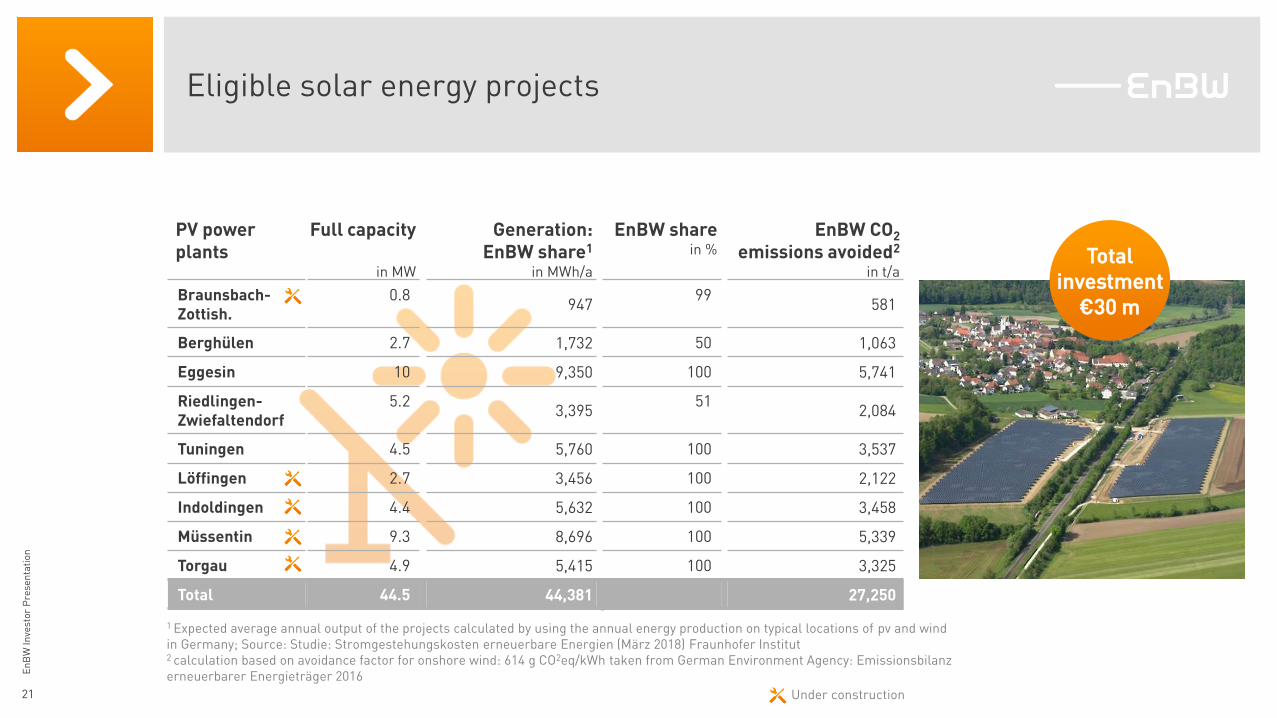
PV powerplants
Full capacity
in MW
Generation:EnBW share1
in MWh/a
EnBW sharein %
EnBW CO2
emissions avoided2
in t/a
Braunsbach-Zottish.
0.8947
99581
Berghülen 2.7 1,732 50 1,063
Eggesin 10 9,350 100 5,741
Riedlingen-Zwiefaltendorf
5.23,395
512,084
Tuningen 4.5 5,760 100 3,537
Löffingen 2.7 3,456 100 2,122
Indoldingen 4.4 5,632 100 3,458
Müssentin 9.3 8,696 100 5,339
Torgau 4.9 5,415 100 3,325
Total 44.5 44,381 27,250
Eligible solar energy projects
21
En
BW
In
vest
or
Pre
sen
tati
on
Under construction
Totalinvestment
€30 m
1 Expected average annual output of the projects calculated by using the annual energy production on typical locations of pv and wind in Germany; Source: Studie: Stromgestehungskosten erneuerbare Energien (März 2018) Fraunhofer Institut2 calculation based on avoidance factor for onshore wind: 614 g CO2eq/kWh taken from German Environment Agency: Emissionsbilanzerneuerbarer Energieträger 2016
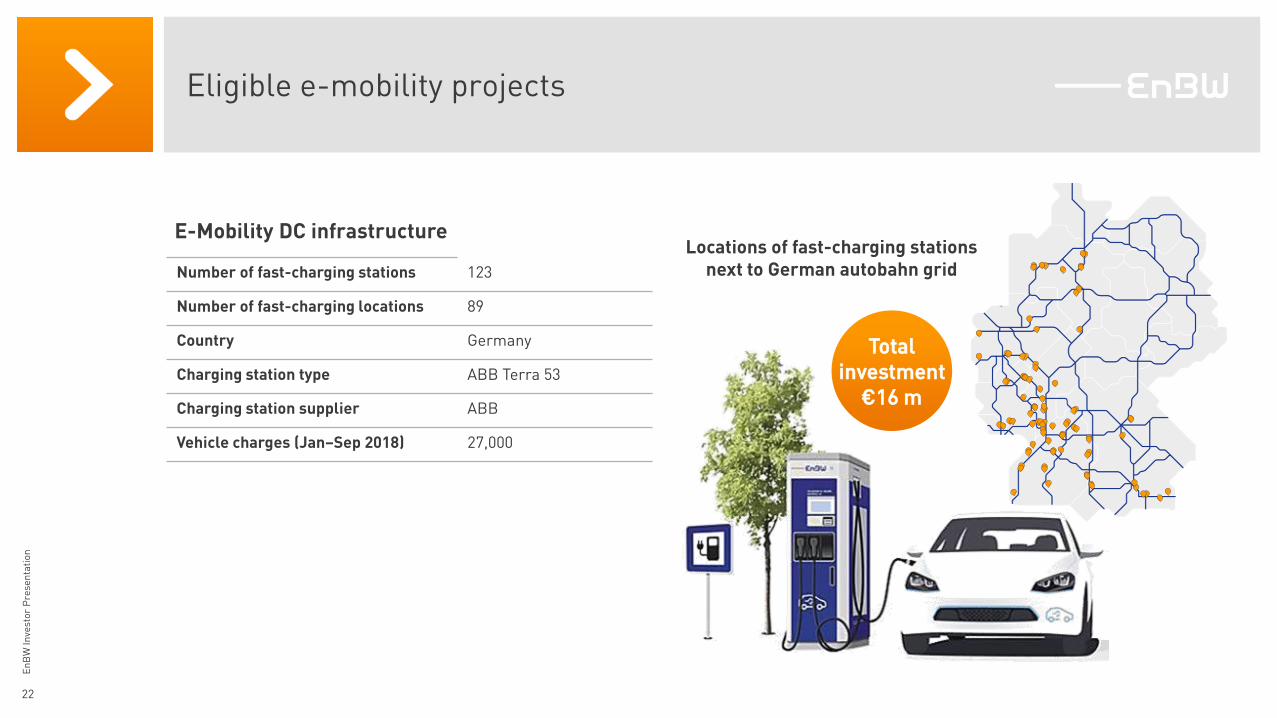
Eligible e-mobility projects
22
En
BW
In
vest
or
Pre
sen
tati
on
E-Mobility DC infrastructure
Number of fast-charging stations 123
Number of fast-charging locations 89
Country Germany
Charging station type ABB Terra 53
Charging station supplier ABB
Vehicle charges (Jan–Sep 2018) 27,000
Totalinvestment
€16 m
Locations of fast-charging stationsnext to German autobahn grid
Long-term rating: A-Outlook: stable
Long-term rating: A3Outlook: stable
Investment case EnBW
23
En
BW
In
vest
or
Pre
sen
tati
on
Internal Financing Capability Retained Cash Flow - Net Investments > 0
ROCE > WACC
High Level of Financial Discipline
Increasing Group Value
Access to Capital Markets Sustainable Dividend Level
Coverage of pension and nuclear provisionsAsset Liability Management Model
Long-term rating: A-Outlook: stable
Solid credit quality
Rating: 73 (2018)Status: Outperformer
Long-term rating: A- (2017)Status: Leadership
Highly ranked sustainability Rating: B- (2017)
Status: Prime

Questions& Answers »
En
BW
In
vest
or
Pre
sen
tati
on
24
Appendix
› EnBW at a glance……………………………………………………….
› Political & regulatory environment…………………………….
› Climate protection in the coalition agreement 2018……
› Generation portfolio……………………………………………………
› EnBW’s position on CO2 minimum price ……………………
› Sustainability……………………………………………………………..
› Financing sources and maturity profile bonds……………
› Shareholder structure………………………………………………..
› Calendar…………………………………………………………………….
› EnBW’s team ……………………………………………………………..
› Important note……………………………………………………………
25
En
BW
In
vest
or
Pre
sen
tati
on
page 26
page 27
page 28
page 29
page 30
page 31
page 32
page 34
page 35
page 36
page 37
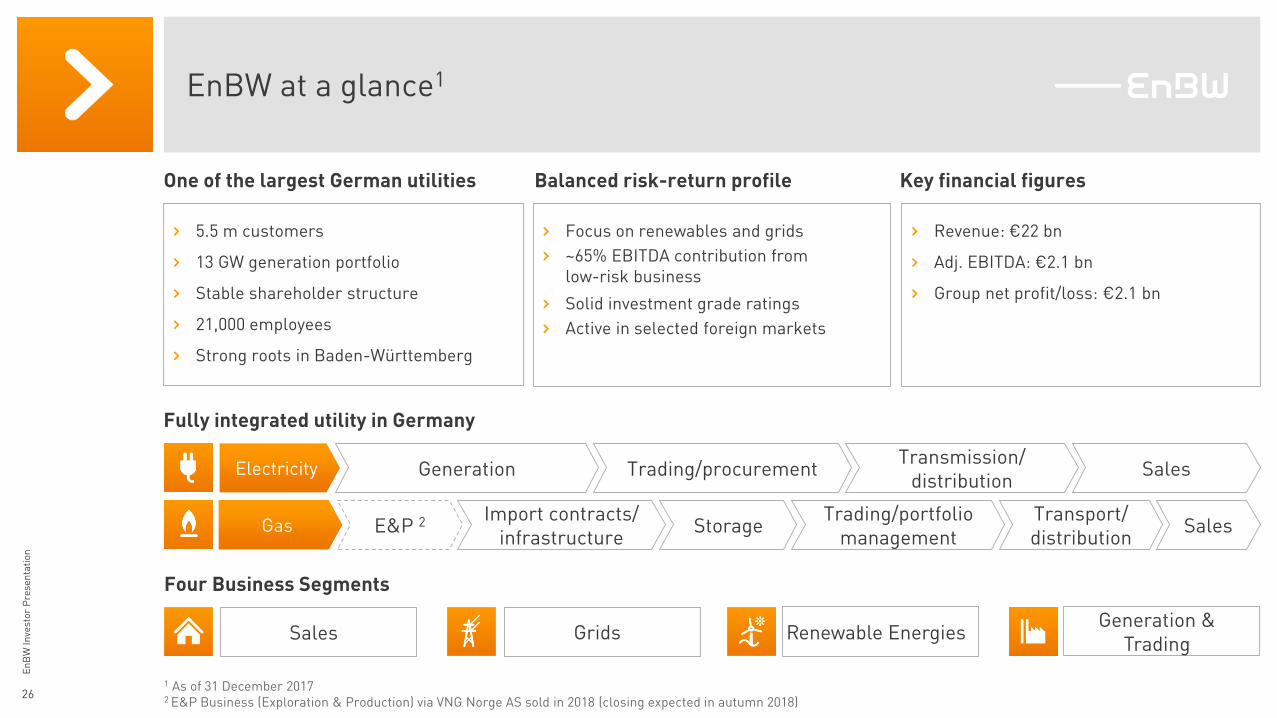
EnBW at a glance1
26
En
BW
In
vest
or
Pre
sen
tati
on
One of the largest German utilities
› Focus on renewables and grids
› ~65% EBITDA contribution from low-risk business
› Solid investment grade ratings
› Active in selected foreign markets
› 5.5 m customers
› 13 GW generation portfolio
› Stable shareholder structure
› 21,000 employees
› Strong roots in Baden-Württemberg
› Revenue: €22 bn
› Adj. EBITDA: €2.1 bn
› Group net profit/loss: €2.1 bn
Balanced risk-return profile Key financial figures
GasImport contracts/
infrastructureStorage
Trading/portfolio management
Transport/ distribution
Sales
Renewable EnergiesGeneration &
TradingGridsSales
Fully integrated utility in Germany
Four Business Segments
Electricity Generation Trading/procurementTransmission/
distributionSales
E&P 2Gas
1 As of 31 December 2017 2 E&P Business (Exploration & Production) via VNG Norge AS sold in 2018 (closing expected in autumn 2018)
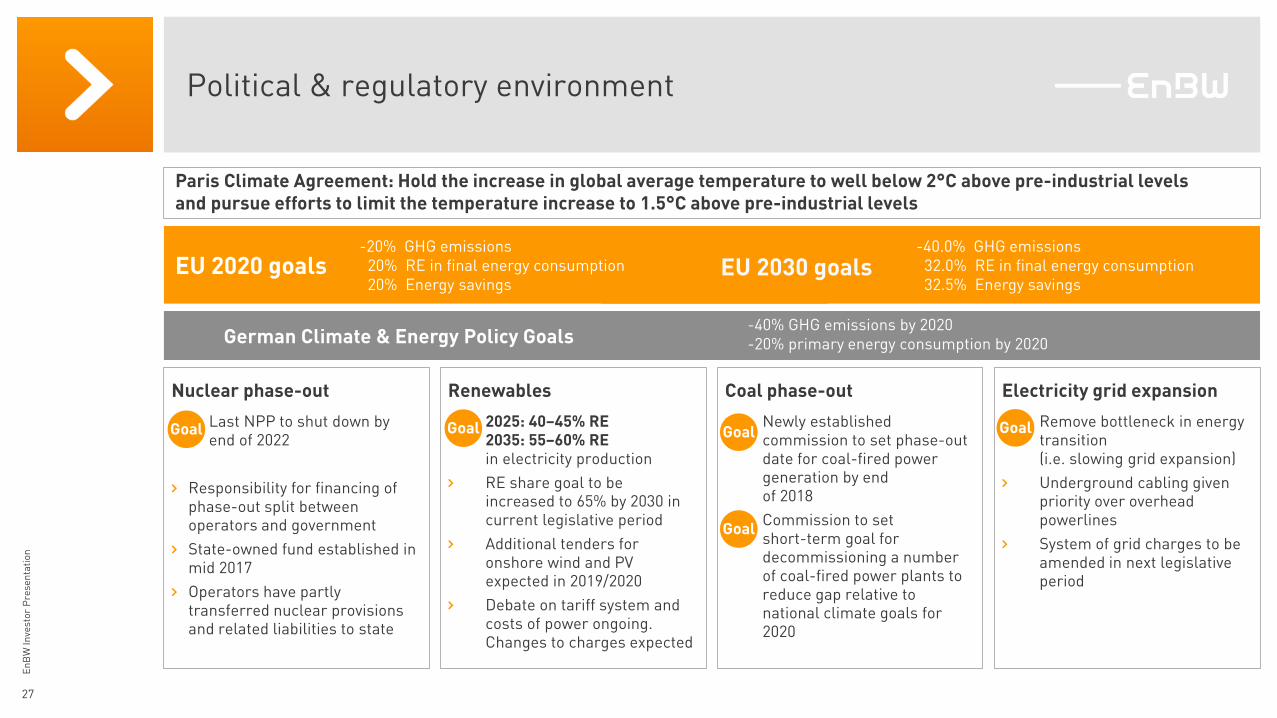
Political & regulatory environment
27
En
BW
In
vest
or
Pre
sen
tati
on
Nuclear phase-out
› Last NPP to shut down by end of 2022
› Responsibility for financing ofphase-out split betweenoperators and government
› State-owned fund established in mid 2017
› Operators have partlytransferred nuclear provisionsand related liabilities to state
Renewables
› 2025: 40–45% RE 2035: 55–60% RE in electricity production
› RE share goal to beincreased to 65% by 2030 in current legislative period
› Additional tenders foronshore wind and PV expected in 2019/2020
› Debate on tariff system and costs of power ongoing. Changes to charges expected
Coal phase-out
› Newly establishedcommission to set phase-out date for coal-fired power generation by end of 2018
› Commission to setshort-term goal fordecommissioning a numberof coal-fired power plants toreduce gap relative tonational climate goals for2020
Electricity grid expansion
› Remove bottleneck in energytransition(i.e. slowing grid expansion)
› Underground cabling givenpriority over overheadpowerlines
› System of grid charges to beamended in next legislative period
EU 2030-Goals
German Climate & Energy Policy Goals
EU 2020 goals
Goal
-20% GHG emissions20% RE in final energy consumption20% Energy savings
-40.0% GHG emissions32.0% RE in final energy consumption32.5% Energy savings
-40% GHG emissions by 2020-20% primary energy consumption by 2020
Goal
Goal
Goal Goal
EU 2030 goals
Paris Climate Agreement: Hold the increase in global average temperature to well below 2°C above pre-industrial levelsand pursue efforts to limit the temperature increase to 1.5°C above pre-industrial levels
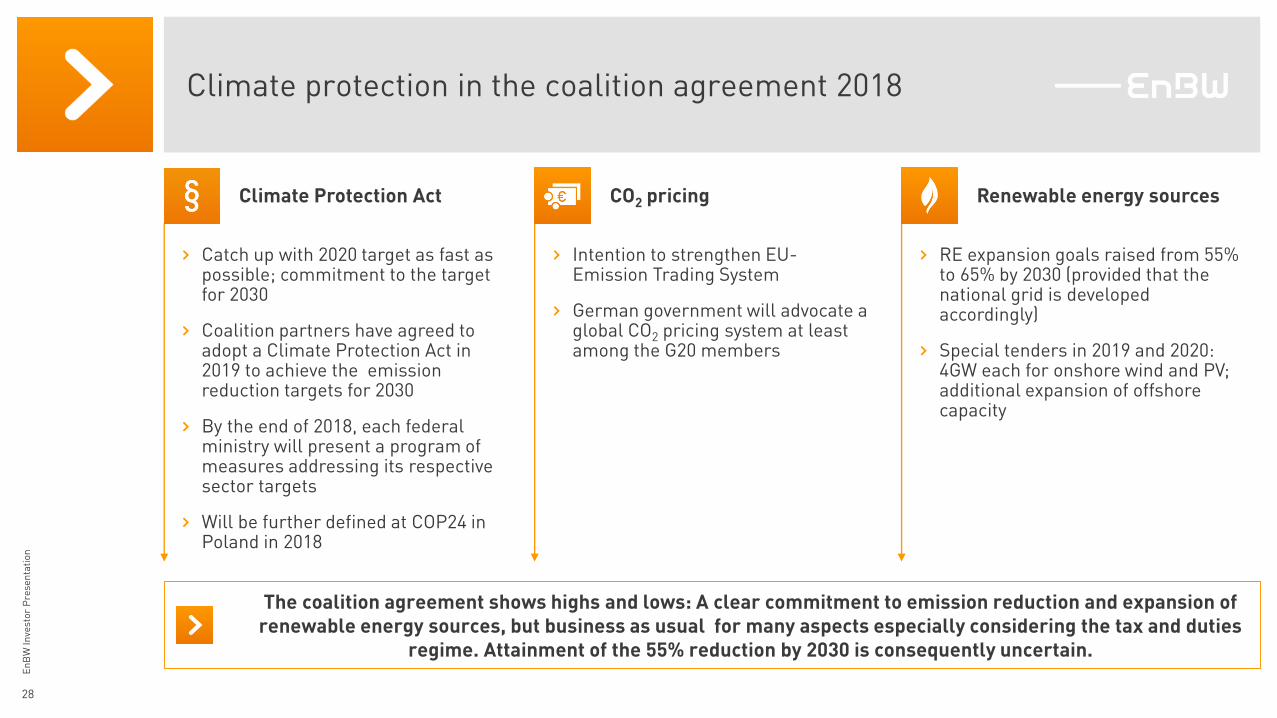
Climate protection in the coalition agreement 2018
28
En
BW
In
vest
or
Pre
sen
tati
on
Climate Protection Act
› Catch up with 2020 target as fast as possible; commitment to the target for 2030
› Coalition partners have agreed to adopt a Climate Protection Act in 2019 to achieve the emission reduction targets for 2030
› By the end of 2018, each federal ministry will present a program of measures addressing its respective sector targets
› Will be further defined at COP24 in Poland in 2018
CO2 pricing
› Intention to strengthen EU-Emission Trading System
› German government will advocate a global CO2 pricing system at least among the G20 members
Renewable energy sources
› RE expansion goals raised from 55% to 65% by 2030 (provided that the national grid is developed accordingly)
› Special tenders in 2019 and 2020: 4GW each for onshore wind and PV; additional expansion of offshore capacity
The coalition agreement shows highs and lows: A clear commitment to emission reduction and expansion of renewable energy sources, but business as usual for many aspects especially considering the tax and duties
regime. Attainment of the 55% reduction by 2030 is consequently uncertain.
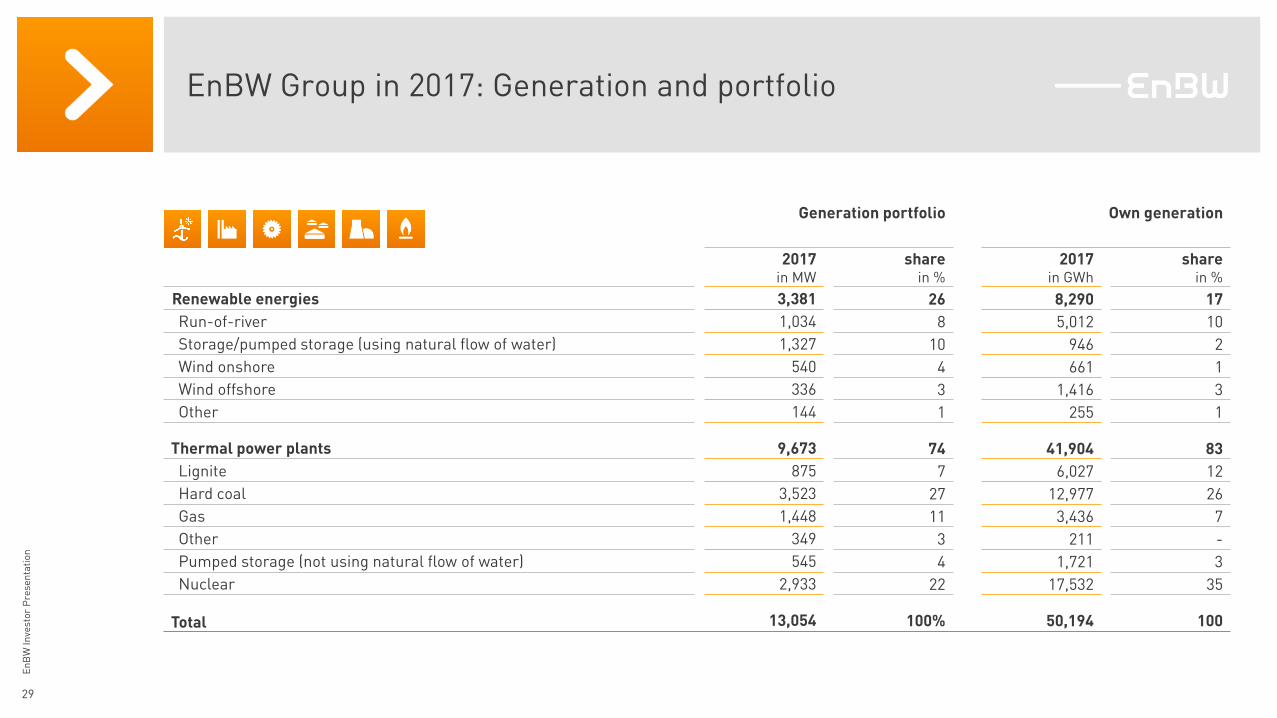
EnBW Group in 2017: Generation and portfolio
29
En
BW
In
vest
or
Pre
sen
tati
on
Generation portfolio Own generation
2017in MW
sharein %
2017in GWh
sharein %
Renewable energies 3,381 26 8,290 17
Run-of-river 1,034 8 5,012 10
Storage/pumped storage (using natural flow of water) 1,327 10 946 2
Wind onshore 540 4 661 1
Wind offshore 336 3 1,416 3
Other 144 1 255 1
Thermal power plants 9,673 74 41,904 83
Lignite 875 7 6,027 12
Hard coal 3,523 27 12,977 26
Gas 1,448 11 3,436 7
Other 349 3 211 -
Pumped storage (not using natural flow of water) 545 4 1,721 3
Nuclear 2,933 22 17,532 35
Total 13,054 100% 50,194 100

Focusing on sustainability, EnBW supports CO2 reducedgeneration with a minimum CO2 price
30
En
BW
In
vest
or
Pre
sen
tati
on
€25 minimum pricespecified for 2020
(€30 for 2025)
EnBW‘s position on minimum CO2 price
CO2
Payment ofmarket price
(currently ca. €17)
Options for use of additional revenue:
› Reduction in electricity tax(≥ 50%)
› Repurchase of CO2 certificates
ETS Market
S T A T E
Energy taxes adjusted forindividual CO2 intensity
Paymentprice difference(currently ca. €5)
Introduction of a national CO2 target price of €25from 2020 and €30 from 2025
› This would render significant market based CO2
reductions economically viable – climate-friendly power plants would be allocated more operating hours. At the same time risks for renewable energy investments would be mitigated.”
Reduction of electricity tax by at least 50%
› Most of today`s electricity and energy taxes have no significant impact on carbon emissions.
› Reduction of the electricity tax facilitated with the additional revenue from the minimum price of CO2; the natural gas tax can be abolished
Alignment of energy taxes with the CO2 intensityof the energy source
› Fundamental reform of the energy tax system: focus on the climate impact of energy sources
› Existing refunds and exemptions remain unaffected
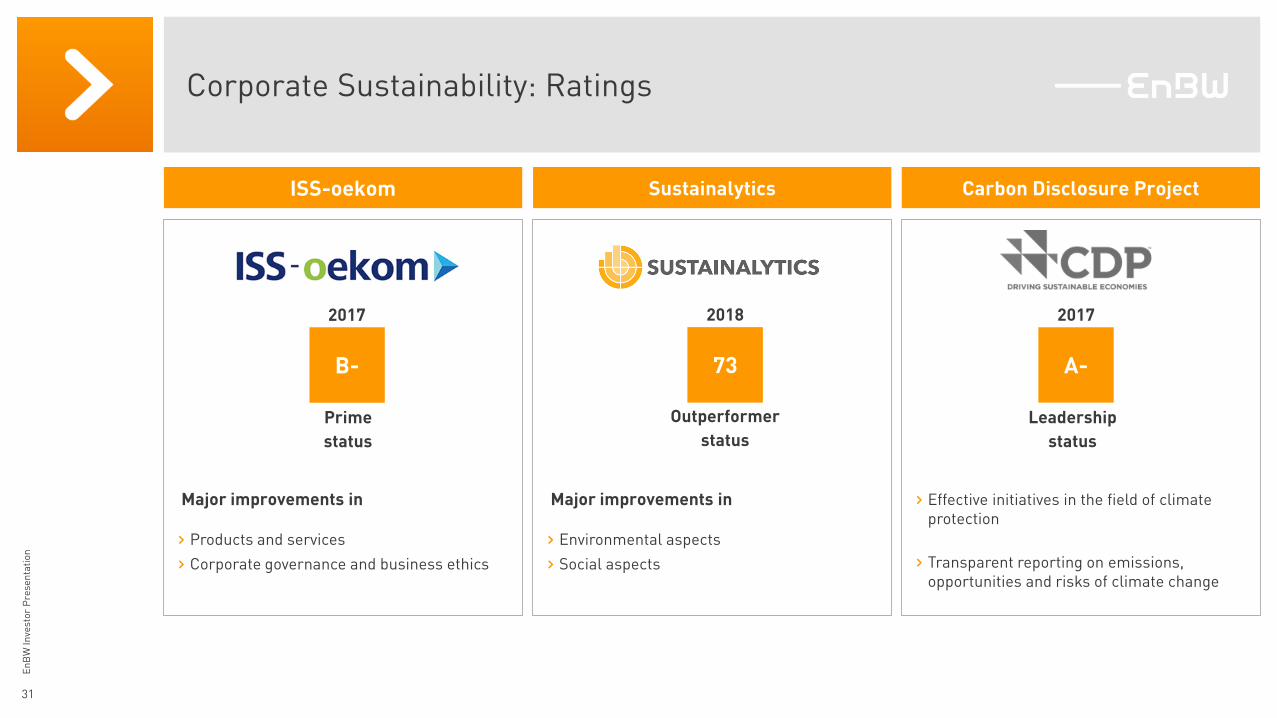
Corporate Sustainability: Ratings
31
En
BW
In
vest
or
Pre
sen
tati
on
› Effective initiatives in the field of climate protection
› Transparent reporting on emissions, opportunities and risks of climate change
Major improvements in
› Environmental aspects
› Social aspects
Major improvements in
› Products and services
› Corporate governance and business ethics
ISS-oekom
B-
2017
A-
2017
73
2018
Prime
status
Outperformer
status
Leadership
status
Sustainalytics Carbon Disclosure Project

EnBW has flexible access to various financing sources1
Financing sourcesin € bn
0.21.8
Commercial Paper Programme
2.0
Hybrid Bonds
2.0
Debt Issurance Programme
7.0
3
4
Thereof € 3 bn utilised2 Thereof € 180 m utilised
2
Bilateral Free Credit Lines
1.4
Syndicated Credit Line
1.5
UndrawnMaturity date: 2021
2
Project financing and low-interest loans from the EIB1 As of 30 June 20182 Rounded figures
En
BW
In
vest
or
Pre
sen
tati
on

Maturities of EnBW’s bonds
33
En
BW
In
vest
or
Pre
sen
tati
on
Fixed Incomein € m
8361
2018
865
2023 2025
1706
2038
700
2039
1,000
500
1,0002
2021 2077
9937
2026
500
100
2034 2044
50
.... …. ….…. …. ….
2022 2076
9933;4 First call dates of hybrid bonds
Senior bonds
Hybrid bondsRepayment on
12 July 2018
1 Includes CHF 100 million, converted as of the reporting date of 30/06/2018 2 First call date: hybrid maturing in 20763 First call date: hybrid maturing in 2077 4 Includes USD 300 million (swap in EUR), coupon for Swap 5.125%5 CHF 100 million, converted as of the reporting date of 30/06/2018 6 JPY 20 billion (swap in EUR), coupon for Swap 3.880%7 Includes USD 300 million, converted as of 05/10/2016
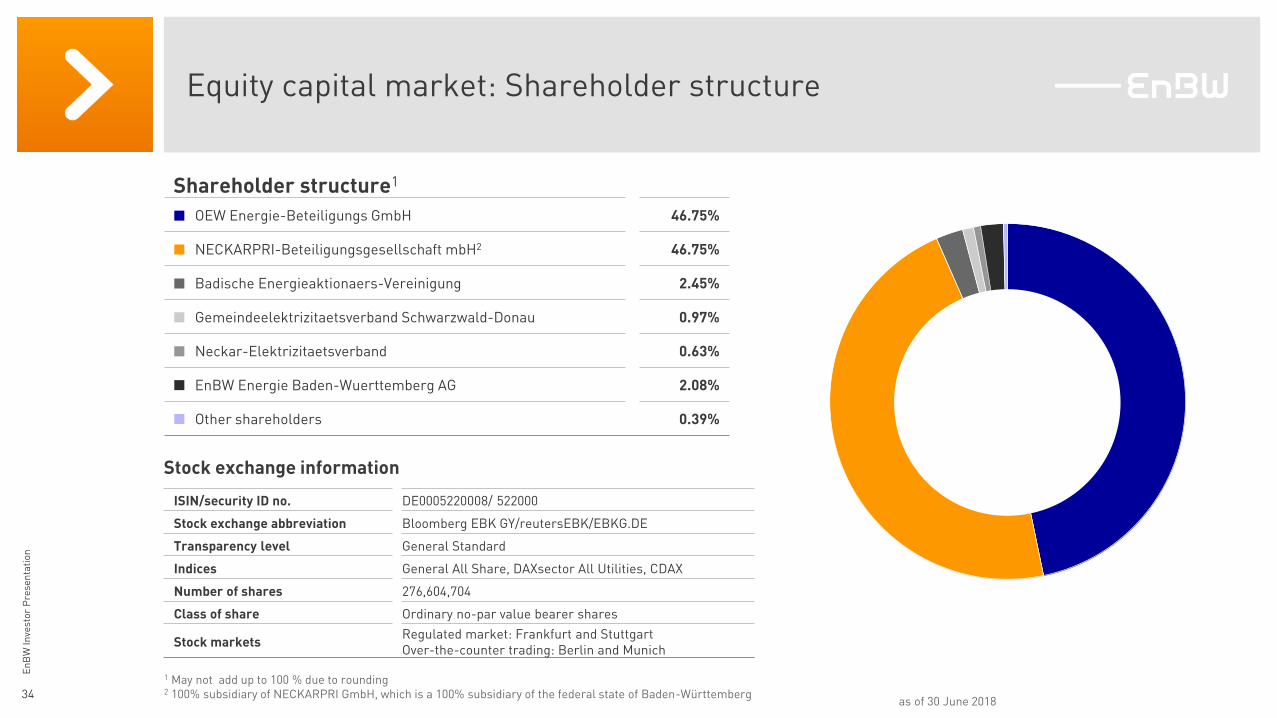
Equity capital market: Shareholder structure
34
En
BW
In
vest
or
Pre
sen
tati
on
OEW Energie-Beteiligungs GmbH 46.75%
NECKARPRI-Beteiligungsgesellschaft mbH2 46.75%
Badische Energieaktionaers-Vereinigung 2.45%
Gemeindeelektrizitaetsverband Schwarzwald-Donau 0.97%
Neckar-Elektrizitaetsverband 0.63%
EnBW Energie Baden-Wuerttemberg AG 2.08%
Other shareholders 0.39%
ISIN/security ID no. DE0005220008/ 522000
Stock exchange abbreviation Bloomberg EBK GY/reutersEBK/EBKG.DE
Transparency level General Standard
Indices General All Share, DAXsector All Utilities, CDAX
Number of shares 276,604,704
Class of share Ordinary no-par value bearer shares
Stock marketsRegulated market: Frankfurt and StuttgartOver-the-counter trading: Berlin and Munich
Stock exchange information
as of 30 June 2018
Shareholder structure1
1 May not add up to 100 % due to rounding2 100% subsidiary of NECKARPRI GmbH, which is a 100% subsidiary of the federal state of Baden-Württemberg
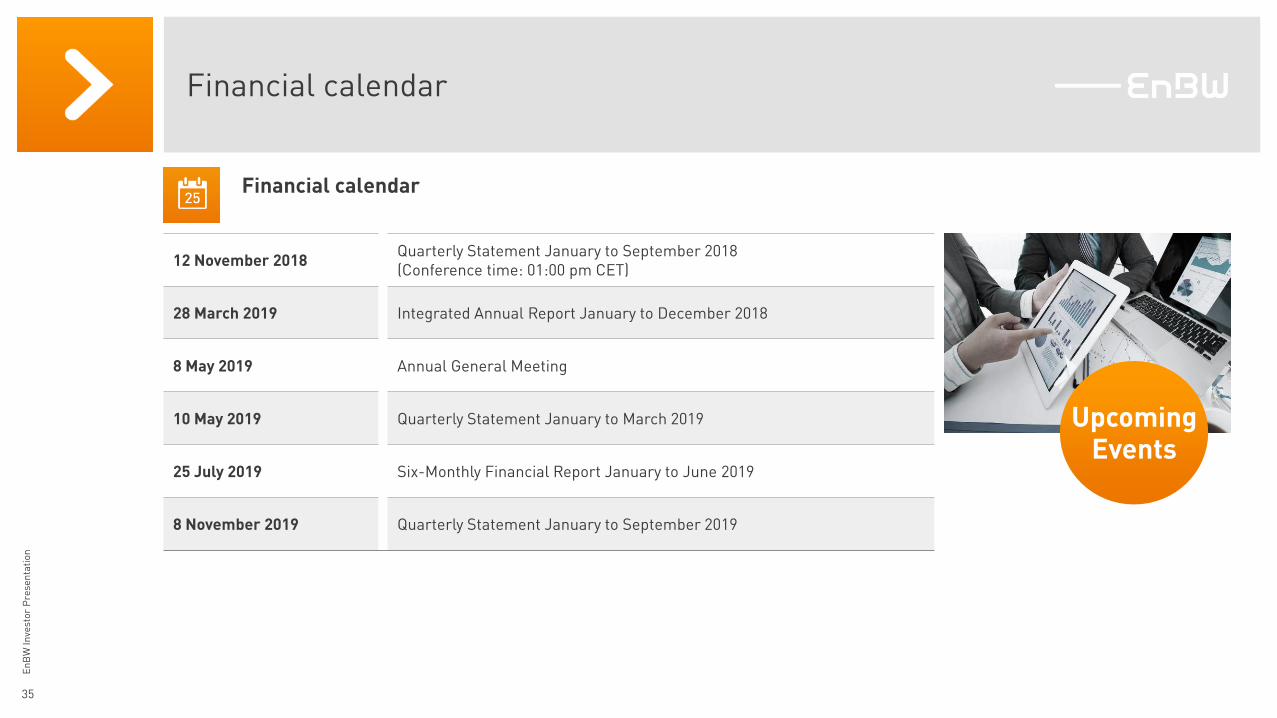
Financial calendar
35
En
BW
In
vest
or
Pre
sen
tati
on
12 November 2018Quarterly Statement January to September 2018 (Conference time: 01:00 pm CET)
28 March 2019 Integrated Annual Report January to December 2018
8 May 2019 Annual General Meeting
10 May 2019 Quarterly Statement January to March 2019
25 July 2019 Six-Monthly Financial Report January to June 2019
8 November 2019 Quarterly Statement January to September 2019
Financial calendar
UpcomingEvents
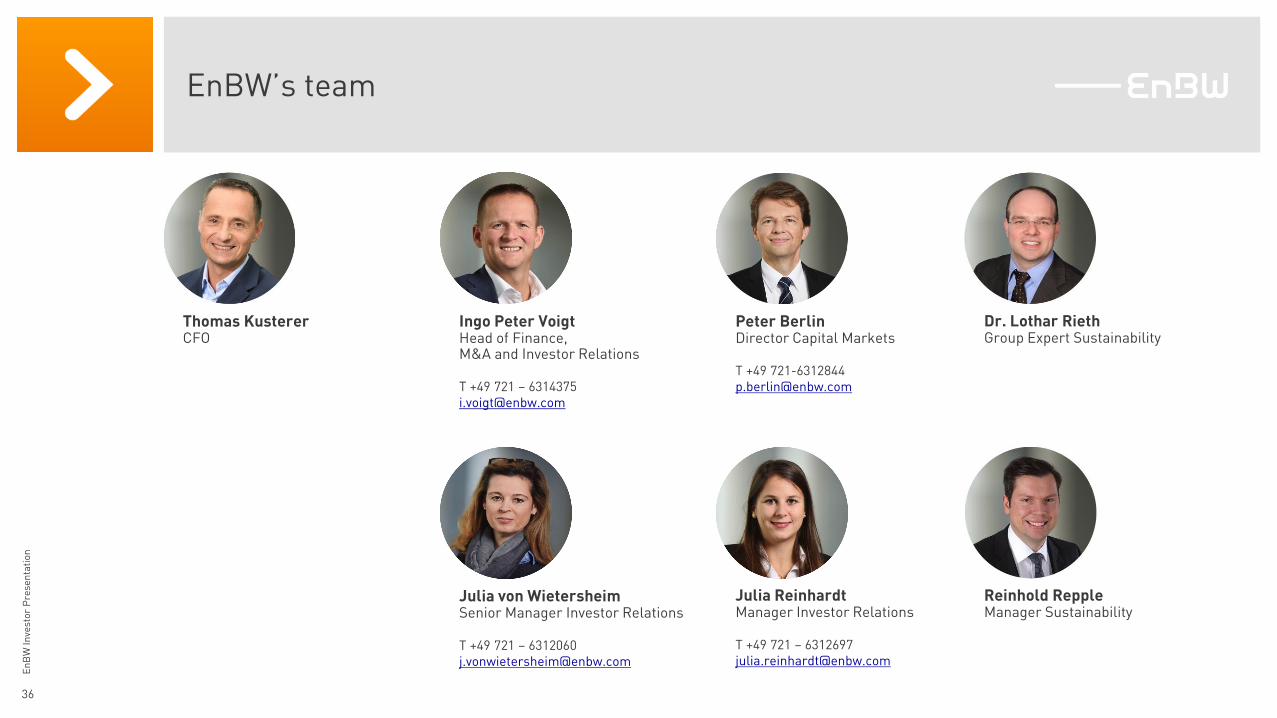
EnBW’s team
36
En
BW
In
vest
or
Pre
sen
tati
on
Julia von WietersheimSenior Manager Investor Relations
T +49 721 – [email protected]
Ingo Peter VoigtHead of Finance, M&A and Investor Relations
T +49 721 – [email protected]
Julia ReinhardtManager Investor Relations
T +49 721 – [email protected]
Peter BerlinDirector Capital Markets
T +49 [email protected]
Reinhold ReppleManager Sustainability
Dr. Lothar RiethGroup Expert Sustainability
Thomas KustererCFO
Important note
37
En
BW
In
vest
or
Pre
sen
tati
on
Unless indicated otherwise, all data contained hereinafter refers to the EnBW
Group and is calculated according to IFRS.
No offer or investment recommendation
This presentation has been prepared for information purposes only. It does not
constitute an offer, an invitation or a recommendation to purchase or sell
securities issued by EnBW Energie Baden-Württemberg AG (EnBW), a company of
the EnBW Group or any other company. This presentation does not constitute a
request, instruction or recommendation to vote or give consent. All descriptions,
examples and calculations are included in this presentation for illustration
purposes only.
Persons who intend to purchase securities of EnBW or EnBW International
Finance B.V. are advised to base any decision about such purchase, or solicitation
of an offer to purchase, on the information contained in the base prospectus dated
27 April 2018 and any supplement thereto (Prospectus) prepared by EnBW.
Accordingly, any investment decision to purchase or subscribe for any securities of
EnBW or EnBW International Finance B.V. should be made solely based on
information contained in the Prospectus and no reliance is to be placed on any
representations other than those that are contained in the Prospectus which is
available published on the websites of EnBW and the Luxembourg Stock
Exchange.
Future-oriented statements
This presentation contains future-oriented statements that are based on current
assumptions, plans, estimates and forecasts of the management of EnBW. Such
future-oriented statements are therefore only valid at the time at which they are
published for the first time. Future-oriented statements are indicated by the
context, but may also be identified by the use of the words “may”, “will”, “should”,
“plans”, “intends”, “expects”, “believes”, “assumes”, “forecasts”, “potentially” or
“continued” and similar expressions.
By nature, future-oriented statements are subject to risks and uncertainties that
cannot be controlled or accurately predicted by EnBW. Actual events, future
results, the financial position, development or performance of EnBW and the
companies of the EnBW Group may therefore diverge considerably from the
future-oriented statements made in this presentation. Therefore it cannot be
guaranteed nor can any liability be assumed otherwise that these future-oriented
statements will prove complete, correct or precise or that expected and forecast
results will actually occur in the future.
No obligation to update the information
EnBW assumes no obligation of any kind to update the information contained in
this presentation or to adjust or update future-oriented statements to future
events or developments.