Embed Size (px)
Citation preview
J. Mater. Environ. Sci. 7 (7) (2016) 2314-2327 Sheeba et al.
ISSN : 2028-2508
CODEN: JMESC
2314
Encapsulation of Cu(II), Ni(II) and V(IV) - imidazole complexes in fly ash
zeolite, characterisation and catalytic activity towards hydroxylation of phenol
S. Sheeba Thavamani and T. Peter Amaladhas*
P.G and Research Department of Chemistry, V.O. Chidambaram College, Tuticorin - 628008, Tamil Nadu, India.
Received 10 Sep 2015, Revised 18 Dec 2015, Accepted 28 Dec 2015
*Corresponding author: E-mail: [email protected]; Phone: +91 9442210876; Fax: +91 461 2310275
Abstract In this article, a new method for the utilization of fly ash has been proposed. X-type zeolite was prepared from fly
ash by alkali fusion followed by hydrothermal method. The prepared fly ash based zeolite (FAZ) was
characterised using FTIR, XRD, TGA and XRF and from BET analysis the surface area was found to be 172.83
m2/g and the pore volume was 0.014 cm
3/g. Cation Exchange Capacity (CEC) of raw fly ash was found to be 0
meq/100g while that of FAZ was estimated to be 457 meq/100g. The increase in surface area and CEC confirms
zeolitisation. Cu(II), Ni(II) and V(IV) - imidazole complexes were encapsulated in FAZ using flexible ligand
method. The FAZ encapsulated with complexes were characterised by FT-IR, XRD, UV-Vis, AAS and TGA. The
C=N stretching frequency observed at 1068 cm-1
and N-H stretching observed at ~3419 cm-1
clearly indicate the
loading of metal-imidazole complexes in the pores of fly ash zeolite. Thermo grams of the metal complexes
encapsulated fly ash zeolite shows an additional weight loss at 200-500ᵒC which confirms the loading of metal
complexes in zeolite. X-Ray diffraction patterns of the encapsulated metal complexes remain unaffected due to
poor loading of the metal complexes in the pores of zeolite. Hydroxylation of phenol has been chosen as a model
reaction and the catalytic activity of the encapsulated complexes towards this reaction has been monitored as a
function of time. The results reveal up to 81.8% conversion of phenol to hydroquinol which has been
characterised by GC-MS.
Keywords: Zeolite, Fly ash, Fly ash based zeolite, Flexible ligand method, Imidazole
1. Introduction Disposal of fly ash is a major issue worldwide, particularly in India because the major source of electricity
generation in India is coal-based. The total installed capacity in India is 80458 MW and 131.09 million-tonne of
ash is generated every year and it is expected to increase to 300-400 MT/year by 2016-17 [1]. A large number of
technologies have been developed for gainful utilization and safe management of fly ash. As a result, the
utilization of fly ash has increased to over 73 million tonne in 2010-12. Fly ash was moved from “hazardous
industrial waste” to “waste material” category during the year 2000 and during November 2009, it became a
saleable commodity. Fly ash utilization has started gaining acceptance, it being 55.79% during 2010-12. Fly ash
has acquired the status of a “useful commodity” which opens up plenty of opportunities in terms of laying and
fine tuning policies, conducting gainful businesses and R&D efforts, and addressing the concerns of environment
at the same time. Though a considerable amount of fly ash has been utilised, a lot of efforts are required to reach
the target of 100% ash utilization. This method of fly ash utilization provides an innovation in technology and
solution development and serves a good purpose to guide further strategies that turns the “menace” into a
“meaningful” engagement and utilisation of fly ash.
J. Mater. Environ. Sci. 7 (7) (2016) 2314-2327 Sheeba et al.
ISSN : 2028-2508
CODEN: JMESC
2315
Zeolites are aluminosilicates that are formed by the mutual sharing of oxygen atoms between tetrahedra of silica
and alumina. Apart from naturally occurring zeolites, a number of synthetic zeolites are known which have a wide
range of applications including ion exchange, catalysis, gas masks, in nuclear and biogas industries, in
construction, agriculture and biomedical applications. Encapsulation of suitable molecular species in zeolitic
cavities to prepare a new variety of materials has gained interest in the field of research. They have been reported
to have applications in size and shape selective catalysis, gas separation and purification and in photocatalysis [2-
4]. They have a fascinating role in heterogeneous catalysis claiming stereoselectivity, easy recovery of products
and reusability of the catalyst [5]. In this work, we report (i) the synthesis and characterisation of zeolite from fly
ash, (ii) encapsulation of Cu(II), Ni(II) and V(IV) complexes of imidazole in fly ash based zeolite and their
characterization and (iii) assessment of the FAZ encapsulated complexes as catalysts towards the hydroxylation
of phenol as a function of time.
2. Experimental 2.1. Materials
The main raw material, F-type coal fly ash sample was collected from electrostatic precipitators of Tuticorin
Thermal Power Station (TTPS), Tuticorin, Tamil Nadu, India. The sample contained both amorphous (mainly
SiO2 and Al2O3) and crystalline components (mainly quartz and mullite). AR Grade concentrated Hydrochloric
acid supplied by Ranbaxy India was used for the acid treatment of fly ash. Sodium hydroxide used for zeolite
synthesis was purchased from Fisher, India, min. assay 98.0%. AR grade, 99% pure, E Merck make, Cupric
Nitrate (Cu(NO3)2.3H2O), Nickel Nitrate (Ni(NO3)2.6H2O) and Ottokemi, Mumbai, India make, 98% pure,
VO(H2O)4SO4 were used for preparing metal exchanged zeolites. AR grade Imidazole of 99.9% purity, supplied
by Fischer, Chennai, India was used for the synthesis of encapsulated metal-imidazole complexes. Phenol of
assay 99.0% purchased from Chemspure, Chennai, India was used for catalytic studies. Acetonitrile and
dichloromethane (HPLC grade) of 99.5% purity were used as solvents. 40% solution of HF (Sigma-Aldrich) was
used to dissolve the zeolite encapsulated metal complexes for AAS analysis. E Merck make, Hydrogen peroxide
solution of assay 30-32% W/V was used to study the catalytic activity of the encapsulated metal complexes
towards the hydroxylation of phenol. The H2O2 solution was kept in a dark polyethylene bottle preserved in a
refrigerator to retard decomposition.
FTIR spectra were recorded as KBr pellet on a SHIMADZU FTIR 8400S spectrophotometer in the frequency
range 400-4000 cm-1
with a resolution of 0.1 cm-1
. The structural crystallinity of the encapsulated complexes was
confirmed by recording the XRD patterns in PANalytical model X’pert PRO using CuKα (2.2 KW Max.) source
and X’celerator (semiconductor) detector. Ni filtered CuKα radiation was used with a curved graphite crystal
monochromator and NaI scintillator. Data were collected in the 2θ range 10-80 degrees at a 2θ step size of 0.05.
Thermo grams of the zeolite and the encapsulated metal complexes were recorded on Perkin- Elmer model-TGA7
instrument with a vertical furnace and vertical sample gas flow at a heating rate of 100C per minute in nitrogen
atmosphere by taking 5 mg of the sample. A known weight of the encapsulated complex was taken in a Platinum
crucible with lid and heated from 50⁰C to 860⁰C to monitor the weight loss on heating in each stage. UV-Vis
spectra were recorded from 190 to 1000 nm using JASCO, V-530 model spectrophotometer after leaching the
encapsulated metal complexes. For this, 25 mg of metal complex encapsulated zeolite was heated with 20 mL of
dilute sulphuric acid to facilitate leaching of the metal complex. The metal contents in the zeolite encapsulated
metal complexes were measured using Varian, Model Spectraa 220 Atomic Absorption Spectrometer in the flame
of acetylene-air mixture. 50 mg of the encapsulated metal complex was dissolved in 20 mL of HF (40%) and the
metal contents in the solution were analysed using Atomic Absorption Spectrometer. To study the surface
morphology, SEM images were recorded using Quanta 200, FEI SEM instrument. GC analysis was carried out to
identify the products obtained from the metal complexes encapsulated zeolite catalysed hydroxylation of phenol
with H2O2 in Hewlett Packard GC-MS, HP 5890 instrument fitted with FID detector and RTX 502.2 column of
length 60 m, 0.25 ID using He as the carrier gas. (Temperature program: Initial Temperature 70oC for 12 minutes
and increased at the rate of 10oC per min up to a temperature of 250
oC. Injection volume - 0.5 microlitre). The
composition of fly ash and FAZ were determined by X-ray fluorescence spectrometry (XRF) on a Philips
J. Mater. Environ. Sci. 7 (7) (2016) 2314-2327 Sheeba et al.
ISSN : 2028-2508
CODEN: JMESC
2316
MAGIX PRO Model 2440 instrument. The sample was additionally pulverised, homogenised and pressed into
pellet with chromatographic cellulose as binder for the analysis. BET surface analysis was carried out on a Carlo-
Erba sorptometer, Model 1800. Prior to the adsorption measurements, the sample was outgassed at 373K for 12 h,
in high vacuum. After evacuation, the sample was cooled at room temperature and weighed. For analysis, the
sample was cooled to 78K using liquid Nitrogen and then Nitrogen was allowed to adsorb on them. The volume
of Nitrogen adsorbed (at STP) and the BET surface areas were then measured. Surface area and pore volume were
obtained from N2 adsorption–desorption isotherms using conventional BET and BJH methods.
2.2. Zeolite synthesis
Fly ash was collected from the electrostatic precipitators of Tuticorin Thermal Power Station (TTPS) and used for
this study. X-type zeolite was synthesized from F-type fly ash by hydrothermal method [6]. In a typical
experiment, the raw fly ash sample was first screened through a sieve of 80-mesh size, to eliminate the larger
particles. The unburnt carbon (3%) along with other volatile materials present in fly ash were removed by
calcination at 800(±10oC) for 2 hours. The calcined fly ash sample was further treated with hydrochloric acid to
increase its activity towards zeolite formation and to remove iron oxides. The treated fly ash was milled with
NaOH in the ratio 1:1 and fused for one hour at 550°C in a muffle furnace. The resultant fused mixture was
cooled and milled again. It was then mixed with a calculated amount of distilled water and stirred continuously
for 8 hours in a mechanical stirrer. The mixture was then left undisturbed for 6 hours at 90°C. Finally it is filtered,
washed repeatedly with distilled water, dried at 110°C and kept in powder form for further procedures.
2.3. Determination of cation exchange capacity of the prepared zeolite
The synthesised zeolite sample was first dried at 240ºC for an hour to remove water molecules. Exactly 0.5 g of
this dried zeolite sample was transferred to a beaker containing 200 mL of 0.05% CaCl2 solution. The mixture
was stirred using a magnetic stirrer for 15 min to facilitate the sample to perform exchange of Ca2+
ions. The
mixture was then filtered using sintered G-4 glass crucible. The filtrate (40 mL) and 200 mL of the stock CaCl2
solutions were titrated with 0.005 M EDTA solution separately using 2 mL of NH3-NH4Cl buffer and 2 drops of
Eriochrome Black T indicator. The end point is the colour change from wine red to blue. The difference in titre
values, gives the amount of Ca2+
exchanged with zeolite. The cation exchange capacity (meq/100) is calculated
using the following equation:
CEC =Volume of EDTA x Strength of EDTA
Weight of zeolite takenX 100 X
200
40
2.4. Preparation of metal complexes encapsulated zeolites by flexible ligand method
The metal complex encapsulated zeolites were prepared by flexible ligand method. The metal ion was exchanged
with the Na+ ions of the FAZ which were further treated with the ligand. In this approach, the flexible ligand must
be able to diffuse freely through the zeolite pores, where it coordinated to the previously exchanged transition
metal cations to form the metal complex which is too large to exit. The zeolite encapsulated metal complexes
were Soxhlet extracted with a suitable solvent to remove any uncomplexed ligand and metal complexes adhered
to the surface of the zeolite. Soxhlet extraction has been performed for several hours and the extracted solvent
was found to be colourless which indicated the complete removal of the metal complex from the surface. Residual
colours that have been noticed in all the zeolite encapsulated metal complexes were due to the loading of the
metal complex in the cages of the zeolite.
2.4.1. Preparation of metal exchanged zeolite, M-X; [M = Cu(II), Ni(II) and V(IV)]
About 1.0 g of fly ash zeolite (FAZ) was suspended in 100 mL of 0.1 M metal salt solution (Nitrates of Cu(II),
Ni(II) and Vanadyl sulphate). The reaction mixture was magnetically stirred for 24 hours. The solid was filtered,
washed with distilled water till the filtrate was free from the metal ion on the surface of the zeolite and then dried
for 15 hours at 150oC in an air oven. The Cu(II) – X and Ni(II) - X were pale green in colour and V(IV) - X was
J. Mater. Environ. Sci. 7 (7) (2016) 2314-2327 Sheeba et al.
ISSN : 2028-2508
CODEN: JMESC
2317
dark green in colour. This colour change may be attributed to the metal ions that have been exchanged for the Na+
ions of the zeolite matrix.
2.4.2. Preparation of metal-imidazole complexes encapsulated zeolite [M(IMD)-X]
Imidazole (2.5 g) and 1.0 g of metal ion exchanged zeolite [M= Cu(II), Ni(II) or V(IV)] were mixed in 50 mL
acetonitrile in a flat bottomed flask and the reaction mixture was heated at reflux for ca.15 hours while stirring
magnetically. After cooling, the slurry was Soxhlet extracted with dichloromethane (ca.48 hours) by circulating
ice cooled water in the condenser. The extraction was continued till the complex was free from unreacted ligand
and any free metal complex on the surface of the zeolite. The encapsulated Cu(II), V(IV) and Ni(II) complexes of
imidazole were blue, green and pale green respectively. The coloured solids were dried at 1500C for five hours till
constant weight was achieved.
2.5. Catalytic activity studies of encapsulated metal complexes of imidazole
The suitability of the encapsulated metal complexes as catalysts in phenol hydroxylation as a model reaction was
assessed. In a typical reaction, an aqueous solution of 30% H2O2 (1.6 mL, 53.38 mmol) and phenol (0.54 g, 6.16
mmol) were mixed in 5 mL CH3CN. Zeolite encapsulated metal imidazole complex (M(IMD)-X) (0.020g) was
added to the reaction mixture and was refluxed for the stipulated time. The products were analyzed by GC-MS
and identified to be hydroquinol. The amount of unreacted phenol in the reaction mixture was estimated
quantitatively by substituting with bromine produced from bromide and bromate in acid solution. The unreacted
bromine was determined by adding excess potassium iodide and back titrating the liberated iodine with standard
sodium thiosulphate solution [7, 8].
3. Results and discussion 3.1. Characterization of the prepared fly ash zeolite (FAZ)
3.1.1. Cation exchange capacity
The major potential application of zeolite is based on its use as ion exchangers in industrial waste water and soil
contamination. Raw fly ash does not have any appreciable cation exchange capacity. The prepared zeolite has a
high cation exchange capacity of 457 meq/100g, comparable to that of commercial zeolites [9, 10]. Thus the
prepared zeolite can find new dimension which allows the exchange of desired metal ions which facilitate the
loading of complexes.
3.1.2. BET surface area and pore size distribution of Fly ash zeolite
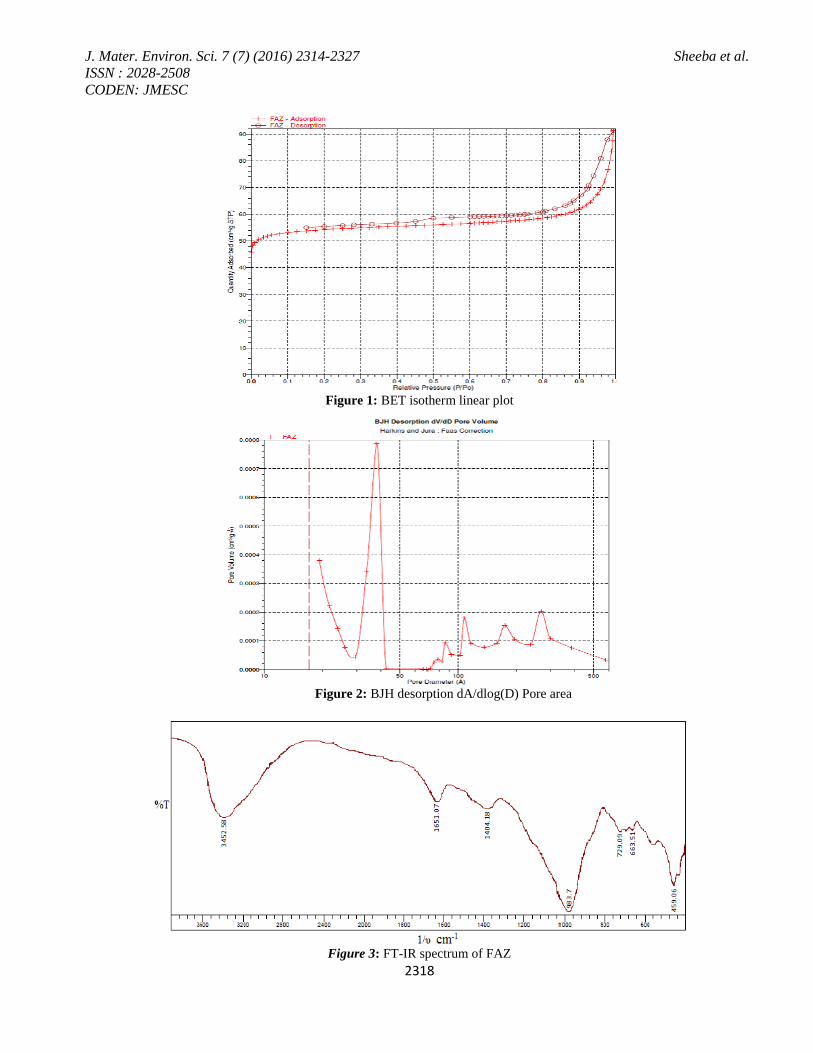
Typical Nitrogen adsorption isotherm along with the pore size distribution has been presented in figures 1 and 2
respectively. The adsorption/desorption isotherm of Nitrogen for FAZ represents type I [11]. Since adsorption
increases within a range, it indicates a definite growth in the number of micro pores, which is one of the defining
features of zeolitic materials. The inflection in the Nitrogen isotherm around P/P0= 0.5-1.0 becomes sharper
indicating narrower and uniform pore size distribution. From the Nitrogen adsorption isotherm data, surface area
and pore diameter have been acquired. A surface area of 172.82 m2/g and pore volume of 0.1412 cm
3/g clearly
indicate that the material has a high order pore system. On the basis of the above mentioned data, it can be
conjectured that the pores in the zeolites are uniform and can facilitate complexation in them. The crystallinity of
the zeolites is reflected by the high surface area of the zeolites. The increase in surface area of fly ash zeolite
(from ~20 m2/g in fly ash) is further an evidence for the formation of zeolite from fly ash. This provides room for
the encapsulation of metal complexes in the pores of the zeolite.
3.1.3. FT-IR analysis
Infra-red spectroscopy can yield information concerning structural details of the zeolite. In general, the IR
spectrum can be split into two groups of vibrations (i) internal vibrations of framework TO4 units which are
insensitive to the structural vibrations and (ii) vibrations related to the external linkages of the TO4 units in the
structure which are sensitive to structural vibrations. The common features observed in the infra-red pattern of
zeolites are asymmetric and symmetric stretch, double ring vibrations and T-O bending modes.
J. Mater. Environ. Sci. 7 (7) (2016) 2314-2327 Sheeba et al.
ISSN : 2028-2508
CODEN: JMESC
2318
Figure 1: BET isotherm linear plot
Figure 2: BJH desorption dA/dlog(D) Pore area
Figure 3: FT-IR spectrum of FAZ
J. Mater. Environ. Sci. 7 (7) (2016) 2314-2327 Sheeba et al.
ISSN : 2028-2508
CODEN: JMESC
2319
The FT-IR of the synthesized FAZ is presented in figure 3. The most intense band at 983 cm-1
is assigned to an
asymmetric stretching of Si-O-Al [12, 13]. The mid infra-red region of the spectrum contains the fundamental
framework vibration of Si(AlO4) groupings. The band (hump) at 1216 cm-1
represents the presence of substituted
Al atoms in the tetrahedral forms of silica frameworks. All these observations confirm the formation of zeolites
on alkali treatment of fly ash. The band at 3452 cm-1
is attributed to the asymmetric and symmetric stretching
vibrations υ(O-H) suggesting the presence of possibly hydrated aluminium silicates. The band at 1651 cm-1
is
attributed to the bending mode of water molecules [14].
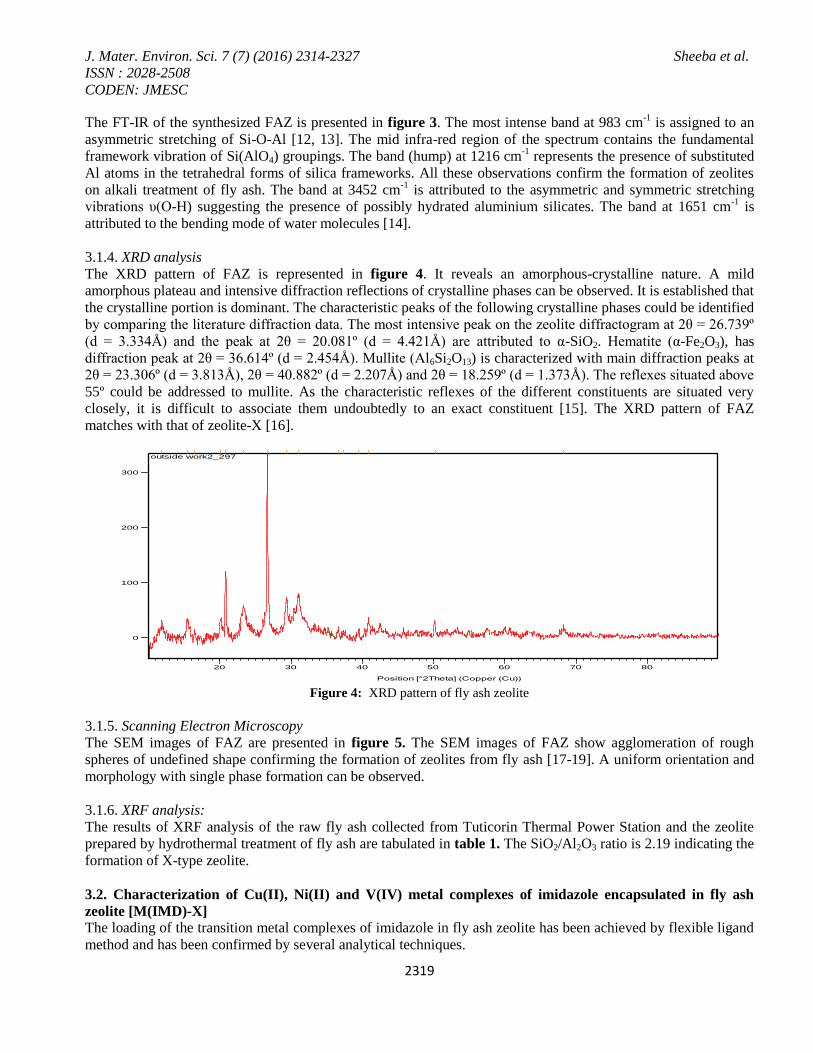
3.1.4. XRD analysis
The XRD pattern of FAZ is represented in figure 4. It reveals an amorphous-crystalline nature. A mild
amorphous plateau and intensive diffraction reflections of crystalline phases can be observed. It is established that
the crystalline portion is dominant. The characteristic peaks of the following crystalline phases could be identified
by comparing the literature diffraction data. The most intensive peak on the zeolite diffractogram at 2θ = 26.739º
(d = 3.334Å) and the peak at 2θ = 20.081º (d = 4.421Å) are attributed to α-SiO2. Hematite (α-Fe2O3), has
diffraction peak at 2θ = 36.614º (d = 2.454Å). Mullite (Al6Si2O13) is characterized with main diffraction peaks at
2θ = 23.306º (d = 3.813Å), 2θ = 40.882º (d = 2.207Å) and 2θ = 18.259º (d = 1.373Å). The reflexes situated above
55º could be addressed to mullite. As the characteristic reflexes of the different constituents are situated very
closely, it is difficult to associate them undoubtedly to an exact constituent [15]. The XRD pattern of FAZ
matches with that of zeolite-X [16].
Figure 4: XRD pattern of fly ash zeolite
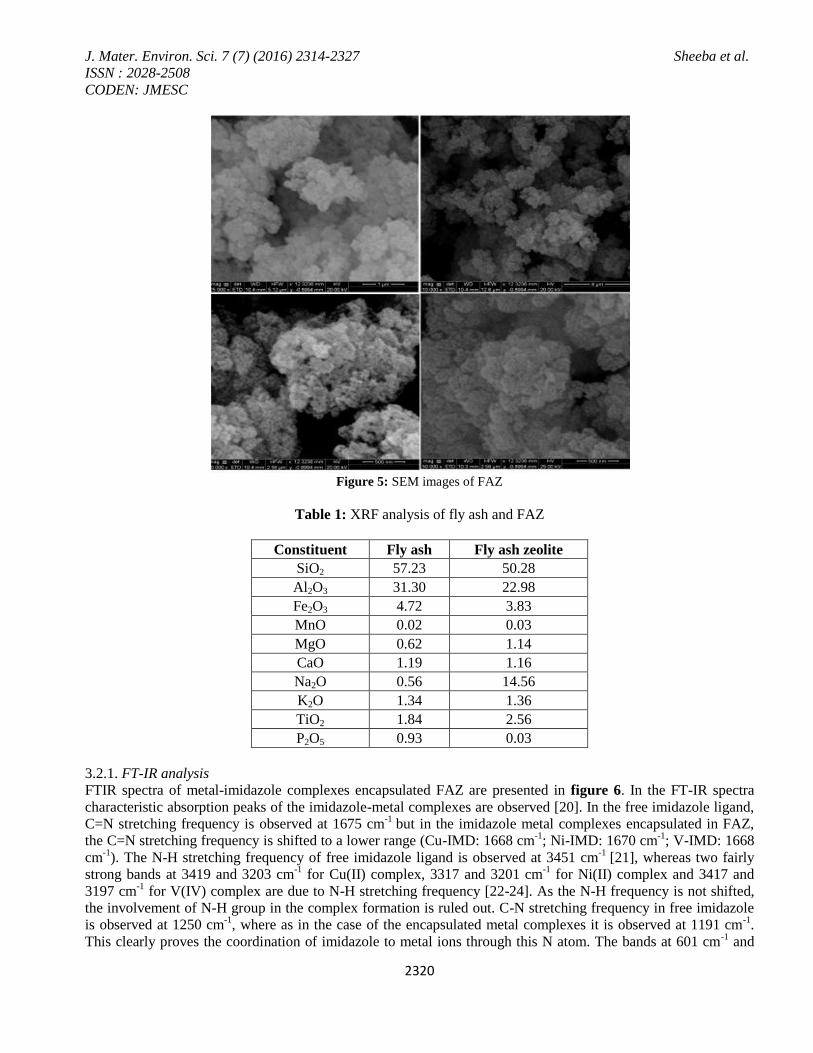
3.1.5. Scanning Electron Microscopy
The SEM images of FAZ are presented in figure 5. The SEM images of FAZ show agglomeration of rough
spheres of undefined shape confirming the formation of zeolites from fly ash [17-19]. A uniform orientation and
morphology with single phase formation can be observed.
3.1.6. XRF analysis:
The results of XRF analysis of the raw fly ash collected from Tuticorin Thermal Power Station and the zeolite
prepared by hydrothermal treatment of fly ash are tabulated in table 1. The SiO2/Al2O3 ratio is 2.19 indicating the
formation of X-type zeolite.
3.2. Characterization of Cu(II), Ni(II) and V(IV) metal complexes of imidazole encapsulated in fly ash
zeolite [M(IMD)-X]
The loading of the transition metal complexes of imidazole in fly ash zeolite has been achieved by flexible ligand
method and has been confirmed by several analytical techniques.
Position [°2Theta] (Copper (Cu))
20 30 40 50 60 70 80
Counts
0
100
200
300
outside work2_297
J. Mater. Environ. Sci. 7 (7) (2016) 2314-2327 Sheeba et al.
ISSN : 2028-2508
CODEN: JMESC
2320
Figure 5: SEM images of FAZ
Table 1: XRF analysis of fly ash and FAZ
Constituent Fly ash Fly ash zeolite
SiO2 57.23 50.28
Al2O3 31.30 22.98
Fe2O3 4.72 3.83
MnO 0.02 0.03
MgO 0.62 1.14
CaO 1.19 1.16
Na2O 0.56 14.56
K2O 1.34 1.36
TiO2 1.84 2.56
P2O5 0.93 0.03
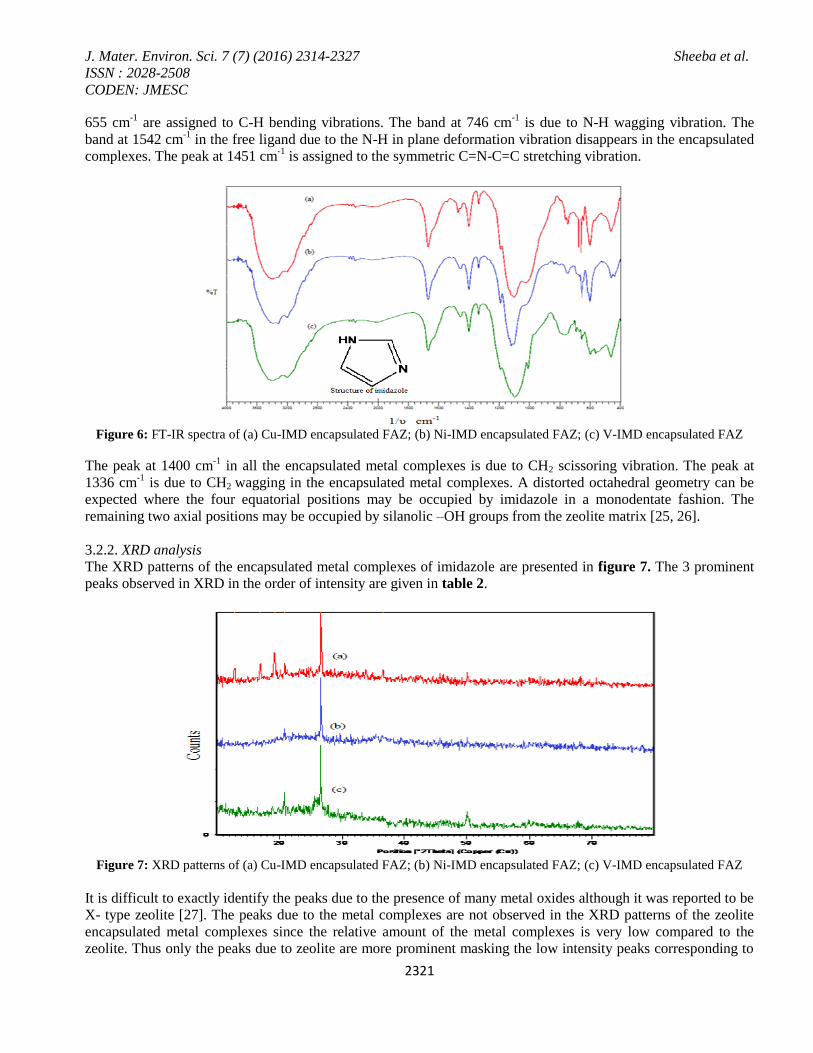
3.2.1. FT-IR analysis
FTIR spectra of metal-imidazole complexes encapsulated FAZ are presented in figure 6. In the FT-IR spectra
characteristic absorption peaks of the imidazole-metal complexes are observed [20]. In the free imidazole ligand,
C=N stretching frequency is observed at 1675 cm-1
but in the imidazole metal complexes encapsulated in FAZ,
the C=N stretching frequency is shifted to a lower range (Cu-IMD: 1668 cm-1
; Ni-IMD: 1670 cm-1
; V-IMD: 1668
cm-1
). The N-H stretching frequency of free imidazole ligand is observed at 3451 cm-1
[21], whereas two fairly
strong bands at 3419 and 3203 cm-1
for Cu(II) complex, 3317 and 3201 cm-1
for Ni(II) complex and 3417 and
3197 cm-1
for V(IV) complex are due to N-H stretching frequency [22-24]. As the N-H frequency is not shifted,
the involvement of N-H group in the complex formation is ruled out. C-N stretching frequency in free imidazole
is observed at 1250 cm-1
, where as in the case of the encapsulated metal complexes it is observed at 1191 cm-1
.
This clearly proves the coordination of imidazole to metal ions through this N atom. The bands at 601 cm-1
and
J. Mater. Environ. Sci. 7 (7) (2016) 2314-2327 Sheeba et al.
ISSN : 2028-2508
CODEN: JMESC
2321
655 cm-1
are assigned to C-H bending vibrations. The band at 746 cm-1
is due to N-H wagging vibration. The
band at 1542 cm-1
in the free ligand due to the N-H in plane deformation vibration disappears in the encapsulated
complexes. The peak at 1451 cm-1
is assigned to the symmetric C=N-C=C stretching vibration.
Figure 6: FT-IR spectra of (a) Cu-IMD encapsulated FAZ; (b) Ni-IMD encapsulated FAZ; (c) V-IMD encapsulated FAZ
The peak at 1400 cm-1
in all the encapsulated metal complexes is due to CH2 scissoring vibration. The peak at
1336 cm-1
is due to CH2 wagging in the encapsulated metal complexes. A distorted octahedral geometry can be
expected where the four equatorial positions may be occupied by imidazole in a monodentate fashion. The
remaining two axial positions may be occupied by silanolic –OH groups from the zeolite matrix [25, 26].
3.2.2. XRD analysis
The XRD patterns of the encapsulated metal complexes of imidazole are presented in figure 7. The 3 prominent
peaks observed in XRD in the order of intensity are given in table 2.
Figure 7: XRD patterns of (a) Cu-IMD encapsulated FAZ; (b) Ni-IMD encapsulated FAZ; (c) V-IMD encapsulated FAZ
It is difficult to exactly identify the peaks due to the presence of many metal oxides although it was reported to be
X- type zeolite [27]. The peaks due to the metal complexes are not observed in the XRD patterns of the zeolite
encapsulated metal complexes since the relative amount of the metal complexes is very low compared to the
zeolite. Thus only the peaks due to zeolite are more prominent masking the low intensity peaks corresponding to
J. Mater. Environ. Sci. 7 (7) (2016) 2314-2327 Sheeba et al.
ISSN : 2028-2508
CODEN: JMESC
2322
the metal complexes. No new peaks are detected in the XRD patterns which indicate the poor loading of the metal
complexes in the zeolite. The peaks are unaffected which shows that the zeolite framework remains intact even
after the encapsulation of the metal complexes [28].
Table 2: Prominent peaks in XRD of M(IMD)-X
Complex 2θ values
FAZ 26.73, 20.79, 29.40
Cu-IMD 26.64, 19.21, 16.95
Ni-IMD 26.62, 20.90
V-IMD 26.59, 20.80, 10.70
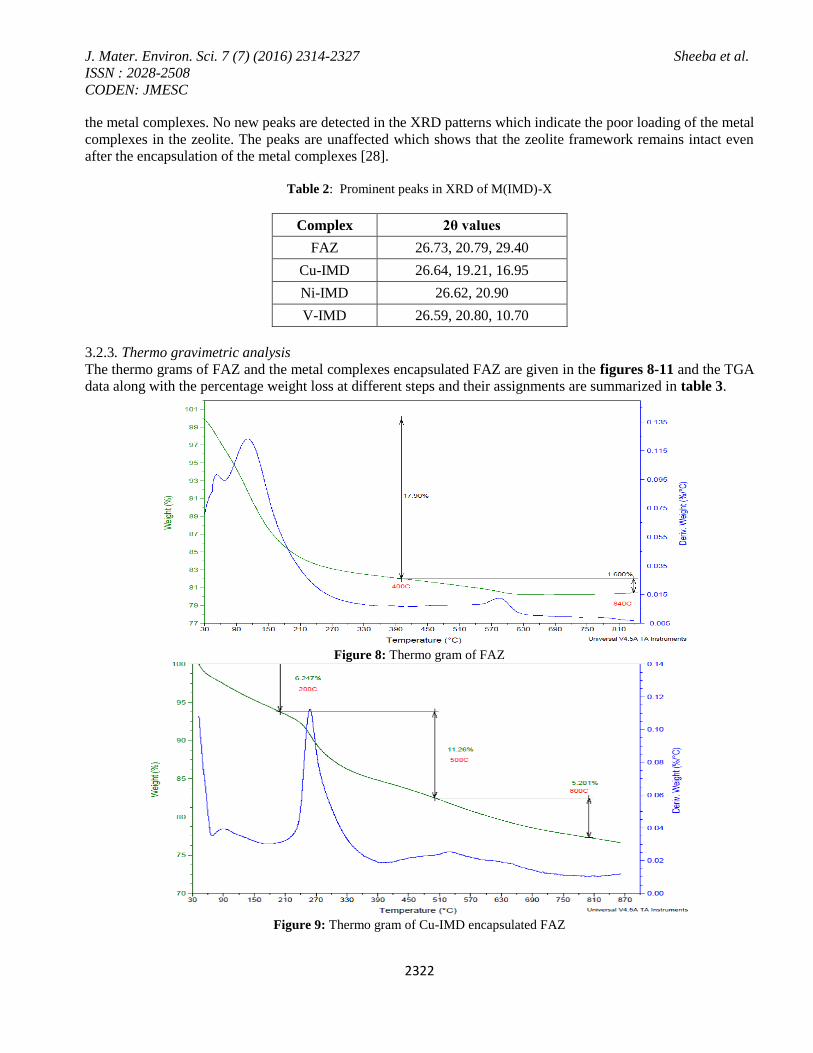
3.2.3. Thermo gravimetric analysis
The thermo grams of FAZ and the metal complexes encapsulated FAZ are given in the figures 8-11 and the TGA
data along with the percentage weight loss at different steps and their assignments are summarized in table 3.
Figure 8: Thermo gram of FAZ
Figure 9: Thermo gram of Cu-IMD encapsulated FAZ
J. Mater. Environ. Sci. 7 (7) (2016) 2314-2327 Sheeba et al.
ISSN : 2028-2508
CODEN: JMESC
2323
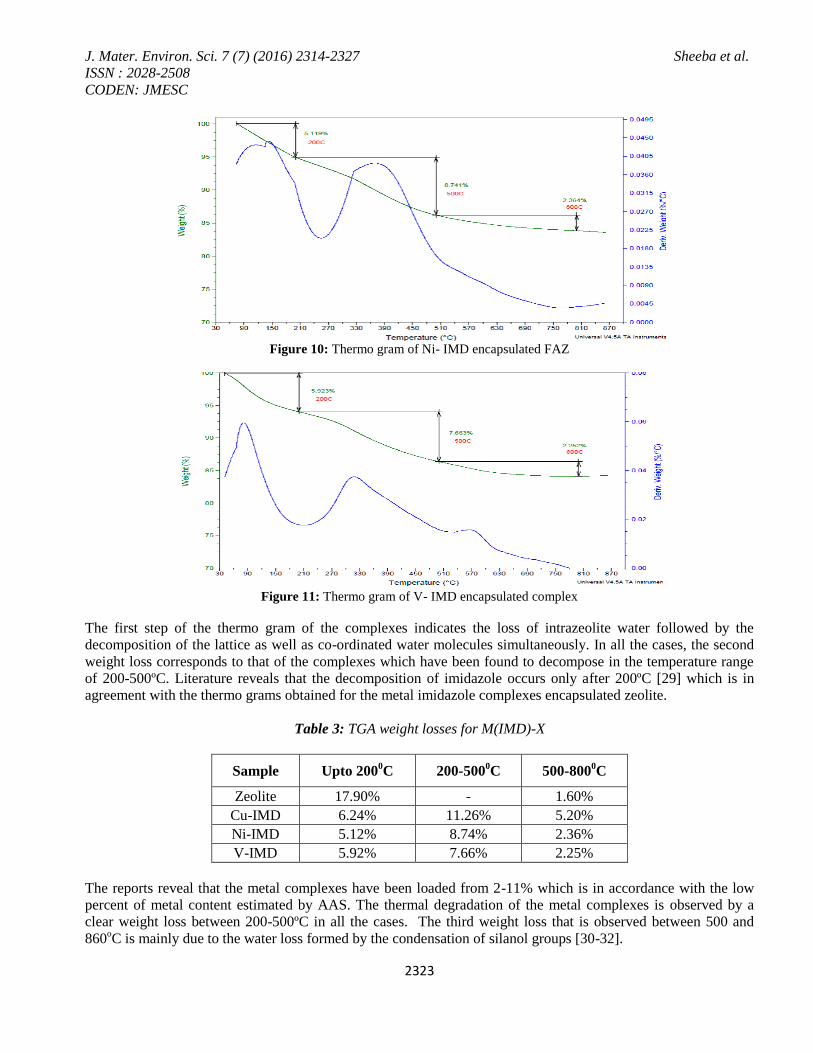
Figure 10: Thermo gram of Ni- IMD encapsulated FAZ
Figure 11: Thermo gram of V- IMD encapsulated complex
The first step of the thermo gram of the complexes indicates the loss of intrazeolite water followed by the
decomposition of the lattice as well as co-ordinated water molecules simultaneously. In all the cases, the second
weight loss corresponds to that of the complexes which have been found to decompose in the temperature range
of 200-500ºC. Literature reveals that the decomposition of imidazole occurs only after 200ºC [29] which is in
agreement with the thermo grams obtained for the metal imidazole complexes encapsulated zeolite.
Table 3: TGA weight losses for M(IMD)-X
Sample Upto 2000C 200-500
0C 500-800
0C
Zeolite 17.90% - 1.60%
Cu-IMD 6.24% 11.26% 5.20%
Ni-IMD 5.12% 8.74% 2.36%
V-IMD 5.92% 7.66% 2.25%
The reports reveal that the metal complexes have been loaded from 2-11% which is in accordance with the low
percent of metal content estimated by AAS. The thermal degradation of the metal complexes is observed by a
clear weight loss between 200-500ºC in all the cases. The third weight loss that is observed between 500 and
860oC is mainly due to the water loss formed by the condensation of silanol groups [30-32].
J. Mater. Environ. Sci. 7 (7) (2016) 2314-2327 Sheeba et al.
ISSN : 2028-2508
CODEN: JMESC
2324
3.2.4. Atomic Absorption Spectrometry
Each metal complex encapsulated zeolite (50 mg) was dissolved in 20 mL of hydrofluoric acid (40%) and was
analyzed by atomic absorption spectrophotometer. The report confirms the presence of the corresponding metal
ions, (Cu: 14.2 ppm, Ni: 100.4 ppm), in the solution which further proves the encapsulation of the metal complex
in the zeolite.
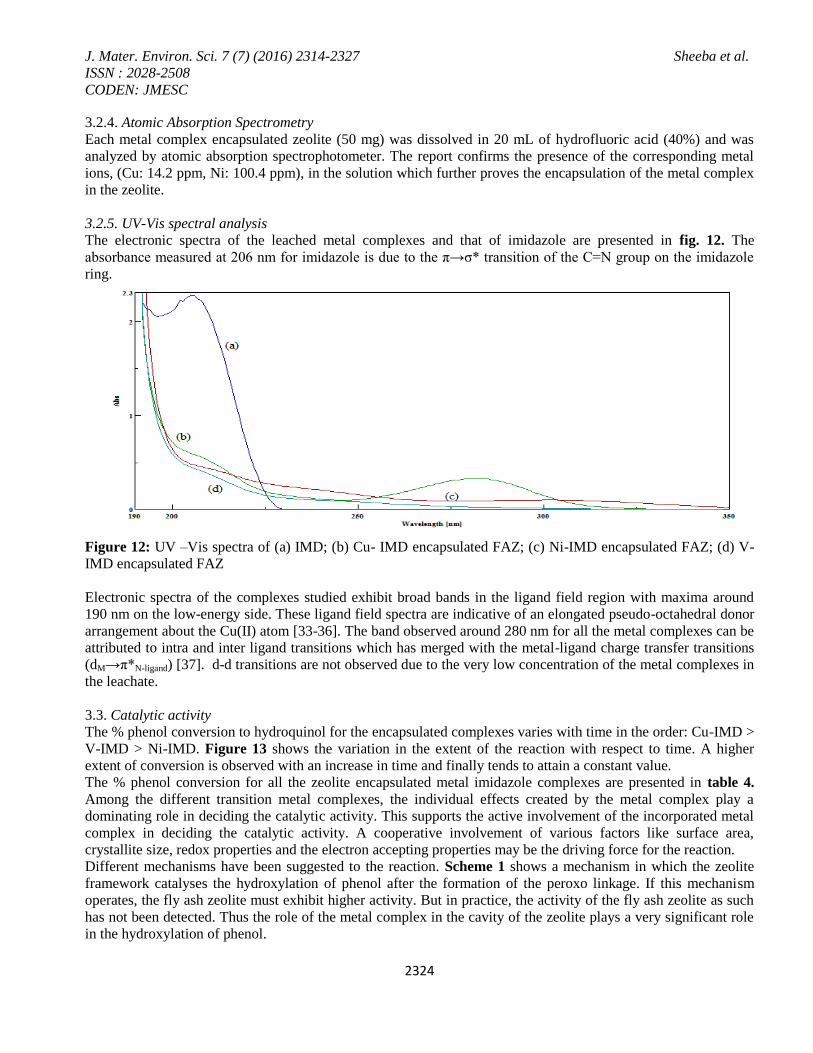
3.2.5. UV-Vis spectral analysis
The electronic spectra of the leached metal complexes and that of imidazole are presented in fig. 12. The
absorbance measured at 206 nm for imidazole is due to the π→σ* transition of the C=N group on the imidazole
ring.
Figure 12: UV –Vis spectra of (a) IMD; (b) Cu- IMD encapsulated FAZ; (c) Ni-IMD encapsulated FAZ; (d) V-
IMD encapsulated FAZ
Electronic spectra of the complexes studied exhibit broad bands in the ligand field region with maxima around
190 nm on the low-energy side. These ligand field spectra are indicative of an elongated pseudo-octahedral donor
arrangement about the Cu(II) atom [33-36]. The band observed around 280 nm for all the metal complexes can be
attributed to intra and inter ligand transitions which has merged with the metal-ligand charge transfer transitions
(dM→π*N-ligand) [37]. d-d transitions are not observed due to the very low concentration of the metal complexes in
the leachate.
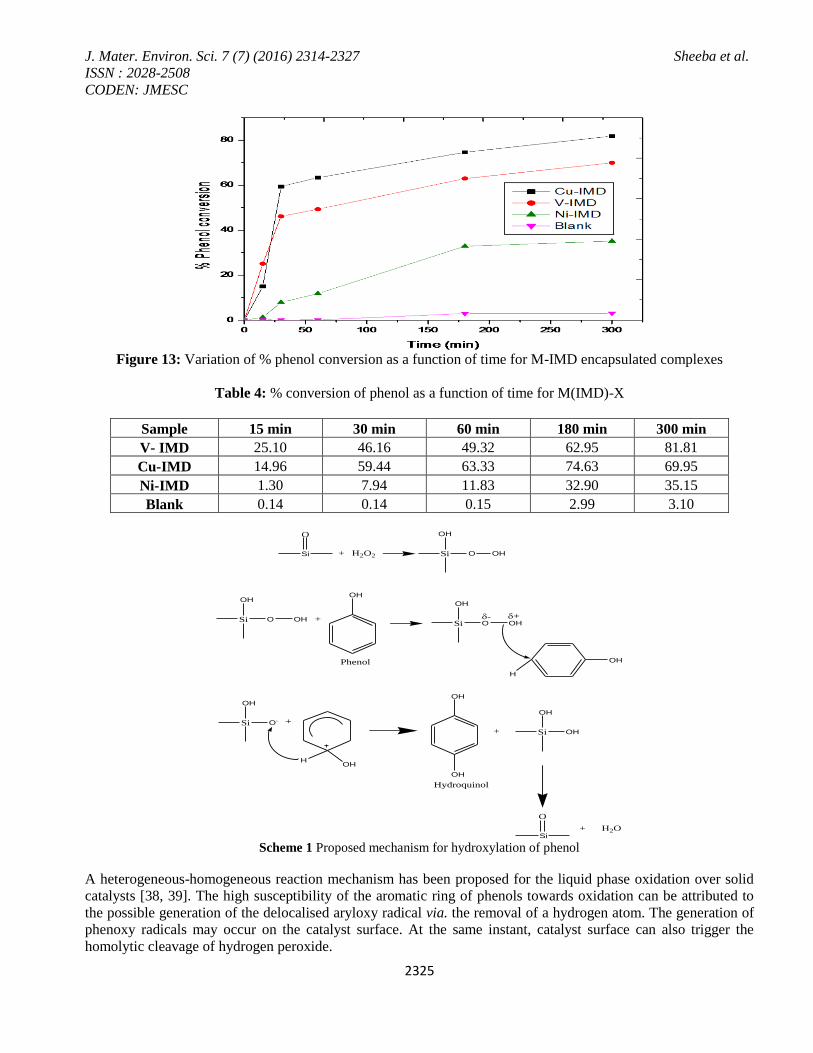
3.3. Catalytic activity
The % phenol conversion to hydroquinol for the encapsulated complexes varies with time in the order: Cu-IMD >
V-IMD > Ni-IMD. Figure 13 shows the variation in the extent of the reaction with respect to time. A higher
extent of conversion is observed with an increase in time and finally tends to attain a constant value.
The % phenol conversion for all the zeolite encapsulated metal imidazole complexes are presented in table 4.
Among the different transition metal complexes, the individual effects created by the metal complex play a
dominating role in deciding the catalytic activity. This supports the active involvement of the incorporated metal
complex in deciding the catalytic activity. A cooperative involvement of various factors like surface area,
crystallite size, redox properties and the electron accepting properties may be the driving force for the reaction.
Different mechanisms have been suggested to the reaction. Scheme 1 shows a mechanism in which the zeolite
framework catalyses the hydroxylation of phenol after the formation of the peroxo linkage. If this mechanism
operates, the fly ash zeolite must exhibit higher activity. But in practice, the activity of the fly ash zeolite as such
has not been detected. Thus the role of the metal complex in the cavity of the zeolite plays a very significant role
in the hydroxylation of phenol.
J. Mater. Environ. Sci. 7 (7) (2016) 2314-2327 Sheeba et al.
ISSN : 2028-2508
CODEN: JMESC
2325
Figure 13: Variation of % phenol conversion as a function of time for M-IMD encapsulated complexes
Table 4: % conversion of phenol as a function of time for M(IMD)-X
Sample 15 min 30 min 60 min 180 min 300 min
V- IMD 25.10 46.16 49.32 62.95 81.81
Cu-IMD 14.96 59.44 63.33 74.63 69.95
Ni-IMD 1.30 7.94 11.83 32.90 35.15
Blank 0.14 0.14 0.15 2.99 3.10
+ H2O2 Si
OH
O OH
Si
OH
O OH +
OH
Si
OH
O OH+-
OH
H
Si
OH
O- +
HOH
OH
OH
+ Si
OH
OH
O
Si+ H2O
O
Si
Hydroquinol
Phenol
Scheme 1 Proposed mechanism for hydroxylation of phenol
A heterogeneous-homogeneous reaction mechanism has been proposed for the liquid phase oxidation over solid
catalysts [38, 39]. The high susceptibility of the aromatic ring of phenols towards oxidation can be attributed to
the possible generation of the delocalised aryloxy radical via. the removal of a hydrogen atom. The generation of
phenoxy radicals may occur on the catalyst surface. At the same instant, catalyst surface can also trigger the
homolytic cleavage of hydrogen peroxide.
J. Mater. Environ. Sci. 7 (7) (2016) 2314-2327 Sheeba et al.
ISSN : 2028-2508
CODEN: JMESC
2326
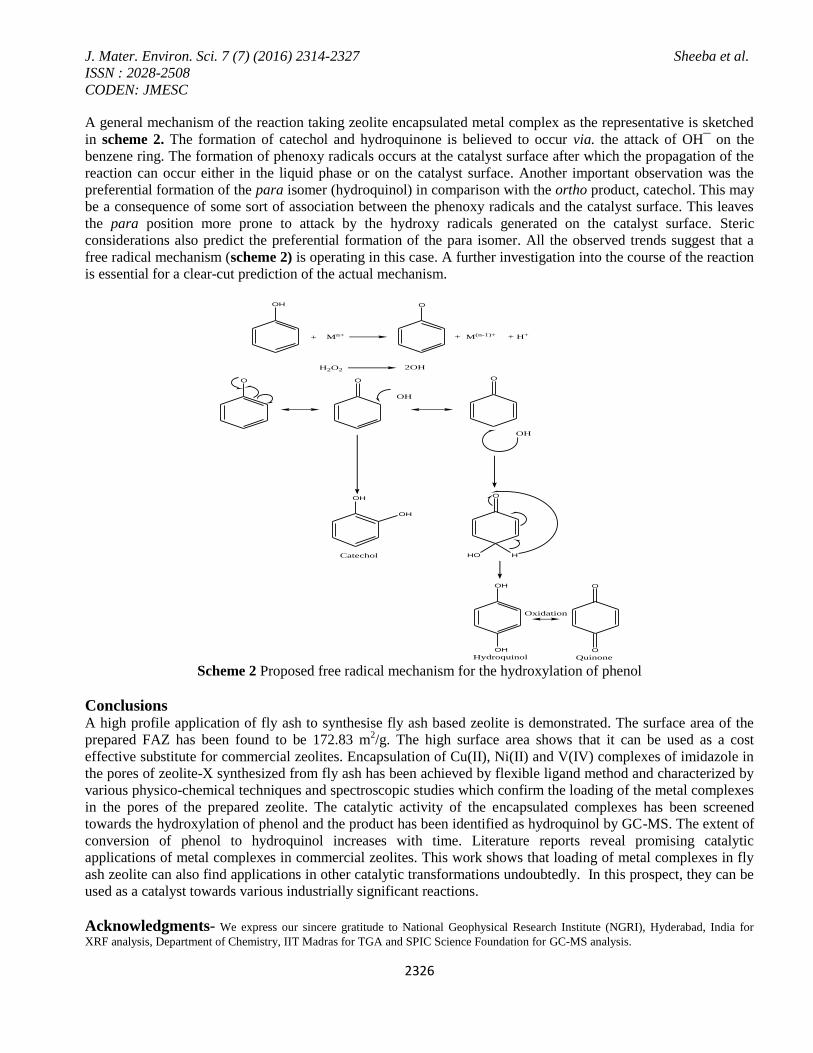
A general mechanism of the reaction taking zeolite encapsulated metal complex as the representative is sketched
in scheme 2. The formation of catechol and hydroquinone is believed to occur via. the attack of OH¯ on the
benzene ring. The formation of phenoxy radicals occurs at the catalyst surface after which the propagation of the
reaction can occur either in the liquid phase or on the catalyst surface. Another important observation was the
preferential formation of the para isomer (hydroquinol) in comparison with the ortho product, catechol. This may
be a consequence of some sort of association between the phenoxy radicals and the catalyst surface. This leaves
the para position more prone to attack by the hydroxy radicals generated on the catalyst surface. Steric
considerations also predict the preferential formation of the para isomer. All the observed trends suggest that a
free radical mechanism (scheme 2) is operating in this case. A further investigation into the course of the reaction
is essential for a clear-cut prediction of the actual mechanism.
OH
+ Mn+
O
+ M(n-1)+ + H+
H2O2 2OH
O O
OH
O
OH
OH
OH
Catechol
O
HO H
OH
OH
O
O
Hydroquinol Quinone
Oxidation
Scheme 2 Proposed free radical mechanism for the hydroxylation of phenol
Conclusions A high profile application of fly ash to synthesise fly ash based zeolite is demonstrated. The surface area of the
prepared FAZ has been found to be 172.83 m2/g. The high surface area shows that it can be used as a cost
effective substitute for commercial zeolites. Encapsulation of Cu(II), Ni(II) and V(IV) complexes of imidazole in
the pores of zeolite-X synthesized from fly ash has been achieved by flexible ligand method and characterized by
various physico-chemical techniques and spectroscopic studies which confirm the loading of the metal complexes
in the pores of the prepared zeolite. The catalytic activity of the encapsulated complexes has been screened
towards the hydroxylation of phenol and the product has been identified as hydroquinol by GC-MS. The extent of
conversion of phenol to hydroquinol increases with time. Literature reports reveal promising catalytic
applications of metal complexes in commercial zeolites. This work shows that loading of metal complexes in fly
ash zeolite can also find applications in other catalytic transformations undoubtedly. In this prospect, they can be
used as a catalyst towards various industrially significant reactions.
Acknowledgments- We express our sincere gratitude to National Geophysical Research Institute (NGRI), Hyderabad, India for
XRF analysis, Department of Chemistry, IIT Madras for TGA and SPIC Science Foundation for GC-MS analysis.
J. Mater. Environ. Sci. 7 (7) (2016) 2314-2327 Sheeba et al.
ISSN : 2028-2508
CODEN: JMESC
2327
References 1. Haque E.M., Internat. J. Waste Resources 3(1) (2013) 22.
2. Ramamurthy V., Lakshminarasimhan P., Grey C.P., Johnston L.J., Chem. Commun. (1998) 2411.
3. Meinershagen J.L., Bein T., J. Am. Chem. Soc. 121 (1998) 448.
4. Sykora M., Maruszewski K., Treffert-Ziemelis S.M., Kincai J.R., J. Am. Chem. Soc. 120 (1998) 3490.
5. Raj I.V.P., Shaikh T.M., Sudalai A., Acta Chim. Slov. 57 (2010) 466.
6. Peter Amaladhas T., Sheeba Thavamani S., Adv. Mat. Lett. 4(3) (2013) 213.
7. Arun S., Systematic Laboratory Experiments in Organic Chemistry, 2nd edn. (New Age International, 2010)
825.
8. Jeffery G.H., Basset J., Mendham J., Denney R.C., Vogel’s textbook of quantitative chemical analysis, 5th edn.
(Longman Scientific & Technical, England, 1989), 408.
9. Amrhein C., Haghnia G.H., Kim T.S., Mosher P.A., Gagajena R.C., Amanios T., Torre L.D.L., Environ. Sci.
Technol. 30 (1996) 735.
10. Berkgaut V., Singer A., Appl. Clay Sci. 10 (1996) 369.
11. IUPAC Manual of Symbol and Terminoogy for Physicochemical Quantities and Units. Appendix II.
Definitions, Terminology and Symbols in Colloid and Surface Chemistry. Part1. Pure Appl. Chem. 31(4)
(1972) 579.
12. Davidova M., Nachtigallova D., Bulanek R., Nachtigall P., J. Phys. Chem. B. 107(10) (2003) 2327.
13. Gupta N., Kushwaha A.K., Chattopadhyaya M.C., Adv. Mat. Lett. 2(4) (2011) 309.
14. Charles A.G., Eur. J. Mineral. 24(3) (2012) 439.
15. Boycheva S., J. Chem. Technol. Metall. 47(2) (2012) 155.
16. Franus W., Pol. J. Environ. Stud. 21(2) (2012) 337.
17. Mimura H., Yokota K., Akiba K., Onodera Y.J., Nucl. Sci. Technol. 38(9) (2001) 766.
18. Belviso C., Cavalcante F., Fiore S., Waste Manage. (Oxford) 30(5) (2010) 839.
19. Pengthamkeerati P., Satapanajaru T., Chularuengoaksorn P., Fuel 87 (2008) 2469.
20. Otting W., Chem. Ber., 89 (1956) 2887.
21. Lane T.J., Nakagawa I., Walter J.L., Kandathil A.J., Inorg. Chem. 1(2) (1962) 267.
22. Davis J.W., Smith J., J. Chem. Soc. A. (1971) 317.
23. Hodgson B.J., Percy C.G., Thornton A.D., Spectrochem. Acta. A 35 (1979) 949.
24. Barbara M.O., Ewa R.S., Danuta M., J. Mol. Struct. 1028 (2012) 49.
25. Suaad T.S., Iraqi National Journal of Chemistry 36 (2009) 605.
26. Denis P.D., David M.M., Alistair J.L., Inorg. Chim. Acta 148 (1988) 173.
27. Ojha K., Pradhan N.C., Samanta A.N., Bull. Mater. Sci. 27 (2004) 555.
28. Bhagya K.N., Gayathri V., J. Porous Mater. 20(1) (2012) 257.
29. Omrani A., Simon L.C., Rostami A.A., Mousa G., Thermochemica Acta 468 (2008) 39.
30. Peter Amaladhas T., Sheeba Thavamani S., Adv. Mat. Lett. 4(9) (2013) 688.
31. Laobuthee A., Chirachanchai S., Ishida H., Polym. Degrad. Stab. 7(6) (2001) 1.
32. Olcay S., Turkish J. Pharm. Sci. 3(2) (2006) 61.
33. Kohout J., Hvastijova M., Jozef K., Diaz J.G., Valko M., Jager L., Svoboda I., Inorg. Chim. Acta 287 (1999)
186.
34. Hathaway B.J., Billing D.E., Coord. Chem. Rev. 5 (1970) 143.
35. Tabbi G., Giuffrida A., Bonomo R.P., J. Inorg. Biochem. 128 (2013) 137.
36. Hathaway B.J., J. Chem. Soc., Dalton Trans. (1972) 1196.
37. Malecki J.G., Maron A., Polyhedron 40 (2012) 125.
38. Meyer C., Clement G., Balaceanu J.C., Proc. Jrd Int. Congr. On Catalysis 1 (1965) 184.
39. Sadana A., Katzer J.R., J Catal. 35 (1974) 140.
(2016) ; http://www.jmaterenvironsci.com/