Embed Size (px)
Citation preview
1
ENCORE+ Feasibility Study
Generating random-realistic topologies for electricity
distribution networks
Sathsara Abeysinghe
Meysam Qadrdan
Cardiff University, UK

2
ACKNOWLEDGEMENT
The authors would like to gratefully acknowledge the funding received for this feasibility study from
the ENCORE Network+, which is an EPSRC funded project.
A special thanks goes to Ms. Diane Palmer of Loughborough University for her support in GIS related
work.
Authors:
Sathsara Abeysinghe
Meysam Qadrdan
April 2018

3
ABSTRACT
In this feasibility study, the possibility of producing realistic electricity distribution network topologies
using information directly from Geographical Information Systems (GIS) about the population
distribution together with the concepts in complexity science for generating networks is investigated.
A large amount of real-world electricity distribution network data was collected from the distribution
networks in the UK, and the statistical properties that describes their network topologies were
identified and quantified. The relationship between the statistical properties of the electricity
distribution networks and the population densities of the selected areas in the UK was studied. It was
identified that distribution of the population has a great impact on the structural characteristics of
electricity distribution networks. Therefore, an algorithm was proposed to generate random network
topologies to match with the actual electricity distribution networks for a given area in the UK, by
using the GIS information that is freely available about the population distribution in the UK together
with the properties of the real-world networks. The limitations of the proposed algorithm and the
possible future work are discussed.

4
TABLE OF CONTENT
Chapter 1: Introduction 5
1.1 Background 5
1.2 Research Challenges 6
1.3 Research Objectives 6
Chapter 2: Data collection and analysis 8
2.1 Introduction 8
2.2 Data collection 8
2.3 Data analysis 11
2.3.1 Selection of software 11
2.3.2 Calculation of population densities using GIS data 11
2.3.3 Statistical properties of the 11kV electricity distribution networks 15
Chapter 3: Generation of random-realistic distribution network topologies 28
3.1 Introduction 28
3.2 Algorithm for generating distribution network topologies 28
3.2.1 Inputs required by the algorithm 28
3.2.2 Flowchart of the algorithm 29
3.3 Validation 31
Chapter 4: Summary, conclusions and future work 33
4.1 Summary and conclusions 33
4.2 Future work 34
APPENDIX A 35
References 40
5
Chapter 1: Introduction
1.1 Background
The electrical power system is one of the most critical infrastructures of a country. Electricity
distribution networks are very large and topologically complex systems which connect the high voltage
transmission grid to end users. With a large penetration of Low Carbon Technologies (LCTs) at the
Medium Voltage (MV) and Low Voltage (LV) levels, electricity distribution networks are undergoing
rapid changes.
Much research have been carried out to analyse the impact of employing LCTs on electricity
distribution networks, and most of these studies are based on either synthetic or real network
samples. Results of such studies are usually case specific and are of limited applicability to other
networks of the same type (e.g. urban/sub-urban/rural). Robust conclusions about how different
types of networks experience the impact of the LCTs, have great value for decision-making and policy
support. A network modelling and simulation platform with the ability to provide statistically-similar
realistic representations of electricity distribution networks, can be used to make such robust and
generalised conclusions through a large number of simulation studies.
Identifying and quantifying the important statistical properties of different types of distribution
networks is a key requirement when developing such random, realistic network samples. Statistical
properties of electric power networks can be categorised into two groups: topological properties and
electrical properties. Both electrical and topological properties of electricity distribution networks
have a significant impact on the overall network performance including voltage drop, power losses,
network reliability and costs.
In order to address the above research question a ‘statistical assessment tool for electricity
distribution networks’ was implemented [1]. The ability to generate realistic, random test networks
with similar topological and electrical properties is one of the key features of this tool. The generated
ensembles of different types of distribution networks can be used for various network studies
including power flow simulation studies to analyse the impacts caused by the integration of new LCTs.
The implementation of the tool was mainly based on real world data collected from Chinese electricity
distribution networks. The data includes the detailed technical, geographical and some demographic
information. Topological properties of 10 kV Chinese electricity distribution networks were
investigated using Complex Networks Analysis (CNA) techniques and methodologies supported by
graph theory applications [2]. The results from the topological investigation were used to generate

6
statistically similar network topologies. The related previous research done by the author can be
summarised using the Figure 1.
Figure 1:1: Related previous research.
1.2 Research Challenges
The above approach to provide many random-realistic networks is challenging due to several reasons.
Usually the amount of information in the data files is huge and needs lot of time and efforts in
extracting the topological and electrical properties of the networks. Therefore in this feasibility study
a new approach will be trialled to produce statistically similar network topologies to get to the same
end point of the above research.
There is abundant evidence suggesting that complex engineering systems can be represented using
various growth models from complexity science (e.g.: fractal growth, diffusion-limited
aggregation/DLA) [3], [4], [5], [6]. A few, complex networks theory and fractal theory-based new
statistical models/tools that have been developed for the modelling of power networks were found
in the literature. Majority of such models/tools have been developed for HV power networks [7].
Statistical models/tools that has been developed for the MV and LV networks are based on the fractal
generating methods. So far, these fractal models are limited for certain geographic areas where the
fractal properties of the real-world distribution networks have been observed [3], [4].
1.3 Research Objectives
The objective of this feasibility study is to investigate the possibility of producing realistic electricity
distribution network topologies using information directly from Geographical Information Systems
(GIS) about the population distribution together with the concepts in complexity science for
generating networks. The approach for the proposed feasibility study is shown in the Figure 2.
Figure 1:2: Proposed feasibility study
In order to conduct the proposed feasibility study, this research set out to achieve the following goals,
7
(i) Collect large amount of GIS data one real-world electricity distribution networks and
population distribution information.
(ii) Choose suitable software to work with GIS data, and analyse the structural properties of
the electricity distribution networks and their relationship with the population
distribution in a given area.
(iii) Come up with a methodology for the generation of random-realistic distribution network
topologies by using the information on population distribution of a given area and the
structural properties of the real-world networks.
The final goal of generating these large number of random realistic test networks is to use them in
network studies where the network uncertainties are studied with a large penetration of LCTs on the
electricity distribution networks. Therefore, this project proposal will fit in to the following ENCORE
thematic area:
Managing uncertainty in Complex Engineering Systems.

8
Chapter 2: Data collection and analysis
2.1 Introduction
Identifying and quantifying the important statistical properties of real-world electricity distribution
networks have immediate benefits of providing random, realistic test network models for various
simulation studies. In this chapter, the relationship between the population distribution and the
topological structures of the electricity distribution networks are analysed.
Electricity distribution networks of 11kV voltage level in the Cardiff area was used for the analysis.
Data sources, limitations of the available data from those sources and the data analysis procedure is
explained in detail in the following sections.
2.2 Data collection
Four different data sets were collected for this study.
● Electricity network data
Electricity network data was the primary information required for this study. Electricity network data
required for this study was collected from Western Power Grid (WPD), UK. The information was
available in the format of shape files. The shapefile format is a digital vector storage format for storing
geometric location and associated attribute information.
Geographical locations of the electrical substations, transmission and distribution towers, and
transmission and distribution lines together with their attribute values (e.g.: Voltage level, type of the
cable, etc.) were available in these shape files.
For example, Figure 2.1 shows the 11kV level electricity distribution network in Cardiff area. The
spatial distribution of the 11kV and 33kV ground mounted and pole mounted substations and 11kV
level underground cables and overhead lines are shown in the map. The selected area in Cardiff used
for the analysis is highlighted in purple colour in the map.

9
Figure 2:1. 11kV Electricity distribution network in Cardiff area.
● 1 km2 grid squares from national grid reference system
The Ordnance Survey National Grid reference system is a system of geographic grid references used
in Great Britain, distinct from latitude and longitude. According to this grid referencing system the
map of the Great Britain is divided into squares of different sizes (e.g.: 20km, 10km, 1km, 100m). The
1km reference grid was selected for this study to analyse the electricity distribution network
properties and population density information within 1kmx1km square areas of Cardiff. The grid data
was downloaded in shapefile format from the following source.
http://edina.ac.uk/projects/sharegeo/content.html
● UK census data
Population census data from the UK was collected for this study. A population census, by the
definition, is a complete process of collection, reception, assessment, analysis, publication and
distribution of demographic, economic and social data, which relate, at a given moment in time, to all
the residents of a country or of a well-defined partial geographic area; as reflected in the Population
and Housing Censuses Handbook of the UN, 1992. Population census data usually contains
enumeration of the population, with details as to age, sex, occupation, etc. However, for this analysis
‘total population’ in a given area was used.

10
Census area statistics contain a pointer (generally a code such as 'E09000022' which represents the
2011 code for the London Borough of Lambeth), to the geographical census areas to which they relate.
By linking census area statistics with the corresponding digitised boundary datasets for a specific
census year, the census attributes can be visualised as a map. Mapping census datasets in this way
allows for an exploration of the characteristics of census datasets geographically and may provide
additional demographic, socio-economic and cultural insights into the census data.
UK census data required for this analysis was collected from the following data source.
https://www.nomisweb.co.uk/census/2011/data_finder
● UK census-boundary data
It was important to identify the accurate census-boundaries to make use of the population data
collected from the above data source. Therefore, UK census-boundary data required for this study
was collected from the following data source.
https://census.ukdataservice.ac.uk/get-data/boundary-data
The digitised co-ordinates (points, lines, areas) make up these census geographies are available as
digitised boundary datasets. With relevant to the UK census information, there are several levels of
boundaries. For example, Lower Layer Super Output Areas are built from groups of contiguous Output
Areas and have been automatically generated to be as consistent in population size as possible, and
typically contain from four to six Output Areas. The Minimum population is 1000 and the mean is
1500. Output Areas are built from clusters of adjacent unit POSTCODES in the United Kingdom and are
the base unit for Census data releases. Due to their smaller size, Output Areas allow for a finer
resolution of data analysis. They are the smallest area for which detailed Census results are available.
They have an average population size of 125 households and around 300 residents, each clustered
around a single mode, always above the confidentiality thresholds of at least 100 residents and 40
households.
For this study ‘Output Areas’ were used as the UK census boundary to extract the total population
information with the maximum possible resolution.
Boundary data and census data was mapped together in the Arcmap platform to visualise the
population distribution in Cardiff area of the Wales, UK (Figure 2:2).

11
Figure 2:2. Population distribution in census output areas.
2.3 Data analysis
2.3.1 Selection of software
It was important to select a software which can work with the GIS data of the real-world electricity
distribution networks and census data.
ArcGIS software was selected for this study. ArcMap, is the central application used in ArcGIS. ArcMap
uses a rich suite of tools for performing spatial analysis and managing GIS data in an automated way.
It can display and explore GIS datasets for a selected study area, where the user can assign symbols,
and create map layouts for printing or publication.
ArcMap represents geographic information as a collection of layers and other elements in a map.
Choosing an appropriate coordinate system for the map is often an important step to create a map
display that will meet the needs of the study. Each data set should have matching coordinate system
for the map display. ‘British National Grid’ coordinate system has been used for all the data sets
selected for this study. Then the electricity distribution network data and census data were
represented as separate layers in the ArcMap application. Figures 2:1 and 2:2 are visualisations
obtained from the ArcMap application.
2.3.2 Calculation of population densities using GIS data
The collected census data holds the information on total population of the output areas of Cardiff
(Figure 2:2). However, population density is a more suitable parameter to find out the relationship
between population distribution and the spatial structure of the electricity distribution networks.

12
Therefore the population densities of output areas of Cardiff was obtained by simply dividing the total
population by the area of the selected ‘Output Area’ of Cardiff.
𝑃𝑜𝑝𝑢𝑙𝑎𝑡𝑖𝑜𝑛 𝑑𝑒𝑛𝑠𝑖𝑡𝑦(𝑁𝑢𝑚𝑏𝑒𝑟 𝑜𝑓 𝑝𝑒𝑜𝑝𝑙𝑒 𝑝𝑒𝑟 𝑘𝑚2)
=𝑇𝑜𝑡𝑎𝑙 𝑝𝑜𝑝𝑢𝑙𝑎𝑡𝑖𝑜𝑛 𝑜𝑓 𝑎 𝑔𝑖𝑣𝑒𝑛 𝑎𝑟𝑒𝑎 (𝑁𝑢𝑚𝑏𝑒𝑟 𝑜𝑓 𝑝𝑒𝑜𝑝𝑙𝑒)
𝐴𝑟𝑒𝑎 (𝑘𝑚2) (2.1)
Figure 2:3 shows the population densities of the Cardiff census ‘Output Areas’.
Figure 2:3. Population densities in census output areas of Cardiff.
Figure 2:4 shows the visualisation of the electricity distribution network data layers and population
density information layers mapped on top of each other in the ArcMap platform. It can be observed
from the Figure 2:4 that the densely populated areas have many electrical substations and electricity
distribution lines whereas in the lightly populated areas the electrical substations are sparsely
distributed. However, to study the relationship between population density and the statistical
properties of the electricity distribution networks the selected area of Cardiff is divided in to 1km2
square areas. This is done by using the national grid reference of 1km2 (Figure 2:5). Excluding the
boundary squares, there were 125 complete 1kmx1km squares in the selected area in Cardiff (i.e.
complete squares highlighted with purple colour in the Figure 2:5.).

13
Figure 2:4. Population densities and electricity distribution network data in Cardiff area.
Figure 2:5. Cardiff area divided into 1km square areas.

14
The goal is to obtain a single number for the population density for each square km area shown in the
map in Figure 2:5. As seen in the Figure 2:6 each square km area sometimes consists of several ‘Output
Areas’ with different population densities. Therefore, using the available tools and functions in the
ArcMap platform the total population in each square km (i.e this value is same as the population
density in each square km) is obtained. Figure 2:7 shows the representation of the population
densities obtained for the 1kmx1km squares in the Figure 2:6. Population densities calculated for all
the 1kmx1km squares in the selected area of Cardiff is shown in the second column of the Table A.1
in Appendix A.
Figure 2:6. Population density distribution within 1kmx1km squares within a 5kmx5km square area in Cardiff.
Figure 2:7. Population density representation of the 1kmx1km squares within a 5kmx5km square area in Cardiff.

15
2.3.3 Statistical properties of the 11kV electricity distribution networks
In this section the variations of the statistical properties of the electricity distribution networks with
the population densities are studied. The statistical properties of the electricity distribution networks
considered in this study are,
(i) Variation of primary (33kV) and secondary (11kV) substation count per square km with
population densities. (Total number of substations, number of ground mounted substations
and number of pole mounted substations per 1km square are studied separately).
(ii) Variation of the distribution line length per square km with population densities. (Total
network length, underground cable lengths and overhead line lengths per 1km square are
studied separately).
(iii) Variation of the box-counting dimension of the distribution of secondary substations with
population densities.
● Variation of 11kV secondary substation count per square km with population density
In the electricity distribution networks of UK, the secondary substations, where power is transformed
from 11kV down to the 0.4kV LV system comes in different types. In urban areas secondary substations
are mostly ground mounted and has higher installed capacities than in rural areas. In rural areas pole
mounted substations are widely used. This property of the electricity distribution networks was
observed from the data collected from the Cardiff area.
The same 5kmx5km square area in the Figures 2:6 and 2:7 is considered. The distribution of the 11kV
level ground mounted and pole mounted substations are shown in the Figures 2:8 (a) and (b)
respectively. It can be clearly seen from the Figures 2:8 (a) and (b) that, in densely populated areas
the substation density is higher and ground mounted substations are widely used, while in the less
populated areas the substation density is lower and pole mounted substations are widely used.
Figure 2:8 Distribution of (a) ground mounted (b) pole mounted 11kV secondary substations.

16
Usually, 11kV distribution network is supplied by primary substations which transforms voltage from
33kV to 11kV. Primary substations are often sited close to large industrial customers or at the load
centres. The distribution of the 33kV primary substations in the same 5kmx5km square area was
studied. The distribution of the 33kV primary substations with the distribution of all 11kV secondary
substations are shown in the Figure 2:9. Population density information of the 1km square areas in
the selected 5kmx5km area is also provided in the figure. It can be observed that 33kV primary
substations are not always located in the area of the highest population density. 33KV primary
substations are sometimes located in the 1 km squares which are adjacent to the 1km squares with
highest population densities.
Figure 2:9. Distribution of the 33kV and 11kV substations in the selected 5kmx5km area of Cardiff.
A similar calculation was done for the substation count in all the 124, 1kmx1km square areas in Cardiff
and the results are listed in the Table A.1 in Appendix A. The results for the variation of the substation
count in 1kmx1km square areas with the population densities are visualised in the Figures 2:10 to
2.14.
Figure 2.10 shows the variation of the 11kV ground mounted substation count per 1kmx1km area with
the population density of the corresponding 1kmx1km square area (Some of the data points overlap
in the figure). It can be seen that, the number of ground mounted substation has an increasing trend
with the increasing population densities. However the relationship is not a linear. The highest number
of ground mounted substitutions are observed in the squares with medium population densities.

17
Figure 2:10. Variation of 11kV ground mounted substation count per square km with population density.
Figure 2:11 shows the Variation of 11kV pole mounted substation count per square km with
population density (Some of the data points overlap in the figure). According to the figure, pole
mounted substations are observed in the less populated square areas. The maximum number of pole
mounted substations observed in one square km is less than 10.
Figure 2:11. Variation of 11kV pole mounted substation count per square km with population density.
18
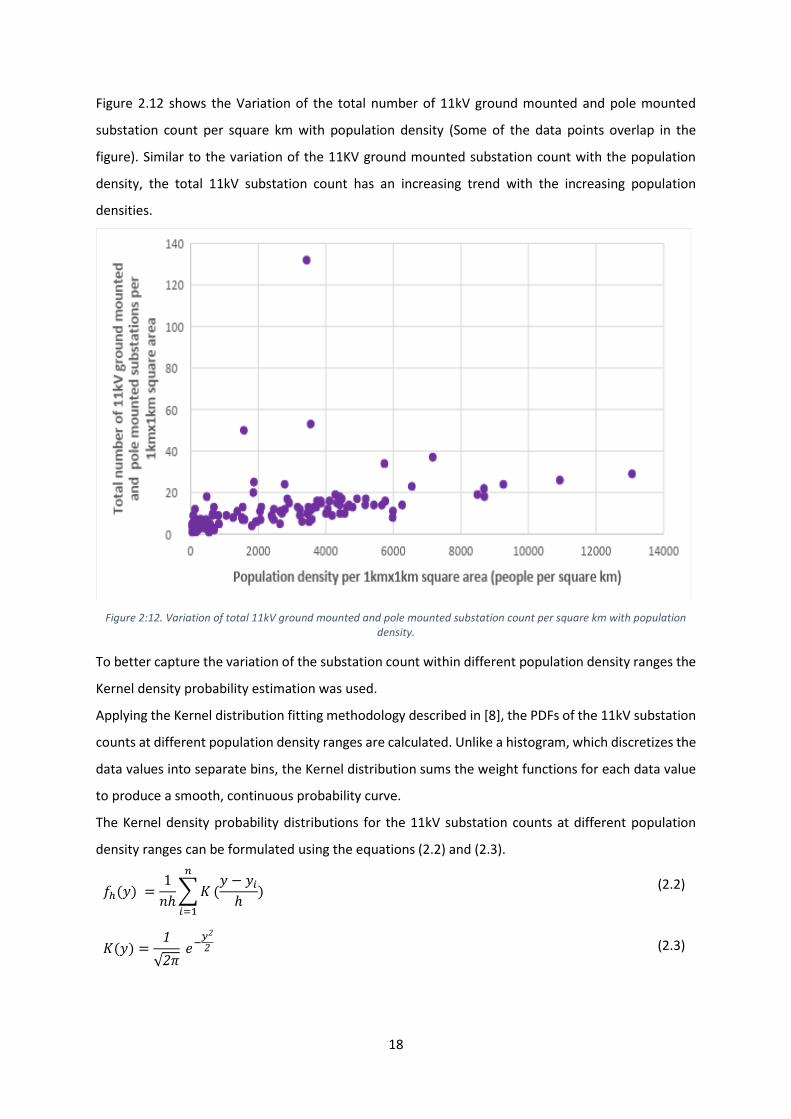
Figure 2.12 shows the Variation of the total number of 11kV ground mounted and pole mounted
substation count per square km with population density (Some of the data points overlap in the
figure). Similar to the variation of the 11KV ground mounted substation count with the population
density, the total 11kV substation count has an increasing trend with the increasing population
densities.
Figure 2:12. Variation of total 11kV ground mounted and pole mounted substation count per square km with population density.
To better capture the variation of the substation count within different population density ranges the
Kernel density probability estimation was used.
Applying the Kernel distribution fitting methodology described in [8], the PDFs of the 11kV substation
counts at different population density ranges are calculated. Unlike a histogram, which discretizes the
data values into separate bins, the Kernel distribution sums the weight functions for each data value
to produce a smooth, continuous probability curve.
The Kernel density probability distributions for the 11kV substation counts at different population
density ranges can be formulated using the equations (2.2) and (2.3).
𝑓ℎ(𝑦) =1
𝑛ℎ∑ 𝐾
𝑛
𝑖=1
(𝑦 − 𝑦𝑖
ℎ) (2.2)
𝐾(𝑦) =1
√2𝜋 𝑒−
𝑦2
2 (2.3)

19
With relevant to this study, variable y in the equations (2.2 and 2.3) refers to the 11kV substation
counts at the given population density range and n refers to the total number of 1kmx1km square
areas in that population density range. The Kernel distribution is defined by a weight function K(y) and
a bandwidth value h that controls the smoothness of the resulting density curve. In this study, the
normal Kernel weight function is used, described in equation (2.3). The bandwidth value h is
considered to be the optimal for estimating densities for the normal distribution.
Figure 2:13 shows the Kernel density probability distributions of the 11kV substation counts within
1kmx1km square areas for five ranges of population densities. These five ranges are defined by using
the ‘Jenks natural breaks classification’. Jenks natural breaks classification method, is a data clustering
method designed to determine the best arrangement of values into different classes [9].
According to the Jenks natural breaks classification, population densities of the 124 square areas were
grouped into five classes as follows.
(i) 46 – 1262
(ii) 1378 – 2914
(iii) 3166 – 4687
(iv) 4796 – 7166
(v) 8489 – 13062
Following the above natural breaks classification, population density ranges for the Kernel density
estimation was defined as follows.
(i) ≤ 1300
(ii) 1300 – 3000
(iii) 3000 – 5000
(iv) 5000 – 8000
(v) ≥ 8000

20
Figure 2: 13. Kernel density probability distribution of the 11kV substation count within 1kmx1km square areas.
The above Kernel density probability distributions of the 11kV substation count can be used to get an
estimate of the number of 11kV substations that might exist in a given area. Therefore, in Chapter 3
these probability distributions are used to randomly assign the number of 11kV substations in
1kmx1km square areas when the population densities of the corresponding squares are known.

21
Figure 2:14. Variation of total 33kV substation count per square km with population density.
Figure 2:14 shows the variation of the 33kV substation count within 1kmx1km square areas with the
population densities. According to the figure, a maximum of two 33kV substations can be observed
per one 1kmx1km square area. Majority of the 33kV substations were found in the squares with
medium population densities.
● Variation of distribution line length per square km with population density
Figure 2:15. Distribution of the 11kV underground cables and overhead lines in the selected 5kmx5km area of Cardiff.

22
According to the Figure 2:15, in densely populated areas underground cables have been widely used
and the distribution line density is much higher in one 1kmx1km square area than in the less populated
areas. In the less populated areas overhead lines have been used. Figures 2:16 and 2:17 show the
variation of the underground cable length and overhead line length per 1kmx1km square area with
the population density. According to the Figure 2.16 the underground cable length per 1kmx1km
square area tend to increase with the population density. But the relationship is not linear. The highest
cable length was recorded for the squares with medium population densities.
Figure 2:16. Variation of 11kV underground cable length per square km with population density.
Figure 2:16. Variation of 11kV overhead line length per square km with population density.

23
According to the Figure 2:16, the overhead line length per 1kmx1km square area has decreased with
incerasing population densities. Overhead lines have been used in the ares with population densities
less than 3700 people per km2 . The maximum over head line length that can be expected per
1kmx1km square area is less than 3.5km.
Figure 2:17 shows the variation of the total 11kV electricity distribution line length (i.e. addition of
under ground cable and overhead line lengths) per 1kmx1km square area. According to the figure, a
maximum 11kV network length of 80 km can be expected per one 1kmx1km square area. The
maximum network lengths have been obeserved in the squares with medium population densities.
Figure 2:17. Variation of total 11kV underground cable and overhead line length per square km with population density

24
● Variation of the fractal (/box-counting) dimension of the distribution of secondary
substations with population density
A brief introduction to fractals
Historically, Benoit Mandelbrot first introduced the concept of fractals. In general, a fractal can be
described as a rough or fragmented geometric shape that can be subdivided in parts, each of which is
(at least approximately) a reduced/size copy of the whole [10].
A same repeating pattern can be seen at every scale of a fractal. Fern leaf is a good example for a
fractal. In the fern leaf shown in the Figure 2:18 it can be noticed that every little leaf is part of the
bigger one and has the same shape as the whole fern leaf. This property of the fractals is called the
self-similarity.
Figure 2:18. Fern leaf-an example for fractals.
Fractal dimension
Fractal dimension is another important property of fractals that provides a statistical index of
complexity of a fractal pattern with the scale at which it is measured [10].
If the fractal dimension of an object needs to be explained, the box counting method provides the
practical solution for that. In this method, the fractal object (e.g. image of the distribution of 11kV
substations) is covered with boxes with equal sides ε, and find how the number of boxes n(ε) which
include the fractal object changes with the box size. A network is said to be fractal if the box counting
dimension exists for that network. The box-counting dimension is defined as,

25
𝐷𝑓 = 𝑙𝑖𝑚𝜀→0
log 𝑛(𝜀)
log (1𝜀
) (2.4)
A few researchers have observed that the real-world electricity distribution networks also consist of
self-repeating patterns across all scales similar to the fractals [3], [4]. Therefore in this study also, the
fractal properties of the distribution networks were investigated.
Mainly the variation of box-counting dimension of the distribution of 11kV substations within
1kmx1km square areas with population densities were investigated.
In order to calculate the box counting dimension of the images ‘Image J’ software with the plugin
called ‘FracLac’ was used. ‘ImageJ’ is freely available image analysis software written in Java by Wayne
Rasband of the US National Institutes of Health in Bethesda, Maryland. The website
(http://rsb.info.nih.gov/ij/) explains how to acquire, setup, and use ImageJ. How to use ‘FracLac’ with
‘ImageJ’ can be found in the user manual at https://imagej.nih.gov/ij/plugins/fraclac/fraclac-
manual.pdf. ‘ImageJ’ and ‘FracLac’ user interfaces are shown below.
Figure 2:19. ImageJ user interface.
Figure 2:20. FracLac user interface-1.

26
Figure 2:21. FracLac user interface-2.
Figure 2:19 shows images used for the calculation of box counting dimension of the distribution of
11kV substations in four 1kmx1km square areas with different population densities. In each image
every dot corresponds to an 11kV substation location. According to the Figure 2:19, for the similar
population densities different box-counting dimensions area observed and the box-counting
dimension and population densities did not have a linear relationship.
Population density= 3430 people per km2 Population density= 3554 people per km2
Box-counting dimension= 1.15 Box-counting dimension= 1.05

27
Population density= 8695 people per km2 Population density= 3468 people per km2
Box-counting dimension= 0.95 Box-counting dimension= 0.91
Figure 2:19. Box counting dimension of the distribution of 11kV substations in 1kmx1km square areas.
The values obtained for box counting dimension in all 124, 1kmx1km square areas were between
0.80 and 1.20.
28
Chapter 3: Generation of random-realistic distribution network topologies
3.1 Introduction
This chapter proposes an algorithm for the generation of random-realistic network topologies for
electricity distribution networks using the GIS information on population distribution of a given area
and the structural properties of the real-world electricity distribution networks studied in the Chapter
2. The inputs required by the algorithm and the flowchart of the algorithm area explained in the
sections below.
The algorithm was used to generate a random representation for a 2kmx2km square area in Cardiff
and the generated random topologies area compared with the actual electricity distribution network
in that area. The procedure and the results are explained in the validation section.
3.2 Algorithm for generating distribution network topologies
3.2.1 Inputs required by the algorithm
The proposed algorithm to generated random distribution network topologies requires the following
set of inputs.
(i) Geographical area of the network in the UK
The user must give the exact geographic area of the electricity distribution network in the UK that is
required for their study. The idea is to generate a representative electricity network topology that can
exist in the selected area without having to collect and process large amount of network data.
(ii) GIS data about the population distribution of the given area
If the exact geographic area is known the GIS data on the population information can be downloaded.
This information is required to calculate the population densities in the selected area.
(iii) National grid 1km grid reference
The idea is to divide the selected area of the UK into 1kmx1km square areas according to the National
grid reference system. Then the population densities in each 1km square area can be calculated as
shown in the Chapter 2.

29
(iv) Kernel density probability distributions for the number of 11kV substations per 1kmx1km
square area according to population densities
These were obtained from the real-world network investigation.
(v) Range of values for box-counting dimension to describe the distribution of the 11kV
substations
The range of box counting dimensions obtained for the distribution of the 11kV substations in the 1km
square areas is between 0.8 and 1.2.
(vi) Number of 33kV substations in the given area
At this stage of the development of the algorithm, the user must input the number of 33kV substations
in the selected area.
3.2.2 Flowchart of the algorithm
Figure 3:1. Flowchart of the algorithm for network topology generation.
30
Figure 3:1 shows the flowchart of the algorithm. The algorithm explains the generation of a single
network topology. The process shown in the algorithm is repeated to generate many statistically-
similar network topologies. Each step of the algorithm is explained in this section. The main steps are
numbered in Figure 3:1 and the step-wise explanation of the algorithm follows this numbering.
1. First, the selected area is divided into 1kmx1km square areas using the national grid
referencing system explained in the Chapter 2. Then using the GIS information available for population
distribution, the population densities in each 1kmx1km square area is calculated.
2. Then, a set of values are assigned for the number of 11kV substations in each 1kmx1km square
using the Kernel density probability distributions for the 11kV substation count in real networks
according to the population densities.
3. From the real world network investigation it was identified that the box counting dimension
of the distribution of 11kV substations within 1kmx1km squares of real networks vary in the range of
0.8 - 1.2. Therefore, random values in the above range of box-counting dimensions area assigned for
each 1kmx1km square in order to distribute the 11kV substations.
4. An algorithm (a Matlab code) was developed to randomly assign points within a given square
area to satisfy a given box-counting dimension. The specified number of 11kV substations are located
within each 1kmx1km square to satisfy the specified box-counting dimension using the above
developed algorithm.
5. It was assumed that the total number of 33kV substations are given as an input to the
algorithm. Therefore, in order to locate these 33kV substations a simple approach was used. The total
number of 11kV substations are divided into a number of clusters similar to the number of 33kV
substations according to their locations in the x, y coordinate system. Then the 33kV substations are
located at the cluster centre of each 11kV substation clusters.
6. At this stage of the development of random network topology generator, the branching of
network was done using a simple methods. The 11kV substations in each cluster are connected by
minimum spanning tree algorithm starting at the centre node of the each cluster. It was assumed that
the network consist of a number of radial components similar to the number of 33kV substations.
7. The outputs of the algorithm are an adjacency matrix which describes the connectivity
between the nodes and the distances between the connected nodes and the spatial layout of the
network.
31
3.3 Validation
In order to test the above topology generating algorithm, network topologies similar to a selected
real-world network are generated. The structural properties of the real-world network and the
generated network topologies are compared in this section.
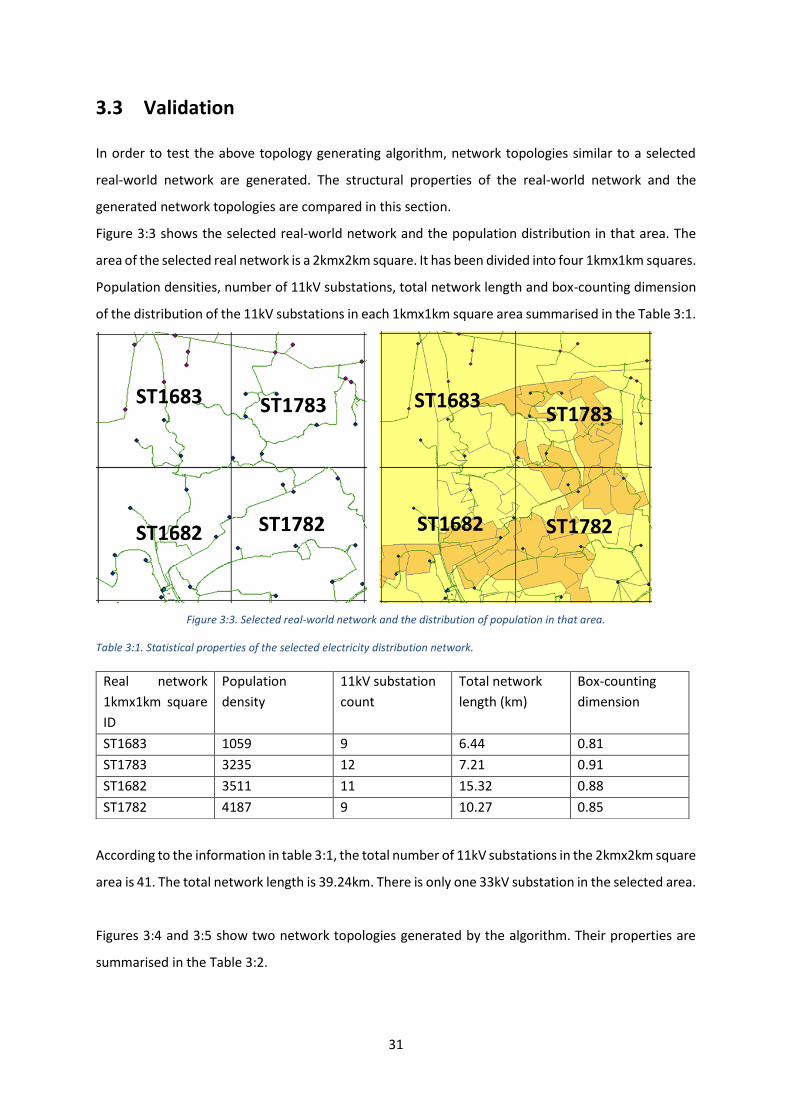
Figure 3:3 shows the selected real-world network and the population distribution in that area. The
area of the selected real network is a 2kmx2km square. It has been divided into four 1kmx1km squares.
Population densities, number of 11kV substations, total network length and box-counting dimension
of the distribution of the 11kV substations in each 1kmx1km square area summarised in the Table 3:1.
Figure 3:3. Selected real-world network and the distribution of population in that area.
Table 3:1. Statistical properties of the selected electricity distribution network.
According to the information in table 3:1, the total number of 11kV substations in the 2kmx2km square
area is 41. The total network length is 39.24km. There is only one 33kV substation in the selected area.
Figures 3:4 and 3:5 show two network topologies generated by the algorithm. Their properties are
summarised in the Table 3:2.
Real network
1kmx1km square
ID
Population
density
11kV substation
count
Total network
length (km)
Box-counting
dimension
ST1683 1059 9 6.44 0.81
ST1783 3235 12 7.21 0.91
ST1682 3511 11 15.32 0.88
ST1782 4187 9 10.27 0.85

32
Figure 3:4. Network topology-1 generated by the algorithm.
Figure 3:5. Network topology-2 generated by the algorithm.
Table 3:2. Properties of the generated network topologies.
Network topology Total number of 11kV
substations
Total network length (km)
1 41 9.12
2 48 9.67
From the results in Table 3:2 it can be observed that the algorithm is able to generate a number of
11kV substations similar to the number in the real world network. However, the total network
length in the generated topologies are very low with compared to the real-world network.

33
Chapter 4: Summary, conclusions and future work
4.1 Summary and conclusions
In this research, the feasibility of producing realistic electricity distribution network topologies using
information directly from Geographical Information Systems (GIS) about the population distribution
together with the concepts in complexity science for generating networks was tested.
A large amount of GIS data regarding the real-world electricity distribution networks and population
distribution in the corresponding areas were collected for this study.
From the real-world networks investigation it was identified that the population densities and
the topological structures of the electricity distribution networks have a close relationship.
The relationship between population densities and the structural properties of the electricity
distribution networks were extracted, using Kernel density probability distributions and fractal
properties. An algorithm was developed to generate random-realistic electricity distribution network
topologies for a given geographic area in the UK.
The developed algorithm was able to generate distributions of 11kV substations within a given
geographic area mimicking the 11kV substation distributions in the real-world networks.
However, the network lengths of the generated topologies were very low with compared to
the real-world network in the selected geographic area.
The generation of multiple representations for the same real-world network (i.e. in this case,
electricity distribution network) has always been problematic in network modelling. A single
representation might not capture all the diverse characteristics of a real network.
Therefore, the ability to generate statistically-similar many networks to represent an
electricity distribution network is one of the key features of the proposed algorithm.

34
4.2 Future work
This research has provided the initial steps to a statistical platform where various network studies can
be carried out on many statistically-similar realistic test networks.
The proposed future work includes,
to investigate the statistical properties of more real world networks.(This study has
investigated the electricity distribution networks in Cardiff area. A larger area can be studied
to obtain more robust conclusions on the topological characteristics of real-world networks.
Also, a wider statistical investigation can be conducted by takin into consideration many new
statistical parameters of the topologies of real world networks (e.g. graph properties) );
to improve the network topology generating algorithm. (The algorithm presented in this
report is an initial approach for the topology generation. This algorithm can be improved by
taking into consideration many other factors that may influence in the topological structures
of real world networks. Also the branching/ path connection step must be improved to
achieve realistic network lengths.);
to improve the algorithm to include realistic electrical properties to the generated network
topologies of the distribution networks (E.g. substation capacities, distribution line
impedances, etc.), and
to conduct impact assessment studies of various low carbon technologies such as solar PV and
electric vehicles on the electricity distribution networks using the many statistically similar
networks. This will allow further development of the statistical approach in conducting the
research on many networks and in providing generalised conclusions of the results.
35
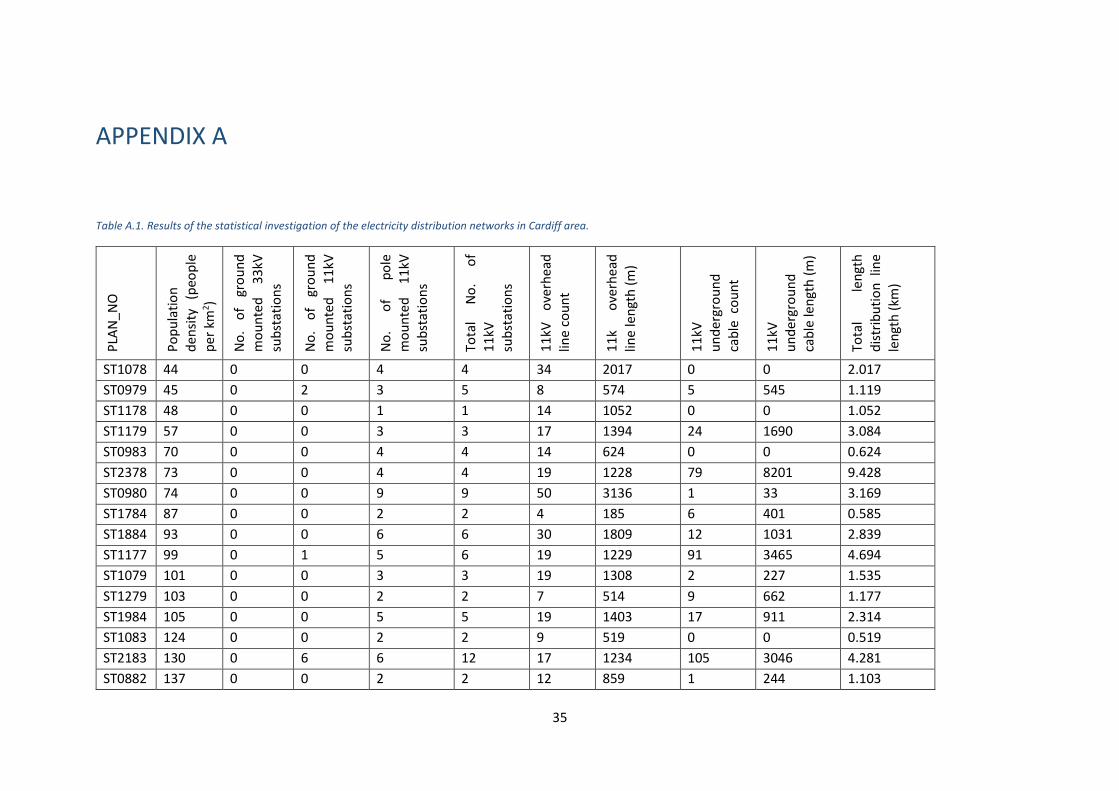
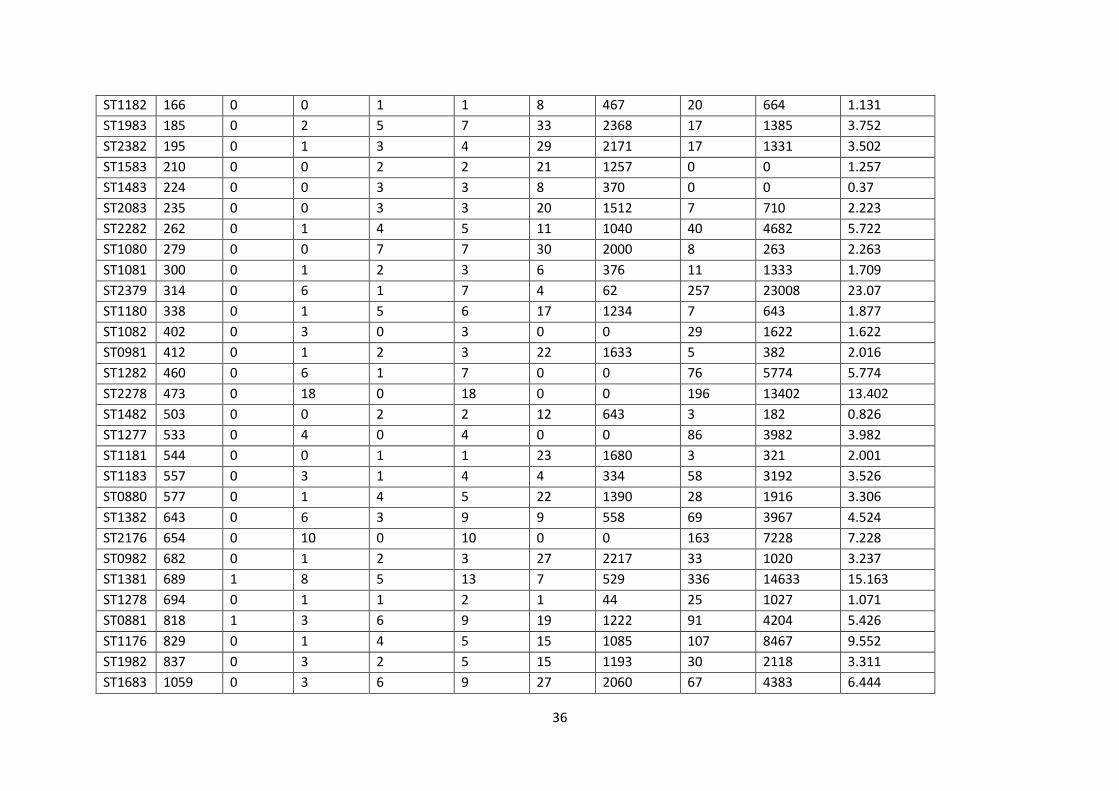
APPENDIX A
Table A.1. Results of the statistical investigation of the electricity distribution networks in Cardiff area.
PLA
N_N
O
Po
pu
lati
on
d
ensi
ty
(peo
ple
p
er k
m2 )
No
. o
f gr
ou
nd
m
ou
nte
d
33
kV
sub
stat
ion
s
No
. o
f gr
ou
nd
mo
un
ted
1
1kV
su
bst
atio
ns
No
. o
f p
ole
m
ou
nte
d
11
kV
sub
stat
ion
s
Tota
l N
o.
of
11
kV
sub
stat
ion
s
11
kV
ove
rhea
d
line
cou
nt
11
k o
verh
ead
lin
e le
ngt
h (
m)
11
kV
un
der
gro
un
d
cab
le c
ou
nt
11
kV
un
der
gro
un
d
cab
le le
ngt
h (
m)
Tota
l le
ngt
h
dis
trib
uti
on
lin
e
len
gth
(km
)
ST1078 44 0 0 4 4 34 2017 0 0 2.017
ST0979 45 0 2 3 5 8 574 5 545 1.119
ST1178 48 0 0 1 1 14 1052 0 0 1.052
ST1179 57 0 0 3 3 17 1394 24 1690 3.084
ST0983 70 0 0 4 4 14 624 0 0 0.624
ST2378 73 0 0 4 4 19 1228 79 8201 9.428
ST0980 74 0 0 9 9 50 3136 1 33 3.169
ST1784 87 0 0 2 2 4 185 6 401 0.585
ST1884 93 0 0 6 6 30 1809 12 1031 2.839
ST1177 99 0 1 5 6 19 1229 91 3465 4.694
ST1079 101 0 0 3 3 19 1308 2 227 1.535
ST1279 103 0 0 2 2 7 514 9 662 1.177
ST1984 105 0 0 5 5 19 1403 17 911 2.314
ST1083 124 0 0 2 2 9 519 0 0 0.519
ST2183 130 0 6 6 12 17 1234 105 3046 4.281
ST0882 137 0 0 2 2 12 859 1 244 1.103
36
ST1182 166 0 0 1 1 8 467 20 664 1.131
ST1983 185 0 2 5 7 33 2368 17 1385 3.752
ST2382 195 0 1 3 4 29 2171 17 1331 3.502
ST1583 210 0 0 2 2 21 1257 0 0 1.257
ST1483 224 0 0 3 3 8 370 0 0 0.37
ST2083 235 0 0 3 3 20 1512 7 710 2.223
ST2282 262 0 1 4 5 11 1040 40 4682 5.722
ST1080 279 0 0 7 7 30 2000 8 263 2.263
ST1081 300 0 1 2 3 6 376 11 1333 1.709
ST2379 314 0 6 1 7 4 62 257 23008 23.07
ST1180 338 0 1 5 6 17 1234 7 643 1.877
ST1082 402 0 3 0 3 0 0 29 1622 1.622
ST0981 412 0 1 2 3 22 1633 5 382 2.016
ST1282 460 0 6 1 7 0 0 76 5774 5.774
ST2278 473 0 18 0 18 0 0 196 13402 13.402
ST1482 503 0 0 2 2 12 643 3 182 0.826
ST1277 533 0 4 0 4 0 0 86 3982 3.982
ST1181 544 0 0 1 1 23 1680 3 321 2.001
ST1183 557 0 3 1 4 4 334 58 3192 3.526
ST0880 577 0 1 4 5 22 1390 28 1916 3.306
ST1382 643 0 6 3 9 9 558 69 3967 4.524
ST2176 654 0 10 0 10 0 0 163 7228 7.228
ST0982 682 0 1 2 3 27 2217 33 1020 3.237
ST1381 689 1 8 5 13 7 529 336 14633 15.163
ST1278 694 0 1 1 2 1 44 25 1027 1.071
ST0881 818 1 3 6 9 19 1222 91 4204 5.426
ST1176 829 0 1 4 5 15 1085 107 8467 9.552
ST1982 837 0 3 2 5 15 1193 30 2118 3.311
ST1683 1059 0 3 6 9 27 2060 67 4383 6.444

37
ST1582 1262 0 6 2 8 13 874 63 3680 4.554
ST1675 1378 1 11 0 11 0 0 188 12469 12.469
ST1883 1516 0 7 1 8 21 1347 46 2944 4.291
ST1280 1537 0 7 0 7 0 0 65 6288 6.288
ST1380 1538 0 10 3 13 7 557 240 14519 15.076
ST1974 1573 0 50 0 50 0 0 1461 77851 77.851
ST1882 1592 0 7 0 7 0 0 92 5326 5.326
ST2177 1810 0 4 0 4 0 0 89 6101 6.101
ST2078 1857 1 20 0 20 0 0 511 19122 19.122
ST1975 1870 0 25 0 25 0 0 319 24088 24.088
ST1379 1927 0 6 0 6 0 0 57 4873 4.873
ST1281 1966 0 5 1 6 7 366 188 8917 9.283
ST2178 2051 0 11 0 11 0 0 105 5321 5.321
ST1881 2068 0 7 0 7 0 0 125 10410 10.41
ST1481 2091 0 13 0 13 0 0 233 12448 12.448
ST2180 2393 0 9 0 9 0 0 82 4358 4.358
ST1981 2416 0 8 0 8 0 0 71 4214 4.214
ST2182 2460 0 12 0 12 0 0 186 11624 11.624
ST2079 2461 0 7 0 7 0 0 89 6523 6.523
ST2480 2648 0 5 0 5 0 0 87 6421 6.421
ST1480 2649 0 11 0 11 9 609 305 19336 19.945
ST1581 2682 0 11 0 11 0 0 164 15071 15.071
ST1879 2709 0 10 0 10 0 0 210 17476 17.476
ST1781 2781 1 24 0 24 0 0 279 17071 17.071
ST1779 2794 1 12 0 12 0 0 223 12704 12.704
ST2181 2859 0 17 0 17 0 0 109 6185 6.185
ST2481 2914 0 14 1 15 2 111 171 10157 10.268
ST2082 3166 0 10 3 13 14 1218 157 6237 7.455
ST2279 3230 0 8 1 9 6 197 158 10625 10.822

38
ST1783 3235 0 7 5 12 17 1201 102 6009 7.21
ST1276 3296 0 5 1 6 3 164 53 3131 3.295
ST1876 3430 2 132 0 132 0 0 1410 49729 49.729
ST1678 3444 0 9 1 10 0 0 141 8173 8.173
ST1677 3468 0 9 1 10 0 0 185 12677 12.677
ST2080 3484 0 13 0 13 0 0 174 6931 6.931
ST1578 3508 0 6 0 6 0 0 152 6630 6.63
ST1682 3511 1 11 0 11 0 0 191 15325 15.325
ST1476 3521 0 11 0 11 0 0 189 9093 9.093
ST1875 3554 2 53 0 53 0 0 1270 60507 60.507
ST1880 3558 0 12 0 12 0 0 281 16437 16.437
ST2179 3575 0 12 0 12 0 0 95 6030 6.03
ST1479 3584 0 7 0 7 0 0 116 9620 9.62
ST1378 3658 0 13 0 13 0 0 133 9439 9.439
ST1478 3718 0 13 0 13 0 0 206 8554 8.554
ST1777 3739 0 16 0 16 0 0 211 10059 10.059
ST1580 3852 1 16 0 16 0 0 257 26829 26.829
ST2381 3865 1 15 0 15 0 0 434 23533 23.533
ST1477 4005 0 10 0 10 0 0 136 6955 6.955
ST1780 4061 0 12 0 12 0 0 144 12330 12.33
ST1774 4109 0 16 0 16 0 0 610 35869 35.869
ST1782 4187 0 9 0 9 0 0 174 10273 10.273
ST1979 4281 0 19 0 19 0 0 232 9607 9.607
ST1980 4322 1 15 0 15 0 0 303 12586 12.586
ST1577 4406 0 18 0 18 0 0 254 17919 17.919
ST1576 4415 1 14 0 14 0 0 276 15849 15.849
ST1275 4421 0 10 0 10 0 0 330 24504 24.504
ST2280 4475 0 17 0 17 0 0 226 13785 13.785
ST2281 4558 0 10 0 10 0 0 163 13004 13.004

39
ST1375 4626 0 13 0 13 0 0 254 12694 12.694
ST1579 4687 0 14 0 14 0 0 180 13766 13.766
ST1681 4795 1 13 0 13 0 0 392 19183 19.183
ST1377 4923 1 17 0 17 0 0 190 9630 9.63
ST2380 5168 0 14 0 14 0 0 175 10773 10.773
ST2076 5184 1 17 0 17 0 0 142 9484 9.484
ST1679 5430 1 14 0 14 0 0 379 22221 22.221
ST1680 5666 0 14 0 14 0 0 221 14809 14.809
ST1874 5738 0 34 0 34 0 0 711 38641 38.641
ST2077 5761 0 16 0 16 0 0 471 33661 33.661
ST1376 5978 1 8 0 8 0 0 166 12851 12.851
ST2081 5989 0 11 0 11 0 0 196 8170 8.17
ST1978 6258 0 14 0 14 0 0 274 18060 18.06
ST1776 6545 0 23 0 23 0 0 375 27139 27.139
ST1976 7166 1 37 0 37 0 0 404 21079 21.079
ST1778 8489 0 19 0 19 0 0 237 14352 14.352
ST1878 8682 1 22 0 22 0 0 330 20978 20.978
ST1676 8695 1 18 0 18 0 0 440 35736 35.736
ST1775 9258 0 24 0 24 0 0 524 33203 33.203
ST1977 10933 0 26 0 26 0 0 251 16338 16.338
ST1877 13062 1 29 0 29 0 0 430 26060 26.06
40
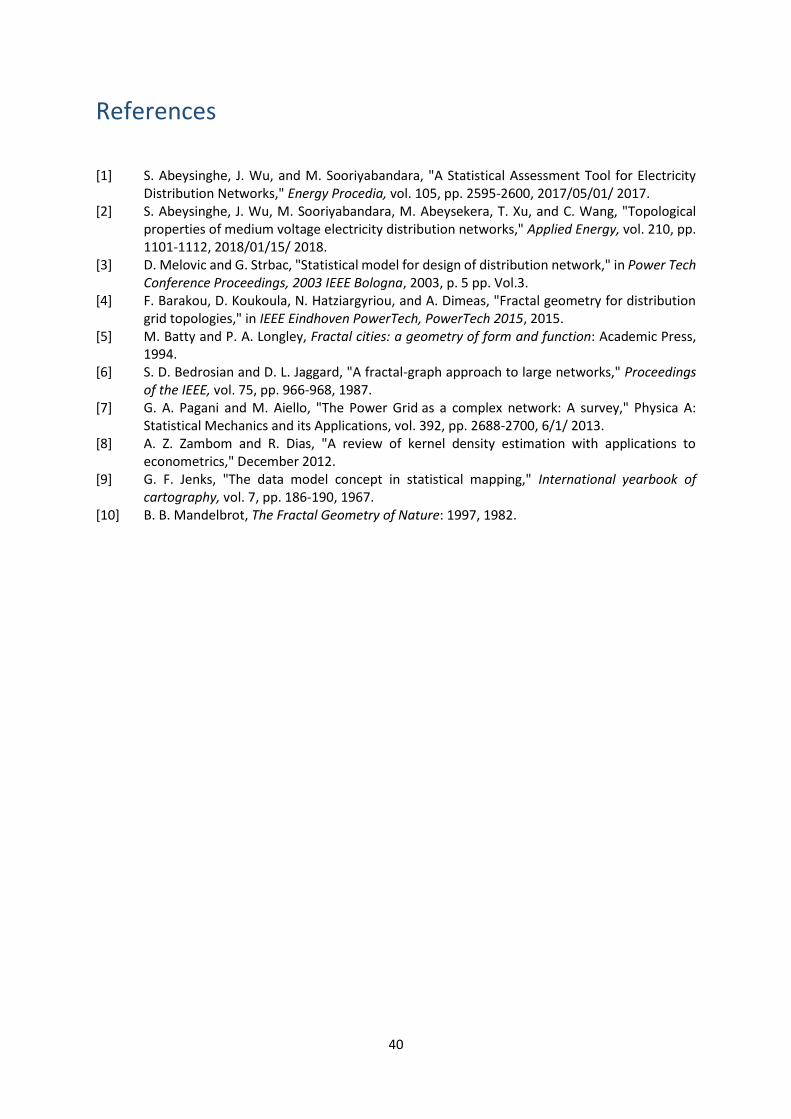
References
[1] S. Abeysinghe, J. Wu, and M. Sooriyabandara, "A Statistical Assessment Tool for Electricity Distribution Networks," Energy Procedia, vol. 105, pp. 2595-2600, 2017/05/01/ 2017.
[2] S. Abeysinghe, J. Wu, M. Sooriyabandara, M. Abeysekera, T. Xu, and C. Wang, "Topological properties of medium voltage electricity distribution networks," Applied Energy, vol. 210, pp. 1101-1112, 2018/01/15/ 2018.
[3] D. Melovic and G. Strbac, "Statistical model for design of distribution network," in Power Tech Conference Proceedings, 2003 IEEE Bologna, 2003, p. 5 pp. Vol.3.
[4] F. Barakou, D. Koukoula, N. Hatziargyriou, and A. Dimeas, "Fractal geometry for distribution grid topologies," in IEEE Eindhoven PowerTech, PowerTech 2015, 2015.
[5] M. Batty and P. A. Longley, Fractal cities: a geometry of form and function: Academic Press, 1994.
[6] S. D. Bedrosian and D. L. Jaggard, "A fractal-graph approach to large networks," Proceedings of the IEEE, vol. 75, pp. 966-968, 1987.
[7] G. A. Pagani and M. Aiello, "The Power Grid as a complex network: A survey," Physica A: Statistical Mechanics and its Applications, vol. 392, pp. 2688-2700, 6/1/ 2013.
[8] A. Z. Zambom and R. Dias, "A review of kernel density estimation with applications to econometrics," December 2012.
[9] G. F. Jenks, "The data model concept in statistical mapping," International yearbook of cartography, vol. 7, pp. 186-190, 1967.
[10] B. B. Mandelbrot, The Fractal Geometry of Nature: 1997, 1982.