Embed Size (px)
Citation preview

••••••••••••••••••••••••••••••••••••••••••••••••••••••••••••••••••••••
The 2006 ACM SIGCOMM Test of Time Award has beengiven to Vern Paxson for his paper, “End-to-End RoutingBehavior in the Internet,” published in the 1996 proceed-ings of the ACM SIGCOMM Conference. The award“recognizes a paper published 10 to 12 years in the past… that is deemed to be an outstanding paper whose con-tents are still a vibrant and useful contribution today.” Inthis review, we try to explain why we picked this paperfor the award. (In that light, we should note there were anumber of outstanding papers that were strong con-tenders for the award).
A Time of Change in MeasurementOne of the reasons that the paper remains vital andvibrant today is that it marks a moment of change in net-work measurement.
Network measurement is as old as networking itself. In1969, when the ARPANET was being built, LenKleinrock at UCLA was commissioned to put together ameasurement center to analyze the performance of thenetwork. Through the 1970s and 1980s, there was a tra-dition of network measurement, both by users and by thenetwork providers. Equally important was a tradition ofsharing the results. So if you were curious about, forinstance, path stability, you could typically ask BBN(who ran the ARPANET) or MERIT (who ran NSFNET)and either get an answer or access to their raw measure-ment data.
By the early 1990s, measurement inside the network wasbecoming increasingly hard. A combination of privacyconcerns and the rise of competing Internet ServiceProviders (ISPs) who viewed measurements as propri-etary, meant that data about the Internet’s (rapidly grow-ing) core was increasingly hard to get. This change didnot mean the end of Internet measurement: indeed, justthe year before Paxson’s paper, Jeff Mogul had publisheda brilliant paper using HTTP measurements to show thebenefits of persistent connections [1]. But it appearedthat research was becoming restricted to measurements(like those in Mogul's study) that could be completedwithout access to data on how the middle of the networkbehaved.
It was in this environment that Paxson’s paper appeared.Paxson showed that, using proper statistical techniques
(notably Wolff’s elegant PASTA principle), one couldgather considerable information about the behavior of thenetwork core using measurement stations solely at theedge of the network. So, wonder of wonders, a group ofPCs scattered at edge sites around the Internet and col-lecting carefully designed measurements could give us alot of information about how both the edges and the mid-dle of the network operated.
As the implications of Paxson’s paper spread, we saw arevitalization of the field of network measurement. Itwas a new kind of network measurement, combining thecollection of data with more sophisticated set of statisti-cal techniques. The need to use more sophisticated statis-tical techniques had started a few years earlier: thefamous self-similarity paper [2] already had forced anumber of researchers to learn new analysis techniques tostudy their measurements. Paxson’s paper showed thatthe statistical techniques also enabled us to capture newtypes of measurements.Many people tie the resurgence of interest in networkmeasurement, and, indeed, the creation of the InternetMeasurement Conference (IMC) to the work this paperinspired.
The Paper ItselfOne of the paradoxes of research is that not all importantpapers are actually worth reading. Sometimes the resultis better explained by someone else. (Or, for instance, thewritten word was not the innovator's best way to commu-nicate: reputedly Einstein did far better as a speaker thana writer). But Paxson’s paper is a good read for a num-ber of reasons.
First, it starts out right. The related research is short, butdemonstrates the author is fully in command of the liter-ature going back to 1978. And the experimental method-ology is clearly spelled out, such that the experiment isrepeatable by someone else. (Many methodologies,when examined even casually, fail to reveal enough aboutthe experiment that one can have confidence it is repeat-able.)
Then the results themselves are both valuable and fun. Anumber of routing pathologies are identified and there isa thorough discussion of routing stability. Finally, thepaper looks as routing symmetry (is the path in both
“End-to-End Routing Behavior in the Internet,” by Vern Paxson
A retrospective reviewJ. Kurose, C. Partridge, and E. W. Zegura
ACM SIGCOMM Computer Communication Review 41 Volume 36, Number 5, October 2006

directions the same?) and was the first to show just howprevalent asymmetry (previously assumed to be rare),actually was.In summary, it is an important paper and rewardingreading. The combination makes it this year’s winner ofthe SIGCOMM Test of Time Award.
References1. J. Mogul, “The case for persistent-connection HTTP,”Proc. ACM SIGCOMM ‘95.
2. W.E. Leland, M.S. Taqqu, W. Willinger, D.V. Wilson,“On the self-similar nature of Ethernet traffic,” Proc.ACM SIGOMM ‘93.
••••••••••••••••••••••••••••••••••••••••••••••••••••••••••••••••••••••
ACM SIGCOMM Computer Communication Review 42 Volume 36, Number 5, October 2006

End-to-End Routing Behavior in the InternetVern Paxson
University of California, Berkeley andLawrence Berkeley National Laboratory
Abstract
The large-scale behavior of routing in the Internet has gone virtually with-
out any formal study, the exception being Chinoy's analysis of the dynamics
of Internet routing information [Ch93]. We report on an analysis of 40,000
end-to-end route measurements conducted using repeated “traceroutes” be-
tween 37 Internet sites. We analyze the routing behavior for pathological
conditions, routing stability, and routing symmetry. For pathologies, we
characterize the prevalence of routing loops, erroneous routing, infrastruc-
ture failures, and temporary outages. We find that the likelihood of encoun-
tering a major routing pathology more than doubled between the end of
1994 and the end of 1995, rising from 1.5% to 3.4%. For routing stability,
we define two separate types of stability, “prevalence,” meaning the overall
likelihood that a particular route is encountered, and “persistence,” the like-
lihood that a route remains unchanged over a long period of time. We find
that Internet paths are heavily dominated by a single prevalent route, but
that the time periods over which routes persist show wide variation, rang-
ing from seconds up to days. About 2/3's of the Internet paths had routes
persisting for either days or weeks. For routing symmetry, we look at the
likelihood that a path through the Internet visits at least one different city in
the two directions. At the end of 1995, this was the case half the time, and
at least one different autonomous system was visited 30% of the time.
1 Introduction
The large-scale behavior of routing in the Internet has gone virtuallywithout any formal study, the exception being Chinoy's analysis ofthe dynamics of Internet routing information [Ch93]. In this pa-per we analyze 40,000 end-to-end route measurements conductedusing repeated “traceroutes” between 37 Internet sites. The mainquestions we strive to answer are: What sort of pathologies and fail-ures occur in Internet routing? Do routes remain stable over timeor change frequently? Do routes from A to B tend to be symmetric(the same in reverse) as routes from B to A?
�This work was supported by the Director, Office of Energy Research,Scientific Computing Staff, of the U.S. Department of Energy under Con-tract No. DE-AC03-76SF00098. A slightly longer version of this paper,with additional figures and typeset with a larger font, is available fromftp://ftp.ee.lbl.gov/papers/routing.SIGCOMM.ps.Z.
Our framework for answering these questions is the measure-ment of a large sample of Internet routes between a number ofgeographically diverse hosts. We argue that the set of routes is rep-resentative of Internet routes in general, and analyze how the routeschanged over time to assess how Internet routing in general changesover time.
In x 2 and x 3 we give overviews of related research and howrouting works in the Internet. In x 4 we discuss the experimental andstatistical methodology for our analysis. In x 5 we give an overviewof the participating sites and the raw data. We classify a numberof routing pathologies in x 6, including routing loops, rapid routingchanges, erroneous routes, infrastructure failures, and temporaryoutages. We find that the likelihood of encountering a major routingpathology more than doubled between the end of 1994 and the endof 1995, rising from 1.5% to 3.4%.
After removing the pathologies, we analyze the remaining mea-surements to investigate routing stability (x 7) and symmetry (x 8),summarizing our findings in x 9.
2 Related research
The problem of routing traffic in communication networks has beenstudied for well over twenty years [SS80]. The subject has maturedto the point where a number of books have been written thoroughlyexamining the different issues and solutions [Pe92, St95, Hu95].
A key distinction we will make is that between routing proto-cols, by which we mean mechanisms for disseminating routing in-formation within a network and the particulars of how to use thatinformation to forward traffic, and routing behavior, meaning howin practice the routing algorithms perform. This distinction is im-portant because while routing protocols have been heavily studied,routing behavior has not.
The literature contains many studies of routing protocols. In ad-dition to the books cited above, see, for example, discussions of thevarious ARPANET routing algorithms [MFR78, MRR80, KZ89];the Exterior Gateway Protocol used in the NSFNET [Ro82] andthe Border Gateway Protocol (BGP) that replaced it [RL95, RG95,Tr95a, Tr95b]; the related work by Estrin et al on routing betweenadministrative domains [BE90, ERH92]; Perlman and Varghese'sdiscussion of difficulties in designing routing algorithms [PV88];Deering and Cheriton's seminal work on multicast routing [DC90];Perlman's comparison of the popular OSPF and IS-IS protocols[Pe91]; and Baransel et al' s survey of routing techniques for veryhigh speed networks [BDG95].
For routing behavior, however, the literature contains consider-ably fewer studies. Some of these are based on simulation, suchas Zaumen and Garcia-Luna Aceves' studies of routing behavior
ACM SIGCOMM Computer Communication Review 43 Volume 36, Number 5, October 2006

on several different wide-area topologies [ZG-LA92], and Sidhuet al' s simulation of OSPF [SFANC93]. In only a few studies domeasurements play a significant role: Rekhter and Chinoy's trace-driven simulation of the tradeoffs in using inter-autonomous systemrouting information to optimize routing within a single autonomoussystem [RC92]; Chinoy's study of the dynamics of routing infor-mation propagated inside the NSFNET infrastructure [Ch93]; andFloyd and Jacobson's analysis of how periodicity in routing mes-sages can lead to global synchronization among the routers [FJ94].
This is not to say that studies of routing protocols ignore routingbehavior. But the presentation of routing behavior in the protocolstudies is almost always qualitative. Furthermore, of the measure-ment studies only Chinoy's is devoted to characterizing routing be-havior in-the-large.
Chinoy found wide ranges in the dynamics of routing informa-tion: For those routers that send updates periodically regardless ofwhether any connectivity information has changed, the vast ma-jority of the updates contain no new information. Most routingchanges occur at the edges of the network and not along its “back-bone.” Outages during which a network is unreachable from thebackbone span a large range of time, from a few minutes to a num-ber of hours. Finally, most networks are nearly quiescent, while afew exhibit frequent connectivity transitions.
Chinoy's study concerns how routing information propagates in-side the network. It is not obvious, though, how these dynamicstranslate into the routing dynamics seen by an end user. An areanoted by Chinoy as ripe for further study is “the end-to-end dynam-ics of routing information.”
We will use the term virtual path to denote the network-levelabstraction of a “direct link” between two Internet hosts. For ex-ample, when Internet host A wishes to establish a network-levelconnection to host B, as far as A is concerned the network layerprovides it with a link directly to B. We will denote the notion ofthe virtual path from A to B as A� B.
At any given instant in time, the virtual path A� B is realizedat the network layer by a single route, which is a sequence of Inter-net routers along which packets sent by A and destined for B areforwarded. Over time, the virtual path A � B may oscillate veryrapidly between different routes, or it may be quite stable (c.f. x 7).Chinoy's suggested research area is then: given two hosts A andB at the edges of the network, how does the virtual path A � B
behave? This is the question we attempt to answer in our study.
3 Routing in the Internet
For routing purposes, the Internet is partitioned into a disjoint set ofautonomous systems (AS's) [Ro82]. Originally, an AS was a collec-tion of routers and hosts unified by running a single “interior gate-way protocol” (IGP). Over time, the notion has evolved to be es-sentially synonymous with that of administrative domain [HK89],in which the routers and hosts are unified by a single administrativeauthority, and a set of IGP's. Routing between autonomous systemsprovides the highest-level of Internet interconnection. RFC 1126outlines the goals and requirements for inter-AS routing [Li89], and[Re95] gives an overview of how inter-AS routing has evolved.
BGP, currently in its fourth version [RL95, RG95], is now usedbetween all significant AS's [Tr95a]. BGP allows arbitrary inter-connection topologies between AS's, and also provides a mecha-nism for preventing routing loops between AS's (c.f. x 6.1).
The key to whether use of BGP will scale to a very large Internet
lies in the stability of inter-AS routing [Tr95b]. If routes betweenAS's vary frequently—a phenomenon termed “flapping” [Do95]—then the BGP routers will spend a great deal of their time updat-ing their routing tables and propagating the routing changes. Dailystatistics concerning routing flapping are available from [Me95b].
It is important to note that stable inter-AS routing does not guar-antee stable end-to-end routing, because AS's are large entities ca-pable of significant internal instabilities.
4 Methodology
In this section we discuss the methodology used in our study: themeasurement software; the utility of sampling at exponentially dis-tributed intervals; which aspects of our data are plausibly represen-tative of Internet traffic and which not; how we computed confi-dence intervals for probability estimates; and some problems withour experimental design.
For brevity we assume that the reader is familiar with the work-ings of the traceroute utility for measuring Internet routes([Ja89]; see [Pa96] for detailed discussion).
4.1 Experimental apparatus
We conducted our experiment by recruiting a number of Internetsites (see Table 1 in x 5) to run a “network probe daemon” (NPD)that provides several measurement services. These NPD's werethen periodically contacted by a control program, “npd control,”running on our local workstation, and asked to measure the route toanother NPD site using traceroute .
For our first set of measurements, termed D�, we measuredeach virtual path between two of the NPD sites with a mean in-terval of 1–2 days. For the second set of measurements, D�, wemade measurements at two different rates: 60% with a mean inter-measurement interval of 2 hours, and 40% with an mean interval ofabout 2.75 days.
The D� interval was chosen so that each NPD would make atraceroute measurement on average of once every two hours.As we added NPD sites to the experiment, the rate at which an NPDmade measurements to a particular remote NPD site decreased, inorder to maintain the average load of one measurement per twohours, which led to the range of 1–2 days in the mean measure-ment interval. Upon analyzing the D� data we realized that sucha large sampling interval would not allow us to resolve a num-ber of questions concerning routing stability (x 7). Therefore forD� we adopted the strategy of making measurements between pairsof NPD sites in “bursts,” with a mean interval of 2 hours betweenmeasurements in each burst. We also continued to make lower fre-quency measurements between pairs of sites in order to gather datato assess routing stability over longer time periods, and arrangedthe measurements so that 50% would come in bursts and 50% morewidely spaced apart. But we also had traceroute measure-ments from a TCP dynamics study we are conducting using theNPD framework (Part II of [Pa96]). These were also made on av-erage two hours apart, so by including them the proportion of burstmeasurements shifted to 60% bursts, 40% more widely spaced.
The bulk of the D� measurements were also paired, meaningwe would measure the virtual path A � B and then immediatelymeasure the virtual path B � A. This enabled us to resolve am-biguities concerning routing symmetry (x 8), which again we onlyrecognized after having captured and analyzed the D� data.
ACM SIGCOMM Computer Communication Review 44 Volume 36, Number 5, October 2006

4.2 Exponential sampling
We devised our measurements so that the time intervals betweenconsecutive measurements of the same virtual path were indepen-dent and exponentially distributed. Doing so gains two important(and related) properties. The first is that the measurements corre-spond to additive random sampling [BM92]. Such sampling is un-biased because it samples all instantaneous signal values with equalprobability. The second important property is that the measurementtimes form a Poisson process. This means that Wolff' s PASTA prin-ciple—“Poisson Arrivals See Time Averages”—applies to our mea-surements: asymptotically, the proportion of our measurements thatobserve a given state is equal to the amount of time that the Inter-net spends in that state [Wo82]. Two important points regardingWolff' s theorem are (1) the observed process does not need to beMarkovian; and (2) the Poisson arrivals need not be homogeneous[Wo82, x 3].
The only requirement of the PASTA theorem is that the observedprocess cannot anticipate observation arrivals. There is one respectin which our measurements fail this requirement. Even though ourobservations come exponentially distributed, the network can an-ticipate arrivals as follows: When the network has lost connectiv-ity between the site running “npd control” and a site potentiallyconducting a traceroute, the network can predict that no mea-surement will occur. The effect of this anticipation is a tendencyto underestimate the prevalence of network connectivity problems(see also x 4.5 and x 5.2).
4.3 Which observations are representative?
37 Internet hosts participated in our routing study. This is a minis-cule fraction of the estimated 6.6 million Internet hosts as of July,1995 [Lo95], so clearly behavior we observe that is due to the par-ticular endpoint hosts in our study is not representative. Similarly,the 34 different stub networks to which these hosts belong are alsoa miniscule fraction of the more than 50,000 known to the NSFNETin April, 1995 [Me95a].
On the other hand, we argue that the routes between the 37 hostsare plausibly representative, because they include a non-negligiblefraction of the AS's which together comprise the Internet. We ex-pect the different routes within an AS to have similar characteristics(e.g., prevalence of pathologies, or routing stability), because theyfall under a common administration, so sampling a significant num-ber of AS's lends representational weight to a set of measurements.
By analyzing a BGP routing table dump obtained from an ASborder router, we find in [Pa96] that the Internet presently has about1,000 active AS's, of which the routes in our study traversed 8%.An important point, however, is that not all AS's are equal—someare much more prominent in Internet routing than others. If weweight each AS by its likelihood of occurring in an AS path, thenthe AS's sampled by the routes we measured represent about halfof the Internet AS's, indicating that our observations are plausiblyrepresentative of Internet routing as a whole.
4.4 Confidence intervals
Often in our study we will want to assign some sort of confidenceinterval to a probability derived from analyzing our data. Supposethat out of a representative sample of n observations we find that asubset of size k exhibit some property P . We might then estimatethe unconditional probability p of observing P as �p � k�n. But
the value of �p is not of much use unless we also have an idea ofits possible error. For example, if, out of 2 observations, 1 of themexhibits P , we would not feel too confident declaring that p � �
�.
To address this problem, we need to associate a confidence in-terval with �p, the interval being a range of values that, with highconfidence, includes p. In [Pa96], we develop tight bounds on theinterval in which p must lie to be consistent, with confidence c,with observing k independent instances of P in n measurements.We find that pl, the lower range of p, is given by:
pl ���
�� � ��QF ���������� c�
where: �� � ��n � k � �� and �� � �k, and QF ���������� c� isthe � � c quantile of the well-known F variance-ratio distributionwith parameters �� and ��. The upper bound, pu, has a similarform.
We also look at the problem of comparing confidence intervals.Suppose we have two separate datasets, D� and D�, in which weobserve k� instances of P out of n� independent measurements forD�, and k� out of n� for D�. If we then let c denote the con-fidence we wish to associate with a finding that the two datasetsshow a significant difference (i.e., c is the probability that an ap-parent difference is not simply due to chance), then in [Pa96] weshow that we should compute confidence intervals for D� and D�
using c� � � � �p�� c. If these intervals do not overlap, then
the prevalence of P inD� is significantly different than in D�, withconfidence c.
Throughout our study we use 95% confidence intervals, corre-sponding to c � �� and c� � ���.
4.5 Shortcomings of the experimental designAn understandable criticism of our study is that it does not pro-vide enough analysis of the routing difficulties uncovered, includingwhether these difficulties are fundamental to routing a large packet-switched internetwork, or whether they could be fixed. There areseveral reasons for this shortcoming worth noting for those whowould undertake a similar study in the future.
The first difficulty is somewhat inherent to end-to-end measure-ment: while an end-to-end measurement has the great benefit ofmeasuring a quantity of direct interest to network end users, it alsohas the difficulty of compounding effects at different hops at thenetwork into a single net effect. For example, when a routing loopis observed, a natural question is: what router is responsible forhaving created this loop? A measurement study made internal tothe network, such as [Ch93], can attempt to answer this questionbecause the network's internal state is more visible. But for an end-to-end measurement study such as ours, all that is actually visibleis the fact that a loop occurs, with little possibility of determiningwhy.
One way to determine why a problem exists is to ask those run-ning the network. We attempted a great deal of this (see x 10), butthis approach does not scale effectively for large numbers of prob-lems.
In retrospect, there are two ways in which our experiment couldbe considerably improved. The first is that if NPD's could be givena whole batch of measurement requests (rather than just a singlerequest), along with times at which to perform them, then the un-derestimation of network problems due to our centralized design(x 4.2) could be eliminated. The second is the use of a tool moresophisticated than traceroute: one that could analyze the route
ACM SIGCOMM Computer Communication Review 45 Volume 36, Number 5, October 2006

Name Description
adv Advanced Network & Services, Armonk, NYaustr University of Melbourne, Australiaaustr2 University of Newcastle, Australiabatman National Center for Atmospheric Research, Boulder, CObnl Brookhaven National Lab, NYbsdi Berkeley Software Design, Colorado Springs, COconnix Caravela Software, Middlefield, CTharv Harvard University, Cambridge, MAinria INRIA, Sophia, Francekorea Pohang Institute of Science and Technology, South Korealbl Lawrence Berkeley Lab, CAlbli LBL computer connected via ISDN, CAmid MIDnet, Lincoln, NEmit Massachusetts Institute of Technology, Cambridge, MAncar National Center for Atmospheric Research, Boulder, COnear NEARnet, Cambridge, Massachusettsnrao National Radio Astronomy Observatory, Charlottesville, VAoce Oce-van der Grinten, Venlo, The Netherlandspanix Public Access Networks Corporation, New York, NYpubnix Pix Technologies Corp., Fairfax, VArain RAINet, Portland, Oregonsandia Sandia National Lab, Livermore, CAsdsc San Diego Supercomputer Center, CAsintef1 University of Trondheim, Norwaysintef2 University of Trondheim, Norwaysri SRI International, Menlo Park, CAucl University College, London, U.K.ucla University of California, Los Angelesucol University of Colorado, Boulderukc University of Kent, Canterbury, U.K.umann University of Mannheim, Germanyumont University of Montreal, Canadaunij University of Nijmegen, The Netherlandsusc University of Southern California, Los Angelesustutt University of Stuttgart, Germanywustl Washington University, St. Louis, MOxor XOR Network Engineering, East Boulder, CO
Table 1: Sites participating in the study
measurement in real-time and repeat portions (or all) of the mea-surement as necessary in order to resolve ambiguities.
5 The Raw Routing Data
5.1 Participating sites
The first routing experiment was conducted from November 8through December 24, 1994. During this time, we attempted6,991 traceroutes between 27 sites. We refer to this col-lection of measurements as D�. The second experiment, D�,went from November 3 through December 21, 1995. It in-cluded 37,097 attempted traceroutes between 33 sites. Bothdatasets are available from the Internet Traffic Archive, http://town.hall.org/Archives/pub/ITA/. Table 1 lists thesites participating in our study, giving the abbreviation we will useto refer to the site, a brief description of the site, and its location.
5.2 Measurement failures
In the two experiments, between 5–8% of the traceroutesfailed outright (i.e., we were unable to contact the remote NPD,execute traceroute and retrieve its output). Almost all of thefailures were due to an inability of npd control to contact the re-mote NPD.
For our analysis, the effect of these contact failures will lead toa bias towards underestimating Internet connectivity failures, be-cause sometimes the failure to contact the remote daemon will re-sult in losing an opportunity to observe a lack of connectivity be-tween that site and another remote site (x 4.2).
When conducting theD� measurements, however, we somewhatcorrected for this underestimation by pairing each measurement ofthe virtual path A � B with a measurement of the virtual pathB � A, increasing the likelihood of observing such failures. Inonly 5% of the D� measurement failures was npd control also un-able to contact the other host of the measurement pair.
6 Routing pathologiesWe begin our analysis by classifying occurrences of routingpathologies—those routes that exhibited either clear, sub-standardperformance, or out-and-out broken behavior.
6.1 Routing loopsIn this section we discuss the pathology of a routing loop. For ourdiscussion we distinguish between three types of loops: a forward-ing loop, in which packets forwarded by a router eventually returnto the router; an information loop, in which a router acts on con-nectivity information derived from information it itself providedearlier; and a traceroute loop, in which a traceroute mea-surement reports the same sequence of routers multiple times. Forour study, all we can observe directly are traceroute loops, andit is possible for a traceroute loop to reflect not a forwardingloop but instead an upstream routing change that happens to addenough upstream hops that the traceroute observes the samesequence of routers as previously. Because of this potential ambi-guity, we require a traceroute measurement to show the samesequence of routers at least three times in order to be assured thatthe observation is of a forwarding loop.
In general, routing algorithms are designed to avoid forwardingloops, provided all of the routers in the network share a consistentview of the present connectivity. Thus, loops are apt to form whenthe network experiences a change in connectivity and that change isnot immediately propagated to all of the routers [Hu95]. One hopesthat forwarding loops resolve themselves quickly, as they representa complete connectivity failure.
While some researchers have downplayed the significance oftemporary forwarding loops [MRR80], others have noted that loopscan rapidly lead to congestion as a router is flooded with multiplecopies of each packet it forwards [ZG-LA92], and minimizing loopsis a major Internet design goal [Li89]. To this end, BGP is designedto never allow the creation of inter-AS forwarding loops, which itaccomplishes by tagging all routing information with the AS pathover which it has traversed.�
Persistent routing loops. For our analysis, we consideredany traceroute showing a loop unresolved by end of thetraceroute as a “persistent loop.” 10 traceroutes inD�exhibited persistent routing loops. See [Pa96] for details.
InD�, 50 traceroutes showed persistent loops. Due toD� ' shigher sampling frequency, for some of these loops we can placeupper bounds on how long they persisted, by looking for surround-ing measurements between the same hosts that do not show the
�This technique is based on the observation that forwarding loops occuronly in the wake of a routing information loop.
ACM SIGCOMM Computer Communication Review 46 Volume 36, Number 5, October 2006

loop. In addition, sometimes the surrounding measurements doshow the loop, allowing us to assign lower bounds, too.
Source Dest. Date # Location Duration
inria adv Nov. 6 1 Washington ?inria near Nov. 11 1 Washington � � hrwustl inria Nov. 24 1 Washington ?inria pubnix Nov. 12 1 Washington ?inria austr2 Nov. 15 1 Washington ?sintef1 adv Nov. 12 1 Washington ?pubnix sintef1 Nov. 8 1 Anaheim ?ustutt ucl Nov. 11 16 Stuttgart 16–32 hrconnix bsdi Nov. 14 1 MAE-East � �� hrustutt austr Nov. 14 1 same looppubnix sintef1 Nov. 14 1 Washington � 5.5 hraustr nrao Nov. 15 1 College Park ?many oce Nov. 23 12 Amsterdam 14–17 hrucol ustutt Nov. 24 1 San Francisco ?ucol inria Nov. 27 1 Paris � �� hrmid bsdi Nov. 28 1 Washington � � hrmid austr Dec. 6 1 Chicago � � hrmit wustl Dec. 10 1 St. Louis ?umann nrao Dec. 13 1 Heidelberg ?ucl mit Dec. 14 1 Cambridge � � hrnear ucla Dec. 16 1 Los Angeles ?sri near Dec. 17 �
� Palo Alto ?near sri same �
� San Francisco ?bsdi sintef1 Dec. 21 1 NJ, London � �� hr
Table 2: Persistent routing loops in D�
Table 2 summarizes the loops seen in D�. The first two columnsgive the source and destination of the traceroute, the nextcolumn the date, the fourth column the number of consecutivetraceroutes that encountered the loop, and the fifth column thelocation. Note that only one of the loops spanned multiple cities(and multiple continents!), the last in the table. The final columngives the bounds we were able to assess for the duration of theloop. Loops for which we were unable to assign plausible boundsare marked “?”.
The loop durations fall into two modes, those definitely under3 hours (and possibly quite shorter), and those of more than halfa day. The presence of persistent loops of durations on the orderof hours is quite surprising, and suggests a lack of good tools fordiagnosing network problems.
We also note a tendency for persistent loops to come in clusters.Geographically, loops occurred much more often in the WashingtonD.C. area, probably because the very high degree of interchange be-tween different network service providers in that area offers ampleopportunity for introducing inconsistencies.
Loops involving separate pairs of routers also are clustered intime. The pubnix � sintef1 loop, involving two AlterNetrouters sited in Washington D.C., was measured at the same timeas the connix� bsdi and ustutt� austr observations ofa SprintLink loop, at nearby MAE-East. The sri � near andnear� sri loop observations were paired measurements. Theydo not observe the same loop, but rather two separate loops betweenclosely related routers. Thus it appears that the inconsistencies thatlead to long-lived routing loops are not confined to a single pairof routers but also affect nearby routers, tending to introduce loopsinto their tables too. This clustering makes sense because topologi-cally close routers will often quickly share routing information, andhence if one router' s view is inconsistent, the view of the nearby
ones is likely to be so, too. The clustering suggests that an obser-vation of a persistent forwarding loop likely reflects an outage oflarger scope than just the observed set of looping routers.
Temporary routing loops. We define a temporary loop as onethat resolved during the traceroute. In D� we observed onlytwo temporary loops, but in D� we found 23. These are detailed in[Pa96]. Here, we limit the discussion to an interesting property weoften found associated with these loops, namely widespread con-nectivity or routing changes. For example, in a traceroute fromrain to inria, we observed a forty second outage; followed by aloop between five MCINET routers sited at Washington, D.C.; fol-lowed by a loss of connectivity all the way back to the rain borderrouter; followed by connectivity regained all the way to inria. Itis these middle two events that are surprising, that a loop in Wash-ington resolved into a connectivity outage between Portland andSeattle.
Most likely these widespread changes reflect the “ripple effects”of a single routing transition (a link going down), as a transient con-nectivity outage propagates through the Internet. This conjecturecould be further assessed by an analysis of BGP routing transitionstatistics, such as those available from [Me95b].
Location of routing loops. We analyzed the looping routers tosee if any of the loops involved more than one AS. As mentionedabove, the design of BGP in theory prevents any inter-AS forward-ing loops, by preventing any looping of routing information. Wefound that all of the D� and D� routing loops were confined to asingle AS, providing solid evidence that BGP route loop suppres-sion works well in practice.
6.2 Erroneous routing
InD� we found one example of erroneous routing, where the pack-ets clearly took the wrong path. This involved a connix� uclroute in which the trans-Atlantic hop was not to London but insteadto Rehovot, Israel! While we did not observe any erroneous routingin D�, there remains a security lesson to be considered: one reallycannot make any safe assumptions about where one's packets mighttravel on the Internet.
6.3 Connectivity altered mid-stream
In 10 of the D� traces we observed routing connectivity reportedearlier in the traceroute later lost or altered, indicating we werecatching a routing failure as it happened. See [Pa96] for examples.Some of these changes were accompanied by outages, in whichpresumably the intermediary routers were rearranging their viewsof the current topology, and dropping many packets in the interimbecause they did not know how to forward them. We found thatthe distribution of recovery times from routing problems is at leastbimodal—some recoveries occur quite quickly, on the time scaleof congestion delays (100's of msec to seconds), while others takeon the order of a minute to resolve. The latter type of recoverypresents significant difficulties for time-sensitive applications thatassume outages are short-lived.
In contrast with the rarity of connectivity changes in D�(10 to-tal), in D� we observed 155 instances of a change, a fact we com-ment upon further in x 6.10.
ACM SIGCOMM Computer Communication Review 47 Volume 36, Number 5, October 2006

Amsterdam Duesseldorf
Figure 1: Routes taken by alternating packets from wustl
(St. Louis, Missouri) to umann (Mannheim, Germany), dueto fluttering
6.4 Fluttering
We use the term “fluttering” to refer to rapidly-oscillating routing.Figure 1 dramatically illustrates the possible effects of fluttering.Here, the wustl border router splits it load between two STARnetrouters in St. Louis, one of which sends all of its packets to Wash-ington, D.C. (solid; 17 hops to umann), and the other to Anaheim(dotted line; 29 hops). Thus, every other packet bound for umanntravels via a different coast! While load splitting is explicitly al-lowed in [Ba95, p.79], that document also cautions that there aresituations for which it is inappropriate. We argue below that this isone of those situations.
In addition to the wustl fluttering (which occurred in everywustl originated traceroute inD�, except when the Anaheimlink went down), we also found fluttering at a ucol border router.Here, though, the two split paths immediately rejoined, so the split' seffects were completely localized. InD�, however, we saw very lit-tle fluttering—see [Pa96] for details and additional discussion.
While fluttering can provide benefits as a way to balance load ina network, it also creates a number of problems for different net-working applications. First, a fluttering network path presents thedifficulties that arise from unstable network paths (x 7.1). Second,if the fluttering only occurs in one direction, then the path suffersfrom the problems of asymmetry (x 8.1). Third, constructing reli-able estimates of the path characteristics, such as round-trip timeand available bandwidth, becomes potentially very difficult, sincein fact there may be two different sets of values to estimate. Finally,when the two routes have different propagation times, then TCPpackets arriving at the destination out of order can lead to spurious“fast retransmissions” [St94] by generating duplicate acknowledge-ments, wasting bandwidth.
These problems all argue for eliminating large-scale flutteringwhenever possible. On the other hand, when the effects of the flutterare confined, as for ucol, or invisible at the network layer (such assplit-routing used at the link layer, which would not show up at allin our study), then these problems are all ameliorated. Furthermore,if fluttering is done on a coarser granularity than per packet (say, perTCP connection), then the effects are also lessened.
Finally, we note that “deflection” routing schemes that forwardpackets along sub-optimal routes to avoid the need to buffer packetsat routers, and/or to simplify routing decisions [BDG95], have vir-tually the same characteristics as fluttering paths. In particular, de-ploying such schemes in wide-area networks could lead to grievousdifficulties unless the schemes include mechanisms for tightly con-
trolling the scope of the route differences.
6.5 Infrastructure failures
In addition to traceroute failures due to persistent routing loopsand erroneous routing, 125 of the D� traceroutes and 617 oftheD� traceroutes failed to reach the destination host for otherreasons. We analyze these failures in detail in [Pa96]. Here, weconfine ourselves to “infrastructure failures,” in which a route ter-minates in the middle of the network.
We observed a total of 13 infrastructure failures out of 6,459 D�
observations, corresponding to an Internet infrastructure availabil-ity of 99.7–99.9%, while in D� this dropped to 99.4–99.6%. Wemust bear in mind, however, that these numbers will be somewhatskewed by times when the infrastructure failure also prevented usfrom making any measurement (x 5.2), so these availability figuresare overestimates.
6.6 Unreachable due to too many hops
By default, traceroute probes up to 30 hops of the route be-tween two hosts. This length sufficed for all of the D� measure-ments, and all but 6 of the D� measurements. The fact that it failedoccasionally in D�, however, indicates that the operational diame-ter of the Internet has grown beyond 30 hops, and argues for usinglarge initial TTL values when a host originates an IP datagram.
It is sometimes assumed that the hop count of a route equates toits geographical distance. While this is roughly the case, we noticedsome remarkable exceptions. For example, we observed a 1,500 kmend-to-end route of only 3 hops, and a 2,000 km route of 5 hops.We also found that the route between mit and harv (about 3 kmapart), was consistently 11 hops in both directions. See [Pa96] fordetails.
6.7 Temporary outages
The final pathology we discuss here is temporary network outages.When a sequence of consecutive traceroute probes are lost,the most likely cause is either a temporary loss of network con-nectivity, or very heavy congestion lasting 10's of seconds. Foreach traceroute, we examined its longest period of consec-utive probe losses (other than consecutive losses at the end of atraceroute when, for example, the endpoint was unreachable).The resulting distribution of the number of probes lost appears tri-modal. In D� (D�), about 55% (43%) of the traceroutes hadno losses, 44% (55%) had between 1 and 5 losses, and 0.96%(2.2%) had 6 or more losses.
Of these latter (six or more losses, � �� sec outage), the distri-bution of the number of probes lost in the D� data is quite close togeometric, with p � ���� that a probe beyond the 6th is dropped.
In the D� data, however, we find that the geometric tail withp � ���� is present only for outages more than 75 seconds long.For outages between 30 and 70 seconds, the duration still exhibitsa strong geometric distribution, but with p � ����, suggesting twodifferent recovery mechanisms. See [Pa96] for additional discus-sion. We do not have a plausible explanation for the difference, norfor why the distribution is geometric.
ACM SIGCOMM Computer Communication Review 48 Volume 36, Number 5, October 2006

6.8 Time-of-day patterns
We analyzed the two most prevalent pathologies in D� for time-of-day patterns, to determine whether they are correlated with theknown patterns of heavy traffic levels during daytime hours andlower levels during the evening and early morning off-hours. Todo so, we must first associate a time-of-day with a traceroutemeasurement that might span multiple time zones or even conti-nents. We did so by assigning to each measurement the mean ofthe time-of-day at its source and destination hosts. For example,the time zone of Berkeley, California is three hours behind that ofCambridge, Massachusetts. For a traceroute from mit to lbl,initiated at 09:00 local time in Cambridge, we would assign a localtime of 07:30, since the traceroute occurred at 06:00 local timein California.
The first question to study is whether the measurements them-selves show a time-of-day pattern. In principle, they should not,because the exponential sampling (x 4.2) is done without regard tothe local time, so measurements should occur throughout the daywith equal likelihood. However, as discussed in x 4.2, our method-ology was flawed in the sense that no measurements were madewhen our centralized measurement process was unable to contact aremote NPD. Thus we would expect to find a bias in the time-of-dayof the measurements towards times of higher connectivity.
Indeed, we find such an effect. By binning each measurement'stime-of-day into one of the day's 24 hours, we constructed a his-togram of which hours had the most measurements and which theleast. We found that the most (4.5%) occurred during the 00:00–01:00 hour, and the least (3.8%) during the 13:00-14:00 hour, withclear correlation between better connectivity and the evening andearly morning hours. This finding accords with the widely rec-ognized phenomenon that congestion peaks during working hours,and hence, one might expect, so do connectivity outages. Thespread across the course of the day is not too great, however, withthe low hour accounting for only 15% fewer connections than thehigh hour.
The most prevalent pathology was a temporary outage lastingat least 30 seconds (x 6.7). We would expect these outages to bestrongly correlated with the time-of-day congestion patterns. In-deed, this is the case. In D�, the fewest temporary outages (0.4%)occurred during the 01:00-02:00 hour, while the most (8.0%) oc-curred during the 15:00-16:00 hour, with the pattern closely fol-lowing the daily congestion pattern.
The other pathology we analyzed was that of an infrastructurefailure (x 6.5). Here, we again have the peak occurring the 15:00-16:00 hour (9.3%), but the minimum actually occurred during the09:00-10:00 hour (1.2%). Furthermore, the second highest peak(7.6%) occurred during the 06:00-07:00 hour. We speculate thatthis pattern might reflect the network operators favoring early morn-ing (before peak hours) for making configuration changes and re-pairs. Once finished, these then hold the network stable until thelate afternoon hours, when congestion hits its peak.
6.9 Representative pathologies
In x 4.3 we argued that our measurements in general are plausi-bly representative. An important question, though, is whether thepathologies are likewise representative. It could be that our col-lection of sites happened to include an atypical AS responsiblefor much more than its representative share of pathologies. Forexample, if the regional network associated with one of the sites
Pathology Probability Trend Notes
Persistent loops 0.13–0.16% Some lasted hours.Temporary loops 0.055–0.078%Erroneous routing 0.004–0.004% No instances in D�.Mid-stream change 0.16% // 0.44% worse Suggests rapidly
varying routes.Infrastructure failure 0.21% // 0.48% worse No dominant link.Outage � �� secs 0.96% // 2.2% worse Duration exponent.
distributed.Total pathologies 1.5% // 3.4% worse
Table 3: Summary of representative routing pathologies
was more prone to looping than most AS's, then our measurementsmight observe loops much more often than the frequency by whichthey occur in the general Internet.
It often proves difficult to assign responsibility for a pathology toa particular AS, in part due to the “serial” nature of traceroute(x 4.5): a pathology observed in a traceroute measurement asoccurring at hop h might in fact be due to a router upstream tohop h that has changed the route, or a router downstream from h
that has propagated inconsistent routing information upstream to h.Nevertheless, we attempted to assess the representativeness of thepathologies as follows. For the most common pathology, a tempo-rary outage of 30 or more seconds (x 6.7), we assigned responsibil-ity for the outage to the router in the traceroute measurementdirectly upstream from the first completely missing hop, as the linkbetween this router and the missing hop is the most likely candi-date for subsequent missing packets. We then tallied for each ASthe number of its routers held culpable for outages.
The top three AS's accounted for nearly half of all of the tempo-rary outages. They were AS-3561 (MCI-RESTON), 25%; AS-1800(ICM-Atlantic; the transcontinental link between North Amer-ica and Europe, operated by Sprint), 16%; and AS-1239 (Sprint-link), 6%. These three also correspond to the top three AS's by“weight” (x 4.3), indicating that our observations of the pathologyare not suffering from skew due to an atypical AS.
6.10 Summary of pathologies
Table 3 summarizes the routing pathologies. The second columngives the probability of observing the pathology, in two forms. Arange indicates that the proportion of observations in D� was con-sistent with the proportion in D� (using the methodology outlinedin x 4.4). The range reflects the values consistent with both datasets.Two probabilities separated by “//” indicates that the proportion ofD� observations was inconsistent with the proportion of D� obser-vations. The first probability applies to D�, and reflects the state ofthe Internet at the end of 1994, and the second to D�, reflecting thestate at the end of 1995.
For those pathologies with inconsistent probabilities, the thirdcolumn assesses the trend during the year separating the D� and D�
measurements. None of the pathologies improved!, and a numberbecame significantly worse.
The final row summarizes the total probability of observing apathology. During 1995, the likelihood of a user encountering aserious end-to-end routing problem more than doubled, and is now1 in 30. The most prevalent of these problems is an outage lastingmore than 30 seconds.
This finding should concern anyone interested in the long-term
ACM SIGCOMM Computer Communication Review 49 Volume 36, Number 5, October 2006

stability of the Internet. While it is always dangerous to infer a trendfrom only two points, clearly if the pattern is indeed a trend, thennetwork service will degrade to unacceptable levels. An argumentthat it might not be a trend is that 1995 was an atypical year forInternet stability, due to the transition from the NSFNET backboneto the commerically-operated backbone. An argument that it is atrend, however, comes from recent data indicating increasing inter-AS routing instability during the second quarter of 1996 [La96].
7 End-to-end routing stabilityOne key property we would like to know about an end-to-end Inter-net route is its stability: do routes change often, or are they stableover time? In this section we analyze the routing measurements toaddress this question. We begin by discussing the impact of rout-ing stability on different aspects of networking. We then presenttwo different notions of routing stability, “prevalence” and “persis-tence,” and show that they can be independent. It turns out that“prevalence” is quite easy to assess from our measurements, and“persistence” quite difficult. In x 7.4 we characterize the preva-lence of Internet routes, and then in x 7.5 we tackle the problem ofassessing persistence.
7.1 Importance of routing stabilityOne of the goals of the Internet architecture is that large-scale rout-ing changes (i.e., those involving different autonomous systems)rarely occur [Li89]. There are a number of aspects of networkingaffected by routing stability: the degree to which the properties ofnetwork paths are predictable; the degree to which a connection canlearn about network conditions from past observations; the degreeto which real-time protocols must be prepared to recreate or migratestate stored in the routers [DB95, FBZ94, ZDESZ93, BCS94]; andthe degree to which network studies based on repeated measure-ments of network paths ([CPB93, Bo93, SAGJ93, Mu94]) can as-sume that the measurements are indeed observing the same path.
7.2 Two definitions of stabilityThere are two distinct views of routing stability. The first is: “Giventhat I observed route r at the present, how likely am I to observer again in the future?” We refer to this notion as prevalence, andequate it with the probability of observing a given route. Prevalencehas implications for overall network predictability, and the abilityto learn from past observations (c.f. x 7.1).
A second view of stability is: “Given that I observed route r attime t, how long before that route is likely to have changed?” Werefer to this notion as persistence. It has implications for how toeffectively manage router state, and for network studies based onrepeated path measurements.
Intuitively, we might expect these two notions to be coupled.Consider, for example, a sequence of routing observations madeevery T units of time. If the routes we observe are:
R�� R�� R�� R�� R�� R�� R�� R�� R�� R�� R�� R�� R�� R�� R� � � �
then clearly route R� is much more prevalent than route R�. Wemight also conclude that route R� is persistent, because we observeit so frequently; but this is not at all necessarily the case. For exam-ple, suppose T is one day. If the mean duration of R� is 10 days,and that of R� is one day, then this sequence of observations is
quite plausible, and we would be correct in concluding that R� ispersistent and prevalent. Furthermore, depending on our concern,we might also deem that R� is persistent, since on average it lastsfor a full day. In that case, R� is persistent but not prevalent.
But suppose instead that the mean duration of R� is 10 secondsand the mean duration of R� is 1 second. If, for example, the al-ternations between them occur as a semi-Markov process, then theproportion of time spent in state R� is ��
��[Ro83], again reflecting
that R� is prevalent. Similarly, the proportion of time spent in stateR� is �
��. Given these proportions, the sequence of observations is
still plausible, even though each observation of R� is actually of aseparate instance of the route. In this case, R� is prevalent but notpersistent, and R� is neither prevalent nor persistent.
7.3 Reducing the dataWe confine our analysis to the D� measurements, as these weremade at a wide range of intervals (60% with mean 2 hrs and40% with mean 2.75 days), which allows us to assess stabilityover many time scales, and to tackle the “persistence ambiguity”outlined above. Of the 35,109 D� measurements, we omittedthose exhibiting pathologies (because they reflect difficulties dis-tinct from routing instabilities), and those for which one or more ofthe traceroute hops was completely missing, as these measure-ments are inherently ambiguous. This left us with 31,709 measure-ments.
We next made a preliminary assessment of the patterns of routechanges by seeing which occurred most frequently. We foundthe pattern of changes dominated by a number of single-hop dif-ferences, at which consecutive measurements showed exactly thesame path except for an alternation at a single router. Furthermore,the names of these routers often suggested that the pair were ad-ministratively interchangeable. It seems likely that frequent routechanges differing at just a single hop are due to shifting traffic be-tween two tightly coupled machines. For the stability concernsgiven in x 7.1, such a change will have little consequence, pro-vided the two routers are co-located and capable of sharing state.We identified 5 such pairs of “tightly coupled” routers and mergedeach pair into a single router for purposes of assessing stability (see[Pa96] for details).
Finally, we reduced the routes to three different levels of granu-larity: considering each route as a sequence of Internet hostnames(host granularity), as a sequence of cities (city granularity; see[Pa96] for details on geography), and as a sequence of AS's (ASgranularity). The use of city and AS granularities introduces a no-tion of “major change” as opposed to “any change.” Overall, 57%of the route changes at host granularity were also changes at citygranularity, and 36% were changes at AS granularity.
7.4 Routing PrevalenceIn this section we look at routing stability from the standpoint ofprevalence: how likely we are, overall, to observe a particular route(c.f. x 7.2). We associate with prevalence a parameter �r, thesteady-state probability that a virtual path at an arbitrary point intime uses a particular route r.
We can assess �r from our data as follows. We hypothesize thatrouting changes follow a semi-Markov process, in which case thesteady-state probability of observing a particular state is equal tothe average amount of time spent in that state [Ro83]. Because ofPASTA, our sampling gives us exactly this time average (x 4.2). So
ACM SIGCOMM Computer Communication Review 50 Volume 36, Number 5, October 2006

Prevalence of Dominant Route
Cumu
lative
Probab
ility
0.2 0.4 0.6 0.8 1.0
0.00.2
0.40.6
0.81.0 Host granularity
City granularityAS granularity
Figure 2: Fraction of observations finding the dominantroute, for all virtual paths, at all granularities
if we make n observations of a virtual path and kr of them find stater (i.e., route r), then we estimate ��r � kr�n.
For a particular virtual path p, let np be the total number oftraceroutes measuring that virtual path, and kp be the numberof times we observed the dominant route, meaning the route thatappeared most often. We focus our analysis on ��dom p � kp�np,the prevalence of the dominant route.
Figure 2 shows the cumulative distribution of the prevalence ofthe dominant routes over all 1,054 virtual paths measured in D�,for the three different granularities. There is clearly a wide range,particularly for host granularity. For example, for the virtual pathbetween pubnix and austr, in 46 measurements we observed9 distinct routes at host granularity, and the dominant route wasobserved only 10 times, leading to ��dom � �����. On the otherhand, at host granularity more than 25% of the virtual paths exhib-ited only a single route (��dom � �). For city and AS granularities,the spread in ��dom is more narrow, as would be expected.
A key figure to keep in mind from this plot, however, is that whilethere is a wide range in the distribution of ��dom over different vir-tual paths, its median value at host granularity is 82%; 97% at citygranularity, and 100% at AS granularity. Thus we can conclude: Ingeneral, Internet paths are strongly dominated by a single route.
Previous traffic studies, however, have shown that many charac-teristics of network traffic exhibit considerable site-to-site variation[Pa94], so it behooves us to assess the differences in ��dom betweenthe sites in our study. To do so, for each site s (and for each granu-larity) we computed:
��src s �X
src virt-p si
ksinsi
�
Here “src virt-p” refers to all virtual paths that have their source at s.The aggregate estimate ��src s then indicates the overall prevalenceof dominant routes from s to different destinations. We expect vari-ations in this estimate for different sites to reflect differing routingprevalence due to route changes near the source. Route changesfurther downstream from the source occur either deep inside thenetwork (and so will affect many different sites), or near the desti-nation (and thus will not affect any particular source site unduly).
Similarly, we can construct ��dst s for all of the virtual pathswith destination s. Studying ��src s and ��dst s for different sites andat different granularities reveals considerable site-to-site variation.
For example, at host granularity, the prevalence of the dominantroutes originating at the ucl source is under 50% (we will see whyin x 7.5.1), and for bnl, sintef1, sintef2, and pubnix isaround 60%, while for ncar, ucol, and unij it is just under90%. Even at AS granularity, the ucl source has an average preva-lence of 60%, with ukc about 70%, and the remainder from 85% to99%. At city granularity the main outlier is bnl, with a prevalenceof 75% (c.f. x 7.5.2), because the ucl and ukc instabilities, whilespanning autonomous systems, do not span different cities.
We find similar spreads for ��dst s. Some sites with low preva-lence for ��src s have high prevalence for ��dst s, and vice versa, dueto asymmetric routing (x 8).
We can thus summarize routing prevalence as follows: In gen-eral, Internet paths are strongly dominated by a single route, but,as with many aspects of Internet behavior, we also find significantsite-to-site variation.
7.5 Routing Persistence
We now turn to the more difficult task of assessing the persistenceof routes: How long they are likely to endure before changing. Asillustrated in x 7.2, routing persistence can be difficult to evaluatebecause a series of measurements at particular points in time donot necessarily indicate a lack of change and then change back inbetween the measurement points. Thus, to accurately assess persis-tence requires first determining if routing alternates on short timescales. If not, then we can trust shortly spaced measurements ob-serving the same route as indicating that the route did indeed persistduring the interval between the measurements. The shortly spacedmeasurements can then be used to assess whether routing alternateson medium time scales, etc. In this fashion, we aim to “bootstrap”ourselves into a position to be able to make sound characterizationsof routing persistence across a number of time scales.
7.5.1 Rapid route alternation
We have already identified two types of rapidly alternating routes,those due to “flutter” and those due to “tightly coupled” routers. Wehave separately characterized fluttering (x 6.4) and consequentlyhave not included paths experiencing flutter in this analysis. Asmentioned in x 7.3, we merged tightly coupled routers into a singleentity, so their presence also does not further affect our analysis.
We next note that in D� we observed 155 instances of a routechange during a traceroute. The combined amount of time ob-served by the 35,109 D� traceroutes was 881,578 seconds.(That is, the mean duration of a D� traceroute was 25.1 sec-onds.) Since when observing the network for 881,578 seconds wesaw 155 route changes, we can estimate that on average we willsee a route change every 5,687 seconds (� 1.5 hours). This re-flects quite a high rate of route alternation, and bodes ill for relyingon measurements made much more than a few hours apart (thoughsee x 7.5.2); but not so high that we would expect to completelymiss routing changes for sampling intervals significantly less thanan hour.
We first looked at measurements made less than 60 secondsapart. There were only 54 of these, but all of them were of theform “R�� R�”—i.e., both measurements observed the same route.Thus there are no additional widespread, high-frequency routingoscillations.
We then looked at measurements made less than 10 minutesapart. There were 1,302 of these, and 40 triple observations (three
ACM SIGCOMM Computer Communication Review 51 Volume 36, Number 5, October 2006
Destination Site
Confi
denc
e Inte
rval fo
r 10-m
inute
chan
ges
0.00.0
50.1
00.1
5
adv
austr
2bn
lbs
dilbl
imi
dmi
tne
arnra
opa
nixsri uc
lauc
oluk
cum
ont
ustut
twu
stlsin
tef1
lblsin
tef2
inria harv
pubn
ixsd
sc ncar
oce ucl
uman
nco
nnix
rain un
ijsa
ndia
austr
Figure 3: Site-to-site variation in P ��
dst s
observations all within a ten minute interval). The triple observa-tions allow us to double check for the presence of high-frequencyoscillations: if we observe the pattern R�� R�� R� or R�� R�� R�,then we are likely to miss some route changes when using only twomeasurements 10 minutes apart. If we only observe R�� R�� R�;R�� R�� R�; or R�� R�� R�, then measurements made 10 minutesapart are not missing short-lived routes. Of the 40 triple observa-tions, all were of the latter forms.
The 1,302 ten-minute observations included 25 instances of aroute change (R�� R�). This suggests that the likelihood of observ-ing a route change over a ten minute interval is not negligible, andrequires further investigation before we can look at more widelyspaced measurements.
A natural question to ask concerning 10-minute changes iswhether just a few sites are responsible for most of them. For eachsite s, let N��
src s be the number of 10-minute pairs of measurementsoriginating at s, and X��
src s be the number of times those observeda change. Similarly, define N��
dst s and X��
dst s for those pairs of mea-surements with destination s. Here we are aggregating, for eachsite, all of the measurements made using that site as a source (des-tination), in an attempt to see whether route oscillations are signifi-cantly more prevalent near a handful of the sites.
For each site s, we can then define: P ��src s � X��
src s�N��src s, and
similarly for P ��
dst s. P��
src s gives the estimated probability that a pairof ten-minute observations of virtual paths with source s will showa routing change. We can then use the methodology outlined inx 4.4 to associated confidence intervals with P ��
src s and P ��
dst s, to seewhich sites, if any, exhibit significantly different probabilities often-minute changes.
Figure 3 shows the resulting confidence intervals for P ��
dst s. Sitesare sorted according to the lower end of their confidence interval.Each interval is shown using a vertical bar, with the name of the siteleft-justified to start at P ��
dst s.The horizontal line in the plot runs along the level corresponding
to the smallest upper bound on P ��
dst s (sri). All sites with inter-vals intersecting the line are pairwise consistent with one another.Those sites above the line (sandia, austr) are not consistentwith the bulk of the other sites.
An important point here, however, is that the statistical compar-ison is valid for consistency between pairs. When plotting a whole
set of confidence intervals, we must allow for a multiplicity effect:there is more opportunity for a few intervals to be inconsistent withthe others, just due to chance. Thus, inconsistencies in the plot arenot neccessarily significant. The plot does, however, point up out-liers that merit further investigation. From this plot we concludethat sandia and (particularly) austr are outliers, much morelikely (as destinations) subject to rapid routing oscillations. Beforeremoving them as outliers, however, we must be careful to first lookat their routing oscillations to see what patterns they exhibit.
For the destination austr, all of the changes (which in-volve a number of source sites) take place at the point-of-entry into Australia. The changes are either the first Australianhop of vic.gw.au, in Melbourne, or act.gw.au, in Can-berra, or serial4-6.pad-core2.sydney.telstra.netin Sydney followed by an additional hop to nsw.gw.au (also inSydney). These are the only points of change: before and after, theroutes are unchanged. Thus, the destination austr exhibits rapid(time scale of tens of minutes) changes in its incoming routing. Assuch, the routing to austr is not at all persistent.
For sandia, however, the story is different. Its changes oc-curred only along the virtual path originating at sri, and reflecteda change localized to MCINET in San Francsico. Had this changebeen more prevalent, we might have decided that the two pairs ofrouters in question were “tightly coupled” (x 7.3), but they wereresponsible for changes only between sri and sandia. Thus,we can deal with this outlier by eliminating the virtual path sri� sandia, but keeping the other virtual paths with destinationsandia.
In addition to the destination austr, a similar analysis of P ��src s
points up ucl, ukc, mid, and umann as outliers. Both ucl andukc had frequent oscillations in the routers visited between Londonand Washington, D.C., alternating between the two hops of:
icm-lon-1.icp.net, icm-dc-1-s3/2-1984k.icp.net
and the four hops of:
eu-gw.ja.net, gw.linx.ja.net,us-gw.thouse.ja.net, icm-dc-1-s2/4-1984k.icp.net
Note that these different hops also correspond to different AS's, asthe latter includes AS 786 (JANET) and the former does not. Formid and umann, however, the changes did not have a clear pattern,and their prevalence could be due simply to chance.
On the basis of this analysis, we conclude that the sources ucland ukc, and the destination austr, suffer from significant, high-frequency oscillation, and excluded them from further analysis. Af-ter removing any measurements originating from the first two ordestined to austr, we then looked at the range of values for P ��
src sand P ��
dst s. Both of these had a median of 0 observed changes, and amaximum corresponding to about 1 change per hour. On this basis,we believe we are on firm ground treating pairs of measurementsbetween these sites, made less than an hour apart, both observingthe same route, as consistent with that route having persisted un-changed between the measurements.
7.5.2 Medium-scale route alternation
Given the findings that, except for a few sites, route changes do notoccur on time scales less than an hour, we now turn to analyzingthose measurements made an hour or less apart to determine whatthey tell us about medium-scale routing persistence. We proceedmuch as in x 7.5.1. Let P hr
src s and P hr
dst s be the analogs of P ��
src s andP ��
dst s, but now for measurements made an hour or less apart. After
ACM SIGCOMM Computer Communication Review 52 Volume 36, Number 5, October 2006

eliminating the rapidly oscillating virtual paths previously identi-fied, we have 7,287 pairs of measurements to assess.
The data also included 1,517 triple observations spanning anhour or less. Of these, only 10 observed the pattern R�� R�� R�
or R�� R�� R�, indicating that, in general, two observations spacedan hour apart are not likely to miss a routing change.
Plots similar to Figure 3 immediately pick out virtual paths orig-inating from bnl as exhibiting rapid changes. These changes arealmost all from oscillation between llnl-satm.es.net andpppl-satm.es.net. (The first in California, the second in NewJersey). ESNET oscillations also occurred on one-hour time scalesin traffic between lbl (and lbli) and the Cambridge sites, near,harv, and mit.
The other prevalent oscillation we found was between the sourceumann and the destinations ucl and ukc. Here the alternationwas between a British Telecom router in Switzerland and anotherin the Netherlands.
Eliminating these oscillating virtual paths leaves us with 6,919measurement pairs. These virtual paths are not statistically identi-cal (i.e., we find among them paths that have significantly differentroute change rates), but all have low rates of routing changes. Forthese virtual paths, the median P hr
src s and P hr
dst s correspond to onerouting change per 1.5 days, and the maximum to one change per12 hours.
7.5.3 Large-scale route alternation
Given that, after removing the oscillating paths discussed above,we expect at most on the order of one route change per 12 hours,we now can analyze measurements less than 6 hours apart of theremaining virtual paths to assess longer-term route changes. Therewere 15,171 such pairs of measurements. As 6 hours is significantlylarger than the mean 2 hour sampling interval, not surprisingly wefind many triple measurements spanning less than 6 hours. But ofthe 10,660 triple measurements, only 75 included a route change ofthe form R�� R�� R� or R�� R�� R�, indicating that, for the virtualpaths to which we have now narrowed our focus, we are still notmissing many routing changes using measurements spaced up to6 hours apart.
Employing the same analysis, we first identify sintef1 andsintef2 as outliers, both as source and as destination sites. Themajority of their route changes turn out to be oscillations betweentwo sets of routers, each alternating between visiting or not visitingOslo. Two other outliers at this level are traffic to or from sdsc,which alternates between two different pairs of CERFNET routersin San Diego, and traffic originating from mid, which alternatesbetween two MIDNET routers in St. Louis.
Eliminating these paths leaves 11,174 measurements of the712 remaining virtual paths. The paths between the sites in theseremaining measurements are quite stable, with a maximum transi-tion rate for any site of about one change every two days, and amedian rate of one per four days.
7.5.4 Duration of long-lived routes
We term the remaining measurements as corresponding to “long-lived” routes. For these, we might hazard to estimate the durationsof the different routes as follows. We suppose that we are not com-pletely missing any routing transitions, an assumption based on theoverall low rate of routing changes. Then for a sequence of mea-surements all observing the same route, we assume that the route's
0 10 20 30 40 50
0.00.0
50.1
00.1
5
Route Duration (Days)
Fractio
n of R
outes
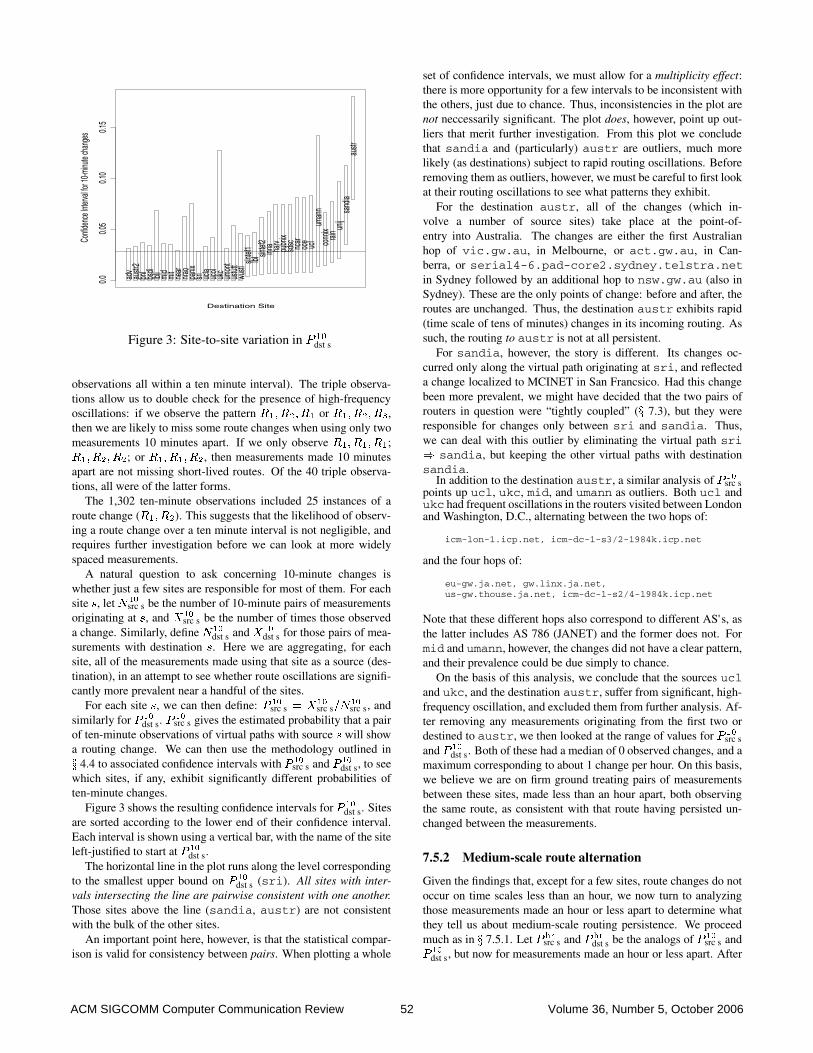
Figure 4: Estimated distribution of long-lived route durations
Time scale % Notes
seconds N/A “Flutter” for purposes of load balancing.Treated separately, as a pathology, and not in-cluded in the analysis of persistence.
minutes N/A “Tightly-coupled routers.” We identifiedfive instances, which we merged into singlerouters for the remainder of the analysis.
10's of minutes 9% Frequent route changes inside the network. Insome cases involved routing through differentcities or AS's.
hours 4% Usually intra-network changes.6+ hours 19% Also intra-network changes.days 68% Bimodal. 50% of routes persist for under 7
days. The remaining 50% account for 90%of the total route lifetimes.
Table 4: Summary of persistence at different time scales
duration was at least the span of the measurements. Furthermore,if at time t� we observe route R� and then the next measurement attime t� observes route R�, we make a “best guess” that route R�
terminated and route R� began half way between these measure-ments, i.e., at time t��t�
�. (See [Pa96] for additional details.)
Figure 4 shows the distribution of the estimated durations of the“long-lived” routes. Even keeping in mind that our estimates arerough, it is clear that the distribution of long-lived route durationshas two distinct regions, with many of the routes persisting for 1-7 days, and another group persisting for several weeks. About halfthe routes persisted for under a week, but the half of the routeslasting more than a week accounted for 90% of total persistence.This means that if we observe a virtual path at an arbitrary point intime, and we are not observing one of the numerous, more rapidlyoscillating paths outlined in the previous sections, then we haveabout a 90% chance of observing a route with a duration of at leasta week.
7.5.5 Summary of routing persistence
We summarize routing persistence as follows. First, routingchanges occur over a wide range of time scales, ranging from sec-onds to days. Table 4 lists different time scales over which routeschange. The second column gives the percentage of all of our mea-sured virtual paths (source/destination pairs) that were affected by
ACM SIGCOMM Computer Communication Review 53 Volume 36, Number 5, October 2006

changes at the given time scale. (The first two rows show “N/A” inthis field because the changes were due to a very small, and hencenot representative, set of routers.) The final column gives associatednotes.
One important point apparent from the table is that routingchanges on shorter time scales (fewer than days) happen inside thenetwork and not at the stub networks. Thus, those changes observedin our measurements are likely to be similar to those observed bymost Internet sites.
On the other hand, while the changes occurred inside the net-work, only those involving ucl and ukc (x 7.5.1) involved differ-ent sequences of autonomous systems. While this bodes well forthe scalability of BGP, we do not claim this finding as having ma-jor significance: one could make a much more thorough assessmentof the degree of inter-AS route flapping by analyzing the data dis-cussed in [Do95, Me95b].
Finally, two thirds of the Internet paths we studied had quite sta-ble routes, persisting for days or weeks. This finding is in accordwith that of [Ch93], which found that most networks are nearly qui-escent (in terms of routing changes) while a few exhibit frequentconnectivity transitions.
8 Routing symmetryWe now analyze the measurements to assess the degree to whichroutes are symmetric or asymmetric. We confine ourselves to study-ing “major” asymmetries, in which the sequence of cities or AS'svisited by the routes for the two directions of a virtual path dif-fer. We first discuss the impact of routing asymmetry on differentnetwork protocols and measurements. We then assess our data forthese asymmetries and find that, overall, 50% of the time an Inter-net path includes a major asymmetry in terms of the cities visitedin the different directions, and 30% of the time it includes a majorasymmetry in terms of AS's visited. We finish with a discussion ofthe magnitude of the asymmetries, most of which differ at just one“hop,” but some at many hops.
8.1 Importance of routing symmetryRouting symmetry affects a number of aspects of network behavior.When attempting to assess the one-way propagation time betweentwo Internet hosts, the common practice is to assume it is well ap-proximated as half of the round-trip time (RTT) between the hosts[CPB93]. The Network Time Protocol (NTP) needs to make suchan assumption when synchronizing clocks between widely sepa-rated hosts [Mi92].�
Claffy and colleagues studied variations in one-way latencies be-tween the United States, Europe, and Japan [CPB93]. They dis-cuss the difficulties of measuring absolute differences in propaga-tion times in the absence of separately-synchronized clocks, but fortheir study they focussed on variations, which does not require syn-chronization of the clocks. They found that the two opposing direc-tions of a path do indeed exhibit considerably different latencies, inpart due to different congestion levels, and in part due to routingchanges.
Routing asymmetry also potentially complicates mechanisms bywhich endpoints infer network conditions from the pattern of packet
�However, NTP features robust algorithms that will only lead to incon-sistencies if the paths between two NTP communities are predominantlyasymmetric, with similar differences in one-way times.
arrivals they observe, and the utility of routers establishing antici-patory flow state when they observe a new flow from A to B that islikely to generate a return flow from B to A [CBP95]. See [Pa96]for detailed discussion of these.
Finally, routing asymmetry complicates network trouble-shooting, because it increases the likelihood that a network problemapparent in one direction along a virtual path cannot be detected inthe other direction.
8.2 Analysis of routing symmetryIn D� we did not make simultaneous measurements of the virtualpaths A � B and B � A, which introduces ambiguity into ananalysis of routing symmetry: if a measurement ofA� B is asym-metric to a later measurement of B � A, is that because the routeis the same but asymmetric, or because the route changed?
In D�, however, the bulk of the measurements were paired(x 4.1), allowing us to unambiguously determine whether the routebetween A and B is symmetric. The D� measurements contain11,339 successful pairs of measurements. Of these, we find that49% of the measurements observed an asymmetric path that visitedat least one different city.
There is a large range, however, in the prevalence of asymmetricroutes among virtual paths to and from the different sites. For exam-ple, 86% of the paths involving umann were asymmetric, becausenearly all outbound traffic from umann traveled via Heidelberg, butnone of the inbound traffic did. At the other end of the spectrum,only 25% of the paths involving umont were asymmetric (but thisis still a significant amount).
If we consider autonomous systems rather than cities, then westill find asymmetry quite common: about 30% of the paired mea-surements observed different autonomous systems in the virtualpath's two directions. The most common asymmetry was the addi-tion of a single AS in one direction. This can reflect a major change,however, such as the presence or absence of SprintLink routers (themost common AS change).
Again, we find wide variation in the prevalence of asymme-try among the different sites. Fully 84% of the paths involvingucl were asymmetric, mostly due to some paths including JANETrouters in London and others not (x 7.5.1), while only 7.5% ofadv' s paths were asymmetric at AS granularity.
8.3 Increasing prevalence of asymmetryWe analyzedD� for routing asymmetry, attempting to adjust for thenon-simultaneity of its measurements by only using measurementsspaced less than a day apart. The mismatch is likely to overestimaterouting asymmetry, since if the route changes between measure-ments that may be incorrectly regarded as an asymmetry, per ourdiscussion at the beginning of x 8.2, though it can also introducefalse symmetries.
In theD� measurements, we found 30% of the virtual paths con-tained city-level asymmetries. The large discrepancy between thisfigure and the 49% figure for the D� measurements suggests thatover the course of a year routing became significantly more asym-metric.
8.4 Size of asymmetriesWe finish with a look at the size of the asymmetries. We find thatthe majority of asymmetries are confined to a single “hop” (just one
ACM SIGCOMM Computer Communication Review 54 Volume 36, Number 5, October 2006

city or AS different). For city asymmetries, though, about one thirddiffered at two or more “hops.” This corresponds to almost 20% ofall the paired measurements in our study, and can indicate a verylarge asymmetry. For example, a magnitude 2 asymmetry betweenucl and umann differs at the central city hops of Amsterdam andHeidelberg in one direction, and Princeton and College Park in theother!
9 Summary
We have reported on an analysis of 40,000 end-to-end Internet routemeasurements, conducted between a diverse collection of Internetsites. The study characterizes pathological routing conditions, rout-ing stability, and routing symmetry. For pathologies, we found anumber of examples of routing loops, some persisting for hours;one instance of erroneous routing; a number of instances of “in-frastructure failures,” meaning that routing failed deep inside thenetwork; and numerous outages lasting 30 seconds or more.
Our statistical methodology allows us to assign confidence in-tervals to the probabilities of observing different pathologies, andto compare these intervals for significant differences. We find thatthe likelihood of encountering a major routing pathology more thandoubled between the end of 1994 and the end of 1995, rising from1.5% to 3.4%.
For routing stability, we defined two types of stability, “preva-lence,” meaning the overall likelihood that a particular route is en-countered, and “persistence,” the likelihood that a route remains un-changed over a long period of time. We find that Internet paths areheavily dominated by a single prevalent route, but that the time pe-riods over which routes persist show wide variation, ranging fromseconds up to days. About 2/3's of the Internet paths had routespersisting for either days or weeks.
For routing symmetry, we looked at the likelihood that a virtualpath through the Internet visits at least one different city in the twodirections. At the end of 1995, this was the case half the time, nearlydouble the likelihood at the end of 1994, and at least one differentautonomous system was visited 30% of the time.
The presence of pathologies, short-lived routes, and major asym-metries highlights the difficulties of providing a consistent topolog-ical view in an environment as large and diverse as the Internet.Furthermore, the findings that the prevalence of pathologies andasymmetries greatly increased during 1995 show in no uncertainterms that Internet routing has become less predictable in majorways.
A constant theme running through our study is that ofwidespread variation. We repeatedly find that different sites or pairsof sites encounter very different routing characteristics. This find-ing matches that of [Pa94], which emphasizes that the variations inInternet traffic characteristics between sites are significant to thepoint that there is no “typical” Internet site. Similarly, there isno “typical” Internet path. But we believe the scope of our mea-surements gives us a solid understanding of the breadth of behaviorwe might expect to encounter—and how, from an end-point' s view,routing in the Internet actually works.
10 Acknowledgements
This work would not have been possible without the efforts ofthe many volunteers who installed the Network Probe Daemon
at their sites. In the process they endured debugging headaches,inetd crashes, software updates, and a seemingly endless streamof queries from me regarding their site' s behavior. I am indebtedto:
Guy Almes and Bob Camm (adv); Jos Alsters (unij);Jean-Chrysostome Bolot (inria); Hans-Werner Braun, KimClaffy, and Bilal Chinoy (sdsc); Randy Bush (rain);Jon Crowcroft and Atanu Ghosh (ucl); Peter Danzig andKatia Obraczka (usc); Mark Eliot (sri); Robert Elz(austr); Teus Hagen (oce); Steinar Haug and Havard Ei-dnes (sintef1, sintef2); John Hawkinson (near andpanix); TR Hein (xor); Tobias Helbig and Werner Sinze(ustutt); Paul Hyder (ncar); Alden Jackson (sandia);Kate Lance (austr2); Craig Leres (lbl); Kurt Lidl(pubnix); Peter Linington, Alan Ibbetson, Peter Collinson,and Ian Penny (ukc); Steve McCanne (lbli); John Mil-burn (korea); Walter Mueller (umann); Evi Nemeth,Mike Schwartz, Dirk Grunwald, Lynda McGinley (ucol,batman); Francois Pinard (umont); Jeff Polk and KeithBostic (bsdi); Todd Satogata (bnl); Doug Schmidt and Mi-randa Flory (wustl); Sorell Slaymaker and Alan Hannan(mid); Don Wells and Dave Brown (nrao); Gary Wright(connix); John Wroclawski (mit); Cliff Young and BradKarp (harv); and Lixia Zhang, Mario Gerla, and Simon Wal-ton (ucla).
I am likewise indebted to Keith Bostic, Evi Nemeth, RichStevens, George Varghese, Andres Albanese, Wieland Holfelder,and Bernd Lamparter for their invaluable help in recruiting NPDsites. Thanks too to Peter Danzig, Jeff Mogul, and Mike Schwartzfor feedback on the NPD design.
This work greatly benefited from the efforts and insights ofDomenico Ferrari, Sally Floyd, John Hawkinson, Van Jacob-son, Kurt Lidl, Steve McCanne, Greg Minshall, Craig Partridge,and John Rice, all of whom gave detailed comments on [Pa96];from discussions with Guy Almes, Robert Elz, Teus Hagen, JohnHawkinson, Kate Lance, Paul Love, Jamshid Mahdavi, MattMathis, Dave Mills, and Curtis Villamizar; and from the commentsof the SIGCOMM reviewers. I would like to particularly thank VanJacobson and John Rice for their advice regarding the thorny prob-lem of assessing routing “persistence.”
Often to understand the behavior of particular routers or to de-termine their location, I asked personnel from the organization re-sponsible for the routers. I was delighted at how willing they wereto help, and in this regard would like to acknowledge:
Vadim Antonov, Tony Bates, Michael Behringer, Per GregersBilse, Bjorn Carlsson, Peggy Cheng, Guy Davies, Sean Do-ran, Bjorn Eriksen, Amit Gupta, Tony Hain, John Hawkin-son again!, Susan Harris, Ittai Hershman, Kevin Hoadley, ScottHuddle, James Jokl, Kristi Keith, Harald Koch, Craig Labovitz,Tony Li, Martijn Lindgreen, Ted Lindgreen, Dan Long, BillManning, Milo Medin, Keith Mitchell, Roderik Muit, ChrisMyers, Torben Nielsen, Richard Nuttall, Mark Oros, MichaelRamsey, Juergen Rauschenbach, Douglas Ray, Brian Renaud,Jyrki Soini, Nigel Titley, Paul Vixie, and Rusty Zickefoose.
A preliminary analysis ofD� was done by Mark Stemm and Ke-tan Patel.
References[Ba95] F. Baker, Ed., “Requirements for IP Version 4 Routers,”
RFC 1812, DDN Network Information Center, June 1995.
[BDG95] C. Baransel, W. Dobosiewicz, and P. Gburzynski, “Routingin Multihop Packet Switching Networks: Gb/s Challenge,”IEEE Network, 9(3), pp. 38-61, May/June 1995.
ACM SIGCOMM Computer Communication Review 55 Volume 36, Number 5, October 2006

[BM92] I. Bilinskis and A. Mikelsons, Randomized Signal Processing,Prentice Hall International, 1992.
[Bo93] J-C. Bolot, “End-to-End Packet Delay and Loss Behavior inthe Internet,” Proceedings of SIGCOMM '93, pp. 289-298,September 1993.
[BCS94] R. Braden, D. Clark, and S. Shenker, “Integrated Services in theInternet Architecture: an Overview,” RFC 1633, DDN NetworkInformation Center, June 1994.
[BE90] L. Breslau and D. Estrin, “Design of Inter-Administrative Do-main Routing Protocols,” Proceedings of SIGCOMM '90, pp.231-241, September 1990.
[Ch93] B. Chinoy, “Dynamics of Internet Routing Information,” Pro-ceedings of SIGCOMM '93, pp. 45-52, September 1993.
[CBP95] K. Claffy, H-W. Braun and G. Polyzos, “A ParameterizableMethodology for Internet Traffic Flow Profiling,” IEEE JSAC,13(8), pp. 1481-1494 October 1995.
[CPB93] K. Claffy, G. Polyzos and H-W. Braun, “Measurement Con-siderations for Assessing Unidirectional Latencies,” Internet-working: Research and Experience, 4 (3), pp. 121-132,September 1993.
[DC90] S. Deering and D. Cheriton, “Multicast Routing in Datagram In-ternetworks and Extended LANs,” ACM Transactions on Com-puter Systems, 8(2), pp. 85-110, May 1990.
[DB95] L. Delgrossi and L. Berger, Ed., “Internet Stream Proto-col Version 2 (ST2), Protocol Specification—Version ST2+,”RFC 1819, DDN Network Information Center, August 1995.
[Do95] Sean Doran, “Route Flapping,” with notes by Stan Barber, http://www.merit.edu/routing.arbiter/NANOG/2.95.NANOG.notes/route-flapping.html.
[ERH92] D. Estrin, Y. Rekhter and S. Hotz, “Scalable Inter-Domain Rout-ing Architecture,” Proceedings of SIGCOMM '92, pp. 40-52,August 1992.
[FBZ94] D. Ferrari, A. Banerjea and H. Zhang, “Network support formultimedia: A discussion of the Tenet approach,” ComputerNetworks and ISDN Systems, 26(10), pp. 1267-1280, July 1994.
[FJ94] S. Floyd and V. Jacobson, “The Synchronization of PeriodicRouting Messages,” IEEE/ACM Transactions on Networking,2(2), pp. 122-136, April 1994.
[HK89] S. Hares and D. Katz, “Administrative Domains and RoutingDomains: A Model for Routing in the Internet,” RFC 1136, Net-work Information Center, SRI International, Menlo Park, CA,December, 1989.
[Hu95] C. Huitema, Routing in the Internet, Prentice Hall PTR, 1995.
[Ja89] V. Jacobson, traceroute, ftp://ftp.ee.lbl.gov/traceroute.tar.Z, 1989.
[KZ89] A. Khanna and J. Zinky, “The Revised ARPANET Routing Met-ric,” Proceedings of SIGCOMM '89, pp. 45-56, 1989.
[La96] C. Labovitz, private communication, May 1996.
[Li89] M. Little, “Goals and Functional Requirements for Inter-Autonomous System Routing,” RFC 1126, Network Informa-tion Center, SRI International, Menlo Park, CA, October, 1989.
[Lo95] M. Lottor, ftp://nic.merit.edu/nsfnet/statistics; October, 1995.
[MFR78] J. McQuillan, G. Falk and I. Richer, “A Review of the Develop-ment and Performance of the ARPANET Routing Algorithm,”IEEE Transactions on Communications, 26(12), pp. 1802-1811,December 1978.
[MRR80] J. McQuillan, I. Richer and E. Rosen, “The New Routing Algo-rithm for the ARPANET,” IEEE Transactions on Communica-tions, 28(5), pp. 711-719, May 1980.
[Me95a] Merit Network, Inc., ftp://nic.merit.edu/nsfnet/statistics/history.nets; May, 1995.
[Me95b] Merit Network, Inc., http://nic.merit.edu/routing.arbiter/RA/statistics/flap.html.
[Mi92] D. Mills, “Network Time Protocol (Version 3): Specification,Implementation and Analysis,” RFC 1305, Network InformationCenter, SRI International, Menlo Park, CA, March 1992.
[Mu94] A. Mukherjee, “On the Dynamics and Significance of Low Fre-quency Components of Internet Load,” Internetworking: Re-search and Experience, Vol. 5, pp. 163-205, December 1994.
[Pa94] V. Paxson, “Empirically-Derived Analytic Models of Wide-AreaTCP Connections,” IEEE/ACM Transactions on Networking,2(4), pp. 316-336, August 1994.
[Pa96] V. Paxson, Part I of An Analysis of End-to-End Internet Dynam-ics, Ph.D. dissertation in preparation, University of California,Berkeley, 1996.
[PV88] R. Perlman and G. Varghese, “Pitfalls in the Design of Dis-tributed Routing Algorithms,” Proceedings of SIGCOMM '88,pp. 43-54, August 1988.
[Pe91] R. Perlman, “A comparison between two routing proto-cols: OSPF and IS-IS,” IEEE Network, 5(5), pp. 18-24,September 1991.
[Pe92] R. Perlman, Interconnections: Bridges and Routers, Addison-Wesley, 1992.
[RC92] Y. Rekhter and B. Chinoy, “Injecting Inter-autonomous SystemRoutes into Intra-autonomous System Routing: a PerformanceAnalysis,” Internetworking: Research and Experience, Vol. 3,pp. 189-202, 1992.
[Re95] Y. Rekhter, “Inter-Domain Routing: EGP, BGP, and IDRP,” in[St95].
[RL95] Y. Rekhter and T. Li, “A Border Gateway Protocol 4 (BGP-4),”RFC 1771, DDN Network Information Center, March 1995.
[RG95] Y. Rekhter and P. Gross, “Application of the Border GatewayProtocol in the Internet,” RFC 1772, DDN Network InformationCenter, March 1995.
[Ro82] E. Rosen, “Exterior Gateway Protocol (EGP),” RFC 896, Net-work Information Center, SRI International, Menlo Park, CA,October 1982.
[Ro83] S. Ross, Stochastic Processes, John Wiley & Sons, 1983.
[SAGJ93] D. Sanghi, A.K. Agrawal, O. Gudmundsson, and B.N. Jain,“Experimental Assessment of End-to-end Behavior on Internet,”Proceedings of INFOCOM '93, San Francisco, March, 1993.
[SS80] M. Schwartz and T. Stern, “Routing Techniques Used in Com-puter Communication Networks,” IEEE Transactions on Com-munications, 28(4), pp. 539-552, April 1980.
[SFANC93] D. Sidhu, T. Fu, S. Abdallah, R. Nair, and R. Coltun, “OpenShortest Path First (OSPF) Routing Protocol Simulation,” Pro-ceedings of SIGCOMM '93, pp. 53-62, September 1993.
[St95] M. Steenstrup, editor, Routing in Communications Networks,Prentice-Hall, 1995.
[St94] W.R. Stevens, TCP/IP Illustrated, Volume 1: The Protocols,Addison-Wesley, 1994.
[Tr95a] P. Traina, “Experience with the BGP-4 Protocol,” RFC 1773,DDN Network Information Center, March 1995.
[Tr95b] P. Traina, editor, “BGP-4 Protocol Analysis,” RFC 1774, DDNNetwork Information Center, March 1995.
[Wo82] R. Wolff, “Poisson Arrivals See Time Averages,” Operations Re-search, 30(2), pp. 223-231, 1982.
[ZG-LA92] W. Zaumen and J.J. Garcia-Luna Aceves, “Dynamics of Link-state and Loop-free Distance-vector Routing Algorithms,” In-ternetworking: Research and Experience, Vol. 3, pp. 161-188,1992.
[ZDESZ93] L. Zhang, S. Deering, D. Estrin, S. Shenker, and D. Zappala,“RSVP: A New Resource ReSerVation Protocol,” IEEE Net-work, 7(5), pp. 8-18, September 1993.
ACM SIGCOMM Computer Communication Review 56 Volume 36, Number 5, October 2006