Embed Size (px)
Citation preview

Ecological Applications, 18(8), 2008, pp. 2028–2040� 2008 by the Ecological Society of America
ENDOGENOUS AND EXOGENOUS FACTORS CONTROLLING TEMPORALABUNDANCE PATTERNS OF TROPICAL MOSQUITOES
GUO-JING YANG,1,2,7 BARRY W. BROOK,3 PETER I. WHELAN,4 SAM CLELAND,5 AND COREY J. A. BRADSHAW3,6
1School for Environmental Research, Institute of Advanced Studies, Charles Darwin University, Darwin,Northern Territory 0909 Australia
2Jiangsu Institute of Parasitic Diseases, Meiyuan, Yangxiang 117#, Wuxi, 214064, Jiangsu, People’s Republic of China3Research Institute for Climate Change and Sustainability, School of Earth and Environmental Sciences, University of Adelaide,
South Australia 5005 Australia4Medical Entomology Branch, Communicable Diseases Program, Northern Territory Government Department of Health and
Community Services, P.O. Box 40596, Casuarina, Northern Territory 0811 Australia5Australian Bureau of Meteorology, Northern Territory Regional Office, P.O. Box 40050, Casuarina,
Northern Territory 0811 Australia6 South Australian Research and Development Institute, P.O. Box 120, Henley Beach, South Australia 5022 Australia
Abstract. The growing demand for efficient and effective mosquito control requires abetter understanding of vector population dynamics and how these are modified byendogenous and exogenous factors. A long-term (11-year) monitoring data set describingthe relative abundance of the saltmarsh mosquito (Aedes vigilax) in the greater Darwin region,northern Australia, was examined in a suite of Gompertz-logistic (GL) models with andwithout hypothesized environmental correlates (high tide frequency, rainfall, and relativehumidity). High tide frequency and humidity were hypothesized to influence saltmarshmosquito abundance positively, and rainfall was hypothesized to correlate negatively byreducing the availability of suitable habitats (moist substrata) required by ovipositing adultfemale mosquitoes. We also examined whether environmental correlates explained thevariance in seasonal carrying capacity (K ) because environmental stochasticity is hypothesizedto modify population growth rate (r), carrying capacity, or both. Current and lagged-timeeffects were tested by comparing alternative population dynamics models using three differentinformation criteria (Akaike’s Information Criterion [corrected; AICc], Bayesian InformationCriterion [BIC], and cross-validation [C-V]). The GL model with a two-month lag withoutenvironmental effects explained 31% of the deviance in population growth rate. This increasedto .70% under various model combinations of high tide frequency, rainfall, and relativehumidity, of which, high tide frequency and rainfall had the highest contributions. Temporalvariation in K was explained weakly by high tide frequency, and there was some evidence thatthe filling of depressions to reduce standing water availability has reduced Aedes vigilaxcarrying capacity over the study period. This study underscores the need to considersimultaneously both types of drivers (endogenous and exogenous) when predicting mosquitoabundance and population growth patterns. This work also indicates that climate change, viacontinued increases in rainfall and higher expected frequencies and intensities of high tideevents with sea level rise, will alter mosquito abundance trends in northern Australia.
Key words: Aedes vigilax; Australia; density dependence; disease; humidity; mosquito control; rainfall;tidal inundation.
INTRODUCTION
Aside from the irritation and annoyance of mosqui-
toes to humans and livestock, the threat of pathogens
transmitted by mosquitoes is a major public health
problem in much of the world (Gubler 1991, World
Health Organization 1995, Sharp and Le Sueur 1996).
Mosquito-borne diseases such as malaria, dengue, yellow
fever, Japanese encephalitis, West Nile virus, and Ross
River virus are just a few major representatives of a long
list of mosquito-transmitted diseases that have histori-
cally plagued human civilization (Gubler 1998, Gratz
1999). Malaria alone causes a public health problem in
over 100 countries worldwide where some 40% of the
world’s human population resides (World Health Orga-
nization 1988). It has been estimated that the incidence of
malaria in the world may be 300–500 million clinical
cases annually (Breman et al. 2004, Snow et al. 2005,
World Health Organization and UNICEF 2005), and
there is evidence that the prevalence, morbidity, and
mortality induced by zoonotic arboviral diseases world-
wide are on the rise (Gubler 2002). Furthermore, global
warming is likely to increase the range and abundance of
mosquitoes in most countries, resulting in increased
frequency of many mosquito-borne diseases (Patz and
Reisen 2001, Hay et al. 2002). As such, the mounting
Manuscript received 24 July 2007; revised 8 February 2008;accepted 19 March 2008. Corresponding Editor: S. M. Altizer.
7 E-mail: [email protected]
2028

quest for efficient and effective mosquito control(Bergquist 2001) requires a better understanding ofvector population dynamics and how these are modifiedby intrinsic and extrinsic processes (de Little et al. 2007,Bradshaw 2008, Chamaille-Jammes et al. 2008).
The transmission frequency and extent of mosquito-
borne diseases depend on a complex set of factors, of
which vector distribution, longevity, and abundance are
three of the most important (Gubler 1998, Whelan et al.
2003). Mosquitoes require an aquatic environment in
which to nurture their larval and pupal stages, with
suitable mosquito larval habitats including vegetated
margins of lakes and streams, salt marshes, floodplains,
man-made wetlands, and physically disturbed environ-
ments (Russell and Whelan 1986, Russell 1987, Rej-
mankova et al. 1991, Norris 2004, Sattler et al. 2005).
Environmental factors important for adult mosquito
survival and dispersal include optimal humidity, tem-
perature, and wind conditions (Muir 1988, Linthicum et
al. 1999), although different species demonstrate dis-
tinctly different ecological preferences, such as Anoph-
eles stephensi selecting urban areas vs. A. gambiae
selecting rural habitats (Robert et al. 2003, Scholte et
al. 2005). Mosquito numbers also vary extensively over
seasons and years, with the amount of rainfall, the
physical nature of the habitat, or the height and
frequency of tidal inundation (for saltwater-breeding
species) accounting for much of the temporal and spatial
variation observed (Russell 1986, 1987). In addition,
human activities via physical, chemical, and biological
control methods can change mosquito population
abundance and distribution by modifying breeding
habitats and individual survival probability (World
Health Organization 1982, 2003).
Most previous studies investigating the factors corre-
lated with mosquito abundance have put particular
emphasis on determining the exogenous (environmental)
drivers of abundance (Russell 1986, Su et al. 2003,
Kunkel et al. 2006); however, mosquito population
dynamics can also demonstrate strong intrinsic (density-
dependent) regulation (Bradshaw and Holzapfel 1989,
Leonard and Juliano 1995, Gimnig et al. 2002, Kiflawi et
al. 2003, Yang et al. 2008). Exogenous (extrinsic)
processes include stochastic environmental components
that affect demographic rates irrespective of population
density. Endogenous (intrinsic) population regulation
works primarily through negative density feedback on
survival or reproductive rates that decline as density
increases (Turchin 2003a). Failing to take intrinsic
dynamics into account can lead to an overestimation
of the medium- to long-term effectiveness of density
control methods, such as insecticides or habitat modi-
fication. This results from falsely attributing changes in
population growth rate resulting exclusively from
density feedback in survival and fertility to contempo-
raneous changes in control effort (Turchin 2003a).
The Gompertz dynamical feedback model describing
a negative log-linear relationship between population
growth rate (r) and insect density (Woiwod and Hanski
1992, Zeng et al. 1998, Turchin 2003a, Sibly et al. 2005,Brook and Bradshaw 2006), predicts an exponential
decrease in r with greater population size (Turchin2003b). This functional form tends to promote over-
compensatory population responses such as rapid peaksand crashes (oscillations) after successive generations(Hilker and Westerhoff 2007), especially when the rate
of decline in r is maximized at a net annual growth ofzero (Owen-Smith 2006).
In this study we examine the relative contribution ofdensity feedback mechanisms and environmental sto-
chasticity on the residual variation in population growthrate by incorporating three plausible environmental
correlates hypothesized to limit mosquito populationsinto a suite of density-feedback models. We focus our
analysis on the northern saltmarsh mosquito (Aedesvigilax) because of its prime importance as a vector of
Ross River virus (RRV) disease and Barmah Forestvirus (BFV) disease (Whelan et al. 1997, Russell 1998).
These human infections are the most commonlyreported mosquito-borne diseases in Australia, with
RRV accounting for 45% and BFV for 30% of all suchcases (Liu et al. 2005). Specifically, we use a long-term
monitoring data set (11 years with weekly trapping) forA. vigilax in the greater Darwin area, northern Australiato (1) quantify the effects of high tide frequency, rainfall,
and relative humidity in controlling r (in addition tointrinsic regulation), using multi-model information-
theoretic and Bayesian inference estimates of relativemodel parsimony, and (2) evaluate the change in
seasonal carrying capacities (K ) (Bjørnstad and Grenfell2001) over the 11 years of monitoring as a function of
environmental and management correlates. In thegreater Darwin region, high tides .7.4 m can generate
temporary saltwater habitats ideal for the ovipositionand larval development of the saltmarsh mosquito A.
vigilax (Whelan 1987), similar to other saltwater-breeding mosquito species (Harrington and Harrington
1961, Russell 1998). We therefore hypothesized that thefrequency of high tides exceeding 7.4 m would positively
influence the abundance of this species. Additionalresidual variation in abundance was hypothesized toresult from average relative humidity and total rainfall
over the time intervals investigated (Day et al. 1990,Farid et al. 2000, Lee and Rowley 2000). By taking into
account both exogenous and endogenous control ofmosquito population dynamics, we aim to provide a
quantitative model of sufficient realism to guide thedevelopment of optimized control strategies for A.
vigilax and other tropical saltmarsh mosquito species.
METHODS
Mosquito abundance data
Monitoring data were collected by the MedicalEntomology Branch of the Northern Territory Depart-
ment of Health and Community Services in 11 locationsin and around Darwin, Australia for routine vector
December 2008 2029MOSQUITO ENDO- AND EXOGENOUS CONTROL

surveillance (Whelan 1989, Yang et al. 2008). Themosquito populations were sampled with CO2-baitedmosquito traps (Rohe and Fall 1979), which were
operated overnight once per week at locations betweenadjacent swamp and residential development areas(Whelan 1989). Although human-baited collections have
been shown to be effective samplers of other mosquitospecies such as A. aegypti, which feeds specifically on
humans (e.g., Schoeler et al. 2004), CO2-baited lighttraps offer the advantages of being less labor-intensive,supply all-night collection, offer no bias based on
individual attractiveness or skill of the collector, andare particularly effective for many generalist-feedingAustralian species such as A. vigilax and C. annulirostris
(Russell 1986, Van Essen et al. 1994, Miller et al. 2005).CO2-baited traps also tend to target nulliparous femalesmore effectively than other methods, but may not
always be as efficient as backpack aspirators or BG-Sentinels (Williams et al. 2006). Regardless, they are
effective at registering relative adult abundance and canbe used to estimate population rates of change (Whelanet al. 2005). The distance between each pair of traps
varied from 1 to 3 km, with the traps covering a totalarea of 63.2 km2. To avoid the possible confoundingeffects of age structure and overlapping generations on
our assessment of density feedback (Turchin 2003a),monthly and every two weeks, female A. vigilax
population density data were prepared by averagingweekly density data. Only female population densitydata were used due to this gender’s blood-feeding
behavior, and resultant importance for disease trans-mission. Yang et al. (2008) demonstrated that A. vigilaxexhibited strong spatial homogeneity in the study
region. As such, the data for these analyses were pooledamong the 11 trap locations as arithmetic mean
abundance. The complete data set spans November
1994 to December 2005. The monthly population
density of A. vigilax was depicted as time series plot
and monthly variation over all years (Figs. 1 and 2a).
Environmental data
Frequency of high tides .7.4 m/month, monthly
relative humidity (percentage), and total rainfall (milli-
meters) data covering the same interval as the mosquito
abundance data sets were all provided by the Australian
Government Bureau of Meteorology (available online).8
The longest-term weather data were available only from
the Darwin Airport station (1282501200 S, 13085302400 E),
which is situated roughly in the center of the 63.2-km2
study area bounded by the mosquito trap locations.
Monthly variation in the environmental data examined
over all years is shown in Fig. 2b–d.
Management data
The physical methods used to reduce the suitable
habitats of mosquito larvae in saltmarsh swamps around
Darwin included reduction or elimination of mosquito
breeding areas via the infilling of depressions that can
collect water, maintenance of existing drains, and
constructing new drains in breeding stands of water
(Whelan 1989). A combination of mosquito larvicides
has also been used as a direct control measure to
accompany the habitat engineering program. In Darwin,
the bacterial insecticide, Bacillus thuringiensis var.
israelensis (B.t.i), and temephos (organophosphorus
insecticide) were widely used for larval control, broad-
cast via both ground and aerial helicopter control
operations. Adulticides, which are less specific than
larvicides, are generally less effective due to the ability of
FIG. 1. Time series plot of Aedes vigilax monthly abundance from 11 traps (each line represents the time series from a singletrap) between 1994 and 2005 (192 months total). Temporal variability overwhelms spatial differences.
8 hwww.bom.gov.aui
GUO-JING YANG ET AL.2030 Ecological ApplicationsVol. 18, No. 8

adult mosquitoes to disperse over wide areas (e.g., Chung
et al. 2001). To provide a qualitative assessment of the
potential effectiveness of physical and chemical manage-
ment interventions on mosquito carrying capacity, we
obtained a yearly summarized time series data set for the
.60 km2 area describing the number of drains connect-
ed, the total area (e.g., depressions) filled, the number of
spraying days, and the number of hectares sprayed each
year over the entire time interval investigated from the
Medical Entomology Branch of the Northern Territory
Department of Health and Community Services.
Dynamical models
The Gompertz-logistic (GL) model describes the
linear relationship between population growth rates (r)
and logarithm-transformed density (relative Nt) and is
characteristic of insect populations (Woiwod and
Hanski 1992, Zeng et al. 1998, Turchin 2003a, Sibly et
al. 2005, Brook and Bradshaw 2006). Under the GL
model, carrying capacity (K ) is defined as the log(N ) at
which r is equal to zero. We expanded the GL model to
include time-variant environmental conditions, namely,
high tide frequency, rainfall, and relative humidity.
Given our lack of knowledge regarding the potentially
complex interaction between density regulation, environ-
mental variation, human control efforts, and modification
of carrying capacity, our approach was to modify the GL
models in three phases. Model 1 (Eq. 1) relates population
growth rate (r) to density, with residual variation in r
explained by stochastic environmental effects; this model
assumes carrying capacity (K) is invariant over the time
series. Model 2 (Eq. 2) is a variant of the GL model in
which K fluctuates as a function of environmental
variability (‘‘K-ratio’’ model) (see Hone and Clutton-
Brock 2007). Model 3 (Eq. 3) is the combination of
Models 1 and 2, which allows environmental stochasticity
to modify r and K simultaneously:
loge
Ntþ1
Nt
0@
1A ¼ rt ¼ rm 1� logðNtÞ
logðKÞ
24
35
8<:
9=;þ bEt þ et
et ; N ð0;r2Þð1Þ
rt ¼ rm 1� logðNtÞlogðKÞ3 Et
24
35
8<:
9=;þ et
et ; N ð0;r2Þ
ð2Þ
rt ¼ rm 1� logðNtÞlogðKÞ3 Et
24
35
8<:
9=;þ bEþ et
et ; N ð0;r2Þð3Þ
where Nt denotes mosquito population size at time t, rt¼
realized population growth rate, rm¼maximal intrinsic r,
K ¼ carrying capacity, b ¼ (b0 b1 � � � bn), Et ¼ vector of
environmental factors (E1t E2t � � � Ent), and et representsunexplained residual error. We also considered lags of two
months on the density feedback mechanism (cf. Turchin
1990). All models were fitted using maximum-likelihood
estimation.
All analyses were done using the R Package version
2.4.0 (R Development Core Team 2004). Model
comparisons were based on multi-model inference
(MMI) using three separate methods: (1) Akaike’s
Information Criterion corrected for small sample sizes
(AICc) as an estimate of Kullback-Leibler (K-L)
information loss (Akaike 1973, Burnham and Anderson
FIG. 2. Box-and-whisker plots showing the monthly vari-ation in (a) population density of A. vigilax, (b) frequency ofhigh tide (.7.4 m), (c) rainfall (mm), and (d) relative humidity(%) in the greater Darwin region, Northern Territory,Australia. Box-and-whisker plot indicates the maximum, upperquartile, median, lower quartile, and minimum values. Opendiamonds are outliers.
December 2008 2031MOSQUITO ENDO- AND EXOGENOUS CONTROL
2002), (2) the dimension-consistent Bayesian (Schwartz)
Information Criteria (BIC) as an estimate of the
Bayesian odds ratio (Link and Barker 2006), and jack-
knifed cross-validation for one-step-ahead prediction
(C -V) (Turchin 2003a). For AICc and BIC, we
calculated the difference between the model’s criterion
and the top-ranked model (Di) and the relative model
weights (wi ) (Link and Barker 2006). Thus, the strength
of evidence (wAICc, wBIC, wC-V) for any particular
model varies from 0 (no support) to 1 (complete
support) relative to the entire model set. However, the
K-L prior used to justify AICc weighting can favor more
complex models (with many tapering effects) when
sample sizes are large (Link and Barker 2006). There-
fore, BIC is generally considered a better procedure for
ranking models when sample sizes are large and the goal
is to determine the principal drivers of complex
relationships (Link and Barker 2006). AICc and C-V
therefore provide information on the existence of
tapering effects necessary to maximize predictive capac-
ity (Link and Barker 2006). As such, we considered BIC
weighting to determine mosquito population dynamical
model ranking (n ¼ 134), and AICc and C-V weighting
to examine shifts in carrying capacity (n ¼ 21).
Carrying capacity
Carrying capacity (K ) can be broadly defined as ‘‘the
theoretical equilibrium population density a given
(average) set of environmental conditions (e.g., food
availability, breeding habitat) can support’’ (del Monte-
Luna et al. 2004). Under classic negative-feedback
density dependence, birth rates often decrease, and
death rates typically increase as population density
approaches K, with the mathematical definition of K
being the point where these two rates are equal (i.e.,
population growth, r ¼ 0). Although variants of the
logistic model generally consider K to remain fixed over
the time interval investigated, finite resources can still
vary with time, causing K to be different at each time
point (Bjørnstad and Grenfell 2001, del Monte-Luna et
al. 2004).
Temporal variation in K can therefore be explained by
adjustments in limiting resources; for example, in the
typical monsoon pattern (dry/wet season) in northern
Australia, the relative seasonal carrying capacity of
mosquitoes will shift according to the availability of
water among and within seasons. We therefore tested for
correlations between interval-specific carrying capacities
and the environmental parameters measured to explain
variation in the ecosystem’s capacity to support
mosquito populations. Carrying capacity here is differ-
ent from the Models 2 and 3 explained above, which
assume K is an instant dynamic variable rather than a
relatively constant parameter. The temporal variation in
K modeled as a function of these same environmental
correlates asks a different, but related question: to what
extent can environmental conditions be used to predict
the maximum potential mosquito population size in any
given season and year?
To investigate this question, we split the relative
abundance time series for A. vigilax from 1994 to 2005
by monsoonal (dry/wet) season and used the fortnightly
abundance averages to estimate K from the Gompertz-logistic model described previously for each year. This
resulted in a total of 22 seasonal estimates of K over 11
years. This K time series was then used as a response
variable (log-transformed) in linear models to investi-
gate the correlation with the environmental factors
described in the previous analysis (high tide frequency,total rainfall, and average relative humidity):
logeðKÞ ¼ a0 þ b 3 Et þ et et ; Nð0;r2Þ ð4Þ
where K ¼ Gompertz-logistic carrying capacity, b ¼ (b0b1 � � � bn), Et¼ vector of seasonal environmental factors
(E1t E2t � � � Ent), and et represents unexplained error.
MMI-ranking procedures were applied to determinerelative model support.
RESULTS
Environmental variables (frequency of high tides,
rainfall, and relative humidity), when treated as
stochastic exogenous forces (Eq. 1), explained morevariation in population growth rate (r) than their
adjustments to mosquito carrying capacity (Eq. 2; Table
1). Models with K-adjusting environmental components
(log(K ) 3 Et) were poorly fitted, demonstrating that
carrying capacity is relatively constant over the interval
and does not fluctuate markedly depending on environ-mental conditions (Tables 1 and 2). Rather, environ-
mental stochasticity appears to alter the relative rate at
which mosquitoes respond to their own density. As such,
the combination approach including environmental
forcing of r and K (Eq. 3) does not provide better
explanatory power than the simpler Model 1 approachusing only stochastic exogenous variables as correlates.
The explanation of deviance in r increased from 31%
up to .70% after the Gompertz-logistic model with a
two-month lag integrated environmental effects (high-
tide frequency, rainfall, and relative humidity; Table 3).
Exogenous environmental conditions and endogenous
density feedback contributed to explaining the variationin r by ;58% (i.e., 43% of 74%; Table 3) and ;42% (i.e.,
31% of 74%; Table 3), respectively. Put more simply,
environmental factors explained slightly more than one-
half of the total explainable variation in population
growth, with the remaining proportion explained by
negative density feedback. Thus, negative densityfeedback is nearly as important as environmental
conditions when predicting the abundance of mosquito
populations over time.
High tide frequency was the most important determi-
nant of exogenous variation in r, with weaker effects of
rainfall and relative humidity. The model with the
greatest support (wBIC ¼ 0.866) included high-tidefrequency and rainfall with a two-month lag (also best
GUO-JING YANG ET AL.2032 Ecological ApplicationsVol. 18, No. 8
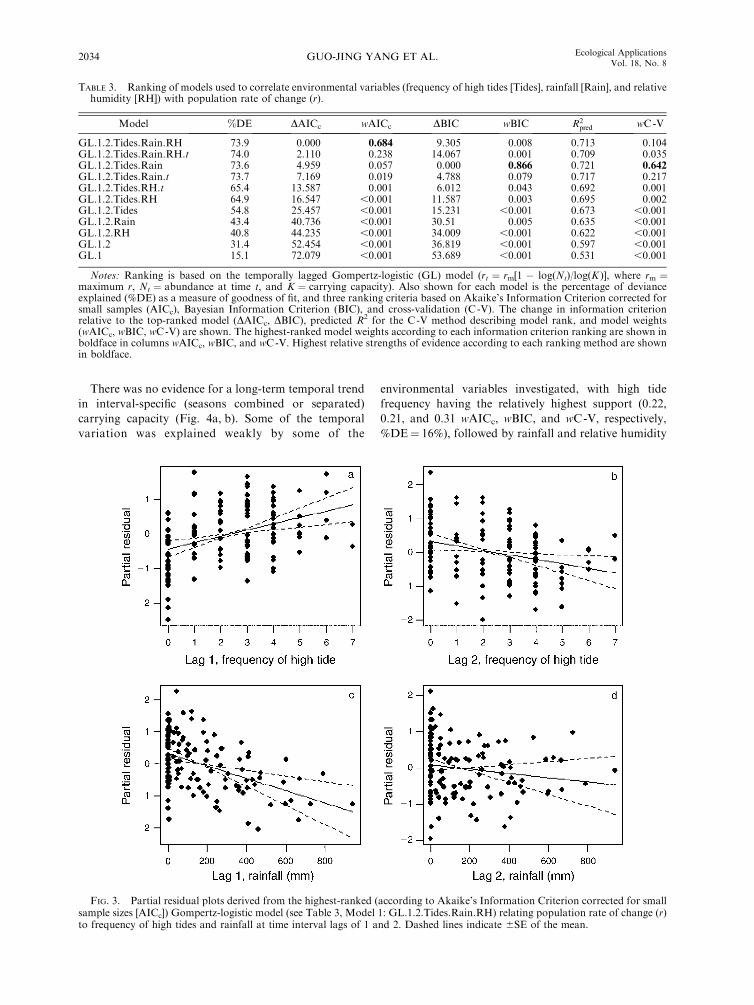
supported by wC-V; Table 3). The coefficients of high
tide frequency in lag 1 and lag 2 are b1 ¼ 0.18 (SE ¼0.054; Fig. 3a) and b2 ¼ �0.13 (SE ¼ 0.051; Fig. 3b),
respectively. The relationship between r and rainfall was,
in contrast, consistently negative over both lag intervals,
albeit much weaker (b3 ¼�0.0019, SE ¼ 0.00052; b4 ¼
�0.0006, SE ¼ 0.00052; Fig. 3c, d). Among the
environmental variables considered, high tide frequency
with a second-order lag explained a larger component of
the variation than rainfall (%DE ¼ 55% vs. 43%,
respectively), with an even smaller contribution from
relative humidity (%DE ¼ 41; Table 3).
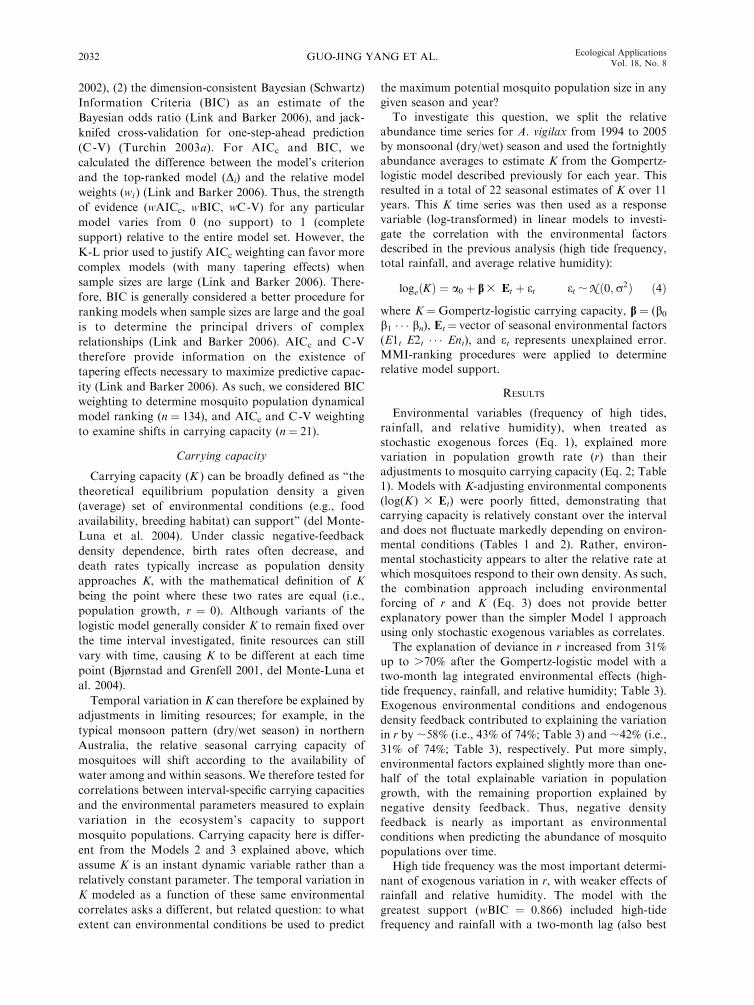
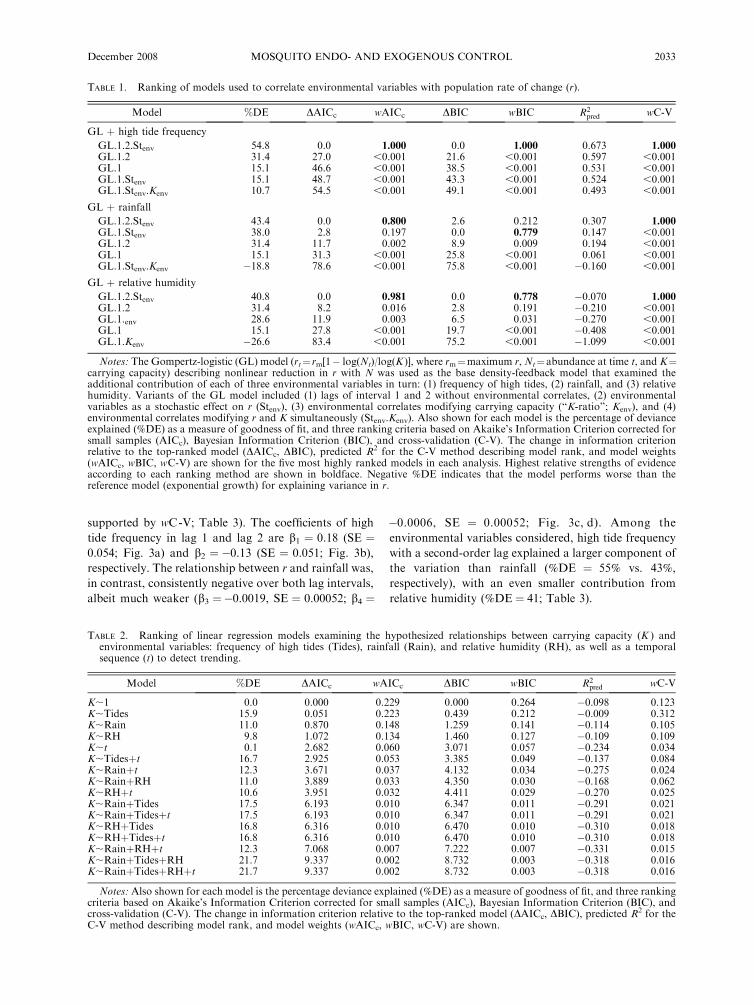
TABLE 2. Ranking of linear regression models examining the hypothesized relationships between carrying capacity (K ) andenvironmental variables: frequency of high tides (Tides), rainfall (Rain), and relative humidity (RH), as well as a temporalsequence (t) to detect trending.
Model %DE DAICc wAICc DBIC wBIC R2pred wC-V
K;1 0.0 0.000 0.229 0.000 0.264 �0.098 0.123K;Tides 15.9 0.051 0.223 0.439 0.212 �0.009 0.312K;Rain 11.0 0.870 0.148 1.259 0.141 �0.114 0.105K;RH 9.8 1.072 0.134 1.460 0.127 �0.109 0.109K;t 0.1 2.682 0.060 3.071 0.057 �0.234 0.034K;Tidesþt 16.7 2.925 0.053 3.385 0.049 �0.137 0.084K;Rainþt 12.3 3.671 0.037 4.132 0.034 �0.275 0.024K;RainþRH 11.0 3.889 0.033 4.350 0.030 �0.168 0.062K;RHþt 10.6 3.951 0.032 4.411 0.029 �0.270 0.025K;RainþTides 17.5 6.193 0.010 6.347 0.011 �0.291 0.021K;RainþTidesþt 17.5 6.193 0.010 6.347 0.011 �0.291 0.021K;RHþTides 16.8 6.316 0.010 6.470 0.010 �0.310 0.018K;RHþTidesþt 16.8 6.316 0.010 6.470 0.010 �0.310 0.018K;RainþRHþt 12.3 7.068 0.007 7.222 0.007 �0.331 0.015K;RainþTidesþRH 21.7 9.337 0.002 8.732 0.003 �0.318 0.016K;RainþTidesþRHþt 21.7 9.337 0.002 8.732 0.003 �0.318 0.016
Notes: Also shown for each model is the percentage deviance explained (%DE) as a measure of goodness of fit, and three rankingcriteria based on Akaike’s Information Criterion corrected for small samples (AICc), Bayesian Information Criterion (BIC), andcross-validation (C-V). The change in information criterion relative to the top-ranked model (DAICc, DBIC), predicted R2 for theC-V method describing model rank, and model weights (wAICc, wBIC, wC-V) are shown.
TABLE 1. Ranking of models used to correlate environmental variables with population rate of change (r).
Model %DE DAICc wAICc DBIC wBIC R2pred wC-V
GL þ high tide frequency
GL.1.2.Stenv 54.8 0.0 1.000 0.0 1.000 0.673 1.000GL.1.2 31.4 27.0 ,0.001 21.6 ,0.001 0.597 ,0.001GL.1 15.1 46.6 ,0.001 38.5 ,0.001 0.531 ,0.001GL.1.Stenv 15.1 48.7 ,0.001 43.3 ,0.001 0.524 ,0.001GL.1.Stenv.Kenv 10.7 54.5 ,0.001 49.1 ,0.001 0.493 ,0.001
GL þ rainfall
GL.1.2.Stenv 43.4 0.0 0.800 2.6 0.212 0.307 1.000GL.1.Stenv 38.0 2.8 0.197 0.0 0.779 0.147 ,0.001GL.1.2 31.4 11.7 0.002 8.9 0.009 0.194 ,0.001GL.1 15.1 31.3 ,0.001 25.8 ,0.001 0.061 ,0.001GL.1.Stenv.Kenv �18.8 78.6 ,0.001 75.8 ,0.001 �0.160 ,0.001
GL þ relative humidity
GL.1.2.Stenv 40.8 0.0 0.981 0.0 0.778 �0.070 1.000GL.1.2 31.4 8.2 0.016 2.8 0.191 �0.210 ,0.001GL.1.env 28.6 11.9 0.003 6.5 0.031 �0.270 ,0.001GL.1 15.1 27.8 ,0.001 19.7 ,0.001 �0.408 ,0.001GL.1.Kenv �26.6 83.4 ,0.001 75.2 ,0.001 �1.099 ,0.001
Notes: The Gompertz-logistic (GL) model (rt¼ rm[1� log(Nt)/log(K )], where rm¼maximum r, Nt¼abundance at time t, and K¼carrying capacity) describing nonlinear reduction in r with N was used as the base density-feedback model that examined theadditional contribution of each of three environmental variables in turn: (1) frequency of high tides, (2) rainfall, and (3) relativehumidity. Variants of the GL model included (1) lags of interval 1 and 2 without environmental correlates, (2) environmentalvariables as a stochastic effect on r (Stenv), (3) environmental correlates modifying carrying capacity (‘‘K-ratio’’; Kenv), and (4)environmental correlates modifying r and K simultaneously (Stenv.Kenv). Also shown for each model is the percentage of devianceexplained (%DE) as a measure of goodness of fit, and three ranking criteria based on Akaike’s Information Criterion corrected forsmall samples (AICc), Bayesian Information Criterion (BIC), and cross-validation (C-V). The change in information criterionrelative to the top-ranked model (DAICc, DBIC), predicted R2 for the C-V method describing model rank, and model weights(wAICc, wBIC, wC-V) are shown for the five most highly ranked models in each analysis. Highest relative strengths of evidenceaccording to each ranking method are shown in boldface. Negative %DE indicates that the model performs worse than thereference model (exponential growth) for explaining variance in r.
December 2008 2033MOSQUITO ENDO- AND EXOGENOUS CONTROL
There was no evidence for a long-term temporal trend
in interval-specific (seasons combined or separated)
carrying capacity (Fig. 4a, b). Some of the temporal
variation was explained weakly by some of the
environmental variables investigated, with high tide
frequency having the relatively highest support (0.22,
0.21, and 0.31 wAICc, wBIC, and wC-V, respectively,
%DE¼ 16%), followed by rainfall and relative humidity
TABLE 3. Ranking of models used to correlate environmental variables (frequency of high tides [Tides], rainfall [Rain], and relativehumidity [RH]) with population rate of change (r).
Model %DE DAICc wAICc DBIC wBIC R2pred wC-V
GL.1.2.Tides.Rain.RH 73.9 0.000 0.684 9.305 0.008 0.713 0.104GL.1.2.Tides.Rain.RH.t 74.0 2.110 0.238 14.067 0.001 0.709 0.035GL.1.2.Tides.Rain 73.6 4.959 0.057 0.000 0.866 0.721 0.642GL.1.2.Tides.Rain.t 73.7 7.169 0.019 4.788 0.079 0.717 0.217GL.1.2.Tides.RH.t 65.4 13.587 0.001 6.012 0.043 0.692 0.001GL.1.2.Tides.RH 64.9 16.547 ,0.001 11.587 0.003 0.695 0.002GL.1.2.Tides 54.8 25.457 ,0.001 15.231 ,0.001 0.673 ,0.001GL.1.2.Rain 43.4 40.736 ,0.001 30.51 0.005 0.635 ,0.001GL.1.2.RH 40.8 44.235 ,0.001 34.009 ,0.001 0.622 ,0.001GL.1.2 31.4 52.454 ,0.001 36.819 ,0.001 0.597 ,0.001GL.1 15.1 72.079 ,0.001 53.689 ,0.001 0.531 ,0.001
Notes: Ranking is based on the temporally lagged Gompertz-logistic (GL) model (rt ¼ rm[1 � log(Nt)/log(K )], where rm ¼maximum r, Nt ¼ abundance at time t, and K ¼ carrying capacity). Also shown for each model is the percentage of devianceexplained (%DE) as a measure of goodness of fit, and three ranking criteria based on Akaike’s Information Criterion corrected forsmall samples (AICc), Bayesian Information Criterion (BIC), and cross-validation (C-V). The change in information criterionrelative to the top-ranked model (DAICc, DBIC), predicted R2 for the C-V method describing model rank, and model weights(wAICc, wBIC, wC-V) are shown. The highest-ranked model weights according to each information criterion ranking are shown inboldface in columns wAICc, wBIC, and wC-V. Highest relative strengths of evidence according to each ranking method are shownin boldface.
FIG. 3. Partial residual plots derived from the highest-ranked (according to Akaike’s Information Criterion corrected for smallsample sizes [AICc]) Gompertz-logistic model (see Table 3, Model 1: GL.1.2.Tides.Rain.RH) relating population rate of change (r)to frequency of high tides and rainfall at time interval lags of 1 and 2. Dashed lines indicate 6SE of the mean.
GUO-JING YANG ET AL.2034 Ecological ApplicationsVol. 18, No. 8

(Table 2). However, the consistent negative values for
R2pred implies that the correlates of K were fitting noise
rather than any underlying signal (Turchin 2003a).
Modification of mosquito breeding habitat over the
course of the interval investigated was sporadic (Fig. 4),
with generally more engineering construction (new
drains, breeding areas filled) in the earlier years (Fig.
4c). Spraying management was also most intensive
between 1994 and 1998, followed by relatively lower
activity in later years (Fig. 4d). Management activities
such as habitat modification focus on reducing mosquito
abundance in the wet season, so we examined evidence
for their effects on seasonal carrying capacity. There was
no strong evidence for a relationship between popula-
tion control, drains concreted, and carrying capacity in
the wet season (Fig. 5).
DISCUSSION
Our study provides an empirical framework for
discerning the relative contributions of endogenous
and exogenous drivers of mosquito population dynam-
ics. We have demonstrated that it is imperative for both
types of drivers to be considered simultaneously when
predicting mosquito abundance and population growth
patterns. Previous studies of the population dynamics of
mosquitoes and other pest insects have focused mainly
on the correlation of environmental variables with
abundance (e.g., Shaman et al. 2002, Mondet et al.
2005, Diuk-Wasser et al. 2006), with more studies in the
last five years considering density-feedback mechanisms
(Gimnig et al. 2002, Kiflawi et al. 2003, Yang et al.
2008). Uniquely, this analysis of the A. vigilax dynamics
in northern Australia provided a direct confirmation of
the higher contribution of environmental drivers relative
to density feedback control, but ascertained that
endogenous control of mosquito populations represents
an important component of the explainable variation in
population growth rates. The multi-model inferential
support of the two-month density lag suggests that
mosquito population growth rate is driven, in part, by
elevated survival or fertility in generations following
periods of low larval density (Gimnig et al. 2002, Sibly et
al. 2005).
High tide frequency contributed the strongest explan-
atory power to A. vigilax population growth rate (Table
3, Fig. 3). Our two-interval lag model provided evidence
for a complex, but logical relationship between high tide
frequency and growth rate (a positive relationship at lag
1 and a negative relationship at lag 2). A. vigilax
primarily breeds in saline to brackish wetlands along the
coast, where females lay their eggs on moist mud and at
the base of plants in high marshlands dominated mainly
FIG. 4. Scatter plot depicting the relationship between log-transformed carrying capacity estimated from the model-averagedGompertz-logistic equations for the wet season between 1994 and 2005 and: (a) the number of days per year when larvicidespraying occurred; (b) the extent of area sprayed with larvicide; (c) the length of drains concreted (built) to remove surface water;and (d) the total area filled to reduce standing water accumulation. Error bars show 6SE.
December 2008 2035MOSQUITO ENDO- AND EXOGENOUS CONTROL

by brackish water reeds (Schoenoplectus spp.) or
mangroves (Avicennia spp. or Bruguiera spp.). As high
tides retreat, eggs are laid on moist substrata where they
mature quickly and become drought-resistant until the
onset of the next high-tide cycle or flood rain. This final
process can take weeks to months to re-flood these
surfaces and stimulate the eggs to hatch. After the
retreat of particularly high tides, substrata suitable for
egg laying and development become readily available, so
population size generally increases; however, the follow-
ing time interval generally results in a decrease in
population size. The diverging directions of the rela-
tionship between r and high-tide frequency at one- and
two-interval lags demonstrates the rapid response to
high densities typical of the Gompertz-logistic model
(i.e., rapid and strong negative density feedback as soon
as population size begins to increase).
Rainfall had, in contrast, a consistently negative
impact on population growth rate over both lag
intervals. The extreme seasonality of the north Austra-
lian monsoon (November–April) results in large
amounts of rainfall during a relatively short interval of
the year (Fig. 2c). This reduces the availability of
suitable habitats (moist substrata) required by ovipos-
iting adult female mosquitoes. Despite the drop of
reproduction rate in the previous time interval with
increased rainfall, the relatively consistent rainfall
patterns within a season in this region negate the
probability of a rebound of reproduction rate at the
next lag interval.
A fundamental aim in the management of disease-
carrying mosquito populations is to reduce overall
densities and the probability of large peaks in popula-
tion size, which enhance the risk of transmission. As
such, an underlying but untested assumption of the
engineering program has been that modifying drainage
patterns reduces the persistence of ephemeral breeding
pools. Our explicit modeling of the drivers of temporal
variation in environmental carrying capacity (K ) inves-
tigated this assumption directly. We found that tempo-
ral variation in mean A. vigilax K was weakly explained
by environmental variation. In other words, environ-
mental forcing does not appear to modify greatly the
degree to which the available habitats can support
mosquito populations; rather, stochastic changes modify
the rate at which the population increases or decreases
above and below carrying capacity. However, the degree
of fit for all K models investigated was low, likely due, in
part, to a relatively small sample size, restricting our
ability to identify clear trends.
Our qualitative comparison of the physical and
chemical management of mosquito habitats over the
FIG. 5. Temporal trends in the (a) log-transformed Aedes vigilax carrying capacity as estimated by the Gompertz-logistic (GL)models in the wet and dry seasons; (b) combined seasonal log-transformed carrying capacity; (c) engineering management (filledareas to reduce water accumulation and drains built to remove excess surface water); and (d) the spatial and temporal extent oflarvicide spraying in Darwin between 1994 and 2005. Temporal and seasonal trends were examined based on the followingequation: loge(K )¼ a0þ b 3 seasonþ et, where K is the Gompertz-logistic carrying capacity, b is the coefficient of season, and etrepresents unexplained error. The coefficients of wet season (bwet), dry season (bdry), and combined-season (i.e., entire year; bcomb.)temporal slopes were 0.004 (SE¼0.03),�0.002 (SE¼0.11), and�0.006 (SE¼0.06), respectively. In other words, long-term carryingcapacity fluctuated widely around a relatively stable mean. Error bars show 6SE.
GUO-JING YANG ET AL.2036 Ecological ApplicationsVol. 18, No. 8

same time interval provides some additional insight. For
example, recent reductions in drain construction, filling
operations, and area sprayed may have contributed to
the higher maximum carrying capacities observed in the
latter portion of the K time series (Figs. 4 and 5). Indeed,
there is the tantalizing suggestion of a weak negative
relationship between carrying capacity and the number
of drains concreted and areas filled (Fig. 5), but more
data are required to verify this hypothesis. However, it
appears that the main effects of human modification to
mosquito breeding habitats (engineering works) and
larval survival (larvicide application) is the reduction in
rate of population increase rather than a reduction in the
environment’s capacity to support high mosquito
densities.
In addition to the contribution our results bring to the
long-term management of mosquito populations in
northern Australia with respect to physical and chemical
manipulation of breeding environments, this work offers
insight into the hypothesized effects of climate change
on mosquito abundance trends. There is a heteroge-
neous pattern of long-term (50þ years) rainfall change in
Australia and globally, with the tropical region of the
Northern Territory experiencing clear increases in total
annual rainfall since the 1940s (Australian Government
Bureau of Meteorology; available online).8 In the greater
Darwin region, 12-month July–June cumulative rainfall
increased at an average rate of 6.2 mm/yr (SE ¼ 1.24)
between 1943 and 2003 based on a least-squares linear
regression of five-year running mean (Fig. 6). Our
models predict that this trend would have an overall
effect of reducing the rebound potential of saline-
breeding species such as A. vigilax. The increased
availability of ephemeral freshwater breeding pools
implies that freshwater breeding species, such as Culex
anulirostris, may be exerting greater ecological domi-
nance (Yang et al. 2008). Climate change scenarios also
predict that rainfall intensity (frequency of heavier
rainfall events) is also likely to increase in areas with
increasing rainfall (Goswami et al. 2006).
Recent reports from the Intergovernmental Panel on
Climate Change show that the Earth’s temperature is
most likely to increase by 1.1–6.48C by 2100, depending
on future emission scenarios and climate sensitivity
(IPCC 2007). Over Australia in recent decades, observed
temperatures have increased in a manner consistent with
other areas around the world. The result is that global
average sea levels are predicted to rise by up to 59 cm
due to the effect of thermal expansion and loss of
mountain glaciers, and the possibility of a further,
possibly substantial contribution, from polar ice sheet
melting (IPCC 2007). These scenarios predict increases
in the frequency and intensity of high tide events (Scavia
et al. 2002). Our models clearly predict that increases in
the frequency of high tide events will provide more
suitable breeding habitat for A. vigilax and other saline
breeding species, which may, by proxy, increase the
frequency and transmission of mosquito-borne diseases
in northern Australia.
FIG. 6. The 12-month July–June cumulative rainfall between 1943 and 2003 in Darwin, Northern Territory, Australia. Thetrend line is based on a least-squares linear regression of the five-year running mean (R2
adjust ¼ 0.2845).
December 2008 2037MOSQUITO ENDO- AND EXOGENOUS CONTROL

ACKNOWLEDGMENTS
Funding for this project was provided by the AustralianResearch Council (LP0667619), Northern Territory Depart-ment of Health and Community Services, Australian Bureau ofMeteorology, Northern Territory Research and InnovationFund, Australian Department of Defence, and Charles DarwinUniversity. We thank L. Bisevac, G. Boggs, D. Bowman, S. deLittle, and G. Williamson. C. J. A. Bradshaw, B. W. Brook, andG.-J. Yang conceived the paper, and G.-J.Yang was responsiblefor the analysis (with assistance from C. J. A. Bradshaw andB. W. Brook). G.-J. Yang took the lead in writing themanuscript, with equal contributions from C. J. A. Bradshawand B. W. Brook. P. Whelan and S. Cleland provided data andcontributed to data interpretation and writing. We acknowl-edge the supportive critiques of two anonymous reviewers toimprove the manuscript.
LITERATURE CITED
Akaike, H. 1973. Information theory as an extension of themaximum likelihood principle. Pages 267–281 in B. N. Petrovand F. Csaki, editors. Proceedings of the Second Interna-tional Symposium on Information Theory. Budapest, Hun-gary.
Bergquist, N. R. 2001. Vector-borne parasitic diseases: newtrends in data collection and risk assessment. Acta Tropica79:13–20.
Bjørnstad, O. N., and B. T. Grenfell. 2001. Noisy clockwork:time series analysis of population fluctuations in animals.Science 293:638–643.
Bradshaw, C. J. A. 2008. Having your water and drinking ittoo: resource limitation modifies density regulation. Journalof Animal Ecology 77:1–4.
Bradshaw, W. E., and C. M. Holzapfel. 1989. Life-historicalconsequences of density-dependent selection in the pitcher-plant mosquito, Wyeomyia smithii. American Naturalist 133:869–887.
Breman, J. G., M. S. Alilio, and A. Mills. 2004. Conquering theintolerable burden of malaria: what’s new, what’s needed: asummary. American Journal of Tropical Medicine andHygiene 71:1–15.
Brook, B. W., and C. J. A. Bradshaw. 2006. Strength ofevidence for density dependence in abundance time series of1198 species. Ecology 87:1445–1451.
Burnham, K. P., and D. R. Anderson. 2002. Model selectionand multimodal inference: a practical information-theoreticapproach. Second edition. Springer-Verlag, New York, NewYork, USA.
Chamaille-Jammes, S., H. Fritz, M. Valeix, F. Murindagomo,and J. Clobert. 2008. Resource variability, aggregation anddirect density dependence in an open context: the localregulation of an African elephant population. Journal ofAnimal Ecology 77:135–144.
Chung, Y. K., S. G. Lam-Phua, Y. T. Chua, and R. Yatiman.2001. Evaluation of biological and chemical insecticidemixture against Aedes aegypti larvae and adults by thermalfogging in Singapore. Medical and Veterinary Entomology15:321–327.
Day, J. F., G. A. Curtis, and J. D. Edman. 1990. Rainfall-directed oviposition behavior of Culex nigripalpus (Diptera:Culicidae) and its influence on St. Louis encephalitis virustransmission in Indian River County, Florida. Journal ofMedical Entomology 27:43–50.
de Little, S. C., C. J. A. Bradshaw, C. R. McMahon, and M. A.Hindell. 2007. Complex interplay between intrinsic andextrinsic drivers of long-term survival trends in southernelephant seals. BMC Ecology 7:3.
del Monte-Luna, P., B. W. Brook, M. J. Zetina-Rejon, andV. H. Cruz-Escalona. 2004. The carrying capacity ofecosystems. Global Ecology and Biogeography 13:485–495.
Diuk-Wasser, M. A., H. E. Brown, T. G. Andreadis, and D.Fish. 2006. Modeling the spatial distribution of mosquitovectors for West Nile virus in Connecticut, USA. VectorBorne and Zoonotic Diseases 6:283–295.
Farid, H. A., Z. S. Morsy, A. N. Hassan, R. E. Hammad, R.Faris, A. M. Kandil, E. S. Ahmed, and G. J. Weil. 2000. Theimpact of environmental and entomological factors onintervillage filarial focality in the Nile Delta. Journal of theEgyptian Society of Parasitology 30:469–485.
Gimnig, J. E., M. Ombok, S. Otieno, M. G. Kaufman, J. M.Vulule, and E. D. Walker. 2002. Density-dependent devel-opment of Anopheles gambiae (Diptera: Culicidae) larvae inartificial habitats. Journal of Medical Entomology 39:162–172.
Goswami, B. N., V. Venugopal, D. Sengupta, M. S. Madhu-soodanan, and P. K. Xavier. 2006. Increasing trend ofextreme rain events over India in a warming environment.Science 314:1442–1445.
Gratz, N. G. 1999. Emerging and resurging vector-bornediseases. Annual Review of Entomology 44:51–75.
Gubler, D. J. 1991. Insects in disease transmission. Pages 981–1000 in G. T. Strickland, editor. Hunter’s tropical medicine.W. B. Saunders, Philadelphia, Pennsylvania, USA.
Gubler, D. J. 1998. Resurgent vector-borne diseases as a globalhealth problem. Emerging Infectious Diseases 4:442–450.
Gubler, D. J. 2002. The global emergence/resurgence ofarboviral diseases as public health problems. Archives ofMedical Research 33:330–342.
Harrington, R. W., and E. S. Harrington. 1961. Food selectionamong fishes invading a high subtropical salt marsh: fromonset of flooding through the progress of a mosquito brood.Ecology 42:646–666.
Hay, S. I., J. Cox, D. J. Rogers, S. E. Randolph, D. I. Stern,G. D. Shanks, M. F. Myers, and R. W. Snow. 2002. Climatechange and the resurgence of malaria in the East Africanhighlands. Nature 415:905–909.
Hilker, F. M., and F. H. Westerhoff. 2007. Preventingextinction and outbreaks in chaotic populations. AmericanNaturalist 170:232–241.
Hone, J., and T. H. Clutton-Brock. 2007. Climate, food, densityand wildlife population growth rate. Journal of AnimalEcology 76:361–367.
IPCC. 2007. Climate change 2007: the physical science basis.Intergovernmental Panel on Climate Change, Paris, France.hwww.ipcc.chi
Kiflawi, M., L. Blaustein, and M. Mangel. 2003. Ovipositionhabitat selection by the mosquito Culiseta longiareolata inresponse to risk of predation and conspecific larval density.Ecological Entomology 28:168–173.
Kunkel, K. E., R. J. Novak, R. L. Lampman, and W. Gu. 2006.Modeling the impact of variable climatic factors on thecrossover of Culex restauns and Culex pipiens (Diptera:Culicidae), vectors of West Nile virus in Illinois. AmericanJournal of Tropical Medicine and Hygiene 74:168–173.
Lee, J. H., and W. A. Rowley. 2000. The abundance andseasonal distribution of Culex mosquitoes in Iowa during1995–97. Journal of the American Mosquito ControlAssociation 16:275–278.
Leonard, P. M., and S. A. Juliano. 1995. Effect of leaf litter anddensity on fitness and population performance of the holemosquito Aedes triseriatus. Ecological Entomology 20:125–136.
Link, W. A., and R. J. Barker. 2006. Model weights and thefoundations of multimodel inference. Ecology 87:2626–2635.
Linthicum, K. J., A. Anyamba, C. J. Tucker, P. W. Kelley,M. F. Myers, and C. J. Peters. 1999. Climate and satelliteindicators to forecast Rift Valley fever epidemics in Kenya.Science 285:397–400.
Liu, C., A. K. Broom, N. Kurucz, and P. I. Whelan. 2005.Communicable Diseases Network Australia: National Arbo-
GUO-JING YANG ET AL.2038 Ecological ApplicationsVol. 18, No. 8

virus and Malaria Advisory Committee Annual Report2004–05. Communicable Diseases Intelligence 29:341–357.
Miller, R. J., J. Wing, S. Cope, R. B. Davey, and D. L. Kline.2005. Comparison of carbon dioxide and octenol baitedencephalitis virus surveillance traps at the Shoalwater Baytraining area, Queensland Australia. Journal of the AmericanMosquito Control Association 21:497–500.
Mondet, B., A. Diaite, J. A. Ndione, A. G. Fall, V. Chevalier,R. Lancelot, M. Ndiaye, and N. Poncon. 2005. Rainfallpatterns and population dynamics of Aedes (Aedimorphus)vexans arabiensis, Patton 1905 (Diptera: Culicidae), apotential vector of Rift Valley Fever virus in Senegal. Journalof Vector Ecology 30:102–106.
Muir, D. A. 1988. Anopheline mosquitoes: vector reproduction,life cycle and biotape. Pages 431–451 in W. H. Wernsdorferand I. McGregor, editors. Malaria: principles and practice ofmalariology. Churchill Livingstone, New York, New York,USA.
Norris, D. E. 2004. Mosquito-borne diseases as a consequenceof land use change. EcoHealth 1:19–24.
Owen-Smith, N. 2006. Demographic determination of theshape of density dependence for three African ungulatepopulations. Ecological Monographs 76:93–109.
Patz, J. A., and W. K. Reisen. 2001. Immunology, climatechange and vector-borne diseases. Trends in Immunology 22:171–172.
R Development Core Team. 2004. R: a language andenvironment for statistical computing. R Foundation forStatistical Computing, Vienna, Austria.
Rejmankova, E., H. M. Savage, M. Rejmanek, J. I. Arredondo-Jimenez, and D. R. Roberts. 1991. Multivariate analysis ofrelationships between habitats, environmental factors andoccurrence of Anopheline mosquito larvae Anopheles albi-manus and A. pseudopunctipennis in Southern Chiapas,Mexico. Journal of Applied Ecology 28:827–841.
Robert, V., K. Macintyre, J. Keating, J.-F. Trape, J.-B.Duchemin, M. Warren, and J. C. Beiber. 2003. Malariatransmission in urban sub-Saharan Africa. American Journalof Tropical Medicine and Hygiene 68:169–176.
Rohe, D. L., and R. P. Fall. 1979. A miniature battery poweredCO2-baited trap for mosquito-borne encephalitis surveil-lance. Bulletin of the Society for Vector Ecology 4:24–27.
Russell, R. C. 1986. Seasonal abundance and age compositionof two populations of Culex annulirostris (Diptera: Culicidae)at Darwin, Northern Territory, Australia. Journal of MedicalEntomology 23:279–285.
Russell, R. C. 1987. Seasonal abundance, longevity andpopulation age composition of potential malaria vectors innorthern and southern Australia. Australian Journal ofZoology Supplementary Series 35:289–306.
Russell, R. C. 1998. Mosquito-borne arboviruses in Australia:the current scene and implications of climate change forhuman health. International Journal for Parasitology 28:955–969.
Russell, R. C., and P. I. Whelan. 1986. Seasonal prevalence ofadult mosquitoes at Casuarina and Leanyer, Darwin.Australian Journal of Ecology 11:99–105.
Sattler, M. A., D. Mtasiwa, M. Kiama, Z. Premji, M. Tanner,G. F. Killeen, and C. Lengeler. 2005. Habitat characteriza-tion and spatial distribution of Anopheles sp. mosquito larvaein Dar es Salaam (Tanzania) during an extended dry period.Malaria Journal 4:4.
Scavia, D., et al. 2002. Climate change impacts on U.S. coastaland marine ecosystems. Estuaries 25:149–164.
Schoeler, G. B., S. S. Schleich, S. A. Manweiler, and V. L.Sifuentes. 2004. Evaluation of surveillance devices forminotiring Aedes aegypti in an urban area of northeasternPeru. Journal of the American Mosquito Control Associa-tion 20:6–11.
Scholte, E.-J., K. Ng’habi, J. Kihonda, W. Takken, K.Paaijmans, S. Abdulla, G. F. Killeen, and B. G. J. Knols.
2005. An entomopathogenic fungus for control of adultAfrican malaria mosquitoes. Science 308:1641–1642.
Shaman, J., M. Stieglitz, C. Stark, S. Le Blancq, and M. Cane.2002. Using a dynamic hydrology model to predict mosquitoabundances in flood and swamp water. Emerging InfectiousDiseases 8:6–13.
Sharp, B. L., and D. Le Sueur. 1996. Malaria in South Africa:past, present and perspectives. Medecine Tropicale (Mar-seilles) 56:189–196.
Sibly, R. M., D. Barker, M. C. Denham, J. Hone, and M. Page.2005. On the regulation of populations of mammals, birds,fish, and insects. Science 309:607–610.
Snow, R. W., C. A. Guerra, A. M. Noor, H. Y. Myint, and S. I.Hay. 2005. The global distribution of clinical episodes ofPlasmodium falciparum malaria. Nature 434:214–217.
Su, T., J. P. Webb, R. P. Meyer, and M. S. Mulla. 2003. Spatialand temporal distribution of mosquitoes in undergroundstorm drain systems in Orange County, California. Journal ofVector Ecology 28:79–89.
Turchin, P. 1990. Rarity of density dependence or populationregulation with lags? Nature 344:660–663.
Turchin, P. 2003a. Complex population dynamics: a theoret-ical/empirical synthesis. Princeton University Press, Prince-ton, New Jersey, USA.
Turchin, P. 2003b. Evolution in population dynamics. Nature424:257–258.
Van Essen, P. H. A., J. A. Kemme, S. A. Ritchie, and B. H.Kay. 1994. Differential responses of Aedes and Culexmosquitoes to octenol or light in combination with carbondioxide in Queensland, Australia. Medical and VeterinaryEntomology 8:63–67.
Whelan, P. I. 1987. Mosquito vector control in the NorthernTerritory. Bulletin of the Mosquito Control Association ofAustralia 1:32–47.
Whelan, P. I. 1989. Integrated mosquito control in Darwin.Arbovirus Research in Australia 5:178–185.
Whelan, P. I., S. P. Jacups, L. Melville, A. Broom, B. J. Currie,V. L. Krause, B. Brogan, F. Smith, and P. Porigneaux. 2003.Rainfall and vector mosquito numbers as risk indicators formosquito-borne disease in central Australia. CommunicableDiseases Intelligence 27:110–116.
Whelan, P., A. Merianos, G. Hayes, and V. Krause. 1997. RossRiver virus transmission in Darwin Northern TerritoryAustralia. Arbovirus Research in Australia 1997:337–345.
Whelan, P., B. Pettit, and V. Krause. 2005. Dengue mosquitoeradication project Tennant Creek: end of January 2005progress report. Bulletin of the Mosquito Control Associa-tion of Australia 17:16–23.
Williams, C. R., S.A. Long, R. C.Russell, and S.A.Ritchie. 2006.Field efficacy of the BG-Sentinel compared with cdc backpackaspirators and CO2-baited EVS traps for collection of adultAedes aegypti in Cairns, Queensland, Australia. Journal of theAmerican Mosquito Control Association 22:296–300.
Woiwod, I. P., and I. Hanski. 1992. Patterns of densitydependence in moths and aphids. Journal of Animal Ecology61:619–629.
World Health Organization. 1982. Manual on environmentalmanagement for mosquito control: with special emphasis onmalaria vectors. WHO Offset Publication 66:1–283.
World Health Organization. 1988. Division of control oftropical diseases. World Health Statistics Quarterly 42:78.
World Health Organization. 1995. Vector control for malariaand other mosquito-borne diseases. WHO Technical ReportSeries 857:1–97.
World Health Organization. 2003. Guidelines for denguesurveillance and mosquito control. Second edition. WorldHealth Organization, Geneva, Switzerland.
World Health Organization and UNICEF. 2005. A 5-minutebriefing on the World Malaria Report. Anna Wright Consult-ing, United Kingdom. World Health Organization, Geneva,Switzerland and UNICEF, New York, New York, USA.
December 2008 2039MOSQUITO ENDO- AND EXOGENOUS CONTROL

Yang, G. J., C. J. A. Bradshaw, P. I. Whelan, and B. W. Brook.2008. Importance of endogenous feedback controlling thelong-term abundance of tropical mosquito species. Popula-tion Ecology 50:293–305.
Zeng, Z., R. M. Nowierski, M. L. Taper, B. Dennis, and W. P.Kemp. 1998. Complex population dynamics in the realworld: modeling the influence of time-varying parametersand time lags. Ecology 79:2193–2209.
GUO-JING YANG ET AL.2040 Ecological ApplicationsVol. 18, No. 8